Miroslav Aradski
Strategist
-
US Housing Sector: Affordability Is The Key
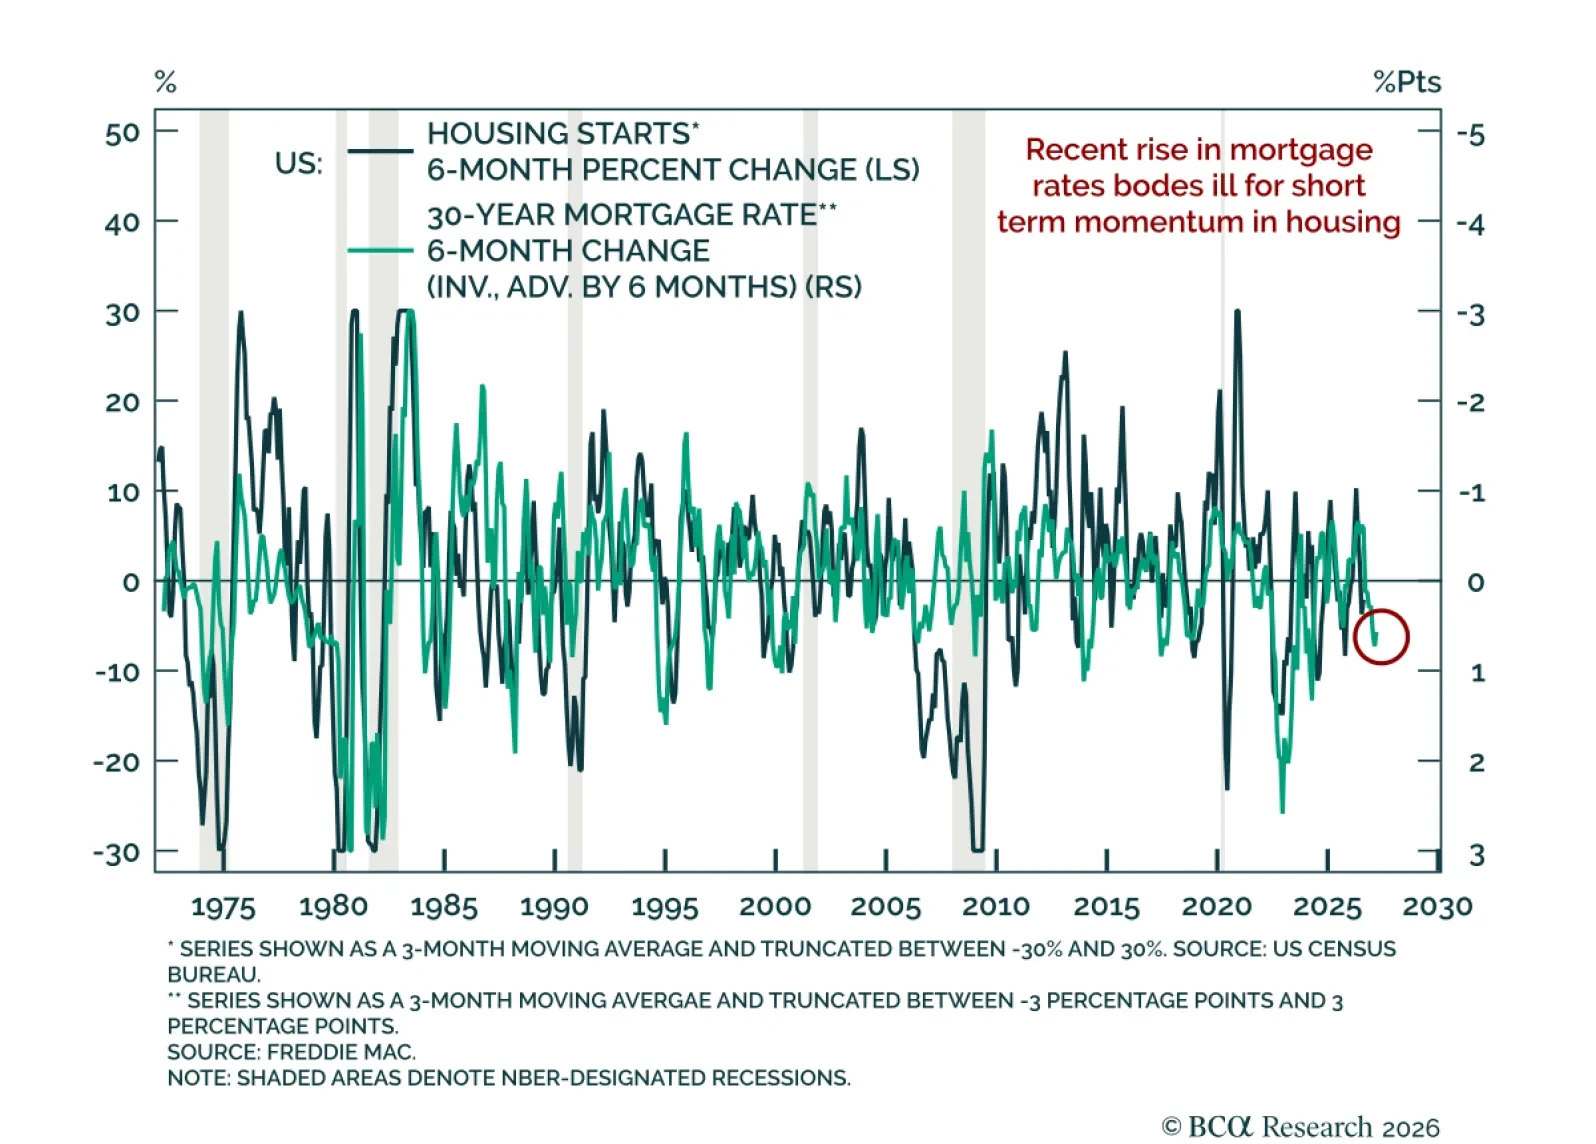
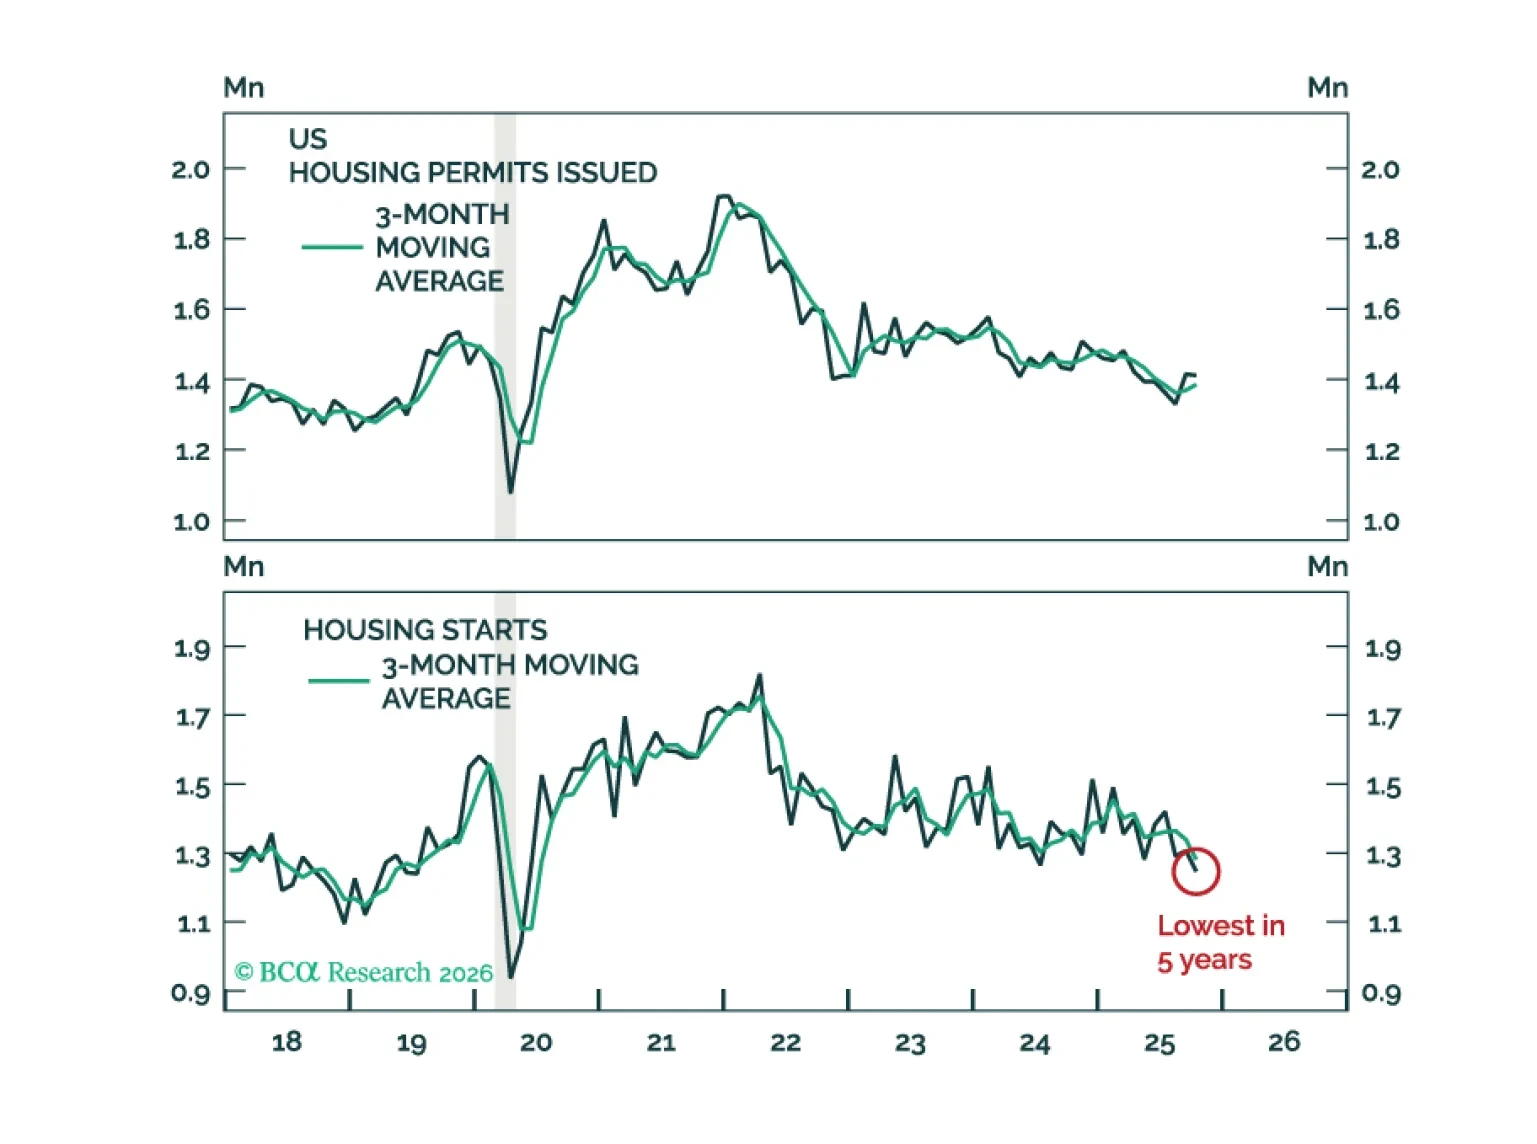
The US residential real estate market remains soft. While the decline in mortgage rates is a positive, it is too early to bet on housing becoming the engine of growth for the US economy this year.
-
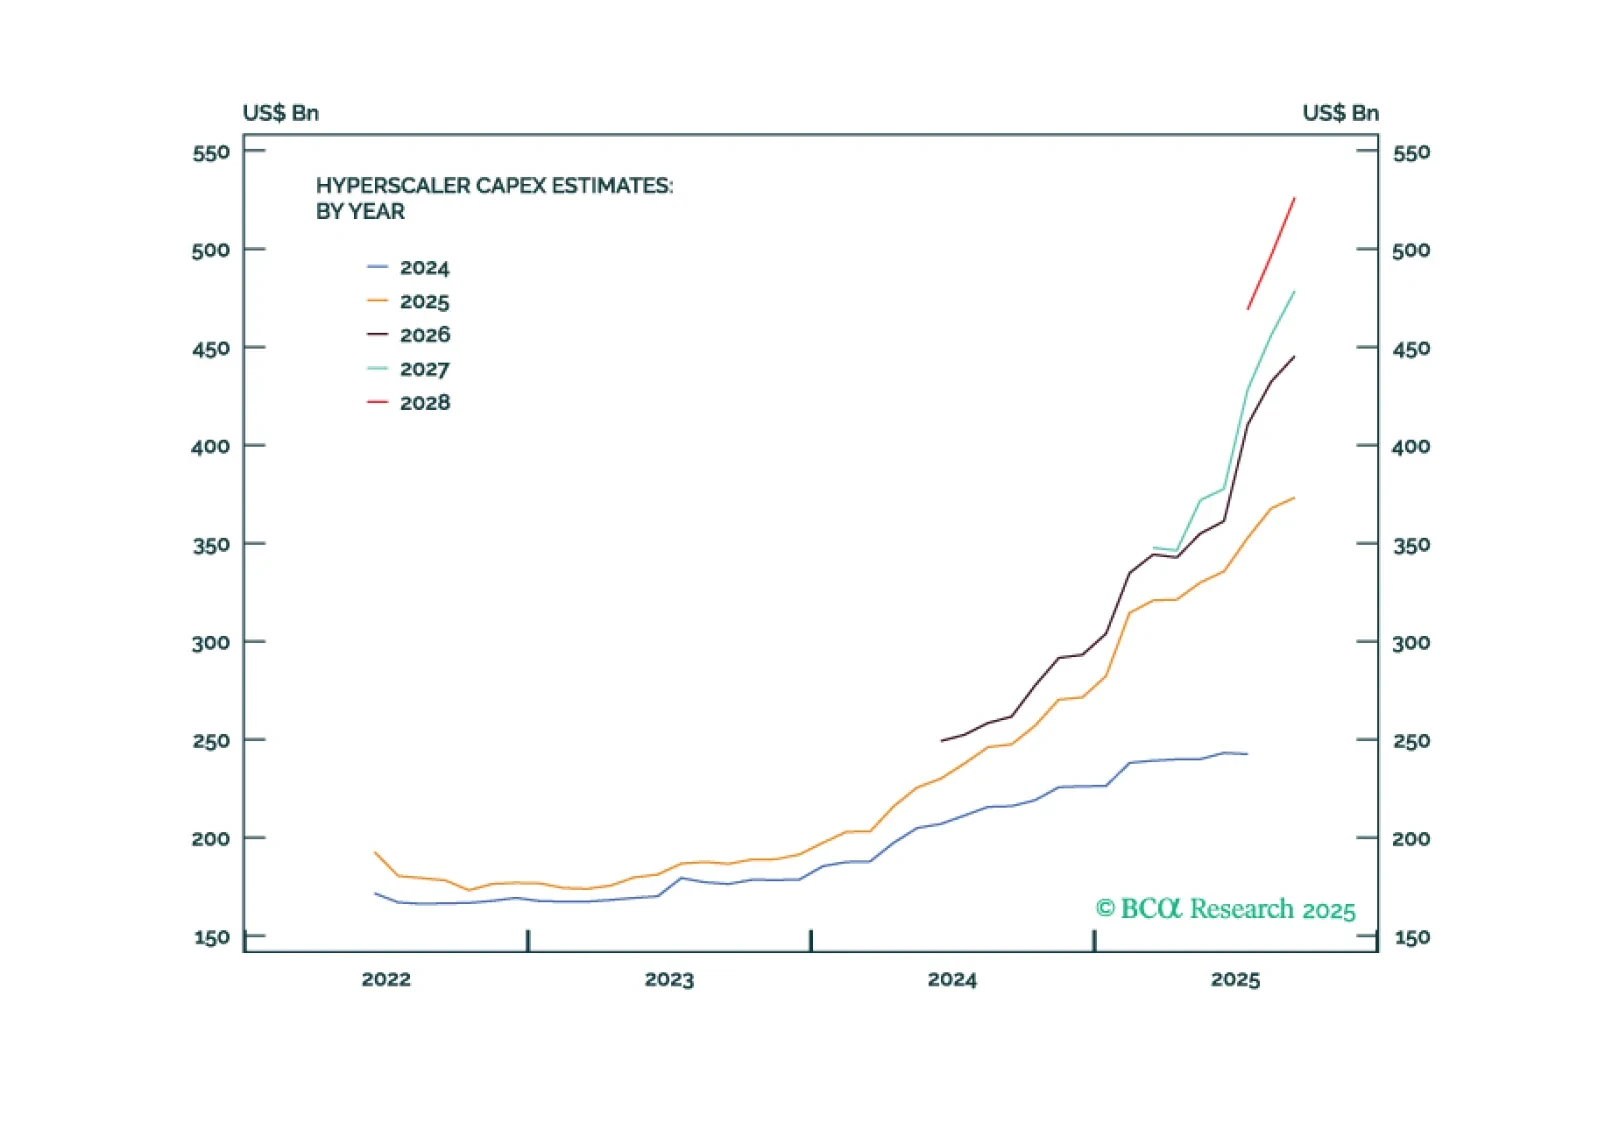
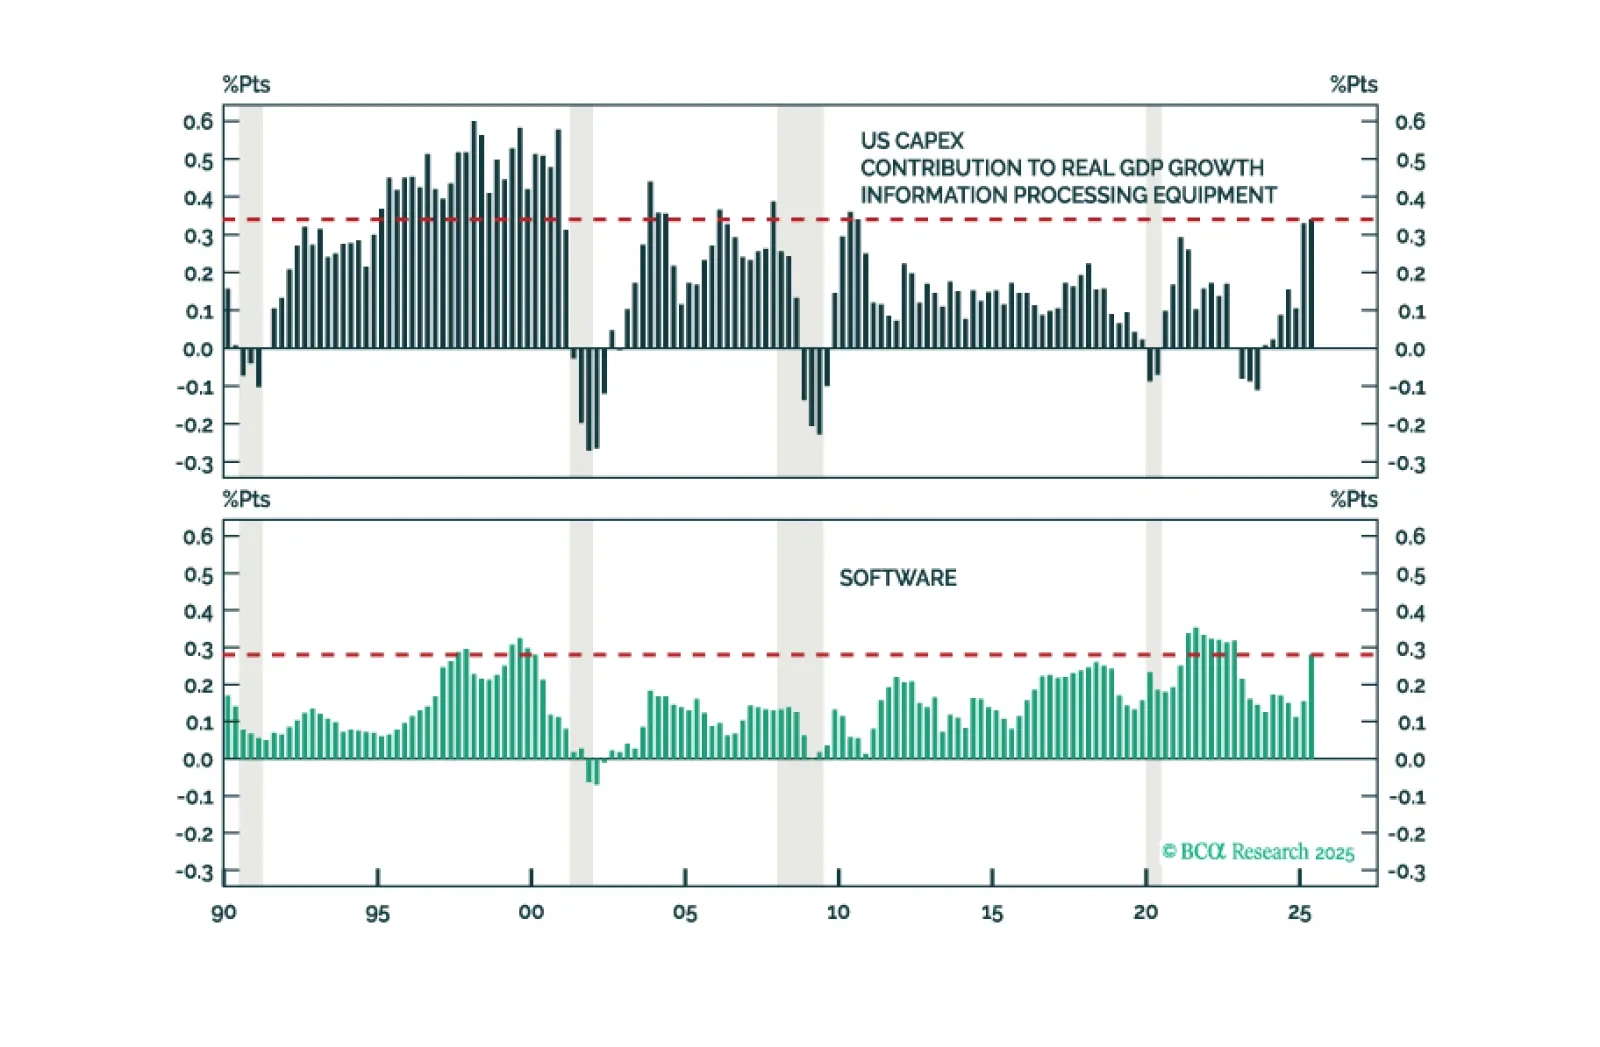
Getting A Fix On The AI Capex Boom
In Section II, Doug and Global Investment Strategy’s Miroslav Aradski consider the implications of the AI investment boom.
-
November 2025
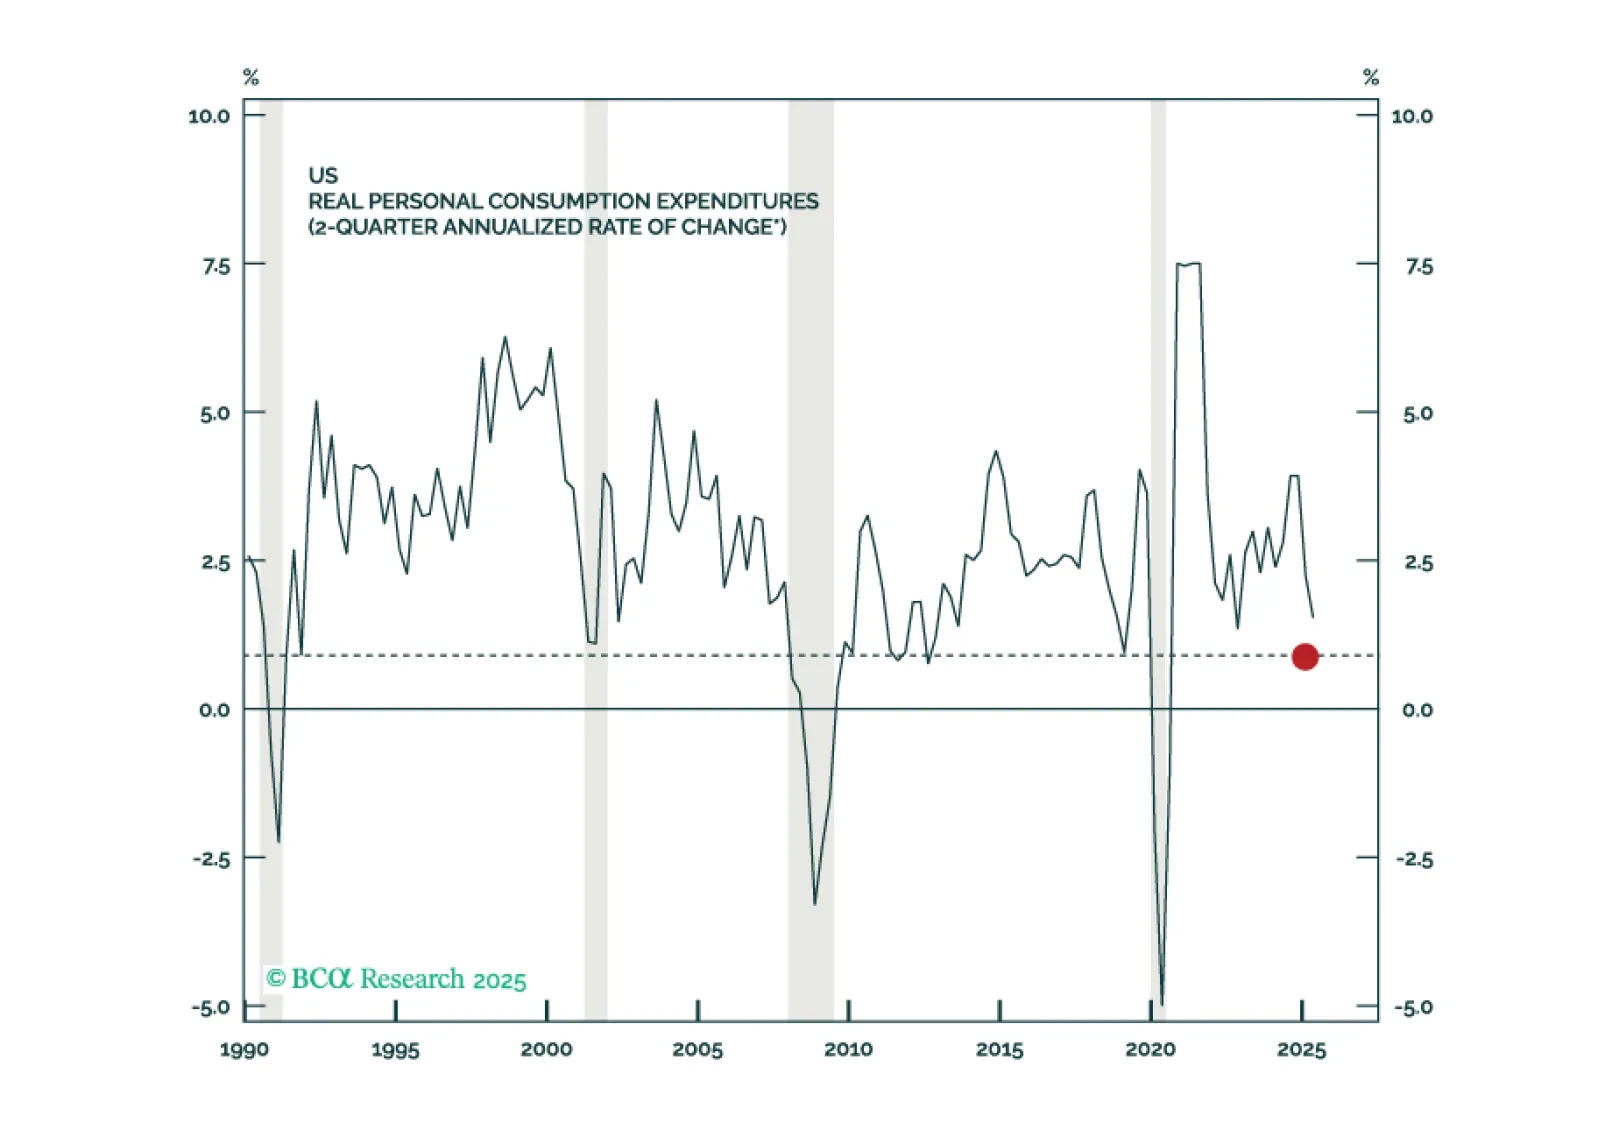
In Section I, Doug explains how the sharp upward revision to second-quarter consumption in the final GDP estimate has reduced our recession conviction and could lead us to abandon our recession call altogether. The situation is fluid, though, as typified by the striking weakness of stocks in consumer-facing and cyclically exposed subindustries. In Section II, Doug and Global Investment Strategy’s Miroslav Aradski consider the implications of the AI investment boom.
-
Tracking The AI Capex Boom
The AI capex boom is having a measurable impact on the economy but, so far, it is more muted than often cited.
-
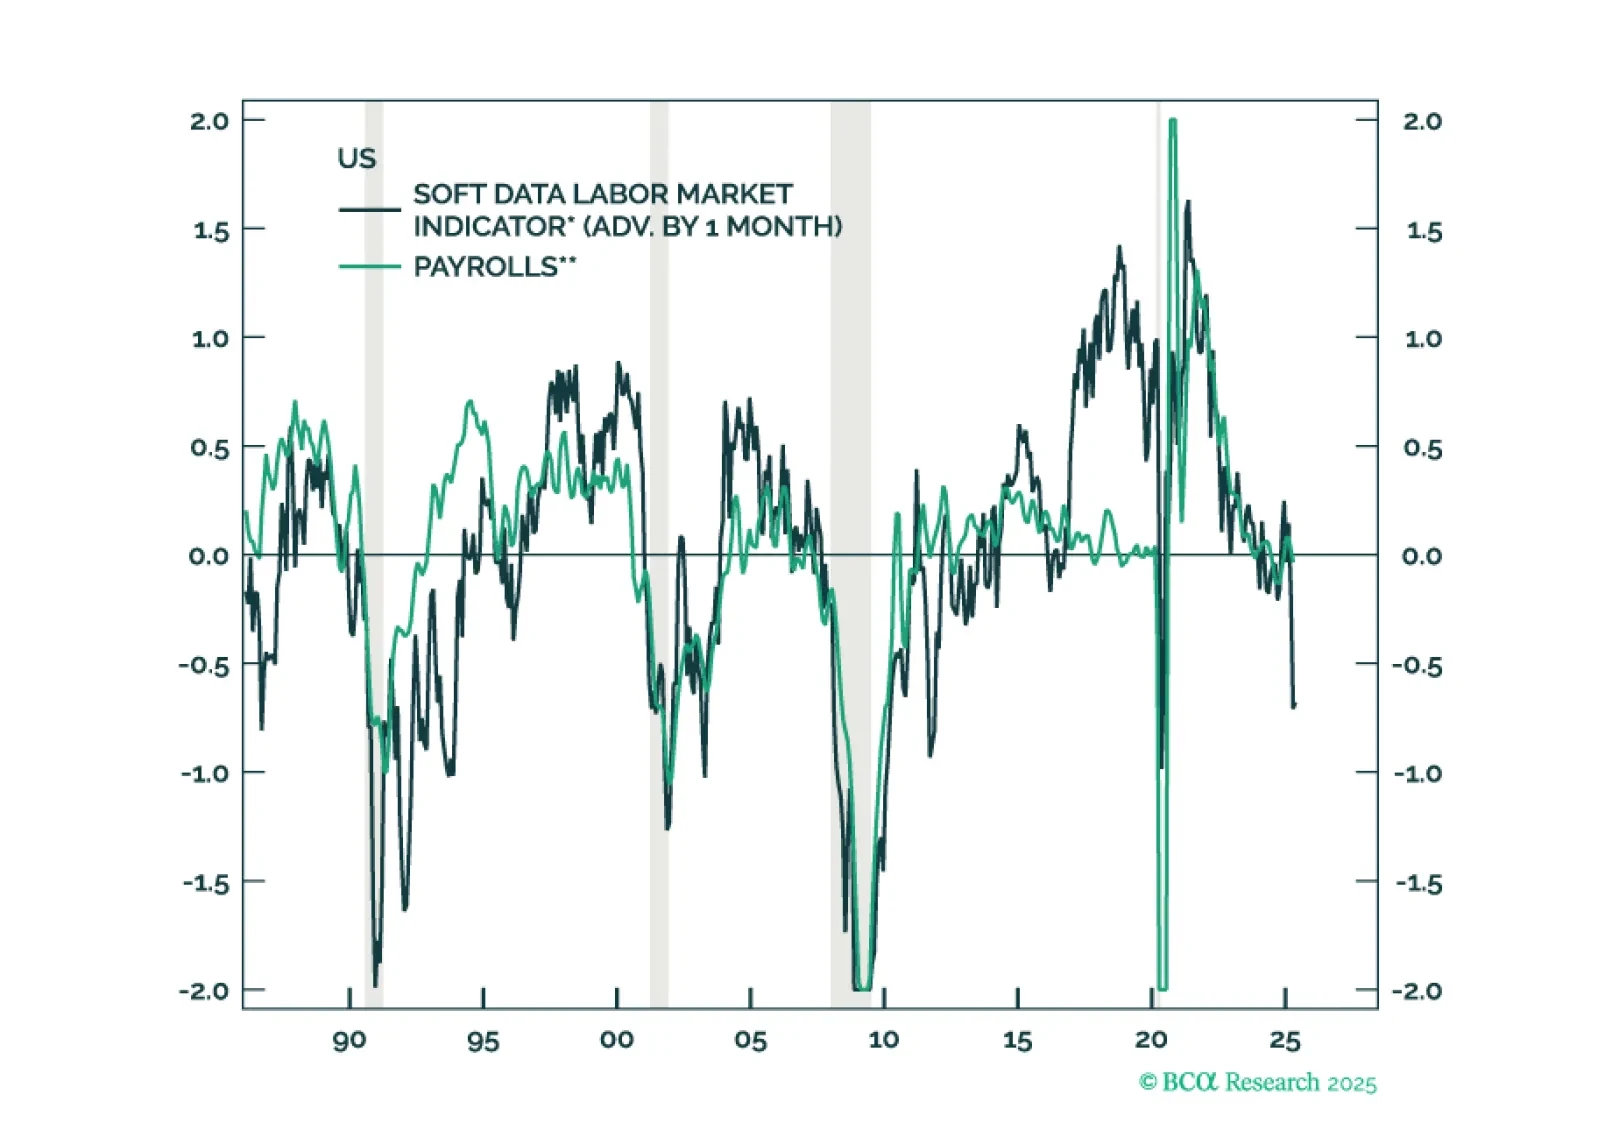
A Softcore Downturn
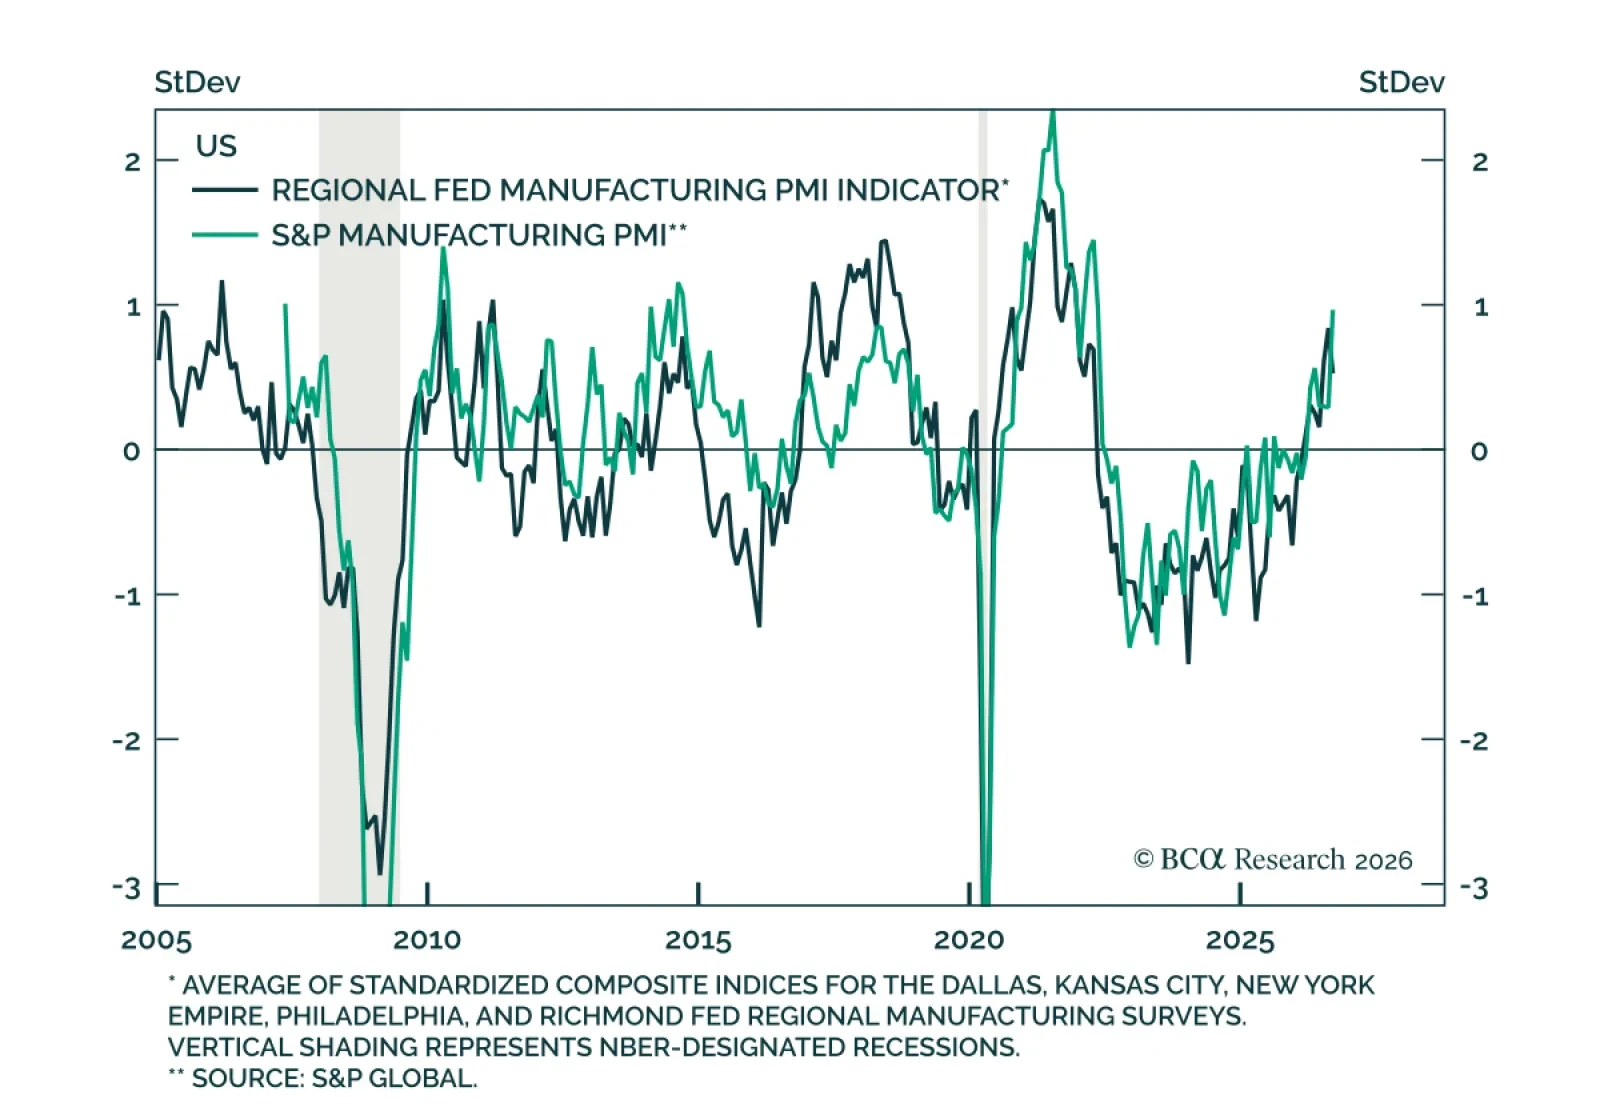
It may take several months for the tariff shock and policy uncertainty to filter through the real economy, but survey-based data are already sending a warning. Equities have priced in a lot of good news, and investors are too sanguine about the risk of a US recession.
-
How Much Does The Rest Of The World Owe America
The Trump administration posits that the world owes the US for the provision of its security. In this report, we perform a quantitative analysis to come up with a naïve estimate of the cost of that peace. More importantly (and more seriously), our qualitative assessment argues that save for a number of frontline countries that rely on the US defense umbrella, the vast majority of the world faces manageable security threats due to the complex multipolar global environment and a growing number of alternatives to the US security blanket.
-
Anatomy Of A Fall
In this Special Report, we analyze the behavior of economic data leading up to US recessions and discuss some common patterns.
-
Canada: A Macro Trade That Has Yet To Hit Capitulation
This Special Report argues that rate cuts will come sooner in Canada than the US and offers how investors can profit from this.
-
In Health And In Sickness
This week’s Special Report, written by Miroslav Aradski, highlights the worrisome deterioration in health trends in the US, which began before the pandemic. Over the long haul, this could weigh on labor supply and productivity, put upward pressure on bond yields, and hurt equity multiples.
-
Tactical Asset Allocation And Market Indicators
The Tactical Asset Allocation model can provide investment recommendations which diverge from those outlined in our regular weekly publications. The model has a much shorter investment horizon - namely, one month - and thus attempts to capture very tactical opportunities. Meanwhile, our regular recommendations have a longer expected life, anywhere from 3-months to a year (or longer). This difference explains why the recommendations between the two publications can deviate from each other from time to time. Highlights In February, the model underperformed global equities and the S&P 500 in USD and local-currency terms. For March, the model slightly increased its allocation to stocks and cut its weighting in bonds (Chart 1). Within the equity portfolio, the allocation to Europe was increased. The model boosted its weightings to French and Australian bonds at the expense of Canadian and Swedish paper. The risk index for stocks, as well as the one for bonds, deteriorated in February. Feature Performance In February, the recommended balanced portfolio gained 2.1% in local-currency terms, and 0.2% in U.S. dollar terms (Chart 2). This compares with a gain of 3% for the global equity benchmark and a 3.3% gain for the S&P 500. Given that the underlying model is structured in local-currency terms, we generally recommend that investors hedge their positions, though we provide suggestions on currency risk exposure from time to time. The high allocation to bonds continued to hold back the model's performance. Chart 1Model Weights Chart 2Portfolio Total Returns Weights The model increased its allocation to stocks from 53% to 57%, and cut its bond weighting from 47% to 43% (Table 1). Table 1Model Weights (As Of February 23, 2017) The model increased its equity allocation to Dutch and Swedish equities by 4 points each, Germany and New Zealand by 2 points each, and France and Emerging Asia by 1 point each. Weightings were cut in Italy by 4 points, Latin America by 3 points, Spain by 2 points, and Switzerland by 1 point. In the fixed-income space, the allocation to Australia was boosted by 8 points, France by 6 points, and Germany by 4 points. The model cut its exposure to Swedish bonds by 9 points, Canadian bonds by 6 points, U.S. and U.K. bonds by 3 points each, and Kiwi bonds by 1 point. Currency Allocation Local currency-based indicators drive the construction of our model. As such, the performance of the model's portfolio should be compared with the local-currency global equity benchmark. The decision to hedge currency exposure should be made at the client's discretion, though from time to time, we do provide our recommendations. The most recent bout of dollar depreciation was halted in February. Our Dollar Capitulation Index is below neutral levels. However, it is not extended, meaning that it does not preclude renewed dollar weakness in the near term. That said, assuming no major negative economic surprises, a relatively more hawkish Fed versus its peers should provide support for the dollar (Chart 3). Chart 3U.S. Trade-Weighted Dollar* And Capitulation Capital Market Indicators The risk index for commodities was little changed in February. The model continues to avoid this asset class (Chart 4). The risk index for global equities rose to its highest level since early 2010, mostly on the back of deteriorating value. Despite this, the model slightly increased its allocation to equities (Chart 5). Chart 4Commodity Index And Risk Chart 5Global Stock Market And Risk The rally in U.S. stocks - driven by optimism about the economic outlook - pushed the value component of the risk index into expensive territory. The model kept a small allocation in U.S. equities. A change in the perception about the ability of the new U.S. administration to boost growth remains a risk for this market (Chart 6). The risk index for euro area equities continues to deteriorate. However, it remains lower than its U.S. counterpart. The continued flow of solid economic data and a weaker currency should bode well for euro area stocks, although political uncertainty is a potential headwind (Chart 7). Chart 6U.S. Stock Market And Risk Chart 7Euro Area Stock Market And Risk All three components of the risk index for Dutch equities are close to neutral levels. As a result, despite the recent deterioration in the overall risk index, it remains one of the lowest among the markets the model covers (Chart 8). The risk index for Swedish stocks worsened. However, the model increased its allocation to this bourse. Swedish equities would be a beneficiary of the continued risk-on environment (Chart 9). Chart 8Netherlands Stock Market And Risk Chart 9Swedish Stock Market And Risk The momentum indicator for global bonds is less stretched in February. Meanwhile, despite its latest decline, the cyclical indicator continues to signal that the positive global economic backdrop is firmly bond-bearish. Taken all together, the risk index for bonds deteriorated in February, although it still remains in the low-risk zone (Chart 10). U.S. Treasury yields moved sideways in February as investors await more guidance from the Fed on the timing of the next hike. A bond-negative cyclical indicator coupled with the unwinding of oversold conditions - as per the momentum measure - led to a deterioration in the risk index for U.S. Treasurys. The latter is almost back to neutral levels. The model trimmed the allocation to this asset class (Chart 11). Chart 10Global Bond Yields And Risk Chart 11U.S. Bond Yields And Risk The momentum indicator remains the main driver of the risk index for Canadian bonds. As a result, the less extreme momentum reading translated into an increase in the risk index for this asset class. (Chart 12). The risk index for Australian bonds moved lower in February, reflecting improvements in all three of its components. The model included the relatively high-yielding Aussie bonds in the portfolio. (Chart 13). Chart 12Canadian Bond Yields And Risk Chart 13Australian Bond Yields And Risk The cyclical indicator for euro area bonds is near expensive levels, and the momentum indicator shows heavily oversold conditions. These two measures are offsetting the cyclical one that is sending a bond-bearish message. While the overall risk index for euro area bonds is in the low-risk zone, the country allocation is concentrated in French paper (Chart 14). The risk level for French bonds is seen as low thanks to oversold momentum. French presidential elections are probably the most important political event in Europe this year. Whether the models' heavy allocation to this asset pans out hinges to a certain extent on the reduction of investor anxiety about this political risk (Chart 15). Chart 14Euro Area Bond Yields And Risk Chart 15French Bond Yields And Risk The 13-week momentum measure for the dollar broke below the zero line, and is currently sitting on its upward-sloping trendline, drawn from the 2010 lows, that has been broken only once before. Meanwhile, the 40-week rate of change measure is still suggesting that the dollar bull market has more legs on a cyclical horizon. Monetary divergences should lend support to the dollar over the cyclical horizon, although the new administration's attempts to talk down the dollar as well as heightened policy uncertainty could translate into more volatility (Chart 16). The weakening trend in the yen hit a snag two months ago, as the 13-week momentum measure reached the lows that previously foreshadowed a consolidation phase after sharp depreciations. This short-term rate-of-change measure has bounced smartly this year reaching a critical level. Meanwhile, the 40-week rate-of-change measure is not warning of a major change in the underlying trend which remains dictated by BoJ's dovish bias (Chart 17). EUR/USD has been gravitating towards 1.05 over the course of February. The short-term rate-of-change measure seems to be holding at the neutral level, while the 40-week rate-of-change measure is in negative territory, but hardly stretched. Political uncertainty has the potential to drive the euro in near term, but the longer-term outlook is mostly a function of the monetary policy divergence between the ECB and the Fed (Chart 18). Chart 16U.S. Trade-Weighted Dollar* Chart 17Yen Chart 18Euro Miroslav Aradski, Senior Analyst miroslava@bcaresearch.com