Sorry, you need to enable JavaScript to visit this website.
Skip to main content

Insights

Gain insight into our independent global macro research through these complimentary reports

Sahm Rule

Market and economic observers have devoted a lot of attention to the Sahm Rule following July’s employment report, and whether or not it has been triggered. BCA’s analysis has highlighted that the overall direction of the labor market is far more important than the rounding conventions one applies to determine if the unemployment rate has risen enough to meet the exact trigger threshold.

Sahm Rule

Moreover, investors should keep in mind that the unemployment rate is a lagging variable. Employers typically resort to firing as a last resort. It is therefore worth remembering that the Sahm Rule is not a leading indicator of the economy. Our Global Investment strategists showed that on average, the Sahm Rule has lagged the onset of past recessions by a couple of months.

History therefore suggests that a recession could already be underway even if the Sahm Rule hasn’t been triggered.

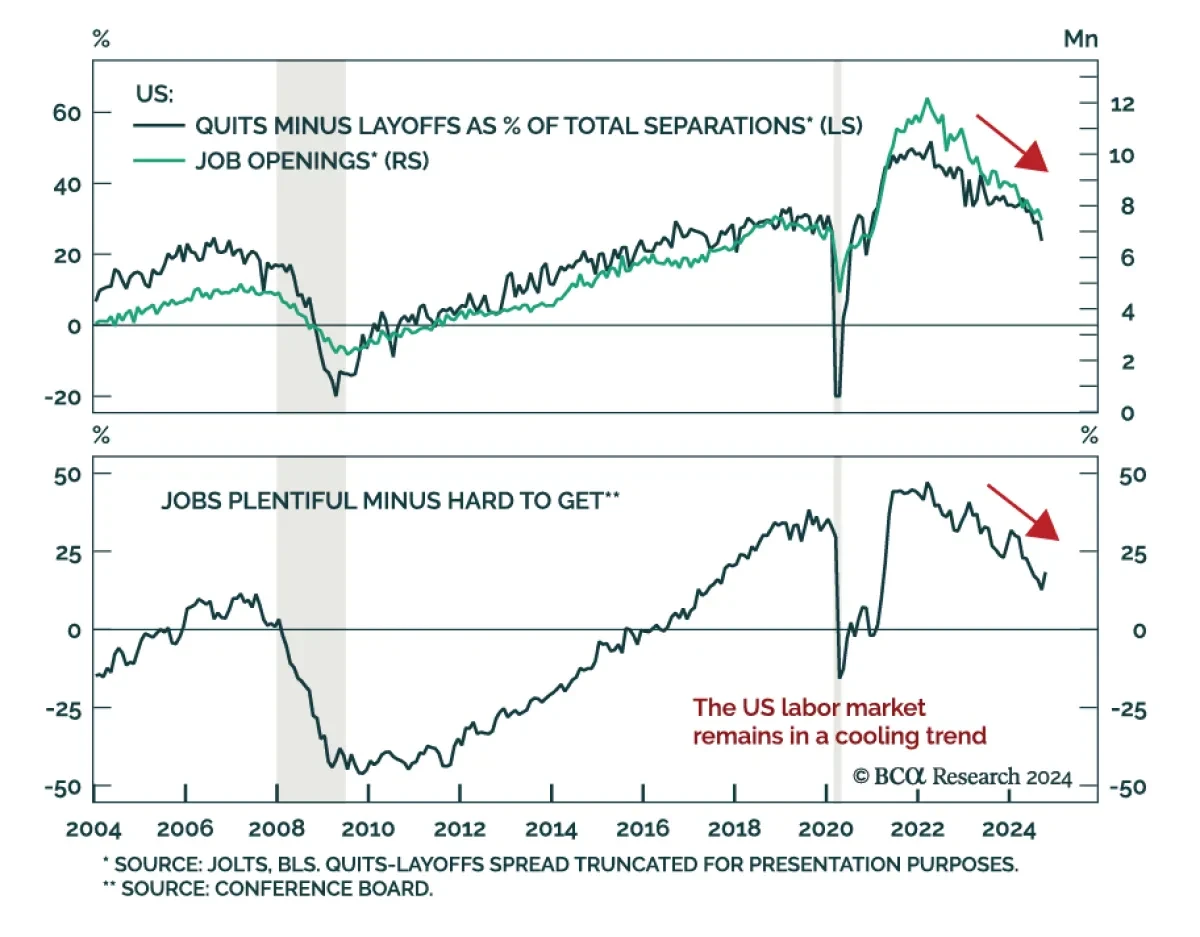
Importantly, the hiring rate from the JOLTS report is a more forward-looking indicator. Firms typically stop hiring before they resort to layoffs. Our US Bond strategists also view it as the “purest” indicator of labor demand, since it is not affected by changes in labor supply. The hiring rate has been directionally consistent with a deteriorating labor market for a while.

Households’ perception of labor availability also influences their behaviors and consumption patterns. The quits rate (also from the JOLTS report) and the share of consumers’ assessing jobs as “plentiful” relative to “hard to get” (from the Conference Board Consumer Confidence survey) are both well off their highs.

We continue to expect a recession and are underweight equities. Our conviction is now high enough that our Global Investment strategists have removed their barbell sector strategy (previously overweighting defensives + materials). They are now overweighting defensives outright. 

Read more
CPI inflation

China’s CPI and PPI prints surprised to the upside on Friday. Producer prices contracted -0.8%y/y, unchanged from June, compared to expectations of a -0.9% contraction. Consumer prices increased 0.5%y/y, above 0.3% expectations.

CPI Inflation

The consumer price index hit its highest rate of change since February, while producer prices have been contracting at the slowest pace since December 2022 for two consecutive months. This begs the question: is China recovering?

As BCA’s China Investment Strategist Jing Sima noted in Friday’s BCA Live & Unfiltered discussion, the answer is likely ‘no’. Most of the acceleration in CPI can be attributed to fluctuations in food and energy prices. Core CPI and Consumer Goods PPI both decelerated in July, which is further evidence that Chinese households are still downbeat.

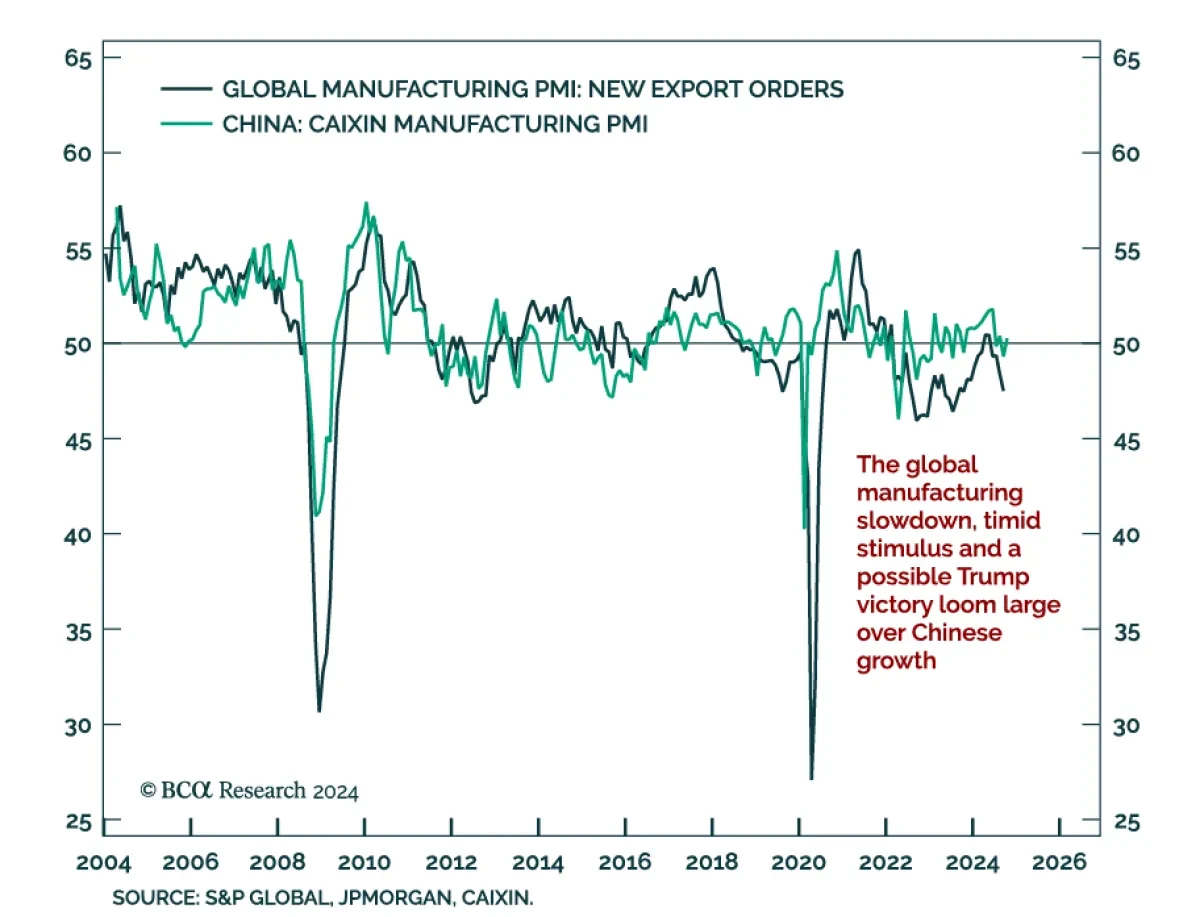
On the other hand, exports and the relatively slow contraction in producer prices drove the upside in industrial profits. However, this tailwind will fade due to waning global demand and an ever-stagnant domestic economy. In addition, a potential second Trump presidency would come with heavy tariffs, hamstringing exports to the US and potentially the EU.

However, our China Investment strategists recently upgraded onshore stocks to overweight and offshore stocks to neutral within a global equity portfolio on the basis that Chinese equities are already oversold and have scope to outperform global equities in the context of a global equity sell-off.

Read more
S&P 500 returns & volatility

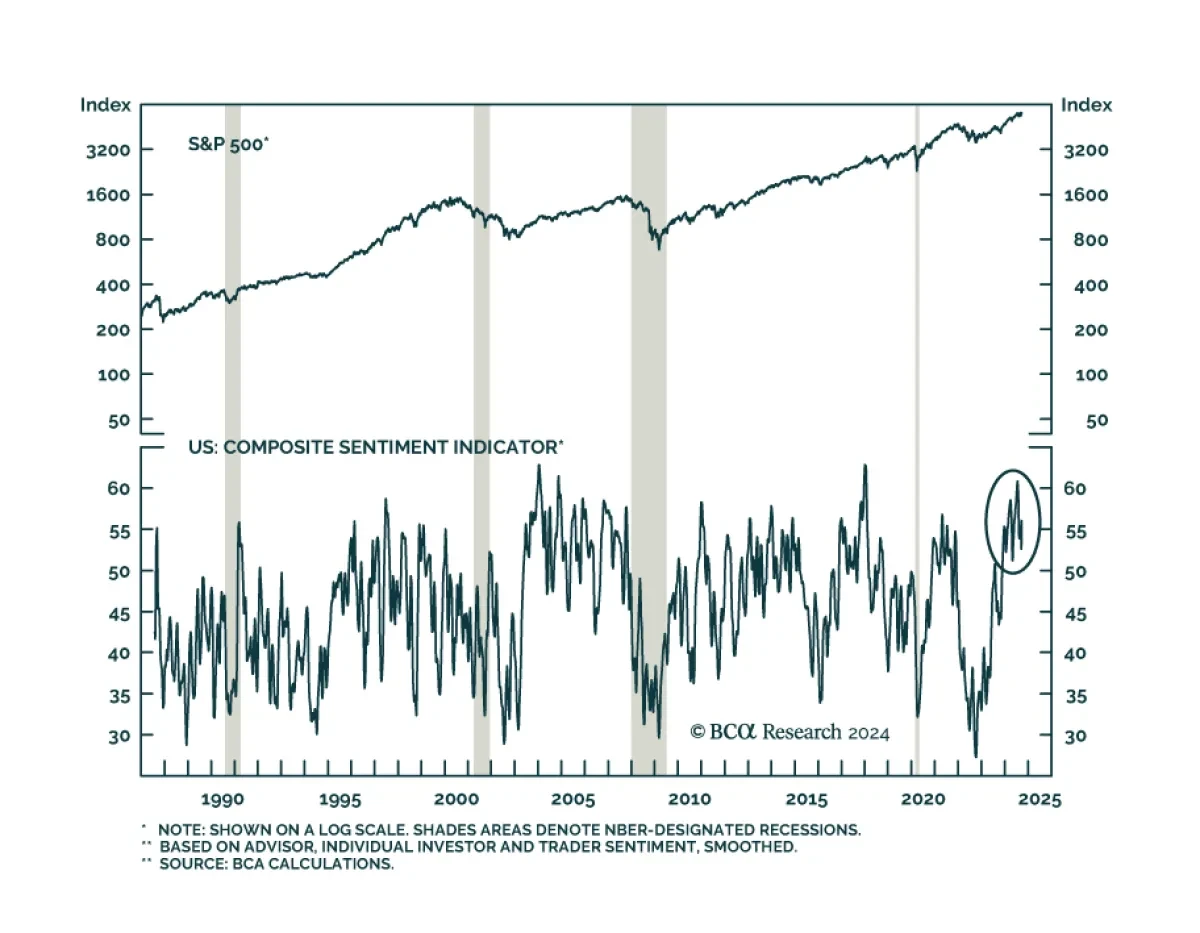
According to BCA Research’s US Equity Strategy service, the stock market outperformance in 2024 thus far is an unusual pattern in election years. The historical data imply that the market will suffer a spill if investors come to believe the incumbent party will change.

S&P 500 returns & volatility


The spike in volatility in recent weeks coincided with a surge in the odds of party change (e.g. Republican victory), which confirms this historical framework. Volatility will continue to increase in the near term, especially if the incumbent party fails to regain momentum after changing nominees. Stocks will fall if the incumbent party is poised to fall.

Investors should expect US assets to outperform global peers. By contrast, the market usually rallies after elections, relieved that uncertainty has dissipated.

After the election, the market faces a different question: 2025 will mark a new year with new policies that may or may not affect the markets, depending on the capability and interests of the next government (hawkish or ultra-hawkish trade policy, gridlock or full sweep).

It is impossible to untangle the Trump trade from the ubiquitous expectation of an imminent rate cut and a soft landing. Our hunch is that Real Estate and Homebuilders outperformed for that reason. However, Trump’s immigration reform will be a headwind for the industry as it will increase labor costs, hitting its bottom line.

The Trump trade, i.e. Small Caps, Regional Banks, and Industrials, runs against the BCA view of slowing economic growth that favors defensive assets. And of course, a Trump victory is far from a certainty.

Read more
forward earnings

According to BCA Research’s Geopolitical Strategy service, Trump’s agenda is structurally inflationary and would eventually be needed to be discounted by markets, if he wins.

forward earnings


Most retail investors – and many clients – seem to believe that Trump will win and the stock market will boom. Opinion polls show Trump leading in swing states. The market rallied when he won in 2016 on the expectation of tax cuts, which eventually boosted corporate earnings. Trump is proposing tax cuts again.

Three things to remember:

A relief rally is the norm after elections because uncertainty is removed.

If recessionary dynamics give Republicans full control, then the market will cheer tax cuts and other stimulus designed to aid the recovery.

If the economy expands and Biden loses anyway, then the bond market may revolt against Republican fiscal stimulus. This is the “Liz Truss” scenario, which is now becoming widely discussed.

The important point is that Trump’s agenda is structurally inflationary. Hence Trump and the Federal Reserve will eventually clash – and the president has the power to remove the Fed chair, however controversial it may be.

Whatever happens initially, the market will eventually need to discount another uptick in inflation.

Read more
import tariffs

According to BCA Research’s Bank Credit Analyst service, trade policy under a second Trump presidency represents one of the greatest cyclical risks to investors.

Import tariffs


A key question for investors is whether tariffs are prioritized early in the administration or saved for later. Our colleagues expect the former. An early legislative priority on immigration over tax cuts, alongside the rapid imposition of new tariffs, would be the worst alignment for risky assets.

Being barred from a third term, Trump would lack electoral constraints in his second term. In 2019, the Trump administration escalated the trade war with China, which weighed heavily on the global manufacturing sector. Then, when the 2020 election began to loom, Trump pivoted and started negotiating the Phase One trade deal with China.

During a second term, if China does not offer structural concessions, Trump will not be forced to conclude a Phase Two deal. Thus, his campaign threats of tariffs “more than” 60% on Chinese imports could materialize – and they may not be watered down in 2028. The impact of a true 60% flat tariff on all imports from China would bring the overall US import tariff rate to 10%, back to 1940s levels. They would dwarf the total increase in tariffs that occurred during the first Trump administration.

One optimistic take about Trump’s trade policy is that he views tariffs as a negotiation tool, and not as something that will stand permanently. The first counterpoint to that view is that China and other countries may not offer structural concessions. The second counterpoint is that tariffs can have a very significant impact on economic growth even if they are only in effect temporarily. That is because large and damaging trade actions are typically met with retaliation, which is theoretically rational, even if it constrains economic activity.

Read more
space economies

According to BCA Research’s Private Markets & Alternatives service, Artificial Intelligence is old news. Given such, it is not prime for Early-Stage Venture Capital (VC) investing. While everyone is distracted with AI, investors should look to Aerospace & Space Technology.

Space economies


Arguably the most important factor for investors, commercialization, is here. In the US, the share of federal spending allocated to NASA has decreased since the 1990s. This has given rise to increased investment and innovation in space exploration by the private sector, exemplified by SpaceX's historic crewed mission in May 2020. This shift towards privatization and commercialization, alongside the creation of the US Space Force in December 2019, reflects changing priorities and the evolving landscape of space exploration, where private companies play a pivotal role. Global space tourism, valued at $678 million in 2023, is expected to reach more than $1.3 billion by 2033, growing at a 38% CAGR over the next decade.

The financial durability of the sector may be undervalued. While falling input costs are making access more affordable and will ultimately attract a broader user base, the wealthy will continue to be the main customers in the near term. Tickets have been priced in the range of $200,000 to $500,000. Orbital flights, such as those offered by SpaceX, cost in the millions of dollars per seat. Such dynamics are likely to withstand any short-term economic downturns, which typically affect this demographic the least. The sector’s economic resilience is further deepened with steady public sector funding through defense spending, which  helped bolster government space budgets through the Global Financial Crisis (GFC). Moreover, the Early-Stage investment structure, featuring a 5-10-year horizon without restrictive debt financing, is well-suited to the characteristics of the opportunity set and potential economic growth challenges ahead.

Regulations will increase and will be positive, especially relative to AI. The increase in compliance costs and potential burden to innovation will be outweighed by the confidence regulation provides consumers, ultimately driving a longer-term path to stability and sustained growth.


Read more
FED GDP growth model

BCA Research has been writing extensively on how consumption fueled by excess savings has been propping up the US economy and prevented a recession in 2023. Now, many estimates of pandemic-era excess savings show that they have run out. While consumption is still robust, with June retail sales easily surpassing expectations, its tailwind is likely to wane.

FED GDP growth model


The Atlanta Fed’s GDPNow model corroborates the view that consumption growth will fade slightly. In April – just before the release of Q1 data – the model estimated that consumption would contribute 220 basis points (bps) to real GDP, much higher than the final print of 98 bps, yet still the greatest contributor to growth. Today, it expects consumption to contribute 150 bps to real GDP growth.

Interestingly, the model has been increasing the estimated contribution of investment to GDP growth and anticipates that investment will contribute 155 bps to growth in Q2 at a time when capex intentions are muted, and durable goods orders are slumping. The capex estimate is propped up by anticipated inventory restocking (95 bps), however. Inventory changes should net to zero in the long run and they are not a component of real domestic demand, which is the best growth barometer within GDP.

While our US Investment strategists’ projection that excess savings were exhausted in June was likely too pessimistic, it is becoming increasingly evident that consumers are losing vigor. In addition, relatively tight monetary policy will eventually weigh on capex. Thus, the two private sector domestic drivers of US activity are likely to slow. We continue to expect a recession to begin in the US in late 2024/early 2025.


Read more
S&P GSCI

According to BCA Research’s Commodity & Energy Strategy service, commodity prices typically rally toward the end of the business cycle.

S&P GSCI


In the past six recessions, the S&P 500 peaked before commodity prices. While there is significant variability across recessions, on average, the S&P GSCI topped out two months after the onset of a recession while the S&P 500 peaked five months before it began. The peak in commodity prices only preceded the recession in two instances (2001 and 2020). Conversely, the S&P 500 index has historically topped out ahead of recessions.

The implication is that investors should not rely on commodity markets to provide a leading signal for other risk assets that an economic downturn is looming. Rather, equity market dynamics help inform the outlook for commodity markets whereby – in the absence of a supply shock – a decisive peak in the equity market would signal that the commodity rally is in its latter stages. 

To be clear, we cannot say if the March 28 top in the S&P 500 marked a cyclical peak. Yet if and when equities decisively roll over and the hard-landing scenario becomes the dominant driver of financial market dynamics, it would signal that the demand headwind is intensifying.

Alternatively, the other two plausible outcomes for the economy – soft landing or no landing – are both favorable for commodity prices. In the soft-landing scenario, resilient demand-side growth would provide a tailwind for both commodity prices and equities. A no-landing scenario – which has been gaining traction among the investment community so far this year – would entail increased interest in commodities as an inflation hedge.

In the lead up to recessions, stocks have historically peaked prior to commodities. Therefore, a decisive top in the equity market would provide an early warning for commodity investors. That said, supply-side dynamics could prolong the commodity rally well into a recession.


Read more
Crude Oil Prices

Brent prices have fallen 6% so far in July, reversing their June gains.

Brent Crude oil Prices


Interestingly, these losses are occurring despite escalating Middle East tensions and quickening Chinese industrial profit growth in June (see The Numbers), both of which are supportive developments for oil prices.

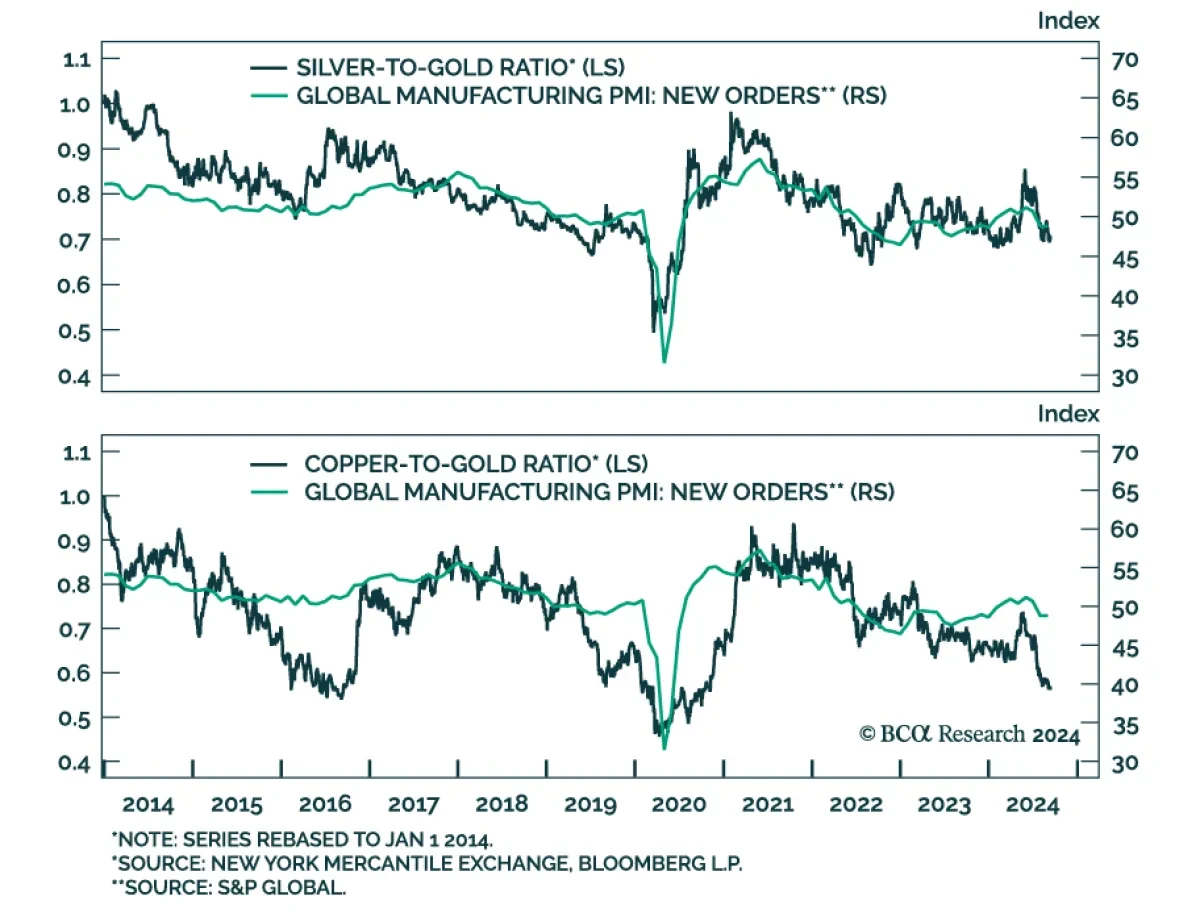
Within the broad commodity complex, oil prices tend to lag peaks and troughs in the business cycle. Conversely, industrial metals prices’ high exposure to the manufacturing sector makes them a leading economic indicator. They peaked back in May and have since been underperforming the broad commodity complex.

Oil prices may therefore be catching up to the reality of subdued demand conditions.

Our Commodity and Energy strategists had highlighted that OPEC, EIA, and IEA oil demand growth forecasts are likely too optimistic. While they all project a moderation in demand this year, none of them anticipate weak consumption growth by historical standards. That said, we assign high odds that the global economy will fall into recession on a 6-to-12-month timeframe.

On the supply side and aside from Middle East tensions, the latest shift in OPEC+’s production agreement suggests that the group may be lowering its sights from raising prices to defending a price floor. Moreover, supply cuts will not begin before October and will merely offset increased output from non-OPEC+ producers.

Weak demand dynamics are thus likely to dominate the oil supply/demand landscape, making lower prices the path of least resistance on a cyclical investment timeframe. Investors should remain underweight.


Read more
ASEAN Markets

The four ASEAN stock markets (Indonesia, Malaysia, Thailand, and the Philippines) have fallen in absolute terms over the past year despite the powerful rally in the developed markets. They have also underperformed their EM benchmark.

ASEAN markets


Our Emerging Markets strategists posit that ASEAN stocks and currencies have more downside. High real interest rates, tight fiscal stances, and export downturns ail all of these markets.

Inflation has fallen rapidly in these economies and has been below 2% since early this year. Yet the ASEAN central banks have not cut policy rates as they face a dilemma over their depreciating currencies. All four currencies have weakened significantly over the past three years versus the US dollar.

As a result, real policy rates have surged to well above pre-pandemic levels in three of the four economies. Correspondingly, real borrowing costs have also risen sharply, discouraging credit demand and origination. Adding to the woes, fiscal thrust has been negative in all four economies over the past two years.

Looking ahead, stock prices will remain vulnerable and the rupiah and the peso will likely continue to fall as export fragility persists and capital inflows are unlikely to rise. One reason for the latter is that the ASEAN nominal interest rate differential with the US has fallen to record lows. Another reason is ASEAN corporate earnings growth has been weaker than that of the US, as capital tends to gravitate where the return on capital is relatively higher and/or rising.


Read more