Homebuilding
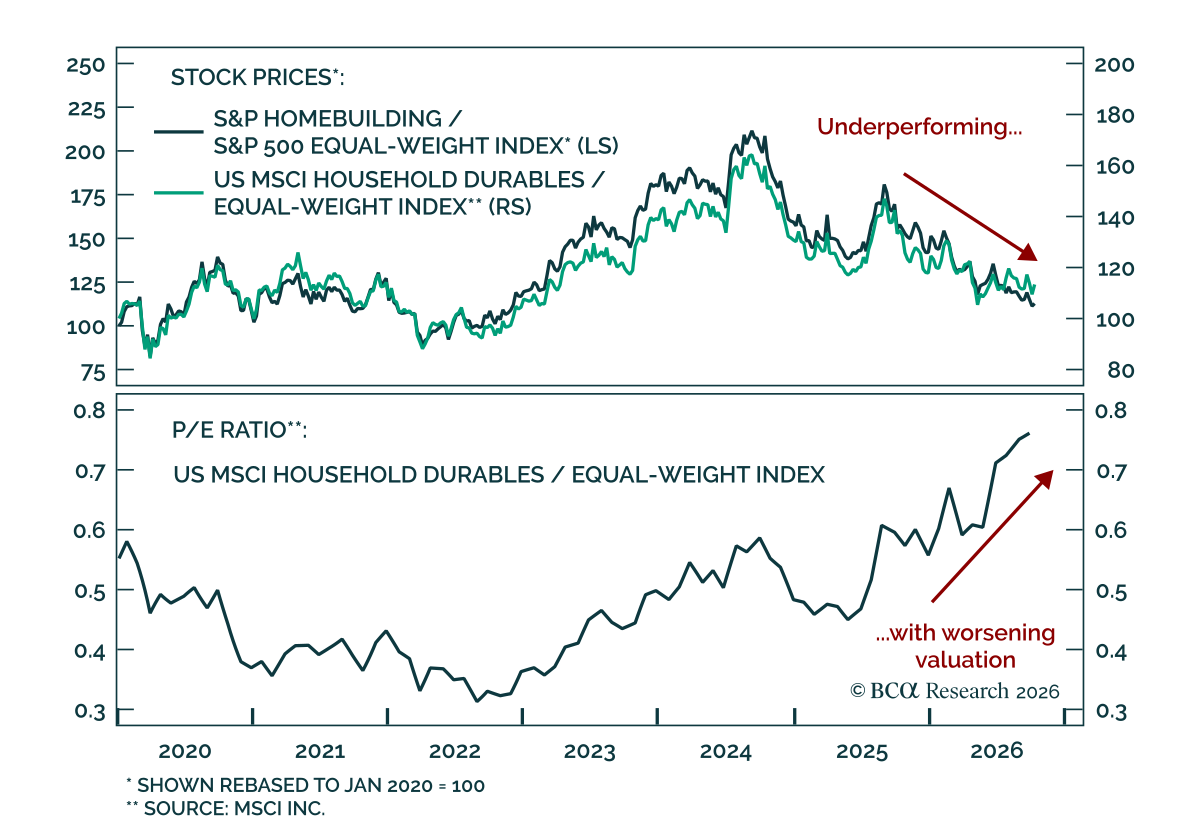
The US housing market is weakening, which bodes poorly for US homebuilders. The US housing market deteriorated meaningfully in September and October. US housing starts, permits, and pending home sales, all fell in September, with an especially large decline…
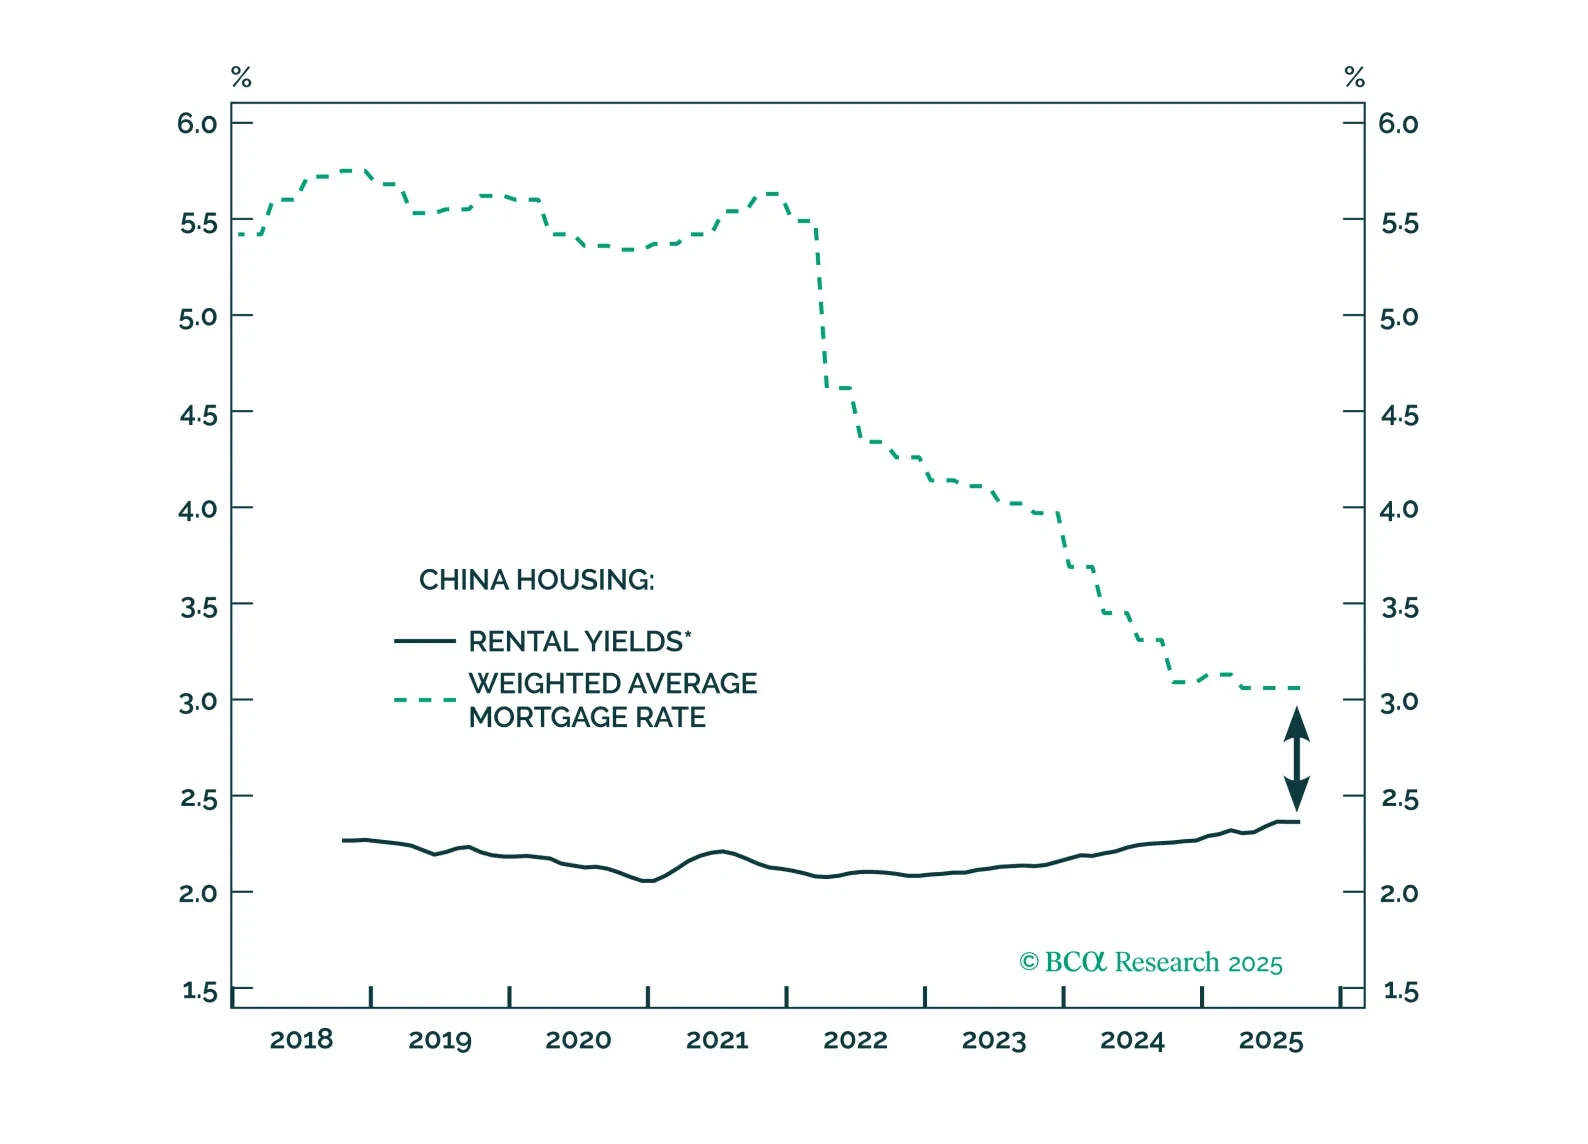
This report revisits China’s property market through both cyclical and structural lenses, assesses the likely policy responses, and evaluates their investment implications.

Stocks are a forward discounting mechanism and routinely top before recessions begin, even if they typically do not swoon until the recession has taken hold. According to BCA Research’s US Investment Strategy service, if consumers were losing momentum and a…

Executive Summary The structural downtrend in Chinese bond yields has a lot further to go, because it is helping to let the air out gently of stratospheric valuations in the real estate sector, and thereby preventing a hard landing for the Chinese economy. In the US, flagging mortgage and housing market activity is weighing on an already slowing economy. Buy US T-bonds. The long T-bond yield is close to a peak. Switch equity exposure into long-duration sectors such as healthcare and biotech. Go overweight US homebuilders versus US insurers. The peak in bond yields will also take pressure off US homebuilder shares whose recent collapse has been the mirror-image of the surge in the 30-year mortgage rate. Fractal trading watchlist: Basic resources; Switzerland versus Germany; and USD/EUR. The Collapse In US Homebuilder Shares Is The Mirror-Image Of The Surge In The Mortgage Rate Bottom Line: The global bond yield cannot rise much further before it destabilises the $350 trillion global real estate market and thereby destabilises the global economy. Feature Quietly and largely unnoticed, Chinese long-dated bond yields have been drifting lower (Chart I-1 and Chart I-2). At a time that surging bond yields elsewhere in the world have grabbed all the attention, the largely unnoticed contrarian move in Chinese bond yields through the past year is significant because of something else that has gone largely unnoticed: Chinese real estate has become by far the largest asset-class in the world, worth $100 trillion.1 Chart I-1The Contrarian Downdrift In The Chinese 30-Year Bond Yield Chart I-2The Contrarian Downdrift In The Chinese 10-Year Bond Yield Chinese Real Estate Is Trading On A Stratospheric Valuation The $100 trillion valuation of Chinese real estate market is greater than the $90 trillion global economy, is more than twice the size of the $45 trillion US real estate market and the $45 trillion US stock market, and dwarfs the $18 trillion Chinese economy. Suffice to say, Chinese real estate’s pre-eminence as the world’s largest asset-class is mostly due to its stratospheric valuation. Prime residential rental yields in Guangzhou, Shanghai, Hangzhou, Shenzhen and Beijing have collapsed to 1.5 percent, the lowest rental yields in the world and less than half the global average of 3 percent. Versus rents therefore, Chinese real estate is now twice as expensive as in the rest of the world (Chart I-3). Chart I-3Versus Rents, Chinese Real Estate Is The Most Expensive In The World To corroborate this point, while the US real asset market is worth around two times US annual GDP, the Chinese real estate market is worth more than five times China’s annual GDP! The structural downtrend in Chinese bond yields has a lot further to go. Crucially, the downward drift in Chinese bond yields is alleviating some of the pressure on the extremely highly valued Chinese real estate market – as it helps to let the air out gently of the stratospheric valuations, and thereby avoid a hard landing for the Chinese economy. Hence, the structural downtrend in Chinese bond yields has a lot further to go. The Surge In US Mortgage Rates Is Taking Its Toll Meanwhile, in the rest of the world, the surge in bond yields poses a major threat to the decade long housing boom. Versus rents, US house prices are the most expensive ever – more expensive even than during the early 2000s so-called ‘housing bubble’. For the first time since 2008, the US 30-year mortgage rate is higher than the prime residential rental yield. Until recently, the historically low rental yield on US real estate was justified by an extremely low bond yield. But the recent surge in the bond yield has changed all that. For the first time since 2008, the US 30-year mortgage rate is higher than the prime residential rental yield2 (Chart I-4). Chart I-4The US 30-Year Mortgage Rate Is Now Higher Than The Prime Residential Rental Yield The surge in US mortgage rates is taking its toll. Since the end of January, US mortgage applications for home purchase have fallen by almost a fifth (Chart I-5), and the lower demand for home purchase mortgages is starting to weigh on home construction (Chart I-6). Building permits for new private housing units were already falling in February, but a more up-to-date sign of the pain is the 35 percent collapse in US homebuilder shares. Chart I-5US Mortgage Applications For Home Purchase Have Fallen By Almost A Fifth Chart I-6The Lower Demand For Home Purchase Mortgages Is Starting To Weigh On Home Construction $350 Trillion Of Global Real Estate Can’t Swallow Higher Bond Yields Mortgage rates drive real estate rental yields because of the arbitrage between buying versus renting a similar home. Given a fixed annual budget for housing, I must choose between how much home I can buy – which depends on the mortgage rate, versus how much home I can rent – which depends on the rental yield. The arbitrage should make me indifferent between the two options. As a simple example of this arbitrage, let’s assume my annual budget for housing is $10k, and both the mortgage rate and rental yield are 4 percent. I will be indifferent between spending the $10k on interest on a $250k mortgage loan to buy the home, or spending the $10k to rent a similar $250k home. If the mortgage rate rises to 5 percent, then the maximum loan that my $10k of interest payment will afford me falls to $200k, reducing my maximum bid to buy the home. If I am the marginal bidder, then the home price will fall to $200k, so that the $10k rent on the similar valued home will also equate to a higher rental yield of 5 percent. In practice, the simple arbitrage described above is complicated by several factors: the maximum loan-to-value that a lender will offer on the home; the different transaction costs of buying versus renting; and the fact that people prefer to buy than to rent because buying a home is an investment which also provides a consumption service – shelter, whereas renting a home only provides the consumption service. Nevertheless, these complications do not diminish the overarching connection between mortgage rates and rental yields. The lion’s share of the real estate boom has come from a massive valuation uplift, which in turn has come from structurally lower bond yields. All of which brings us to the decade long global real estate boom that has doubled the value of global real estate market to an eye-watering $350 trillion, four times the size of the $90 trillion global economy. During this unprecedented boom, global rents have risen by 40 percent, tracking world nominal GDP, as they should. This means that the lion’s share of the real estate boom has come from a massive valuation uplift, which in turn has come from structurally lower bond yields (Chart I-7). Chart I-7The Lion's Share Of The Global Real Estate Boom Has Come From A Massive Uplift In Valuations Since the global financial crisis, there has been an excellent empirical relationship between the global long-dated bond yield (US/China average) and the global rental yield. The important takeaway is that the global bond yield cannot rise much further before it destabilises the $350 trillion global real estate market and thereby destabilises the global economy (Chart I-8). Chart I-8The Global Bond Yield Cannot Rise Much Further Before It Destabilises The $350 Trillion Global Real Estate Market Some Investment Conclusions The good news is that the recent rise in the global bond yield has been limited by the downdrift in Chinese bond yields. Given the massive overvaluation of Chinese real estate, the structural downtrend in Chinese bond yields has a lot further to go. Meanwhile in the US, unless bond yields back down quickly, flagging mortgage and housing market activity will weigh on an already slowing economy. If US bond yields don’t back down quickly, the feedback from consequent slowdown in the economy will ultimately bring yields down anyway. As I explained last week in Fat-Tailed Inflation Signals A Peak In Bond Yields I do expect the long T-bond yield to back down relatively quickly. The sharp drop in US core inflation to just 0.3 percent month-on-month in March signals that inflation is peaking. Hence, medium to long term investors should be buying US T-bonds, and switching equity exposure into long-duration sectors such as healthcare and biotech. Finally, a peak in bond yields will also take pressure off US homebuilder shares whose recent collapse has been the mirror-image of the surge in the 30-year mortgage rate (Chart I-9). Hence, go overweight US homebuilders versus US insurers. Chart I-9The Collapse In US Homebuilder Shares Is The Mirror-Image Of The Surge In The Mortgage Rate Fractal Trading Watchlist Given that inflation hedging investment demand has driven at least part of the strong rally in basic resources, a peak in inflation and bond yields threatens to unwind the recent outperformance of basic resources shares. This is corroborated by the extremely fragile 130-day fractal structure (Chart I-10). Accordingly, the recommended trade is to short basic resources (GNR) versus the broad market, setting the profit target and symmetrical stop-loss at 11.5 percent. This week we are also adding to our watchlist: Switzerland versus Germany; and USD/EUR. The full list of 20 investments that are experiencing or approaching turning points is available on our website: cpt.bcaresearch.com Chart I-10The Outperformance Of Basic Resources Is Vulnerable To Reversal Switzerland's Outperformance Vs. Germany Could End The Rally In USD/EUR Could End Chart 1The Strong Trend In The 18-Month-Out US Interest Rate Future Is Fragile Chart 2The Strong Trend In The 3 Year T-Bond Is Fragile Chart 3AUD/KRW Is Vulnerable To Reversal Chart 4Canada Versus Japan Is Vulnerable To Reversal Chart 5Canada's TSX-60's Outperformance Might Be Over Chart 6US Healthcare Providers Vs. Software At Risk of Reversal Chart 7Bitcoin's 65-Day Fractal Support Is Holding For Now Chart 8A Potential Switching Point From Tobacco Into Cannabis Chart 9Biotech Is A Major Buy Chart 10CAD/SEK Reversal Has Started Chart 11Financials Versus Industrials To Reverse Chart 12Norway's Outperformance Could End Chart 13Greece's Brief Outperformance To End Chart 14BRL/NZD At A Resistance Point Chart 15The Outperformance Of Resources Versus Healthcare Is Vulnerable To Reversal Chart 16The Outperformance Of Resources Versus Biotech Is Vulnerable To Reversal Chart 17Cotton's Outperformance Is Vulnerable To Reversal Chart 18US Homebuilders' Underperformance Is At A Potential Turning Point Chart 19Fractal Trading Watch List Chart 20Fractal Trading Watch List Dhaval Joshi Chief Strategist dhaval@bcaresearch.com Footnotes 1 We estimate the value of Chinese real estate at the end of 2021 to be $97 trillion, comprising residential $85 trillion, commercial $6 trillion, and agricultural $6 trillion. The source is: the Savills September 2021 report ‘The total value of global real estate’, which valued the global real estate market to the end of 2020; and the February 2022 report ‘Savills Prime Residential Index: World Cities’ which allowed us to update the valuations to the end of 2021. 2 The US prime residential rental yield is the simple average of the prime residential rental yields in New York, Miami, Los Angeles and San Francisco. Source: Savills. Fractal Trading System Fractal Trades 6-Month Recommendations Structural Recommendations Closed Fractal Trades Indicators To Watch - Bond Yields Chart II-1Indicators To Watch - Bond Yields - Euro Area Chart II-2Indicators To Watch - Bond Yields - Europe Ex Euro Area Chart II-3Indicators To Watch - Bond Yields - Asia Chart II-5Indicators To Watch - Bond Yields - Other Developed Indicators To Watch - Interest Rate Expectations Indicators To Watch - Interest Rate Expectations Chart II-6Indicators To Watch - Interest Rate Expectations Chart II-7Indicators To Watch - Interest Rate Expectations Chart II-8Indicators To Watch - Interest Rate Expectations
Underweight Housing stocks have been resilient to rising interest rates for the most part of the year, but now macro headwinds are taking over this consumer discretionary sub-sector and we recommend a below benchmark allocation. Rising mortgage rates (up 35 bps YTD), and skyrocketing housing prices (up 15% YoY), are starting to hurt housing affordability, suppressing demand, and putting downward pressure on homebuilders’ revenue. To make things worse, oriented strand board prices remain on the ascent despite the outright bear market in lumber futures. The cost of labor is on the rise, too, increasing homebuilders’ expenses. Falling revenue and rising costs are a poisonous cocktail bound to hurt homebuilders’ profitability, putting a halt to what has been a strong run and making them an excellent candidate for an underweight allocation. Looking beyond this macro soft patch, once headwinds dissipate, we will be adding to homebuilders as the industry has compelling long-term prospects: US consumers are facing a housing shortage to the tune of five million units as construction was running under the trend over the past decade. Bottom Line: We are underweight the S&P homebuilding index. The ticker symbols for the stocks in this index are: BLBG: S5HOME – LEN, PHM, DHI, NVR.
Underweight High-Conviction While our underweight homebuilders call has been offside of late, we are sticking with it given the recent turn in some crucial data series. Interest and mortgage rates are a key determinant for the industry’s relative performance, and given the sell-off in the bond market, it is only a question of when, not if, US building permits will play catch up to the downside (mortgage rates shown inverted, middle panel). If rising mortgage rates (although from a low base) is not enough to cool down the US housing market, then an astronomical rise in lumber prices will likely weigh on it soon. As a reminder, framing lumber accounts for 15-20% of the total cost of building a home (bottom panel). Before long, this input cost inflation will eat into homebuilders’ margins and thus cut into profits. Bottom Line: We reiterate our cyclical and high-conviction underweight stance in the S&P homebuilding index. The ticker symbols for the stocks in this index are: BLBG: S5HOME – LEN, PHM, DHI, NVR.
Today we close two high-conviction trades and place a stop buy order for the June 2021 expiry VIX futures as a hedge to the remaining positions. Homebuilders have proven to be more resilient than we expected, especially given the selloff in the bond market. Clearly the US consumer is not concerned about a rebound in rates, at least not yet. Moreover, the looming fiscal stimulus will only facilitate more excesses, even in the residential housing market, as a fresh wave of liquidity will likely more than offset the tightening in monetary conditions. Thus, we have lost confidence in our high-conviction underweight stance in this niche consumer discretionary group and are taking a loss of 11% since inception. The S&P consumer staples sector was a natural high-conviction underweight given our end-2021 4,000 SPX target that we arrived at on the November 9 Special Report. Now that the market is within spitting distance of our target, the risk reward is no longer as favorable as it used to be for this defensive sector. Thus, we are closing this high-conviction trade today for a gain of 8% since inception. Finally, we successfully capitalized on our long VIX futures hedge to the tune of 19% recently, but given that volatility is settling down, it pays to institute a stop buy order for the June 2021 expiry VIX futures near the 25 mark. Bottom Line: Close the S&P consumer staples and the S&P homebuilding high-conviction underweights for 8% and -11% returns, respectively since the December 7 inception; and place a stop buy order for the June 2021 VIX futures at the 25 level.
In the January 19th Special Report we instituted a long S&P REITs / short S&P homebuilders pair trade with a 10% stop loss. Yesterday, our stop was triggered and we are obeying it and closing this pair trade. Among other reasons, one of the macro drivers that compelled us to put this pair trade on was the 10-year US Treasury yield: historically the correlation between the relative share price ratio and interest rates would snap positive especially following a recession. Hence, a pullback in yields was also a key risk we highlighted for this pair trade. The 10-year US Treasury yield peaked near 1.19% and has continued to correct breaking below 1.04%, which at the margin boosts the allure of homebuilding stocks and consequently put our pair trade offside. While the original reasoning for putting this pair trade on remains intact, we refrain from fighting the trend and opt to move to the sidelines for the time being. We will be on the lookout for a better-timed entry point in the near future. Bottom Line: Obey the trailing stop and close the long S&P REITs / short S&P homebuilders pair trade for a loss of 10%.
Underweight We deem that most, if not all, of the good news (low mortgage rates, low inventories, high demand, work-from-home reality, all-time highs on the overall NAHB housing sentiment survey) is already priced in galloping homebuilders stock prices and exuberant expectations. If our economic reopening thesis proves accurate next year, then the COVID-19 winners – homebuilders included – will take the back seat. Historically, interest rates and relative share prices have been inversely correlated and a steep selloff in the bond market is bad news for homebuilding stocks (top panel). On the operating housing front, some cracks are forming. New home sales, while brisk in absolute terms, are losing out to existing housing sales and homebuilders have resorted to price concessions in order to drive volumes (second & third panels). Profit margins are at the highest level since the subprime crisis and are vulnerable to a squeeze courtesy of rising input costs. Framing lumber comprises roughly 15% of a new home’s commodity related costs and lumber prices have been expanding all year long (bottom panel). Bottom Line: Put the S&P homebuilding index to the high-conviction underweight call list. The ticker symbols for the stocks in this index are: BLBG: S5HOME – LEN, PHM, DHI, NVR.