Global
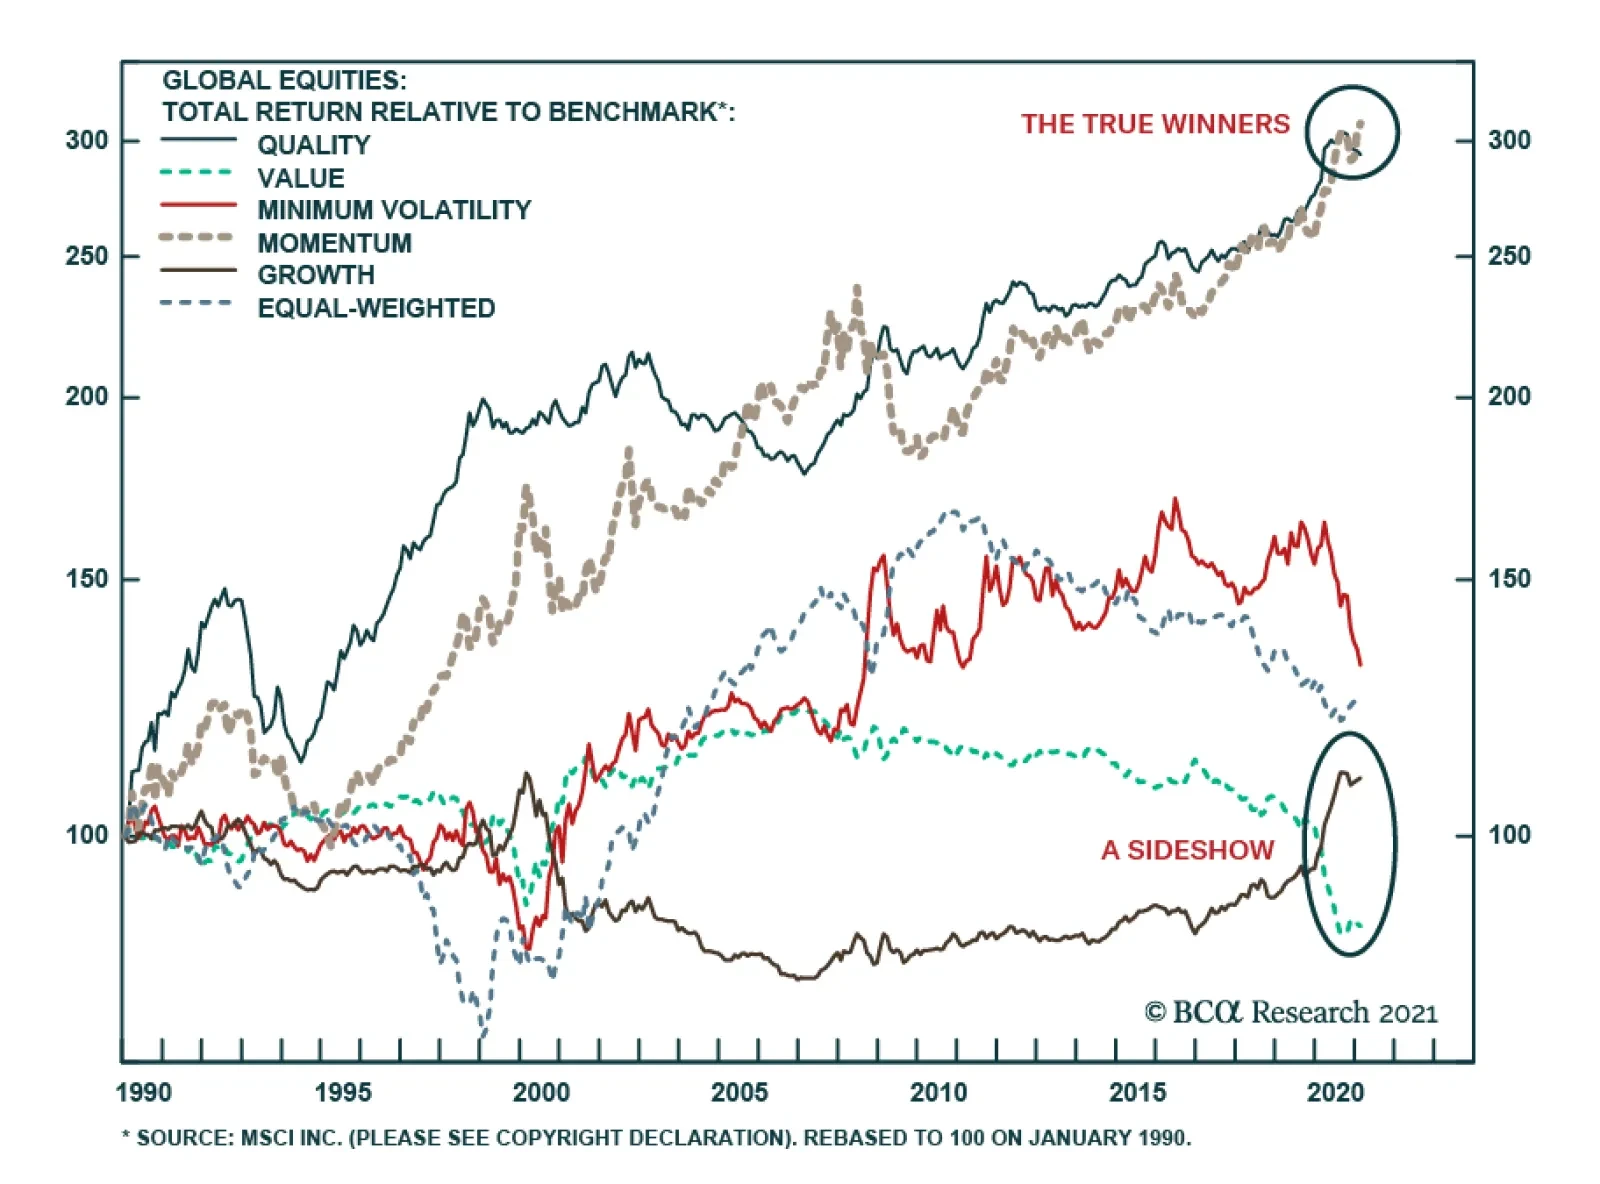
The debate between the proponents of value and growth investing receives the most airplay in the financial media and among the investment community. However, this debate obfuscates the reality that superior strategies exist. Our Global Asset Allocation…

Highlights There is too much euphoria and complacency in global markets. The main distinction between the current and previous episodes of speculative equity market excesses is that classic end-of-business cycle conditions – such as economic overheating and policy tightening – are now absent. Yet, it does not mean that the bull market will continue uninterrupted. This rally might be short circuited by gravitational forces as happened with the S&P 500 in 1987 and Chinese onshore stocks in 2015. Investors should consider going long EM equity or EM currency volatility to hedge their exposure. Feature There is growing evidence that the global equity rally has turned into a frenzy. Signs of investor euphoria include: The number of traded call options in the US equity market has surged to an all-time high (Chart 1). The number of put options has spiked only in the past couple of weeks and remains well below the number of call options. Chart 1A Call Buying Frenzy Is A Symptom Of Investor Exuberance
A Call Buying Frenzy Is A Symptom Of Investor Exuberance
A Call Buying Frenzy Is A Symptom Of Investor Exuberance
Critically, there is currently too much complacency: the US put-call ratio is as low as it was in 2000 (Chart 2). The volume of stocks traded on and off all US stock exchanges has exploded since late October, reaching an all-time high (Chart 3). Chart 2A Sign Of Equity Market Complacency
A Sign Of Equity Market Complacency
A Sign Of Equity Market Complacency
Chart 3US Equity Trading Volumes Are At All-Time Highs
bca.ems_wr_2021_02_04_c3
bca.ems_wr_2021_02_04_c3
Chart 4Retail Investors Haven Been A Powerful Force In Korea And Taiwan
Retail Investors Haven Been A Powerful Force In Korea And Taiwan
Retail Investors Haven Been A Powerful Force In Korea And Taiwan
Equity fervor is prevalent not only among American individual investors but also in many parts of the world. For instance, the breathtaking rallies in the KOSPI and Taiwanese stocks has been primarily driven by local retail investors, as shown in Chart 4. The surge in Taiwanese share prices is stunning because it completely ignores the escalating geopolitical tensions over Taiwan. BCA Research’s Chief Geopolitical Strategist, Matt Gertken, recently argued that while China is unlikely to invade Taiwan immediately, a military stand-off cannot be ruled out. China and the US have yet to arrive at a mutual understanding regarding China’s access to computer chips made in Taiwan. Overall, since the lockdowns in March last year, individual investors have rushed into equities in many countries such as the US, Korea, Taiwan, Japan, India and Brazil, to name a few. Finally, US institutional investors are fully invested, as shown in Chart 5. Besides, Chart 6 reveals that US-domiciled EM equity mutual funds’ liquidity ratio (cash as a percentage of assets) is very low. Chart 5US Institutional Investors Are Long Stocks
US Institutional Investors Are Long Stocks
US Institutional Investors Are Long Stocks
Chart 6US-Domiciled EM Mutual Funds' Cash Is Low
US-Domiciled EM Mutual Funds' Cash Is Low
US-Domiciled EM Mutual Funds' Cash Is Low
There have been doubts within the global investment community about the potential for small individual investors to move the needle in the overall market. We believe that their impact has been substantial: First, there is plenty of anecdotal evidence to suggest that individual traders have been involved in options trading since the pandemic erupted. By purchasing call options, retail investors exert substantial upward pressure on share prices: dealers – who sell/write call options – typically hedge their risks by acquiring and holding the underlying stock for the duration of respective options. In short, by putting even small amounts of money at work to purchase call options, individual traders meaningfully affect share prices. Second, price formation in financial markets is influenced by the marginal investor. Everything else being equal, the entry of a new buyer into the marketplace leads to higher prices. Further, retail investors’ impact on financial markets has not been limited solely to stocks they purchase. Rather, there has been a ripple effect on the broader market. For instance, there is evidence that individual investors flocked to the market in March and April and bought en masse shares of companies most negatively affected by the pandemic, such as cruise operations, hotels, airlines and energy producers. As individual investors provided substantial bids for these stocks, institutional investors were able to offload these stocks and buy others. For instance, in Q2 last year Warren Buffett offloaded his airline stocks and allocated that capital to natural gas storage and pipelines, banks, pharma and auto stocks. If retail investors had not provided support to stocks of companies hit hard by the lockdowns and social distancing, Warren Buffett and other professional investors would not have had the opportunity to exit their positions in these stocks at acceptable prices and acquire other securities. This is the mechanism whereby the impact of new market entrants extends beyond the specific equities they purchase. Chart 7A Mini Call Option Mania Among Retail Investors
A Mini Call Option Mania Among Retail Investors
A Mini Call Option Mania Among Retail Investors
Finally, Charts 1 and 3 above clearly illustrate the surge in both the number of call options and trading volumes since last March. Among call options, transactions with a small number of options have ballooned (Chart 7). This reflects individual investors activity. Consistently, the number of brokerage accounts for retail investors has mushroomed in the US and elsewhere. Bottom Line: It is obvious that the ongoing equity market euphoria is considerable. Individual investors have been playing a vital role in fostering it. The GameStop stock saga, among others, reinforces this point. When And How Will It End? This bull market shares some similarities with previous market cycles, but it also has its distinct features. Similarities: Retail investors typically rush into financial markets toward the end of a bull market. The current US equity market rally began in 2009. After the S&P 500 showed its resilience by rebounding quickly and making new highs following the selloffs in 2015, 2018 and 2019, retail investors were reassured to jump on the bull market train when the 2020 crash occurred. In short, it took about 11 years of a US equity bull run for individual investors to feel comfortable enough to play the stock market. This is a characteristic of a late cycle/mature bull market. Speculative instruments and schemes are designed and launched. The IPO boom in SPACs1 will probably go down in history as a key feature of the speculative excesses in this cycle. Valuations overshoot during stock market euphoria but investors find reasons to justify lofty equity multiples. FAANGM stocks and other parts of the US equity market are expensive, but investors are using extremely low US bond yields – artificially suppressed by the Federal Reserve – to justify the current multiples. In such a case, the bond market will likely hold equities hostage. As bond yields rise going forward, equity valuations will be threatened. In fact, we believe rising bond yields, not the outlook for economic growth, to be the primary risk to US share prices akin to the late 1960s (Chart 8). Differences: Typically, retail investors feel comfortable investing in the stock market when the economy is strong. In this cycle, they jumped on the stock market train when the economy crashed due to the pandemic. This is a departure from previous cycles. Massive stimulus and ongoing vaccination deployment suggest the economic outlook for the US and many emerging economies is positive. In particular, EM corporate profits are set to recover (Chart 9). Chart 8The US In The 1960s: Share Prices And Treasury Yields
The US In The 1960s: Share Prices And Treasury Yields
The US In The 1960s: Share Prices And Treasury Yields
Chart 9EM EPS Is To Recover
EM EPS Is To Recover
EM EPS Is To Recover
Hence, it is hard to be bearish on stocks based on the cyclical outlook for growth, assuming vaccination campaigns will allow many major economies to fully reopen in H2 2021. Yet, a lot of this good news seem to be already priced in. Retail investors arrive to the stock market party usually in the late stage of a business cycle – when unemployment is low, inflation is rising, and policymakers are tightening policies. That combination proves lethal for the equity market and a major top in share prices ensues. Presently, due to the pandemic-induced lockdowns, we have the opposite occurring in the US and in many EM economies. Unemployment is high, inflation remains contained, and policymakers are committed to providing unlimited stimulus. In short, the main distinction between the current and previous episodes of speculative equity market excesses is that classic end-of-business cycle conditions – such as economic overheating and policy tightening – are now absent. History doesn't repeat itself, but it does rhyme. Does it mean that the bull market will continue uninterrupted? Not necessarily. This rally might be short circuited for reasons that may differ from those that terminated previous stock market frenzies. First, speculative bubbles could burst without policy tightening. An example of this is China’s equity bubble in 2015, which crashed without policy tightening due to gravitational forces reasserting themselves. Another example is the 1987 US stock market crash that occurred without an economic or fundamental financial cause. Chart 10 illustrates the cyclical trajectories of US GDP and the Fed funds rate did not change materially before and after the equity market crash. In short, the 1987 equity crash was a case when excessive speculation/overbought conditions rather than policy tightening or a recession caused an abrupt equity sell-off. Second, in the EM equity universe, leadership has been extremely narrow. Only a handful of companies have outperformed the aggregate benchmark, propelling the index to 2007 highs. These include a few Chinese new economy stocks, and Korean and Taiwanese technology stocks (Chart 11). Outside North Asian markets (China, Korea and Taiwan), every single EM bourse has underperformed both the EM and global equity benchmarks in the past year. Chart 10The 1987 S&P 500 Crash Was Not Caused By The Fed Or The Economy
The 1987 S&P 500 Crash Was Not Caused By The Fed Or The Economy
The 1987 S&P 500 Crash Was Not Caused By The Fed Or The Economy
Chart 11Euphoria In Asian TMT Stocks
Euphoria in Asian TMT Stocks
Euphoria in Asian TMT Stocks
Chart 12Global ex-TMT Stocks Have Not Broken Out Yet
bca.ems_wr_2021_02_04_c12
bca.ems_wr_2021_02_04_c12
If these global and EM TMT stocks relapse, they will inflict major damage on the EM and global indexes. The EM index has become extremely concentrated with the top five stocks accounting for 24% of the MSCI EM equity index’s market cap. Interestingly, global ex-TMT stocks have not yet broken out to new highs (Chart 12). Finally, US overall equity and global TMT valuations are vulnerable to rising US bond yields. The latter could rise without the Fed hinting at policy tightening if fixed-income investors decide that the Fed is behind the inflation curve. This could trigger a major selloff even if policymakers do not tighten policy. Investment Conclusions Chart 13Go Long EM Equity And Currency Volatility
Go Long EM Equity And Currency Volatility
Go Long EM Equity And Currency Volatility
We are in a euphoria phase where fundamentals are less pertinent. The market can either rally a lot or sell off hard regardless of the profit outlook. Navigating through such markets is challenging. Going long EM equity or EM currency volatility offers a good risk-reward profile (Chart 13). Volatility will likely rise in the coming months in both scenarios: either risk assets continue rallying or they sell off. For global equity and credit portfolios, we continue recommending a neutral allocation to EM. The long-term US dollar outlook is negative, but it is oversold and odds of a near-term rebound are still high. Our currency strategy remains to short a basket of EM currencies versus an equal-weighted average of the euro, CHF and JPY. This basket of EM currencies includes the BRL, CLP, ZAR, KRW and TRY. We continue receiving 10-year swap rates in Mexico, Colombia, Russia, China, India, Indonesia and Korea. Arthur Budaghyan Chief Emerging Markets Strategist arthurb@bcaresearch.com Footnotes 1 Special Purpose Acquisition Companies (SPAC), also known as “blank check companies”, are organizations with no commercial operations that raise capital through an IPO, which is then deployed to purchase an existing company. This process is done to bypass the lengthy process of launching a traditional IPO for a young company. Equities Recommendations Currencies, Credit And Fixed-Income Recommendations
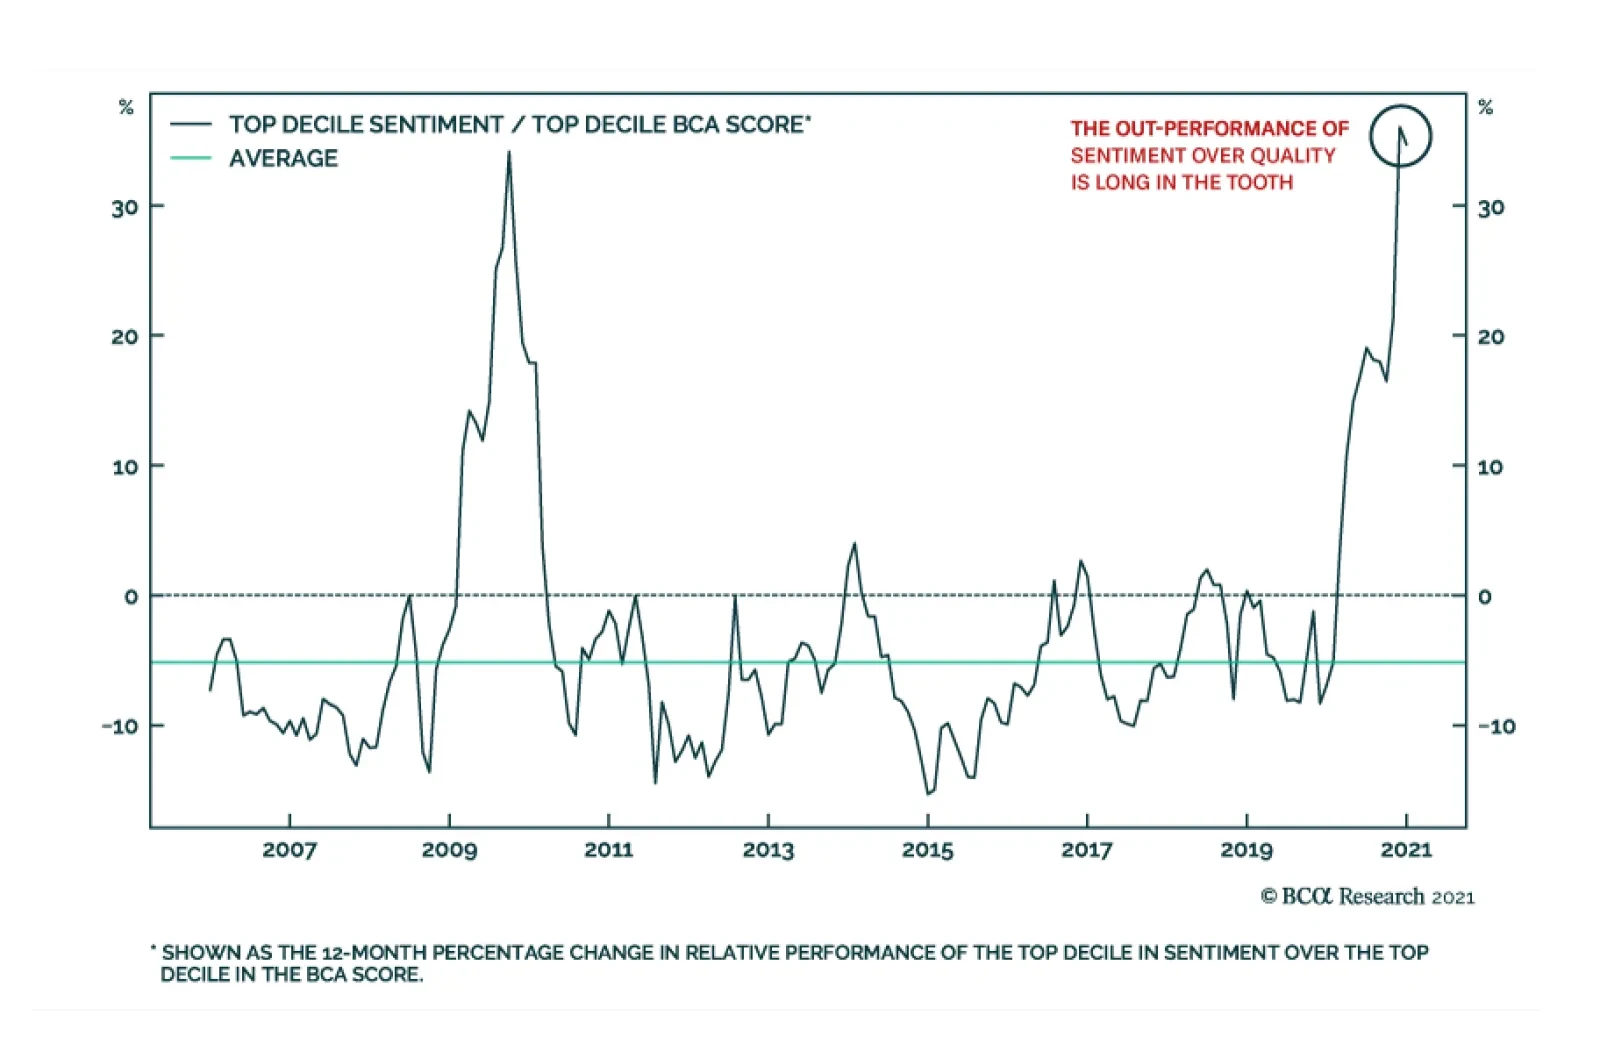
We can use the BCA Research Equity Analyzer (EA) to evaluate the role of sentiment in the current frenzy absorbing certain corners of the market. Today, sentiment is the best performing factor in the model and has generated an outperformance of 36% on an…
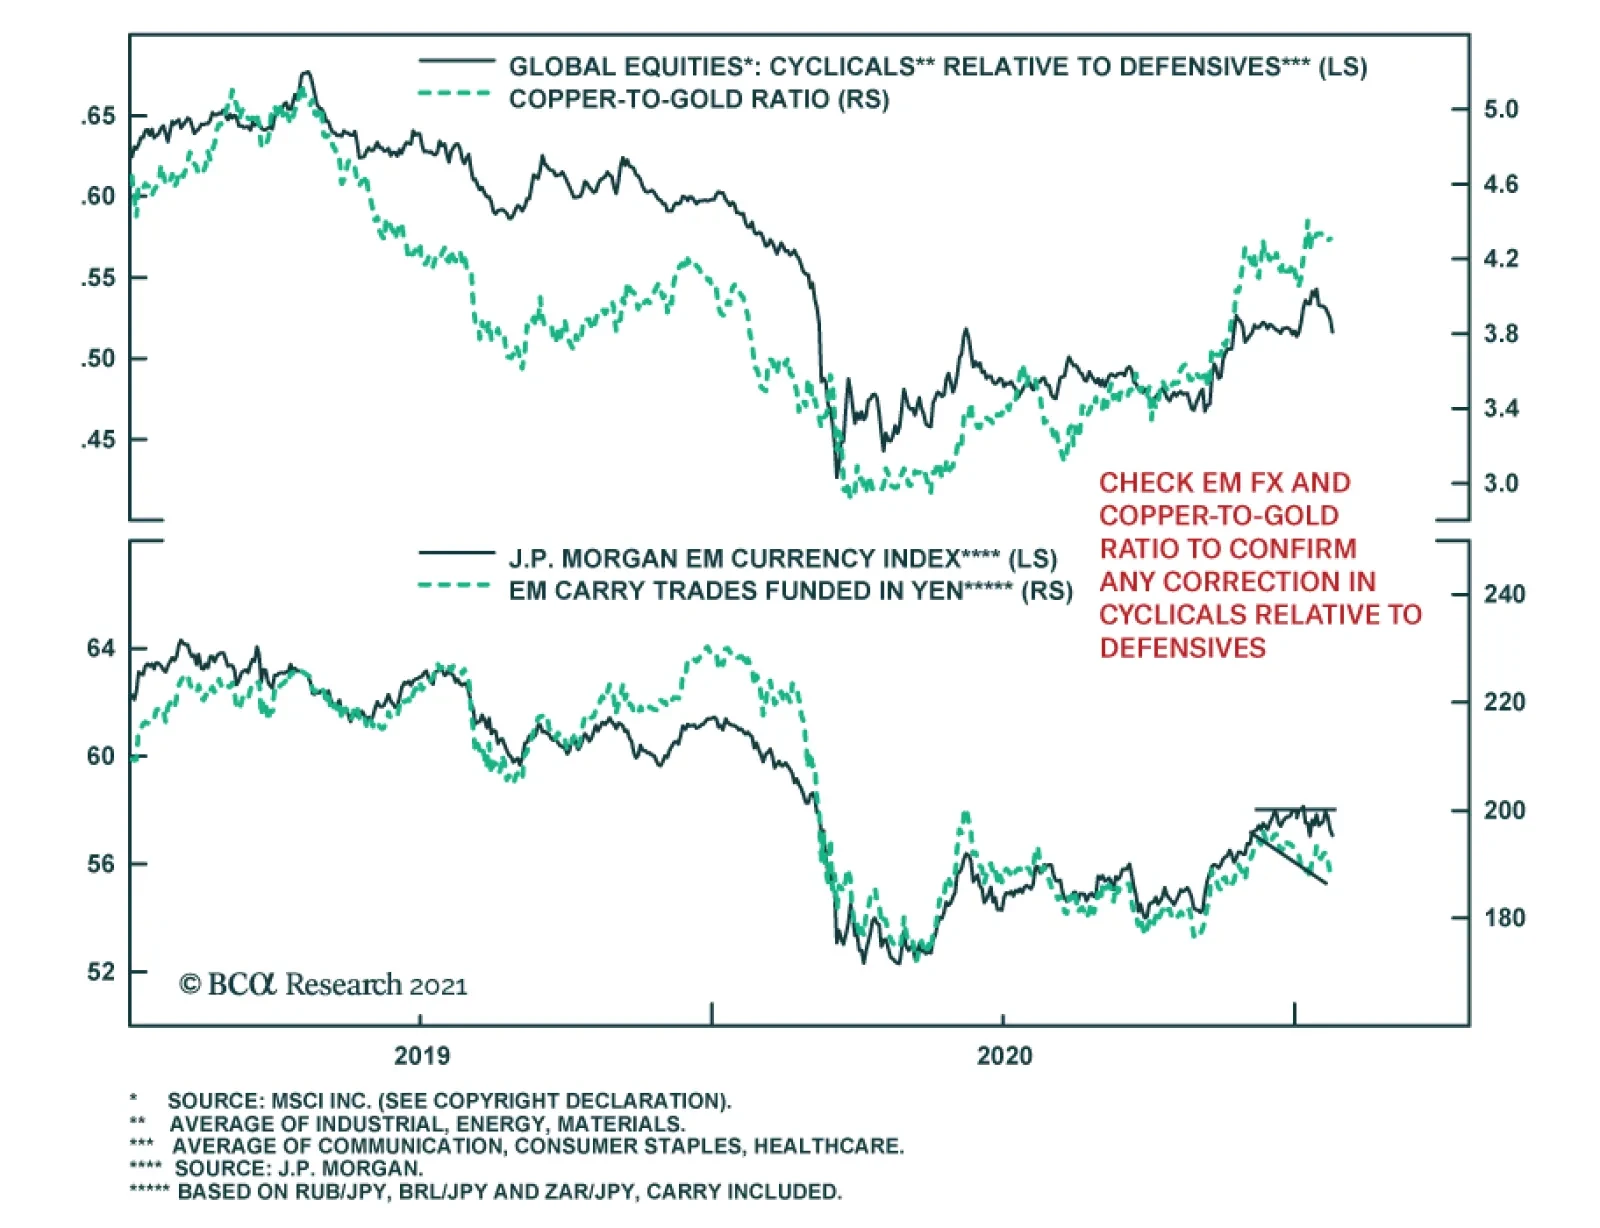
Cyclical equities have recently underperformed defensive ones, a development we expected. However, it is too early to determine whether this move represents anything more than noise. To make this judgment, we must evaluate confirming signals. The first is…
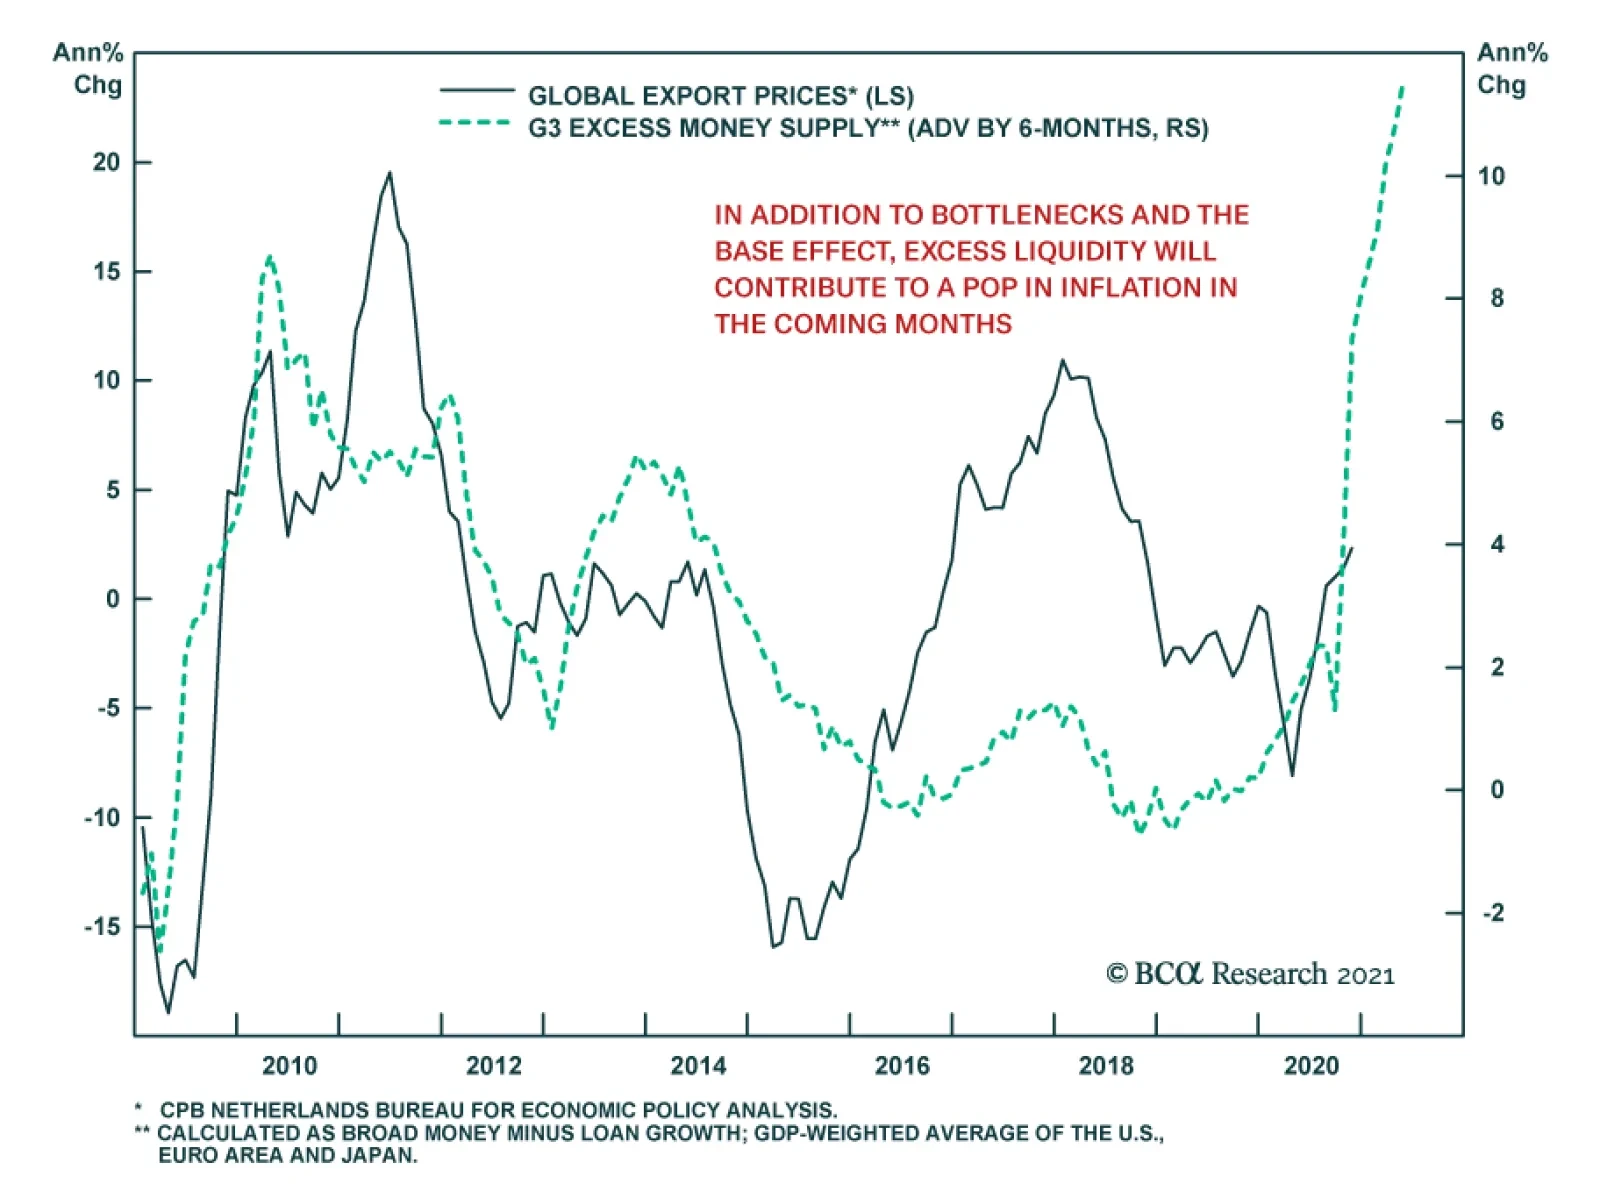
Goods prices are likely to remain buoyant and further outpace services inflation for the bulk of 2021, contributing to a pop in inflation in the first half of the year. This will create some volatility in markets willing to test the Fed’s determination.…
With monetary policy maxed out at major central banks, fiscal policy (which has already eclipsed its contribution in past crises) is due to assume the primary role in providing a reflationary bridge until the pandemic subsides later this year. However, the…
Incoming data and high-frequency indicators point to a soft patch in the global recovery amid the current surge in the pandemic. However, we expect the current softness to mark a bottom in the economic and health crisis as vaccination campaigns are being…
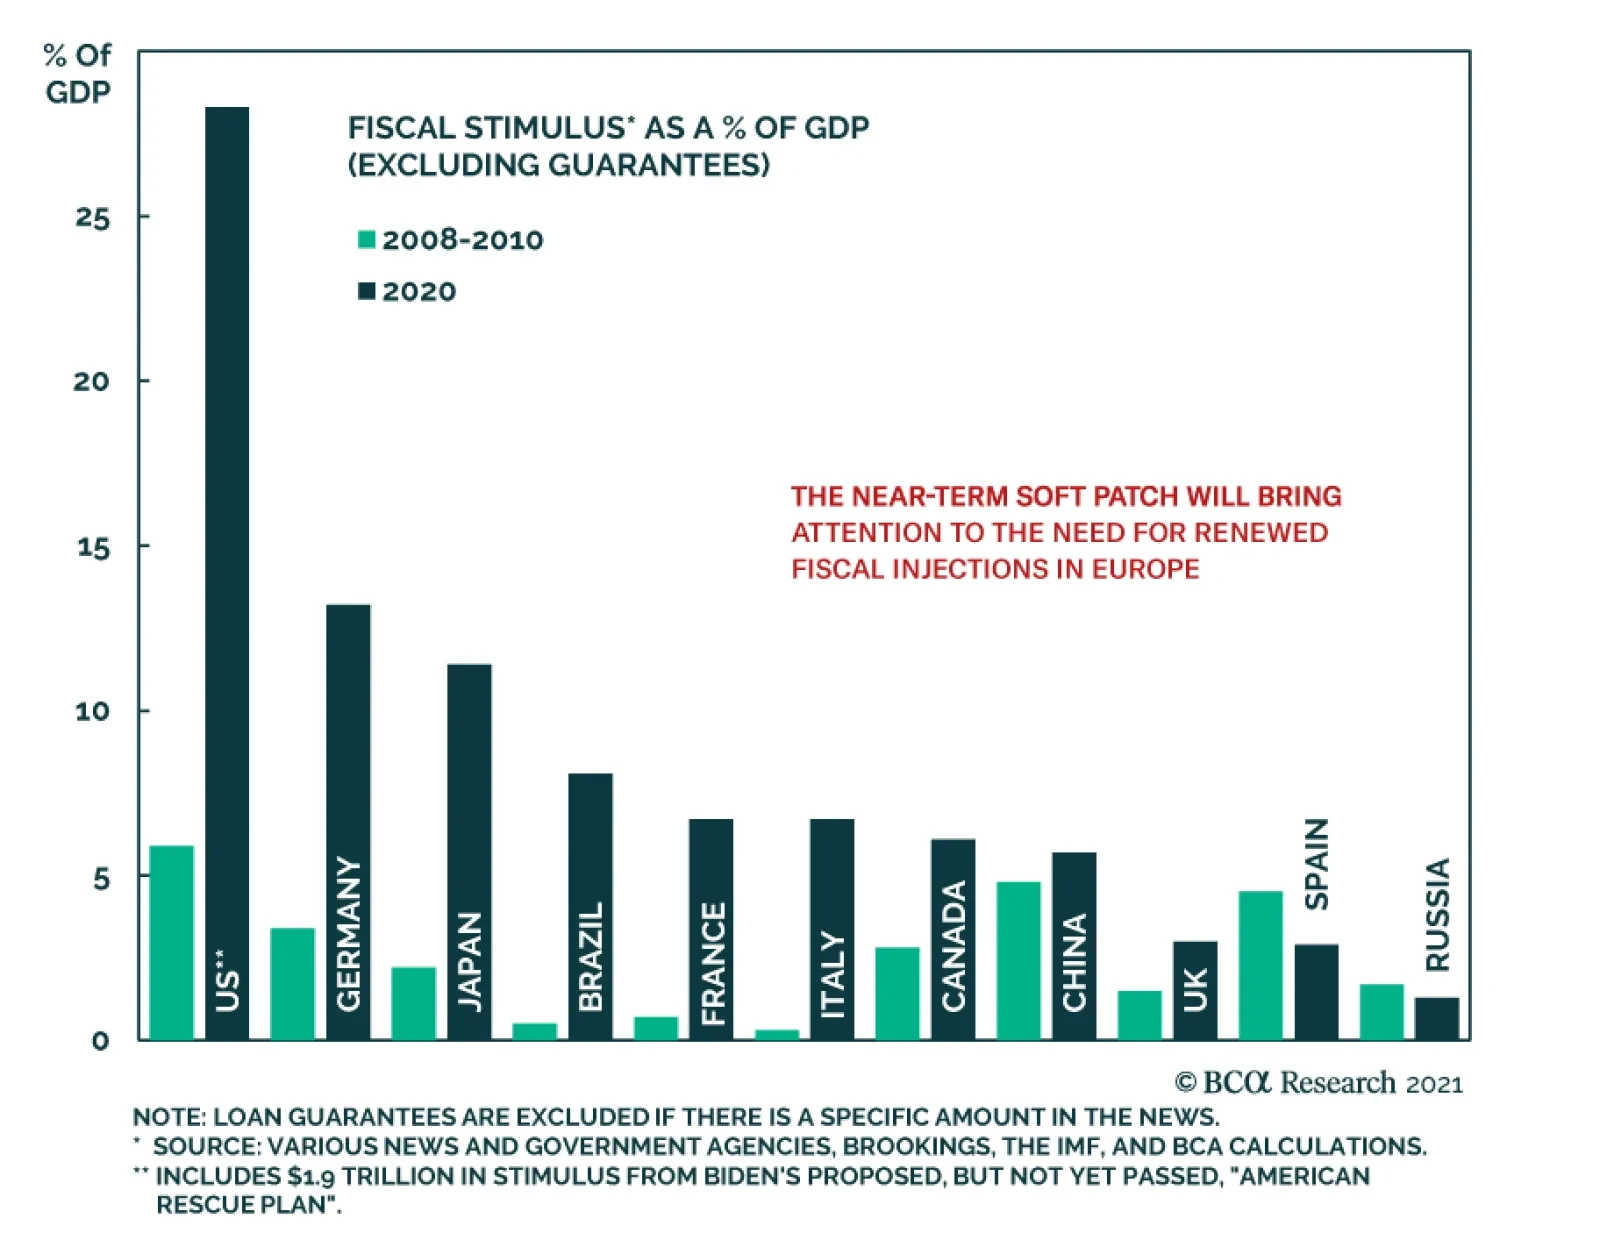
Highlights Our baseline view is that inflation will increase only modestly over the next few years before accelerating in the middle of the decade. Nevertheless, the risks are skewed towards an earlier and sharper increase in inflation in the US and, to a lesser extent, in the other major economies. The first round of stimulus left US households with $1.5 trillion in excess savings, equivalent to 10% of annual consumption. The stimulus deal Congress reached in December and President Biden’s proposed package would inject an additional $300 billion per month into the economy through the end of September. According to the Congressional Budget Office, the monthly output gap is $80 billion. The true number may be even lower since the CBO’s estimate does not take into account the temporary disruption to the supply side of the economy from the pandemic or the potential disincentive to work from unusually generous unemployment benefits. In and of itself, inflation is not necessarily bad for stocks. Inflation is only bad for stocks when it triggers monetary policy tightening. The bar for the Fed to raise rates is still very high, which suggests that equities will weather a temporary burst of inflation. Nevertheless, investors should hedge against the risk that inflation will surprise on the upside. This calls for reducing duration in fixed-income portfolios to below-benchmark levels, favoring inflation-protected securities over nominal bonds, and owning more real assets such as gold and farmland. Investors should also favor value stocks over growth stocks. Commodity producers are overrepresented in value indices, while banks will benefit from steeper yield curves. The Austerians Give Up In his 2011 State Of The Union Address, President Obama declared that “Families across the country are tightening their belts and making tough decisions. The federal government should do the same.” And so the government did. According to calculations by the Brookings Institution, tighter fiscal policy subtracted about 1.2 percentage points from annual GDP growth between 2011 and 2014 (Chart 1). Chart 1US Fiscal Easing Gave Way To Fiscal Drag Soon After The Great Recession
Stagflation In A Few Months?
Stagflation In A Few Months?
The US was not alone. As Chart 2 illustrates, most advanced economies tightened fiscal policy not long after the Great Recession officially ended. In the case of countries such as Italy and Spain, the tightening came in response to market duress. In other cases such as those involving Germany and the UK, the tightening occurred against the backdrop of fairly low borrowing costs. Chart 2Fiscal Austerity Was The Favored Post-GFC Policy Prescription
Stagflation In A Few Months?
Stagflation In A Few Months?
After the pandemic struck, most governments were quick to loosen fiscal policy again (Chart 3). However, unlike ten years ago, calls for reducing the flow of red ink have been a lot more muted this time around. Chart 3Fiscal Policy In 2020: Governments Eased Significantly In Response To The Unfolding Crisis
Stagflation In A Few Months?
Stagflation In A Few Months?
Back in 2010, the OECD – the go-to source for conventional thinking on all economic matters – opined that “monetary policy must be normalized” and that “exit from exceptional fiscal support must start now, or by 2011 at the latest.” Today, the OECD admits that it made a “mistake” in pushing for austerity so soon after the recession ended. “The first lesson is to make sure governments are not tightening in the one to two years following the trough of GDP” explained Laurence Boone, the OECD’s current chief economist, to the FT earlier this month. The OECD’s change of heart partly reflects political reality – assistance for businesses and workers who lost income due to lockdowns is more palatable than bailouts for banks and for homeowners who took on more debt than they could afford. Yet, there is an important economic dimension to the policy pivot as well. The huge spike in bond yields that many pundits predicted a decade ago never materialized. Despite soaring debt levels, real bond yields in the US and most other economies are near record lows (Chart 4). Even the Italian 10-year yield stands at a mere 0.68% now that the ECB has effectively promised to backstop European governments. Chart 4Governments Enjoy Low Borrowing Costs
Governments Enjoy Low Borrowing Costs
Governments Enjoy Low Borrowing Costs
The Bondholder Who Cried Wolf Chart 5Generous Government Transfers Boosted Household Savings
Generous Government Transfers Boosted Household Savings
Generous Government Transfers Boosted Household Savings
After many false alarms, could the inflationistas get the last laugh in 2021? The idea is not entirely far-fetched. Consider the case of the US. Chart 5 shows that US households are sitting on $1.5 trillion of excess savings – equivalent to 10% of annual consumption. The amount of dry powder US households have at their disposal will only get larger. Taken together, the stimulus deal Congress reached in December and President Biden’s proposed fiscal package would inject an average of $300 billion per month into the economy through the end of September. Republicans and centrist Democrats in the Senate may force Biden to winnow down his stimulus plans to something closer to $1 trillion. Nevertheless, this still would provide about $200 billion in incremental monthly support. Official estimates made by the Congressional Budget Office last summer imply that the monthly output gap – the difference between what the economy is capable of producing and what it actually is producing – is currently only $80 billion. In fact, the true output gap may be even lower than this. First, GDP has recovered more rapidly than the CBO had projected. Second, official estimates of the output gap do not control for the fact that part of the economy’s productive capacity – certain retail establishments, hotels, airlines, etc. – has been rendered either fully or partly inoperative due to the pandemic. Third, official estimates also do not account for the fact that generous jobless benefits may have made some workers less eager to find work, thus temporarily raising the natural rate of unemployment. Inflation: Movin’ On Up If the demand for goods and services exceeds supply, prices are likely to go up. How much will they rise? In the near term, inflation is certain to increase from very low levels, if only due to base effects. As my colleague Ryan Swift has noted, both core PCE and core CPI inflation will soon spike above 2% on an annualized basis even if consumer prices rise by a meager 0.15% per month, as the deflationary March and April 2020 data points fall out of the rolling 12-month average (Chart 6). Looking beyond the next few months, the trajectory for inflation will depend on the degree to which the economy overheats. In some categories, there is already evidence of excess demand. US core goods inflation is running at 1.6%, the highest level since 2012. The ISM manufacturing Prices Paid index points to further upside for goods inflation. Soaring commodity prices tell a similar tale (Chart 7). Chart 6Base Effects Will Push Inflation Higher
Base Effects Will Push Inflation Higher
Base Effects Will Push Inflation Higher
Chart 7Further Upside For Goods Inflation And Commodity Prices
Further Upside For Goods Inflation And Commodity Prices
Further Upside For Goods Inflation And Commodity Prices
While services inflation has been more downbeat, that could change as the labor market tightens (Chart 8). Housing inflation is also set to bottom. The National Multifamily Housing Council’s Apartment Market Tightness Index remains in contractionary territory. However, the closely-linked Sales Volume Index recently jumped to the highest level in nine years (Chart 9). Sales volume led the Market Tightness Index coming out of the last recession. If that happens again, shelter inflation should creep up. Chart 8A Pickup In Services Inflation Is Awaiting A Tighter Labor Market
A Pickup In Services Inflation Is Awaiting A Tighter Labor Market
A Pickup In Services Inflation Is Awaiting A Tighter Labor Market
Chart 9Shelter Inflation Could Bottom Soon
Shelter Inflation Could Bottom Soon
Shelter Inflation Could Bottom Soon
A Self-Fulfilling Prophecy? Like most macroeconomic phenomena, inflation is subject to feedback loops. If households expect prices to increase initially but then fall back down once the stimulus has lapsed, they may defer some of their spending until prices return to normal. This could prevent prices from rising in the first place. In contrast, if households expect prices to rise and then keep rising, they may try to expedite their purchases. This would supercharge spending. One can see that there is a self-fulfilling process at work. If households expect prices to remain broadly stable, then they will remain broadly stable. If households expect prices to rise a lot, then they will rise a lot. Imagine last year’s Great Toilet Paper Shortage but on an economy-wide scale. A similar self-fulfilling process works at the firm level. If firms expect prices to rise only briefly, they will try to run down their inventories as quickly as possible to take advantage of temporarily high profit margins. The additional supply will limit any increase in prices. In contrast, if firms expect selling prices to keep rising, they may hoard inventory to take advantage of future higher prices. Likewise, firms may be reluctant to raise wages in response to a temporary overheating of the economy for fear that this would lock in a higher cost structure. In contrast, firms would be more willing to raise wages if they thought that prices would keep rising. Hence, the expectation of rising inflation could trigger a price-wage spiral. Lifting The Anchor The inflationary scenario described above could play out if long-term inflation expectations become unmoored. Central banks have invested a lot of effort in trying to anchor inflation expectations at around 2%. To the extent that they have fallen short of their goal, it is because prices have risen less than desired (Chart 10). Chart 10Central Banks Have Missed Their Inflation Targets
Stagflation In A Few Months?
Stagflation In A Few Months?
To remedy the shortfall in inflation, the Fed has pledged to allow inflation to rise above 2% for a few years, with the aim of bringing the price level back to its long-term target trend. The risk is that such an inflation overshoot happens sooner and is more pronounced than policymakers desire. Christina Romer, the former chair of the Council of Economic Advisers in the Obama administration, famously wrote a paper entitled “It Takes A Regime Shift.” Using the example of Roosevelt’s decision to take the US off the gold standard in 1933, she argued that major monetary policy decisions could permanently jolt inflation expectations. It is too early to say whether the Fed’s new inflation-targeting framework will go down in history as a “regime shift.” What one can say with more confidence is that the rollout of this framework is coming at a tumultuous time. Policymakers and business leaders routinely talk about the “The Great Reset” – the notion that the pandemic provides a once-in-a-lifetime opportunity to shift policy in a new, rather curious, direction. Central bankers better hope that inflation expectations are not reset too much. Investment Implications Our baseline view is that inflation will increase only modestly over the next few years before accelerating in the middle of the decade. Nevertheless, as highlighted in this week’s report, the risks are skewed towards an earlier and sharper increase in inflation in the US and, to a lesser extent, in the other major economies. The spectre of higher inflation is unsettling to many investors. However, in and of itself, inflation is not necessarily bad for stocks. Inflation is only bad for stocks when it triggers monetary policy tightening. In the absence of rate hikes, rising inflation would push real rates lower. This would be quite good for stocks, as the experience of the past nine months demonstrates (Chart 11). As noted above, the bar for the Fed to withdraw monetary support is fairly high. This suggests that rising inflation is unlikely to derail the bull market in stocks. Of course, if both actual inflation and inflation expectations were to jump too much, the Fed would have to intervene. With that in mind, investors should position their portfolios to withstand rising inflation. This calls for reducing duration in fixed-income portfolios to below-benchmark levels, favoring inflation-protected securities over nominal bonds, and owning more real assets such as gold and farmland. Chart 11Lower Real Yields Have Lifted Equity Prices
Lower Real Yields Have Lifted Equity Prices
Lower Real Yields Have Lifted Equity Prices
Chart 12Bank Stocks Tend To Outperform When Inflation Expectations And Bond Yields Are Rising
Bank Stocks Tend To Outperform When Inflation Expectations And Bond Yields Are Rising
Bank Stocks Tend To Outperform When Inflation Expectations And Bond Yields Are Rising
Investors should also favor value stocks over growth stocks. Commodity producers are overrepresented in value indices, and would benefit from rising inflation. Banks are also overrepresented in value indices. Chart 12 shows that banks tend to outperform when inflation expectations and long-term bond yields are rising. Peter Berezin Chief Global Strategist peterb@bcaresearch.com Global Investment Strategy View Matrix
Stagflation In A Few Months?
Stagflation In A Few Months?
Special Trade Recommendations This table provides trade recommendations that may not be adequately represented in the matrix on the preceding page.
Stagflation In A Few Months?
Stagflation In A Few Months?
Current MacroQuant Model Scores
Stagflation In A Few Months?
Stagflation In A Few Months?
According to BCA Research’s European Investment Strategy service, the longevity of the bull market depends on four things: sales, wages, taxes, and the bond yield. Until yields rise significantly, long-term investors should stay in equities. Sales tend to…
The forthcoming third round of enormous US fiscal stimulus will likely mark a structural regime shift in global financial markets. Over the past 25 years, the chief concern of US and, hence, global financial markets, has been economic growth. Share prices typically fluctuated with growth expectations. As a result, the S&P 500 and US bond yields have been positively correlated, as shown in Chart 1 of week. Chart 1AUS Share Prices And Treasury Yields Will Soon Become Negatively Correlated
US Share Prices And Treasury Yields Will Soon Become Negatively Correlated
US Share Prices And Treasury Yields Will Soon Become Negatively Correlated
Going forward, odds are that the correlation between US equity prices and US bond yields will turn negative and stay there for several years, as was the case prior to 1997. In brief, we are moving from a deflationary to an inflationary backdrop. Share prices will likely start negatively reacting to rising inflation and/or inflation expectations and vice versa. We will discuss these issues in depth in forthcoming reports. A rise in EM corporate bond yields is the key threat to EM share prices, as shown in the charts on page 3. EM corporate and sovereign US bond spreads are so tight that they are unlikely to compress further to offset the rise in US Treasury yields. As a result, EM dollar-denominated corporate and sovereign bond yields will also rise as US Treasurys sell off. Chart 2 of week shows that the distinct breakout in a high-beta American industrial stock price – Kennametal – points to higher US government bond yields. Chart 1BA Super-Strong US Industrial Cycle Points To Higher US Treasury Yields
A Super-Strong US Industrial Cycle Points To Higher US Treasury Yields
A Super-Strong US Industrial Cycle Points To Higher US Treasury Yields
The timing of such a shakeout in risk assets is uncertain but it will likely be sharp and will happen in the first half of this year. The reason is that positioning and sentiment on global risk assets in general and EM risk assets in particular are very elevated as we illustrate in this January issue of Charts That Matter. Our major investment themes remain: US equities will continue underperforming global stocks. Rising bond yields and inflation will hurt the expensive US equity market more than overseas ones. Europe and Japan will outperform and EM will likely be a market performer. For now, maintain a neutral allocation to EM in a global equity portfolio. The US dollar is in a structural bear market but it is presently oversold and will bounce sharply sometime in H1 this year. Continue shorting select EM currencies versus an equal-weighted basket of the euro, CHF and JPY. EM currencies will suffer more than DM currencies during a potential US dollar snapback. A setback in EM fixed-income markets should be used as a buying opportunity. Inflation is much less of a problem in EM than in the US. A long-term bear market in the greenback favors EM fixed-income markets, both dollar-denominated and local currency ones. Arthur Budaghyan Chief Emerging Markets Strategist arthurb@bcaresearch.com Rising EM Corporate Bond Yields Is The Key Threat To EM Share Prices A continuous rise in corporate and sovereign US dollar bond yields (shown inverted) has historically been a negative signal for EM share prices. With no downside to global growth due to US fiscal policy, both US and EM bond yields are crucial variables to monitor. Chart 1Rising EM Corporate Bond Yields Will Be The Key Threat To EM Share Prices
Rising EM Corporate Bond Yields Is The Key Threat To EM Share Prices
Rising EM Corporate Bond Yields Is The Key Threat To EM Share Prices
Chart 2Rising EM Corporate Bond Yields Will Be The Key Threat To EM Share Prices
Rising EM Corporate Bond Yields Is The Key Threat To EM Share Prices
Rising EM Corporate Bond Yields Is The Key Threat To EM Share Prices
EM Stocks Will Outperform The S&P 500 Amid Rising Inflation Worries Rising inflation expectations will help EM stocks to outperform the S&P 500. The latter is more expensive and, thereby, more sensitive to rising interest rates. Chart 3EM Stocks Will Outperform The S&P 500 Amid Rising Inflation Worries
EM Stocks Will Outperform The S&P 500 Amid Rising Inflation Worries
EM Stocks Will Outperform The S&P 500 Amid Rising Inflation Worries
Chart 4EM Stocks Will Outperform The S&P 500 Amid Rising Inflation Worries
EM Stocks Will Outperform The S&P 500 Amid Rising Inflation Worries
EM Stocks Will Outperform The S&P 500 Amid Rising Inflation Worries
US Equities Are Overextended; EM Is Set To Outperform The S&P 500 In The Coming Years In real (inflation-adjusted) terms, US stocks in general and US tech stocks in particular are over-extended relative to their long-term trends. Relative to US equities, but not absolute term, EM stocks are cheap. Chart 5US Equities Are Overextended; EM Is Set To Outperform The S&P 500 In The Coming Years
US Equities Are Overextended; EM Is Set To Outperform The S&P 500 In The Coming Years
US Equities Are Overextended; EM Is Set To Outperform The S&P 500 In The Coming Years
Chart 6US Equities Are Overextended; EM Is Set To Outperform The S&P 500 In The Coming Years
US Equities Are Overextended; EM Is Set To Outperform The S&P 500 In The Coming Years
US Equities Are Overextended; EM Is Set To Outperform The S&P 500 In The Coming Years
Chart 7US Equities Are Overextended; EM Is Set To Outperform The S&P 500 In The Coming Years
US Equities Are Overextended; EM Is Set To Outperform The S&P 500 In The Coming Years
US Equities Are Overextended; EM Is Set To Outperform The S&P 500 In The Coming Years
Chart 8US Equities Are Overextended; EM Is Set To Outperform The S&P 500 In The Coming Years
US Equities Are Overextended; EM Is Set To Outperform The S&P 500 In The Coming Years
US Equities Are Overextended; EM Is Set To Outperform The S&P 500 In The Coming Years
Strategy For An Era Of Inflation Global growth stocks will underperform versus value ones. US equities have broken down relative to the global equity index. US bond yields have more upside. A rise in US corporate bond yields is the main danger to American stocks. Chart 9Strategy For An Era Of Inflation
Strategy For An Era Of Inflation
Strategy For An Era Of Inflation
Chart 10Strategy For An Era Of Inflation
Strategy For An Era Of Inflation
Strategy For An Era Of Inflation
Chart 11Strategy For An Era Of Inflation
Strategy For An Era Of Inflation
Strategy For An Era Of Inflation
Chart 12Strategy For An Era Of Inflation
Strategy For An Era Of Inflation
Strategy For An Era Of Inflation
Risk Measures That EM Investors Should Monitor US TIPS yields are very oversold. Any spike will likely trigger a rebound in the US dollar and a correction in EM local currency bonds. Besides, off-shore Chinese property company bond prices have rolled over. This means stress is accumulating in China’s property market and construction activity will slow in H2 this year. Finally, EM HY corporates might begin underperforming EM IG – a sign of poor risk backdrop. Chart 13Risk Measures That EM Investors Should Monitor
Risk Measures That EM Investors Should Monitor
Risk Measures That EM Investors Should Monitor
Chart 14Risk Measures That EM Investors Should Monitor
Risk Measures That EM Investors Should Monitor
Risk Measures That EM Investors Should Monitor
Chart 15Risk Measures That EM Investors Should Monitor
Risk Measures That EM Investors Should Monitor
Risk Measures That EM Investors Should Monitor
The Case For US Inflation US personal disposable income has surged due to fiscal transfers. This is ultimately Modern Monetary Theory (MMT) in action. US consumer spending on goods has been booming, lifting global trade and manufacturing. The vaccination and a reopening of the economy will increase the velocity (turnover) of money supply and lead to higher inflation in H2 2021. Chart 16The Case For US Inflation
The Case For US Inflation
The Case For US Inflation
Chart 17The Case For US Inflation
The Case For US Inflation
The Case For US Inflation
Chart 18The Case For US Inflation
The Case For US Inflation
The Case For US Inflation
Global Trade: The US and China Have Been Epicenters Of Spending China's and the US’ real trade balances (export volume divided by import volume) have been falling, meaning that both economies have been locomotives of global demand. China’s stimulus is tapering off but the US’ fiscal largess continues. Chart 19Global Trade: The US and China Have Been Epicenters Of Spending
Global Trade: The US and China Have Been Epicenters Of Spending
Global Trade: The US and China Have Been Epicenters Of Spending
Chart 20Global Trade: The US and China Have Been Epicenters Of Spending
Global Trade: The US and China Have Been Epicenters Of Spending
Global Trade: The US and China Have Been Epicenters Of Spending
Chart 21Global Trade: The US and China Have Been Epicenters Of Spending
Global Trade: The US and China Have Been Epicenters Of Spending
Global Trade: The US and China Have Been Epicenters Of Spending
US Consumers Could Face High Goods Prices Tradable goods prices are rising in US dollar terms. If export nations’ currencies continue appreciating, US imports prices in US dollar terms will rise much more. This will reinforce inflationary pressures in the US. Chart 22US Consumers Could Face High Goods Prices
US Consumers Could Face High Goods Prices
US Consumers Could Face High Goods Prices
Chart 23US Consumers Could Face High Goods Prices
US Consumers Could Face High Goods Prices
US Consumers Could Face High Goods Prices
Chart 24US Consumers Could Face High Goods Prices
US Consumers Could Face High Goods Prices
US Consumers Could Face High Goods Prices
Chart 25US Consumers Could Face High Goods Prices
US Consumers Could Face High Goods Prices
US Consumers Could Face High Goods Prices
No Inflation In China In China, supply has been overwhelming demand and deflationary tendencies remain broad-based. Policymakers have become concerned with RMB appreciation, or at least the pace of its strengthening. Authorities have allowed more portfolio capital to leave China. The latter has produced the recent surge in HK-traded Chinese stocks (please refer to page 16). Chart 26No Inflation In China
No Inflation In China
No Inflation In China
Chart 27No Inflation In China
No Inflation In China
No Inflation In China
Chart 28No Inflation In China
No Inflation In China
No Inflation In China
Chart 29No Inflation In China
No Inflation In China
No Inflation In China
The Chinese Economy: Strong In H1; Slowing In H2 China’s credit and fiscal stimulus peaked in Q4 2020. This and regulatory tightening for banks and ongoing non-banks as well as the property market restrictions will produce a meaningful slowdown in H2 this year. Chart 30The Chinese Economy: Strong In H1; Slowing In H2
The Chinese Economy: Strong In H1; Slowing In H2
The Chinese Economy: Strong In H1; Slowing In H2
Chart 31The Chinese Economy: Strong In H1; Slowing In H2
The Chinese Economy: Strong In H1; Slowing In H2
The Chinese Economy: Strong In H1; Slowing In H2
Chart 32The Chinese Economy: Strong In H1; Slowing In H2
The Chinese Economy: Strong In H1; Slowing In H2
The Chinese Economy: Strong In H1; Slowing In H2
Chart 33The Chinese Economy: Strong In H1; Slowing In H2
The Chinese Economy: Strong In H1; Slowing In H2
The Chinese Economy: Strong In H1; Slowing In H2
Commodities Inventories In China Are Elevated Slowdowns in China’s construction activity and infrastructure spending amid excessive inventories of commodities pose a downside risk in commodities prices this year. Chart 34Commodities Inventories In China Are Elevated
Commodities Inventories In China Are Elevated
Commodities Inventories In China Are Elevated
Chart 36Commodities Inventories In China Are Elevated
Commodities Inventories In China Are Elevated
Commodities Inventories In China Are Elevated
Chart 35Commodities Inventories In China Are Elevated
Commodities Inventories In China Are Elevated
Commodities Inventories In China Are Elevated
A Mania In Full Force Asia’s growth stocks have been rising exponentially. Such parabolic price moves can last for a while but these stocks will experience a major shakeout this year. The trigger will be rising global bond yields as discussed on pages 1 and 2. Chart 37A Mania In Full Force
A Mania In Full Force
A Mania In Full Force
Chart 38A Mania In Full Force
A Mania In Full Force
A Mania In Full Force
Chart 39A Mania In Full Force
A Mania In Full Force
A Mania In Full Force
Chart 40A Mania In Full Force
A Mania In Full Force
A Mania In Full Force
Local Retail Investors Have Been Buying EM Stocks Aggressively These charts show that a retail mania is taking place not only in the US but has become a common phenomenon in many EM stock markets. Amid retail-driven rallies, fundamentals do not matter and momentum is the key variable to monitor. Chart 41Local Retail Investors Have Been Buying EM Stocks Aggressively
Local Retail Investors Have Been Buying EM Stocks Aggressively
Local Retail Investors Have Been Buying EM Stocks Aggressively
Chart 42Local Retail Investors Have Been Buying EM Stocks Aggressively
Local Retail Investors Have Been Buying EM Stocks Aggressively
Local Retail Investors Have Been Buying EM Stocks Aggressively
Mainland Investors Buying HK-Listed Chinese Stocks To halt yuan appreciation, authorities have recently increased quotas for mainland investors to buy HK-listed equities. Consequently, capital has rushed out of the mainland and Chinese stocks listed in HK have surged. The duration and magnitude of any flow-driven rally is impossible to handicap with any certainty. Chart 43Mainland Investors Buying HK-Listed Chinese Stocks
Mainland Investors Buying HK-Listed Chinese Stocks
Mainland Investors Buying HK-Listed Chinese Stocks
Chart 44Mainland Investors Buying HK-Listed Chinese Stocks
Mainland Investors Buying HK-Listed Chinese Stocks
Mainland Investors Buying HK-Listed Chinese Stocks
Chart 45Mainland Investors Buying HK-Listed Chinese Stocks
Mainland Investors Buying HK-Listed Chinese Stocks
Mainland Investors Buying HK-Listed Chinese Stocks
Global Investors Are Super Bullish These charts illustrate that based on the Sentix1 survey European investors are record bullish on EM equities and European growth. Chart 46Global Investors Are Super Bullish
Global Investors Are Super Bullish
Global Investors Are Super Bullish
Chart 47Global Investors Are Super Bullish
Global Investors Are Super Bullish
Global Investors Are Super Bullish
Investor Sentiment And Positioning Are Very Elevated Investors are bullish on US stocks and copper (a proxy for global growth) and bearish on the US dollar. The ratio of US institutional and retail money market funds’ assets (cash on sidelines) relative to market value of stocks and all US dollar bonds has declined substantially. Chart 48Investor Sentiment And Positioning Are Very Elevated
Investor Sentiment And Positioning Are Very Elevated
Investor Sentiment And Positioning Are Very Elevated
Chart 49Investor Sentiment And Positioning Are Very Elevated
Investor Sentiment And Positioning Are Very Elevated
Investor Sentiment And Positioning Are Very Elevated
Chart 50Investor Sentiment And Positioning Are Very Elevated
Investor Sentiment And Positioning Are Very Elevated
Investor Sentiment And Positioning Are Very Elevated
Several Reflation Gauges Are Facing Resistance Global cyclical versus defensive stocks and several EM reflation plays are facing important technical resistances. Chart 51Several Reflation Gauges Are Facing Resistance
Several Reflation Gauges Are Facing Resistance
Several Reflation Gauges Are Facing Resistance
Chart 52Several Reflation Gauges Are Facing Resistance
Several Reflation Gauges Are Facing Resistance
Several Reflation Gauges Are Facing Resistance
Major Equity Indexes Are Attempting A Breakout The EM, global ex-US, global ex-TMT and euro area equity indexes are at their previous highs and are attempting a breakout. Momentum is on their side but positioning and sentiment are against a sustainable breakout. Chart 53Major Equity Indexes Are Attempting A Breakout
Major Equity Indexes Are Attempting A Breakout
Major Equity Indexes Are Attempting A Breakout
Chart 54Major Equity Indexes Are Attempting A Breakout
Major Equity Indexes Are Attempting A Breakout
Major Equity Indexes Are Attempting A Breakout
Chart 55Major Equity Indexes Are Attempting A Breakout
Major Equity Indexes Are Attempting A Breakout
Major Equity Indexes Are Attempting A Breakout
Chart 56Major Equity Indexes Are Attempting A Breakout
Major Equity Indexes Are Attempting A Breakout
Major Equity Indexes Are Attempting A Breakout
Outside Asian Growth Stocks, EM Equities Have Been Lagging Reflecting not-so-positive fundamentals, EM share prices, outside Asian growth stocks, have not yet entered a bull market. Chart 57Outside Asian Growth Stocks, EM Equities Have Been Lagging
Outside Asian Growth Stocks, EM Equities Have Been Lagging
Outside Asian Growth Stocks, EM Equities Have Been Lagging
Chart 58Outside Asian Growth Stocks, EM Equities Have Been Lagging
Outside Asian Growth Stocks, EM Equities Have Been Lagging
Outside Asian Growth Stocks, EM Equities Have Been Lagging
Chart 59Outside Asian Growth Stocks, EM Equities Have Been Lagging
Outside Asian Growth Stocks, EM Equities Have Been Lagging
Outside Asian Growth Stocks, EM Equities Have Been Lagging
Chart 60Outside Asian Growth Stocks, EM Equities Have Been Lagging
Outside Asian Growth Stocks, EM Equities Have Been Lagging
Outside Asian Growth Stocks, EM Equities Have Been Lagging
The Outlook For EM Stocks The cyclical EM profit outlook is bullish. However, much of this is already priced in. China’s peak stimulus is a risk to EM later this year. We recommend equity investors to favor EM versus the S&P 500 but not against European or Japanese stocks. Chart 61The Outlook For EM Stocks
The Outlook For EM Stocks
The Outlook For EM Stocks
Chart 62The Outlook For EM Stocks
The Outlook For EM Stocks
The Outlook For EM Stocks
New COVID Cases Are Rising In Several Areas Outside North Asia Many developing countries are facing challenges to contain the pandemic as well as to obtain and conduct broad-based vaccination. Chart 63New COVID Cases Are Rising In Several Areas Outside North Asia
New COVID Cases Are Rising In Several Areas Outside North Asia
New COVID Cases Are Rising In Several Areas Outside North Asia
Chart 64New COVID Cases Are Rising In Several Areas Outside North Asia
New COVID Cases Are Rising In Several Areas Outside North Asia
New COVID Cases Are Rising In Several Areas Outside North Asia
Footnotes 1 The Sentix surveys cover several thousand European institutional and individual investors. In the survey, investors are asked about their medium-term expectations. Source: SENTIX.