Global

Highlights The U.S. economy is slowing in a completely predictable manner. With inflationary pressures largely dormant, the Fed can afford to stay on hold for the next few FOMC meetings. Growth in the U.S. and the rest of the world should stabilize by mid-year. This will enable the Fed to resume raising rates in June. A bearish stance towards U.S. Treasurys is warranted over a 12-month horizon. As long as the Fed is hiking rates in response to above-trend GDP growth rather than accelerating inflation, risk assets will fare well. Investors should overweight global equities and spread product for now, but monitor inflation trends closely for signs of when to get out. Brexit fears are overdone. Stay long the pound versus the euro. We were stopped out of our short AUD/JPY trade for a gain of 10%. Feature A Predictable Slowdown Investors are misunderstanding the nature of the current slowdown in the United States and much of the world. Completely predictable slowdowns, such as this one, rarely morph into recessions. Real U.S. GDP rose at a blistering 3.8% average annualized pace in Q2 and Q3 of 2018. There is no way that sort of growth rate could have been sustained. Financial conditions also tightened sharply in Q4, which has inevitably weighed on growth. Given the stock market rout, it is actually surprising that the economy has not weakened more than it has. The New York Fed GDP Nowcast points to growth of 2.5% in Q4 of 2018 and 2.1% in Q1 of 2019. This is still above the Fed’s long-term estimate of potential GDP growth of 1.9%. Most of the slowdown has been concentrated in the manufacturing sector, but even there, the bloodletting may be ending. The latest Philadelphia Fed survey — arguably the most important of the regional Fed manufacturing reports — showed an uptick in activity, with the new orders component hitting the highest level since last July. Despite the tightening in financial conditions, bank lending to the business sector has accelerated over the past three months (Chart 1). The Conference Board’s Leading Credit Index remains in expansionary territory (Chart 2). While business capex intention surveys have come off their highs, they still point to robust spending plans over the next few quarters (Chart 3). Chart 1Credit Is Still Flowing To U.S. Businesses
Credit Is Still Flowing To U.S. Businesses
Credit Is Still Flowing To U.S. Businesses
Chart 2Little Sign Of A Looming Credit Crunch
Little Sign Of A Looming Credit Crunch
Little Sign Of A Looming Credit Crunch
Chart 3Capex Plans Still Solid
Capex Plans Still Solid
Capex Plans Still Solid
The labor market remains healthy, as evidenced by ongoing strong payroll growth and low initial unemployment claims. Faster wage growth is boosting consumer spending. Holiday sales rose by 5.1% from a year earlier according to the Mastercard SpendingPulse report, the fastest growth in six years. The Redbook same-store index tells a similar story (Chart 4). Chart 4Same-Store Sales Are Robust
Same-Store Sales Are Robust
Same-Store Sales Are Robust
The housing market struggled for much of 2018, but the recent stabilization in mortgage rates should help matters (Chart 5). Notably, mortgage applications for purchase have surged to their highest levels since 2010 (Chart 6). Homebuilder confidence improved in January, mirroring the rally in homebuilder shares (Chart 7). We are long homebuilders versus the S&P 500, a trade that is up 5.3% since we recommended it on November 1, 2018. Chart 5aThe U.S. Housing Sector Will Stabilize (I)
The U.S. Housing Sector Will Stabilize (I)
The U.S. Housing Sector Will Stabilize (I)
Chart 5BThe U.S. Housing Sector Will Stabilize (II)
The U.S. Housing Sector Will Stabilize (II)
The U.S. Housing Sector Will Stabilize (II)
Chart 6A Positive Signal For U.S. Housing
A Positive Signal For U.S. Housing
A Positive Signal For U.S. Housing
Chart 7U.S. Homebuilder Stocks Have Been Outperforming Recently
U.S. Homebuilder Stocks Have Been Outperforming Recently
U.S. Homebuilder Stocks Have Been Outperforming Recently
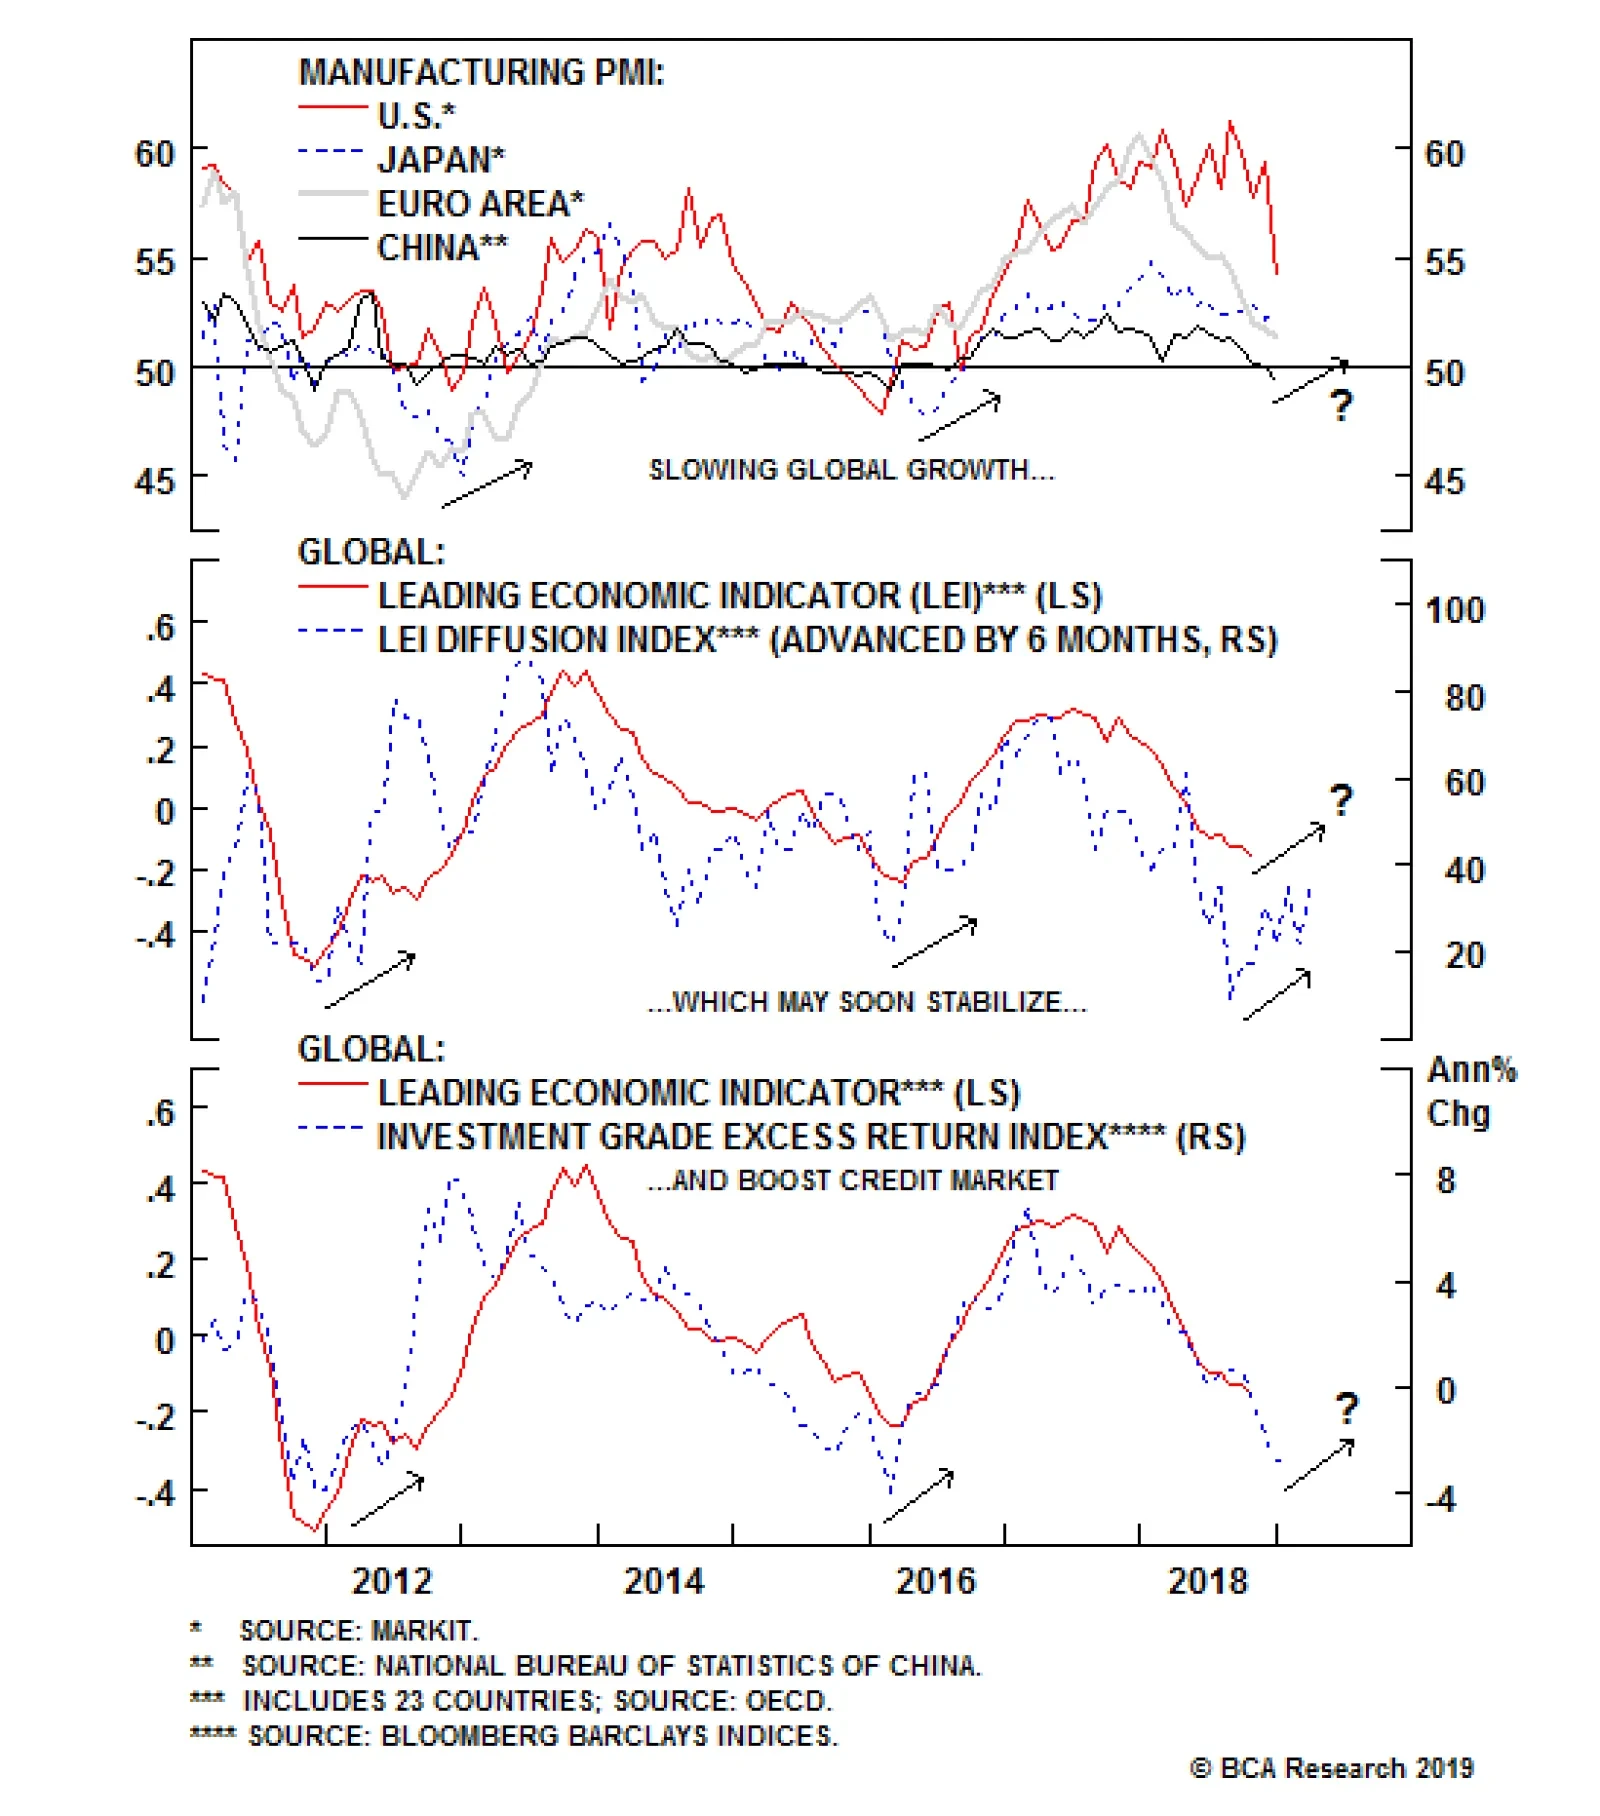
U.S. Government Shutdown: A Near-Term Hit To Growth The government shutdown poses a near-term risk to the U.S. economy. If it lasts until the end of March, it will shave about 1.7% off Q1 GDP based on White House estimates. While this represents a potentially significant hit to the economy, the effect is likely to be completely reversed once the shutdown ends. Moreover, the drag to growth from the shutdown pales in comparison to the overall stance of fiscal policy. According to the IMF, the cyclically-adjusted budget deficit is set to reach 5.7% of GDP this year, up from 3.2% of GDP in 2015. There is also a reasonable chance that any deal to end the shutdown will involve a commitment to increase spending beyond currently budgeted levels. This would increase the overall amount of fiscal stimulus the economy is receiving. Taking The Pulse Of Global Growth The slowdown in growth has been deeper and more protracted outside the United States. Nevertheless, rays of sunshine are emerging. Our global Leading Economic Indicator diffusion index, which measures the proportion of countries with rising LEIs compared to those with falling LEIs, has bottomed. The diffusion index leads the global LEI by a few months (Chart 8). Chart 8The Uptick In The LEI Diffusion Index Suggests Global Growth Could Stabilize
The Uptick In The LEI Diffusion Index Suggests Global Growth Could Stabilize
The Uptick In The LEI Diffusion Index Suggests Global Growth Could Stabilize
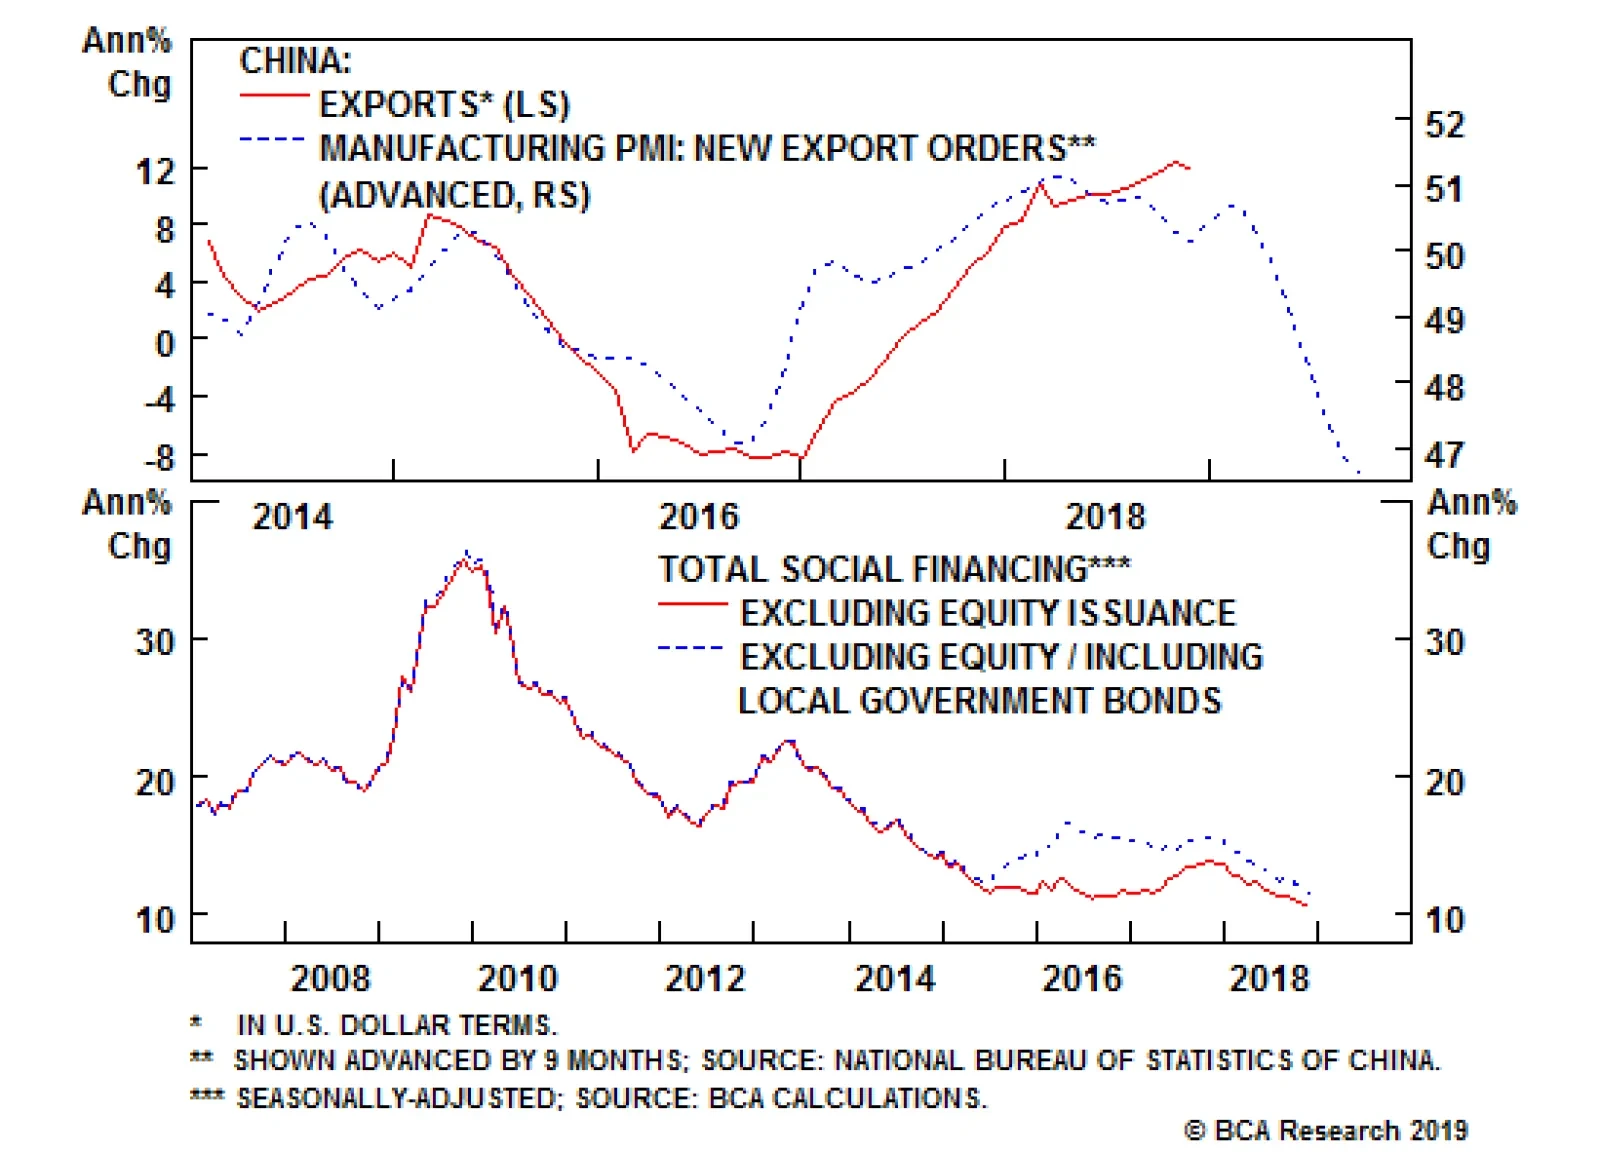
As is increasingly the case, the fate of the Chinese economy will be critical in determining when global growth begins to reaccelerate. The latest Chinese activity data has been disappointing, with this week’s downright awful export figures being the latest example. That said, credit growth may be starting to stabilize, as evidenced by stronger-than-expected loan growth for December. With credit growth now running only slightly above nominal GDP growth, the need for the authorities to maintain their deleveraging campaign has diminished. In an encouraging sign, the Market-Based China Growth Indicator developed by our China Investment Strategy service has been moving higher (Chart 9). Chart 9Encouraging Sign For The Chinese Economy
Encouraging Sign For The Chinese Economy
Encouraging Sign For The Chinese Economy
A revival in Chinese growth would aid trade-sensitive economies such as Japan and Germany. The former saw a decline in economic momentum in the second half of 2018, exacerbated by typhoons and an earthquake in Hokkaido. With the consumption tax set to increase from 8% to 10% in October, the Bank of Japan will need to maintain its yield curve control regime at least until 2020. This could weigh on the yen. With that in mind, we tightened the stop on our short AUD/JPY trade two weeks ago and subsequently exited the position with a gain of 10%. The German economy has taken it on the chin recently. Real GDP contracted in the third quarter and barely grew in the fourth quarter. The economy should rebound in 2019 as external demand improves. The drag on growth from the decline in automobile assemblies following the introduction of new emission standards should also turn into a modest tailwind as production resumes. In addition, fiscal policy is set to turn more stimulative, while robust wage growth, lower oil prices, and rising home prices should support consumption. Elsewhere in Europe, the Italian economy should recover as bond yields come down from their highs and confidence improves following the resolution of the impasse with the EU over budget targets. The modest easing in Italy’s fiscal policy of about 0.5% of GDP in 2019 should also benefit growth. It is too early to quantify the effect on the French economy from the “yellow vest” protests. France is no stranger to protests of this sort, so our guess is that the impact on the economy will be minimal. President Macron’s pledge to loosen fiscal policy in hopes of placating the protestors should also support demand. Brexit: A “No Deal” Outcome Looks Less Likely The Brexit saga could end in one of three ways: 1) A “no deal” where the U.K. leaves the EU with no alternative in place; 2) A “soft Brexit” involving an agreement to form a permanent customs union or some sort of “Norway plus” arrangement; 3) A decision to reverse the results of the original referendum and stay in the EU. In thinking about which of these three outcomes is most likely, one should keep the following in mind: Any course of action that the U.K. takes must have the support of the British parliament. A no deal outcome does not have parliament’s support. Not even close. Thus, it will not happen. This leaves options 2 and 3. This publication has argued since the day after the Brexit vote that the European establishment, following the example of the Irish and Danish referendums over various EU treaties, will keep insisting on do-overs until it gets the result it wants. If one referendum is good, two is even better – it’s twice as much democracy! The betting markets seem to be coming around to our view. As we go to press, PredictIt shows a one-in-three chance that a new referendum will be called by March 31 (Chart 10). Polling trends suggest that if another referendum were held, the remain side would probably prevail (Chart 11).
Chart 10
Chart 10
Chart 11U.K.: A Change Of Heart?
U.K.: A Change Of Heart?
U.K.: A Change Of Heart?
In some sense though, it does not matter for investors whether the original referendum is reversed or a soft-Brexit deal is reached. Either outcome would be welcomed by markets. We continue to advocate buying GBP/EUR. My colleague Dhaval Joshi, BCA’s Chief European strategist, also recommends that equity investors purchase the FTSE 250 index, which comprises from the 101st to the 350th largest companies listed on the London Stock Exchange. Unlike its large-cap counterpart, the FTSE 100, the FTSE 250 index is more geared to what happens in the U.K. than in the rest of the world. Investment Conclusions Global inflation remains subdued, which gives central banks the luxury of taking a wait-and-see approach to tightening monetary policy. Growth in the U.S. and the rest of the world should stabilize by mid-year. This will enable the Fed to resume raising rates in June. Given that the market is no longer pricing in any Fed hikes, a bearish stance towards U.S. Treasurys is warranted over a 12-month horizon (Chart 12). Outside of Japan, bond yields will also rise in the major developed economies. Chart 12Treasurys Will Underperform If The Fed Hikes Rates By More Than Expected
Treasurys Will Underperform If The Fed Hikes Rates By More Than Expected
Treasurys Will Underperform If The Fed Hikes Rates By More Than Expected
We downgraded global equities in June as our leading indicators began to point to slower growth ahead, but upgraded them back to overweight after stocks plunged following the December FOMC meeting. The rally over the past three weeks has reversed deeply oversold conditions and our tactical MacroQuant model is once again flagging some near-term risk to stocks. Nevertheless, if the global economy avoids a recession this year, as we expect, equities should fare well over a 12-month horizon. The MSCI All-Country World index is trading at a modest 13.6-times forward earnings (Chart 13). Profit estimates have been revised down meaningfully, suggesting that the bar for upward earnings surprises is now quite low. Chart 13A Lot Of Bad News Already Discounted?
A Lot Of Bad News Already Discounted?
A Lot Of Bad News Already Discounted?
Risk assets can tolerate higher rates as long as tighter monetary policy is the result of stronger growth. What risk assets cannot withstand is a stagflationary environment where growth is slowing but the Fed is hiking rates in order to bring down inflation. That is not the situation today, but could be the situation next year. Bottom line: Investors should overweight global equities and spread product for now, but monitor inflation trends closely for signs of when to get out. Peter Berezin, Chief Global Strategist Global Investment Strategy peterb@bcaresearch.com Strategy & Market Trends MacroQuant Model And Current Subjective Scores
Chart 14
Tactical Trades Strategic Recommendations Closed Trades
Typically, some underperformance of corporate credit occurs when global growth momentum slows, as was the case throughout 2018. The most violent period of spread widening materialized once the FOMC signaled that despite this softening global growth, the Fed…
Highlights Global Corporates: The Fed is now clearly signaling a near-term capitulation to tightening financial conditions alongside slowing global growth and inflation. A pause in the U.S. rate hiking cycle, after credit spread valuations have cheapened up, opens up a window of opportunity for global corporate bond market outperformance versus government debt over the next 3-6 months. Country Allocation: Move to overweight (4 of 5) on both U.S. investment grade and high-yield corporates, while downgrading U.S. Treasuries to underweight (2 of 5). Upgrade euro area investment grade and high-yield corporates to neutral (3 of 5), while downgrading euro area governments to underweight (2 of 5). Upgrade emerging market U.S. dollar denominated debt (both sovereign and corporate) from maximum underweight to underweight (2 of 5). Feature We downgraded our overall recommended investment stance on global corporate debt to neutral on June 26 of last year.1 That decision reflected our concern at the time that less accommodative central banks, a rising U.S. dollar, weakening global growth momentum and intensifying U.S.-China trade tensions had all significantly worsened the near-term risk/reward tradeoff for owning corporate bonds. This accompanied a firm-wide call at BCA to pare back our recommended exposure to global equities for the same reasons. We now see an opportunity, driven by better value and diminished market volatility after the Fed has clearly signaled a pause on U.S. rate hikes (Chart of the Week), to go back to an overweight stance on corporate credit on a tactical basis (3-6 months). Chart of the WeekTime For A Pause In Corporate Spread Widening
Time For A Pause In Corporate Spread Widening
Time For A Pause In Corporate Spread Widening
To be clear, we still see medium-term risks for corporate credit once global growth stabilizes and a resilient U.S. economy forces the Fed to restart the rate hikes in the latter half of 2019. A move to a restrictive stance by the Fed toward year-end, signaled by an inversion of the U.S. Treasury yield curve, will raise recession risks and be the eventual death knell for this credit cycle. In the meantime, corporate debt is likely to outperform government bonds, justifying a tactical overweight position. This mirrors the recent change in the BCA House View, returning to a tactical overweight stance on global equities. On a regional basis, we prefer taking more of our upgraded credit risk in U.S. corporates over European and emerging market (EM) equivalents. The outlook for growth remains more favorable on a relative basis to Europe or China, the latter being most critical for the outperformance of EM assets. Why The Spread Widening Will Pause: A Patient Fed Is Taking A Break Global corporate bond spreads have widened since we did our downgrade in June, across all countries and credit tiers (Chart 2). Typically, some underperformance of corporate credit should occur when global growth momentum slows, as was the case throughout 2018. Yet the most violent period of spread widening only began once the Fed began signaling that it would continue with its interest hikes and balance sheet runoff, despite softening global growth.
Chart 2
This set off yet another clash between policy and the markets – one of BCA’s key investment themes for 2018 that still applies in 2019 – resulting in a sharp selloff in global risk assets, including corporate debt. The result was a tightening of U.S. financial conditions, first through a stronger U.S. dollar (supported by rate hike expectations) and later through lower equity prices and wider corporate spreads. This echoed the 2014/15 period when the Fed was trying to lift rates off the zero bound after ending its quantitative easing program. The Fed was only able to deliver a single rate hike in December 2015 before pausing because of severely slumping global growth (most notably in China) and a sharp tightening in financial conditions, both of which knocked the wind out of the U.S. economy. Turning to 2019, the downturn in cyclical growth indicators like manufacturing purchasing managers indices (PMI) and the global leading economic indicator (LEI) has reached levels last seen after that 2014/15 episode (Chart 3). Importantly, our global LEI diffusion index, which measures the number of countries with rising LEIs compared to falling LEIs and is itself a reliable leading indicator of the global LEI, is bottoming out at the same level that preceded the 2016 LEI revival (middle panel). This suggests that a stabilization of the global LEI could unfold in the next few months, which would also signal a potential rebound in corporate credit returns (bottom panel). Chart 3Credit Returns Already Reflect Slowing Growth
Credit Returns Already Reflect Slowing Growth
Credit Returns Already Reflect Slowing Growth
Given the many similarities between today and the 2014/15 backdrop, it is sensible to look for other indicators that accurately heralded the end of that period of spread widening to help time a potential increase in recommended exposure to corporates. Over the past several weeks, our colleagues at our sister BCA service, U.S. Bond Strategy, have been following a checklist of market-based signals to determine the timing of a potential peak in U.S. credit spreads.2 These are grouped into two categories: signals of rebounding global growth and signals of Fed capitulation on rate hikes. For global growth, the indicators monitored are shown in Chart 4: Chart 4Checklist For Peak U.S. Spreads: Global Growth
Checklist For Peak U.S. Spreads: Global Growth
Checklist For Peak U.S. Spreads: Global Growth
the CRB raw industrials index of commodity prices (a broader measure that excludes highly volatile oil prices) the BCA Market-Based China Growth Indicator (created by our China Investment Strategy team as a proxy of investor expectations of Chinese growth3) the Global Industrial Mining equity price index For Fed capitulation, the indicators monitored are shown in Chart 5: Chart 5Checklist For Peak U.S. Spreads: Fed Capitulation
Checklist For Peak U.S. Spreads: Fed Capitulation
Checklist For Peak U.S. Spreads: Fed Capitulation
our 12-month fed funds discounter, which measures the amount of expected Fed rate hikes over the next year discounted in the U.S. Overnight Index Swap (OIS) curve the price of gold in dollars (a higher price correlating with perceptions of easier U.S. monetary policy and vice versa) the nominal trade-weighted U.S. dollar index Among the growth-focused elements of the checklist, only the China Growth Indicator is in a clear uptrend. Non-oil commodity prices had been stabilizing at the end of 2018 but appear to be rolling over, while it is not yet clear if the downturn in Mining stocks has ended. With momentum in global PMIs and LEIs still having not yet bottomed out, it may be too early to expect a cyclical rebound in non-oil commodities and related equities. At a minimum, that will require even greater signs that China’s economy is regaining some vigor. However, as we discussed last week, Chinese policymakers’ options to stimulate growth are far more limited now than they were in 2015 and 2016 when a rebounding China boosted commodity demand and EM asset performance.4 Within the Fed-focused components of the “Peak Spreads Checklist”, the near-term bullish signal for credit is much stronger. Our fed funds discounter has rapidly priced out all rate hikes for 2019. Since November, gold is up nearly 8% and the nominal trade-weighted U.S. dollar is down 2%. The shift in recent Fed messaging from signaling a “gradual pace” of tightening to exhibiting “patience” on any future policy moves was a highly dovish signal for investors. This alone has been enough to stabilize equity and credit markets, which had been discounting that Fed tightening in 2019 would drive the U.S. into a possible recession. In the constant battle between financial conditions and the Fed, the former has won this latest round. How long will this Fed pause last? Continuing with the comparison to the 2014/15 episode, a critical difference is that underlying trends in U.S. economic growth and inflation are firmer today. This is evident in the BCA Fed Monitor, which is comprised of economic and financial data that indicate pressure on the Fed to tighten or ease monetary policy. Chart 6 shows a “cycle-on-cycle” comparison of the Fed Monitor (and its subcomponents) today versus 2014/15. The Fed Monitor is still signaling a need for the Fed to continue tightening because the Economic Growth and Inflation Components remain elevated. Yet the Monitor has declined from its recent peak thanks entirely to the plunge in the Financial Conditions Component, which has fallen even faster than it did in 2014/15. Chart 6BCA Fed Monitor: Today Vs 2014/15
BCA Fed Monitor: Today Vs 2014/15
BCA Fed Monitor: Today Vs 2014/15
The implication from our Fed Monitor is that there needs to be more evidence of slowing U.S. economic growth and reduced inflation pressures for the Fed to stay on hold for longer. If the data stay firm, but financial conditions ease because investors expect a prolonged pause from the Fed, then the Fed could quickly return to a hawkish bias later this year. This is now our base case scenario for how 2019 will play out. This is also why we are only upgrading corporate debt on a tactical basis. We do not expect U.S. growth or inflation to slow enough to prevent more Fed tightening later this year – an outcome that will weigh on credit returns as the Fed moves to a restrictive policy stance. Yet even if we are wrong and the U.S. economy decelerates more sharply, that is also a bad outcome for credit because it means weaker corporate profits and rising downgrades and defaults. For bond investors with longer-time horizons than 3-6 months, the credit rally that we are anticipating can actually provide an opportunity to reduce credit exposure for the final leg of the Fed’s monetary policy cycle and the multi-year corporate credit cycle. In other words, selling into the rally rather than chasing it. For now, we are choosing to play for the shorter-term move by upgrading our recommended global credit allocations. Yet we do not envision this turning into a long-term position. The medium-term outlook for corporates is far more challenging given the advanced age of the monetary, business and credit cycles. Bottom Line: The Fed is now clearly signaling a near-term capitulation to tightening global financial conditions alongside slowing global growth and inflation. A pause in the U.S. rate hiking cycle, after credit spread valuations have cheapened up, opens up a window of opportunity for global corporate bond market outperformance versus government debt over the next 3-6 months. The Specific Changes To Our Recommended Asset Allocation As part of our tactical upgrade of global corporate debt, we are making the following changes to our recommended portfolio allocation tables (see Page 13): Upgrade overall global credit exposure to overweight (4 out of 5) Upgrade both U.S. investment grade and high-yield corporate exposure to overweight (4 out of 5), while downgrading U.S. Treasury exposure to underweight (2 out of 5) Upgrade euro area investment grade and high-yield corporate exposure to neutral (3 out of 5) and downgrade euro area government bond exposure to underweight (2 out of 5) Upgrade EM U.S. dollar denominated debt from maximum underweight to underweight (2 out of 5), both for sovereign and corporate debt. The changes all represent a one-notch upgrade from our previous allocations, based on our more positive tactical view on overall global credit risk, while still maintaining our relative preference for U.S. corporates over non-U.S. equivalents. We prefer U.S. credit not only because we expect better relative economic growth momentum in the U.S., but also because our preferred valuation metrics indicate that U.S. corporate bond spreads now look relatively attractive. Our estimate of the default-adjusted spread on U.S. high-yield corporates, which is simply the current spread minus losses from defaults, has risen to 302bps, well above the long-run average of 268bps (Chart 7). That is a function of the high-yield spread now discounting a 2019 default rate of nearly 6%, well above our forecasted default rate of 2.5%.5 Chart 7Too Much Default Risk Priced Into U.S. Junk
Too Much Default Risk Priced Into U.S. Junk
Too Much Default Risk Priced Into U.S. Junk
Corporate credit spreads in the U.S. also look attractive on a volatility-adjusted basis. Our estimates of Breakeven Spreads – the amount of spread widening required for corporate returns to break-even with duration-matched U.S. Treasuries on a one-year horizon – shows that credit spreads have cheapened to levels that are in the upper end of the historical range for both investment grade and high-yield debt (Charts 8 & 9). Chart 8Vol-Adjusted IG Spreads Have Cheapened
Vol-Adjusted IG Spreads Have Cheapened
Vol-Adjusted IG Spreads Have Cheapened
Chart 9Vol-Adjusted HY Spreads Are Cheap
Vol-Adjusted HY Spreads Are Cheap
Vol-Adjusted HY Spreads Are Cheap
Credit spreads have also cheapened up in Europe and EM, and a “risk-on” rally from a Fed pause will likely benefit spread product in those regions. However, the performance of U.S. credit versus non-U.S. credit remains largely determined by relative growth trends (Charts 10 & 11). Given our more positive view on U.S. growth on a relative basis, we are maintaining a higher recommended allocation to U.S. corporates versus euro area and EM equivalents, even as we upgrade overall global corporate exposure. This is also a way to provide a partial hedge to the specific risks in the latter regions coming from: Chart 10Global Corporates: Continue Favoring U.S. Over Europe
Global Corporates: Continue Favoring U.S. Over Europe
Global Corporates: Continue Favoring U.S. Over Europe
Chart 11Global Corporates: Continue Favoring U.S. Over EM
Global Corporates: Continue Favoring U.S. Over EM
Global Corporates: Continue Favoring U.S. Over EM
a) an end of the ECB’s corporate bond buying as part of its Asset Purchase Program, which takes a major buyer out of the euro area corporate market b) a more persistent slowing of Chinese growth momentum and softer non-oil commodity prices, both of which would be negatives for EM assets On a final note, we are also changing the specific weighting in our Model Bond Portfolio on Page 12 to reflect all of the above changes. The allocations to all U.S., euro area and EM corporates are increased – with bigger allocation changes in the U.S. – funded out of reduced weightings in U.S., German and French government bonds. Note that we are not making any changes to our relative U.K. exposures this week, given the unique risk for U.K. financial markets from the Brexit uncertainty. Thus, we are maintaining an overweight stance on U.K. Gilts in the government bond portion of the model portfolio, while remaining underweight U.K. corporates on the credit side. Robert Robis, CFA, Senior Vice President Global Fixed Income Strategy rrobis@bcaresearch.com Footnotes 1 Please see BCA Global Fixed Income Strategy Weekly Report, “Time To Take Some Chips Off The Table: Downgrade Global Corporate Bond Exposure To Neutral”, dated June 26th 2018, available at gfis.bcaresearch.com. 2 Please see BCA U.S. Bond Strategy Weekly Report, “A Checklist For Peak Credit Spreads”, dated November 27th 2018, available at usbs.bcaresearch.com. 3 Please see BCA China Investment Strategy Weekly Report, “Trade Is Not China’s Only Problem”, dated November 21st 2018, available at cis.bcaresearch.com. 4 Please see BCA Global Fixed Income Strategy Weekly Report, “Three Big Questions To Start Off 2019”, dated January 8th 2019, available at gfis.bcaresearch.com. 5 That forecasted default rate is taken from Moody’s, who have a similarly positive outlook on 2019 U.S. growth as BCA. Therefore, we see no reason to use a different default rate assumption in our high-yield valuation estimate. Recommendations The GFIS Recommended Portfolio Vs. The Custom Benchmark Index
Enough With The Gloom: Upgrade Global Corporates On A Tactical Basis
Enough With The Gloom: Upgrade Global Corporates On A Tactical Basis
Duration Regional Allocation Spread Product Tactical Trades Yields & Returns Global Bond Yields Historical Returns
Highlights Corporates: The same indicators that called the early-2016 peak in credit spreads are once again sending a positive signal. Investors should tactically increase exposure to corporate bonds at the expense of Treasuries. Duration: Treasury yields will rise in the coming months as credit spreads tighten and financial conditions ease. Maintain below-benchmark portfolio duration. TIPS: The 10-year TIPS breakeven inflation rate has fallen too far, and it is now well below the fair value reading from our Adaptive Expectations model. Remain overweight TIPS versus nominal Treasury securities. Feature We continue to view the 2015/16 episode as the appropriate comparable for current market behavior, and the same indicators that called the early-2016 peak in credit spreads are once again sending a positive signal. As such, we recommend increasing portfolio allocations to both investment grade and high-yield corporate bonds at the expense of Treasury securities (see the Recommended Portfolio Specification Table on the last page of this report). Importantly, our cyclical view of the credit cycle has not changed. Elevated corporate debt balances and a relatively flat yield curve suggest that we are in the awkward middle phase of the cycle when excess returns from corporate credit tend to be positive, but low.1 However, recent spread widening has been excessive for this middle phase of the cycle, and we expect spreads to tighten from oversold levels during the next few months. Three Reasons To Upgrade Credit (& One Key Risk) Reason 1: Elevated Spreads The first reason to upgrade corporate credit is the attractive entry point (Chart 1). Outside of the Aaa space, 12-month breakeven spreads for every credit tier (encompassing both investment grade and junk) are above their respective historical medians. For example, the 12-month breakeven spread for the Baa credit tier is at 59%. This means that the spread has been tighter than its current level 59% of the time since 1988 and wider than its current level 41% of the time. Historically, spreads tend to hover within the tight-end of their historical range during this middle phase of the credit cycle, and only cheapen significantly when the yield curve inverts and the default rate moves higher. Chart 1Corporate Bonds: Attractive Entry Point
Corporate Bonds: Attractive Entry Point
Corporate Bonds: Attractive Entry Point
Reason 2: Fed Capitulation The 2015/16 roadmap is applicable to the current market because in both cases credit spread widening was driven by the combination of weaker global growth and relatively hawkish Fed policy.2 With that in mind, an important pre-condition for spread tightening is a shift in the market’s expectations for Fed policy. Investor psyche must change from viewing monetary policy as restrictive to viewing it as accommodative. Chart 2 shows the three indicators we’ve been monitoring to signal when this shift occurs. All three called the early-2016 peak in credit spreads, and all are sending a strong buy signal at the moment. Chart 2Fed Capitulation Indicators Send A Strong Signal...
Fed Capitulation Indicators Send A Strong Signal...
Fed Capitulation Indicators Send A Strong Signal...
Our 12-month Fed Funds Discounter, the change in the fed funds rate that is priced into the overnight index swap curve for the next 12 months, has collapsed from an early-November peak of 66 bps all the way to -4 bps (Chart 2, top panel). The gold price has also rebounded smartly (Chart 2, panel 2). Gold tends to rally when the market perceives that monetary policy is becoming more accommodative because the increased risk of future inflation makes gold’s “store of value” characteristics more appealing.3 Finally, the trade-weighted dollar has started to depreciate (Chart 2, bottom panel). This signals that U.S. monetary policy is easing relative to the rest of the world, and is historically correlated with stronger global growth. Reason 3: Imminent Global Growth Rebound The high-frequency global growth indicators that called the early-2016 peak in credit spreads are not sending as strong a signal as the monetary policy indicators, but there has been some positive movement (Chart 3). Chart 3...While There Is Positive Movement In Global Growth Indicators
...While There Is Positive Movement In Global Growth Indicators
...While There Is Positive Movement In Global Growth Indicators
The CRB Raw Industrials index has only flattened-off in recent weeks (Chart 3, top panel), but the Market-Based China Growth Indicator created by our China Investment Strategy team has been rising quickly (Chart 3, panel 2).4 Finally, the price of global industrial mining stocks is no longer in free-fall. Rather, it is showing some signs of stabilization (Chart 3, bottom panel). Of the six indicators shown in Charts 2 and 3, four are sending strong buy signals and the other two are more or less neutral. In sum, we think this is enough of a signal to upgrade exposure to corporate bonds. One Key Risk The key risk to our tactical upgrade is that there is no follow-through from Fed easing to stronger global growth. In 2016, Fed capitulation coincided with a ramp-up in Chinese stimulus efforts. Chart 4 shows that our China Investment Strategy team’s Li Keqiang Leading Indicator moved sharply higher in early 2016.5 Moreover, all six components of the indicator participated in the uptrend. At present, only some components of the Leading Index have rebounded and the overall index has merely leveled-off. Chart 4Chinese Growth Is The One Key Risk
China Is The One Key Risk
China Is The One Key Risk
When it comes to Chinese growth, a trade deal with the U.S. would certainly help matters. However, the risk remains that Chinese policymakers continue to curb credit growth so much that the pass through from easier Fed policy to global growth is weaker than in 2016. Bottom Line: With Fed rate hikes priced out of the market and signs of stabilization in high-frequency global growth indicators, the toxic combination of tight Fed policy and weak global growth is disappearing. This should allow credit spreads to tighten from current oversold levels. The rapid shift in monetary policy expectations makes us think that spread tightening could occur over a relatively short timeframe. As such, we would recommend this upgrade only to tactical (3-6 month) investors. Those with longer investment horizons may be better served by waiting for spreads to tighten and then using that opportunity to reduce cyclical corporate bond exposure. A Note On Portfolio Duration As mentioned above, the market has completely priced out Fed rate hikes. At present, the overnight index swap curve discounts 4 bps of rate cuts over the next 12 months and 17 bps of rate cuts over the next 24 months. This shift in market rate expectations is the main reason for our rosier outlook on corporate spreads, but it’s important to remember that the causation between credit spreads and policy expectations runs both ways (Chart 5).
Chart 5
It is the recent spread widening and sharp tightening in financial conditions that caused the Fed to adopt a more accommodative policy stance in the first place (Chart 6). In the background, the U.S. economic data remain robust. The New York Fed’s GDP Nowcast model projects above-trend real GDP growth of 2.5% in 2018 Q4 and 2.1% in 2019 Q1. The corollary is that once credit spreads tighten and financial conditions ease, the Fed will have no further reason to stay on hold. Chart 6Financial Conditions Likely Going To Ease Going Forward
Financial Conditions Likely Going To Ease Going Forward
Financial Conditions Likely Going To Ease Going Forward
If financial conditions ease during the next few months, as we expect, then it is very likely that the Fed will be ready to lift rates again at the June FOMC meeting. The fed funds futures curve currently discounts less than a 20% chance of that happening. Bottom Line: The U.S. economic data are solid. The sharp fall in rate hike expectations and Treasury yields is purely a reaction to tighter financial conditions. Treasury yields will rise in the coming months as credit spreads tighten and financial conditions ease. Maintain below-benchmark portfolio duration. Inflation & TIPS The main reason why the Fed feels comfortable responding to tighter financial conditions by adopting a more dovish policy stance is that inflation remains well contained. Last week’s CPI report showed that core CPI grew by 2.2% in 2018, somewhat below levels that are consistent with the Fed’s target (Chart 7).6 Chart 7Inflation Remains Well Contained
Inflation Remains Well Contained
Inflation Remains Well Contained
Looking at the monthly changes, we also see that core CPI has increased by roughly 0.2% in each of the past three months. This translates to an annualized rate of approximately 2.4%, in line with the Fed’s target (Chart 8). The monthly changes shown in Chart 8 also reveal that the year-over-year growth rate in core CPI will almost certainly decline next month when the strong 0.35% print from last January falls out of the trailing 12-month sample. Chart 8Muted Inflationary Pressures For Now
Muted Inflationary Pressures For Now
Muted Inflationary Pressures For Now
However, after next month base effects start to turn supportive. Our Base Effects Indicator, an indicator that compares rates of change in core CPI ranging from 1 to 11 months, predicts that year-over-year core CPI inflation will be higher six months from now (Chart 9). Chart 9Expect Higher Inflation Six Months From Now
Expect Higher Inflation Six Months From Now
Expect Higher Inflation Six Months From Now
The conclusion is that inflationary pressures appear muted right now, and will continue to appear muted through the end of February. However, we expect them to ramp up again as we head into March. Come June, it is quite likely that the Fed will be feeling the pressure to lift rates as inflation approaches target. Coincident with a renewed uptick in inflation, TIPS breakeven inflation rates are also biased higher during the next six months. Slowing global growth and falling oil prices drove long-maturity breakevens lower during the past few months, with the result that the 10-year TIPS breakeven inflation rate is now 1.83%, 14 bps below the fair value reading from our Adaptive Expectations model (Chart 10).7 Chart 10Message From Our Adaptive Expectations Model
Message From Our Adaptive Expectations Model
Message From Our Adaptive Expectations Model
Our Adaptive Expectations model contains three independent variables: The 10-year trailing rate of change in core CPI (Chart 10, panel 3) The 12-month trailing rate of change in headline CPI (Chart 10, panel 4) The New York Fed’s Underlying Inflation Gauge (Chart 10, bottom panel) Of those three variables, the 10-year trailing rate of change in core CPI carries the largest weight. This long-run measure of core inflation is currently running at an annualized pace of 1.83%. This translates roughly to an average monthly increase of 0.15%. In other words, as long as monthly core inflation prints above the 0.15% level, the fair value from our Adaptive Expectations model will continue to rise. Bottom Line: Core inflation has been steady during the past few months, but base effects will turn positive after next month’s report. This means that we will probably see higher year-over-year core CPI inflation in six months. With the 10-year TIPS breakeven inflation rate already well below the fair value reading from our Adaptive Expectations model, we expect TIPS will outperform nominal Treasuries during the next six months. Ryan Swift, Vice President U.S. Bond Strategy rswift@bcaresearch.com Footnotes 1 Please see U.S. Bond Strategy Special Report, “2019 Key Views: Implications For U.S. Fixed Income”, dated December 11, 2018, available at usbs.bcaresearch.com 2 Please see U.S. Bond Strategy Weekly Report, “An Oasis Of Prosperity?”, dated August 21, 2018, available at usbs.bcaresearch.com 3 Please see U.S. Bond Strategy Weekly Report, “A Signal From Gold?”, dated May 1, 2018, available at usbs.bcaresearch.com 4 For further details on how this indicator is constructed please see China Investment Strategy Weekly Report, “Trade Is Not China’s Only Problem”, dated November 21, 2018, available at cis.bcaresearch.com 5 The Li Keqiang Leading Indicator is a composite indicator of money and credit growth measures designed to predict changes in the Li Keqiang Index (a coincident indicator of Chinese economic activity). For further details on how the Leading Index is constructed please see China Investment Strategy Special Report, “The Data Lab: Testing The Predictability Of China’s Business Cycle”, dated November 30, 2017, available at cis.bcaresearch.com 6 The Fed targets 2% PCE inflation. CPI inflation tends to run about 0.4%-0.5% higher than PCE, which means the Fed’s target is roughly 2.4%-2.5% for CPI. 7 For further details on the model please see U.S. Bond Strategy Weekly Report, “Adaptive Expectations In The TIPS Market”, dated November 20, 2018, available at usbs.bcaresearch.com Fixed Income Sector Performance Recommended Portfolio Specification
The most important U.S. dataset next week should be the retail sales schedules to come out on Wednesday. The consumer spending has remained robust, and the retail sales data will test if this is still true. However, if the government shutdown continues,…
After a brief rebound, the ratio of risk-on vs. Safe-Haven currencies used by BCA’s Emerging Market Strategy team has once again rolled over. This ratio picked up the growing risks to global demand last year, worries that ultimately spilled into the global…
Our emerging market strategists are not convinced that global equities are in a cyclical bull market yet. Being oversold, global equity prices are already reflecting a lot of bad news. Moreover, investor sentiment on global growth has become downbeat.…
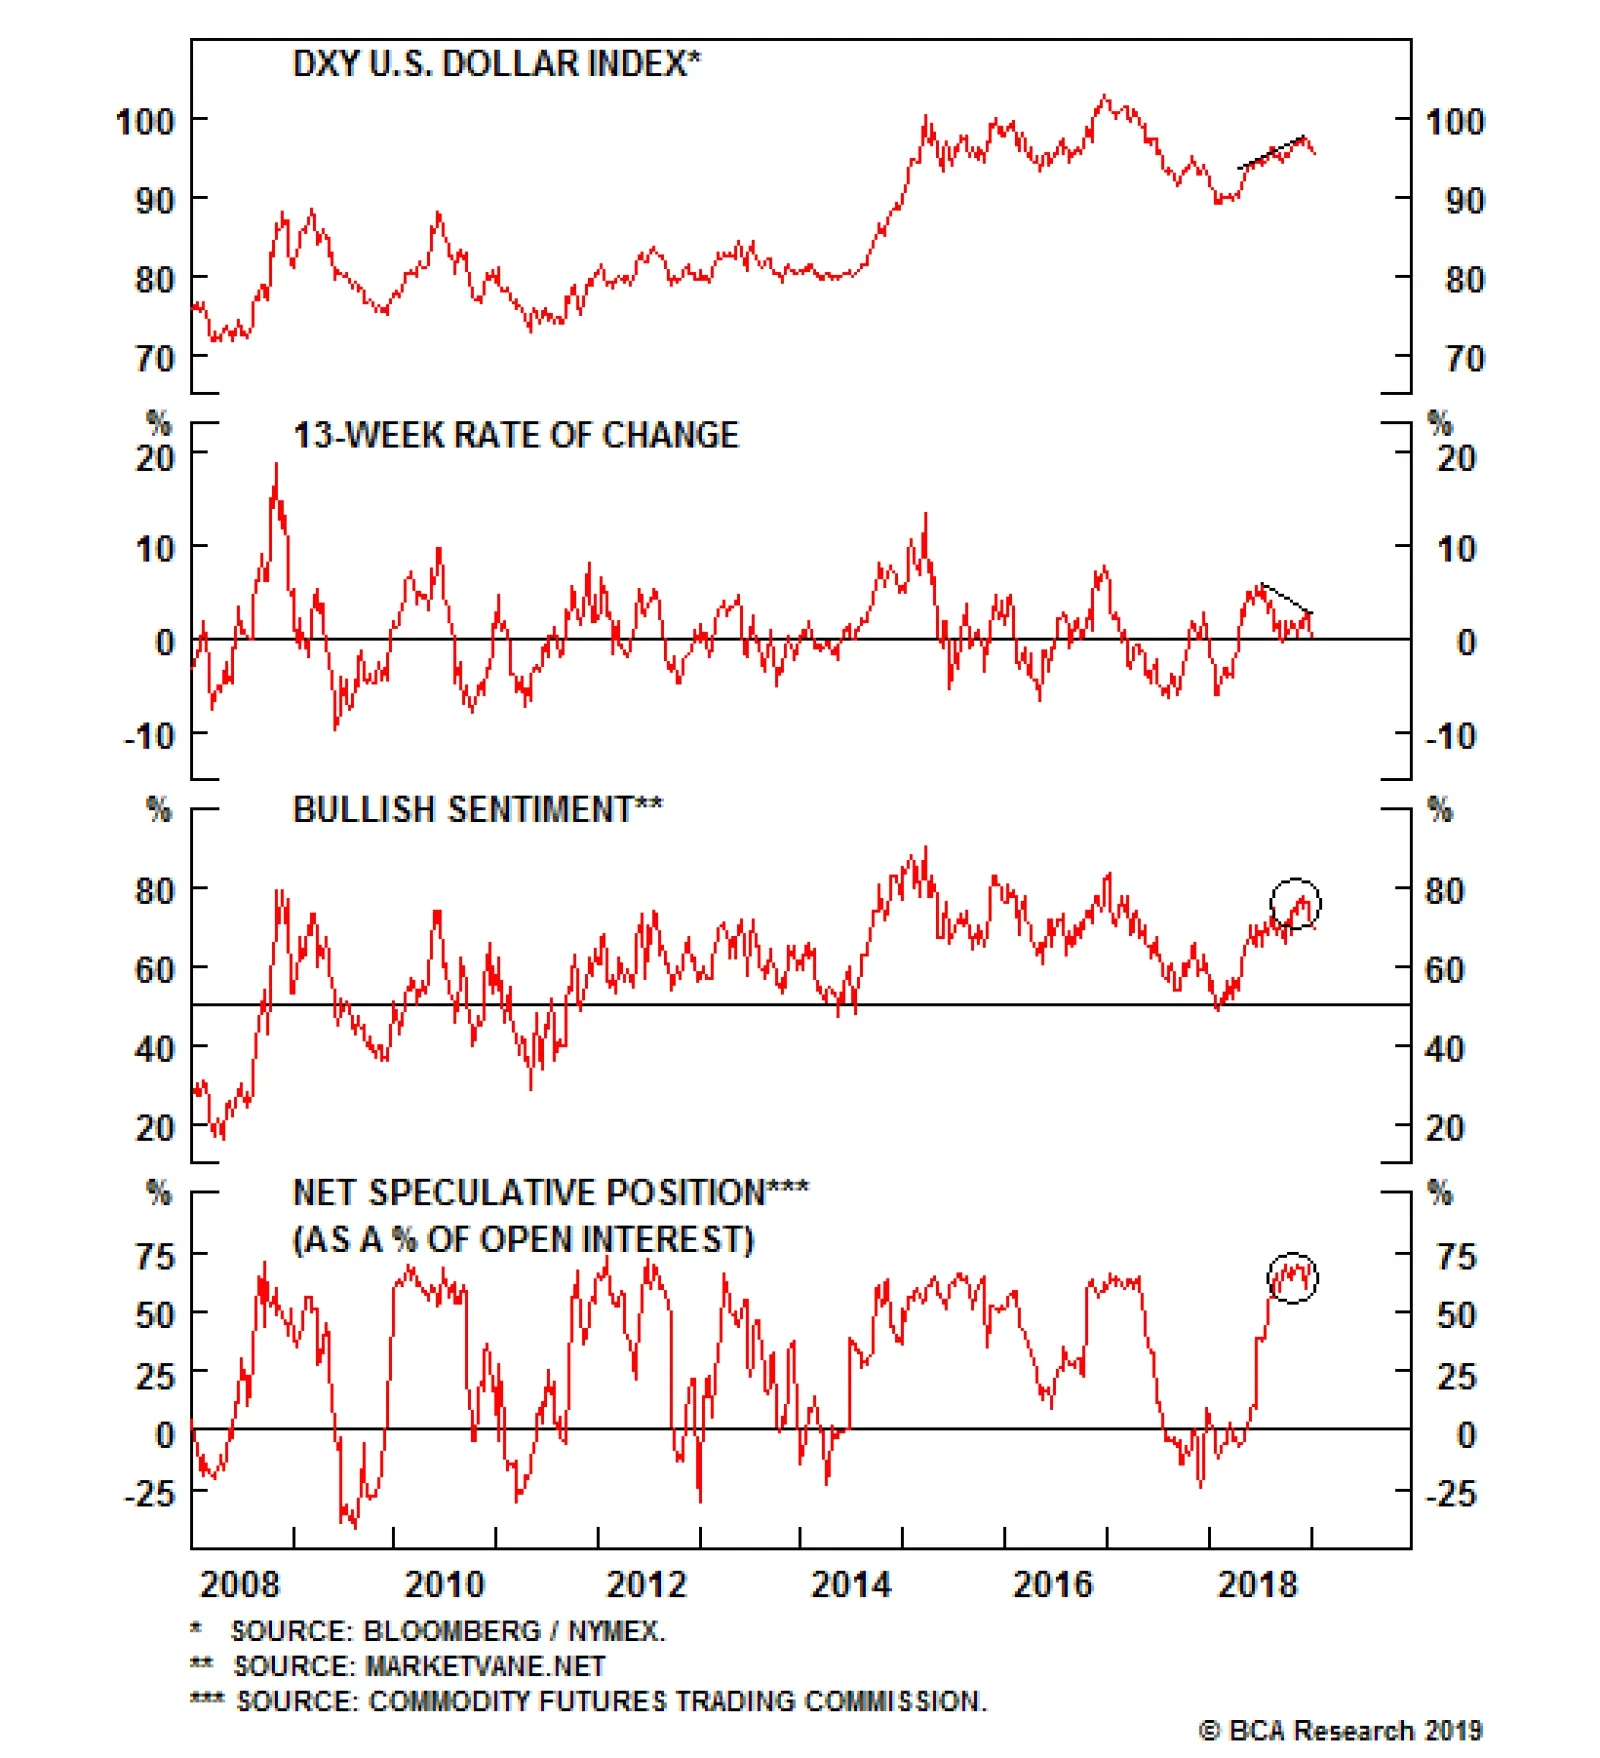
The dollar is historically a momentum currency, implying that as much as strength begets further strength, weakness begets additional weakness. As a result, the fall in the DXY from 97.5 in December to 96 raises a red flag. This red flag is even more…
The oil rout that began in October appears to have run its course, based on positioning, sentiment and technicals. All the same, several cross-market gauges we designed to assess investors’ conviction on global macro conditions continue to support a cautious view over the short term. This dichotomy in the markets’ internal dynamics supports our view volatility will remain elevated over the next month or two. After that, we expect clear evidence the global oil market is tightening, as strong OPEC 2.0 compliance with production cuts and robust demand – albeit weaker than that of the past two years – drains inventories in 1H19. This is the basis of our $80/bbl Brent forecast for this year. Highlights Energy: Overweight. Our oil recommendations made last week in the wake of the oil-price vs. fundamentals disconnect – long spot WTI and long July 2019 Brent vs. short July 2020 Brent spread – are up 5.7% and 0.7%. Base Metals: Neutral. Asia trade-volume growth likely will move lower in the short term, even if Sino – U.S. trade talks are fruitful. With or without such an outcome, precautionary inventories built on both sides will have to be drawn down, an outcome we believe is priced into base metals prices. A rapprochement would be supportive for these markets, but these inventories still have to be worked through. Precious Metals: Neutral. Gold’s rally is intact, as markets gain conviction the Fed will deliver one rate hike this year. We are aligned with our House view calling for three hikes, which would present a headwind. We remain long gold as a portfolio hedge. Ags/Softs: Underweight. Insiders report China made three large purchases of soybeans from the U.S. over the past month, as trade negotiators met in Beijing this week. Optimism on the trade front is buoying optimism in ag markets.1 Feature The rout in oil prices over the course of 4Q18 appears to have run its course, based on a composite indicator we created to assess technical and sentiment information in the crude oil market, and other metrics designed to gauge internal market dynamics (Chart of the Week). Chart of the WeekBCA's WTI Composite Indicator Flags Oversold Condition for Crude
BCA's WTI Composite Indicator Flags Oversold Condition for Crude
BCA's WTI Composite Indicator Flags Oversold Condition for Crude
The individual components of the composite at the end of last year all had taken a sharp down leg, indicating investors were seriously concerned about a global slowdown and perhaps even an unexpectedly early recession (Chart 2).2 This concern also was noted by the World Bank, which this week revised its EM growth outlook – the key driver of commodity demand – for 2018 lower, and shaved its global 2019 growth estimate as well.3 Chart 2Sharp Down Leg In Composite's Components
Sharp Down Leg In Composite's Components
Sharp Down Leg In Composite's Components
Ordinarily, there is not a lot of econometric support for technical indicators. Nonetheless, we found this composite indicator does a good job of explaining y/y changes of Brent crude oil prices, and vice versa. That’s right: there is two-way Granger-causality between the BCA WTI Composite indicator and y/y crude prices (Chart 3).4 Chart 3Composite Indicator, WTI Crude Form A Feedback Loop
Composite Indicator, WTI Crude Form A Feedback Loop
Composite Indicator, WTI Crude Form A Feedback Loop
Given this two-way relationship, it is plausible speculative positioning, investor sentiment and price momentum can help forecast short-term price movements. In turn, the movement in prices feeds back to the components of our composite indicator, and can help anticipate positioning, sentiment and momentum. Indeed, it is likely the fundamental supply-side shock arising from the higher-than-expected waivers on Iranian imports granted by the Trump administration in November – separate and apart from the selling pressure in October – set off one of these feedback loops. Given the paucity of data at the time, market participants had to guess the extent of the physical surplus arising from the waivers as OPEC 2.0 rapidly increased production and filled inventories ahead of U.S. sanctions, and at the same time fears over the strength of demand were becoming more pronounced.5 As we noted last week, we do not think the oil price rout was evidence of an as-yet undetected collapse in demand or run-away supply. OPEC 2.0 and Canadian producers will cut ~ 1.4mm b/d of production; decline-curve losses of ~ 200k b/d from states that cannot maintain or increase their supply will persist, and slower U.S. shale growth resulting from price-induced capex declines will reduce output growth there. These supply cuts, plus still-strong demand growth of 1.4mm b/d, are driving our forecast the physical oil overhang will clear in 1H19, and that Brent prices will average $80/bbl this year, with WTI trading $6/bbl below that.6 Based on the most recent “oversold” reading of the BCA WTI Composite indicator, we believe the oil rout has run its course, given the indicator is in deeply oversold territory. By now, we think the negative sentiment and spec positioning components of prices have been exhausted. Unless we see a fundamental shock – a truly unexpected collapse in demand, e.g., or a complete breakdown in OPEC 2.0 production discipline – it is difficult to foresee another sell-off. As the uncertainty clears and inventory starts to draw, speculators will re-enter the market (allowing producers to hedge), and sentiment will turn more bullish as visible evidence of lower inventories continues to be reported in weekly and monthly data. Some Indicators Still Urge Caution While the case can be made the oil rout has run its course, there still are cautionary signals flashing in our other indicators that assess internal market dynamics within and across EM and commodities. This likely will keep volatility high over the short term (Chart 4). Chart 4Conflicting Signals Will Keep Oil Vol Elevated
Conflicting Signals Will Keep Oil Vol Elevated
Conflicting Signals Will Keep Oil Vol Elevated
BCA’s Emerging Market strategists’ Risk-on vs. Safe-Haven currency ratio has rolled over. This ratio picked up the degradation of demand expectations and rise in recession fears, which then spilled into global bond yields. With the benefit of hindsight, the case can be made this presaged a rise in global risk aversion in currency markets (Chart 5).7 Chart 5Warning Signs Flashing
bca.ces_wr_2019_01_10_c5
bca.ces_wr_2019_01_10_c5
In addition, our gold ratios, which serve as growth-versus-safe-haven indicators – i.e., the copper/gold and oil/gold ratios – sagged, as industrial commodities weakened and gold rallied by 7% since November 2018.8 Together, these indicate markets were revising down their growth expectations, and reducing their risk in 4Q18. Even with the recent pick up in EM trade volume – a proxy for EM income growth – our short-term models suggest this likely will not be sustained, and that import volume growth will contract in 2H19 (Chart 6). Chart 6Expect Weaker Trade Volumes In 2H19
Expect Weaker Trade Volumes In 2H19
Expect Weaker Trade Volumes In 2H19
Our EM trade-volume models are driven by the broad trade-weighted USD (TWIB) and other FX and financial variables.9 The USD had been rallying as the U.S. domestic economy outperformed the rest of the world, and markets remained concerned over the Fed’s rates-normalization policy, which was pressuring expectations for EM trade growth lower. With the oil-price collapse of 4Q18 in the rear-view mirror, it is not inconceivable the Fed will not feel compelled to raise rates in 1H19, as inflation expectations are re-calibrated in the wake of this most important expectations driver. If this takes some of the steam out of the USD, or even causes it to retreat from its recent highs, oil – and commodities generally – will rally on the tailwind. Indeed, a depreciation in the USD of 5% from current levels could lift prices by ~18%, holding everything else constant (Chart 7). Chart 7USD's Path Will Be Important As Oil Supply and Demand Rebalance
USD's Path Will Be Important As Oil Supply and Demand Rebalance
USD's Path Will Be Important As Oil Supply and Demand Rebalance
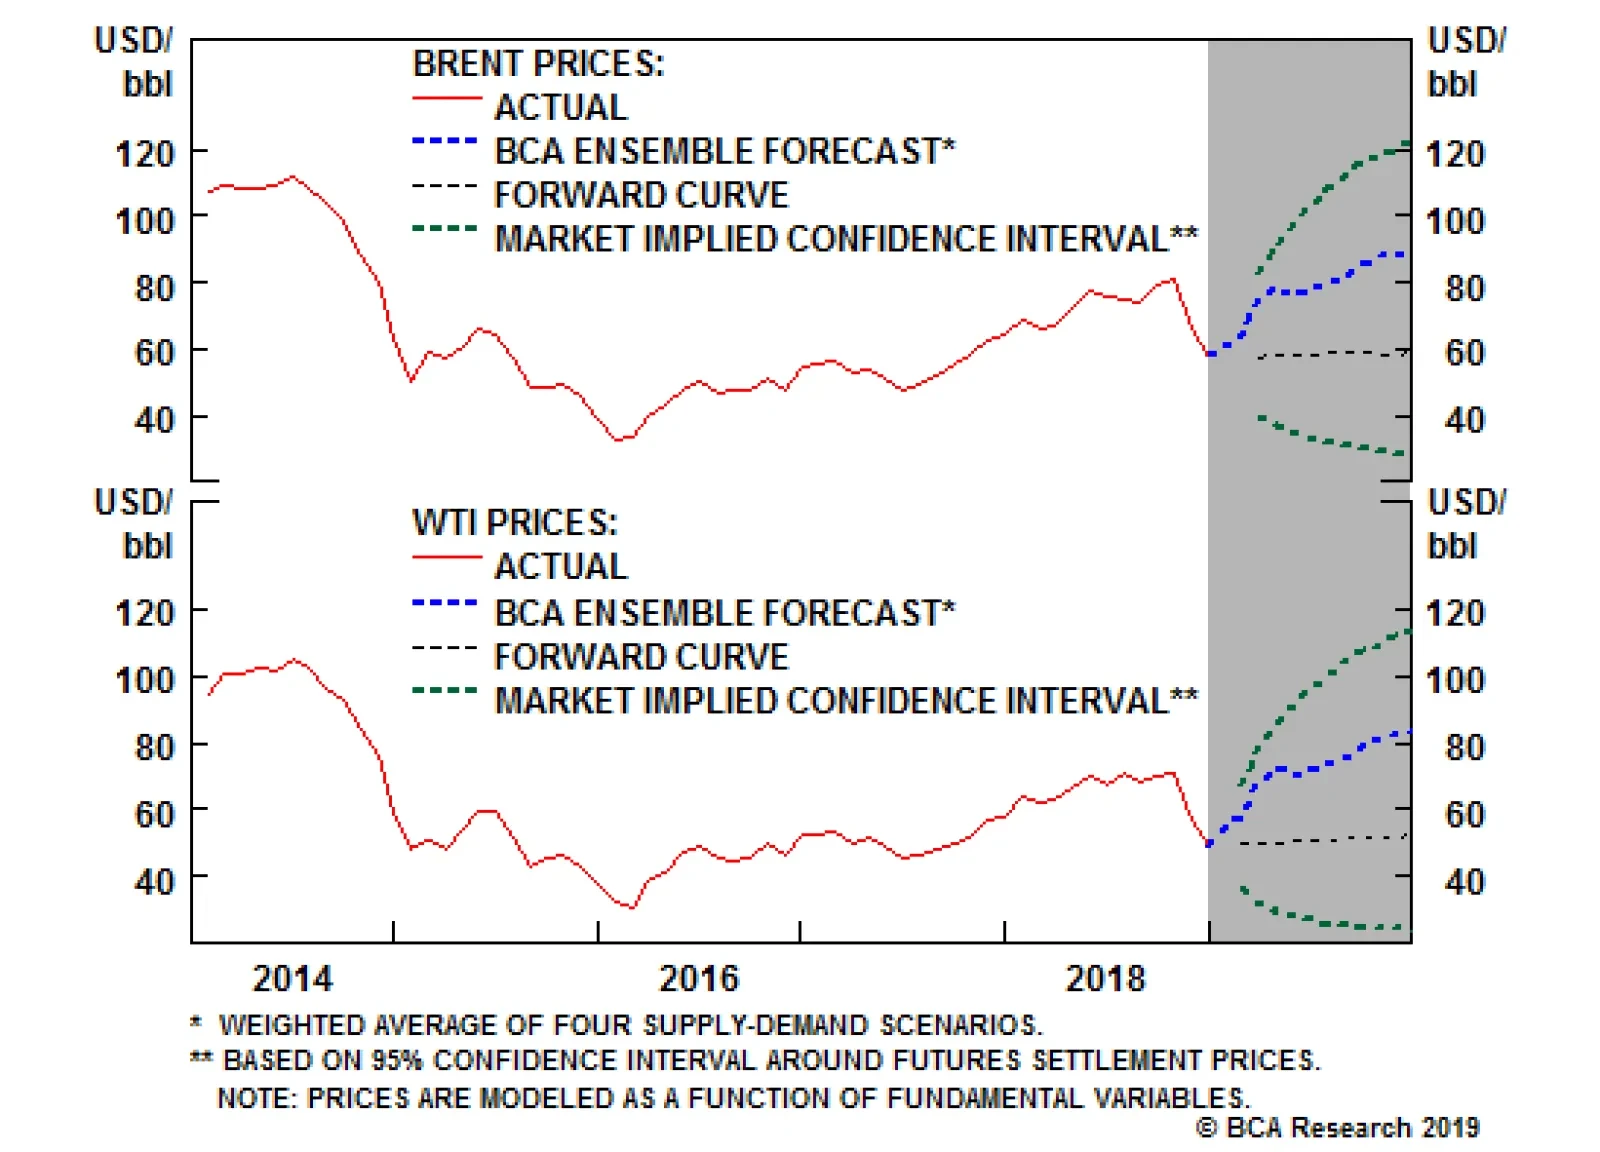
Bottom Line: Our intra- and inter-market indicators are throwing off conflicting signals regarding the current state of global oil markets. On the one hand, our WTI Composite indicator shows oil is oversold, which supports our bullish outlook. On the other hand, markets currently are signaling a larger decline in global growth than we currently have in our oil forecast models. A larger-than-expected slowdown in oil demand growth – e.g., an additional loss of 200k b/d that took growth to 1.2mm b/d – would push our Brent forecasts down by ~ $4/bbl to $76/bbl this year. Nevertheless, uncertainty about the future path of oil supply and demand is elevated, and the distribution of possible price outcomes is wide, as our most recent forecast illustrates (Chart 8). We believe the combination of OPEC 2.0 production discipline and robust demand support a rebound in oil prices in 2019. We are keeping our 2019 Brent price target at $80/bbl. Chart 8Elevated Volatility Keeps Range of Expected Prices Wide
Elevated Volatility Keeps Range of Expected Prices Wide
Elevated Volatility Keeps Range of Expected Prices Wide
Robert P. Ryan, Senior Vice President Commodity & Energy Strategy rryan@bcaresearch.com Hugo Bélanger, Senior Analyst Commodity & Energy Strategy HugoB@bcaresearch.com Pavel Bilyk, Research Analyst Commodity & Energy Strategy PavelB@bcaresearch.com Footnotes 1 Please see “China buys more U.S. soy as officials meet for trade talks,” published by reuters.com January 7, 2019.com. 2 Each of the individual components is standardized to create the WTI composite indicator. We lack CFTC open-interest data to update the open-interest series, due to the U.S. government’s shutdown. 3 This is in line with our expectation, which is contained in our most recent balances and forecast update published last week. Please see “Oil Volatility will Persist; 2019 Brent Forecast Lowered to $80/bbl.” It is available at ces.bcaresearch.com. The World Bank’s latest forecast can be found in its Global Economic Prospects, which is titled “Darkening Skies.” It can be found at http://www.worldbank.org/en/publication/global-economic-prospects. 4 Clive Granger used standard statistics to show information contained in past realizations of one variable can be used to predict another variable’s value. Two-way causality indicates lagged values of both variables contain statistically significant information that allows past realizations of both to be used to predict the other’s value. There is a huge literature on this topic. For an excellent intuitive explanation of Granger causality, please see the discussion beginning on p. 365 of “Time Series Analysis, Cointegration, and Applications,” Clive Granger’s Nobel lecture delivered December 8, 2003 (https://www.nobelprize.org/uploads/2018/06/granger-lecture.pdf). 5 Please see “All Fall Down: Vertigo In The Oil Market ... Lowering 2019 Brent Forecast To $82/bbl,” published by BCA Research’s Commodity & Energy Strategy November 15, 2018. It is available at ces.bcaresearch.com. 6 We would not be at all surprised if OPEC 2.0 overdelivered on production cuts, as it did in 2017 – 1H18. 7 Relative total return (carry included) of four equally weighted EM (ZAR, RUB, BRL and CLP) and three DM (AUD, NZD and CAD) commodities currencies versus an equally weighted average of two safe-haven currencies - the Japanese yen and Swiss franc. 8 These gold ratios are discussed in detail in “Gold Ratios Wave Off ‘Red October’ … Iran Export Waivers Highlight Tight Market,” published by BCA Research’s Commodity & Energy Strategy November 8, 2018. It is available at ces.bcaresearch.com. 9 For in-depth discussions of these models and our general approach to modeling EM trade volumes, please see “Trade, Dollars, Oil & Metals … Assessing Downside Risk,” published by BCA Research’s Commodity & Energy Strategy August 23, 2018. It is available at ces.bcaresearch.com. Investment Views and Themes Recommendations Strategic Recommendations Trade Recommendation Performance In 4Q18
Image
Commodity Prices and Plays Reference Table Trades Closed in 2018 Summary of Trades Closed in 2018
Image
Highlights EM equity and credit outperformance versus the U.S. in the past three months was an aberration in the cyclical and structural downtrend. Hence, the recent outperformance of EM assets provides a good entry point for investors to short EM/China assets against their U.S. counterparts. In our opinion, this strategy will work in the coming months regardless of whether global risk assets rebound or sell off – i.e., they are not dependent on market direction. Feature The fourth quarter of 2018 was marked by a precipitous plunge in global equities, led by the U.S. In the meantime, EM stocks have outperformed the global equity benchmark in the past three months. Will EM and U.S. stocks trade places again, or will EM continue to outperform U.S. and DM equities? By the end of December, global share prices had become extremely oversold, and investor sentiment was downbeat. A trifecta of confidence-boosting developments – the rapprochement between the U.S. and China in trade negotiations, the announcement of more policy stimulus in China and reassurances from Federal Reserve Chairman Jerome Powell that monetary policy tightening is not predetermined – have since led to a rebound in global stocks. A key question for asset allocators heading into 2019 is: Will EM continue to outperform the global equity index in this rebound? We do not think so. The odds are considerable that EM will resume its underperformance versus DM in general and the U.S. in particular. The fundamental rationale for staying bearish on EM is that global trade and manufacturing remain on a downward trajectory. Chart I-1 illustrates that EM risk assets sell off when global trade is slowing, especially when the weakness stems from China. Chart I-1EM Selloff Has Been Due To Slowdown In China
EM Selloff Has Been Due To Slowdown In China
EM Selloff Has Been Due To Slowdown In China
Chinese policymakers are easing both fiscal and monetary policies, but the impact of their efforts on the economy is yet to be seen. Declining interest rates in China do not constitute a sufficient condition to buy EM risk assets. Importantly, EM stocks often drop when Chinese interest rates are falling, as that reflects a deteriorating growth outlook (Chart I-2). Chart I-2Lower Interest Rates In China Is Not A Reason To Buy EM
Lower Interest Rates In China Is Not A Reason To Buy EM
Lower Interest Rates In China Is Not A Reason To Buy EM
In short, monetary and fiscal stimulus in China are not yet sufficient to revive the mainland’s business cycle. The latter is critical to the performance of EM risk assets. We will explore China’s fiscal and credit stimulus efforts in much more detail in the coming weeks. Finally, EM equity valuations are no better than those in the U.S. In particular, our EM/U.S. relative stock valuation indicator based on a 20% trimmed mean is currently neutral (Chart I-3). This valuation measure strips out the top and bottom 10% for EM as well as U.S. sub-sectors and computes an equally weighted average of the other 80%. Hence, it eliminates the outliers that for structural or industry specific reasons trade at much lower or higher multiples. Consequently, contrary to the common narrative in the investment industry, EM equities are not cheap versus U.S. ones. Chart I-3EM Equities Are Not Cheaper Than U.S. Ones
bca.ems_wr_2019_01_10_s1_c3
bca.ems_wr_2019_01_10_s1_c3
Given our high conviction on the view that U.S. will outperform EM over the coming several months, we are reiterating a few of our long-standing strategic recommendations/pair trades: Short EM stocks / long the S&P 500; Short EM banks / long U.S. banks; Short EM high-yield corporate credit / long U.S. high-yield corporate credit; Short Chinese property developers / long U.S. homebuilders. In all four cases, the recent outperformance of EM assets provides a good entry point for investors who do not yet have these positions. In our opinion, these recommendations will work in the coming months regardless of whether global risk assets rebound or sell off – i.e., they are not dependent on market direction. No Turnaround In Global Trade/Manufacturing Global cyclical equity sectors have plunged significantly and their prices may be recovering/stabilizing due to oversold conditions. Yet there are few signs of improvement in global trade and manufacturing, and no indication of a significant turnaround in financial markets that are most sensitive to global trade and Chinese growth. Our Risk-On-to-Safe-Haven (RSH) currency ratio1 has relapsed again following a failed rebound attempt (Chart I-4, top panel). Interestingly, this ratio seems to be forming a head-and-shoulders pattern, suggesting the next big move could be to the downside. As we have shown in past reports, EM share prices correlate strongly with this indicator, and a major downleg in this indicator would be consistent with a major drop in EM stocks. Chart I-4No Buy Signal For EM From The Global Currency Markets
bca.ems_wr_2019_01_10_s1_c4
bca.ems_wr_2019_01_10_s1_c4
Furthermore, the annual rate of change on this currency ratio leads the EM manufacturing PMI, and it presently foreshadows more downside in the latter (Chart I-4, bottom panel). Korean and Taiwanese exports contracted slightly in December from a year ago. As frontloading from U.S. import tariffs wanes, their exports will shrink further. Chips prices are falling, signaling that the slump of the global tech hardware sector is not yet over (Chart I-5). Chart I-5Chip Prices Are Still Plunging
Chip Prices Are Still Plunging
Chip Prices Are Still Plunging
Continued deterioration in global trade and manufacturing is bad news for emerging Asia. The technical profile of Asian stock markets is also poor, raising the odds of a meltdown as cyclical economic conditions in the region deteriorate further. The region’s relative equity performance versus global and Latin American indexes is relapsing, having failed to break above long-term moving averages (Chart I-6). Chart I-6Underweight Emerging Asian Stocks Versus Both World And Latin America
Underweight Emerging Asian Stocks Versus Both World And Latin America
Underweight Emerging Asian Stocks Versus Both World And Latin America
Odds are that emerging Asian stocks will drop in absolute terms, underperforming both the EM and global equity benchmarks. This will drag the EM index down further. We continue to recommend the following strategy: long Latin American stocks / short emerging Asian equities. The U.S. manufacturing leading indicator – the ISM manufacturing new orders-to-inventory ratio – remains in a downtrend (Chart I-7). Chart I-7The U.S. Selloff Has Been Partially Due To Manufacturing Slowdown
The U.S. Selloff Has Been Partially Due To Manufacturing Slowdown
The U.S. Selloff Has Been Partially Due To Manufacturing Slowdown
The average of new and backlog orders from the Chinese manufacturing PMI survey has plunged to its previous lows (Chart I-8, top panel). The domestic orders component of the People’s Bank of China’s latest 5000 industrial enterprise survey is also in a free fall (Chart I-8, bottom panel). Chart I-8China: No Sign Of Bottom In Industrial Sectors
China: No Sign Of Bottom In Industrial Sectors
China: No Sign Of Bottom In Industrial Sectors
Meanwhile, the impact of Chinese domestic demand on the rest of the world occurs via mainland imports. The leading indicator for imports – the manufacturing PMI import sub-component – has plunged to 46, well below the 50 boom-bust line (see Chart I-1, bottom panel on page 1). Within the investable Chinese equity universe, cyclical sectors exposed to capital spending are making new lows in absolute terms (Chart I-9, top and middle panels). At the same time property stocks are relapsing again (Chart I-9, bottom panel). Chart I-9China: Not Much Rebound In Cyclical Equity Sectors
China: Not Much Rebound In Cyclical Equity Sectors
China: Not Much Rebound In Cyclical Equity Sectors
While the authorities are once again boosting infrastructure spending by allowing local governments to issue more special bonds, the mainland’s real estate market has ground to a halt. The latter will likely offset the former. Finally, the MSCI China All Shares index – which incorporates all Chinese stocks trading inside and outside the country – has not rebounded much, despite being oversold (Chart I-10, top panel). Chart I-10China All Share Index: Poor Performance Continues
China All Share Index: Poor Performance Continues
China All Share Index: Poor Performance Continues
Notably, this index’s relative performance versus both DM and EM equity indexes has failed to break above its 200-day moving average, despite the announced policy stimulus (Chart I-10, middle and bottom panels). These are negative technical signposts that bode ill for the outlook for Chinese share prices. Bottom Line: Odds are high that the global trade/manufacturing or related equity sectors/segments will continue struggling in the months ahead. What About The U.S. Dollar? The trade-weighted U.S. dollar has been going sideways for several months. While lower U.S. interest rate expectations have weighed on the greenback, the global manufacturing slowdown and risk-off sentiment in financial markets have put a floor under its value. The dollar is a countercyclical currency, and it does well when global growth is weakening, and vice versa (Chart I-11). Chart I-11The U.S. Dollar Is A Counter-Cyclical Currency
The U.S. Dollar Is A Counter-Cyclical Currency
The U.S. Dollar Is A Counter-Cyclical Currency
It is impossible to know how long this standstill phase in the currency markets will last. What we do know is that when it breaks one way or another, the move will be violent and large. We believe risks to the U.S. currency are to the upside. First, U.S. consumer spending growth remains robust, and the labor market is very tight. Unless the rest of the world plunges into a major growth slump, pulling the U.S. down with it, U.S. interest rate expectations should recover, lifting the dollar. Second, a further downshift in U.S. interest rate expectations will likely occur only if the global economic slowdown is so severe that it leads the market to price in Fed rate cuts. In this scenario, the greenback will rally violently as well. The basis is that the dollar tends to appreciate during global slumps and sell off amid global growth recoveries, as illustrated in Chart I-11. Third, the only scenario where the dollar could plunge is where global trade recovers briskly, driven by growth outside the U.S. in general and in China/EM in particular. This is the least-likely scenario at the current juncture, in our opinion. The trend in the dollar is critical to the relative performance between EM and U.S. stocks. Chart I-12 demonstrates that periods of EM equity underperformance versus the U.S. typically coincide with an appreciation in the trade-weighted greenback, and vice versa. Chart I-12When EM Stocks Outperform The Global Benchmark, U.S. Underperforms And Dollar Weakens And Vice Versa
When EM Stocks Outperform The Global Benchmark, U.S. Underperforms And Dollar Weakens And Vice Versa
When EM Stocks Outperform The Global Benchmark, U.S. Underperforms And Dollar Weakens And Vice Versa
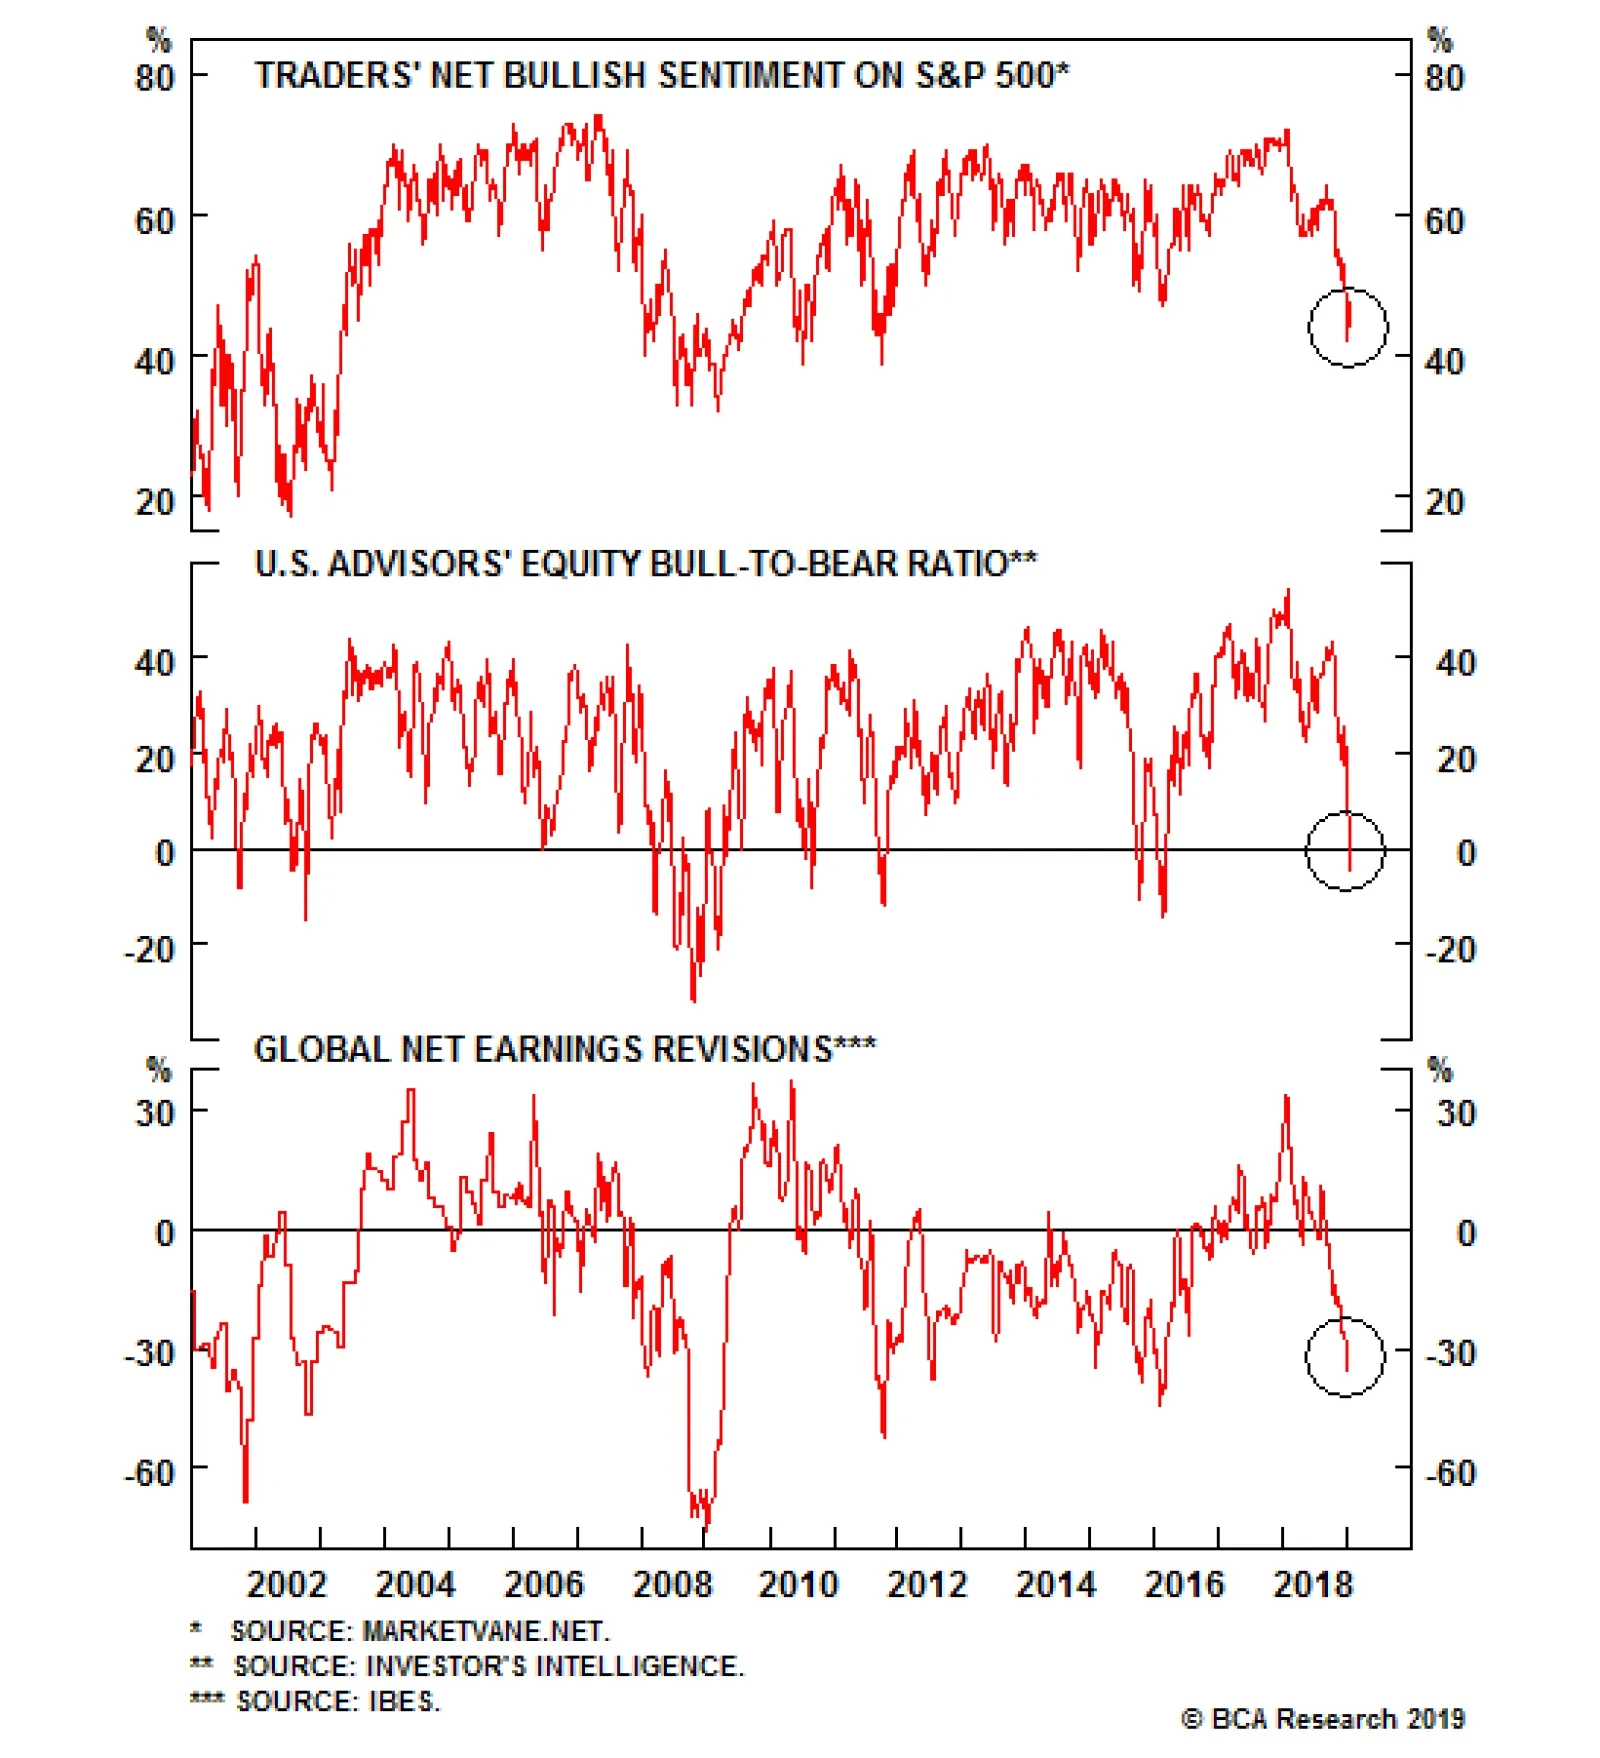
Bottom Line: The next big move in the U.S. dollar will likely be up, not down. Investment Considerations Global equity prices are already reflecting a lot of bad news; they are oversold, and investor sentiment on global growth has become downbeat (Chart I-13). This could create a window for global equities to rebound on a tactical basis. Chart I-13U.S./Global Stocks Are Oversold
U.S./Global Stocks Are Oversold
U.S./Global Stocks Are Oversold
The majority of our colleagues at BCA believe global equities are primed for a cyclical rally. We within BCA’s EM team agree with the equity rebound narrative but on a tactical basis and believe that any rebound will be led by U.S. stocks – and that EM will lag. We are not convinced that global equities are in a cyclical bull market yet. The main difference between BCA’s house view and the EM team’s outlook is the risks related to China’s economy and their impact on global cyclical equity sectors. The U.S. is relatively unexposed to Chinese growth, EM economies, commodities producers, Japan and Germany. Therefore, U.S. stocks will outperform and the dollar will do well if Chinese growth continues disappointing. Ongoing trade talks between China and the U.S. may bring about some positive results, and the Fed may continue to sound more dovish. However, we contend that the main culprit behind the global equity selloff in 2018 was neither the trade war nor the Fed, but the slowdown in global trade/manufacturing (please refer to Chart 1 and 7 on pages 1 and 6, respectively). On this front, we do not foresee an imminent reversal, as argued above. The latest underperformance of the U.S. has created a good entry point for our relative strategies/trades to be short EM / long U.S. We reiterate the following strategies/trades (Chart I-14): Chart I-14Reiterating Four EM Vs. U.S. Strategies/Trades
Re-iterating Four Strategies/Trades for EM Vs. U.S.
Re-iterating Four Strategies/Trades for EM Vs. U.S.
Short EM stocks / long the S&P 500; Short EM banks / long U.S. banks; Short EM HY corporate credit / long U.S. HY corporate credit; Short Chinese property developers / long U.S. homebuilders. Within the EM equity space, we continue to recommend underweighting emerging Asia while overweighting Latin America, Russia and Central Europe. In particular, we are reiterating our long Latin America / short Emerging Asian equities trade initiated on October 11, 2018 (please refer to Chart I-6 on page 5). The complete list of our country equity allocations is presented on page 12. Finally, the path of least resistance for the dollar is up. We continue to recommend shorting a basket of the following EM currencies against the dollar: ZAR, IDR, MYR, KRW, COP and CLP. Arthur Budaghyan, Senior Vice President Emerging Markets Strategy arthurb@bcaresearch.com Footnotes 1 Average of CAD, AUD, NZD, BRL, CLP & ZAR total return indices relative to average of JPY & CHF total returns (including carry). Equity Recommendations Fixed-Income, Credit And Currency Recommendations