Global
The U.S. economic calendar continues to heal from the disturbance inflicted by the government shutdown, and some important releases are being re-scheduled. What we currently know for certain is that the factory orders and the Fed’s senior loan officers survey…
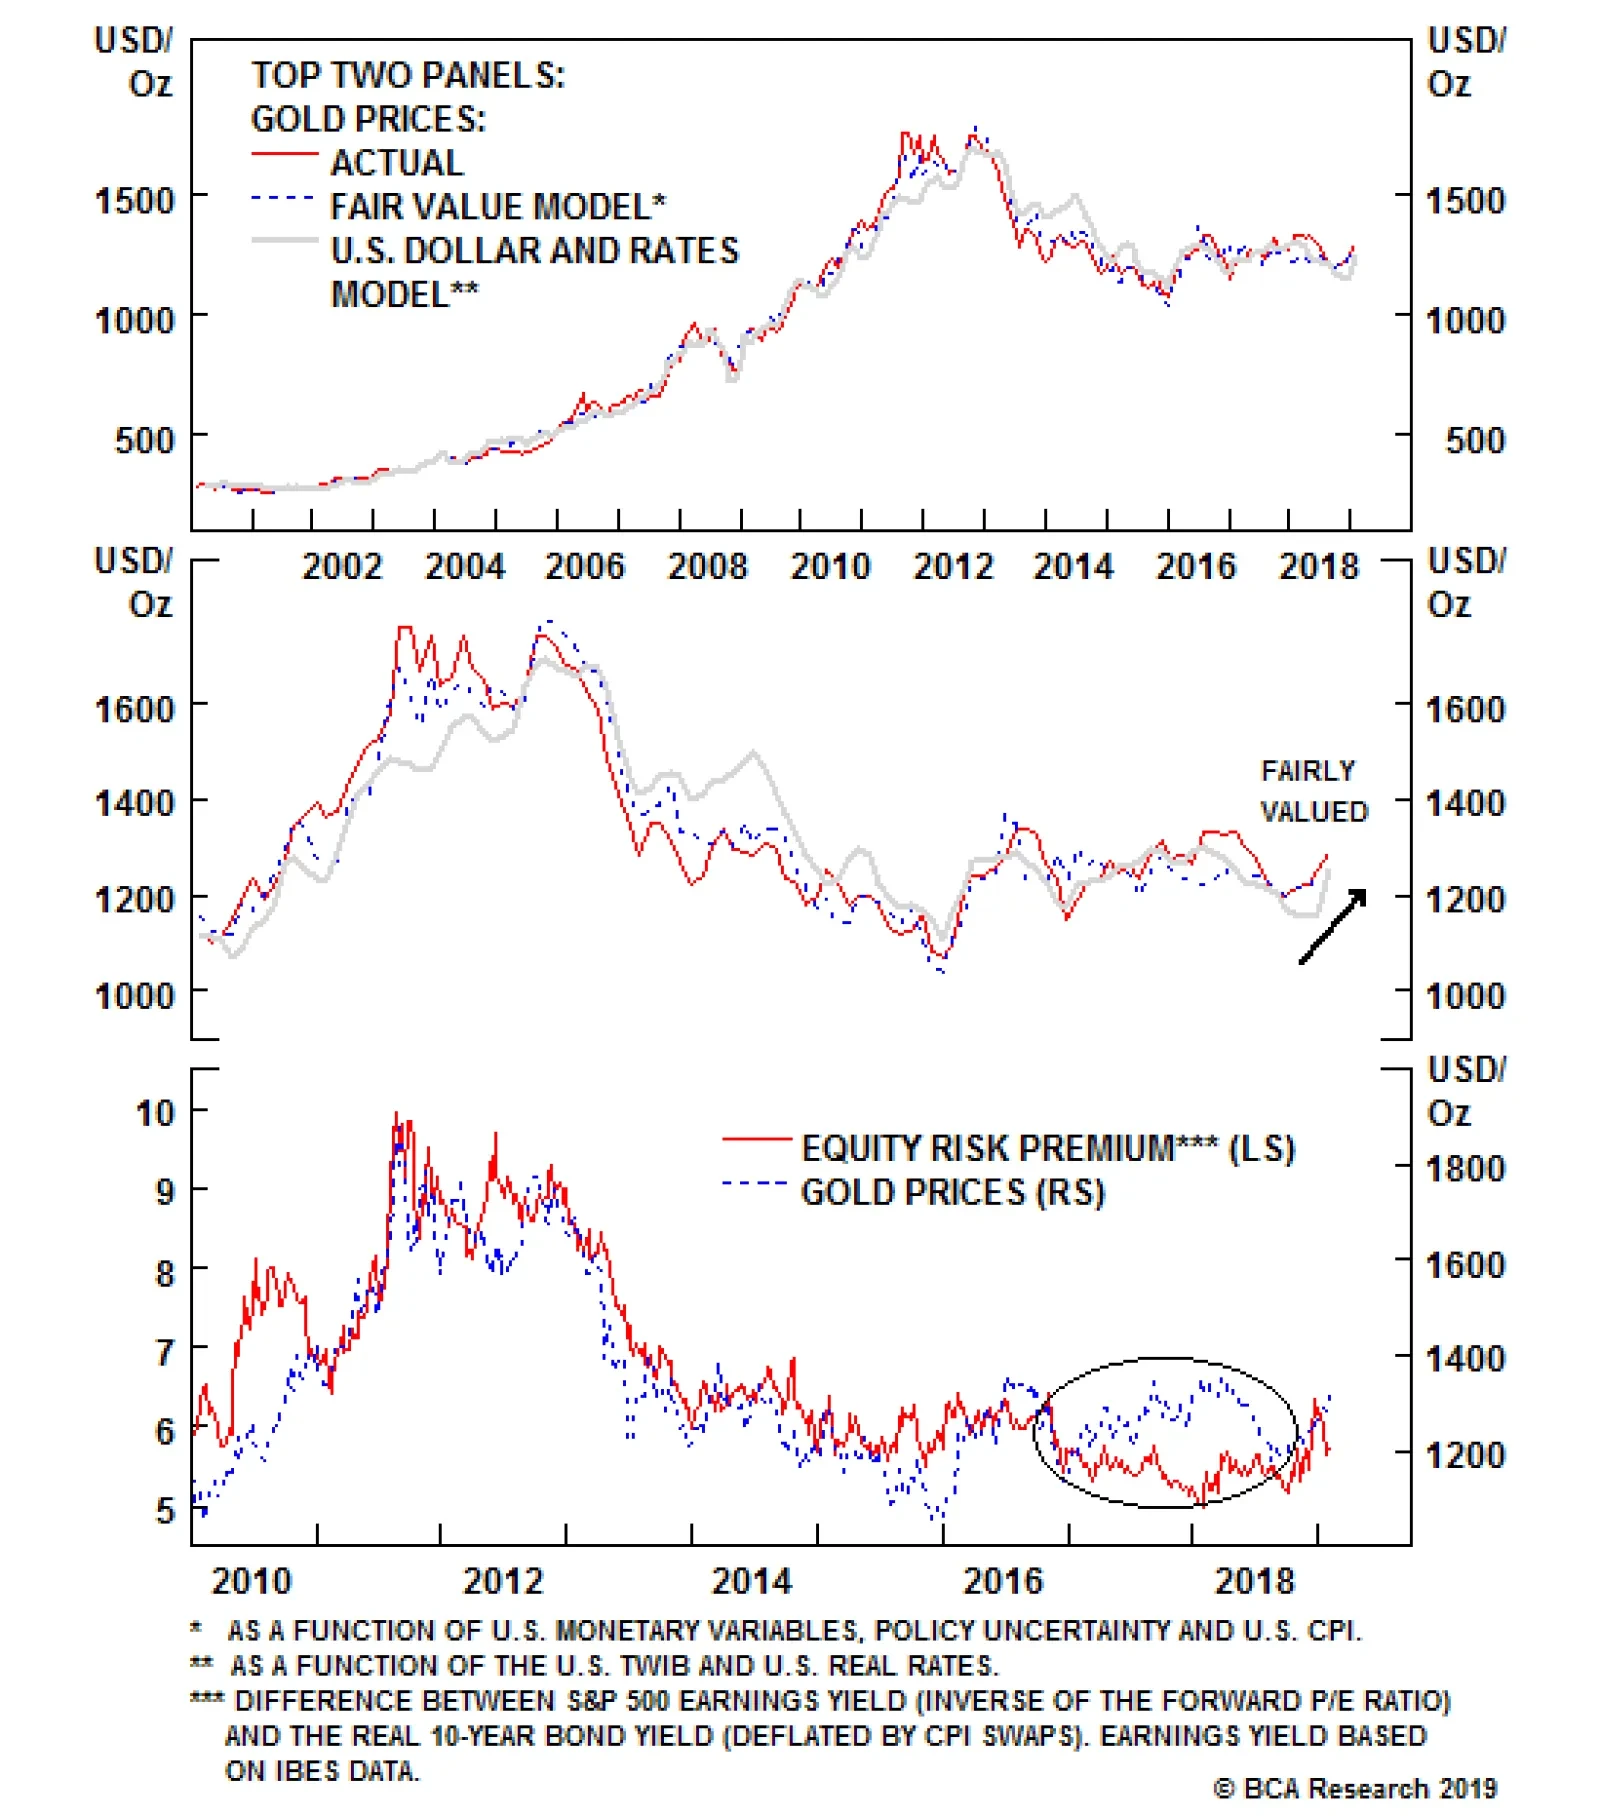
For most of 2018, the U.S. dollar and real rates were the primary determinants of investor sentiment and positioning toward gold. As these variables rose, investors’ sentiment and positioning turned overly bearish; this pushed our Gold Composite Indicator in…

Feature Half Way Back Since BCA went overweight global equities in late December, the MSCI ACWI index has rallied by 8% and the S&P 500 is back to only 8% off its September historical high. So far, this has been little more than a technical rally from the extreme oversold position in Q4. But with U.S. economic growth still resilient, earnings likely to grow healthily again this year (albeit more slowly than in 2018), and the valuation of risk assets (both equities and credit) no longer a headwind, we expect the rally to continue for some time, and so reiterate our overweight on equities. Recommendations
Monthly Portfolio Update
Monthly Portfolio Update
True, there have been some disappointments in U.S. data in recent weeks. In particular, the December manufacturing ISM fell sharply to 54.3 from 59.3, raising fears that the U.S. is starting to decelerate in line with other regions (Chart 1). But the ISM may have been affected by the government shutdown and, overall, U.S. data still look solid, with the Citigroup Economic Surprise Index beginning to rebound, and stronger than in other regions (Chart 2). The residential housing market, which was exhibiting signs of stress last year, with existing home sales -6.4% YoY in December, is showing the first signs of stabilization, helped by mortgage interest rates that are now 50 BPs off their recent peak (Chart 3). Chart 1How Worrying Is The U.S. Slowdown?
How Worrying Is The U.S. Slowdown?
How Worrying Is The U.S. Slowdown?
Chart 2U.S. Data Surprisingly Positive
U.S. Data Surprisingly Positive
U.S. Data Surprisingly Positive
Chart 3Housing Market Should Stabilize
Housing Market Should Stabilize
Housing Market Should Stabilize
In particular, the outlook for consumption looks healthy, with average hourly earnings growing at 3.3% YoY, consumer confidence close to an historic high, and the savings rate above 6%. Unsurprisingly, then, retail sales have boomed in recent months (Chart 4). Unless consumer confidence is dented by a repetition of the government shutdown or some other shock, consumption (68% of GDP, remember) should grow strongly this year. Add to this a residual positive impact of close to 0.5% of GDP coming from last year’s fiscal stimulus, and it is hard to imagine the U.S. going into recession over the next 12 months. Chart 4Consumption Booming
Consumption Booming
Consumption Booming
The Fed will probably go on hold for now, however, given the market jitters in Q4. We are likely back to a situation like that in 2015-2016, where the Fed Policy Feedback Loop becomes the key factor for markets (Chart 5). When financial conditions tighten, with stock prices falling and the dollar appreciating, the Fed turns more dovish. However, this triggers a rally in risk assets and loosens financial conditions, allowing the Fed to start hiking again. With the tightening in financial conditions over the past six months, the Fed is likely to err on the side of caution for now (Chart 6). However, if our macro view is correct – and as inflation starts to pick up again after April, partly due to the base effect – the Fed will want to continue withdrawing accommodation over the course of this year. The Fed Funds Rate, at around 2.4% is still two hikes below what the FOMC sees as the neutral level of interest rates (the 2.8% terminal rate in the FOMC dots). We see the Fed, therefore, raising rates in June and perhaps hiking two or even three times this year. By contrast, the futures market assigns only a 25% probability of even one rate hike this year, and is even pricing in a small probability of a cut.
Chart 5
Chart 6Tighter Conditions Mean More Cautious Fed
Tighter Conditions Mean More Cautious Fed
Tighter Conditions Mean More Cautious Fed
Clearly, there are plenty of risks to the scenario of growth continuing. But those in the hands of President Trump, especially the trade war with China and the fight over funding of the wall on the border with Mexico, we don’t see as being serious impediments. Trump is fully aware that he is unlikely to be reelected in November 2020 if the U.S. is in recession by then. Every incumbent U.S. president since World War Two who fought for reelection during a recession failed to be reelected (Chart 7). The view of BCA’s geopolitical strategists, therefore, is that the White House and Congressional Democrats will agree to concessions to end the shutdown before the end of the current three-week stop-gap period. Less likely, Trump will declare a national emergency that will cause much controversy but have little impact on the economy. Our strategists also argue that there is a 45% probability of trade negotiations with China producing a result (at least a short-term one the president can boast about) before the March 1 deadline, and a further 25% probability of the deadline being extended without further sanctions being imposed.1 Chart 7Trump Won't Be Reelected In A Recession
Trump Won't Be Reelected In A Recession
Trump Won't Be Reelected In A Recession
Equities: Analysts have become overly pessimistic about the earnings outlook for this year, cutting 2019 U.S. EPS growth to 7% (and only 2% YoY in Q1). Our top-down model (based on, admittedly optimistic, U.S. growth assumptions, but also headwinds from a stronger dollar) indicates 12% growth. If analysts are forced to revise up their numbers as better earnings come through, that should be a catalyst for further equity performance (Chart 8). We continue to prefer U.S. over European equities. The steady slowdown in European growth over the past 12 months has not yet bottomed, banks in Europe remain troubled, the earnings picture is less positive, and valuations relative to the U.S. are not especially attractive. We also remain underweight on EM equities: they may produce a positive return in a risk-on environment, but we see them underperforming DM as rising U.S. interest rates and a stronger USD put pressure on EM borrowers with excess foreign-currency debt. Chart 8Analysts Have Overdone Downward Revisions
Analysts Have Overdone Downward Revisions
Analysts Have Overdone Downward Revisions
Fixed Income: The recent fall in U.S. Treasury yields was mainly caused by the inflation expectation component, itself very sensitive (if rather illogically so) to the oil price (Chart 9). As the oil price recovers (see below), inflation picks up moderately, and the Fed hikes by more than the market expects, we see the 10-year Treasury yield rising to 3.5% during the course of the year. BCA’s fixed-income strategists recently raised their recommendation on global credit to overweight, given more attractive spreads and the likelihood that the Fed will be on hold for the next six months.2 Their recommendation is for 3-6 months, and the Fed restarting the hiking cycle, say in June, might terminate the positive story. We are following their lead, by raising both high-yield and investment-grade bonds to overweight within the (underweight) fixed-income asset class. That means we are neutral credit in the overall portfolio. We would warn, though, that this is a somewhat short-term call: we still prefer equities as a way to play the continuing risk-on rally. Given the high level of U.S. corporate leverage, and the over-owned nature of the credit market, this is likely to be an asset class that performs very poorly in the next recession (Chart 10). Chart 9Inflation Expectations Should Recover
Inflation Expectations Should Recover
Inflation Expectations Should Recover
Chart 10Corporate Leverage Is A Concern
Corporate Leverage Is A Concern
Corporate Leverage Is A Concern
Currencies: Currencies will continue to be driven by relative monetary policy. With the growth desynchronization between the U.S. and other DMs set to continue (to a degree), we see modest further USD appreciation this year. The Fed (as argued above) will probably hike more than the market expects. But, given slow European growth, the ECB is unlikely to be able to hike in Q4 this year, as it currently is guiding for and the futures market implies (Chart 11). We see the ECB reopening the Targeted Long-Term Repo Facility (TLTRO), which expires soon. Italy and Spain have been big borrowers from this facility, and bank loan growth is likely to slow as it ends (Chart 12). A renewed TLRTO would be seen as a dovish move. Tighter dollar liquidity conditions also point to a stronger USD. U.S. credit growth continues to accelerate (to 12% YoY – Chart 13) in an environment where the monetary policy has tightened: credit growth is outpacing U.S. money supply growth by 7%. Historically this has been negative for global growth (mainly because the deteriorating liquidity is a problem for EM dollar borrowers) and positive for the dollar (Chart 14).3 Chart 11Can ECB Really Hike In 2019?
Can ECB Really Hike In 2019?
Can ECB Really Hike In 2019?
Chart 12
Chart 13...U.S. Loan Growth Accelerating...
...U.S. Loan Growth Accelerating...
...U.S. Loan Growth Accelerating...
Chart 14... Which Will Tighten Liquidity Further
... Which Will Tighten Liquidity Further
... Which Will Tighten Liquidity Further
Commodities: The supply/demand situation for oil should improve over coming months. With Saudi Arabia and Russia committed to cut supply by 1.2 million barrels/day, U.S. shale production growth slowing given the low one-year forward price for WTI, Canada reducing production, and Venezuela on the verge of collapse (which alone could remove 700-800k b/d from the market), our energy strategists see the crude oil balance in deficit over the next four quarters (Chart 15). Given this, they forecast Brent crude rebounding to above $80 a barrel. Other commodity prices are mostly driven by Chinese demand. We see China continuing to slow, until the accumulated effects of its fiscal and mild monetary stimulus start to come through in H2 and stabilize growth. Our analysis suggests that China remains very disciplined about the size and nature of its stimulus: it is not turning on the liquidity taps as it did in early 2016. Bank loan growth has stabilized, but shadow banking activity continues to contract, as the authorities persist with their crackdown and their emphasis on deleveraging (Chart 16). Industrial commodities prices are therefore likely to weaken over the next six months. Chart 15Oil Balance In Deficit This Year
Oil Balance In Deficit This Year
Oil Balance In Deficit This Year
Chart 16China Sticking To Credit Crackdown
China Sticking To Credit Crackdown
China Sticking To Credit Crackdown
Garry Evans, Senior Vice President Global Asset Allocation garry@bcaresearch.com GAA Asset Allocation Footnotes 1 Please see Geopolitical Strategy Weekly Report, “So Donald Trump Cares About Stocks, Eh?”, dated 9 January 2019, available at gps.bcaresearch.com 2 Please see Global Fixed Income Strategy Weekly Report, “Enough With The Gloom: Upgrade Global Corporates On A Tactical Basis,” dated 15 January 2019, available at gfis.bcaresearch.com 3 For a detailed explanation, please see Foreign Exchange Strategy Weekly Report, “Global Liquidity Trends Support The Dollar, But…,” dated 25 January 2019, available at fes.bcaresearch.com
After rising for thousands of years, human intelligence has begun to decline in developed economies. This can be seen in falling IQ scores and a decline in math and science test scores. Environmental factors appear to account for the bulk of this decline, but no one knows what these factors are. If left unchecked, falling intelligence will severely undermine productivity growth. This could lead to lower equity multiples, larger budget deficits, and ultimately, much higher government bond yields. Technological advances, particularly in the genetic realm, promise to radically raise IQs. In a complete abandonment of its one-child policy, China will combine these controversial technologies with pro-natal measures in order to boost sagging birth rates. The coming Eugenic Wars will be one of the most important economic and geopolitical developments of the 21st century. Part 1: What The Tame Fox Says In 1959, a Soviet scientist named Dmitry Belyaev embarked on an ambitious experiment: to domesticate the silver fox. A geneticist by training, Belyaev wanted to replicate the process by which animals such as cats and dogs came to live side-by-side with humans. It was a risky endeavor. The Soviets had essentially banned the study of Mendelian genetics in favor of the blank slate ideology that is popular in progressive circles today. Belyaev persevered. Working under the guise of studying vulpine physiology, he selected foxes based on only one trait – tamability. Less than 10% of foxes made it to the subsequent generation, with the other 90% being sent off to fur farms. By the fourth generation, the changes were undeniable. Rather than fleeing humans, the foxes sought out their attention with no prompting whatsoever. They even wagged their tails and whined and whimpered like dogs do. The tame foxes also displayed physical changes. Their ears flopped over. Their snouts became shorter and their tails stood upright. "By intense selective breeding, we have compressed into a few decades an ancient process that originally unfolded over thousands of years," wrote Lyudmila Trut, who began as Belyaev’s assistant and took over the project when her boss died in 1985. Genetically Capitalist? Evolution can broadly proceed in two ways. The first way is through random mutations. This form of evolution, which scientists sometimes refer to as genetic drift, can take thousands of years to yield any discernable changes. The second way is through natural selection, a process that exploits existing variations in genetic traits. As the Russian fox experiment illustrates, evolution driven by selective pressures (either natural or artificial) can occur fairly quickly. Did selective pressures manifest themselves in human evolution in the lead up to the Industrial Revolution? Did humans, in some sense, domesticate themselves? In his book, A Farewell To Alms, economic historian Gregory Clark argued in the affirmative. Clark documented that members of skilled professions in Medieval England had twice as many surviving children as unskilled workers (Chart II-1). Indeed, the fledgling middle class of the time had even more surviving children than the aristocracy, who were often out fighting wars. As a result, the wages of craftsmen declined by a third relative to laborers between 1200 and 1800, implying that the supply of skilled labor was growing more quickly than the demand for skilled workers over this period. Chart II-1Richer Men Had More Surviving Children In Medieval England
The Most Important Trend In The World Has Reversed And Nobody Knows Why
The Most Important Trend In The World Has Reversed And Nobody Knows Why
In subsequent work, Clark and Neil Cummins argued that the spread of bourgeois values across pre-industrial England was more consistent with a model of genetic transmission than a cultural one (see Box II-1 for details). Similar developments occurred in other parts of the world. For example, in China, the gateway into the bureaucracy for a thousand years was the highly competitive imperial exam. Xi Song, Cameron Campbell, and James Lee showed that high-status men had more surviving children during the eighteenth- and nineteenth-centuries (Chart II-2).1 Chart II-2High-Status Men In China Produced More Descendants In The 18th And 19th Centuries
The Most Important Trend In The World Has Reversed And Nobody Knows Why
The Most Important Trend In The World Has Reversed And Nobody Knows Why
The 10,000 Year Explosion Stephen Jay Gould famously said that “There’s been no biological change in humans in 40,000 or 50,000 years. Everything we call culture and civilization we’ve built with the same body and brain.” Gould was wrong. Data from the International HapMap Project show that human evolution accelerated by 100-fold starting around 10,000 years ago (Chart II-3). Chart II-3Human Evolution Has Accelerated 100-Fold Over The Past 10,000 Years
The Most Important Trend In The World Has Reversed And Nobody Knows Why
The Most Important Trend In The World Has Reversed And Nobody Knows Why
In their book The 10,000 Year Explosion: How Civilization Accelerated Human Evolution, Gregory Cochran and the late Henry Harpending explained why evolution sped up so rapidly.2 The advent of agriculture led to a surge in population levels. This, in turn, increased the absolute number of potentially beneficial genetic mutations that could be subject to selection effects. Farming and the rise of city states also completely reshaped the environment in which people lived. Basic biology teaches us that environmental dislocations of this kind tend to generate selective pressures that cause evolution to accelerate. John Hawks, professor of anthropology and genetics at the University of Wisconsin-Madison, put it best: “We are more different genetically from people living 5,000 years ago than they were different from Neanderthals.” Many of the changes to our genomes relate to diet and diseases. The various genetic resistances that people have built up to malaria are all less than 10,000 years old. Mutations to the LCT gene, which confers lactose tolerance into adulthood, occurred independently in three different geographical locations: one in East Asia, one in the Middle East, and one in Africa. The Middle Eastern variant was probably responsible for the rapid enlargement of the Indo-European language group, which now stretches from India to Ireland. The African variant likely facilitated the Bantu expansion, which started near the present-day border of Nigeria and Cameroon, and then spread out across almost all of sub-Saharan Africa. Evolution Of The Human Brain About half of the genes in the human genome regulate some aspect of brain function. Given the rapid acceleration in evolution, it would be rather surprising if our own brains had not been affected. And indeed, there is plenty of evidence that they were. The frontal lobe of the brain has increased in size over the past 10,000 years. This is the part of the brain that regulates such things as language, memory, and long-term planning. Testosterone levels have also declined. That may explain the steady reduction in violent crime rates (Chart II-4). Chart II-4Long-Term Decline In Homicide Rates
The Most Important Trend In The World Has Reversed And Nobody Knows Why
The Most Important Trend In The World Has Reversed And Nobody Knows Why
We know that certain genes that are associated with higher intelligence have been under recent selective pressure. For example, the gene that leads to torsion dystonia – a debilitating movement disorder – appears to have increased in frequency. Why would a gene that causes a known disease become more widespread? The answer is that individuals who have this particular mutation tend to have IQs that are around 10-to 20-points above the population average. Why IQ Matters IQ has a long and contentious history. Yet, despite numerous efforts to jettison the concept, it has endured for one simple reason: It has more predictive power than virtually anything else in the psychological realm. A simple 30-minute IQ test can help predict future educational attainment, job performance, income, health, criminality, and fertility choices (Table II-1 and Chart II-5). IQ even predicts trader performance!3 Table II-1What IQ Predicts (Results From Meta-Analyses)
The Most Important Trend In The World Has Reversed And Nobody Knows Why
The Most Important Trend In The World Has Reversed And Nobody Knows Why
Chart II-5IQ Tests Don’t Just Measure How Well You Can Do On An IQ Test
The Most Important Trend In The World Has Reversed And Nobody Knows Why
The Most Important Trend In The World Has Reversed And Nobody Knows Why
Like most physiological traits, IQ is highly heritable.4 The genetic contribution to IQ increases from 20% in early childhood to as high as 80% by one’s late teens and remains at that level well into adulthood.5 This makes IQ almost as heritable as height (Chart II-6). Chart II-6The Inheritance You Cannot Renounce
The Most Important Trend In The World Has Reversed And Nobody Knows Why
The Most Important Trend In The World Has Reversed And Nobody Knows Why
Although there is a great deal of variation among individuals, on average, more intelligent people earn higher incomes (Chart II-7). If the same relationship existed in the pre-industrial era, as seems likely, then human intelligence probably increased in a way that facilitated the economic explosion that we associate with the Industrial Revolution. The stunning implication is that the emergence of the modern era was a question of “when, not if.” Chart II-7IQ Tends To Be Positively Correlated With Income And Wealth
The Most Important Trend In The World Has Reversed And Nobody Knows Why
The Most Important Trend In The World Has Reversed And Nobody Knows Why
Part 2: The Flynn Effect By the late-19th century, it had become clear that the rich were no longer having as many children as the poor. This realization, together with the growing popularity of Darwin’s theories, helped galvanize the eugenics movement. Contrary to popular belief, this movement was not a product of the far-right. In fact, the most vocal proponents of eugenics were among the progressive left. John Maynard Keynes, for example, served as the Director of the British Eugenics Society between 1937 and 1944. Yet, a funny thing happened on the road to idiocracy: The concerns of eugenicists did not come to pass. Rather than becoming dimmer, people became smarter. This phenomenon is now known as the Flynn Effect, named after James Flynn, a psychologist who was among the first to document it. Chart II-8 shows the evolution of IQ scores in a sample of countries between 1940 and 1990. The average country recorded IQ gains of three points per decade over this period, a remarkably large increase over such a relatively short period of time. Chart II-8The Flynn Effect: It Was Nice While It Lasted
The Most Important Trend In The World Has Reversed And Nobody Knows Why
The Most Important Trend In The World Has Reversed And Nobody Knows Why
Explaining The Flynn Effect The Flynn Effect must have been entirely driven by environmental factors since genetic factors – namely the tendency of less-educated people to have more children, and to have them at an earlier age – would have reduced average IQs over the past two hundred years. But how could environmental factors have played the dominant role in light of the strong role of genes discussed above? The answer was proposed by geneticist Richard Lewontin in the 1970s. Lewontin suggested imagining a genetically-diverse sack of seed corn randomly distributed between two large identical fields. One field had fertilizer added to it while the other did not. Genetic variation would explain all of the differences in the height of corn stalks within each field, while environmental factors (the addition of fertilizer) would explain all of the difference in the average height of corn stalks between the two fields. This logic explains why genes can account for the bulk of the variation in IQs within any demographic group, while environmental effects may explain most of the variation across groups, as well as why average scores have changed over time. And what environmental effects are these? The truth is that no one really knows. Plenty of theories have been advanced, but so far there is still little consensus on the matter. Bigger, Healthier Brains It has long been known that learning increases the amount of grey matter in the brain. For example, a recent study showed that the hippocampi of London taxi drivers tend to be larger due to the need for drivers to memorize and navigate complex routes.6 The emergence of modern societies likely kicked off a virtuous circle where the need to solve increasingly complex tasks forced people to hone their learning skills, leading to higher IQs and further technological progress. The introduction of universal primary education amplified this virtuous circle. Better health undoubtedly helped as well. Early childhood diseases reduce IQ by diverting the body’s resources away from mental development towards fighting off infections. There is a strong correlation between measured IQ and disease burden across countries (Chart II-9). A number of studies have documented a strong relationship between the timing of malaria eradication in the U.S. and other parts of the world and subsequent observed gains in childhood IQs.7 Chart II-9IQ And Disease Burden
The Most Important Trend In The World Has Reversed And Nobody Knows Why
The Most Important Trend In The World Has Reversed And Nobody Knows Why
Brain size and IQ are positively correlated. Forensic evidence from the U.S. suggests that the average volume of adult human skulls has increased by 7% since the late 1800s, or roughly the size of a tennis ball.8 Part 3: The End Of A 10,000 Year Trend The problem with environmental effects is that they eventually run into diminishing returns. This appears to have happened with the Flynn Effect. In fact, not only does the recent evidence suggest that the Flynn Effect has ended, but the data suggest that IQs are starting to decline. Chart II-10 shows that average math and science test scores fell in the OECD’s Program For International Scholastic Achievement (PISA) between 2009 and 2015, the latest year of the examination. The drop in math and science test scores has been mirrored in falling IQ scores. Flynn observed a decade ago that IQs of British teenagers were slipping.9 Similar results have been documented in France, the Netherlands, Germany, Denmark, and most recently, Norway. Chart II-10Math And Science Skills Are Slipping In The OECD
The Most Important Trend In The World Has Reversed And Nobody Knows Why
The Most Important Trend In The World Has Reversed And Nobody Knows Why
The Norwegian results, published last year, are particularly noteworthy.10 Bernt Bratsberg and Ole Rogeberg examined three-decades worth of data on IQ tests of Norwegian military conscripts. Military duty has been mandatory for almost all men in Norway since 1814, which means that the study’s authors were able to collect comprehensive data on most Norwegian men and their fathers. Their paper clearly shows that IQ peaked with the generation born in the mid-1970s and declined by about five points, or one-third of a standard deviation, for the one born in 1990 (Chart II-11). For the first time in recorded history, Norwegian kids today are not scoring as well as their parents. Chart II-11Norwegian IQs Have Been Falling For Those Born Since The Mid-1970s
The Most Important Trend In The World Has Reversed And Nobody Knows Why
The Most Important Trend In The World Has Reversed And Nobody Knows Why
A Mystery What caused the sudden reversal of the Flynn Effect in Norway and most other developed economies? Nobody knows. We can, however, offer three possible theories: New Technologies For much of human history, rising intelligence and technological innovation were complementary processes, meaning that the smartest people were the ones who could best exploit the new technologies that were coming their way. Moreover, as noted above, even those who were less gifted benefited from the mental stimulation that a technologically advanced society provided. It remains to be seen how future technological advances such as generalized AI will affect human intelligence, but recent technological advances seem to have had a dumbing down effect.11 For example, the GPS has obviated the need for people to navigate unfamiliar locations, thus blunting the development of their visuospatial skills. Modern word processors have made spelling skills less important. Having all the information in the world just a click away is a wonderful thing, but it has reduced the need for our brains to retain and codify what we learn. Meanwhile, the constant bombardment of information to which we are subject has made it difficult to concentrate on anything for long. How many youth today can read a report of this length without checking their Facebook feed multiple times? My guess is not many. Diminishing Returns To Education The ability to take young bright minds, who would have otherwise spent their lives doing menial labor, and provide them with an education was probably the greatest tailwind to growth that the 20th century enjoyed. There is undoubtedly still scope to continue this process, but the low-hanging fruits have been picked. Educational attainment has slowed dramatically in most of the world (Chart II-12). Economist James Heckman estimates that U.S. high-school graduation rates, properly measured, peaked over 40 years ago.12 Chart II-12The Contribution To Economic Growth From Rising Human Capital Is Falling
The Most Important Trend In The World Has Reversed And Nobody Knows Why
The Most Important Trend In The World Has Reversed And Nobody Knows Why
Despite billions of dollars spent, efforts to improve school performance have generally fallen flat. A recent high-level report by the U.S. Department of Education concluded that “The panel did not find any empirical studies that reached the rigor necessary to determine that specific turnaround practices produce significantly better academic outcomes.”13 This gets to a point that most parents already know, which is that when people talk about “bad schools," they are really talking about “bad students.” Deteriorating Health Better health probably contributed to the Flynn Effect. But is it possible to have too much of a good thing? More calories are welcome when people are starving, but today’s calorie-rich, nutrient-poor diets have led to a surge in obesity rates. A clean environment reduces the spread of germs, but it also makes children hypersensitive to foreign substances. Following German reunification, researchers observed that allergies were much more common among West German children than their Eastern peers, presumably because of the West’s more salubrious environment.14 All sorts of weird and concerning physiological changes are occurring. Sperm counts have fallen by nearly 60% since the early 1970s.15 Testosterone levels in young men are dropping. Among girls, the age of first menarche has declined by two years over the past century.16 Are chemical agents in the environment responsible? If they are, what impact are they having on cognitive development? Nobody knows. Reported mental illness is also on the rise. The share of U.S. teenagers with a reported major depressive episode over the prior year surged by over 60% between 2010 and 2017 (Chart II-13). The fraction of young adults that made suicide plans nearly doubled.17 More than 20% of U.S. women over the age of 40 are on antidepressants.18 Five percent of U.S. children are receiving ADHD medication.19 Chart II-13A Disturbing Deterioration In Mental Health
The Most Important Trend In The World Has Reversed And Nobody Knows Why
The Most Important Trend In The World Has Reversed And Nobody Knows Why
Implications For Economic Growth And Asset Markets So far, the reversal of the Flynn Effect has been largely confined to the developed economies. Test scores are still rising in the developing world, albeit from fairly low levels. For example, two recent studies have documented significant IQ gains in Kenya and Brazil.20 In the poorest countries, opportunities for improving health abound. Even small steps such as fortifying salt with iodine (which costs about five cents per person per year) have been shown to boost IQ by nearly one standard deviation.21 Measures to reduce inbreeding are also likely to boost IQ scores.22 Yet, we should not underestimate the importance of falling cognitive skills in developed economies. Chart II-14 shows that there is a clear positive correlation between student score on math and science and per capita incomes. Chart II-14Positive Correlation Between Student Scores On Math And Science And Per Capita Income
The Most Important Trend In The World Has Reversed And Nobody Knows Why
The Most Important Trend In The World Has Reversed And Nobody Knows Why
Most technological innovation still takes place in developed economies. There is an extremely tight relationship between visuospatial IQ and the likelihood of becoming an inventor (Chart II-15). Since IQ is distributed along a bell curve, a 0.1 standard deviation drop in IQs across the entire distribution will result in an 8% decline in the share of people with IQs over 100, a 14% decline in those with IQs over 115, and a 21% decline in those with an IQ over 130 (by convention, each standard deviation on an IQ test is worth 15 points). Chart II-15Having A Compass In Your Head Makes You A Better Inventor
The Most Important Trend In The World Has Reversed And Nobody Knows Why
The Most Important Trend In The World Has Reversed And Nobody Knows Why
Falling IQs could result in slower productivity growth, which could further strain fiscal balances. Lower IQs are also associated with decreased future orientation.23 People who live for the moment tend to save less. A decline in savings would push up real rates, leading to less capital accumulation. History suggests that a deceleration in productivity growth and higher real rates will put downward pressure on equity multiples (Chart II-16). Chart II-16Equity Multiples Tend To Fall When Real Rates Rise And Productivity Growth Declines
The Most Important Trend In The World Has Reversed And Nobody Knows Why
The Most Important Trend In The World Has Reversed And Nobody Knows Why
Part 4: Generation E For 200 years, the environmentally-driven Flynn Effect disguised the underlying genetically-driven decline in IQs that began not long after the dawn of the Industrial Revolution. Flynn has acknowledged this himself, noting at the 2017 International Society For Intelligence Research Conference that “I have no doubt that there has been some deterioration of genetic quality for intelligence since the late Victorian times.”24 Now that the Flynn Effect has reversed, both genes and the environment are working together to reduce cognitive abilities in developed economies. This means that the most important trend in the world – a trend that allowed the human population to increase during the Malthusian era and later allowed output-per-worker to soar following the Industrial Revolution – has broken down. Yet, there may be another twist in the story – one that began just a few months ago: the first members of Generation E were born. E Is For Edited ... Or Eugenics Lulu and Nana will be like most other children, but with one key difference: They will be the first humans ever to have their genomes edited through a procedure know as CRISPR-Cas9. Rogue Chinese scientist He Jiankui deactivated their CCR5 gene, which the HIV virus uses as a gateway into the body. His actions were rightfully condemned around the world for endangering the twins’ health by using a procedure that has not yet been fully vetted in animal studies, let alone in human trials (Lulu and Nana’s father is HIV+ but it is debatable whether the children were at an elevated risk of infection). He Jiankui remains under house arrest at the university where he worked. But whatever his fate, the dam has been broken. For better or for worse, the era of personal eugenics has arrived. The Return Of The Silver Fox It is easier to delete a gene than to add one. It is even more difficult to swap out a large number of genes in a way that achieves a predictable outcome. Thus, the successful manipulation of highly polygenic traits such as intelligence — traits that are linked to hundreds of different genes – may still be decades away.25 Predicting a trait is much simpler than modifying it, however. The cost of sequencing a human genome has fallen by more than 99% since 2001 (Chart II-17). Start-up company Genomic Prediction has already developed a test for fertilized embryos for IVF users that predicts height within a few centimetres and IQ with a correlation of 0.3-to-0.4, roughly as accurate as standardized tests such as the SAT or ACT.26 Other companies are following suit.27 Chart II-17Sequencing Costs Have Plummeted
The Most Important Trend In The World Has Reversed And Nobody Knows Why
The Most Important Trend In The World Has Reversed And Nobody Knows Why
Some will recoil in horror at the prospect of selecting prospective children in this manner. They will argue that such technologies, beyond being simply immoral, will widen social inequality between those who can afford them and those who cannot. Others will counter that screening embryos for certain traits is not that dissimilar to what people already do with prospective romantic partners. They will also point out that mass usage of these technologies will drive down prices to the point that even poor people will be able to access them, thus giving low IQ parents the chance to have high IQ kids. They might also note that such technologies may be the only way to reverse the ongoing accumulation of deleterious mutations within the human germline that has been the unintended by-product of the proliferation of life-saving medicines.28 We will not wade into this thorny debate, other than to note that there will be huge incentives for people to avail themselves of these technologies. The Coming Eugenic Wars And not just individuals either – governments too. While the initial impact of eugenic technologies will be small, the effects will compound over time. Carl Shulman and Nick Bostrom estimate that genetic screening could boost average IQs by up to 65 points in five generations (Table II-2). Table II-2A Poisoned Chalice? Genetic Screening Can Raise IQ
The Most Important Trend In The World Has Reversed And Nobody Knows Why
The Most Important Trend In The World Has Reversed And Nobody Knows Why
China has been investing heavily in genetic technologies. As Geoffrey Miller has argued, China’s infatuation with eugenics spans into the modern day.29 Like most other countries, fertility in China is negatively correlated with IQ. Mingrui Wang, John Fuerst, and Jianjun Ren estimate that China is currently losing nearly one-third of a point in generalized intelligence per decade, with the loss having accelerated rapidly between the 1960s and mid-1980s.30 The decline in the genetic component of Chinese IQs is coming at a time when the population itself is about to shrink. According to the UN’s baseline forecast, China will lose 450 million working-age people by the end of the century (Chart II-18). Meanwhile, the country is saddled with debt, the result of an economic model that has, for decades, recycled copious household savings into debt-financed fixed-investment spending in an effort to shore up domestic demand. Chart II-18China’s Labor Pool Is Shrinking
The Most Important Trend In The World Has Reversed And Nobody Knows Why
The Most Important Trend In The World Has Reversed And Nobody Knows Why
The authorities may be tempted to tackle all three problems simultaneously by adopting generous pro-natal measures – call it the “at least one-child policy”– which increasingly harnesses emerging eugenic technologies. The resulting baby boom would strengthen domestic demand, thus making the economy less dependent on exports, while ensuring China’s long-term geopolitical viability. The Eugenic Wars are coming, and they will be unlike anything the world has seen before. BOX II-1 The Diffusion Of Bourgeois Values: Culture Or Genes? Higher-income people had more surviving children in the centuries leading up to the Industrial Revolution. Real per capita income was broadly stable during this period. This implies that there must have been downward social mobility, with sons, on average, being less wealthy than their fathers. This downward mobility, in turn, spread the characteristics of higher-income people across the broad swathe of society. What were these characteristics? Cultural values that emphasized thrift, diligence, and literacy were undoubtedly part of what was passed on to future generations. But surprisingly, it also appears that genetic transmission played an important, and perhaps pivotal, role. Models of genetic transmission make very concrete predictions about the correlations in economic status that one would expect to see among relatives. Biological brothers share 50% of their genes, as do fathers and sons. Likewise, first cousins share 25% of their genes, the same as grandfathers and sons. These facts yield two testable predictions: The first is that the correlation coefficient on status measures such as wealth, occupation, and education should be the same for relatives that share the same fraction of genes such as sibling pairs and father-son pairs. Box Chart II-1 shows that this is borne out by the data. The second prediction is that the correlation between status and genetic distance should follow a linear trend so that, for example, the correlation in wealth among brothers is twice that of first cousins and four times that of second cousins. Box Chart II-2 shows that this is also borne out by the data. BOX CHART II-1Comparative Father-Son And Brother Correlations By Status
The Most Important Trend In The World Has Reversed And Nobody Knows Why
The Most Important Trend In The World Has Reversed And Nobody Knows Why
BOX CHART II-2Wealth Correlations By Genetic Distance
The Most Important Trend In The World Has Reversed And Nobody Knows Why
The Most Important Trend In The World Has Reversed And Nobody Knows Why
Other evidence supports the importance of genes in the transmission of status across generations. The correlation in measures such as wealth, education, and occupation is much higher among identical twins than fraternal twins. Adopted children turn out to be more similar to their biological parents on these measures when they reach adulthood than their adopted parents, even when the children have never met their biological parents. The parent-child correlation also remains the same regardless of family size, suggesting that spreading the same resources over more children may not harm life outcomes to any discernible degree, at least on the measures listed above. Peter Berezin Chief Global Strategist Global Investment Strategy Footnotes 4 Xi Song, Cameron Campbell, and James Lee, "Descent Line Growth and Extinction From A Multigenerational Perspective, Extended Abstract," American Sociological Review 80:3, (April 21, 2015): 574-602. 5 Gregory Cochran and Henry Harpending, "The 10,000 Year Explosion: How Civilization Accelerated Human Evolution," Basic Books, (2009). 6 Mark Grinblatt, Matti Keloharju, and Juhani T. Linnainmaa, “IQ, Trading Behavior, and Performance,” Journal of Financial Economics, 104:2, (May 2012): 339-362. 7 Thomas Bouchard, "Genetic Influence On Human Psychological Traits - A Survey," Current Directions in Psychological Science 13:4, (August 2004): 148-151. 8 The tendency for the genetic contribution to IQ to increase until early adulthood and then to remain at high levels until old age is known as the Wilson Effect. There is no consensus on what causes it, but it probably reflects a number of factors: 1) It may take some children longer than normal to reach full intellectual maturity. Testing their IQs at a young age will result in scores that are lower than those expected based on their parents’ IQs. The opposite is true for children whose IQs increase relatively quickly in young age, but possibly top out earlier; 2) Environmental effects are probably more important in young age when a child’s brain is still quite malleable; 3) Self-reinforcing gene-environment interactions tend to increase with age. Children do not have much control over their environment, but as they get older, they will seek out activities that are more in keeping with their genetic predispositions. For example, a studious child may pursue a career that reinforces their love of learning. 9 "Cache Cab: Taxi Drivers' Brains Grow to Navigate London's Streets," Scientific American, (December 2011). 10 Atheendar Venkataramani, "Early Life Exposure to Malaria and Cognition in Adulthood: Evidence from Mexico," Journal of Health Economics 31:5, (July 2012): 767-780; Hoyt Bleakley, "Health, Human Capital and Development," Annual Review of Economics 2, (March 2010): 283-310; Hoyt Bleakley, "Malaria Eradication in the Americas: A Retrospective Analysis of Childhood Exposure," American Economic Journal: Applied Economics 2, (April 2010): 1-45. 11 "Anthropologists Find American Heads Are Getting Larger," ScienceDaily, (May 2012). 12 "British Teenagers Have Lower IQs Than Their Counterparts Did 30 Years Ago," The Telegraph, (February 2009). 13 Bernt Bratsberg and Ole Rogeberg, "Flynn Effect And Its Reversal Are Both Environmentally Caused," Proceedings of the National Academy of Sciences 115:26, (June 2018): 6674-6678. 14 On the face of it, artificial intelligence would appear to be a substitute for human intelligence. Many applications of AI would undoubtedly have this feature, especially those that allow computers to perform complex mental tasks that humans now must do. However, there are several ways that AI may eventually come to complement human intelligence. First, and most obviously, AI could be used to augment human capabilities either directly by hardwiring it into our brains, or indirectly through the development of drugs or genetic techniques which improve cognition. Second, looking further out, the benefits of highly intelligent AI systems would be limited if humans did not possess the requisite intelligence to understand certain concepts that are currently beyond our mental reach. No matter how well intentioned, trying to explain string theory to a mouse is not going to succeed. There are probably a multitude of ideas that AI could reveal that we simply cannot comprehend at current levels of human intelligence. 15 James Heckman and Paul La Fontaine, "The American High School Graduation Rate: Trends and Levels," The Review of Economics and Statistics 92:2, (May 2010): 244–262. 16 "Turning Around Chronically Low-Performing Schools," The Institute of Education Sciences (IES), (May 2008). 17 E. von Mutius, F.D. Martinez, C. Fritzsch, T. Nicolai, G. Roell, and H. H. Thiemann, "Prevalence Of Asthma And Atopy In Two Areas Of West Germany And East Germany," American Journal of Respiratory and Critical Care Medicine 149:2, (February 1994): 358-64. 18 "Sperm Counts In The West Plunge By 60% In 40 Years As ‘Modern Life’ Damages Men’s Health," Independent, (July 2017). 19 Kaspar Sørensen, Annette Mouritsen, Lise Aksglaede, Casper P. Hagen, Signe Sloth Mogensen, and Anders Juul, "Recent Secular Trends in Pubertal Timing: Implications for Evaluation and Diagnosis of Precocious Puberty," Hormone Research in Paediatrics 77:3, (May 2012): 137-145. 20 “Results from the 2017 National Survey On Drug Use And Health: Detailed Tables,” Substance Abuse and Mental Health Services Administration, Center for Behavioral Health Statistics and Quality, Rockville (Maryland), (September, 2018). 21 Laura A. Pratt, Debra J. Brody, and Qiuping Gu, "Antidepressant Use Among Persons Aged 12 and Over: United States, 2011–2014," NCHS Data Brief No. 283, Centers for Disease Control and Prevention, (August 2017). 22 Some, but not all, of the increase in reported rates of mental illness may be due to more aggressive diagnosis by health practitioners. For example, a recent study revealed that children born in August were 30% more likely to receive an ADHD diagnosis than those born in September, simply because they were less mature compared to other kids in the first few years of elementary school. See: Timothy J. Layton, Michael L. Barnett, Tanner R. Hicks, and Anupam B. Jena, "Attention Deficit-Hyperactivity Disorder and Month of School Enrollment," New England Journal of Medicine 379:22, (November 2018): 2122-2130. 23 Tamara C. Daley, Shannon E. Whaley, Marian D. Sigman, Michael P. Espinosa, and Charlotte Neumann, "IQ On The Rise: The Flynn Effect In Rural Kenyan Children," Psychological Science 14:3, (June 2003): 215-9; Jakob Pietschnig and Martin Voracek, "One Century of Global IQ Gains: A Formal Meta-Analysis of the Flynn Effect (1909-2013)," Perspectives on Psychological Science 10:3, (May 2015): 282-306. 24 N. Bleichrodt and M. P. Born, “Meta-Analysis of Research on Iodine and Its Relationship to Cognitive Development,” In: ed. J. B. Stanbury, "The Damaged Brain of Iodine Deficiency," Cognizant Communication Corporation, New York, (1994): 195-200; "Iodine status worldwide: WHO Global Database on Iodine Deficiency," World Health Organization, Geneva, (2004). 25 Mohd Fareed and Mohammad Afzal, "Estimating the Inbreeding Depression on Cognitive Behavior: A Population Based Study of Child Cohort," PLOS ONE 9:12, (October 2015): e109585. 26 H. de Wit, J. D. Flory, A. Acheson, M. McCloskey, and S. B. Manuck, "IQ And Nonplanning Impulsivity Are Independently Associated With Delay Discounting In Middle-Aged Adults," Personality and Individual Differences 42:1, (January 2007): 111-121; W. Mischel and R. Metzner, "Preference For Delayed Reward As A Function Of Age, Intelligence, And Length Of Delay Interval," Journal of Abnormal and Social Psychology 64:6, (July 1962): 425-31. 27 James Flynn, “IQ decline and Piaget: Does the rot start at the top?” Lifetime Achievement Award Address, 18th Annual meeting of ISIR, (July 2017). 28 For a good discussion of these issues, please see Richard J. Haier, “The Neuroscience of Intelligence,” Cambridge Fundamentals of Neuroscience in Psychology, (December 2016). 29 "The Future of In-Vitro Fertilization and Gene Editing," Psychology Today, (December 2018). 30 "DNA Tests For IQ Are Coming, But It Might Not Be Smart To Take One," MIT Technology Review, (April 2018). 31 Michael Lynch, "Rate, Molecular Spectrum, And Consequences Of Human Mutation," Proceedings of the National Academy of Sciences 107:3, (January 2010): 961-968. 32 Geoffrey Miller, "What *Should* We Be Worried About?" Edge, (2013). 33 Mingrui Wang, John Fuerst, and Jianjun Ren, "Evidence Of Dysgenic Fertility In China," Intelligence 57, (April 2016): 15-24.
Highlights Global equity markets have managed to recoup some of last year’s plunge since we upgraded stocks to overweight in late December. The equity rally has been tentative, however, and so far feels more like a technical bounce from oversold levels than a resumption of the bull market. One driving factor behind last year’s market swoon was that policy uncertainty spiked at a time when the last pillar of global growth, the U.S., was showing signs of cracking. Investors thus welcomed the Fed’s signal that it would pause in March. Nonetheless, shrinkage in the Fed’s balance sheet is proving to be troublesome. Quantitative tightening does not necessarily imply permanently higher risk premia, but it will be a source of volatility. There are hopeful but tentative signs that a U.S. slowdown is not the precursor to a recession. The hit to GDP from the U.S. government shutdown will be reversed next quarter. The FOMC has also signaled that policymakers are attuned to the economic risks associated with tightening financial conditions, and that the calm inflation backdrop provides room to maneuver. The FOMC will stand pat in March, but should restart rate hikes in June as the economic soft patch ends. We still see only a modest risk of a U.S. recession this year. In contrast, our outlook for growth outside the U.S. remains downbeat for at least the first half of the year. Among the advanced economies, Japan and Europe are being the most affected by the Chinese economic slowdown and global trade tensions. This means that monetary policy divergence will continue to be a tailwind for the dollar. China continues to stimulate at the margin, but efforts so far have been insufficient to put a floor under growth. The contraction in Chinese exports has just begun. It is still too early to upgrade EM assets or base metals. Despite the cloud still surrounding Brexit, sterling is beginning to look attractive as a long-term punt. Our decision to upgrade corporate bonds to overweight this month, similar to our reasoning for upgrading equities in December, is based on improved value and a sense that investor pessimism had become excessive. Just as the selloff in risk assets was overdone, so too was the rally in government bonds. It is highly unlikely that the Fed is done tightening, as is currently discounted in the money market curve. A resumption of Fed rate hikes around mid-year means that the 10-year Treasury yield will move back above 3% by year end. Feature Global equity markets have managed to recoup some of last year’s plunge since we upgraded the asset class back to overweight in the latter half of December. A decline in the VIX and high-yield bond spreads are also positive signs that global risk appetite is recovering, following an overdone investor ‘panic attack’ last quarter. The equity rally has been tentative, however, and so far feels more like a simple technical bounce from oversold levels than a resumption of the bull market. One problem is that policy uncertainty has spiked at a time when the last pillar of global growth, the U.S., is showing signs of cracking (Chart I-1). Investors are skittish while they await a clear de-escalation of U.S./China trade tensions, an end to the U.S. economic soft patch, an end to the U.S. government shutdown, and signs that global growth is bottoming (especially in China). There has only been some modestly positive news on a couple of these issues. Chart I-1Policy Uncertainty Has Spiked
Policy Uncertainty Has Spiked Watch Policy Uncertainty
Policy Uncertainty Has Spiked Watch Policy Uncertainty
Another factor that appeared to play a role in last quarter’s market swoon is the fear that the end of asset purchases by the European Central Bank and the normalization of the Fed’s balance sheet necessarily imply a structural de-rating for all risk assets. A related worry is that the de-rating might intensify the global economic slowdown, resulting in a self-reinforcing negative feedback loop. Does QT Imply Lower Multiples? The question of balance sheet normalization is a difficult one because there is widespread disagreement on how, or even whether, quantitative easing (QE) works. We have always maintained that QE was not about creating a wave of central bank liquidity that flowed into asset prices. Central banks did not “print money” – they created bank reserves. These reserves did not result in a major acceleration in broader measures of money growth, including M1 and M2, largely because there was little demand for loans and because banks tightened lending standards. In other words, the credit channel of monetary policy was broken. The implication is that investors should not worry that quantitative tightening (QT) implies a withdrawal of central bank liquidity that must mechanically come from the sale of risk assets. Rather, we believe that QE operates mostly through the portfolio balance effect. There are two ways to think about this channel. First, the central bank forced investors to move into riskier assets by purchasing large amounts of “safe” assets, such as government bonds. Investors had little choice but to redeploy the capital into other riskier areas, pushing up asset prices. The second perspective is that central bank purchases of government bonds depressed both the yield curve and bond volatility. Volatility fell because investors could forecast the policy rate with certainty – it would be glued to zero (or negative) for the foreseeable future in most of the advanced economies. This is akin to strong forward guidance that flattened the yield curve. Aggressive monetary stimulus, such as QE, also helped to reduce the perceived risk that the economy would succumb to secular stagnation or fall back into recession. Reduced bond volatility, lower bond yields, and less economic risk all increased the attractiveness of the riskier asset classes. These explanations represent two sides of the same coin. Either way, QE boosted a broad array of asset prices. If this is true, then unwinding QE must be bearish for risk assets, all else equal. In the case of the U.S., the fed funds rate is much more difficult to forecast than was the case when the Fed was buying bonds. Higher yields and bond volatility imply a lower equilibrium multiple in the equity market and wider equilibrium corporate bond spreads. Nonetheless, all else is not equal. If interest rates and bond volatility are rising in the context of healthy economic and profit growth, then it is likely that the perceived risk of secular stagnation is falling. It would be a sign that the economy has finally put the financial crisis firmly in the rear-view mirror. It could be the case that the upgrade in economic confidence overwhelms the negative impact of the reverse portfolio balance effect related to quantitative tightening, allowing risk assets to rise. No one can prove this thesis one way or the other and we are not making the case that unwinding the Fed’s balance sheet will necessarily go smoothly, especially since interest rates are rising at the same time. The problem is that both investors and the Fed are trying to figure out where the neutral fed funds rate lies. If the so-called level of R-star is still very low, then the Fed might have already made a policy mistake by raising rates too far. We discussed in last month’s Overview the market implications of four scenarios for the level of R-star and the Fed’s success in correctly guessing it. If the economy holds up and the economic soft patch ends in the coming months as we expect, then investors will revise their estimate of the neutral rate higher and risk assets will rally even as bond yields rise. The Doom Loop One risk to our base-case scenario is the so-called financial conditions “doom loop”. Irrespective of whether or not QT is playing a role, the doom loop scenario involves a shock to investor confidence that leads to a tightening in financial conditions and market liquidity as stock prices fall and credit spreads widen. More onerous financial conditions, in turn, undermine economic activity, which then feeds back into even tighter financial conditions. One could make the argument that risk assets are even more exposed to this type of negative feedback loop today than in past monetary tightening cycles because of program trading, the Fed’s balance sheet shrinkage and investors’ lingering shell shock from the Great Recession and financial crisis. Nonetheless, there are a few mitigating factors to consider. We believe that a doom loop is more likely to unfold when economic growth becomes very sensitive to changes in financial conditions. This normally happens when economic and financial imbalances are elevated. On a positive note, unlike in the lead-up to the last two recessions, the U.S. private sector is a net saver whose income outstrips spending by 2.1% of GDP (Chart I-2). The highly cyclical parts of the U.S. economy are not stretched to the upside as a share of GDP, reducing the risk that overspending in one part of the economy will required a deep contraction to correct the imbalance (Chart I-3). Chart I-2U.S. Private Sector: A New Saver
U.S. Private Sector: A New Saver The U.S. Private Sector Is A Net Saver
U.S. Private Sector: A New Saver The U.S. Private Sector Is A Net Saver
Chart I-3U.S. Cyclical Spending Not Extended
U.S. Cyclical Spending Not Extended
U.S. Cyclical Spending Not Extended
In terms of financial excesses, the good news is that the U.S. household sector is in its best shape in decades. Our main concern is debt accumulation in the corporate sector. We reviewed the related risks in a Special Report published in the November 2018 issue.1 We concluded that corporate leverage will not cause the next U.S. recession, because high levels of debt will only become a problem when profits begin to contract (i.e. when the economic downturn is already underway). Nonetheless, when a recession does occur, corporate spreads will widen by more than in the past for any given degree of economic contraction (see below). ‘Fed Put’ Still In Play Another factor that tempers the risk of a doom loop is that the so-called ‘Fed Put’ is still operating. The December FOMC Minutes and comments by various FOMC members communicated to investors that the Fed is attuned to the economic risks associated with tightening financial conditions, and that the calm inflation backdrop provides policymakers with room to maneuver. Chair Powell even said he was willing to adjust the Fed’s balance sheet run-off if necessary. One important reason for policymakers’ willingness to be flexible is that the fed funds rate is still not far from the zero-lower-bound, making it potentially more difficult for the FOMC to respond adequately in the event of a recession this year because the fed funds rate can only be cut by 250 basis points. Several U.S. data releases have been delayed due the government shutdown, but what has been released has been mixed. The downdraft in the January reading of the manufacturing ISM was eye-opening, highlighting that the global manufacturing slowdown has reached U.S. shores. The good news is that the non-manufacturing ISM and the small business survey, although off their peaks, remain consistent with solid underlying growth. The December U.S. payroll report revealed that wage growth continued to accelerate on the back of gangbusters job creation at the end of the year. There have also been some recent hints that the soft patch in capital spending and housing is ending (Chart I-4). Existing home sales fell sharply in December, but extremely low inventories suggest that it is more of a supply than a demand problem. The impressive bounce in home mortgage applications for purchases is a hopeful sign. U.S. commercial and industrial loan growth is also accelerating. Chart I-4Some Tentative Signs
Some Tentative Signs
Some Tentative Signs
These tentative signs that the economic soft patch is close to an end will not be enough to get the FOMC to tighten in March, after so many members have gone out of their way to signal a pause in recent weeks. Nonetheless, we believe the economy will remain strong enough for the Fed to resume hiking in June. The U.S. government shutdown will complicate interpreting incoming economic data. Ultimately, while its impact on Q1 real GDP growth will be non-trivial, it will be reversed the following quarter and we do not expect any permanent damage to be done. U.S. inflation should edge higher by mid-year, supporting our view that the Fed will resume tightening in June. The decline in oil prices will continue to feed into a lower headline inflation rate in the coming months, but that does not mean that the core rate will fall. Indeed, core CPI has increased by roughly 0.2% in each of the past three months, translating into an annualized rate of approximately 2.4%. Base effects will depress annual core inflation in February but, thereafter, this effect will begin to reverse. The acceleration in wage growth according to measures such as average hourly earnings and the Employment Cost Index highlights that underlying inflationary pressures continue to percolate (Chart I-5). The implication is that the Treasury bond market is overly complacent in discounting that the fed funds rate has peaked for the cycle. Chart I-5U.S. Wage Pressure Is Percolating
U.S. Wage Pressure Is Percolating
U.S. Wage Pressure Is Percolating
Looking further ahead, our base case remains that the next U.S. recession will not occur until 2020, and will be the result of tighter fiscal policy and further Fed tightening that takes short-term rates a step too far. No Bottom Yet For Global Growth Our outlook for growth outside the U.S. remains downbeat for at least the first half of the year. Our global economic indicators still show no sign of a turnaround, except for a bottoming in the diffusion index based on BCA’s Global Leading Economic Indicator (Chart I-6). The global ZEW economic sentiment index continued to fall in January, while business and consumer confidence readings in the advanced economies eroded heading into year end. Chart I-6Global Leading Indicators Still Deteriorating
Global Leading Indicators Still Deteriorating Global Growth Is Still Moderating...
Global Leading Indicators Still Deteriorating Global Growth Is Still Moderating...
A better global growth dynamic awaits more serious policy stimulus in China. Real GDP growth decelerated further to 6.4% year-over-year in the last quarter of 2018. This is no disaster, but the point is that there are still no signs of stabilization. The Chinese authorities continue to tweak the policy dials at the margin, most recently providing some tax cuts and a liquidity injection into the banking system. Nonetheless, the central government has so far abstained from stimulating the property market due to existing speculative excesses. This is very different from the previous two policy easing episodes, including 2015/16 (Chart I-7). Chart I-7China: No Property Market Stimulus...
China: No Property Market Stimulus...
China: No Property Market Stimulus...
The stimulus undertaken so far has been insufficient in terms of putting a floor under growth according to our 12-month Credit Impulse (Chart I-8). It is a hopeful sign that broad money growth is trying to bottom, but this does not guarantee that the credit impulse is about to turn. The latter is required to confirm that Chinese import demand will accelerate, providing a lift to EM exporters, EM asset prices and commodity prices. Without a positive credit impulse, China’s investment and construction activity will continue to moderate, leading to lower imports of machinery and raw materials. Chart I-8...And No Credit Impulse
...And No Credit Impulse
...And No Credit Impulse
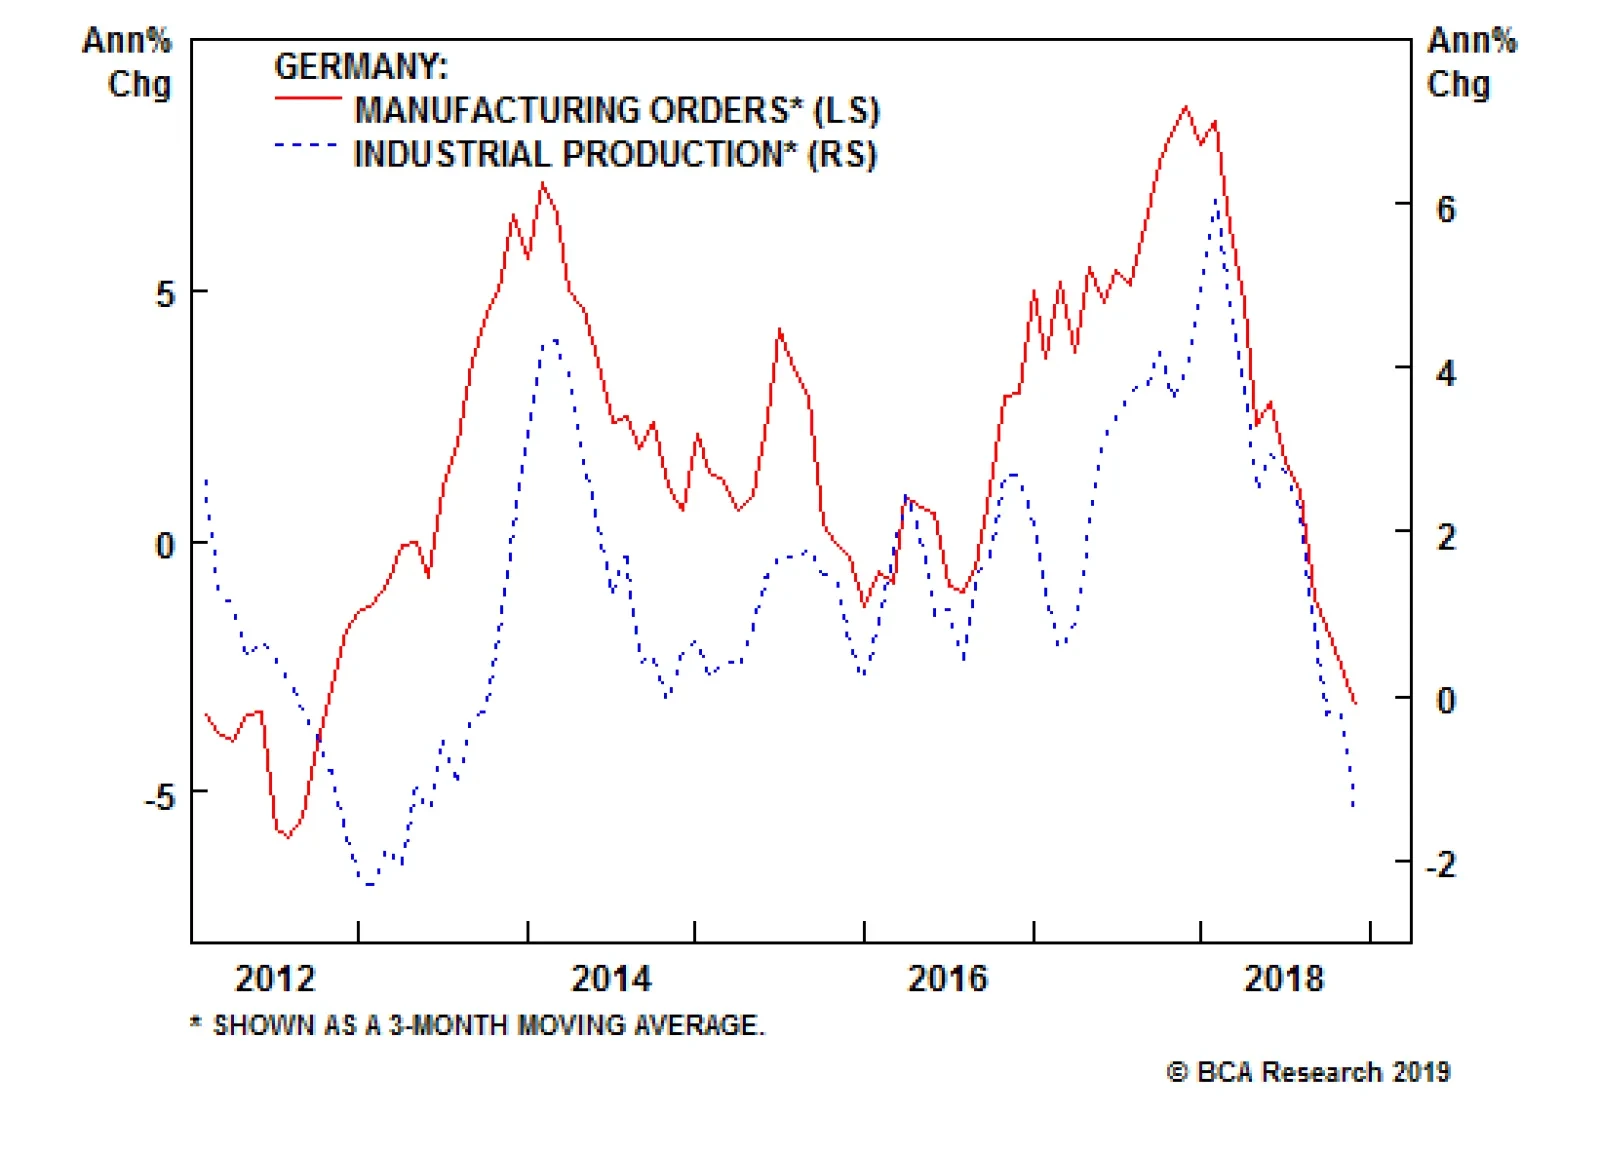
The economic situation in China is likely to get worse before it gets better. Dismal trade figures in December confirmed that the trade war is beginning to bite. The period of export ‘front-running’ related to higher U.S. tariffs is over as total exports fell by 4.4% year-over-year. Last year’s collapse in export orders indicates that the woes are just beginning. In turn, moderating production related to the Chinese export sector will bleed into domestic consumption and imports, suggesting that it is too early to expect a durable rally in EM assets or commodity prices. Lackluster Chinese demand and growing trade concerns have weighted on global business confidence, contributing to the pullback in capital goods orders, manufacturing PMIs and industrial production in the advanced economies (Chart I-9). Even the average service sector PMI and consumer confidence index in the advanced economies have fallen in recent months, although both remain at a high level. Chart I-9The Fallout From Trade
The Fallout From Trade
The Fallout From Trade
Europe and Japan, in particular, are feeling the pinch. German GDP only grew 1.5% in 2018, implying that Q4 GDP growth was in the vicinity of just 0.2% QoQ. Meanwhile, European industrial production contracted by 3.3% year-over-year in December. The German Ifo and ZEW surveys do not point to any significant improvements in this trend. A few idiosyncratic factors explain some of this poor performance, including new emissions testing standards that have weighted on the German auto industry, a tightening in financial conditions in Italy, and the ‘gilets jaunes’ protests in France. Nonetheless, the euro area slowdown cannot be fully explained by one-off factors. The economy is highly sensitive to global trade fluctuations given that 18% of the euro area’s gross value added is generated in the manufacturing sector. Hence, China’s poor economic health has been painful for Europe, and the trend in Chinese credit does not bode well for the near term (Chart I-10). The European Central Bank (ECB) is likely to stay on the defensive as a result, especially as euro area core inflation, which has been stuck near 1% for three years, is unlikely to pick up if growth remains on the back foot. The ECB stuck with the view that the economic soft patch is temporary after the January policy meeting, but policymakers will consider providing more stimulus in March if the economy does not pick up (using forward guidance or a new TLTRO). This will weigh on the euro. Chart I-10China's Woes Are Infecting Europe
China's Woes Are Infecting Europe
China's Woes Are Infecting Europe
Japan is suffering from similar ills. Exports are no longer growing, and foreign machinery and factory orders are contracting at a 4.1% and 4.3% pace, respectively. This weakness is not mimicked in domestic growth, but the disproportionate contribution of the external sector to Japan’s overall economic health means that this country is also falling victim to the malaise witnessed in China and emerging markets, the destination of 19% and 45% of Japanese shipments, respectively (Chart I-11). Collapsing oil prices and a firming trade-weighted yen have amplified this deflationary backdrop. It is therefore far too early to bet that the Bank of Japan will tighten the monetary dials. Chart I-11Japan Hit By The Chinese Cold As Well
Japan Hit By The Chinese Cold As Well
Japan Hit By The Chinese Cold As Well
If we are correct that the U.S. economic soft patch will soon end, then the dollar will once again look to be the best of a bad lot. Interest rate expectations will move in favor of the dollar. We expect the dollar to rise by about 6% this year on a trade-weighted basis, appreciating most strongly against the AUD and SEK. As for sterling, it is beginning to look attractive as a long-term punt. Brexit Deadlock We are a month closer to the end-March deadline and a Brexit deal seems even farther out of reach. It could play out in one of three ways: (1) a “no deal” where the U.K. leaves the EU with no alternative in place; (2) a “soft Brexit” involving an agreement to form a permanent customs union or some sort of “Norway plus” arrangement; or (3) a decision to reverse the results of the original referendum and stay in the EU. There is no support for the “no deal” option in Parliament, which means that it won’t happen. We do not have a strong view on which of the latter two scenarios will occur. The odds of another referendum are rising and the polls are swinging away from any sort of Brexit, suggesting that the original referendum result may be over-turned via another referendum (Chart I-12). Nonetheless, for investors, it does not matter much whether it is scenario 2 or 3; either outcome would be welcomed by markets. Overweight sterling positions are attractive as a long-term play, although it could be some time before the final solution emerges. Chart I-12Brexit Result May Be Overturned
Brexit Result May Be Overturned
Brexit Result May Be Overturned
Upgrade Corporate Bonds To Overweight Given the recent global economic dynamics, it is perhaps surprising that U.S. corporate financial health actually improved in 2018 according to our Corporate Health Monitors (CHM). We highlighted in the aforementioned Special Report the risks facing U.S. corporate bonds when the economic expansion ends. High levels of corporate leverage mean that the interest coverage ratio for the median corporation in the Barclays-Bloomberg index will plunge to near or below all-time historic lows. The potential for a large wave of fallen angels implies that downgrade activity will be particularly painful for corporate bond investors. The surge in lower-quality issuance has led to a downward trend in the average credit rating and has significantly raised the size of the BBB-rated bonds relative to the IG index and relative to the broader universe of corporate bonds. Moreover, poor market liquidity and covenant erosion will intensify pressure for corporate spreads to widen when the bear market arrives. Rapid debt accumulation is reflected in our bottom-up Corporate Health Monitors (CHM) for the U.S. investment-grade and high-yield sectors (Chart I-13). The CHMs are constructed from six financial ratios that the rating agencies use when rating individual companies. The companies in our bottom-up sample were chosen so as to mimic the sector and quality distribution in the Bloomberg-Barclay’s corporate bond index. Chart I-13U.S. Corporate Health
U.S. Corporate Health
U.S. Corporate Health
The debt-to-book-value of equity ratio for both the U.S. IG and HY sample of companies has risen to nose-bleed levels, although the ratio appears to have flattened off for the latter. Despite rising leverage, the HY CHM has shifted into “improved health” territory and the IG CHM is on the verge of doing the same. Last year’s upturn in the profitability measures, such as the return on capital, overwhelmed the deteriorating leverage trend. In Europe, where we distinguish between domestic and foreign issuers, rising leverage has been concentrated among the latter until recently (Chart I-14). In any event, the CHM for both types of issuers is close to the neutral zone. Chart I-14Euro Area Corporate Health
Euro Area Corporate Health
Euro Area Corporate Health
Improving U.S. corporate health on its own would not justify increasing exposure to corporate bonds within balanced portfolios or moving down in quality. Profit growth is likely to moderate this year, especially in Europe, such that last year’s improvement in corporate health is likely to reverse. And, as previously discussed, the economic cycle is well advanced and this sector is particularly vulnerable to a recession. Nonetheless, value has improved enough to warrant a tactical upgrade to overweight within fixed-income portfolios, at a time when the FOMC has signaled a pause and the next recession is at least a year away. Implied volatility should continue to moderate and spreads should narrow, similar to dynamics in 2016, the last time that the Fed signaled patience following a period of market turmoil (Chart I-15). Chart I-15Fed Patience To Narrow Spreads
Fed Patience To Narrow Spreads
Fed Patience To Narrow Spreads
Spreads have already narrowed from the peak in late December, but 12-month breakeven spreads for most credit tiers are all still close to or above their historical means, except for AA-rated issues (Chart I-16). For example, the 12-month breakeven spread2 for the Baa credit tier is 46%. This means that the spread has been tighter than its current level 46% of the time since 1988 and wider than its current level 54% of the time. Historically, spreads tend to hover within the tight-end of their historical range during this phase of the credit cycle, and only cheapen significantly when the yield curve inverts and the default rate moves higher. Chart I-16Value Restored In IG Corporates...
Value Restored In IG Corporates...
Value Restored In IG Corporates...
For U.S. high yield, our estimate of the spread adjusted for expected defaults has risen to 237 bps (Chart I-17). This implies that investors are discounting a 2019 default rate of 3.2%, in line with Moody's forecast. Since we do not foresee recession this year, high-yield bonds are not expensive enough to be avoided within a portfolio. Chart I-17...And In HY Too
...And In HY Too
...And In HY Too
Value has also improved in the European corporate bond market, but our global fixed-income team still recommends favoring the U.S. market for global credit investors. Leverage is higher in the U.S., especially relative to domestic issuers in Europe, but the U.S. economic and profit outlook for 2019 is better. Conclusions Our decision to upgrade corporate bonds this month, similar to our reasoning for upgrading equities to overweight in December, is based on improved value and a sense that investor pessimism had become excessive. For the equity market, the S&P 12-month forward P/E is an attractive 15.4 as we go to press, and bottom-up estimates for 2019 EPS have been slashed to a very reasonable 8%. Just as the selloff in risk assets late last year was overdone, so too was the rally in government bonds. It is highly unlikely that the Fed is done tightening. A resumption of Fed rate hikes, probably in June, means that the 10-year Treasury yield will move back above 3% by year end. Across the major countries, market expectations for yields 5-10 years from now are close to current levels, which is extremely complacent (Chart I-18). Investors should keep duration short of benchmark. Chart I-18Forward Rates Far Too Low
Forward Rates Far Too Low
Forward Rates Far Too Low
Our shift to overweight in both equities and corporate bonds is tactical in nature. We fully expect to move back to neutral and then to underweight later this year or into 2020, as the peak in U.S. GDP draws nearer. Timing will be difficult as always, which means that investors should be prepared to trim risk exposure earlier than implied by our base-case economic timeline. The tactical upgrade does not imply that we have become more sanguine on the economic and geopolitical risks for 2019. We do not believe that quantitative tightening or U.S. corporate leverage will truncate the U.S. expansion prematurely. Nonetheless, there is a plethora of other risks to keep us up at night. These include a Fed policy mistake, a hard economic landing in China, a full-blown financial crisis in Italy and an escalation in U.S./China trade tensions. The last one has diminished marginally in probability. We have a sense that the recent equity market downdraft unnerved President Trump, such that he now has a diminished appetite for upsetting investors with talk of an escalating trade war ahead of next year’s election. Outside of these well-known risks, our geopolitical team has recently published its “Black Swans” report for 2019. These are deemed to be risks that are off of most investors’ radar screens, but that would have profound implications if they were to occur: It is premature to expect armed conflict over Taiwan, but an outbreak of serious tensions between China and Taiwan is possible as Sino-American strategic distrust continues to build. Russia and Ukraine may have a shared incentive to renew hostilities this year. Saudi Arabia has received a “blank cheque” from Donald Trump, and thus it may continue to be provocative. This could boost the geopolitical risk premium in oil prices. Tensions are building in the Balkans. A renewed conflict on Europe’s doorstep could be the next great geopolitical crisis. A “Lame Duck” Trump could stage a military intervention in Venezuela. We encourage interested readers to see our Special Report for details.3 As for emerging market assets and base metals, we continue to shy away until we receive confirmation that China is aggressively stimulating. We expect better news on this front by mid-year, but watch our China Credit Impulse indicator for timing. In contrast, investors should be overweight oil and related assets now because our commodity specialists still see the price of Brent rising above US$80/bbl sometime this year. Recent political turmoil in Venezuela buttresses our bullish oil view. Finally, this month’s fascinating Special Report, penned by BCA’s Chief Global Strategist, Peter Berezin, examines the long-term implications of the peaking in the average IQ in the advanced economies. Average intelligence is falling for both demographic and environment reasons. The impact will be far from benign, potentially leading to lower productivity growth, lower equity multiples, larger budget deficits and higher equilibrium bond yields. The report begins on page 20. Mark McClellan Senior Vice President The Bank Credit Analyst Mathieu Savary Vice President Foreign Exchange Strategy January 31, 2019 Next Report: February 28, 2019 II. The Most Important Trend In The World Has Reversed And Nobody Knows Why After rising for thousands of years, human intelligence has begun to decline in developed economies. This can be seen in falling IQ scores and a decline in math and science test scores. Environmental factors appear to account for the bulk of this decline, but no one knows what these factors are. If left unchecked, falling intelligence will severely undermine productivity growth. This could lead to lower equity multiples, larger budget deficits, and ultimately, much higher government bond yields. Technological advances, particularly in the genetic realm, promise to radically raise IQs. In a complete abandonment of its one-child policy, China will combine these controversial technologies with pro-natal measures in order to boost sagging birth rates. The coming Eugenic Wars will be one of the most important economic and geopolitical developments of the 21st century. Part 1: What The Tame Fox Says In 1959, a Soviet scientist named Dmitry Belyaev embarked on an ambitious experiment: to domesticate the silver fox. A geneticist by training, Belyaev wanted to replicate the process by which animals such as cats and dogs came to live side-by-side with humans. It was a risky endeavor. The Soviets had essentially banned the study of Mendelian genetics in favor of the blank slate ideology that is popular in progressive circles today. Belyaev persevered. Working under the guise of studying vulpine physiology, he selected foxes based on only one trait – tamability. Less than 10% of foxes made it to the subsequent generation, with the other 90% being sent off to fur farms. By the fourth generation, the changes were undeniable. Rather than fleeing humans, the foxes sought out their attention with no prompting whatsoever. They even wagged their tails and whined and whimpered like dogs do. The tame foxes also displayed physical changes. Their ears flopped over. Their snouts became shorter and their tails stood upright. "By intense selective breeding, we have compressed into a few decades an ancient process that originally unfolded over thousands of years," wrote Lyudmila Trut, who began as Belyaev’s assistant and took over the project when her boss died in 1985. Genetically Capitalist? Evolution can broadly proceed in two ways. The first way is through random mutations. This form of evolution, which scientists sometimes refer to as genetic drift, can take thousands of years to yield any discernable changes. The second way is through natural selection, a process that exploits existing variations in genetic traits. As the Russian fox experiment illustrates, evolution driven by selective pressures (either natural or artificial) can occur fairly quickly. Did selective pressures manifest themselves in human evolution in the lead up to the Industrial Revolution? Did humans, in some sense, domesticate themselves? In his book, A Farewell To Alms, economic historian Gregory Clark argued in the affirmative. Clark documented that members of skilled professions in Medieval England had twice as many surviving children as unskilled workers (Chart II-1). Indeed, the fledgling middle class of the time had even more surviving children than the aristocracy, who were often out fighting wars. As a result, the wages of craftsmen declined by a third relative to laborers between 1200 and 1800, implying that the supply of skilled labor was growing more quickly than the demand for skilled workers over this period.
The Most Important Trend In The World Has Reversed And Nobody Knows Why
The Most Important Trend In The World Has Reversed And Nobody Knows Why
In subsequent work, Clark and Neil Cummins argued that the spread of bourgeois values across pre-industrial England was more consistent with a model of genetic transmission than a cultural one (see Box II-1 for details). Similar developments occurred in other parts of the world. For example, in China, the gateway into the bureaucracy for a thousand years was the highly competitive imperial exam. Xi Song, Cameron Campbell, and James Lee showed that high-status men had more surviving children during the eighteenth- and nineteenth-centuries (Chart II-2).4
The Most Important Trend In The World Has Reversed And Nobody Knows Why
The Most Important Trend In The World Has Reversed And Nobody Knows Why
The 10,000 Year Explosion Stephen Jay Gould famously said that “There’s been no biological change in humans in 40,000 or 50,000 years. Everything we call culture and civilization we’ve built with the same body and brain.” Gould was wrong. Data from the International HapMap Project show that human evolution accelerated by 100-fold starting around 10,000 years ago (Chart II-3).
The Most Important Trend In The World Has Reversed And Nobody Knows Why
The Most Important Trend In The World Has Reversed And Nobody Knows Why
In their book The 10,000 Year Explosion: How Civilization Accelerated Human Evolution, Gregory Cochran and the late Henry Harpending explained why evolution sped up so rapidly.5 The advent of agriculture led to a surge in population levels. This, in turn, increased the absolute number of potentially beneficial genetic mutations that could be subject to selection effects. Farming and the rise of city states also completely reshaped the environment in which people lived. Basic biology teaches us that environmental dislocations of this kind tend to generate selective pressures that cause evolution to accelerate. John Hawks, professor of anthropology and genetics at the University of Wisconsin-Madison, put it best: “We are more different genetically from people living 5,000 years ago than they were different from Neanderthals.” Many of the changes to our genomes relate to diet and diseases. The various genetic resistances that people have built up to malaria are all less than 10,000 years old. Mutations to the LCT gene, which confers lactose tolerance into adulthood, occurred independently in three different geographical locations: one in East Asia, one in the Middle East, and one in Africa. The Middle Eastern variant was probably responsible for the rapid enlargement of the Indo-European language group, which now stretches from India to Ireland. The African variant likely facilitated the Bantu expansion, which started near the present-day border of Nigeria and Cameroon, and then spread out across almost all of sub-Saharan Africa. Evolution Of The Human Brain About half of the genes in the human genome regulate some aspect of brain function. Given the rapid acceleration in evolution, it would be rather surprising if our own brains had not been affected. And indeed, there is plenty of evidence that they were. The frontal lobe of the brain has increased in size over the past 10,000 years. This is the part of the brain that regulates such things as language, memory, and long-term planning. Testosterone levels have also declined. That may explain the steady reduction in violent crime rates (Chart II-4).
The Most Important Trend In The World Has Reversed And Nobody Knows Why
The Most Important Trend In The World Has Reversed And Nobody Knows Why
We know that certain genes that are associated with higher intelligence have been under recent selective pressure. For example, the gene that leads to torsion dystonia – a debilitating movement disorder – appears to have increased in frequency. Why would a gene that causes a known disease become more widespread? The answer is that individuals who have this particular mutation tend to have IQs that are around 10-to 20-points above the population average. Why IQ Matters IQ has a long and contentious history. Yet, despite numerous efforts to jettison the concept, it has endured for one simple reason: It has more predictive power than virtually anything else in the psychological realm. A simple 30-minute IQ test can help predict future educational attainment, job performance, income, health, criminality, and fertility choices (Table II-1 and Chart II-5). IQ even predicts trader performance!6
The Most Important Trend In The World Has Reversed And Nobody Knows Why
The Most Important Trend In The World Has Reversed And Nobody Knows Why
The Most Important Trend In The World Has Reversed And Nobody Knows Why
The Most Important Trend In The World Has Reversed And Nobody Knows Why
Like most physiological traits, IQ is highly heritable.7 The genetic contribution to IQ increases from 20% in early childhood to as high as 80% by one’s late teens and remains at that level well into adulthood.8 This makes IQ almost as heritable as height (Chart II-6).
The Most Important Trend In The World Has Reversed And Nobody Knows Why
The Most Important Trend In The World Has Reversed And Nobody Knows Why
Although there is a great deal of variation among individuals, on average, more intelligent people earn higher incomes (Chart II-7). If the same relationship existed in the pre-industrial era, as seems likely, then human intelligence probably increased in a way that facilitated the economic explosion that we associate with the Industrial Revolution. The stunning implication is that the emergence of the modern era was a question of “when, not if.”
The Most Important Trend In The World Has Reversed And Nobody Knows Why
The Most Important Trend In The World Has Reversed And Nobody Knows Why
Part 2: The Flynn Effect By the late-19th century, it had become clear that the rich were no longer having as many children as the poor. This realization, together with the growing popularity of Darwin’s theories, helped galvanize the eugenics movement. Contrary to popular belief, this movement was not a product of the far-right. In fact, the most vocal proponents of eugenics were among the progressive left. John Maynard Keynes, for example, served as the Director of the British Eugenics Society between 1937 and 1944. Yet, a funny thing happened on the road to idiocracy: The concerns of eugenicists did not come to pass. Rather than becoming dimmer, people became smarter. This phenomenon is now known as the Flynn Effect, named after James Flynn, a psychologist who was among the first to document it. Chart II-8 shows the evolution of IQ scores in a sample of countries between 1940 and 1990. The average country recorded IQ gains of three points per decade over this period, a remarkably large increase over such a relatively short period of time.
The Most Important Trend In The World Has Reversed And Nobody Knows Why
The Most Important Trend In The World Has Reversed And Nobody Knows Why
Explaining The Flynn Effect The Flynn Effect must have been entirely driven by environmental factors since genetic factors – namely the tendency of less-educated people to have more children, and to have them at an earlier age – would have reduced average IQs over the past two hundred years. But how could environmental factors have played the dominant role in light of the strong role of genes discussed above? The answer was proposed by geneticist Richard Lewontin in the 1970s. Lewontin suggested imagining a genetically-diverse sack of seed corn randomly distributed between two large identical fields. One field had fertilizer added to it while the other did not. Genetic variation would explain all of the differences in the height of corn stalks within each field, while environmental factors (the addition of fertilizer) would explain all of the difference in the average height of corn stalks between the two fields. This logic explains why genes can account for the bulk of the variation in IQs within any demographic group, while environmental effects may explain most of the variation across groups, as well as why average scores have changed over time. And what environmental effects are these? The truth is that no one really knows. Plenty of theories have been advanced, but so far there is still little consensus on the matter. Bigger, Healthier Brains It has long been known that learning increases the amount of grey matter in the brain. For example, a recent study showed that the hippocampi of London taxi drivers tend to be larger due to the need for drivers to memorize and navigate complex routes.9 The emergence of modern societies likely kicked off a virtuous circle where the need to solve increasingly complex tasks forced people to hone their learning skills, leading to higher IQs and further technological progress. The introduction of universal primary education amplified this virtuous circle. Better health undoubtedly helped as well. Early childhood diseases reduce IQ by diverting the body’s resources away from mental development towards fighting off infections. There is a strong correlation between measured IQ and disease burden across countries (Chart II-9). A number of studies have documented a strong relationship between the timing of malaria eradication in the U.S. and other parts of the world and subsequent observed gains in childhood IQs.10
The Most Important Trend In The World Has Reversed And Nobody Knows Why
The Most Important Trend In The World Has Reversed And Nobody Knows Why
Brain size and IQ are positively correlated. Forensic evidence from the U.S. suggests that the average volume of adult human skulls has increased by 7% since the late 1800s, or roughly the size of a tennis ball.11 Part 3: The End Of A 10,000 Year Trend The problem with environmental effects is that they eventually run into diminishing returns. This appears to have happened with the Flynn Effect. In fact, not only does the recent evidence suggest that the Flynn Effect has ended, but the data suggest that IQs are starting to decline. Chart II-10 shows that average math and science test scores fell in the OECD’s Program For International Scholastic Achievement (PISA) between 2009 and 2015, the latest year of the examination. The drop in math and science test scores has been mirrored in falling IQ scores. Flynn observed a decade ago that IQs of British teenagers were slipping.12 Similar results have been documented in France, the Netherlands, Germany, Denmark, and most recently, Norway.
The Most Important Trend In The World Has Reversed And Nobody Knows Why
The Most Important Trend In The World Has Reversed And Nobody Knows Why
The Norwegian results, published last year, are particularly noteworthy.13 Bernt Bratsberg and Ole Rogeberg examined three-decades worth of data on IQ tests of Norwegian military conscripts. Military duty has been mandatory for almost all men in Norway since 1814, which means that the study’s authors were able to collect comprehensive data on most Norwegian men and their fathers. Their paper clearly shows that IQ peaked with the generation born in the mid-1970s and declined by about five points, or one-third of a standard deviation, for the one born in 1990 (Chart II-11). For the first time in recorded history, Norwegian kids today are not scoring as well as their parents.
The Most Important Trend In The World Has Reversed And Nobody Knows Why
The Most Important Trend In The World Has Reversed And Nobody Knows Why
A Mystery What caused the sudden reversal of the Flynn Effect in Norway and most other developed economies? Nobody knows. We can, however, offer three possible theories: New Technologies For much of human history, rising intelligence and technological innovation were complementary processes, meaning that the smartest people were the ones who could best exploit the new technologies that were coming their way. Moreover, as noted above, even those who were less gifted benefited from the mental stimulation that a technologically advanced society provided. It remains to be seen how future technological advances such as generalized AI will affect human intelligence, but recent technological advances seem to have had a dumbing down effect.14 For example, the GPS has obviated the need for people to navigate unfamiliar locations, thus blunting the development of their visuospatial skills. Modern word processors have made spelling skills less important. Having all the information in the world just a click away is a wonderful thing, but it has reduced the need for our brains to retain and codify what we learn. Meanwhile, the constant bombardment of information to which we are subject has made it difficult to concentrate on anything for long. How many youth today can read a report of this length without checking their Facebook feed multiple times? My guess is not many. Diminishing Returns To Education The ability to take young bright minds, who would have otherwise spent their lives doing menial labor, and provide them with an education was probably the greatest tailwind to growth that the 20th century enjoyed. There is undoubtedly still scope to continue this process, but the low-hanging fruits have been picked. Educational attainment has slowed dramatically in most of the world (Chart II-12). Economist James Heckman estimates that U.S. high-school graduation rates, properly measured, peaked over 40 years ago.15
The Most Important Trend In The World Has Reversed And Nobody Knows Why
The Most Important Trend In The World Has Reversed And Nobody Knows Why
Despite billions of dollars spent, efforts to improve school performance have generally fallen flat. A recent high-level report by the U.S. Department of Education concluded that “The panel did not find any empirical studies that reached the rigor necessary to determine that specific turnaround practices produce significantly better academic outcomes.”16 This gets to a point that most parents already know, which is that when people talk about “bad schools," they are really talking about “bad students.” Deteriorating Health Better health probably contributed to the Flynn Effect. But is it possible to have too much of a good thing? More calories are welcome when people are starving, but today’s calorie-rich, nutrient-poor diets have led to a surge in obesity rates. A clean environment reduces the spread of germs, but it also makes children hypersensitive to foreign substances. Following German reunification, researchers observed that allergies were much more common among West German children than their Eastern peers, presumably because of the West’s more salubrious environment.17 All sorts of weird and concerning physiological changes are occurring. Sperm counts have fallen by nearly 60% since the early 1970s.18 Testosterone levels in young men are dropping. Among girls, the age of first menarche has declined by two years over the past century.19 Are chemical agents in the environment responsible? If they are, what impact are they having on cognitive development? Nobody knows. Reported mental illness is also on the rise. The share of U.S. teenagers with a reported major depressive episode over the prior year surged by over 60% between 2010 and 2017 (Chart II-13). The fraction of young adults that made suicide plans nearly doubled.20 More than 20% of U.S. women over the age of 40 are on antidepressants.21 Five percent of U.S. children are receiving ADHD medication.22
The Most Important Trend In The World Has Reversed And Nobody Knows Why
The Most Important Trend In The World Has Reversed And Nobody Knows Why
Implications For Economic Growth And Asset Markets So far, the reversal of the Flynn Effect has been largely confined to the developed economies. Test scores are still rising in the developing world, albeit from fairly low levels. For example, two recent studies have documented significant IQ gains in Kenya and Brazil.23 In the poorest countries, opportunities for improving health abound. Even small steps such as fortifying salt with iodine (which costs about five cents per person per year) have been shown to boost IQ by nearly one standard deviation.24 Measures to reduce inbreeding are also likely to boost IQ scores.25 Yet, we should not underestimate the importance of falling cognitive skills in developed economies. Chart II-14 shows that there is a clear positive correlation between student score on math and science and per capita incomes.
The Most Important Trend In The World Has Reversed And Nobody Knows Why
The Most Important Trend In The World Has Reversed And Nobody Knows Why
Most technological innovation still takes place in developed economies. There is an extremely tight relationship between visuospatial IQ and the likelihood of becoming an inventor (Chart II-15). Since IQ is distributed along a bell curve, a 0.1 standard deviation drop in IQs across the entire distribution will result in an 8% decline in the share of people with IQs over 100, a 14% decline in those with IQs over 115, and a 21% decline in those with an IQ over 130 (by convention, each standard deviation on an IQ test is worth 15 points).
The Most Important Trend In The World Has Reversed And Nobody Knows Why
The Most Important Trend In The World Has Reversed And Nobody Knows Why
Falling IQs could result in slower productivity growth, which could further strain fiscal balances. Lower IQs are also associated with decreased future orientation.26 People who live for the moment tend to save less. A decline in savings would push up real rates, leading to less capital accumulation. History suggests that a deceleration in productivity growth and higher real rates will put downward pressure on equity multiples (Chart II-16).
The Most Important Trend In The World Has Reversed And Nobody Knows Why
The Most Important Trend In The World Has Reversed And Nobody Knows Why
Part 4: Generation E For 200 years, the environmentally-driven Flynn Effect disguised the underlying genetically-driven decline in IQs that began not long after the dawn of the Industrial Revolution. Flynn has acknowledged this himself, noting at the 2017 International Society For Intelligence Research Conference that “I have no doubt that there has been some deterioration of genetic quality for intelligence since the late Victorian times.”27 Now that the Flynn Effect has reversed, both genes and the environment are working together to reduce cognitive abilities in developed economies. This means that the most important trend in the world – a trend that allowed the human population to increase during the Malthusian era and later allowed output-per-worker to soar following the Industrial Revolution – has broken down. Yet, there may be another twist in the story – one that began just a few months ago: the first members of Generation E were born. E Is For Edited ... Or Eugenics Lulu and Nana will be like most other children, but with one key difference: They will be the first humans ever to have their genomes edited through a procedure know as CRISPR-Cas9. Rogue Chinese scientist He Jiankui deactivated their CCR5 gene, which the HIV virus uses as a gateway into the body. His actions were rightfully condemned around the world for endangering the twins’ health by using a procedure that has not yet been fully vetted in animal studies, let alone in human trials (Lulu and Nana’s father is HIV+ but it is debatable whether the children were at an elevated risk of infection). He Jiankui remains under house arrest at the university where he worked. But whatever his fate, the dam has been broken. For better or for worse, the era of personal eugenics has arrived. The Return Of The Silver Fox It is easier to delete a gene than to add one. It is even more difficult to swap out a large number of genes in a way that achieves a predictable outcome. Thus, the successful manipulation of highly polygenic traits such as intelligence — traits that are linked to hundreds of different genes – may still be decades away.28 Predicting a trait is much simpler than modifying it, however. The cost of sequencing a human genome has fallen by more than 99% since 2001 (Chart II-17). Start-up company Genomic Prediction has already developed a test for fertilized embryos for IVF users that predicts height within a few centimetres and IQ with a correlation of 0.3-to-0.4, roughly as accurate as standardized tests such as the SAT or ACT.29 Other companies are following suit.30
The Most Important Trend In The World Has Reversed And Nobody Knows Why
The Most Important Trend In The World Has Reversed And Nobody Knows Why
Some will recoil in horror at the prospect of selecting prospective children in this manner. They will argue that such technologies, beyond being simply immoral, will widen social inequality between those who can afford them and those who cannot. Others will counter that screening embryos for certain traits is not that dissimilar to what people already do with prospective romantic partners. They will also point out that mass usage of these technologies will drive down prices to the point that even poor people will be able to access them, thus giving low IQ parents the chance to have high IQ kids. They might also note that such technologies may be the only way to reverse the ongoing accumulation of deleterious mutations within the human germline that has been the unintended by-product of the proliferation of life-saving medicines.31 We will not wade into this thorny debate, other than to note that there will be huge incentives for people to avail themselves of these technologies. The Coming Eugenic Wars And not just individuals either – governments too. While the initial impact of eugenic technologies will be small, the effects will compound over time. Carl Shulman and Nick Bostrom estimate that genetic screening could boost average IQs by up to 65 points in five generations (Table II-2).
The Most Important Trend In The World Has Reversed And Nobody Knows Why
The Most Important Trend In The World Has Reversed And Nobody Knows Why
China has been investing heavily in genetic technologies. As Geoffrey Miller has argued, China’s infatuation with eugenics spans into the modern day.32 Like most other countries, fertility in China is negatively correlated with IQ. Mingrui Wang, John Fuerst, and Jianjun Ren estimate that China is currently losing nearly one-third of a point in generalized intelligence per decade, with the loss having accelerated rapidly between the 1960s and mid-1980s.33 The decline in the genetic component of Chinese IQs is coming at a time when the population itself is about to shrink. According to the UN’s baseline forecast, China will lose 450 million working-age people by the end of the century (Chart II-18). Meanwhile, the country is saddled with debt, the result of an economic model that has, for decades, recycled copious household savings into debt-financed fixed-investment spending in an effort to shore up domestic demand.
The Most Important Trend In The World Has Reversed And Nobody Knows Why
The Most Important Trend In The World Has Reversed And Nobody Knows Why
The authorities may be tempted to tackle all three problems simultaneously by adopting generous pro-natal measures – call it the “at least one-child policy”– which increasingly harnesses emerging eugenic technologies. The resulting baby boom would strengthen domestic demand, thus making the economy less dependent on exports, while ensuring China’s long-term geopolitical viability. The Eugenic Wars are coming, and they will be unlike anything the world has seen before. BOX II-1 The Diffusion Of Bourgeois Values: Culture Or Genes? Higher-income people had more surviving children in the centuries leading up to the Industrial Revolution. Real per capita income was broadly stable during this period. This implies that there must have been downward social mobility, with sons, on average, being less wealthy than their fathers. This downward mobility, in turn, spread the characteristics of higher-income people across the broad swathe of society. What were these characteristics? Cultural values that emphasized thrift, diligence, and literacy were undoubtedly part of what was passed on to future generations. But surprisingly, it also appears that genetic transmission played an important, and perhaps pivotal, role. Models of genetic transmission make very concrete predictions about the correlations in economic status that one would expect to see among relatives. Biological brothers share 50% of their genes, as do fathers and sons. Likewise, first cousins share 25% of their genes, the same as grandfathers and sons. These facts yield two testable predictions: The first is that the correlation coefficient on status measures such as wealth, occupation, and education should be the same for relatives that share the same fraction of genes such as sibling pairs and father-son pairs. Box Chart II-1 shows that this is borne out by the data. The second prediction is that the correlation between status and genetic distance should follow a linear trend so that, for example, the correlation in wealth among brothers is twice that of first cousins and four times that of second cousins. Box Chart II-2 shows that this is also borne out by the data.
Image
Image
Other evidence supports the importance of genes in the transmission of status across generations. The correlation in measures such as wealth, education, and occupation is much higher among identical twins than fraternal twins. Adopted children turn out to be more similar to their biological parents on these measures when they reach adulthood than their adopted parents, even when the children have never met their biological parents. The parent-child correlation also remains the same regardless of family size, suggesting that spreading the same resources over more children may not harm life outcomes to any discernible degree, at least on the measures listed above. Peter Berezin Chief Global Strategist Global Investment Strategy III. Indicators And Reference Charts Our tactical equity upgrade to overweight last month has still not been confirmed by most of our proprietary indicators. Our Willingness-to-Pay (WTP) indicator for the U.S. is falling fast. It is also eroding for Europe, although it has ticked higher in Japan. The WTP indicators track flows, and thus provide information on what investors are actually doing, as opposed to sentiment indexes that track how investors are feeling. Investors have clearly moved funds away from the U.S. equity market and there is no sign yet that this is reversing. Our Revealed Preference Indicator (RPI) for stocks continued to issue a ‘sell’ signal in January. The RPI combines the idea of market momentum with valuation and policy measures. It provides a powerful bullish signal if positive market momentum lines up with constructive signals from the policy and valuation measures. Conversely, if constructive market momentum is not supported by valuation and policy, investors should lean against the market trend. While the RPI is still cautious, value has improved significantly according to BCA’s composite valuation indicator. It is a composite of 11 different valuation measures. This indicator almost reached the fair value line in December. Moreover, our Monetary Indicator has suddenly shifted out of negative territory for stocks, rising to the neutral line in December. Calming words from the Fed has improved the monetary backdrop by removing expected rate hikes from the money market curve. Given the improvement in both value and the monetary backdrop, the RPI could generate a ‘buy’ signal next month. Our Composite Technical indicator for stocks broke down last month, providing a clear ‘sell’ signal, and has not yet delivered a ‘buy’. However, sentiment is now washed out and earnings expectations have been revised heavily downward. These signals are bullish from a contrary perspective. The 10-year Treasury yield is in the neutral range according to our valuation model. Bonds are not overbought, despite the rally in December, because they were still working off oversold conditions. Contrary to the bond valuation model, the 10-year term premium moved further into negative territory in January, suggesting that yields are unsustainably low. Our bond-bearish bias is consistent with the view that the Fed rate hike cycle is not over. The U.S. dollar is somewhat overbought and very expensive on a PPP basis. Nonetheless, we believe it will become more expensive in the first half of 2019, before its structural downtrend resumes in broad trade-weighted terms. EQUITIES: Chart III-1U.S. Equity Indicators
U.S. Equity Indicators
U.S. Equity Indicators
Chart III-2Willingness To Pay For Risk
Willingness To Pay For Risk
Willingness To Pay For Risk
Chart III-3U.S. Equity Sentiment Indicators
U.S. Equity Sentiment Indicators
U.S. Equity Sentiment Indicators
Chart III-4Revealed Preference Indicator
Revealed Preference Indicator
Revealed Preference Indicator
Chart III-5U.S. Stock Market Valuation
U.S. Stock Market Valuation
U.S. Stock Market Valuation
Chart III-6U.S. Earnings
U.S. Earnings
U.S. Earnings
Chart III-7Global Stock Market And Earnings: Relative Performance
Global Stock Market And Earnings: Relative Performance
Global Stock Market And Earnings: Relative Performance
Chart III-8Global Stock Market And Earnings: Relative Performance
Global Stock Market And Earnings: Relative Performance
Global Stock Market And Earnings: Relative Performance
FIXED INCOME: Chart III-9U.S. Treasurys And Valuations
U.S. Treasurys And Valuations
U.S. Treasurys And Valuations
Chart III-10Yield Curve Slopes
Yield Curve Slopes
Yield Curve Slopes
Chart III-11Selected U.S. Bond Yields
Selected U.S. Bond Yields
Selected U.S. Bond Yields
Chart III-1210-Year Treasury Yield Components
10-Year Treasury Yield Components
10-Year Treasury Yield Components
Chart III-13U.S. Corporate Bonds And Health Monitor
U.S. Corporate Bonds And Health Monitor
U.S. Corporate Bonds And Health Monitor
Chart III-14Global Bonds: Developed Markets
Global Bonds: Developed Markets
Global Bonds: Developed Markets
Chart III-15Global Bonds: Emerging Markets
Global Bonds: Emerging Markets
Global Bonds: Emerging Markets
CURRENCIES: Chart III-16U.S. Dollar And PPP
U.S. Dollar And PPP
U.S. Dollar And PPP
Chart III-17U.S. Dollar And Indicator
U.S. Dollar And Indicator
U.S. Dollar And Indicator
Chart III-18U.S. Dollar Fundamentals
U.S. Dollar Fundamentals
U.S. Dollar Fundamentals
Chart III-19Japanese Yen Technicals
Japanese Yen Technicals
Japanese Yen Technicals
Chart III-20Euro Technicals
Euro Technicals
Euro Technicals
Chart III-21Euro/Yen Technicals
Euro/Yen Technicals
Euro/Yen Technicals
Chart III-22Euro/Pound Technicals
Euro/Pound Technicals
Euro/Pound Technicals
COMMODITIES: Chart III-23Broad Commodity Indicators
Broad Commodity Indicators
Broad Commodity Indicators
Chart III-24Commodity Prices
Commodity Prices
Commodity Prices
Chart III-25Commodity Prices
Commodity Prices
Commodity Prices
Chart III-26Commodity Sentiment
Commodity Sentiment
Commodity Sentiment
Chart III-27Speculative Positioning
Speculative Positioning
Speculative Positioning
ECONOMY: Chart III-28U.S. And Global Macro Backdrop
U.S. And Global Macro Backdrop
U.S. And Global Macro Backdrop
Chart III-29U.S. Macro Snapshot
U.S. Macro Snapshot
U.S. Macro Snapshot
Chart III-30U.S. Growth Outlook
U.S. Growth Outlook
U.S. Growth Outlook
Chart III-31U.S. Cyclical Spending
U.S. Cyclical Spending
U.S. Cyclical Spending
Chart III-32U.S. Labor Market
U.S. Labor Market
U.S. Labor Market
Chart III-33U.S. Consumption
U.S. Consumption
U.S. Consumption
Chart III-34U.S. Housing
U.S. Housing
U.S. Housing
Chart III-35U.S. Debt And Deleveraging
U.S. Debt And Deleveraging
U.S. Debt And Deleveraging
Chart III-36U.S. Financial Conditions
U.S. Financial Conditions
U.S. Financial Conditions
Chart III-37Global Economic Snapshot: Europe
Global Economic Snapshot: Europe
Global Economic Snapshot: Europe
Chart III-38Global Economic Snapshot: China
Global Economic Snapshot: China
Global Economic Snapshot: China
Mark McClellan Senior Vice President The Bank Credit Analyst Footnotes 1 Please see The Bank Credit Analyst Special Report "The Long Shadow Of The Financial Crisis," dated October 25, 2018, available at bca.bcaresearch.com 2 The amount of spread widening required for corporate returns to break-even with duration-matched U.S. Treasuries on a one-year horizon. 3 Please see Geopolitical Strategy Special Report "Five Black Swans In 2019," dated January 16, 2019, available at gps.bcaresearch.com 4 Xi Song, Cameron Campbell, and James Lee, "Descent Line Growth and Extinction From A Multigenerational Perspective, Extended Abstract," American Sociological Review 80:3, (April 21, 2015): 574-602. 5 Gregory Cochran and Henry Harpending, "The 10,000 Year Explosion: How Civilization Accelerated Human Evolution," Basic Books, (2009). 6 Mark Grinblatt, Matti Keloharju, and Juhani T. Linnainmaa, “IQ, Trading Behavior, and Performance,” Journal of Financial Economics, 104:2, (May 2012): 339-362. 7 Thomas Bouchard, "Genetic Influence On Human Psychological Traits - A Survey," Current Directions in Psychological Science 13:4, (August 2004): 148-151. 8 The tendency for the genetic contribution to IQ to increase until early adulthood and then to remain at high levels until old age is known as the Wilson Effect. There is no consensus on what causes it, but it probably reflects a number of factors: 1) It may take some children longer than normal to reach full intellectual maturity. Testing their IQs at a young age will result in scores that are lower than those expected based on their parents’ IQs. The opposite is true for children whose IQs increase relatively quickly in young age, but possibly top out earlier; 2) Environmental effects are probably more important in young age when a child’s brain is still quite malleable; 3) Self-reinforcing gene-environment interactions tend to increase with age. Children do not have much control over their environment, but as they get older, they will seek out activities that are more in keeping with their genetic predispositions. For example, a studious child may pursue a career that reinforces their love of learning. 9 "Cache Cab: Taxi Drivers' Brains Grow to Navigate London's Streets," Scientific American, (December 2011). 10 Atheendar Venkataramani, "Early Life Exposure to Malaria and Cognition in Adulthood: Evidence from Mexico," Journal of Health Economics 31:5, (July 2012): 767-780; Hoyt Bleakley, "Health, Human Capital and Development," Annual Review of Economics 2, (March 2010): 283-310; Hoyt Bleakley, "Malaria Eradication in the Americas: A Retrospective Analysis of Childhood Exposure," American Economic Journal: Applied Economics 2, (April 2010): 1-45. 11 "Anthropologists Find American Heads Are Getting Larger," ScienceDaily, (May 2012). 12 "British Teenagers Have Lower IQs Than Their Counterparts Did 30 Years Ago," The Telegraph, (February 2009). 13 Bernt Bratsberg and Ole Rogeberg, "Flynn Effect And Its Reversal Are Both Environmentally Caused," Proceedings of the National Academy of Sciences 115:26, (June 2018): 6674-6678. 14 On the face of it, artificial intelligence would appear to be a substitute for human intelligence. Many applications of AI would undoubtedly have this feature, especially those that allow computers to perform complex mental tasks that humans now must do. However, there are several ways that AI may eventually come to complement human intelligence. First, and most obviously, AI could be used to augment human capabilities either directly by hardwiring it into our brains, or indirectly through the development of drugs or genetic techniques which improve cognition. Second, looking further out, the benefits of highly intelligent AI systems would be limited if humans did not possess the requisite intelligence to understand certain concepts that are currently beyond our mental reach. No matter how well intentioned, trying to explain string theory to a mouse is not going to succeed. There are probably a multitude of ideas that AI could reveal that we simply cannot comprehend at current levels of human intelligence. 15 James Heckman and Paul La Fontaine, "The American High School Graduation Rate: Trends and Levels," The Review of Economics and Statistics 92:2, (May 2010): 244–262. 16 "Turning Around Chronically Low-Performing Schools," The Institute of Education Sciences (IES), (May 2008). 17 E. von Mutius, F.D. Martinez, C. Fritzsch, T. Nicolai, G. Roell, and H. H. Thiemann, "Prevalence Of Asthma And Atopy In Two Areas Of West Germany And East Germany," American Journal of Respiratory and Critical Care Medicine 149:2, (February 1994): 358-64. 18 "Sperm Counts In The West Plunge By 60% In 40 Years As ‘Modern Life’ Damages Men’s Health," Independent, (July 2017). 19 Kaspar Sørensen, Annette Mouritsen, Lise Aksglaede, Casper P. Hagen, Signe Sloth Mogensen, and Anders Juul, "Recent Secular Trends in Pubertal Timing: Implications for Evaluation and Diagnosis of Precocious Puberty," Hormone Research in Paediatrics 77:3, (May 2012): 137-145. 20 “Results from the 2017 National Survey On Drug Use And Health: Detailed Tables,” Substance Abuse and Mental Health Services Administration, Center for Behavioral Health Statistics and Quality, Rockville (Maryland), (September, 2018). 21 Laura A. Pratt, Debra J. Brody, and Qiuping Gu, "Antidepressant Use Among Persons Aged 12 and Over: United States, 2011–2014," NCHS Data Brief No. 283, Centers for Disease Control and Prevention, (August 2017). 22 Some, but not all, of the increase in reported rates of mental illness may be due to more aggressive diagnosis by health practitioners. For example, a recent study revealed that children born in August were 30% more likely to receive an ADHD diagnosis than those born in September, simply because they were less mature compared to other kids in the first few years of elementary school. See: Timothy J. Layton, Michael L. Barnett, Tanner R. Hicks, and Anupam B. Jena, "Attention Deficit-Hyperactivity Disorder and Month of School Enrollment," New England Journal of Medicine 379:22, (November 2018): 2122-2130. 23 Tamara C. Daley, Shannon E. Whaley, Marian D. Sigman, Michael P. Espinosa, and Charlotte Neumann, "IQ On The Rise: The Flynn Effect In Rural Kenyan Children," Psychological Science 14:3, (June 2003): 215-9; Jakob Pietschnig and Martin Voracek, "One Century of Global IQ Gains: A Formal Meta-Analysis of the Flynn Effect (1909-2013)," Perspectives on Psychological Science 10:3, (May 2015): 282-306. 24 N. Bleichrodt and M. P. Born, “Meta-Analysis of Research on Iodine and Its Relationship to Cognitive Development,” In: ed. J. B. Stanbury, "The Damaged Brain of Iodine Deficiency," Cognizant Communication Corporation, New York, (1994): 195-200; "Iodine status worldwide: WHO Global Database on Iodine Deficiency," World Health Organization, Geneva, (2004). 25 Mohd Fareed and Mohammad Afzal, "Estimating the Inbreeding Depression on Cognitive Behavior: A Population Based Study of Child Cohort," PLOS ONE 9:12, (October 2015): e109585. 26 H. de Wit, J. D. Flory, A. Acheson, M. McCloskey, and S. B. Manuck, "IQ And Nonplanning Impulsivity Are Independently Associated With Delay Discounting In Middle-Aged Adults," Personality and Individual Differences 42:1, (January 2007): 111-121; W. Mischel and R. Metzner, "Preference For Delayed Reward As A Function Of Age, Intelligence, And Length Of Delay Interval," Journal of Abnormal and Social Psychology 64:6, (July 1962): 425-31. 27 James Flynn, “IQ decline and Piaget: Does the rot start at the top?” Lifetime Achievement Award Address, 18th Annual meeting of ISIR, (July 2017). 28 For a good discussion of these issues, please see Richard J. Haier, “The Neuroscience of Intelligence,” Cambridge Fundamentals of Neuroscience in Psychology, (December 2016). 29 "The Future of In-Vitro Fertilization and Gene Editing," Psychology Today, (December 2018). 30 "DNA Tests For IQ Are Coming, But It Might Not Be Smart To Take One," MIT Technology Review, (April 2018). 31 Michael Lynch, "Rate, Molecular Spectrum, And Consequences Of Human Mutation," Proceedings of the National Academy of Sciences 107:3, (January 2010): 961-968. 32 Geoffrey Miller, "What *Should* We Be Worried About?" Edge, (2013). 33 Mingrui Wang, John Fuerst, and Jianjun Ren, "Evidence Of Dysgenic Fertility In China," Intelligence 57, (April 2016): 15-24. EQUITIES:FIXED INCOME:CURRENCIES:COMMODITIES:ECONOMY:
Highlights We advocate implementing asset allocation not across EM assets, but rather relative to their DM counterparts. EM stocks should be part of a global equity portfolio. EM sovereign and corporate credit should be part of a global credit portfolio. EM local currency government bonds are a unique asset class with idiosyncratic features and a low correlation with other assets. Hence, their addition to any multi-asset class portfolio is beneficial. We continue recommending below benchmark allocation to EM equities, credit and local bonds. The rebound in various EM financial markets is reaching a critical technical level where it will either stop or, if broken, will carry on for some time. In Peru, further decline in industrial metals prices and ongoing involuntary monetary tightening bode ill for share prices; continue underweighting. Feature We frequently receive questions from our clients on how they should be positioning their portfolios within EM asset classes such as equities, EM U.S. dollar bonds (credit markets) and local currency government bonds – whether they should be overweight EM stocks versus EM credit markets and domestic bonds, or vice versa. While BCA’s Emerging Markets Strategy service covers EM stocks, credit and domestic bonds and exchange rates, we do not make asset allocation calls between EM equities, EM credit and local currency bonds. The reason is very simple: in a risk-on market, EM equities always outperform EM credit and local bonds, and in a risk-off environment, stocks always underperform fixed income (Chart I-1). Chart I-1EM Stocks Versus EM Credit And Local Bonds
EM Stocks Versus EM Credit And Local Bonds
EM Stocks Versus EM Credit And Local Bonds
With respect to the relative performance of EM credit markets versus domestic bonds, the performance of EM currencies is key. A large portion of total returns on EM local currency bonds comes from exchange rates (Chart I-2). Hence, when EM currencies appreciate, domestic bonds outperform EM credit markets (U.S. dollar bonds), and vice versa (Chart I-3). Chart I-2EM Currencies Are Key To EM Local Bonds Returns
EM Currencies Are Key To EM Local Bonds Returns
EM Currencies Are Key To EM Local Bonds Returns
Chart I-3EM Local Bonds Versus EM Credit: It Is A Currency Call
EM Local Bonds Versus EM Credit: It Is A Currency Call
EM Local Bonds Versus EM Credit: It Is A Currency Call
For investors willing to allocate across EM asset classes, a directional view on financial markets should drive allocation between equities and fixed-income. In rallies, equities should be favored, while during risk-off periods, fixed income should be preferred. It follows that investors should overweight EM credit markets versus domestic bonds when EM currencies depreciate, and tilt allocation toward local currency bonds versus EM credit markets when EM exchange rates appreciate. Recommended Approach To Asset Allocation We advocate implementing asset allocation not across EM assets, but relative to their DM counterparts: EM stocks should be part of a global equity portfolio. A pertinent asset allocation decision should be whether to be overweight, neutral or underweight EM within a global equity portfolio. In short, EM stocks should not be compared with EM credit or local bonds, but rather versus their DM counterparts. Having mentioned that, we are maintaining our underweight recommendation on EM within a global equity portfolio for now. EM sovereign and corporate credit should be part of a global credit portfolio – i.e., asset allocators should compare them with other credit instruments such as U.S. and European corporate bonds. Total returns on EM U.S. dollar-denominated sovereign and corporate bonds can be deconstructed into the total return on U.S. Treasurys and the excess return of these EM bonds over U.S. Treasurys. Investors can obtain exposure to U.S. Treasurys by owning them outright. Hence, the unique feature of EM sovereign and corporate bonds is their spreads over U.S. government bonds. EM sovereign and corporate bond spreads over U.S. Treasurys reflect issuers' ability and willingness to pay. Thereby, investors should treat EM dollar-denominated bonds as a pure credit product and this asset class should be part of a global credit portfolio. At the moment, we recommend asset allocators underweight EM sovereign and corporate credit versus U.S./DM corporate credit, in line with our short EM equities/long U.S./DM equities strategy (Chart I-4). Within credit markets, EM investment-grade and high-yield credit should be compared with their peers in U.S./DM, respectively. The reason we are negative on EM credit markets relative to the U.S. and DM universe is that the majority of EM sovereign and corporate bond issuers in Latin America and the EMEA are commodity producers. Hence, their revenues fluctuate with commodity prices, and their spreads should be under upward pressure as commodity prices drop further and EM currencies correspondingly depreciate (Chart I-5). Chart I-4EM Credit Versus U.S. Credit
EM Credit Versus U.S. Credit
EM Credit Versus U.S. Credit
Chart I-5EM Credit Spreads Are Sensitive To Commodities And EM Currencies
EM Credit Spreads Are Sensitive To Commodities And EM Currencies
EM Credit Spreads Are Sensitive To Commodities And EM Currencies
In the meantime, Chinese property companies, financials and industrials/materials remain the largest issuers of corporate debt in emerging Asia. Specifically, U.S. dollar bonds issued by Chinese companies account for 32% of the Barclay’s overall EM USD Credit index and 56% of the EM Asia USD Credit index. Crucially, Chinese corporate credit is essential to trends in emerging Asian credit markets. We are bearish on the fundamentals of Chinese corporate bond issuers due to our negative view on Chinese capital spending, particularly in the real estate sector. With respect to EM local-currency government bonds, this is an entirely different asset class with returns often uncorrelated with any other asset. Table 1 shows that EM local currency bond returns in U.S. dollars have a low correlation with most other asset classes. Therefore, adding EM local-currency bonds to a global multi-asset class portfolio will help achieve risk diversification provided an expectation of a positive return on this asset class in the long run.
Chart I-
EM domestic bond returns are comprised of local yield carry and capital gains/losses, as well as currency appreciation/depreciation. Business cycles and monetary policies could from time to time be desynchronized across EM countries, and EM currencies could also at times diverge. In short, all of this will add idiosyncratic risk to any global multi-asset class portfolio and push out the portfolio’s efficient frontier – i.e., the portfolio could achieve higher returns for the same amount of risk (volatility). The exposure to EM local currency bonds should be altered according to the view on this asset’s absolute performance. Presently, we recommend below benchmark allocation to this asset class because we expect the majority of EM currencies to depreciate versus the U.S. dollar, the euro and the Japanese yen. The key driver of EM currencies is not U.S. interest rates but the global business cycle (Chart I-6). Odds are high that global trade will continue disappointing as China’s growth weakens further. This will lead to tumbling EM currencies and outflows from high-yielding EM domestic bonds. Chart I-6What Drive EM Currencies
What Drive EM Currencies
What Drive EM Currencies
Within an EM local currency bond portfolio, our recommended overweights are Mexico, Brazil, Chile, Russia, central Europe, Thailand and Korea. The list of our overweights and underweight across EM stocks, credit markets, local bonds and currencies is always published at the end of our reports. Bottom Line: Global asset allocation should treat EM stocks as part of a global equity portfolio. EM sovereign and corporate credit should be part of a global credit portfolio. In turn, EM local currency government bonds are a unique asset class with idiosyncratic features and a low correlation with other assets. Hence, their addition to any multi-asset class portfolio is recommended given an expectation of a positive return in the long run. A Make It Or Break It Juncture The rebound in various EM financial market segments is reaching a critical technical level. At that point, it will either reverse, or will break through and carry on the upward momentum for some time: EM share prices have troughed at their three-year moving averages but are now facing resistance at their 200-day moving averages (Chart I-7). Failure to break above their 200-day moving averages would signal higher risks of a major breakdown. Conversely, a decisive break above their 200-day moving averages would suggest that the recent rebound has much farther to go. Our Risk-on versus Safe-Haven currency ratio has found support at its 6-year moving average but is now facing resistance at its 200-day moving average (Chart I-8, top panel). This ratio is highly correlated with EM share prices, and its breakout or breakdown will be an important signal for the direction of EM, commodities and global cyclical assets in general (Chart I-8, bottom panel). Chart I-7EM Share Prices Are Between Support And Resistance
EM Share Prices Are Between Support And Resistance
EM Share Prices Are Between Support And Resistance
Chart I-8This Currency Ratio Is Key To EM And Commodities Trend
bca.ems_wr_2019_01_31_s1_c8
bca.ems_wr_2019_01_31_s1_c8
A relapse from this level would be a major bearish signal, as it would confirm the formation of a head-and-shoulders pattern in this currency ratio. The latter would entail a major breakdown. A number of EM currencies such as ZAR, MXN, KRW, TWD, MYR and CNY are at a critical juncture (Chart I-9). A breakout or failure to do so will entail a major move. Chart I-9AEM Exchange Rates Are At Make It Or Break It Juncture
EM Exchange Rates Are At Make It Or Break It Juncture
EM Exchange Rates Are At Make It Or Break It Juncture
Chart I-9BEM Exchange Rates Are At Make It Or Break It Juncture
EM Exchange Rates Are At Make It Or Break It Juncture
EM Exchange Rates Are At Make It Or Break It Juncture
Meanwhile, the BRL may be forming an inverted head-and-shoulders pattern (Chart I-10). Hence, continuous BRL strength would signal rising odds of an extension to the rally in Brazilian markets. Chart I-10The Brazilian Real: An Inverted Head-And-Shoulder?
The Brazilian Real: An Inverted Head-And-Shoulder?
The Brazilian Real: An Inverted Head-And-Shoulder?
Finally, industrial metals prices have failed to rebound and appear to be forming a head-and-shoulders formation. This pattern foreshadows considerable downside from current levels (Chart I-11, top panel). In the meantime, oil prices have bounced off their long-term moving average and might have a bit more room to advance before hitting a major resistance between $65-$70 for Brent (Chart I-11, bottom panel).
Image
Bottom Line: Our fundamental view on EM risk assets remains negative due to our expectations of further weakness in China’s growth. However, we are monitoring various signals and indicators to gauge whether the latest rebound can last much longer, which would cause us to change our stance tactically. Arthur Budaghyan, Senior Vice President Emerging Markets Strategy arthurb@bcaresearch.com Peru: Involuntary Monetary Tightening Peru’s central bank is tightly managing the country’s exchange rate. As a result, it has little control over local interest rates. The Impossible Trinity thesis stipulates that in a country that has an open capital account, the central bank can control either interest rates or the exchange rate, not both simultaneously. Provided Peru has an open capital account, its central bank can have tight control over either the exchange rate or interest rates. So long as the central bank focuses on exchange rate stability, local interest rates will fluctuate with its balance of payments (BoP). Therefore, Peru’s credit cycle and hence domestic demand swings and bank share prices are driven by BoP (Chart II-1). Negative BoP dynamics – shrinking inflow of U.S. dollars – causes local interest rates to move higher while a positive BoP leads to lower borrowing costs (Chart II-2). Chart II-1Commodities Prices & Bank Stocks Are Correlated
Commodities Prices & Bank Stocks Are Correlated
Commodities Prices & Bank Stocks Are Correlated
Chart II-2Trade Balance Drives Interbank Rates
Trade Balance Drives Interbank Rates
Trade Balance Drives Interbank Rates
We expect negative BoP dynamics for Peru going forward – metals prices will drop as China’s growth continues to decelerate, and EM countries will likely experience a bout of portfolio capital outflows. If Peru’s central bank continues to favor limited currency depreciation, its interbank rates will march higher. Chart II-3 illustrates that the pace of net foreign exchange reserves accumulation often negatively correlates with interbank rates and leads loan growth by around 12 months (Chart II-4). Chart II-3Peruvian Local Rates Have Risen
Peruvian Local Rates Have Risen
Peruvian Local Rates Have Risen
Chart II-4Peru: Bank Loan Growth Will Relapse
Peru: Bank Loan Growth Will Relapse
Peru: Bank Loan Growth Will Relapse
When the monetary authorities purchase foreign exchange reserves, they inject local currency excess reserves (liquidity) into the banking system. More plentiful banking system liquidity drives down interbank rates and allows banks to expand credit, boosting domestic demand. The reverse also holds true. The Peruvian central bank was able to mitigate upside in local rates amid the negative terms-of-trade shock in 2014-‘15 by conducting foreign currency swaps with banks. This swap led to an injection of local currency reserves into the system. Currently these swaps are being unwound and banks’ excess reserves are dwindling, putting upward pressure on local rates. Hence, the rise in interbank rates in the past 12 months has not only been due to negative terms of trade but also due to the expiration of foreign currency swaps. As metals prices drop and exports contraction deepens, the currency will come under selling pressure (Chart II-5). To prevent the currency from depreciating considerably, the central bank has to tighten liquidity, producing higher interbank rates. The latter bodes ill for domestic demand. Chart II-5Money Growth Is Contingent On Trade
Money Growth Is Contingent On Trade
Money Growth Is Contingent On Trade
Bottom Line: We continue to underweight the Peruvian bourse because of its exposure to mining companies and banks. The former is at risk from falling industrial metals prices, while the latter will suffer from rising interbank rates. Within the mining sector, gold and silver stocks should outperform copper producers because we foresee more downside in industrial metals than precious metals prices. Andrija Vesic, Research Analyst andrijav@bcaresearch.com Footnotes Equity Recommendations Fixed-Income, Credit And Currency Recommendations
Highlights We recently upgraded our recommended investment stance on global corporate bonds to overweight on a tactical (3 to 6 months) basis.1 Feature That change was mostly based on our view that global financial conditions had tightened enough in late 2018 – both through lower equity prices and wider corporate credit spreads – to force central banks (most notably, the Fed) to shift to a less hawkish policy bias. Our opinion that global growth expectations had grown too pessimistic, particularly in the U.S., also played a role in the upgrade (Chart 1). Chart 1Global Corporates: Too Much Bad News Now Discounted
Global Corporates: Too Much Bad News Now Discounted
Global Corporates: Too Much Bad News Now Discounted
One other supporting factor for the upgrade to corporates: the prior bout of spread widening was not justified by a significant worsening of the underlying financial health of companies. With that in mind, this week we are presenting our latest update of the BCA Corporate Health Monitor (CHM) Chartbook. The CHMs are composite indicators of balance sheet and income statement ratios (using both top-down and bottom-up data) that are designed to assess the financial well-being of the overall non-financial corporate sectors in the major developed economies. A brief overview of the methodology is presented in Appendix 1 on Pages 15-16. The broad conclusion from the latest readings on our CHMs is that global credit quality has been enjoying a cyclical improvement, but with divergences starting to open up among individual regions. The U.S. has delivered the biggest improvement in corporate health, thanks largely to the boost to profitability from the Trump corporate tax cuts. Euro area corporates still appear to be in decent health, but are now exposed to the sharp slowing of European growth and the end of the ECB’s buying of corporates through its Asset Purchase Program. Meanwhile, corporate health in the U.K. and Japan is showing some strain from weaker growth in both countries. Given those regional divergences, we continue to prefer U.S. corporates over non-U.S. equivalents, even within that tactical overweight recommendation on global corporate exposure. Beyond that tactical timeframe, however, there are growing risks for corporate bond performance. Our base case scenario is that resilient U.S. growth and inflation will prompt the Fed to restart the rate hike cycle later in the year, creating a more challenging backdrop for corporates from U.S. growth uncertainty and rising volatility. Yet if the U.S. (and global) economy surprises to the downside, that is even worse for corporate bond returns given how the only real improvements in our global CHMs have come from cyclical variables like profit margins and interest coverage. U.S. Corporate Health Monitors: Strong Profits “Trump” High Leverage Our top-down CHM for the U.S. has ever so slightly flipped into the “improving health” zone, after flashing “deteriorating health” since mid-2014 (Chart 2). The resilience of the U.S. economy, combined with the positive impact on U.S. profitability from the Trump corporate cuts, has put U.S. companies in a cyclically healthier position, even with relatively high leverage. Chart 2Top-Down U.S. CHM: Supported By Cyclically Strong Profits
Top-Down U.S. CHM: Supported By Cyclically Strong Profits
Top-Down U.S. CHM: Supported By Cyclically Strong Profits
There are clear uptrends in the ratios that go into the top-down CHM that are directly related to corporate profits – return on capital, profit margins, interest coverage and debt coverage. From a fundamental perspective, the top-down U.S. CHM suggests that the U.S. credit cycle is being extended by the stubborn endurance of the U.S. business cycle. In other words, there are no immediate domestic pressures on U.S. corporate finances that should require significantly wider credit spreads to compensate for rising downgrade/default risk. The bottom-up versions of the U.S. CHMs for IG corporates (Chart 3) and HY companies (Chart 4) have also shown meaningful cyclical progress, with the HY indicator now firmly in “improving health” territory. This confirms that the signal from our top-down CHM is being reflected in both higher rated and lower quality companies. Yet the longer-term issues related to high leverage and low interest/debt coverage are not going away, suggesting that potential problems are being stored up for the next U.S. economic downturn. Chart 3Bottom-Up U.S. IG CHM: Steady, But Have Margins Peaked?
Bottom-Up U.S. IG CHM: Steady, But Have Margins Peaked?
Bottom-Up U.S. IG CHM: Steady, But Have Margins Peaked?
Chart 4Bottom-Up U.S. High-Yield CHM: Only A Cyclical Improvement
Bottom-Up U.S. High-Yield CHM: Only A Cyclical Improvement
Bottom-Up U.S. High-Yield CHM: Only A Cyclical Improvement
Interest coverage remains the key ratio to watch in both the IG and HY bottom-up U.S. CHMs. For IG, the fact that interest coverage has fallen in recent years, despite high profit margins and historically low corporate borrowing rates, is worrisome. This indicates that the stock of U.S. corporate debt is now so large that the interest expense required to service that debt is eating up a greater share of corporate revenues, even at a time when profit growth is still quite strong. This will raise downgrade risk if corporate borrowing rates were to increase significantly or if U.S. earnings growth slows sharply – likely from rising labor costs eroding high profit margins. For HY, interest coverage remains depressed by historical standards, with the liquidity ratio down to levels last seen prior to the 2009 recession. This suggests that U.S. HY companies are at risk of a severe default cycle when the current U.S. economic expansion ends, with fewer liquid assets available to meet current liabilities. Given these more medium-term fundamental concerns, we do not plan on overstaying our current tactical overweight stance on U.S. IG and HY corporates versus both U.S. Treasuries and non-U.S. corporates (Chart 5). We anticipate cutting our recommended exposure once the Fed begins signaling a need to restart the rate hikes, likely around mid-year. For those with an investment horizon beyond the next six months, the more prudent decision may be to sell into the corporate bond outperformance that we are expecting. The medium-term outlook for U.S. corporates is far more challenging given the advanced age of the U.S. monetary, business and credit cycles. Chart 5U.S. Corporates: Stay Tactically Overweight IG & HY
U.S. Corporates: Stay Tactically Overweight IG & HY
U.S. Corporates: Stay Tactically Overweight IG & HY
Euro Corporate Health Monitors: Stable, But Slowing Growth Is A Problem The CHMs remain a core part of our suite of bond market indicators, reliably proving their usefulness in helping evaluate the fundamental risks in owning corporate bonds. That does not, however, mean that there is no room for improvement in the CHM methodology from time to time. This is the case for our top-down CHM for the euro area, which has been behaving in a manner inconsistent with our bottom-up CHMs for the region – which are based on actual reported financial data from publicly traded companies – for some time. This is not the case in the U.S., where our bottom-up and top-down CHMs continue to move broadly in lockstep. Thus, we are taking our top-down euro area CHM “into the garage” for repairs. We will revisit all aspects of the methodology, from calculations to data sources, to try and improve the signal from the top-down euro area CHM. We plan on introducing a new and (hopefully) improved indicator sometime in the next few months. The message from our bottom-up CHMs for euro area IG and HY is still generally positive for overall European corporate health. Yet there are noticeable divergences within the sub-components of those individual CHMs that paint a more worrisome picture. For IG, the gap between domestic and foreign issuers in the euro area corporate bond market continues to widen, with the former worsening on the margin (Chart 6). While interest/debt coverage has improved for domestic issuers, operating margins and return on capital remain low and leverage has been inching higher. These trends have not been matched by foreign issuers. Perhaps most ominously, the short-term liquidity ratio has fallen quite sharply for domestic IG issuers in the euro area. Chart 6Bottom-Up Euro Area IG CHMs: Stable, But Watch Liquidity Ratios
Bottom-Up Euro Area IG CHMs: Stable, But Watch Liquidity Ratios
Bottom-Up Euro Area IG CHMs: Stable, But Watch Liquidity Ratios
For HY, the signal from the bottom-up CHM is more consistently positive between domestic and foreign issuers (Chart 7). Leverage has declined and operating margins have improved for both sets of issuers, but interest/debt coverage and liquidity are worse for domestic issuers. Chart 7Bottom-Up Euro Area High-Yield CHMs: Cyclically Healthier
Bottom-Up Euro Area High-Yield CHMs: Cyclically Healthier
Bottom-Up Euro Area High-Yield CHMs: Cyclically Healthier
Within the euro area, our bottom-up IG CHMs for Core and Periphery countries show that both remain in the “improving health” zone (Chart 8). Yet the CHM for the Core now sits on the edge of the “deteriorating health” zone, led by higher leverage, lower debt coverage and a sharply falling liquidity ratio. Notably, there is no gap between the profitability metrics of the Core and Peripheral companies used in our bottom-up CHMs. Chart 8Bottom-Up Euro Area IG CHMs: Trending In Wrong Direction
Bottom-Up Euro Area IG CHMs: Trending In Wrong Direction
Bottom-Up Euro Area IG CHMs: Trending In Wrong Direction
Peripheral European issuers continue to have much higher leverage and much lower interest coverage, the latter suggesting that Core issuers have benefitted more from the ECB’s super-easy monetary policies that have lowered borrowing costs (negative short-term interest rates, liquidity programs designed to prompt low-cost bank lending, and asset purchase programs that include buying of corporate bonds). Despite the lack of a major negative signal from the CHMs, we are concerned that the combination of slowing euro area economic growth and the end of ECB corporate bond buying will negatively impact the performance of euro area corporates (Chart 9). We are only maintaining a neutral allocation to euro area corporates, even within our current overweight stance on overall global corporates. In addition, we are sticking with our preference to favor U.S. corporates – both IG and HY – over euro area equivalents for two important reasons: stronger U.S. growth and better U.S. corporate health. Chart 9Euro Area Corporates: Stay Tactically Neutral IG & HY
Euro Area Corporates: Stay Tactically Neutral IG & HY
Euro Area Corporates: Stay Tactically Neutral IG & HY
Euro area corporates have not enjoyed the same rally that U.S. corporates have seen so far in 2019, and for good reasons. In Chart 10, we show an overall bottom-up CHM for the U.S. and euro area, combining both IG and HY are combined into a single measure for each region.2 The obvious visible trend is that U.S. corporate health has been steadily improving, while it is starting to worsen in the euro area. The gap between those two CHMs is strongly correlated to the difference in credit spreads between European and U.S. issuers (middle panel), suggesting that relative corporate health is favoring U.S. names. At the same time, the relatively stronger U.S. economy continues to support U.S. corporate performance versus euro area equivalents (bottom panel). Chart 10Relative Bottom-Up CHMs: Continue To Favor U.S. Over Europe
Relative Bottom-Up CHMs: Continue To Favor U.S. Over Europe
Relative Bottom-Up CHMs: Continue To Favor U.S. Over Europe
U.K. Corporate Health Monitor: A Brexit-Fueled Deterioration Our top-down U.K. CHM indicates that U.K. companies remain in the “improving health” zone, but just barely as the indicator has been drifting towards “deteriorating health” over the past two years. All the components of the U.K. CHM have contributed to this worsening trend (Chart 11). Even short-term liquidity, which has been in a powerful uptrend for almost a decade, has started to roll over. Chart 11U.K. Top-Down CHM: Cyclical Hit From Brexit Worries
U.K. Top-Down CHM: Cyclical Hit From Brexit Worries
U.K. Top-Down CHM: Cyclical Hit From Brexit Worries
The cause for this deterioration can be reduced to six letters: B-R-E-X-I-T. Two years of political uncertainty over the details of the U.K.’s future relationship with the European Union have eroded confidence among U.K. businesses and consumers. The result is slowing economic growth and diminished corporate profitability that has hit all earnings-related ratios in the U.K. CHM. Perhaps most disturbingly for U.K. credit performance, even the interest coverage ratio has rolled over – at a historically low level – despite the Bank of England keeping U.K. interest rates at deeply depressed levels. The toxic combination of political uncertainty and weaker economic growth has resulted in a substantial widening of U.K. credit spreads. The spread on U.K. HY corporates has widened by 293bps since September 2017 and now sits at the widest level since September 2012. U.K. IG has not seen the same degree of spread widening, but has underperformed even more on an excess return basis versus duration-matched U.K. Gilts (Chart 12). Chart 12U.K. Corporates: Brexit Uncertainty = Stay Underweight
U.K. Corporates: Brexit Uncertainty = Stay Underweight
U.K. Corporates: Brexit Uncertainty = Stay Underweight
We are currently recommending an underweight stance on U.K. corporates, even as we have become more tactically positive on overall global corporate exposure. While credit spreads have widened to levels that appear to offer value, U.K. economic momentum is fading steadily and leading economic indicators are pointing to even slower growth in 2019. With Conservative Prime Minster Theresa May now in a dramatically weakened position after losing the recent vote on her Brexit deal with the EU, there are no immediate options that will solve the Brexit uncertainty in a way that will provide a lasting boost to U.K. business confidence. In fact, the only realistic options – postponing Brexit, fresh U.K. elections, even a second Brexit referendum – all involve a period of even more uncertainty that will weigh on the performance of U.K. corporate debt. Japan Corporate Health Monitor: A Negative Signal Our bottom-up Japan CHM3 has consistently stayed in the “Improving health” zone since 2010; however, the most recent data shows that the health of Japanese corporates has started to deteriorate as the last data point from Q3/2018 is just above the zero line (Chart 13). The overall Japanese economy has generally performed well (by Japanese standards) over the past few years, boosted by “Abenomics” economic stimulus combined with the extraordinarily easy monetary policies of the Bank of Japan. Yet the slowing of global growth momentum seen in 2018 has weighed on the performance of the Japanese corporate sector, which is still heavily geared to exports and global growth. Chart 13Japan Bottom-Up CHM: Cyclical Deterioration
Japan Bottom-Up CHM: Cyclical Deterioration
Japan Bottom-Up CHM: Cyclical Deterioration
Looking at the components of the CHM, there was a modest deterioration of all the ratios last year, except for profit margins which have been virtually unchanged since 2015. On an absolute basis, the CHM components do not suggest any major problems with Japanese credit quality. Japanese companies are not highly levered and liquidity remains near the highest level seen since at least the mid-2000s. Interest coverage is still high on a historical basis and is much higher than the ratios seen in the other major developed markets. Yet at the same time, return on capital and profit margins remain very low compared to those same other major economies. Japanese companies remain cash-rich with low debt levels – a sharp contrast to the other countries show in this report. There are many potential cyclical risks for Japanese corporates in 2019: even weaker demand for Japanese exports, the drag on Japanese capital spending from firms worried about slowing global growth and the spillover effects from the U.S.-China trade war, even a possible hike in the consumption tax that the Abe government is still considering for October of this year. Yet these all would prevent any adjustment of the interest rate policy of the Bank of Japan, which remains the biggest factor to consider when looking at the investment prospects of Japanese corporate bonds. Japanese corporate spreads did not widen much compared to other countries’ corporate spreads in the 2018 selloff, due to their relative illiquidity and the extreme low level of interest rates in Japan. As the central bank is under no pressure to move off its current hyper-easy monetary policy settings, government bond yields and corporate spreads will remain low, even if the Japanese economy continues to slow. Therefore, for those investors who have access to the relatively small Japanese corporate debt market, we continue to recommend an overweight stance on Japanese corporates vs Japanese government bonds (Chart 14). Chart 14Japan Corporates: Stay Overweight Vs JGBs
Japan Corporates: Stay Overweight Vs JGBs
Japan Corporates: Stay Overweight Vs JGBs
Canada Corporate Health Monitor: Now Even Healthier Both our top-down and bottom-up Canadian CHMs indicate an improving trend in Canadian corporate health (Chart 15). Steady above-trend economic growth, combined with some increases in realized inflation, have helped boost the profitability and interest/debt coverage ratios. Yet not all the news is good - leverage is high and rising, while the absolute levels of return on capital and debt/interest coverage are low. This may be building up risks for the next Canadian economic downturn but, for now, Canadian companies look in decent shape. Chart 15Canada CHMs: Supported By Solid Growth
Canada CHMs: Supported By Solid Growth
Canada CHMs: Supported By Solid Growth
With so much of Canada’s economy (and its financial markets) geared to the performance of the energy sector, the recent recovery in global oil prices is a significant boost for the overall Canadian corporate market. Our commodity strategists see additional upside in oil prices over the next 6-9 months, which will further underpin the health of Canadian oil companies. Canadian corporates were not immune to the period of global spread widening seen at end of 2018, but the magnitude of the move was modest (Chart 16). This is a function of the still-low interest rate environment in Canada, where the Bank of Canada has not yet lifted policy rates to its own estimate of neutral (2.5-3.5%). Easy monetary conditions and relatively low Canadian interest rates will continue to make Canadian corporates relatively attractive, in an environment of decent growth and firm corporate health. Chart 16Canadian Corporates: Stay Overweight Vs Canadian Govt. Debt
Canadian Corporates: Stay Overweight Vs Canadian Govt. Debt
Canadian Corporates: Stay Overweight Vs Canadian Govt. Debt
We continue recommending an overweight position in Canadian corporate debt relative to Canadian government bonds on a tactical basis. Spreads have been in a very stable range since the 2009 recession, ranging between 100-200bps even during periods when our CHMs were indicating worsening corporate health. To break out of that range to the upside, we would need to see a sharp deterioration of Canadian economic growth or several more rate hikes from the Bank of Canada – neither outcome is likely over at least the next six months. Yet given how closely the Bank of Canada has been tracking the Fed’s current tightening cycle, we anticipate downgrading Canadian corporates at the same time do the same for U.S. corporates, likely around mid-2019. Robert Robis, CFA, Senior Vice President Global Fixed Income Strategy rrobis@bcaresearch.com Ray Park, CFA, Research Analyst ray@bcaresearch.com Appendix 1: An Overview Of The BCA Corporate Health Monitors The BCA Corporate Health Monitor (CHM) is a composite indicator designed to assess the underlying financial strength of the corporate sector for a country. The Monitor is an average of six financial ratios inspired by those used by credit rating agencies to evaluate individual companies. However, we calculate our ratios using top-down (national accounts) data for profits, interest expense, debt levels, etc. The idea is to treat the entire corporate sector as if it were one big company, and then look at the credit metrics that would be used to assign a credit rating to it. Importantly, only data for the non-financial corporate sector is used in the CHM, as the measures that would be used to measure the underlying health of banks and other financial firms are different than those for the typical company. The six ratios used in the CHM are shown in Table 1 below. To construct the CHM, the individual ratios are standardized, added together, and then shown as a deviation from the medium-term trend. That last part is important, as it introduces more cyclicality into the CHM and allows it to better capture major turning points in corporate well-being. Largely because of this construction, the CHM has a very good track record at heralding trend changes in corporate credit spreads (both for Investment Grade and High-Yield) over many cycles. Table 1Definitions Of Ratios That Go Into The CHMs
BCA Corporate Health Monitor Chartbook: Still OK … For Now
BCA Corporate Health Monitor Chartbook: Still OK … For Now
Top-down CHMs are now available for the U.S., euro area, the U.K. and Canada. The CHM methodology was extended in 2016 to look at corporate health by industry and by credit quality.4 The financial data of a broad set of individual U.S. and euro area companies was used to construct individual “bottom-up” CHMs using the same procedure as the more familiar top-down CHM. Some of the ratios differ from those used in the top-down CHM (see Table 1), largely due to definitional differences in data presented in national income accounts versus those from actual individual company financial statements. The bottom-up CHMs analyze the health of individual sectors, and can be aggregated up into broad CHMs for Investment Grade and High-Yield groupings to compare with credit spreads. In 2018, we introduced bottom-up CHMs for Japan and Canada. With the country expansion of our CHM universe, we now have coverage for 92% of the Bloomberg Barclays Global Aggregate Corporate Bond Index (Appendix Chart 1).
Image
Appendix 2: U.S. Bottom-Up CHMs For Selected Sectors
APPENDIX 2: ENERGY SECTOR
APPENDIX 2: ENERGY SECTOR
APPENDIX 2: MATERIALS SECTOR
APPENDIX 2: MATERIALS SECTOR
APPENDIX 2: COMMUNICATIONS SECTOR
APPENDIX 2: COMMUNICATIONS SECTOR
APPENDIX 2: CONSUMER DISCRETIONARY SECTOR
APPENDIX 2: CONSUMER DISCRETIONARY SECTOR
APPENDIX 2: CONSUMER STAPLES SECTOR
APPENDIX 2: CONSUMER STAPLES SECTOR
APPENDIX 2: HEALTH CARE SECTOR
APPENDIX 2: HEALTH CARE SECTOR
APPENDIX 2: INDUSTRIALS SECTOR
APPENDIX 2: INDUSTRIALS SECTOR
APPENDIX 2: TECHNOLOGY SECTOR
APPENDIX 2: TECHNOLOGY SECTOR
APPENDIX 2: UTILITIES SECTOR
APPENDIX 2: UTILITIES SECTOR
Footnotes 1 Please see BCA Global Fixed Income Strategy Weekly Report, “Enough With The Gloom: Upgrade Global Corporates On A Tactical Basis”, dated January 15th, 2019, available at gfis.bcaresearch.com. 2 We only use the CHMs for euro area domestic issuers in this aggregate bottom-up CHM, as this is most reflective of uniquely European corporate credits. This also eliminates double-counting from U.S. companies that issue in the euro area market that are part of our U.S. CHMs. 3 We do not currently have a top-down CHM for Japan given the lack of consistent government data sources for all the necessary components. 4 Please see Section II of The Bank Credit Analyst, “U.S. Corporate Health Gets A Failing Grade”, dated February 2016, available at bca.bcaresearch.com Recommendations The GFIS Recommended Portfolio Vs. The Custom Benchmark Index
BCA Corporate Health Monitor Chartbook: Still OK … For Now
BCA Corporate Health Monitor Chartbook: Still OK … For Now
Duration Regional Allocation Spread Product Tactical Trades Yields & Returns Global Bond Yields Historical Returns
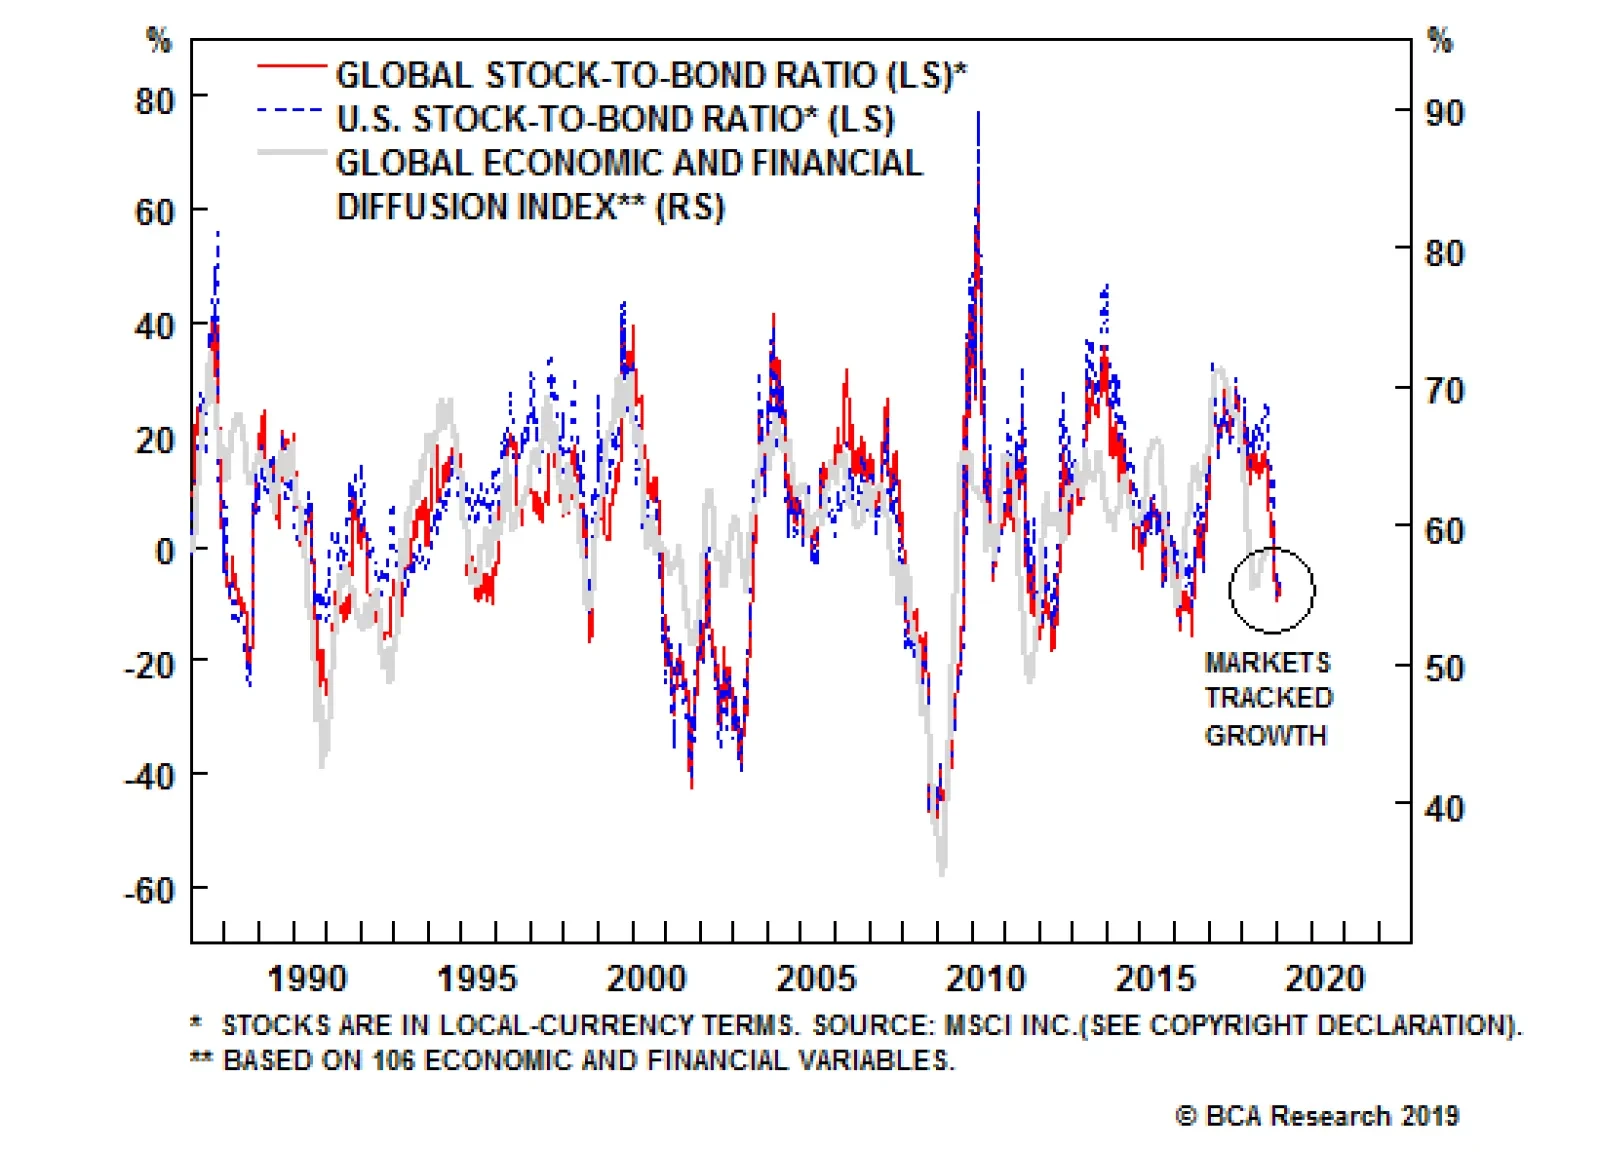
Due to slowing Chinese credit growth and the tightening in global liquidity conditions, global growth has suffered. However, the global and U.S. stock-to-bond ratios, two financial market metrics finely tuned to global economic gyrations, have already fallen…
In a report published early last August, I wrote that: “The perfect time for equity investing is when markets are cheap, earnings expectations are overly pessimistic and the monetary environment is highly accommodative. Currently, the opposite conditions exist: valuations are stretched, earnings expectations are euphoric and the Fed is in tightening mode. It does not seem a propitious time to be aggressive.” By the end of the year, the MSCI All-Country Index had declined by around 12%, with the S&P 500 down by a similar amount. Against that background, valuations improved, earnings expectations moderated and the Fed adopted a less hawkish tone. And, not surprisingly, investors and traders became much less bullish about the outlook, a positive development from a contrary perspective. As a result, BCA’s equity stance was upgraded to overweight from both a 3- and 12-month perspective. With no recession imminent and the Fed likely to raise rates by less than previously feared, we took the view that the path of least resistance for equities was up. There is no requirement at BCA for strategists to agree on the outlook. In fact, the opposite is true in that we encourage independent thinking and diverse ways of looking at the world. I have no strong reasons to disagree with the view that equities will end this year higher, and thus outperform bonds and cash. However, my concerns about the longer-run outlook, coupled with the potential for further late-cycle volatility, temper my comfort with an overweight position. Of course, this merely cements my reputation amongst colleagues as the resident BCA bear! What Troubles Me There rarely is a shortage of economic, financial or political issues to worry about. Even in the best of times, one can always find some problems and potential threats to the outlook. Contrary to my current reputation within BCA, I am not always bearish – I turned more positive on equities in the spring of 2009 and embraced the rally for most of the subsequent decade. However, notwithstanding the potential for equity prices to move higher this year, I perceive three particular challenges to an optimistic view of the outlook: The outlook for U.S. corporate earnings given the likelihood that labor’s share of income will rise from current unusually low levels. The financial markets’ addiction to easy money and low interest rates that may delay the normalization of monetary policy and encourage financial imbalances and excessive risk-taking. The unprecedented rise in U.S. federal deficits at a time of strong economic growth. There will be a price to pay down the road. Notably absent from this list is any mention of trade wars, Brexit, China, U.S. political dysfunction, recession risks and the many other issues that feature in news headlines. I do care about these things, but the three topics mentioned above are enough reason to be concerned, without piling on other problems. The Extraordinary Performance Of U.S. Profits, But… One of the most remarkable features of the past decade’s economic environment has been the impressive performance of U.S. corporate earnings. Despite the weakest economic recovery on record, profit margins have soared to an all-time peak (Chart 1). How on earth did companies manage that? Let’s start by noting what strong earnings growth did NOT reflect. Chart 1An Impressive Margin Performance
An Impressive Margin Performance
An Impressive Margin Performance
First, there has not been above-trend growth in top-line revenues. The top panel of Chart 2 shows that S&P 500 sales have grown broadly in line with nominal U.S. corporate GDP over the past two decades. Second, related to the above point, there has not been a great environment for corporate pricing power. The corporate sector inflation rate has averaged a measly 1.2% during the past decade. Third, despite ongoing technological innovations, earnings have not benefited from a revival in productivity growth. Corporate sector productivity has grown at only a moderate 1.1% pace during the past 10 years, far below its historical average (third panel of Chart 2). Chart 2No Major Improvements Here!
No Major Improvements Here!
No Major Improvements Here!
Finally, one other popular explanation – low interest rates - also can be ruled out as a major driver of the profit cycle. The large decline in interest rates since the Great Recession has clearly benefited some companies, but interest payments as a share of pre-tax profits have not shown much net change in the decade (final panel of Chart 2). In recent years, the lower level of rates has been offset by an increase in outstanding debt. We are left with two major drivers of the rise in margins: lower tax rates and, more importantly, tight control over labor costs. The effective tax rate paid by domestic non-financial companies averaged 21.7% between 2010 and 2017 compared with 26.7% between 2000 and 2007 (Chart 3). And the rate plunged further in 2018 in response to the large cut in the federal corporate tax rate from 35% to 21%. Had the effective tax rate continued to average 26.7% after 2010, after-tax profits of domestic non-financial companies would have grown at a much-reduced pace during the past eight years. Chart 3Corporate Tax Burdens Have Declined
Corporate Tax Burdens Have Declined
Corporate Tax Burdens Have Declined
We finally come to the main explanation of remarkable earnings growth: the corporate sector’s success in capturing much of the benefits of higher productivity, rather than sharing it with labor. Historically, real employee compensation in the corporate sector rose in line with productivity, allowing both employees and the employers to enjoy the rewards of increased efficiencies. As a result, the shares of income going to capital and labor were among the most mean-reverting series in the economy (Chart 4). Chart 4A Major Divergence in Income Shares
A Major Divergence in Income Shares
A Major Divergence in Income Shares
Everything changed around 2000 when real compensation began to stagnate, even as productivity continued to rise (Chart 5). Labor’s bargaining power was eroded by the combination of globalization and technological innovations, allowing companies to keep a tight grip on wage costs. The returns to capital soared while those to labor collapsed, with both moving to more than four standard deviations away from historical averages – an extraordinary divergence. If real employee compensation had continued to rise in line with productivity after 2000, then EBITD margins1 would be at their historical mean, rather than at a high extreme. Chart 5Labor Gets Left Behind
Labor Gets Left Behind
Labor Gets Left Behind
The corporate sector’s ability to expand at the expense of labor has now come to an end. Wage growth has started to rise against the backdrop of an increasingly tight labor market. As a result, the labor share of income bottomed at the end of 2017 and the capital share peaked. Populist pressures against globalization also argue for an increased labor share. The payoff to earnings growth from the drop in the corporate tax rate also will end this year. It was a one-off event with no further cuts in prospect. The bottom line is that the major tailwind (weak wage growth) behind strong U.S. earnings has turned into a headwind, while the secondary one (lower taxes) is ending. When it comes to S&P earnings (as opposed to the national income measure of profits), an additional supporting factor has been the decline in outstanding share balances that has boosted earnings per share. Many companies have taken advantage of low interest rates to raise debt and use the proceeds to buy back shares. However, with leverage now high and interest rates off their lows, the incentive for such financial engineering is diminishing. Debt growth has slowed and so should the pace of share buybacks (Chart 6). Chart 6Lots Of Financial Engineering
Lots Of Financial Engineering
Lots Of Financial Engineering
The ever-optimistic analyst community remains unfazed about the above trends. According to IBES data, analysts’ individual company estimates imply long-run earnings growth of more than 16% a year for the S&P 500 universe (Chart 7). That is more than double average historical earnings growth. It was exceeded only by the insane optimism at the peak of the tech bubble in the late 1990s/early 2000, and we know how that ended! There can only be disappointment and an eventual marked downgrading of these earnings expectations. In my view, earnings will be lucky to grow at 3% a year over the long run from current elevated levels. Chart 7Euphoric Long-Run Earnings Estimates
Euphoric Long-Run Earnings Estimates
Euphoric Long-Run Earnings Estimates
Some may argue that these long-term earnings estimates are irrelevant because investors pay them little attention. But there is a loose correlation between valuations and these earnings estimates, and while the price-earnings ratio (PER) has declined from its peak, it remains above its historical average. If long-term earnings estimates come down that should undermine the PER. Perhaps the causality is the other way: high valuations encourage analysts to inflate their earnings projections, but that would not be any more encouraging. Either way, it is a bearish chart. The Addiction To Easy Money The Fed’s gradual retreat from its hyper-easy policy stance was well telegraphed, but still unsettled the markets. That is the problem with addictions – the withdrawal period is always difficult. That has put the Fed in a tricky position as it must balance the need to prevent an overheated economy with the need to maintain financial stability. History suggests that the odds of the Fed getting it just right are slim. Adopting a cautious approach to tightening risks the worst of both worlds: falling behind the curve on inflation while encouraging financial speculation and imbalances. The Fed embraced an extended period of easy policy in the first half of the 2000s after the tech bubble burst, with the fed funds rate kept far below the growth in nominal GDP (Chart 8). If money is unusually cheap, then speculation and financial excesses are inevitable. The easy money period of the 1990s helped fuel the tech bubbles and the more extended period of easy money in the 2000s fueled the housing bubble. Once again, we have interest rates far below the growth in GDP and, not surprisingly, this has fed financial euphoria. Chart 8Monetary Policy Still Looks Accomodative
Monetary Policy Still Looks Accomodative
Monetary Policy Still Looks Accomodative
The Fed has raised the federal funds rate by 225 basis points over the past three years, with nine increases of 25 basis points each. Four of the moves occurred in 2018 and have been blamed for financial problems in emerging economies and volatility in developed equity markets. Yet, all the Fed has done is bring the real fed funds rate out of negative territory. If a real funds rate of only 0.5% is enough to trigger extreme market volatility and threaten the economic expansion, then the system is much more vulnerable than generally assumed. There is much discussion in economic circles about the level of the real equilibrium interest rate – the rate consistent with the economy growing at trend, currently estimated to be around 2% a year. In the past, a simple rule of thumb was that real rates, over time, would have some approximation to the real growth in the economy. However, some studies (including by the Fed) argue that the real equilibrium rate may now be close to zero, far below the trend growth of the economy. If real rates close to zero are all that the economy can tolerate then that raises interesting questions. Does it mean that the economy’s growth potential could be much lower than 2%? Does it mean that if real rates have to be kept close to zero, then speculative activities in the markets will continue to build, ultimately threatening financial stability? Either way, it does not seem to be a positive story. Some worry that the Fed is making a mistake in both raising rates and unwinding its bloated balance sheet (aka QT or quantitative tightening). I believe this concern is hugely overstated. Contrary to popular opinion, the expansion in the Fed’s balance sheet did not lead to a surge of liquidity that drove asset prices sharply higher. Of course, the Fed’s bond purchases lowered yields and that forced money into riskier assets. However, there was no increased flood of money in the broader financial system. Quantitative easing (QE) led to a dramatic rise in bank reserves at the Fed, but there was no corresponding sustained surge in M2 – the measure of money supply that is more reflective of money available for economic and/or financial transactions. In other words, the money multiplier (the ratio of M2 to the narrow money) collapsed (Chart 9). This is because the credit system was impaired after the 2007-09 meltdown and the Fed was largely pushing on a string in its attempts to bring it back to life. The main way that Fed policy drove asset prices higher was keeping short rates close to zero because that gave investors a massive reason to take on more risk. Chart 9The Monetary Plumbing Has Blockages
The Monetary Plumbing Has Blockages
The Monetary Plumbing Has Blockages
If QE was not the driving factor behind the bull market in stocks, then we should not be overly concerned about QT. Yes, investors will be forced to absorb more bond issuance as the Fed ceases to be a buyer. However, it is interesting to note that the current 10-year Treasury yield of 2.7% is no higher than five years ago, even though the Fed’s balance sheet has begun to shrink and the Fed has hiked rates nine times over the period (Chart 10). Chart 10Monetary Policy And Bond Yields
Monetary Policy And Bond Yields
Monetary Policy And Bond Yields
The bottom line is that the Fed should continue on its path of reducing its balance sheet and not be timid about raising rates if the economy continues to grow in excess of a 2% pace. At some point there will be another recession and the Fed may well be blamed. But that is a lesser evil than feeding the addiction to easy money by prolonging the period of excessively low rates. Fiscal Profligacy The federal deficit is expected to reach around $1 trillion this year, around 5% of GDP. There is no precedent for such a large peacetime deficit during the late stage of an economic expansion (Chart 11). And, assuming current policies remain in place, the Congressional Budget Office (CBO) expects the deficit to rise rather than fall over the next few decades given the aging population’s impact on entitlement programs. Chart 11Fiscal Policy Has Become Pro-Cyclical
Fiscal Policy Has Become Pro-Cyclical
Fiscal Policy Has Become Pro-Cyclical
There is no strong support for fiscal discipline in Congress. Neither party has the stomach to tackle the problem of entitlements, those on the right want more spending on defense, while those on the left want more spending on social programs. One should never be surprised that politicians prefer fiscal profligacy to austerity. It is no fun and is injurious to re-election prospects to advocate spending cuts and tax increases. When things start to get of hand, the burden of imposing fiscal discipline falls on the markets. Currently, markets do not appear fazed by fiscal trends. The 10-year Treasury bond yield remains below 3% and the gap between 30- and 10-year yields is low. If markets are worried about government finances, that gap tends to widen as investors demand a fiscal premium to hold longer-duration bonds (Chart 12). Chart 12Bond Investors Unfazed By The Deficit...For Now
Bond Investors Unfazed By The Deficit...For Now
Bond Investors Unfazed By The Deficit...For Now
Presumably, investor complacency about the grim fiscal picture reflects a list of other more important economic and financial concerns that are suppressing yields. There will be a limit to this fiscal tolerance, but we just don’t know exactly where it is. Japan’s gross government debt has exceeded 200% of GDP throughout the past decade without a financial crisis, but that is a poor model for what the U.S. can manage. Japan does not need to borrow from abroad and thus finances its deficits internally. In contrast, the U.S. current account deficit is still running at around $500 billion a year and the country is, by far, the world’s largest international debtor. Yes, the dollar is the international reserve currency of choice and the U.S. receives the exorbitant privilege from that. However, that will not protect the U.S. currency or markets from an eventual loss of investor confidence. I accept that a fiscal-related bond/currency market crisis could be years away, and timing is everything! Nonetheless, the current lack of fiscal discipline does pose a threat to markets because it could limit the authorities’ room to enact stimulus in the next recession. How I Could Be Wrong I have strong convictions about the views I expressed, but that does not mean I will be proved right. Let’s examine some counter arguments. On earnings, my pessimism will be unfounded if the corporate sector manages to keep a tight grip on wages and/or there is a sustained marked improvement in productivity. Of course, we need to exclude subdued wages that arise because of an economic slowdown as that would undermine sales growth. It would be remarkable if the nascent upturn in wage growth suddenly reverses without a renewed rise in unemployment so I would put low odds on that. As far as productivity is concerned, there are lots of interesting innovations these days, but none seem to be game changers within a five-year horizon. Autonomous vehicles will certainly be huge for several sectors but widespread adoption is still some time away. However, it is important to keep an open mind on this and I will certainly change my view if the data improve meaningfully. Turning to monetary policy, I suppose it is possible that the Fed will miraculously calibrate policy to achieve a soft economic landing and maintain financial stability. They have never been able to do this in the past but there is a first time for everything. Needless to say, I am hugely skeptical but time will tell. Finally, on fiscal policy, you would have to be an extreme optimist to believe that politicians will suddenly enact the politically painful measures required to restore order to government finances. The current Administration has shown no signs of fiscal responsibility and the opposition have not raised this as an issue. If anything, there are calls for even more spending. History shows that governments generally skirt to the edge of a severe crisis before they reluctantly embrace austerity. In other words, I do not see much case to be optimistic here. Concluding Thoughts On average, the stock market is more likely to rise than fall. Since 1950, the S&P has recorded monthly gains 60% of the time. In other words, it generally has paid to be bullish. This was particularly true between end-1982 and end-2018 with the S&P 500 delivering above-average compound annual returns of around 11% a year (8% a year in real terms), despite two 50%+ market declines during the period. This was the greatest 36-year period for financial assets in history, driven by falling inflation and interest rates, major corporate restructuring that boosted profit margins, rising equity multiples and a huge expansion in credit growth. Looking ahead, the environment will be very different. Inflation and interest rates are more likely to rise than fall, profit margins will be under pressure, it would imprudent to expect sustained gains in multiples, and broad credit growth will not return to its earlier rapid pace. Thus, future returns will be a pale shadow of the past performance. Against the above background, I don’t think I am being overly pessimistic. However, I understand that many investors do not have the luxury of taking a long-term view. For those who are in a competition to beat their peers, it can be disastrous to stand on the sidelines while the market marches higher. Moreover, if returns are going to be modest by past standards, it puts a premium on market timing, as difficult as that may be. So I do not recommend ignoring the BCA view that equities will outperform bonds and cash this year. My concerns are for the long run. The obvious question is: how should one invest in a world of low returns? I doubt that piling into alternative investments will be the solution as these assets will be affected by the same macro forces as conventional assets. The answer is a rather boring and obvious one. In the absence of being a market-timing and stock/sector-selection genius or investing with such a person, capital preservation has become more important. When returns are low, it takes longer to recover from market losses. This means one should maintain a conservative portfolio bias with higher-than-normal levels of cash. Martin H. Barnes, Senior Vice President Economic Advisor mbarnes@bcaresearch.com Footnotes 1 EBITD = earnings before interest, taxes and depreciation. This measure best reflects the performance of earnings as it relates to output, wages, prices and productivity.
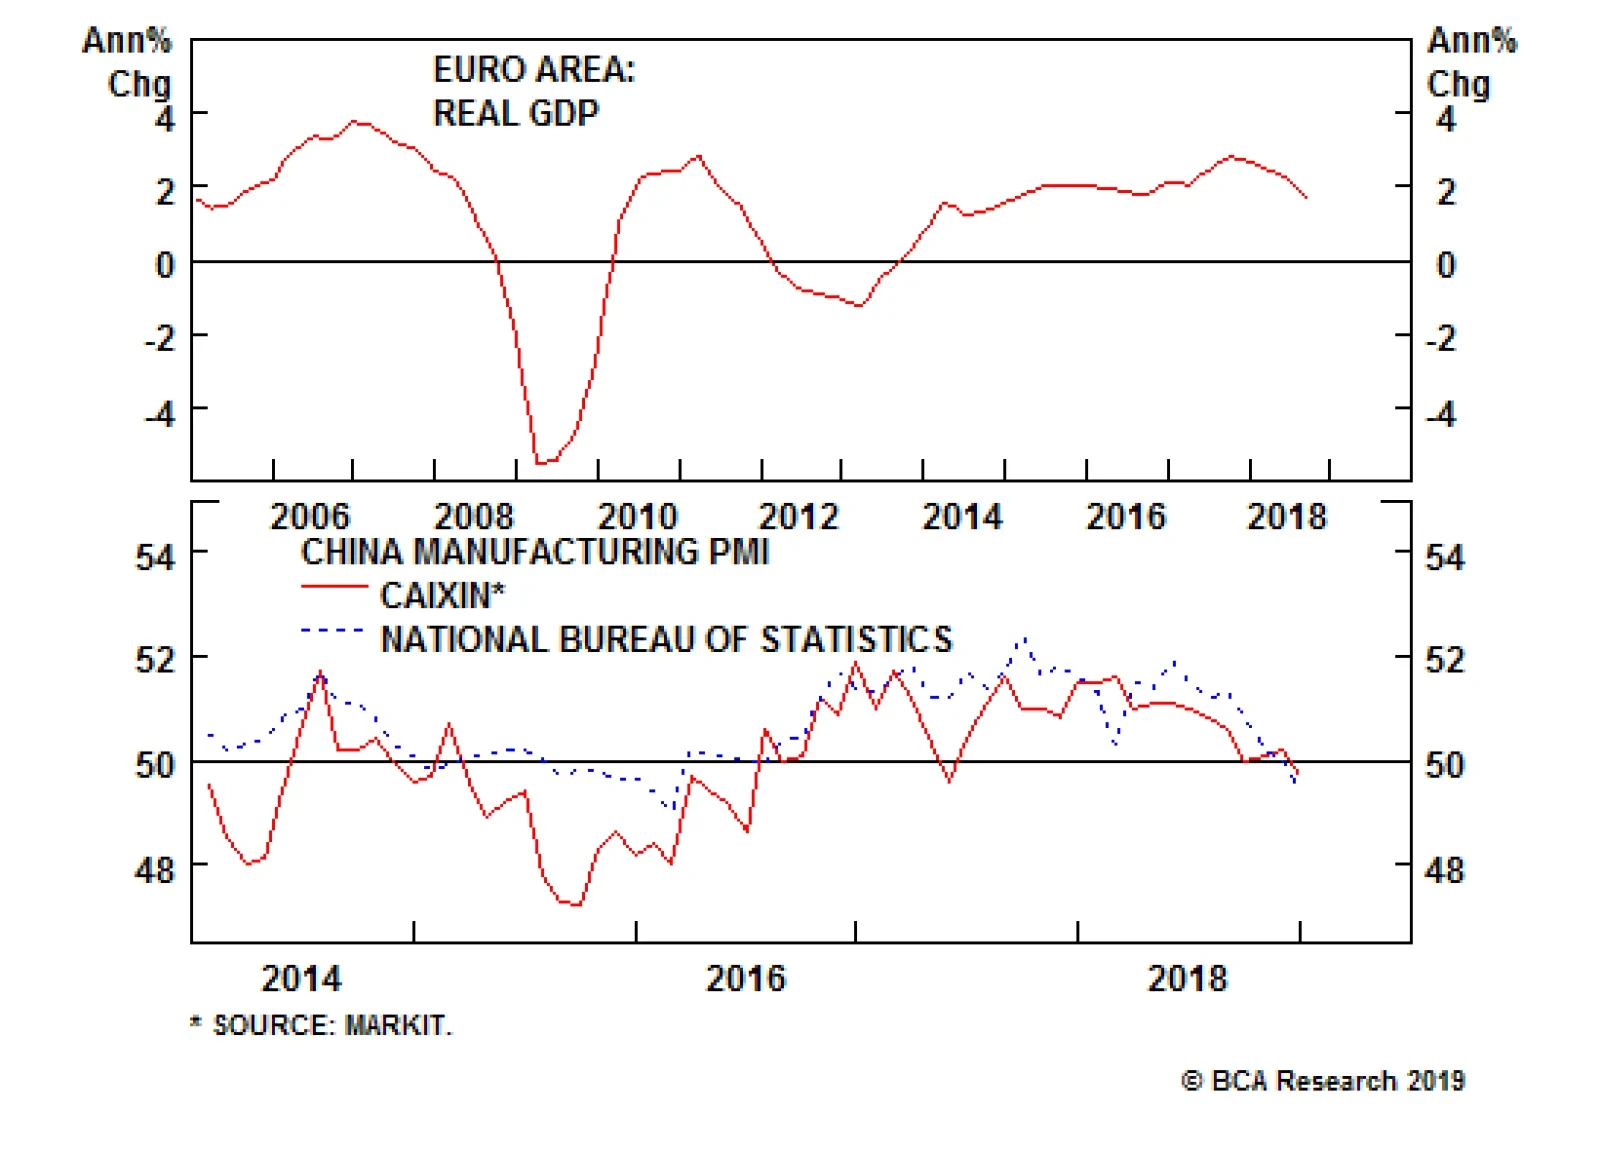
In the U.S., the FOMC meeting ends Wednesday. While no policy changes are anticipated, the press conference could provide color on the Fed’s thought on its balance sheet policy as well as the potential factors that will determine the durability of its…