Global
The highlight of next week will be the highly anticipated Xi-Trump meeting at the G20 in Osaka on Friday or Saturday. BCA does not anticipate a deal that will end the trade to come out of this get-together, but an agreement for China and the U.S. to start…
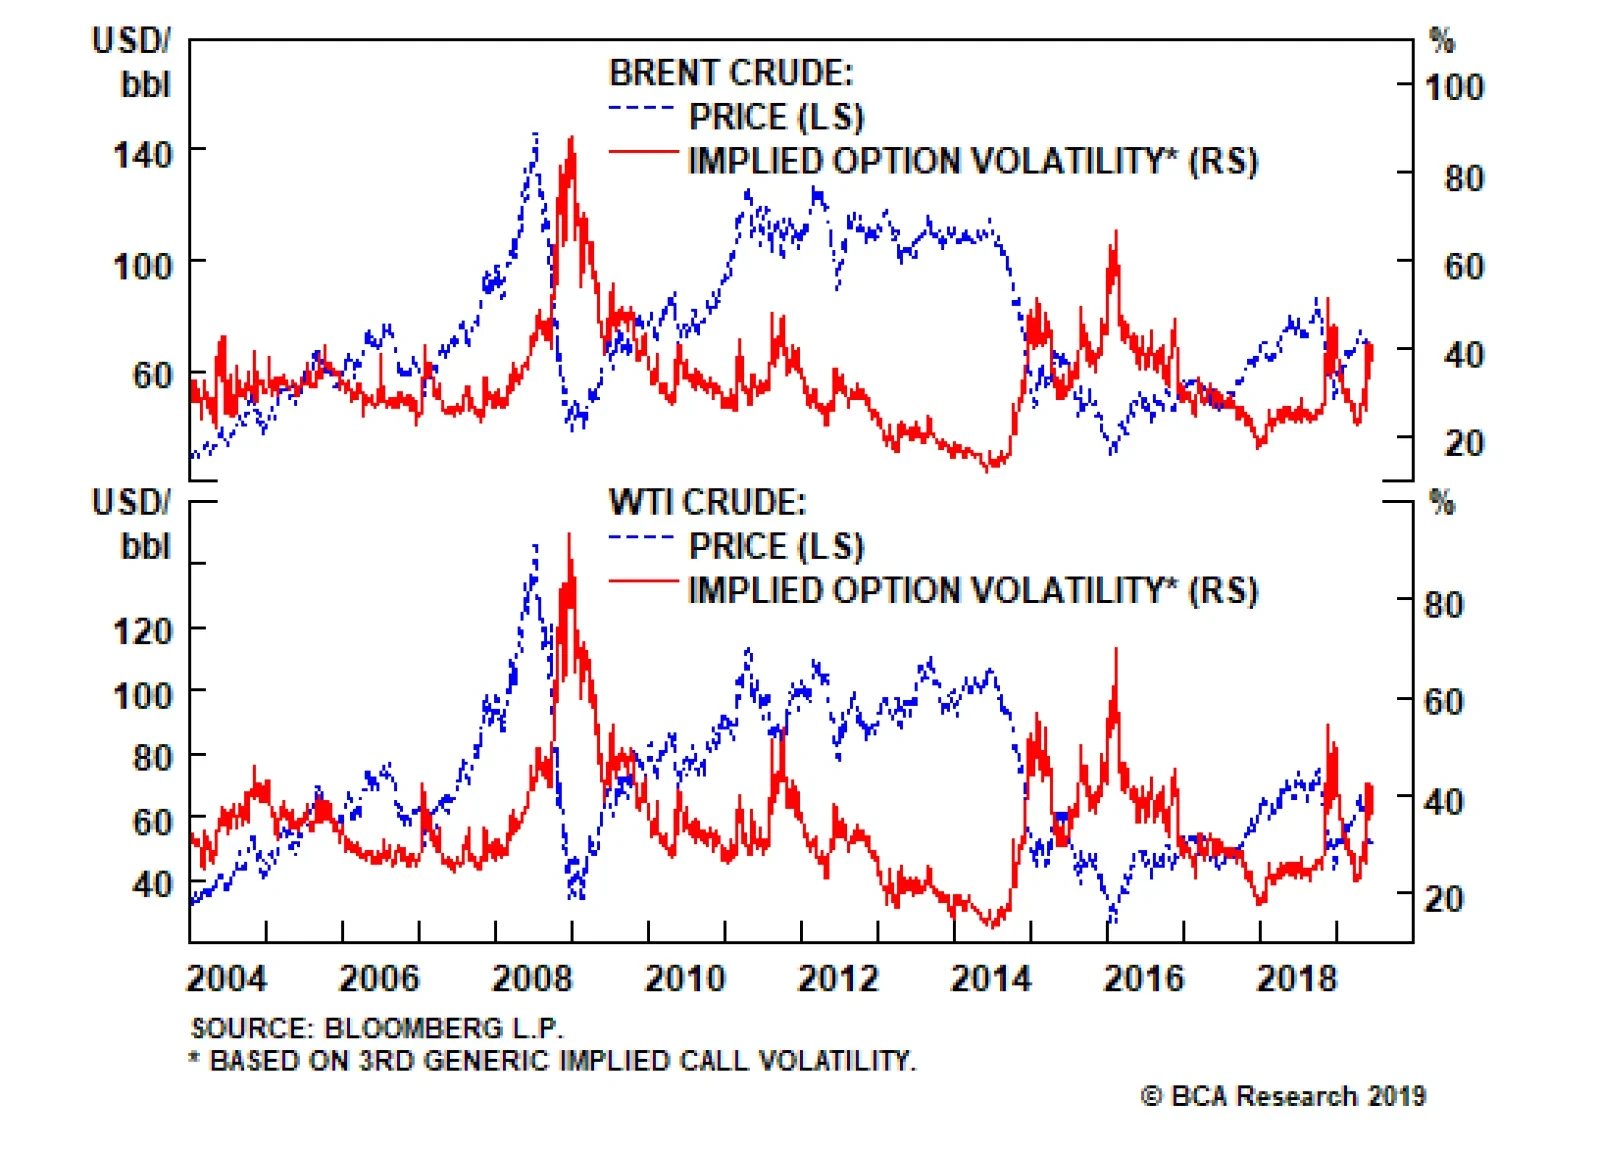
Freedom of navigation on the open seas is sine qua non for a well-functioning oil market – everything from getting supplies to refiners to getting products to consumers depends on it. Oil is a globally traded, waterborne commodity: ~ 60% of all crude…

Highlights The unifying chorus among global central banks is currently for more monetary stimulus. In the race towards lower interest rates, the ultimate winners will be pro-cyclical currencies. Italian 10-year real government bond yields are rapidly joining those in Spain and Portugal in being below the neutral rate of interest for the entire euro zone. This is hugely reflationary. That said, growth barometers remain in freefall, suggesting some patience is still warranted. We are watching like hawks a few key crosses that are sitting at critical technical levels. A break below will signal we are entering a deflationary bust. A bounce could be a prologue to a reflationary rally. Watch the bond-to-gold ratio to gauge where the balance of forces are shifting for the U.S. dollar. Tepid action by the BoJ this week reinforces our view that the path towards additional stimulus will be lined by a stronger yen. Stay short USD/JPY. We were a few pips away from our stop loss on long GBP/USD this week. Stand aside if triggered. The Norges Bank has emerged as the most hawkish G10 central bank. Hold long NOK/SEK and short CAD/NOK positions. Feature As early as 1625, Hugo De Groot, then a Dutch philosopher, saw the act of pre-emptively striking an enemy as a move of self-defense. With a mandate of self-preservation, it made sense for a country to wage war for injury not yet done, if sufficient evidence pointed to colossal damage from no action. So faced with some important central bank meetings this week, and European manufacturing data well into freefall, the European Central Bank pulled a trick out of an old playbook. At an ECB forum in Sintra, Portugal, President Mario Draghi highlighted that if the inflation outlook failed to improve, the central bank had considerable headroom to launch a fresh expansion of its balance sheet. With its next policy meeting not until July 25th, it sure did feel like the ECB was cornered. What followed was as expected, a more dovish Federal Reserve, Bank Of Japan and Bank of England. Paradoxically, those two words might have opened a reflationary window and triggered one of the necessary catalysts for a sharp selloff in the U.S. dollar (Chart I-1). Time Lags The key question today is whether central banks have sufficiently eased policy to stem the decline in manufacturing data. Obviously, the trade war remains a key risk to whatever direction indicators might be pointing to today, but a few key observations are in order. Chart I-1A Countertrend Rally Underway
A Countertrend Rally Underway
A Countertrend Rally Underway
Chart I-2Dovish Central Banks Should Help Growth
Dovish Central Banks Should Help Growth
Dovish Central Banks Should Help Growth
Our global monetary policy barometer tends to lead the PMI by about six months. It tracks 29 central banks, gauging which have tightened policy over the last three months and which have not. Since the global financial crisis, whenever the measure has hit the critical threshold of 15-20%, it has correctly signaled that the pace of manufacturing activity is likely to slow. It is entirely another debate whether or not the world we live in today can tolerate higher interest rates, but our barometer has clearly plunged into reflationary territory – below the 20% threshold. This has usually been followed by a pick-up in manufacturing activity (Chart I-2). Data out of Singapore has been a timely tracker of global trade and warrants monitoring. Most real-time measures of economic activity remain weak, especially in the export sector, but it appears shipping activity may have been picking up pace over the past few months. Both the Harpex Shipping Index and the Baltic Dry Index have been perking up. Similarly, vessel arrivals into Singapore that tend to lead exports have stopped their pace of deceleration. It is still too early to read much into this data, since it could be a reflection of re-stocking ahead of possible tariffs. That said, data out of Singapore has been a timely tracker of global trade and warrants monitoring (Chart I-3). Chart I-3ASigns Of Life Along Shipping Lanes
Signs Of Life Along Shipping Lanes
Signs Of Life Along Shipping Lanes
Chart I-3BWatch Activity At Singaporean Ports
Watch Activity At Singaporean Ports
Watch Activity At Singaporean Ports
Chinese money growth, especially forward-looking liquidity indicators such as M2 relative to GDP, has bottomed. Historically, this has lit a fire under cyclical stocks, and by extension pro-cyclical currencies. This is also consistent with the fall in Chinese bond yields that has historically tended to be supportive for money growth in the ensuing months (Chart I-4). Overall industrial production remains weak, but the production of electricity and steel, inputs into the overall manufacturing value chain, are inflecting higher. Intuitively, these tend to lead overall industrial production. In recent weeks, both steel and iron ore prices have been soaring. Many commentators have attributed these increases to supply bottlenecks and/or seasonal demand. However, it is evident from both the manufacturing data and the trend in prices that demand is also playing a role. Overall residential property sales remain soft, but the evidence from tier-1 and even tier-2 cities is that this may be behind us. A revival in the property market will support construction activity, investment and imports (Chart I-5). Chart I-4A Bullish Signal For Chinese Liquidity
A Bullish Signal For Chinese Liquidity
A Bullish Signal For Chinese Liquidity
Chart I-5
Finally, high-beta currencies such as the RUB/USD, ZAR/USD and BRL/USD have stopped falling and are off their lows of the year. These currencies are usually good at sniffing out a change in the investment landscape, specifically one becoming more favorable to carry trades. The message so far is that the drop in U.S. bond yields may have been sufficient to make these currencies attractive again (Chart I-6). On a similar note, if currencies in emerging Asia that sit closer to the epicenter of Chinese stimulus can rally from here, it would indicate that policy stimulus is sufficient, and that the transmission mechanism is working. Chart I-6High-Beta Currencies Have Stopped Falling
High-Beta Currencies Have Stopped Falling
High-Beta Currencies Have Stopped Falling
Chart I-7AUD/JPY Near A Critical Level
AUD/JPY Near A Critical Level
AUD/JPY Near A Critical Level
Importantly, the AUD/JPY cross is sitting at an important technical level. Ever since the financial crisis, 72.5 has proven to be formidable intra-day resistance, with the cross failing to break below both during the euro area debt crisis in 2011-2012 and the China slowdown of 2015-2016. Speculators are neutral on the cross, suggesting any move in either direction could be powerful and significant. A break below will signal we are entering a deflationary bust. A bounce could be a prologue to a reflationary rally (Chart I-7). Bottom Line: We are watching a few key reflationary indicators to gauge whether it pays to be contrarian. The message is tipping in favor of pro-cyclical currencies, and further improvement will give us the green light to adopt a more pro-cyclical stance. The Message From The U.S. Dollar The market interpreted the Fed’s latest monetary policy announcement as dovish, even though the central bank kept rates on hold. What transpired during the conference was the market increasing its bets for more aggressive rate cuts. The swaps market is currently pricing in 94 basis points of rate cuts over the next 12 months, versus 76 basis points a fortnight ago. This shift has pushed down the dollar, lifting other currencies and gold in the process. U.S. bond yields have also punched below 2%. Interest rate differentials are moving against the dollar, but our important takeaway – that gold continues to outperform Treasurys – is an ominous sign. Even before the financial crisis, a long-standing benchmark for gauging ultimate downside in the dollar was the bond-to-gold ratio. This is because gold has stood as a viable threat to dollar liabilities, capturing the ebbs and flows of investor confidence in the greenback tick for tick. Any sign that the balance of forces are moving away from the U.S. dollar will favor a breakout in the bond-to-gold ratio. Chart I-8Major Peak In The Bond-To-Gold Ratio?
Major Peak In The Bond-To-Gold Ratio?
Major Peak In The Bond-To-Gold Ratio?
The rationale is pretty simple. Investors who are worried about U.S. twin deficits and the crowded trade of being long Treasurys will shift into gold, since pretty much every other major bond market (Germany, Switzerland, Japan) have negative yields. That favors gold at the expense of the dollar. The reverse is true if investors consider Treasurys more of a safe haven. The bond-to-gold ratio and dollar tend to move tick for tick, so a breakout in one can be a signal for what will happen to the other. This is why we are watching this ratio like hawks, and the breakdown this week is a bad omen for the U.S. dollar (Chart I-8). The euro might be the biggest beneficiary from the fall in the dollar. The standard dilemma for the euro zone is that interest rates have always been too low for the most productive nation, Germany, but too expensive for others such as Spain and Italy.1 As such, the euro has typically been caught in a tug-of-war between a rising equilibrium rate of interest for Germany, but a very low neutral rate for the peripheral countries. The silver lining is that the ECB may now have finally lowered domestic interest rates and eased policy to the point where they are accommodative for almost all euro zone countries: 10-year government bond yields in France, Spain, Portugal and even Italy now sit close to or below the neutral rate (Chart I-9). The ECB may now have finally lowered domestic interest rates and eased policy to the point where they are accommodative for almost all euro zone countries. Chart I-9The ECB May Have Won The Euro Battle
The ECB May Have Won The Euro Battle
The ECB May Have Won The Euro Battle
The drop in the euro since 2018 has also eased financial conditions and made euro zone companies more competitive. This is a tailwind for European stocks. Fortunately for investors, European equities, especially those in the periphery, remain unloved, given they are trading at some of the cheapest cyclically adjusted price-to-earnings multiples in the developed world. Analysts began aggressively revising up their earnings estimates for euro zone equities earlier this year, relative to the U.S. If they are right, this could lead into powerful inflows into the euro over the next nine to 12 months (Chart I-10). Chart I-10The Euro May Be On The Verge Of A Major Pop
The Euro May Be On The Verge Of A Major Pop
The Euro May Be On The Verge Of A Major Pop
Bottom Line: Falling rate expectations relative to policy action have historically been bearish for the dollar with a lag of about nine to 12 months. The dollar has been relatively resilient, despite interest rate differentials are moving against it, but has started to converge towards lower rates. One winner will be EUR/USD. Stay Short USD/JPY The BoJ kept monetary policy on hold this week, but the message was cautious, even encouraging fiscal support. It looks like the end of the Heisei era2 has brought forward a well-known quandary for the central bank, which is that additional monetary policy options are hard to come by, since there have been diminishing economic returns to additional stimulus. This puts short USD/JPY bets in an enviable “heads I win, tails I do not lose too much” position. Chart I-11Stealth Tapering By The BoJ
Stealth Tapering By The BoJ
Stealth Tapering By The BoJ
The BoJ maintained Yield Curve Control (YCC), stating it will continue to “conduct purchases of JGBs in a flexible manner so that their amount outstanding will increase at an annual pace of about 80 trillion yen.”3 But with the BoJ owning 46% of outstanding JGBs, about 75% of ETFs and almost 5% of JREITs, this will be a tall order (Chart I-11). The supply side obviously puts a serious limitation on how much more stimulus the central bank can provide. Total annual asset purchases by the BoJ are currently running at about ¥27 trillion, while JGBs purchases are running at ¥20 trillion. This is a far cry from the central bank’s soft target of ¥80 trillion, and unlikely to change anytime soon, given bond yields closing in on the -20 basis-point floor. This means interest rate differentials are likely to move in favor of a stronger yen short term (Chart I-12). The BoJ targets an inflation rate of 2%, but it is an open question as to whether it can actually achieve this. The overarching theme for prices in Japan is a rapidly falling (and ageing) population leading to deficient demand. More importantly, almost 40% of the Japanese consumption basket is in tradeable goods, meaning domestic inflation is as much driven by the influence of the BoJ as it is by globalization. Even for prices within the BoJ’s control, an ageing demographic that has a strong preference for falling prices is a powerful conflicting force. For example, transportation and telecommunications make up 17% of the core consumption basket in Japan, a non-negligible weight. This is and will remain a powerful drag on CPI, making it very difficult for the BoJ to re-anchor inflation expectations upward. The risk to short USD/JPY positions is that the BoJ will eventually act, but it may first require a riot point. On the other side of the coin, YCC and negative interest rates have been an anathema for Japanese net interest margins and share prices. This, together with QE, has pushed banks to search for yield down the credit spectrum. Any policy shift that is increasingly negative for banks could easily tip them over. Chart I-12Can Japan Drop Rates Further?
Can Japan Drop Rates Further?
Can Japan Drop Rates Further?
Chart I-13MMT Might Be What The Doctor Ordered
MMT Might Be What The Doctor Ordered
MMT Might Be What The Doctor Ordered
Bottom Line: Inflation expectations remain at rock-bottom levels in Japan, at a time when the BoJ may be running out of policy bullets. Meanwhile, the margin of error for the BoJ is non-trivial, since a small external shock could tip the economy back into deflation. The risk to short USD/JPY positions is that the BoJ will eventually act, but it may first require a riot point (Chart I-13). A Final Note On The Pound A new conservative leadership is at the margin more negative for the pound (the assessment of our geopolitical strategists is that the odds of a hard Brexit have risen from 14% to 21%). However, our simple observation is that the pound is below where it was after the 2016 referendum results, yet more people are now in favor of staying in the union (Chart I-14). Chart I-14Support For Brexit Is Low, But Has Risen
Support For Brexit Is Low, But Has Risen
Support For Brexit Is Low, But Has Risen
Chart I-15Low Rates Could Help British Capex
Low Rates Could Help British Capex
Low Rates Could Help British Capex
The BoE kept rates on hold following its latest policy meeting and will continue to err on the side of caution until the Brexit imbroglio is resolved. The reality is that the pound and U.K. gilt yields should be much higher solely on the basis of hard incoming data. Yes, the data has softened, but employment growth has been holding up very well, wages are inflecting higher and the average U.K. consumer appears in decent shape. Investment and construction have been the weak spot in the U.K. economy but may marginally improve on low rates (Chart I-15). We remain long the pound, given lower overall odds of a no-deal Brexit. That said, our long GBP/USD position was a few pips from being stopped out this week. Stand aside if triggered. Housekeeping Our stop-loss on long EUR/CHF was triggered at 1.11 yesterday. Stand aside for now, but we will be looking for opportunities to put this trade back on. Chester Ntonifor, Foreign Exchange Strategist chestern@bcaresearch.com Footnotes 1 Please see Foreign Exchange Strategy Weekly Report, titled “EUR/USD And The Neutral Rate Of Interest,” dated June 14, 2019, available at fes.bcaresearch.com. 2 The Heisei era refers to the period of Japanese history corresponding to the reign of Emperor Akihito from 8 January 1989 until his abdication on 30 April 2019. 3 Please refer to the Bank of Japan “Minutes of The Monetary Policy Meeting,” dated June 20, 2019, page 1. Currencies U.S. Dollar Chart II-1USD Technicals 1
USD Technicals 1
USD Technicals 1
Chart II-2USD Technicals 2
USD Technicals 2
USD Technicals 2
Recent data in the U.S. have been mostly negative: Retail sales grew by 0.5% month-on-month in May. University of Michigan consumer sentiment and expectation indices both fell to 97.9 and 88.6 in June. However, current conditions index increased to 112.5. NY empire state manufacturing index came in at -8.6 in June, falling below 0 for the first time since October 2016. NAHB housing market index fell to 64 in June. Housing starts contracted by 0.9% month-on-month in May, while building permits increased by 0.3% month-on-month. Current account deficit decreased to $130.4 billion in Q1. Philadelphia Fed Business Outlook survey index fell to 0.3 in June. DXY index fell by 1% this week. This Wednesday, the Fed has kept interest rates steady at 2.5%, but left the door open for rate cuts in the future as Powell stated that “Many participants now see the case for somewhat more accommodative policy has strengthened.” The dollar has weakened in response to the dovish pivot. Report Links: EUR/USD And The Neutral Rate Of Interest - June 14, 2019 Where To Next For The U.S. Dollar? - June 7, 2019 President Trump And The Dollar - May 9, 2019 The Euro Chart II-3EUR Technicals 1
EUR Technicals 1
EUR Technicals 1
Chart II-4EUR Technicals 2
EUR Technicals 2
EUR Technicals 2
Recent data in the euro area have been negative with muted inflation: Trade surplus narrowed to €15.3 billion in April. Headline and core inflation fell to 1.2% and 0.8% year-on-year respectively in May. ZEW survey expectations index fell to -20.2 in June. Current account surplus decreased to €20.9 billion in April. Construction output growth fell to 3.9% year-on-year in April. Consumer confidence fell further to -7.2 in June. EUR/USD increased by 0.7% this week. The cross fell initially on Draghi’s dovish message that ECB would ease policy again should inflation fail to accelerate, then rebounded on broad dollar weakness this Wednesday following the Fed’s dovish pivot. However, the euro has weakened further against other currency pairs. Our EUR/CHF trade was stopped out at 1.11 on Thursday morning. Report Links: EUR/USD And The Neutral Rate Of Interest - June 14, 2019 Take Out Some Insurance - May 3, 2019 Reading The Tea Leaves From China - April 12, 2019 The Yen Chart II-5JPY Technicals 1
JPY Technicals 1
JPY Technicals 1
Chart II-6JPY Technicals 2
JPY Technicals 2
JPY Technicals 2
Recent data in Japan have been mostly negative: Industrial production was unchanged at -1.1% year-on-year in April. Total adjusted trade balance decreased to -¥609.1 billion in May. Imports fell by 1.5% year-on-year, while exports contracted by 7.8% year-on-year. All industry activity index increased by 0.9% month-on-month in April. Machine tool orders continued to contract by 27.3% year-on-year in May. USD/JPY fell by 1.1% this week. BoJ kept the interest rate unchanged at -0.1% this week. In the monetary statement, the BoJ stated that the Japanese economy would likely continue expanding at a moderate rate, despite exogenous shocks. The current policy rates will be maintained at least through the spring of 2020. Report Links: Short USD/JPY: Heads I Win, Tails I Don’t Lose Too Much - May 31, 2019 Beware Of Diminishing Marginal Returns - April 19, 2019 Tug OF War, With Gold As Umpire - March 29, 2019 British Pound Chart II-7GBP Technicals 1
GBP Technicals 1
GBP Technicals 1
Chart II-8GBP Technicals 2
GBP Technicals 2
GBP Technicals 2
Recent data in the U.K. have been mixed: Retail price index increased by 3% year-on-year in May. Headline and core inflation fell to 2% and 1.7% year-on-year respectively in May. Total retail sales growth fell to 2.3% year-on-year in May. GBP/USD increased by 0.9% this week. The MPC voted unanimously to keep the interest rate unchanged at 0.75% this week. However, some policymakers have suggested that borrowing costs should be higher. The BoE however cut its growth forecast in the second quarter of 2019 amid rising global trade tensions and a fear of “no-deal” Brexit. Report Links: A Contrarian View On The Australian Dollar - May 24, 2019 Take Out Some Insurance - May 3, 2019 Not Out Of The Woods Yet - April 5, 2019 Australian Dollar Chart II-9AUD Technicals 1
AUD Technicals 1
AUD Technicals 1
Chart II-10AUD Technicals 2
AUD Technicals 2
AUD Technicals 2
There is little data from Australia this week: House price index contracted by 7.4% year-on-year in Q1. Westpac leading index fell by 0.08% month-on-month in May. AUD/USD rose by 0.7% this week. Our long AUD/USD came close to the stop-loss at 0.68 this Tuesday, then rebounded on dollar weakness and is now trading around 0.69. RBA governor Philip Lowe said that it was unrealistic to think that the single quarter-point cut to 1.25% would work to achieve its growth target, signaling more rate cuts and fiscal stimulus in the future. We are holding on to the long AUD/USD position from a contrarian perspective, and believe that the Aussie dollar will benefit as a pro-cyclical currency if the global growth outlook turns positive. Report Links: A Contrarian View On The Australian Dollar - May 24, 2019 Beware Of Diminishing Marginal Returns - April 19, 2019 Not Out Of The Woods Yet - April 5, 2019 New Zealand Dollar Chart II-11NZD Technicals 1
NZD Technicals 1
NZD Technicals 1
Chart II-12NZD Technicals 2
NZD Technicals 2
NZD Technicals 2
Recent data in New Zealand have been mixed: REINZ house sales keep contracting by 7.8% year-on-year in May. Business Manufacturing PMI fell to 50.2 in May. Westpac consumer confidence fell to 103.5 in Q2. Current account surplus widened to N$0.675 billion in Q1. GDP growth was unchanged at 0.6% in Q1 on a quarter-on-quarter basis. However, it increased to 2.5% on a year-on-year basis. NZD/USD increased by 1.1% this week. Our bias remains that the New Zealand dollar has less room to rise compared to other pro-cyclical currencies if global growth picks up. Our SEK/NZD position is 1.3% in the money since initiated. Report Links: Where To Next For The U.S. Dollar? - June 7, 2019 Not Out Of The Woods Yet - April 5, 2019 Balance Of Payments Across The G10 - February 15, 2019 Canadian Dollar Chart II-13CAD Technicals 1
CAD Technicals 1
CAD Technicals 1
Chart II-14CAD Technicals 2
CAD Technicals 2
CAD Technicals 2
Recent data in Canada have been mixed: Foreign portfolio investment in Canadian securities fell by C$12.8 billion in April. Bloomberg Nanos confidence increased to 56.9 in June. Manufacturing sales fell by 0.6% month-on-month in April. Headline and core inflation both increased to 2.4% and 2.1% year-on-year respectively in May, surprising to the upside. USD/CAD fell by 1.6% this week. The surprising Canadian inflation print, and oil price recovery are all underpinning the Canadian dollar in the short term. This Thursday, Iran shot down a the U.S. drone in Gulf, and fears have been rising of a military confrontation between the U.S. and Iran, which is bullish for oil prices and the Canadian dollar. Report Links: Currency Complacency Amid A Global Dovish Shift - April 26, 2019 A Shifting Landscape For Petrocurrencies - March 22, 2019 Into A Transition Phase - March 8, 2019 Swiss Franc Chart II-15CHF Technicals 1
CHF Technicals 1
CHF Technicals 1
Chart II-16CHF Technicals 2
CHF Technicals 2
CHF Technicals 2
Recent data in Switzerland have been positive: Exports and imports increased to CHF 21.5 billion and CHF 18.1 billion respectively in May, resulting in a higher trade surplus of CHF 3.4 billion. USD/CHF fell by 1.7% this week. The Swiss franc has strengthened significantly against the U.S. dollar and the euro following the more-than-expected dovish shifts by the ECB and the Fed this week. Our bias remains that the SNB will use the currency as a weapon to defend the economy. Report Links: What To Do About The Swiss Franc? - May 17, 2019 Beware Of Diminishing Marginal Returns - April 19, 2019 Balance Of Payments Across The G10 - February 15, 2019 Norwegian Krone Chart II-17NOK Technicals 1
NOK Technicals 1
NOK Technicals 1
Chart II-18NOK Technicals 2
NOK Technicals 2
NOK Technicals 2
Recent data in Norway have been negative: The trade surplus narrowed to 11.3 billion NOK in May. USD/NOK fell by 1.6% this week. The Norges bank raised interest rates from 1% to 1.25%, the third rate hike during the past 12 months, and the Bank is also signaling more to come in the future. The Norges Bank remains the only hawkish central bank among all the G10 countries at this moment. The widening interest rate differentials and bullish oil outlook have been pushing the Norwegian krone higher. Our long NOK/SEK position is now 4.5% in the money. Report Links: Currency Complacency Amid A Global Dovish Shift - April 26, 2019 A Shifting Landscape For Petrocurrencies - March 22, 2019 Balance Of Payments Across The G10 - February 15, 2019 Swedish Krona Chart II-19SEK Technicals 1
SEK Technicals 1
SEK Technicals 1
Chart II-20SEK Technicals 2
SEK Technicals 2
SEK Technicals 2
Recent data in Sweden have been neutral: Headline and core inflation increased to 2.2% and 2.1 year-on-year respectively in May. Consumer confidence increased to 93.8 in June, while manufacturing confidence fell to 100.2. Unemployment rate increased to 6.8% in May. USD/SEK fell by 0.7% this week. Easing financial conditions worldwide remain a tailwind for global growth. Risk assets are rebounding with higher hopes of a trade deal as Trump will meet Xi at the G20 summit. We believe that the Swedish krona will benefit if global growth picks up in the second half of this year. Report Links: Where To Next For The U.S. Dollar? - June 7, 2019 Balance Of Payments Across The G10 - February 15, 2019 A Simple Attractiveness Ranking For Currencies - February 8, 2019 Trades & Forecasts Forecast Summary Core Portfolio Tactical Trades Closed Trades
(Part II) Global Semiconductors: The Key Driver
(Part II) Global Semiconductors: The Key Driver
Global smartphone sales, which drive 29% of global semiconductor revenues, are currently contracting. According to the International Data Corporation (IDC), in Q1/2019 global smartphone shipments declined 6.6% year-on-year (yoy) in volume terms. The slowdown is also picking up pace, as last year’s drop was 4.4% (see chart). We also expect smartphone shipments to continue contracting in the second half of this year. Major markets such as mainland China and advanced economies have entered the saturation phase of mobile-phone demand. For example, U.S. shipments were down 15% yoy in Q1 due to near-full market penetration. Investors are also mistakenly betting on 5G technology. Although Samsung, Huawei, OnePlus, Xiaomi, Motorola, LG, and ZTE have either released or will release their 5G phones this year, the sales growth from 5G phones will not be able to offset the loss in 2G, 3G and 4G phone sales, at least not in 2019. IDC estimated that 5G phones would only reach 0.5% of the global mobile-phone market share this year. 5G phones will likely only begin boosting overall semiconductor demand next year, when they will garner a larger slice of the global smartphone market. Bottom Line: Global semiconductor stocks are still facing considerable downside. Our Emerging Markets Strategy service remains negative on Asian semiconductor share prices in absolute terms. A continued contraction in global semiconductor sales will further squeeze their profits. For additional details, please see this past Monday’s Special Report authored by Ellen JingYuan He, Associate Vice President of Emerging Markets Strategy.
(Part I) Global Semiconductors: Demand
(Part I) Global Semiconductors: Demand
The odds of a cyclical upturn in global semiconductors over the next three-to-six months are low as global demand remains feeble and is contracting 15%/annum (top panel). Drilling deeper into global demand reveals that the slowdown is structural, affecting a number of geographical areas (bottom five panels). Chip company revenues have so far contracted by 24% since the October 2018 peak, which is disproportionally more than the decline in share prices. The global semiconductor equity index is only 14% below its March 2018 high. It appears as though the market is expecting a quick recovery in semi sales. However, as we highlighted in our most recent Special Report authored by Ellen JingYuan He, Associate Vice President of Emerging Markets Strategy, there are structural problems in each of the key segments that drive global semiconductor sales, warning that the odds of an upturn are low. Please see the next Insight where we discuss the major demand driver that accounts for 29% of the world’s total semiconductor sales.
While 2017 was characterized by a synchronized upturn, 2018 was marked by a sharp divergence in growth momentum. The U.S., fueled by fiscal stimulus, powered ahead, but China slowed, hobbled by monetary tightening. We think it is telling that the rest of the…
Highlights The odds of a cyclical upturn in the global semiconductor sector over the next three to six months are low. Global semiconductor demand will continue to decline due to contracting demand for smartphones, automobiles, personal computers (PCs), and servers. Global semiconductor stocks are still facing considerable downside in absolute terms. We recommend going long Asian semiconductor stocks versus the U.S. S&P 500 semiconductor index. Dedicated EM equity portfolios should stay neutral on the Taiwanese bourse and Korean technology sector relative to the overall EM benchmark. Feature Chart 1 shows share prices of the global semiconductor sector and global semiconductor sales in the past two decades. Chart 1Global Semiconductor Market: Sales & Share Prices
Global Semiconductor Market: Sales & Share Prices
Global Semiconductor Market: Sales & Share Prices
Was last December’s trough in global semiconductor equity prices the ultimate bottom in this cycle? The odds are in favor of a continued contraction in global semiconductor sales and further downside in semiconductor share prices over the next three to six months. Cycle-On-Cycle Analysis Semiconductor sales experienced five recessions over the past 20 years. Table 1 illustrates the peak-to-bottom percentage decline in nominal global semiconductor sales and the magnitude of the drop in global semiconductor share prices in U.S. dollar terms during these five cyclical downturns in this industry. It also indicates the duration of each downturn and the number of months that semiconductor stocks led the bottom in global semiconductor sales. Table 1Key Statistics Of Five Cyclical Downturns In Global Semiconductor Market
The Global Semiconductor Sector: Is A Cyclical Upturn Imminent?
The Global Semiconductor Sector: Is A Cyclical Upturn Imminent?
The current shrinkage of semiconductor sales is worse than the 2011-12 and 2015 downturns. Yet, it is still smaller than the magnitude during the 2008 Great Financial Crisis and the 2001 tech bubble bust. The revenue of semiconductor companies has so far contracted by 24%, which is disproportionally more than the decline in share prices of these companies. The global semiconductor equity index is only 14% below its March 2018 high. It appears as though the market is expecting a quick recovery in semiconductor sales. As per Table 1, in the downturns of 2008, 2011 and 2015, global semiconductor stocks all bottomed before the bottom of global semiconductor sales. Only in the 2001 episode, stock prices bottomed eight months after the bottom in sales. In the current cyclical downturn, global semiconductor sales have so far had only four months of growth contraction,1 far less than the 13-16 months experienced in all the past four cycles. All in all, we would lean against the market’s expectation of an imminent recovery in the semiconductor cycle. The demand downturn will last another three to six months and share prices are facing major headwinds. Global Semiconductor Demand Semiconductor sales are in contraction across countries and regions (Chart 2). In April – before President Trump’s tweet on imposing new import tariff on China, global semiconductor sales growth sank to a negative 15% year-on-year. The short-term (three-to-six month) outlook for global semiconductor demand remains dismal. Chart 3 shows global semiconductor revenue breakdown in terms of end usage. Mobile phones account for the largest share (29%) of the market, followed by PCs (12%), miscellaneous consumer products (12%), and servers (11%). All of these major demand sources are under downward pressure: Smartphone Sales Global smartphone sales are shrinking (Chart 4). According to the International Data Corporation (IDC), global smartphone shipments declined 6.6% year-on-year in volume terms in the first quarter of this year, worse than last year’s 4.4% drop. Chart 2Semiconductor Sales Are In Contraction Across Countries
Semiconductor Sales Are In Contraction Across Countries
Semiconductor Sales Are In Contraction Across Countries
In the current cyclical downturn, global semiconductor sales have so far had only four months of growth contraction, far less than the 13-16 months experienced in all the past four cycles.
Chart 3
Chart 4Global Smartphone Sales: Contracting
Global Smartphone Sales: Contracting
Global Smartphone Sales: Contracting
We expect smartphone shipments to continue contracting in the second half of this year. Major markets such as mainland China and advanced economies have entered the saturation phase of mobile-phone demand. For example, U.S. shipments were down 15% year-on-year in the first quarter due to near-full market penetration. In China, smartphone sales have shown signs of stabilization (Chart 5). However, this is probably temporary and has been driven by the boom in Huawei smartphone sales in China since early this year. The incredible 50% year-on-year growth of Huawei smartphone sales in the first quarter is not sustainable. While global sales of Huawei smartphones increased by 20 million units, total global smartphone sales of all brands fell by 22 million units (Chart 6). The U.S. punitive actions towards China and Huawei have also instigated nationalism in China. This has triggered a Chinese buying-spree of the Huawei smartphone. Chart 5Chinese Smartphone Sales: Temporary Stabilization
Chinese Smartphone Sales: Temporary Stabilization
Chinese Smartphone Sales: Temporary Stabilization
Chart 6
Yet, this has probably reduced the number of potential Chinese smartphones buyers in the near future. After all, many buyers likely made the purchase earlier than otherwise planned in the absence of a trade war. Although Samsung, Huawei, OnePlus, Xiaomi, Motorola, LG, and ZTE have either released or will release their 5G phones this year, the sales growth from 5G phones will not be able to offset the loss in 2G, 3G and 4G phone sales, at least not in 2019. The IDC estimated that 5G phones would only account for about 0.5% of the market share this year. 5G will likely only begin affecting overall semiconductor demand next year, when they account for a larger share of smartphone sales. Huawei is the market leader in 5G technology. The U.S. boycott of Huawei will likely continue. This will only slow the pace of 5G phone adoption and the development of 5G networks worldwide. On balance, global smartphone demand may only recover next year. Server Demand Global server shipments also experienced a 5% contraction in volume terms in the first quarter of this year, according to IDC (Chart 7). The outlook for the rest of 2019 does not look promising. Global server demand will likely remain in contraction in the second half of this year. Many hyperscale data centers have already purchased considerable amounts of servers in advance of the trade war to avoid tariffs.2 Meanwhile, the escalation in the U.S.-China confrontation has increased economic uncertainties. This may delay potential datacenter investments. Decelerating 5G network development worldwide due to the U.S. ban on Huawei will also tend to discourage new datacenter and cloud services projects. This is because the 5G technology enables datacenter and cloud services to experience a huge improvement in terms of data transfer speeds, latency, connectivity, capacity, reliability and mobility. Chart 7Global Server Shipment: Are In Contraction
Global Server Shipment: Are In Contraction
Global Server Shipment: Are In Contraction
Personal Computers (PC) PCs sales are also in contraction (Chart 8). PC demand has entered into the deep-maturation phase while facing strong competition from tablets and laptops. Auto Sales Global auto sales also sank by 5% in April from a year ago, registering the worst contraction since 2009 (Chart 9). Chart 8Global PCs Sales: Deeply Saturated
Global PCs Sales: Deeply Saturated
Global PCs Sales: Deeply Saturated
Chart 9Global Auto Sales Are In Contraction As Well
Global Auto Sales Are In Contraction As Well
Global Auto Sales Are In Contraction As Well
Regarding auto demand, the Chinese government may continue to implement more supportive policies to stimulate car sales in China. However, we believe the recovery will be delayed. The government has already implemented a number of policies to lift domestic car sales since late January, including providing subsidies to encourage new energy vehicle sales, to promote auto sales in rural areas, and to increase auto replacement. The central government recently loosened auto sales restrictions in the first tier cities of Guangzhou and Shenzhen that have restrictive auto sales policies. However, all of these policies have failed to lift Chinese domestic car sales out of deep contraction. The key reason has been a diminishing willingness to spend among Chinese consumers, as suggested by falling households’ marginal propensity to consume (Chart 10). Bottom Line: Global semiconductor demand growth will likely remain weak and will fail to recover in the second half of this year. The basis is that its major upstream markets (smartphone, servers, PCs and automobiles) are all facing cyclically declining demand. Chart 10Chinese Consumers: Diminishing Willingness To Consume
Chinese Consumers: Diminishing Willingness To Consume
Chinese Consumers: Diminishing Willingness To Consume
Inventories And Prices Chart 11 shows the semiconductor supply chain illustrating the process of manufacturing semiconductors starting with silicon wafers and up to final electronic products.
Chart 11
Box 1 explains the role of key segments and players along the supply chain. Box 1 A Brief Explanation Of The Key Segments/Players Of The Supply Chain Both integrated device manufacturers (IDM) and foundries are at the center of the supply chain, responsible for chip manufacturing. In terms of semiconductor sales revenue, Samsung, Intel and SK Hynix are the world’s top three IDM companies and TSMC, Global Foundries and United Microelectronics Corp (UMC) are the world’s top three foundries. While IDMs cover most of the process from IC design, chip fabrication, assembly, testing and packaging, IDM companies still have to purchase raw materials and equipment for the chip-making process. Foundry companies receive orders from IC designing companies like Qualcomm, Nvidia, and Huawei HiSilicon, then purchase needed raw materials and equipment to proceed in the chip-manufacturing process. Both IDMs and foundries can either outsource the tasks of semiconductor assembly and testing or perform them on their own. The final semiconductor products will be used in electronics products, such as smartphones, computers, home appliances, automobiles, etc. Global semiconductor demand growth will likely remain weak and will fail to recover in the second half of this year. The basis is that its major upstream markets (smartphone, servers, PCs and automobiles) are all facing cyclically declining demand. In a typical business cycle, a cyclical downturn begins with a slump in demand for final electronic products (upstream demand). This leads to falling semiconductor sales. As a result, inventory buildup will occur across most of the segments along the semiconductor supply chain. Chipmakers: Producers’ semiconductor inventory in both Taiwan and Korea have reached either a record high or a near-record high (Chart 12). The installed wafer capacities at these two countries are the world’s largest, together accounting for 43% of total global wafer capacity. In addition, the inventory of some major electronic parts and components have also increased considerably in Taiwan (Chart 13). This also implies weaker demand for semiconductor raw materials. Chart 12Chipmakers: A Rapid Buildup In Inventory
Chipmakers: A Rapid Buildup In Inventory
Chipmakers: A Rapid Buildup In Inventory
Chart 13Rising Inventory Of Some Major Electronic Parts And Components
Rising Inventory Of Some Major Electronic Parts And Components
Rising Inventory Of Some Major Electronic Parts And Components
Raw material suppliers: Silicon wafer is the indispensable raw material required in the chip manufacturing process. Japanese companies account for over half of global silicon wafer supply.Chart 14 shows that silicon wafer inventory in Japan has had a significant buildup in volume terms since late last year. Importantly, it is not declining yet. Chart 14Silicon Wafer Inventory: A Significant Buildup As Well
Silicon Wafer Inventory: A Significant Buildup As Well
Silicon Wafer Inventory: A Significant Buildup As Well
Outsourced semiconductor assembly and test (OSAT) providers: Both Singapore and Thailand are OSAT providers while they also manufacture, assemble and export electronic products. Both countries are closer to the downstream side of the semiconductor supply chain. Semiconductor inventory at these two countries has also jumped to a record high (Chart 15). Chart 15Singapore and Thailand: Record High Semiconductor inventory
Singapore and Thailand: Record High Semiconductor inventory
Singapore and Thailand: Record High Semiconductor inventory
Importantly, a marginal improvement in demand will tend to support spot prices. For example, in the memory chip market, falling prices denote weak demand relative to excess supply. When prices of DRAM and NAND start to form a bottom or decisively move up, this may indicate the arrival of a cyclical upturn. So far, both DRAM and NAND prices are continuing to fall (Chart 16). In addition, the prices of silicon wafer – the most important raw material used in the chip-making process – have declined in the first half of this year.3 Chart 16Still Falling Memory Chip Prices
Still Falling Memory Chip Prices
Still Falling Memory Chip Prices
Chart 17Deflating DRAM Prices Suggest Downside Risks To Korean Tech Stocks
Deflating DRAM Prices Suggest Downside Risks To Korean Tech Stocks
Deflating DRAM Prices Suggest Downside Risks To Korean Tech Stocks
In short, prices are the most important variable to monitor. Chart 17 exhibits the high correlation between DRAM prices and the Korean technology sector stock prices. Falling DRAM prices suggest downside risks to technology stocks in Korea. Samsung accounts for about 65% of Korea’s tech index and 27% of the overall Korean equity index. Memory chips accounted for 68% of Samsung’s operating profits in the first quarter of this year. Bottom Line: There has been involuntary inventory accumulation along the entire supply chain of semiconductors. This and ongoing price deflation among various types of semiconductors foreshadow a downbeat near-term outlook. The Interpretation Of Some Positive Developments There have been some positive developments in the past several months. Taiwanese PMI new orders diffusion index in the electronics sector jumped out of deep contraction to reach zero, and Chinese semiconductor imports halted their decline in both volume and value terms (Chart 18). The improvement in the aforementioned data was probably mainly due to large semiconductor purchases by China to hedge the rising risk of U.S. blocking China’s technological development (Chart 19). Chart 18Some Positive Development
Some Positive Development
Some Positive Development
Chart 19China: More Semiconductors Purchases Before The Tariff And U.S. Huawei Ban?
China: More Semiconductors Purchases Before The Tariff And U.S. Huawei Ban?
China: More Semiconductors Purchases Before The Tariff And U.S. Huawei Ban?
Besides, Huawei smartphone sales have been booming, which we deliberated on page 5, could have been responsible for the improvement in these data. This one-off surge will likely dwindle going forward. Investment Conclusions We remain negative on Asian semiconductor share prices in absolute terms. A continued contraction in global semiconductor sales will further squeeze their profits. In relative terms, we are neutral on the Asian semiconductor sector: we continue recommending market-weight allocation to Taiwan’s overall market and the Korean technology sector within the EM equity benchmark. As a new trade, we recommend going long Asian semiconductor stocks and short the S&P 500 semiconductor index over the next three to six months (Chart 20). The Bloomberg Asia Pacific semiconductor index has nine stocks. Samsung and TSMC account for 42% and 38% of the index, respectively. There has been involuntary inventory accumulation along the entire supply chain of semiconductors. This and ongoing price deflation among various types of semiconductors foreshadow the downbeat near-term outlook. Samsung will likely benefit from the U.S. ban on Huawei in the smartphone sector outside of China. In addition, Samsung will win some market share from Apple as the latter does not have a 5G phone to release this year. These positive factors may partially offset the negative impact from falling memory prices and demand on Samsung. The S&P 500 semiconductor index has 13 stocks. Intel, Broadcom, Texas Instruments and Qualcomm are the top five constituents, together accounting for nearly 70% of the index. Most of these companies are IC designing companies, which will likely suffer as Chinese demand for their products shrink due to the U.S. administration's ban on Huawei. This position will also benefit from U.S. dollar appreciation. A firm dollar will hurt profits of U.S. semiconductor stocks. In turn, currency depreciation in Korea and Taiwan will on the margin benefit Asian semiconductor stocks. Chart 20Recommend Long Asia Pacific Semiconductor Stock Vs. S&P 500 Semiconductor Index
Recommend Long Asia Pacific Semiconductor Stock Vs. S&P 500 Semiconductor Index
Recommend Long Asia Pacific Semiconductor Stock Vs. S&P 500 Semiconductor Index
Chart 21The 2015 Experience
The 2015 Experience
The 2015 Experience
Chart 21 shows that global foundry companies outperformed global IC designing companies during the final phase of the 2015 cyclical downturn. Odds are that these dynamics will play out in this downturn as well. Finally, the relative performance of Asian semiconductor stocks versus U.S. ones is oversold and might stage some sort of mean reversion (Chart 20). Ellen JingYuan He, Associate Vice President ellenj@bcaresearch.com Footnotes 1 Please note that here the calculation for “the number of months of the growth contraction” is different from the one for the “peak-to-bottom duration” in Table 1. “The number of months of the growth contraction” equals the number of months when semiconductor sales year-on-year growth is negative. 2 https://marketrealist.com/2019/05/nvidias-data-center-revenue-inference-rendering-and-edge/ 3 http://www.sohu.com/a/300386061_132567, http://news.moore.ren/industry/104958.htm
Highlights We spent nearly all of last week engaged in dialogue with clients: Over the course of a dozen face-to-face meetings, and multiple follow-up questions, we learned that crowding out is a real phenomenon. The Fed and trade tensions were essentially all that people wanted to discuss. We’re expecting a 25-basis-point rate cut in July, but our investment recommendations have not changed: We remain bullish on risk assets and bearish on Treasuries, and we continue to recommend that investors maintain below-benchmark duration positioning. Feature It turns out that you really can’t fight the Fed. Not when meeting with investors right now, anyway, as its impending moves dominated our discussions with several U.S.-based clients last week. We expect monetary policy will be Topic A on our meetings schedule this week and next, especially if the plot thickens after the FOMC releases its updated Summary of Economic Projections (“the dots”) and markets mull over Wednesday’s post-meeting statement and press conference. This report covers our recent exchanges with investors on the points that came up most often. Chart 1Healing, If Not Yet Fully Healed
Healing, If Not Yet Fully Healed
Healing, If Not Yet Fully Healed
Q: How likely is it that the Fed will cut rates? We think a rate cut at the FOMC meeting beginning tomorrow is unlikely. Fed officials only revealed that they were seriously contemplating the idea recently, and it would feel rather sudden if they followed through so soon, especially when the Mexican tariff cloud has lifted, economic data have been reasonably firm and financial conditions are still easing (Chart 1). We pay particularly close attention when Fed speakers all start singing from the same sheet, though, and the prepared-to-adjust-the-target-range-as-necessary refrain is signaling a rate cut. Our base case is that changes in the post-meeting statement and the updated dots will point in the direction of a cut at the next FOMC conclave at the end of July. Q: Why has the Fed changed its tune so much since mid-December? We view the Fed’s evolution from a tightening bias to an easing bias as having unfolded in three distinct stages. The first stage occurred in early January, following the sharp fourth-quarter selloff in equities and corporate bonds. The decline in stock prices amounted to a meaningful decline in household wealth, the sudden widening in bond spreads heralded higher debt-service costs for corporations and consumers, and the surge in mortgage rates caused several would-be homebuyers to lose their nerve (Chart 2). With the accumulated tightening in financial conditions equating to at least one, if not two, 25-basis-point hikes in the fed funds rate, additional hikes would have amounted to piling on, and the Fed opted to move to the sidelines for perhaps a six-month stay. Financial conditions are still tighter than they were before the fourth-quarter selloff, but they’ve eased quite a bit. Chart 2The Rate Backup Spooked Homebuyers, But They'll Be Back
The Rate Backup Spooked Homebuyers, But They'll Be Back
The Rate Backup Spooked Homebuyers, But They'll Be Back
The Fed signaled an even lengthier pause in March, bemoaning the risk of too-low inflation expectations, at a time when global growth was already slumping (Chart 3). It seemed to us that it began to worry about the prospect of entering the next recession with inflation expectations below 2%, from which it would not be able to lower the real fed funds rate below -2%. Inflation expectations of 2.5%, on the other hand, would support a real fed funds rate of -2.5%, providing the Fed with additional firepower to restart the economy. The post-meeting dots removed two full rate hikes from the median voter’s terminal-rate projection, and appeared to stretch the Fed’s pause from six months to twelve. Chart 3As Global Trade Goes, So Goes Global Growth
As Global Trade Goes, So Goes Global Growth
As Global Trade Goes, So Goes Global Growth
Global trade facilitates global growth. Impediments to trade can cast a long shadow over the global economy, and the escalation of trade tensions provided the catalyst for the Fed’s latest dovish turn. Against a backdrop of uninspiring global growth, taking out some monetary policy insurance to protect against increasing trade frictions may well be a prudent course of action, especially in a low-inflation environment. At the moment, we assign slightly better than a 50% probability that the FOMC will cut the target rate at its July 30-31 meeting, but much could change between now and then. Q: What will happen if the Fed cuts rates? If the Fed cuts the fed funds rate in response to a rapidly weakening economy, risk assets will fare poorly. If the economy’s doing fine, and the rate cut is simply an insurance policy, the additional accommodation would give the economy an incremental boost, extending the longevity of the expansion. A longer runway for the business cycle, in turn, would mean longer (and bigger) bull markets in equities and spread product. In our base-case scenario in which the economy’s doing fine, a rate cut (or cuts) would be tantamount to spiking the punchbowl, and would therefore extend the sell-by date on our overweight equities and spread product recommendations. We don’t think the U.S. economy needs easier monetary policy, but there’s nothing in the current low-inflation environment that would prevent the Fed from cutting the fed funds rate as insurance against a downturn. Q: But what will happen if the Fed falls short of the rate-cut expectations that are already being discounted by the markets? As implied by the overnight index swap (OIS) curves, the money markets are pricing in 75 basis points (“bps”) of rate cuts in 2019, and another 25 in 2020 (Chart 4). Those expectations are awfully aggressive, and they are flatly incompatible with our constructive view. If the economy proves to be more resilient than expected, spread product will outperform Treasuries, especially given how much the latter have surged on the pickup in risk aversion. In line with our U.S. Bond Strategy service’s Golden Rule of Bond Investing,1 we expect that long-maturity Treasuries will underperform the overall Treasury index if actual rate cuts fall short of expected rate cuts over the next twelve months. We expect that the yield curve will first shift higher as the market discounts a better economic future (real rates rise) and then steepen as investors begin to discount the inflation implications of unneeded incremental monetary accommodation. Chart 4The Money Market Seems To Foresee A Recession
The Money Market Seems To Foresee A Recession
The Money Market Seems To Foresee A Recession
Chart 5Stocks Do Better When Real Rates Are Rising
Stocks Do Better When Real Rates Are Rising
Stocks Do Better When Real Rates Are Rising
If the economy surprises to the upside, the resulting boost to earnings should help equity investors overcome any disappointment resulting from a rate-cut shortfall. In terms of equity analysts’ spreadsheets, we expect that the boost to the earnings numerator would be large enough to overcome the drag from a larger interest rate denominator. Empirically, U.S. equities perform better over periods when real rates are rising than they do when real rates are falling (Chart 5). Q: What do you see for the rest of the world? We see improvement for the rest of the world. After 2017’s globally synchronized upturn, the first since the crisis, 2018 was marked by a sharp divergence in momentum. The U.S., fueled by fiscal stimulus, powered ahead, while China slowed, hobbled by monetary tightening. We think it is telling that the rest of the world followed China, the world’s second largest standalone economy, rather than the U.S., the comparatively closed number one (Chart 6). Chart 6Divergent Paths
Divergent Paths
Divergent Paths
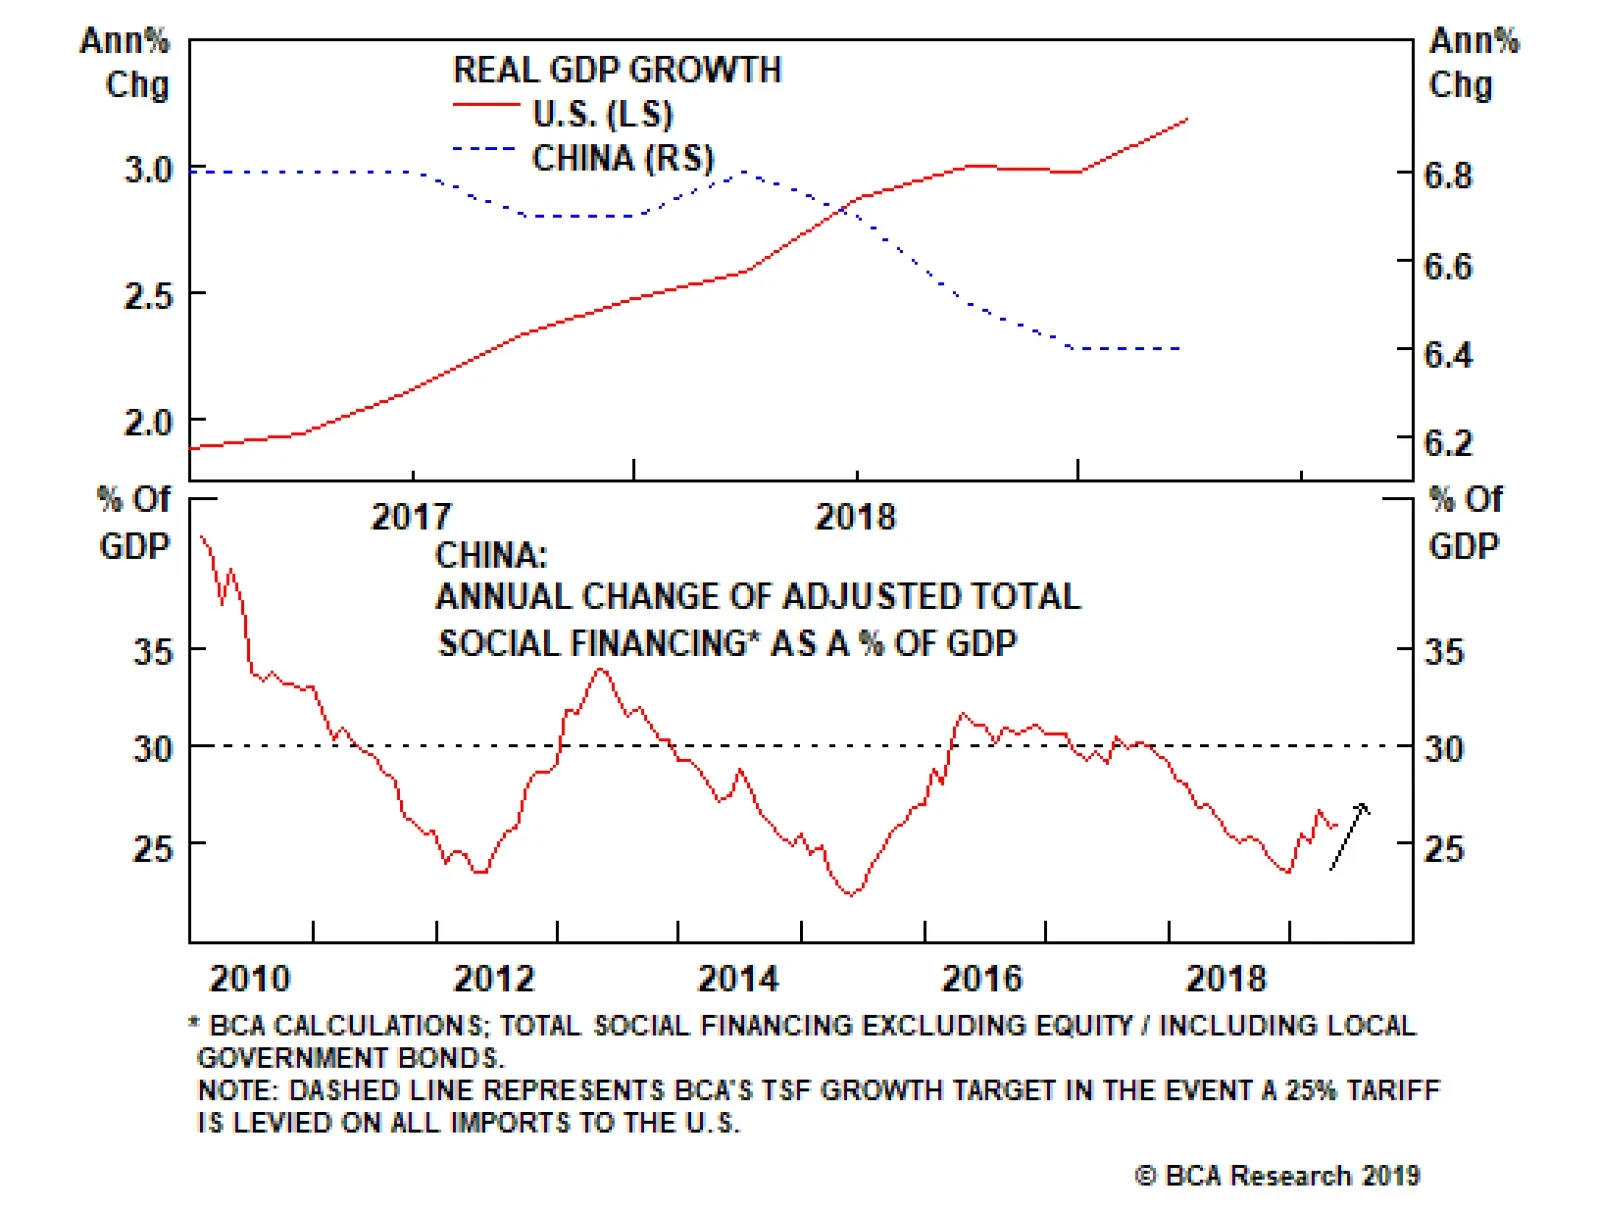
Our China Investment Strategy and Geopolitical Strategy teams have repeatedly made the case that investors have underestimated the lagged impact of tight monetary policy and slowing domestic credit growth on the Chinese economy over the past two years. While the existing tariffs on imports to the U.S. are a drag on Chinese growth, policymakers’ efforts to redirect credit creation from the shadow banking system to the regulated banking system has had a larger impact on economic activity. Now that the regulatory impediment has been removed, total social financing growth has picked up, and our China team expects it to rise meaningfully over the coming year in order to overcome the combination of still-muted economic momentum and a larger shock to the export sector (Chart 7). The key takeaway is that ongoing policy efforts will allow Chinese growth to stabilize and there is scope for policy to induce re-acceleration over the coming six to twelve months. The bullish scenario holds that Chinese growth will rebound as policymakers make use of that capacity. Chart 7Add Leverage In Case Of Tariffs
Add Leverage In Case Of Tariffs
Add Leverage In Case Of Tariffs
Chinese imports are the key channel by which China impacts growth in the rest of the world. Increased Chinese aggregate demand will feed increased demand for materials and goods imports. China’s imports are Europe’s, Japan’s, emerging Asia’s, and the resource economies’ exports. If China bottoms and turns higher, we anticipate that its trading partners will as well with a lag of a few months. We side with the bulls and expect that it will, and we expect that the China-driven revival in the global economy, ex-U.S., will help spark a modest self-reinforcing acceleration cycle. As this virtuous circle begins to turn, the growth divergence between the U.S. (where the fiscal thrust from the stimulus package is nearly spent) and the rest of the world will narrow. We expect the dollar will peak once markets catch on to the shift, and that U.S. equities will shift from leader to laggard, in common-currency terms. Narrowing equity outperformance should help push the dollar lower at the margin, which in turn should help blunt Treasuries’ appeal to foreign investors, steering investment capital away from the U.S. Dollar softness, at the margin, should help contribute to S&P 500 earnings gains, reinforcing our bullish equity take in absolute terms. An exogenous shock could trip up the U.S. economy, but it’s hard to find clear-cut signs of internal weakness. Q: What data are you watching to tell you that your view may not come to pass? Much of our sanguine take turns on the idea that monetary policy settings have not yet turned restrictive. We cannot know in real time where the line of demarcation between reflationary and restrictive monetary policy lies, however, so we are on the lookout for data that might disprove our assessment that the fed funds rate is still comfortably in reflationary territory. Housing is the segment of the economy that is most sensitive to interest rates, and we would be concerned if it took a turn for the worse. For now, though, we’re encouraged by the homebuilder sentiment survey, which has retraced nearly all of its fourth-quarter losses (Chart 8), and suggests that the modest recovery in housing starts and new home sales will continue. Chart 8Homebuilders Are Feeling Pretty Chipper
Homebuilders Are Feeling Pretty Chipper
Homebuilders Are Feeling Pretty Chipper
Chart 9What Recession?
What Recession?
What Recession?
The inverted yield curve has gotten everyone’s attention, but one month of inversion is not enough to declare that a recession is on the way. It also appears that the inversion may have been inspired by investor risk aversion more than a sense that recession is nigh. Our Global Fixed Income Strategy service looked at the average position of several key data series at the onset of the last five recessions and found that conditions look a lot better than they did when those recessions were developing (Chart 9).2 The Leading Economic Index’s (LEI) recession forecasting record matches the yield curve’s. When it contracts on a year-over-year basis, recessions have reliably followed (Chart 10). The LEI is still expanding, but it has been steadily decelerating, and we are keeping a close eye on it. If it contracted while the yield curve was inverted, we would probably have to throw in the towel on our view that policy is still easy, and a recession is therefore still a ways off. Chart 10The LEI Is Not Yet Sounding The Recession Alarm
The LEI Is Not Yet Sounding The Recession Alarm
The LEI Is Not Yet Sounding The Recession Alarm
Doug Peta, CFA Chief U.S. Investment Strategist dougp@bcaresearch.com Footnotes 1 Please see the U.S. Bond Strategy Special Report titled, “The Golden Rule Of Bond Investing,” published July 24, 2018, available at usbs.bcaresearch.com. 2 Please see the Global Fixed Income Strategy Weekly Report titled, “The Risk Aversion Curve Inversion,” published June 4, 2019, available at gfis.bcaresearch.com.
Next week, the U.S. calendar will be charged and will provide many sources of volatility for the market. At its Wednesday press conference, the Fed will not only announce its rate decision, it will also release a new set of economic projections. While BCA…
Highlights The odds of a cyclical upturn in the global semiconductor sector over the next three to six months are low. Global semiconductor demand will continue to decline due to contracting demand for smartphones, automobiles, personal computers (PCs), and servers. Global semiconductor stocks are still facing considerable downside in absolute terms. We recommend going long Asian semiconductor stocks versus the U.S. S&P 500 semiconductor index. Dedicated EM equity portfolios should stay neutral on the Taiwanese bourse and Korean technology sector relative to the overall EM benchmark. Feature Chart 1 shows share prices of the global semiconductor sector and global semiconductor sales in the past two decades. Chart 1Global Semiconductor Market: Sales & Share Prices
Global Semiconductor Market: Sales & Share Prices
Global Semiconductor Market: Sales & Share Prices
Was last December’s trough in global semiconductor equity prices the ultimate bottom in this cycle? The odds are in favor of a continued contraction in global semiconductor sales and further downside in semiconductor share prices over the next three to six months. Cycle-On-Cycle Analysis Semiconductor sales experienced five recessions over the past 20 years. Table 1 illustrates the peak-to-bottom percentage decline in nominal global semiconductor sales and the magnitude of the drop in global semiconductor share prices in U.S. dollar terms during these five cyclical downturns in this industry. It also indicates the duration of each downturn and the number of months that semiconductor stocks led the bottom in global semiconductor sales. Table 1Key Statistics Of Five Cyclical Downturns In Global Semiconductor Market
The Global Semiconductor Sector: Is A Cyclical Upturn Imminent?
The Global Semiconductor Sector: Is A Cyclical Upturn Imminent?
The current shrinkage of semiconductor sales is worse than the 2011-12 and 2015 downturns. Yet, it is still smaller than the magnitude during the 2008 Great Financial Crisis and the 2001 tech bubble bust. The revenue of semiconductor companies has so far contracted by 24%, which is disproportionally more than the decline in share prices of these companies. The global semiconductor equity index is only 14% below its March 2018 high. It appears as though the market is expecting a quick recovery in semiconductor sales. As per Table 1, in the downturns of 2008, 2011 and 2015, global semiconductor stocks all bottomed before the bottom of global semiconductor sales. Only in the 2001 episode, stock prices bottomed eight months after the bottom in sales. In the current cyclical downturn, global semiconductor sales have so far had only four months of growth contraction,1 far less than the 13-16 months experienced in all the past four cycles. All in all, we would lean against the market’s expectation of an imminent recovery in the semiconductor cycle. The demand downturn will last another three to six months and share prices are facing major headwinds. Global Semiconductor Demand Semiconductor sales are in contraction across countries and regions (Chart 2). In April – before President Trump’s tweet on imposing new import tariff on China, global semiconductor sales growth sank to a negative 15% year-on-year. The short-term (three-to-six month) outlook for global semiconductor demand remains dismal. Chart 3 shows global semiconductor revenue breakdown in terms of end usage. Mobile phones account for the largest share (29%) of the market, followed by PCs (12%), miscellaneous consumer products (12%), and servers (11%). All of these major demand sources are under downward pressure: Smartphone Sales Global smartphone sales are shrinking (Chart 4). According to the International Data Corporation (IDC), global smartphone shipments declined 6.6% year-on-year in volume terms in the first quarter of this year, worse than last year’s 4.4% drop. Chart 2Semiconductor Sales Are In Contraction Across Countries
Semiconductor Sales Are In Contraction Across Countries
Semiconductor Sales Are In Contraction Across Countries
In the current cyclical downturn, global semiconductor sales have so far had only four months of growth contraction, far less than the 13-16 months experienced in all the past four cycles.
Chart 3
Chart 4Global Smartphone Sales: Contracting
Global Smartphone Sales: Contracting
Global Smartphone Sales: Contracting
We expect smartphone shipments to continue contracting in the second half of this year. Major markets such as mainland China and advanced economies have entered the saturation phase of mobile-phone demand. For example, U.S. shipments were down 15% year-on-year in the first quarter due to near-full market penetration. In China, smartphone sales have shown signs of stabilization (Chart 5). However, this is probably temporary and has been driven by the boom in Huawei smartphone sales in China since early this year. The incredible 50% year-on-year growth of Huawei smartphone sales in the first quarter is not sustainable. While global sales of Huawei smartphones increased by 20 million units, total global smartphone sales of all brands fell by 22 million units (Chart 6). The U.S. punitive actions towards China and Huawei have also instigated nationalism in China. This has triggered a Chinese buying-spree of the Huawei smartphone. Chart 5Chinese Smartphone Sales: Temporary Stabilization
Chinese Smartphone Sales: Temporary Stabilization
Chinese Smartphone Sales: Temporary Stabilization
Chart 6
Yet, this has probably reduced the number of potential Chinese smartphones buyers in the near future. After all, many buyers likely made the purchase earlier than otherwise planned in the absence of a trade war. Although Samsung, Huawei, OnePlus, Xiaomi, Motorola, LG, and ZTE have either released or will release their 5G phones this year, the sales growth from 5G phones will not be able to offset the loss in 2G, 3G and 4G phone sales, at least not in 2019. The IDC estimated that 5G phones would only account for about 0.5% of the market share this year. 5G will likely only begin affecting overall semiconductor demand next year, when they account for a larger share of smartphone sales. Huawei is the market leader in 5G technology. The U.S. boycott of Huawei will likely continue. This will only slow the pace of 5G phone adoption and the development of 5G networks worldwide. On balance, global smartphone demand may only recover next year. Server Demand Global server shipments also experienced a 5% contraction in volume terms in the first quarter of this year, according to IDC (Chart 7). The outlook for the rest of 2019 does not look promising. Global server demand will likely remain in contraction in the second half of this year. Many hyperscale data centers have already purchased considerable amounts of severs in advance of the trade war to avoid tariffs.2 Meanwhile, the escalation in the U.S.-China confrontation has increased economic uncertainties. This may delay potential datacenter investments. Decelerating 5G network development worldwide due to the U.S. ban on Huawei will also tend to discourage new datacenter and cloud services projects. This is because the 5G technology enables datacenter and cloud services to experience a huge improvement in terms of data transfer speeds, latency, connectivity, capacity, reliability and mobility. Chart 7Global Server Shipment: Are In Contraction
Global Server Shipment: Are In Contraction
Global Server Shipment: Are In Contraction
Personal Computers (PC) PCs sales are also in contraction (Chart 8). PC demand has entered into the deep-maturation phase while facing strong competition from tablets and laptops. Auto Sales Global auto sales also sank by 5% in April from a year ago, registering the worst contraction since 2009 (Chart 9). Chart 8Global PCs Sales: Deeply Saturated
Global PCs Sales: Deeply Saturated
Global PCs Sales: Deeply Saturated
Chart 9Global Auto Sales Are In Contraction As Well
Global Auto Sales Are In Contraction As Well
Global Auto Sales Are In Contraction As Well
Regarding auto demand, the Chinese government may continue to implement more supportive policies to stimulate car sales in China. However, we believe the recovery will be delayed. The government has already implemented a number of policies to lift domestic car sales since late January, including providing subsidies to encourage new energy vehicle sales, to promote auto sales in rural areas, and to increase auto replacement. The central government recently loosened auto sales restrictions in the first tier cities of Guangzhou and Shenzhen that have restrictive auto sales policies. However, all of these policies have failed to lift Chinese domestic car sales out of deep contraction. The key reason has been a diminishing willingness to spend among Chinese consumers, as suggested by falling households’ marginal propensity to consume (Chart 10). Bottom Line: Global semiconductor demand growth will likely remain weak and will fail to recover in the second half of this year. The basis is that its major upstream markets (smartphone, servers, PCs and automobiles) are all facing cyclically declining demand. Chart 10Chinese Consumers: Diminishing Willingness To Consume
Chinese Consumers: Diminishing Willingness To Consume
Chinese Consumers: Diminishing Willingness To Consume
Inventories And Prices Chart 11 shows the semiconductor supply chain illustrating the process of manufacturing semiconductors starting with silicon wafers and up to final electronic products.
Chart 11
Box 1 explains the role of key segments and players along the supply chain. Box 1 A Brief Explanation Of The Key Segments/Players Of The Supply Chain Both integrated device manufacturers (IDM) and foundries are at the center of the supply chain, responsible for chip manufacturing. In terms of semiconductor sales revenue, Samsung, Intel and SK Hynix are the world’s top three IDM companies and TSMC, Global Foundries and United Microelectronics Corp (UMC) are the world’s top three foundries. While IDMs cover most of the process from IC design, chip fabrication, assembly, testing and packaging, IDM companies still have to purchase raw materials and equipment for the chip-making process. Foundry companies receive orders from IC designing companies like Qualcomm, Nvidia, and Huawei HiSilicon, then purchase needed raw materials and equipment to proceed in the chip-manufacturing process. Both IDMs and foundries can either outsource the tasks of semiconductor assembly and testing or perform them on their own. The final semiconductor products will be used in electronics products, such as smartphones, computers, home appliances, automobiles, etc. Global semiconductor demand growth will likely remain weak and will fail to recover in the second half of this year. The basis is that its major upstream markets (smartphone, servers, PCs and automobiles) are all facing cyclically declining demand. In a typical business cycle, a cyclical downturn begins with a slump in demand for final electronic products (upstream demand). This leads to falling semiconductor sales. As a result, inventory buildup will occur across most of the segments along the semiconductor supply chain. Chipmakers: Producers’ semiconductor inventory in both Taiwan and Korea have reached either a record high or a near-record high (Chart 12). The installed wafer capacities at these two countries are the world’s largest, together accounting for 43% of total global wafer capacity. In addition, the inventory of some major electronic parts and components have also increased considerably in Taiwan (Chart 13). This also implies weaker demand for semiconductor raw materials. Chart 12Chipmakers: A Rapid Buildup In Inventory
Chipmakers: A Rapid Buildup In Inventory
Chipmakers: A Rapid Buildup In Inventory
Chart 13Rising Inventory Of Some Major Electronic Parts And Components
Rising Inventory Of Some Major Electronic Parts And Components
Rising Inventory Of Some Major Electronic Parts And Components
Raw material suppliers: Silicon wafer is the indispensable raw material required in the chip manufacturing process. Japanese companies account for over half of global silicon wafer supply.Chart 14 shows that silicon wafer inventory in Japan has had a significant buildup in volume terms since late last year. Importantly, it is not declining yet. Chart 14Silicon Wafer Inventory: A Significant Buildup As Well
Silicon Wafer Inventory: A Significant Buildup As Well
Silicon Wafer Inventory: A Significant Buildup As Well
Outsourced semiconductor assembly and test (OSAT) providers: Both Singapore and Thailand are OSAT providers while they also manufacture, assemble and export electronic products. Both countries are closer to the downstream side of the semiconductor supply chain. Semiconductor inventory at these two countries has also jumped to a record high (Chart 15). Chart 15Singapore and Thailand: Record High Semiconductor inventory
Singapore and Thailand: Record High Semiconductor inventory
Singapore and Thailand: Record High Semiconductor inventory
Importantly, a marginal improvement in demand will tend to support spot prices. For example, in the memory chip market, falling prices denote weak demand relative to excess supply. When prices of DRAM and NAND start to form a bottom or decisively move up, this may indicate the arrival of a cyclical upturn. So far, both DRAM and NAND prices are continuing to fall (Chart 16). In addition, the prices of silicon wafer – the most important raw material used in the chip-making process – have declined in the first half of this year.3 Chart 16Still Falling Memory Chip Prices
Still Falling Memory Chip Prices
Still Falling Memory Chip Prices
Chart 17Deflating DRAM Prices Suggest Downside Risks To Korean Tech Stocks
Deflating DRAM Prices Suggest Downside Risks To Korean Tech Stocks
Deflating DRAM Prices Suggest Downside Risks To Korean Tech Stocks
In short, prices are the most important variable to monitor. Chart 17 exhibits the high correlation between DRAM prices and the Korean technology sector stock prices. Falling DRAM prices suggest downside risks to technology stocks in Korea. Samsung accounts for about 65% of Korea’s tech index and 27% of the overall Korean equity index. Memory chips accounted for 68% of Samsung’s operating profits in the first quarter of this year. Bottom Line: There has been involuntary inventory accumulation along the entire supply chain of semiconductors. This and ongoing price deflation among various types of semiconductors foreshadow a downbeat near-term outlook. The Interpretation Of Some Positive Developments There have been some positive developments in the past several months. Taiwanese PMI new orders diffusion index in the electronics sector jumped out of deep contraction to reach zero, and Chinese semiconductor imports halted their decline in both volume and value terms (Chart 18). The improvement in the aforementioned data was probably mainly due to large semiconductor purchases by China to hedge the rising risk of U.S. blocking China’s technological development (Chart 19). Chart 18Some Positive Development
Some Positive Development
Some Positive Development
Chart 19China: More Semiconductors Purchases Before The Tariff And U.S. Huawei Ban?
China: More Semiconductors Purchases Before The Tariff And U.S. Huawei Ban?
China: More Semiconductors Purchases Before The Tariff And U.S. Huawei Ban?
Besides, Huawei smartphone sales have been booming, which we deliberated on page 5, could have been responsible for the improvement in these data. This one-off surge will likely dwindle going forward. Investment Conclusions We remain negative on Asian semiconductor share prices in absolute terms. A continued contraction in global semiconductor sales will further squeeze their profits. In relative terms, we are neutral on the Asian semiconductor sector: we continue recommending market-weight allocation to Taiwan’s overall market and the Korean technology sector within the EM equity benchmark. As a new trade, we recommend going long Asian semiconductor stocks and short the S&P 500 semiconductor index over the next three to six months (Chart 20). The Bloomberg Asia Pacific semiconductor index has nine stocks. Samsung and TSMC account for 42% and 38% of the index, respectively. There has been involuntary inventory accumulation along the entire supply chain of semiconductors. This and ongoing price deflation among various types of semiconductors foreshadow the downbeat near-term outlook. Samsung will likely benefit from the U.S. ban on Huawei in the smartphone sector outside of China. In addition, Samsung will win some market share from Apple as the latter does not have a 5G phone to release this year. These positive factors may partially offset the negative impact from falling memory prices and demand on Samsung. The S&P 500 semiconductor index has 13 stocks. Intel, Broadcom, Texas Instruments and Qualcomm are the top five constituents, together accounting for nearly 70% of the index. Most of these companies are IC designing companies, which will likely suffer as Chinese demand for their products shrink due to the U.S. administration's ban on Huawei. This position will also benefit from U.S. dollar appreciation. A firm dollar will hurt profits of U.S. semiconductor stocks. In turn, currency depreciation in Korea and Taiwan will on the margin benefit Asian semiconductor stocks. Chart 20Recommend Long Asia Pacific Semiconductor Stock Vs. S&P 500 Semiconductor Index
Recommend Long Asia Pacific Semiconductor Stock Vs. S&P 500 Semiconductor Index
Recommend Long Asia Pacific Semiconductor Stock Vs. S&P 500 Semiconductor Index
Chart 21The 2015 Experience
The 2015 Experience
The 2015 Experience
Chart 21 shows that global foundry companies outperformed global IC designing companies during the final phase of the 2015 cyclical downturn. Odds are that these dynamics will play out in this downturn as well. Finally, the relative performance of Asian semiconductor stocks versus U.S. ones is oversold and might stage some sort of mean reversion (Chart 20). Ellen JingYuan He, Associate Vice President ellenj@bcaresearch.com Footnotes 1 Please note that here the calculation for “the number of months of the growth contraction” is different from the one for the “peak-to-bottom duration” in Table 1. “The number of months of the growth contraction” equals the number of months when semiconductor sales year-on-year growth is negative. 2 https://marketrealist.com/2019/05/nvidias-data-center-revenue-inference-rendering-and-edge/ 3 http://www.sohu.com/a/300386061_132567, http://news.moore.ren/industry/104958.htm Equity Recommendations Fixed-Income, Credit And Currency Recommendations