Global

BCA takes pride in its independence. Strategists publish what they really believe, informed by their framework and analysis. Occasionally, this independence results in strongly diverging views and we currently are in one of those times. Within BCA, two views on the cyclical (six to 12-months) outlook for assets have emerged. One camp expects global growth to rebound in the second half of the year. Along with accelerating growth, they anticipate stock prices and risk assets to remain firm, cyclical equities to outperform defensive ones, safe-haven yields to move up, and the dollar to weaken. Meanwhile, another group foresees a further deterioration in activity or a delayed recovery, additional downside in stocks and risk assets, outperformance of defensives relative to cyclicals, low safe-haven yields, and a generally stronger dollar. For the sake of transparency, we have asked representatives of each camp to make their case in a round-table discussion, allowing our clients to decide for themselves which view is more appealing to them. Global Investment Strategy’s Peter Berezin, U.S. Investment Strategy’s Doug Peta, and Global Fixed Income Strategy’s Rob Robis take the mantle for the bullish camp. U.S. Equity Strategy’s Anastasios Avgeriou, Emerging Market Strategy’s Arthur Budaghyan, and European Investment Strategy’s Dhaval Joshi represent the bearish group.1 The round-table discussion below focuses on the cyclical outlook. For longer investment horizons, most strategists agree that a recession is highly likely by 2022. Moreover, on a long-term basis, valuations in both risk assets and safe-haven bonds are very demanding. In this context, a significant back up in yields could hammer risk assets. The BCA Round Table Mathieu Savary: Yield curve inversions have often been harbingers of recessions. Anastasios, you are amongst those investors troubled by this inversion. Do you not worry that this episode might prove similar to 1998, when the curve only inverted temporarily and did not foreshadow a recession? Moreover, how do you account for the highly variable time lags between the inversion of the yield curve and the occurrence of a recession? Anastasios Avgeriou: The yield curve inverts at or near the peak of the business cycle and it eventually forewarns of upcoming recessions. This past December, parts of the yield curve inverted and now, BCA’s U.S. Equity Strategy service is heeding the signal from this simple indicator, especially given that the SPX has subsequently made all-time highs as our research predicted.2 Chart 1 (ANASTASIOS)The 1998 Episode Revisited
The 1998 Episode Revisited
The 1998 Episode Revisited
The yield curve inversion forecasts a Fed rate cut, and it has never been wrong on that front. It served well investors that heeded the message in June of 1998 as the market soon thereafter fell 20% in a heartbeat. If investors got out at the 1998 peak near 1200 and forwent about 350 points of gains until the March 2000 SPX cycle peak, they still benefited if they held tight as the market ultimately troughed near 777 in October 2002 (Chart 1). With regard to timing the previous seven recessions using the yield curve, if we accept that mid-1998 is the starting point of the inversion, it took 33 months before the recession commenced. Last cycle, the recession began 24 months after the inversion. Consequently, December 2020 is the earliest possible onset of recession and September 2021, the latest. Our forecast calls for SPX EPS to fall 20% in 2021 to $140 with the multiple dropping between 13.5x and 16.5x for an SPX end-2020 target range of 1,890-2,310.3 In other words we are not willing to play a 100-200 point advance for a potential 1,000 point drawdown. The risk/reward tradeoff is to the downside, and we choose to sit this one out. Mathieu: Rob, you take a much more sanguine view of the current curve inversion. Why? Rob Robis: While the four most dangerous words in investing are “this time is different,” this time really does appear to be different. Never before have negative term premia on longer-term Treasury yields and a curve inversion coexisted (Chart 2). Longer-term Treasury yields have therefore been pushed down to extremely low levels by factors beyond just expectations of a lower fed funds rate. The negative Treasury term premium is distorting the economic message of the U.S. yield curve inversion. Chart 2 (ROB)Negative Term Premium Distorting The Economic Message Of An Inverted Yield Curve
Negative Term Premium Distorting The Economic Message Of An Inverted Yield Curve
Negative Term Premium Distorting The Economic Message Of An Inverted Yield Curve
Term premia are depressed everywhere, as seen in German, Japanese and other yields, reflecting the intense demand for safe assets like government bonds during a period of heightened uncertainty. Global bond markets may also be discounting a higher probability of the ECB restarting its Asset Purchase Program, as term premia typically fall sharply when central banks embark on quantitative easing. This has global spillovers. Prior to previous recessions, U.S. Treasury curve inversions occurred when the Fed was running an unequivocally tight monetary policy. That is not the case today. The real fed funds rate still is not above the Fed’s estimate of the neutral real rate, a.k.a. “r-star,” which was the necessary ingredient for all previous Treasury curve inversions since 1960 (Chart 3). Chart 3 (ROB)Fed Policy Is Not Tight Enough For Sustained Curve Inversion
Fed Policy Is Not Tight Enough For Sustained Curve Inversion
Fed Policy Is Not Tight Enough For Sustained Curve Inversion
Mathieu: The level of policy accommodation will most likely determine whether Anastasios or Rob is proven right. Peter, you have been steadfastly arguing that policy, in the U.S. at least, remains easy. Can you elaborate why? Peter Berezin: Remember that the neutral rate of interest is the rate that equalizes the level of aggregate demand with the economy’s supply-side potential. Loose fiscal policy and fading deleveraging headwinds are boosting demand in the United States. So is rising wage growth, especially at the bottom of the income distribution. Given that the U.S. does not currently suffer from any major imbalances, I believe that the economy can tolerate higher rates without significant ill-effects. In other words, monetary policy is currently quite easy. Of course, we cannot observe the neutral rate directly. Like a black hole, one can only detect it based on the effect that it has on its surroundings. Housing is by far the most interest rate-sensitive sector of the economy. If history is any guide, the recent decline in mortgage rates will boost housing activity in the remainder of the year (Chart 4). If that relationship breaks down, as it did during the Great Recession, it would suggest that the neutral rate is quite low. Chart 4 (PETER)Declining Mortgage Rates Bode Well For Housing
Declining Mortgage Rates Bode Well For Housing
Declining Mortgage Rates Bode Well For Housing
Given that mortgage underwriting standards have been quite strong and the homeowner vacancy is presently very low, our guess is that housing will hold up well. We should know better in the next few months. Mathieu: Dhaval, you do not agree. Why do you think global rates are not accommodative? Dhaval Joshi: Actually, I think that global rates are accommodative, but that the global bond yield can rise by just 70 bps before conditions become perilously un-accommodative. Here’s where I disagree with Peter: for me, the danger doesn’t come from economics, it comes from the mathematics of ultra-low bond yields. The unprecedented and experimental panacea of our era has been ‘universal QE’ – which has led to ultra-low bond yields everywhere. But what is not understood is that when bond yields reach and remain close to their lower bound, weird things happen to the financial markets.
Chart 5
I refer you to other reports for the details, but in a nutshell, the proximity of the lower bound to yields increases the risk of owning supposedly ‘safe’ bonds to the risk of owning so-called ‘risk-assets’. The result is that the valuation of risk-assets rises exponentially (Chart 5). Because when the riskiness of the asset-classes converges, investors price risk-assets to deliver the same ultra-low nominal return as bonds.4 Comparisons with previous economic cycles miss the current danger. The post-2000 policy easing distorted the global economy by engineering a credit boom – so the subsequent danger emanated from the most credit-sensitive sectors in the economy such as mortgage lending. In contrast, the post-2008 ‘universal QE’ has severely distorted the valuation relationship between bonds and global risk-assets – so this is where the current danger lies. Higher bond yields can suddenly undermine the valuation support of global risk-assets whose $400 trillion worth dwarfs the global economy by five to one. Where is this tipping point? It is when the global 10-year yield – defined as the average of the U.S., euro area,5 and China – approaches 2.5%. Through the past five years, the inability of this yield to remain above 2.5% confirms the hyper-sensitivity of financial conditions to this tipping point (Chart 6). Right now, I agree that bond yields are accommodative. But the scope for yields to move higher is quite limited. Chart 6 (DHAVAL)Since 2015, the Global Long Bond Yield Has Struggled To Surpass 2.5 Percent
Since 2015, the Global Long Bond Yield Has Struggled To Surpass 2.5 Percent
Since 2015, the Global Long Bond Yield Has Struggled To Surpass 2.5 Percent
Mathieu: Monetary policy is important to the outlook, but so is the global manufacturing cycle. The global growth slowdown has been concentrated in the manufacturing sector, tradeable goods in particular. Across advanced economies, the service and consumer sectors have been surprisingly resilient, but this will not last if the industrial sector decelerates further. Arthur, you still do not anticipate any major improvement in global trade and industrial production. Can you elaborate why? Chart 7 (ARTHUR)Global Trade Is Down Due To China Not U.S.
Global Trade Is Down Due To China Not U.S.
Global Trade Is Down Due To China Not U.S.
Arthur Budaghyan: To properly assess the economic outlook, one needs to understand what has caused the ongoing global trade/manufacturing downturn. One thing we know for certain: It originated in China, not the U.S. Chart 7 illustrates that Korean, Japanese, Taiwanese and Singaporean exports to China have been shrinking at an annual rate of 10%, while their shipments to the U.S. have been growing. China’s aggregate imports have also been contracting. This entails that from the perspective of the rest of the world, China has been and remains in recession. U.S. manufacturing is the least exposed to China, which is the main reason why it has been the last shoe to drop. Hence, the U.S. has lagged in this downturn, and one should not be looking to the U.S. for clues about a potential global recovery. We need to gauge what will turn Chinese demand around. In this regard, the rising credit and fiscal spending impulse is positive, but it has so far failed to kick start a recovery (Chart 8). The key reason has been a declining marginal propensity to spend among households and companies. Notably, the marginal propensity to spend of mainland companies leads industrial metals prices by a few months, and it currently continues to point south (Chart 8, bottom panel). The lack of willingness among Chinese consumers and enterprises to spend is due to several factors: (1) the U.S.-China confrontation; (2) high levels of indebtedness among both enterprises and households (Chart 9); (3) ongoing regulatory scrutiny over banks and shadow banking as well as local government debt; and (4) a lack of outright government subsidies for purchases of autos and housing. Chart 8 (ARTHUR)Stimulus Versus Marginal Propensity To Spend
Stimulus Versus Marginal Propensity To Spend
Stimulus Versus Marginal Propensity To Spend
Chart 9 (ARTHUR)Chinese Households Are More Leveraged Than U.S. Ones
Chinese Households Are Leveraged Than U.S. Ones
Chinese Households Are Leveraged Than U.S. Ones
On the whole, the falling marginal propensity to spend will all but ensure that any recovery in mainland household and corporate spending is delayed. Mathieu: Meanwhile, Peter, you have a much more optimistic stance. Why do you differ so profoundly with Arthur’s view? Peter: China’s deleveraging campaign began more than a year before global manufacturing peaked. I have no doubt that slower Chinese credit growth weighed on global capex, but we should not lose sight of the fact there are natural ebbs and flows at work. Most manufactured goods retain some value for a while after they are purchased. If spending on, say, consumer durable goods or business equipment rises to a high level for an extended period, a glut will form, requiring a period of lower production. Chart 10 (PETER)The Global Manufacturing Cycle Has Likely Reached A Bottom
The Global Manufacturing Cycle Has Likely Reached A Bottom
The Global Manufacturing Cycle Has Likely Reached A Bottom
These demand cycles typically last about three years; roughly 18 months on the way up, 18 months on the way down (Chart 10). The last downleg in the global manufacturing cycle began in early 2018, so if history is any guide, we are nearing a trough. The fact that U.S. manufacturing output rose in both May and June, followed by this week’s sharp rebound in the July Philly Fed Manufacturing survey, supports this view. Of course, extraneous forces could complicate matters. If trade tensions ratchet higher, this would weaken my bullish thesis. Nevertheless, with China stimulating its economy again, it would probably take a severe trade war to push the global economy into recession. Mathieu: Dhaval, you are not as negative as Arthur, but nonetheless expect a slowdown in the second half of the year. What is your rationale? Dhaval: To be clear, I am not forecasting a recession or major downturn – unless, as per my previous answer, the global 10-year bond yield approaches 2.5% and triggers a severe dislocation in global risk-assets. In fact, many people get the relationship between recession and financial market dislocation back-to-front: they think that the recession causes the financial market dislocation when, in most cases, the financial market dislocation causes the recession! Nevertheless, I do believe that European and global growth is entering a regular down-oscillation based on the following compelling evidence: From a low last summer, quarter-on-quarter GDP growth rates in the developed economies have already rebounded to the upper end of multi-year ranges. Short-term credit impulses in Europe, the U.S., and China are entering down-oscillations (Chart 11). The best current activity indicators, specifically the ZEW economic sentiment indicators, have rolled over. The outperformance of industrials – the equity sector most exposed to global growth – has also rolled over. Why expect a down-oscillation? Because it is the rate of decline in the bond yield that drove the rebound in growth after its low last summer. Furthermore, it is impossible for the rate of decline in the bond yield to keep increasing, or even stay where it is. Counterintuitively, if bond yields decline, but at a reduced pace, the effect is to slow economic growth. Mathieu: A positive and a negative view of the world logically result in bifurcated outlooks for interest rates and the dollar. Rob, how do you see U.S., German, and Japanese yields evolving over the coming 12 months? Rob: If global growth rebounds, U.S. Treasury yields will have far more upside than Bund or JGB yields. Inflation expectations should recover faster in the U.S., with the Fed taking inflationary risks by cutting rates with a 3.7% unemployment rate and core CPI inflation at 2.1%. The Fed is also likely to disappoint by delivering fewer rate cuts than are currently discounted by markets (90bps over the next 12 months). Treasury yields can therefore increase more than German and Japanese yields, with the ECB and BoJ more likely to deliver the modest rate cuts currently discounted in their yield curves (Chart 12). Chart 11 (DHAVAL)Short-Term Impulses Rebounded... But Are Now Rolling Over
Short-Term Impulses Rebounded... But Are Now Rolling Over
Short-Term Impulses Rebounded... But Are Now Rolling Over
Chart 12 (ROB)U.S. Treasuries Will Underperform Bunds & JGBs
U.S. Treasuries Will Underperform Bunds & JGBs
U.S. Treasuries Will Underperform Bunds & JGBs
Japanese yields will remain mired at or below zero over the next 6-12 months, as wage growth and core inflation remain too anemic for the BoJ to alter its 0% target on 10-year JGB yields. German yields have a bit more potential to rise if European growth begins to recover, but will lag any move higher in Treasury yields. That means that the Treasury-Bund and Treasury-JGB spreads will move higher over the next year. Negative German and Japanese yields may look completely unappetizing compared to +2% U.S. Treasury yields, but this handicap vanishes when all three yields are expressed in U.S. dollar terms. Hedging a 10-year German Bund or JGB into higher-yielding U.S. dollars creates yields that are 50-60bps higher than a 10-year U.S. Treasury. It is abundantly clear that German and Japanese bonds will outperform Treasuries over the next year if global growth recovers. Mathieu: Peter, your positive view on global growth means that the Fed will cut rates less than what is currently priced into the OIS curve. So why do you expect the dollar to weaken in the second half of 2019? Peter: What the Fed does affects interest rate differentials, but just as important is what other central banks do. The ECB is not going to raise rates over the next 12 months. However, if euro area growth surprises on the upside later this year, investors will begin to question the need for the ECB to keep policy rates in negative territory until mid-2024. The market’s expectation of where policy rates will be five years out tends to correlate well with today’s exchange rate. By that measure, there is scope for interest rate differentials to narrow against the U.S. dollar (Chart 13). Chart 13A (PETER)Interest Rate Expectations Against The U.S. Should Narrow (I)
Interest Rate Expectations Against The U.S. Should Narrow (I)
Interest Rate Expectations Against The U.S. Should Narrow (I)
Chart 13B (PETER)Interest Rate Expectations Against The U.S. Should Narrow (II)
Interest Rate Expectations Against The U.S. Should Narrow (II)
Interest Rate Expectations Against The U.S. Should Narrow (II)
Keep in mind that the U.S. dollar is a countercyclical currency, meaning that it moves in the opposite direction of global growth (Chart 14). This countercyclicality stems from the fact that the U.S. economy is more geared towards services than manufacturing compared with the rest of the world. Chart 14 (PETER)The Dollar Is A Countercyclical Currency
The Dollar Is A Countercyclical Currency
The Dollar Is A Countercyclical Currency
As such, when global growth accelerates, capital tends to flow from the U.S. to the rest of the world, translating into more demand for foreign currency and less demand for dollars. If global growth picks up in the remainder of the year, as I expect, the dollar will weaken. Mathieu: Arthur, as you are significantly more negative on growth than either Rob or Peter, how do you see the dollar and global yields evolving over the coming six to 12 months? Arthur: I am positive on the trade-weighted U.S. dollar for the following reasons: The U.S. dollar is a countercyclical currency – it exhibits a negative correlation with the global business cycle. Persistent weakness in the global economy emanating from China/EM is positive for the dollar because the U.S. economy is the major economic block least exposed to a China/EM slowdown. Meanwhile, the greenback is only loosely correlated with U.S. interest rates. Thereby, the argument that lower U.S. rates will drive the value of the U.S. currency much lower is overemphasized. The Federal Reserve will cut rates by more than what is currently priced into the market only in a scenario of a complete collapse in global growth. Yet this scenario would be dollar bullish. In this case, the dollar’s strong inverse relationship with global growth will outweigh its weak positive relationship with interest rates. Contrary to consensus views, the U.S. dollar is not very expensive. According to unit labor costs based on the real effective exchange rate – the best currency valuation measure – the greenback is only one standard deviation above its fair value. Often, financial markets tend to overshoot to 1.5 or 2 standard deviations below or above their historical mean before reversing their trend. One of the oft-cited headwinds facing the dollar is positioning, yet there is a major discrepancy between positioning in DM and EM currencies versus the U.S. dollar. In aggregate, investors – asset managers and leveraged funds – have neutral exposure to DM currencies, but they are very long liquid EM exchange rates such as the BRL, MXN, ZAR and RUB versus the greenback. The dollar strength will occur mostly versus EM and commodities currencies. In other words, the euro, other European currencies and the yen will outperform EM exchange rates. I have less conviction on global bond yields. While global growth will disappoint, yields have already fallen a lot and the U.S. economy is currently not weak enough to justify around 90 basis points of rate cuts over the next 12 months. Mathieu: Before we move on to investment recommendations, Anastasios, you have done a lot of interesting work on the outlook for U.S. profits. What is the message of your analysis? Chart 15 (ANASTASIOS)Gravitational Pull
Gravitational Pull
Gravitational Pull
Anastasios: While markets cheered the trade truce following the recent G-20 meeting, no tariff rollback was agreed. Since the tariff rate on $200bn of Chinese imports went up from 10% to 25% on May 10, odds are high that manufacturing will remain in the doldrums. This will likely continue to weigh on profits for the remainder of the year. Profit growth should weaken further in the coming six months. Periods of falling manufacturing PMIs result in larger negative earnings growth surprises as market forecasters rarely anticipate the full breadth and depth of slowdowns. Absent profit growth, equity markets lack the necessary ‘oxygen’ for a durable high-quality rally. Until global growth momentum turns, investors should fade rallies. Our four-factor SPX EPS growth model is flirting with the contraction zone. In addition, our corporate pricing power proxy and Goldman Sachs’ Current Activity Indicator both send a distress signal for SPX profits (Chart 15). Already, more than half of the S&P 500 GICS1 sectors’ profits are estimated to have contracted in Q2, and three sectors could see declining revenues on a year-over-year basis, according to I/B/E/S data. Q3 depicts an equally grim profit picture that will also spill over to Q4. Adding it all up, profits will underwhelm into year-end. Mathieu: Doug, you do not share Anastasios’s anxiety. What offsets do you foresee? Moreover, you are not concerned by the U.S. corporate balance sheets. Can you share why? Doug Peta: As it relates to earnings, we foresee offsets from a revival in the rest of the world. Increasingly accommodative global monetary policy and reviving Chinese growth will give global ex-U.S. economies a boost. That inflection may go largely unnoticed in U.S. GDP, but it will help the S&P 500, as U.S.-based multinationals’ earnings benefit from increased overseas demand and a weaker dollar. When it comes to corporate balance sheets, shifting some of the funding burden to debt from equity when interest rates are at generational lows is a no-brainer. Even so, non-financial corporates have not added all that much leverage (Chart 16). Low interest rates, wide profit margins and conservative capex have left them with ample free cash flow to service their obligations (Chart 17). Chart 16 (DOUG)Corporations Have Not Added Much Leverage ...
Corporations Have Not Added Much Leverage ...
Corporations Have Not Added Much Leverage ...
Chart 17 (DOUG)...Though They Have Ample Cash Flow To Service It
...Though They Have Ample Cash Flow To Service It
...Though They Have Ample Cash Flow To Service It
Every single viable corporate entity with an effective federal tax rate above 21% became a better credit when the top marginal rate was cut from 35% to 21%. Every such corporation now has more net income with which to service debt, and will have that income unless the tax code is revised. You can’t see it in EBITDA multiples, but it will show up in reduced defaults. Mathieu: The last, and most important question. What are each of your main investment recommendations to capitalize on the economic trends you anticipate over the coming 6-12 months? Let’s start with the pessimists: Arthur: First, the rally in global cyclicals and China plays since December has been premature and is at risk of unwinding as global growth and cyclical profits disappoint. Historical evidence suggests that global share prices have not led but have actually been coincident with the global manufacturing PMI (Chart 18). The recent divergence is unprecedented. Chart 18 (ARTHUR)Global Stocks Historically Did Not Lead PMIs
Global Stocks Historically Did Not Lead PMIs
Global Stocks Historically Did Not Lead PMIs
Second, EM risk assets and currencies remain vulnerable. EM and Chinese earnings per share are shrinking. The leading indicators signal that the rate of contraction will deepen, at least the end of this year (Chart 19). Asset allocators should continue underweighting EM versus DM equities. Finally, my strongest-conviction, market-neutral trade is to short EM or Chinese banks and go long U.S. banks. The latter are much healthier than EM/Chinese ones, as we discussed in our recent report.6 Anastasios: The U.S. Equity Strategy team is shifting away from a cyclical and toward a more defensive portfolio bent. Our highest conviction view is to overweight mega caps versus small caps. Small caps are saddled with debt and are suffering a margin squeeze. Moreover, approximately 600 constituents of the Russell 2000 have no forward profits. Only one S&P 500 company has negative forward EPS. Given that both the S&P and the Russell omit these figures from the forward P/E calculation, this is masking the small cap expensiveness. When adjusted for this discrepancy, small caps are trading at a hefty premium versus large caps (Chart 20). Chart 19 (ARTHUR)China And EM Profits Are Contracting
China And EM Profits Are Contracting
China And EM Profits Are Contracting
Chart 20 (ANASTASIOS)Continue To Avoid Small Caps
Continue To Avoid Small Caps
Continue To Avoid Small Caps
We have also upgraded the S&P managed health care and the S&P hypermarkets groups. If the economic slowdown persists into early 2020, both of these defensive subgroups will fare well. In mid-April, we lifted the S&P managed health care group to an above benchmark allocation and posited that the selloff in this group was overdone as the odds of “Medicare For All” becoming law were slim. Moreover, a tight labor market along with melting medical cost inflation would boost the industry’s margins and profits (Chart 21). This week, we upgraded the defensive S&P hypermarkets index to overweight arguing that the souring macro landscape coupled with a firming industry demand outlook will support relative share prices (Chart 22). Chart 21 (ANASTASIOS)Buy Hypermarkets
Buy Hypermarkets
Buy Hypermarkets
Chart 22 (ANASTASIOS)Stick With Managed Health Care
Stick With Managed Health Care
Stick With Managed Health Care
Dhaval: To be fair, I am not a pessimist. Provided the global bond yield stays well below 2.5 percent, the support to risk-asset valuations will prevent a major dislocation. But in a growth down-oscillation, the big game in town will be sector rotation into pro-defensive investment plays, especially into those defensives that have underperformed (Chart 23). Chart 23 (DHAVAL)Switch Out Of Growth-Sensitives Into Healthcare
Switch Out Of Growth-Sensitives Into Healthcare
Switch Out Of Growth-Sensitives Into Healthcare
On this basis: Overweight Healthcare versus Industrials. Overweight the Eurostoxx 50 versus the Shanghai Composite and the Nikkei 225. Overweight U.S. T-bonds versus German bunds. Overweight the JPY in a portfolio of G10 currencies. Mathieu: And now, the optimists: Doug: So What? is the overriding question that guides all of BCA’s research: What is the practical investment application of this macro observation? But Why Now? is a critical corollary for anyone allocating investment capital: Why is the imbalance you’ve observed about to become a problem? As Herbert Stein said, “If something cannot go on forever, it will stop.” Imbalances matter, but Dornbusch’s Law counsels patience in repositioning portfolios on their account: “Crises take longer to arrive than you can possibly imagine, but when they do come, they happen faster than you can possibly imagine.” Look at Chart 24, which shows a vast white sky (bull markets) with intermittent clusters of gray (recessions) and light red (bear markets) clouds. Market inflections are severe, but uncommon. When the default condition of an economy is to grow, and equity prices to rise, it is not enough for an investor to identify an imbalance, s/he also has to identify why it’s on the cusp of reversing. Right now, as it relates to the U.S., there aren’t meaningful imbalances in either markets or the real economy. Chart 24 (DOUG)Recessions And Bear Markets Travel Together
Recessions And Bear Markets Travel Together
Recessions And Bear Markets Travel Together
Even if we had perfect knowledge that a recession would arrive in 18 months, now would be way too early to sell. The S&P 500 has historically peaked an average of six months before the onset of a recession, and it has delivered juicy returns in the year preceding that peak (Table 1). Bull markets tend to sprint to the finish line (Chart 25). If this one is like its predecessors, an investor risks significant relative underperformance if s/he fails to participate in its go-go latter stages. Table 1 (DOUG)The S&P 500 Doesn’t Peak Until Six Months Before A Recession …
What Goes On Between Those Walls? BCA’s Diverging Views In The Open
What Goes On Between Those Walls? BCA’s Diverging Views In The Open
Chart 25
We are bullish on the outlook for the next six to twelve months, and recommend overweighting equities and spread product in balanced U.S. portfolios while significantly underweighting Treasuries. Peter: I agree with Doug. Equity bear markets seldom occur outside of recessions and recessions rarely occur when monetary policy is accommodative. Policy is currently easy, and will get even more stimulative if the Fed and several other central banks cut rates. Global equities are not super cheap, but they are not particularly expensive either. They currently trade at about 15-times forward earnings. Given the ultra-low level of global bond yields, this generates an equity risk premium (ERP) that is well above its historical average (Chart 26). One should favor stocks over bonds when the ERP is high. Chart 26A (PETER)Equity Risk Premia Remain Elevated (I)
Equity Risk Premia Remain Elevated (I)
Equity Risk Premia Remain Elevated (I)
Chart 26B (PETER)Equity Risk Premia Remain Elevated (II)
Equity Risk Premia Remain Elevated (II)
Equity Risk Premia Remain Elevated (II)
The ERP is especially elevated outside the United States. This is partly because non-U.S. stocks trade at a meager 13-times forward earnings, but it also reflects the fact that bond yields are lower overseas. Chart 27 (PETER)EM And Euro Area Equities Outperform When Global Growth Improves
EM And Euro Area Equities Outperform When Global Growth Improves
EM And Euro Area Equities Outperform When Global Growth Improves
As global growth accelerates, the dollar will weaken. Equity sectors and regions with a more cyclical bent will benefit (Chart 27). We expect to upgrade EM and European stocks later this summer. A softer dollar will also benefit gold. Bullion will get a further boost early next decade when inflation begins to accelerate. We went long gold on April 17, 2019 and continue to believe in this trade. Rob: For fixed income investors, the most obvious way to play a combination of monetary easing and recovering global growth is to overweight corporate debt versus government bonds (Chart 28). Within the U.S., corporate bond valuations look more attractive in high-yield over investment grade. Assuming a benign outlook for default risk in a reaccelerating U.S. economy, with the Fed easing, going for the carry in high-yield looks interesting. Emerging market credit should also do well if we see a bit of U.S. dollar weakness and additional stimulus measures in China. Chart 28 (ROB)Best Bond Bets: Overweight Global Corporates & Inflation-Linked Bonds
Best Bond Bets: Overweight Global Corporates & Inflation-Linked Bonds
Best Bond Bets: Overweight Global Corporates & Inflation-Linked Bonds
European corporates, however, may end up being the big winner if the ECB chooses to restart its Asset Purchase Program and ramps up its buying of European company debt. There are fewer restrictions for the ECB to buy corporates compared to the self-imposed limits on government bond purchases. The ECB would be entering a political minefield if it chose to buy more Italian debt and less German debt, but nobody would mind if the ECB helped finance European companies by buying their bonds. If one expects reflation to be successful, a below-benchmark stance on portfolio duration also makes sense given the current depressed level of government bond yields worldwide. Yields are more likely to grind upward than spike higher, and will be led first by increasing inflation expectations. Inflation-linked bonds should feature prominently in fixed income portfolios, especially in the U.S. where TIPS will outperform nominal yielding Treasuries. Mathieu: Thank you very much to all of you. Below is a comparative summary of the main arguments and investment recommendations of each camp. Summary Of Views And Recommendations
What Goes On Between Those Walls? BCA’s Diverging Views In The Open
What Goes On Between Those Walls? BCA’s Diverging Views In The Open
What Goes On Between Those Walls? BCA’s Diverging Views In The Open
What Goes On Between Those Walls? BCA’s Diverging Views In The Open
Anastasios Avgeriou U.S. Equity Strategist anastasios@bcaresearch.com Peter Berezin Chief Global Strategist peterb@bcaresearch.com Arthur Budaghyan Chief Emerging Markets Strategist arthurb@bcaresearch.com Dhaval Joshi Chief European Investment Strategist dhaval@bcaresearch.com Doug Peta Chief U.S. Investment Strategist dougp@bcaresearch.com Robert Robis Chief Fixed Income Strategist rrobis@bcaresearch.com Mathieu Savary The Bank Credit Analyst mathieu@bcaresearch.com Footnotes 1 To be fair to each individual involved, this is simplifying their views. Even within each camp, the negativity or positivity ranges on a spectrum, as you will be able to tell from the debate itself. 2 Please see BCA U.S. Equity Strategy Weekly Report, “Signal Vs. Noise,” dated December 17, 2018, available at uses.bcaresearch.com. 3 Please see BCA U.S. Equity Strategy Weekly Report, “A Recession Thought Experiment,” dated June 10, 2019, available at uses.bcaresearch.com. 4 Please see the European Investment Strategy Weekly Report “Risk: The Great Misunderstanding Of Finance,” October 25, 2018 available at eis.bcaresearch.com. 5 France is a good proxy for the euro area. 6 Please see Emerging Markets Strategy Weekly Report, “On Chinese Banks And Brazil,” available at ems.bcaresearch.com. Strategy & Market Trends* MacroQuant Model And Current Subjective Scores
Image
Tactical Trades Strategic Recommendations Closed Trades
BCA takes pride in its independence. Strategists publish what they really believe, informed by their framework and analysis. Occasionally, this independence results in strongly diverging views and we currently are in one of those times. Within BCA, two views on the cyclical (six to 12-months) outlook for assets have emerged. One camp expects global growth to rebound in the second half of the year. Along with accelerating growth, they anticipate stock prices and risk assets to remain firm, cyclical equities to outperform defensive ones, safe-haven yields to move up, and the dollar to weaken. Meanwhile, another group foresees a further deterioration in activity or a delayed recovery, additional downside in stocks and risk assets, outperformance of defensives relative to cyclicals, low safe-haven yields, and a generally stronger dollar. For the sake of transparency, we have asked representatives of each camp to make their case in a round-table discussion, allowing our clients to decide for themselves which view is more appealing to them. Global Investment Strategy’s Peter Berezin, U.S. Investment Strategy’s Doug Peta, and Global Fixed Income Strategy’s Rob Robis take the mantle for the bullish camp. U.S. Equity Strategy’s Anastasios Avgeriou, Emerging Market Strategy’s Arthur Budaghyan, and European Investment Strategy’s Dhaval Joshi represent the bearish group.1 The round-table discussion below focuses on the cyclical outlook. For longer investment horizons, most strategists agree that a recession is highly likely by 2022. Moreover, on a long-term basis, valuations in both risk assets and safe-haven bonds are very demanding. In this context, a significant back up in yields could hammer risk assets. The BCA Round Table Mathieu Savary: Yield curve inversions have often been harbingers of recessions. Anastasios, you are amongst those investors troubled by this inversion. Do you not worry that this episode might prove similar to 1998, when the curve only inverted temporarily and did not foreshadow a recession? Moreover, how do you account for the highly variable time lags between the inversion of the yield curve and the occurrence of a recession? Anastasios Avgeriou: The yield curve inverts at or near the peak of the business cycle and it eventually forewarns of upcoming recessions. This past December, parts of the yield curve inverted and now, BCA’s U.S. Equity Strategy service is heeding the signal from this simple indicator, especially given that the SPX has subsequently made all-time highs as our research predicted.2 Chart 1 (ANASTASIOS)The 1998 Episode Revisited
The 1998 Episode Revisited
The 1998 Episode Revisited
The yield curve inversion forecasts a Fed rate cut, and it has never been wrong on that front. It served well investors that heeded the message in June of 1998 as the market soon thereafter fell 20% in a heartbeat. If investors got out at the 1998 peak near 1200 and forwent about 350 points of gains until the March 2000 SPX cycle peak, they still benefited if they held tight as the market ultimately troughed near 777 in October 2002 (Chart 1). With regard to timing the previous seven recessions using the yield curve, if we accept that mid-1998 is the starting point of the inversion, it took 33 months before the recession commenced. Last cycle, the recession began 24 months after the inversion. Consequently, December 2020 is the earliest possible onset of recession and September 2021, the latest. Our forecast calls for SPX EPS to fall 20% in 2021 to $140 with the multiple dropping between 13.5x and 16.5x for an SPX end-2020 target range of 1,890-2,310.3 In other words we are not willing to play a 100-200 point advance for a potential 1,000 point drawdown. The risk/reward tradeoff is to the downside, and we choose to sit this one out. Mathieu: Rob, you take a much more sanguine view of the current curve inversion. Why? Rob Robis: While the four most dangerous words in investing are “this time is different,” this time really does appear to be different. Never before have negative term premia on longer-term Treasury yields and a curve inversion coexisted (Chart 2). Longer-term Treasury yields have therefore been pushed down to extremely low levels by factors beyond just expectations of a lower fed funds rate. The negative Treasury term premium is distorting the economic message of the U.S. yield curve inversion. Chart 2 (ROB)Negative Term Premium Distorting The Economic Message Of An Inverted Yield Curve
Negative Term Premium Distorting The Economic Message Of An Inverted Yield Curve
Negative Term Premium Distorting The Economic Message Of An Inverted Yield Curve
Term premia are depressed everywhere, as seen in German, Japanese and other yields, reflecting the intense demand for safe assets like government bonds during a period of heightened uncertainty. Global bond markets may also be discounting a higher probability of the ECB restarting its Asset Purchase Program, as term premia typically fall sharply when central banks embark on quantitative easing. This has global spillovers. Prior to previous recessions, U.S. Treasury curve inversions occurred when the Fed was running an unequivocally tight monetary policy. That is not the case today. The real fed funds rate still is not above the Fed’s estimate of the neutral real rate, a.k.a. “r-star,” which was the necessary ingredient for all previous Treasury curve inversions since 1960 (Chart 3). Chart 3 (ROB)Fed Policy Is Not Tight Enough For Sustained Curve Inversion
Fed Policy Is Not Tight Enough For Sustained Curve Inversion
Fed Policy Is Not Tight Enough For Sustained Curve Inversion
Mathieu: The level of policy accommodation will most likely determine whether Anastasios or Rob is proven right. Peter, you have been steadfastly arguing that policy, in the U.S. at least, remains easy. Can you elaborate why? Peter Berezin: Remember that the neutral rate of interest is the rate that equalizes the level of aggregate demand with the economy’s supply-side potential. Loose fiscal policy and fading deleveraging headwinds are boosting demand in the United States. So is rising wage growth, especially at the bottom of the income distribution. Given that the U.S. does not currently suffer from any major imbalances, I believe that the economy can tolerate higher rates without significant ill-effects. In other words, monetary policy is currently quite easy. Of course, we cannot observe the neutral rate directly. Like a black hole, one can only detect it based on the effect that it has on its surroundings. Housing is by far the most interest rate-sensitive sector of the economy. If history is any guide, the recent decline in mortgage rates will boost housing activity in the remainder of the year (Chart 4). If that relationship breaks down, as it did during the Great Recession, it would suggest that the neutral rate is quite low. Chart 4 (PETER)Declining Mortgage Rates Bode Well For Housing
Declining Mortgage Rates Bode Well For Housing
Declining Mortgage Rates Bode Well For Housing
Given that mortgage underwriting standards have been quite strong and the homeowner vacancy is presently very low, our guess is that housing will hold up well. We should know better in the next few months. Mathieu: Dhaval, you do not agree. Why do you think global rates are not accommodative? Dhaval Joshi: Actually, I think that global rates are accommodative, but that the global bond yield can rise by just 70 bps before conditions become perilously un-accommodative. Here’s where I disagree with Peter: for me, the danger doesn’t come from economics, it comes from the mathematics of ultra-low bond yields. The unprecedented and experimental panacea of our era has been ‘universal QE’ – which has led to ultra-low bond yields everywhere. But what is not understood is that when bond yields reach and remain close to their lower bound, weird things happen to the financial markets.
Chart 5
I refer you to other reports for the details, but in a nutshell, the proximity of the lower bound to yields increases the risk of owning supposedly ‘safe’ bonds to the risk of owning so-called ‘risk-assets’. The result is that the valuation of risk-assets rises exponentially (Chart 5). Because when the riskiness of the asset-classes converges, investors price risk-assets to deliver the same ultra-low nominal return as bonds.4 Comparisons with previous economic cycles miss the current danger. The post-2000 policy easing distorted the global economy by engineering a credit boom – so the subsequent danger emanated from the most credit-sensitive sectors in the economy such as mortgage lending. In contrast, the post-2008 ‘universal QE’ has severely distorted the valuation relationship between bonds and global risk-assets – so this is where the current danger lies. Higher bond yields can suddenly undermine the valuation support of global risk-assets whose $400 trillion worth dwarfs the global economy by five to one. Where is this tipping point? It is when the global 10-year yield – defined as the average of the U.S., euro area,5 and China – approaches 2.5%. Through the past five years, the inability of this yield to remain above 2.5% confirms the hyper-sensitivity of financial conditions to this tipping point (Chart 6). Right now, I agree that bond yields are accommodative. But the scope for yields to move higher is quite limited. Chart 6 (DHAVAL)Since 2015, the Global Long Bond Yield Has Struggled To Surpass 2.5 Percent
Since 2015, the Global Long Bond Yield Has Struggled To Surpass 2.5 Percent
Since 2015, the Global Long Bond Yield Has Struggled To Surpass 2.5 Percent
Mathieu: Monetary policy is important to the outlook, but so is the global manufacturing cycle. The global growth slowdown has been concentrated in the manufacturing sector, tradeable goods in particular. Across advanced economies, the service and consumer sectors have been surprisingly resilient, but this will not last if the industrial sector decelerates further. Arthur, you still do not anticipate any major improvement in global trade and industrial production. Can you elaborate why? Chart 7 (ARTHUR)Global Trade Is Down Due To China Not U.S.
Global Trade Is Down Due To China Not U.S.
Global Trade Is Down Due To China Not U.S.
Arthur Budaghyan: To properly assess the economic outlook, one needs to understand what has caused the ongoing global trade/manufacturing downturn. One thing we know for certain: It originated in China, not the U.S. Chart 7 illustrates that Korean, Japanese, Taiwanese and Singaporean exports to China have been shrinking at an annual rate of 10%, while their shipments to the U.S. have been growing. China’s aggregate imports have also been contracting. This entails that from the perspective of the rest of the world, China has been and remains in recession. U.S. manufacturing is the least exposed to China, which is the main reason why it has been the last shoe to drop. Hence, the U.S. has lagged in this downturn, and one should not be looking to the U.S. for clues about a potential global recovery. We need to gauge what will turn Chinese demand around. In this regard, the rising credit and fiscal spending impulse is positive, but it has so far failed to kick start a recovery (Chart 8). The key reason has been a declining marginal propensity to spend among households and companies. Notably, the marginal propensity to spend of mainland companies leads industrial metals prices by a few months, and it currently continues to point south (Chart 8, bottom panel). The lack of willingness among Chinese consumers and enterprises to spend is due to several factors: (1) the U.S.-China confrontation; (2) high levels of indebtedness among both enterprises and households (Chart 9); (3) ongoing regulatory scrutiny over banks and shadow banking as well as local government debt; and (4) a lack of outright government subsidies for purchases of autos and housing. Chart 8 (ARTHUR)Stimulus Versus Marginal Propensity To Spend
Stimulus Versus Marginal Propensity To Spend
Stimulus Versus Marginal Propensity To Spend
Chart 9 (ARTHUR)Chinese Households Are More Leveraged Than U.S. Ones
Chinese Households Are Leveraged Than U.S. Ones
Chinese Households Are Leveraged Than U.S. Ones
On the whole, the falling marginal propensity to spend will all but ensure that any recovery in mainland household and corporate spending is delayed. Mathieu: Meanwhile, Peter, you have a much more optimistic stance. Why do you differ so profoundly with Arthur’s view? Peter: China’s deleveraging campaign began more than a year before global manufacturing peaked. I have no doubt that slower Chinese credit growth weighed on global capex, but we should not lose sight of the fact there are natural ebbs and flows at work. Most manufactured goods retain some value for a while after they are purchased. If spending on, say, consumer durable goods or business equipment rises to a high level for an extended period, a glut will form, requiring a period of lower production. Chart 10 (PETER)The Global Manufacturing Cycle Has Likely Reached A Bottom
The Global Manufacturing Cycle Has Likely Reached A Bottom
The Global Manufacturing Cycle Has Likely Reached A Bottom
These demand cycles typically last about three years; roughly 18 months on the way up, 18 months on the way down (Chart 10). The last downleg in the global manufacturing cycle began in early 2018, so if history is any guide, we are nearing a trough. The fact that U.S. manufacturing output rose in both May and June, followed by this week’s sharp rebound in the July Philly Fed Manufacturing survey, supports this view. Of course, extraneous forces could complicate matters. If trade tensions ratchet higher, this would weaken my bullish thesis. Nevertheless, with China stimulating its economy again, it would probably take a severe trade war to push the global economy into recession. Mathieu: Dhaval, you are not as negative as Arthur, but nonetheless expect a slowdown in the second half of the year. What is your rationale? Dhaval: To be clear, I am not forecasting a recession or major downturn – unless, as per my previous answer, the global 10-year bond yield approaches 2.5% and triggers a severe dislocation in global risk-assets. In fact, many people get the relationship between recession and financial market dislocation back-to-front: they think that the recession causes the financial market dislocation when, in most cases, the financial market dislocation causes the recession! Nevertheless, I do believe that European and global growth is entering a regular down-oscillation based on the following compelling evidence: From a low last summer, quarter-on-quarter GDP growth rates in the developed economies have already rebounded to the upper end of multi-year ranges. Short-term credit impulses in Europe, the U.S., and China are entering down-oscillations (Chart 11). The best current activity indicators, specifically the ZEW economic sentiment indicators, have rolled over. The outperformance of industrials – the equity sector most exposed to global growth – has also rolled over. Why expect a down-oscillation? Because it is the rate of decline in the bond yield that drove the rebound in growth after its low last summer. Furthermore, it is impossible for the rate of decline in the bond yield to keep increasing, or even stay where it is. Counterintuitively, if bond yields decline, but at a reduced pace, the effect is to slow economic growth. Mathieu: A positive and a negative view of the world logically result in bifurcated outlooks for interest rates and the dollar. Rob, how do you see U.S., German, and Japanese yields evolving over the coming 12 months? Rob: If global growth rebounds, U.S. Treasury yields will have far more upside than Bund or JGB yields. Inflation expectations should recover faster in the U.S., with the Fed taking inflationary risks by cutting rates with a 3.7% unemployment rate and core CPI inflation at 2.1%. The Fed is also likely to disappoint by delivering fewer rate cuts than are currently discounted by markets (90bps over the next 12 months). Treasury yields can therefore increase more than German and Japanese yields, with the ECB and BoJ more likely to deliver the modest rate cuts currently discounted in their yield curves (Chart 12). Chart 11 (DHAVAL)Short-Term Impulses Rebounded... But Are Now Rolling Over
Short-Term Impulses Rebounded... But Are Now Rolling Over
Short-Term Impulses Rebounded... But Are Now Rolling Over
Chart 12 (ROB)U.S. Treasuries Will Underperform Bunds & JGBs
U.S. Treasuries Will Underperform Bunds & JGBs
U.S. Treasuries Will Underperform Bunds & JGBs
Japanese yields will remain mired at or below zero over the next 6-12 months, as wage growth and core inflation remain too anemic for the BoJ to alter its 0% target on 10-year JGB yields. German yields have a bit more potential to rise if European growth begins to recover, but will lag any move higher in Treasury yields. That means that the Treasury-Bund and Treasury-JGB spreads will move higher over the next year. Negative German and Japanese yields may look completely unappetizing compared to +2% U.S. Treasury yields, but this handicap vanishes when all three yields are expressed in U.S. dollar terms. Hedging a 10-year German Bund or JGB into higher-yielding U.S. dollars creates yields that are 50-60bps higher than a 10-year U.S. Treasury. It is abundantly clear that German and Japanese bonds will outperform Treasuries over the next year if global growth recovers. Mathieu: Peter, your positive view on global growth means that the Fed will cut rates less than what is currently priced into the OIS curve. So why do you expect the dollar to weaken in the second half of 2019? Peter: What the Fed does affects interest rate differentials, but just as important is what other central banks do. The ECB is not going to raise rates over the next 12 months. However, if euro area growth surprises on the upside later this year, investors will begin to question the need for the ECB to keep policy rates in negative territory until mid-2024. The market’s expectation of where policy rates will be five years out tends to correlate well with today’s exchange rate. By that measure, there is scope for interest rate differentials to narrow against the U.S. dollar (Chart 13). Chart 13A (PETER)Interest Rate Expectations Against The U.S. Should Narrow (I)
Interest Rate Expectations Against The U.S. Should Narrow (I)
Interest Rate Expectations Against The U.S. Should Narrow (I)
Chart 13B (PETER)Interest Rate Expectations Against The U.S. Should Narrow (II)
Interest Rate Expectations Against The U.S. Should Narrow (II)
Interest Rate Expectations Against The U.S. Should Narrow (II)
Keep in mind that the U.S. dollar is a countercyclical currency, meaning that it moves in the opposite direction of global growth (Chart 14). This countercyclicality stems from the fact that the U.S. economy is more geared towards services than manufacturing compared with the rest of the world. Chart 14 (PETER)The Dollar Is A Countercyclical Currency
The Dollar Is A Countercyclical Currency
The Dollar Is A Countercyclical Currency
As such, when global growth accelerates, capital tends to flow from the U.S. to the rest of the world, translating into more demand for foreign currency and less demand for dollars. If global growth picks up in the remainder of the year, as I expect, the dollar will weaken. Mathieu: Arthur, as you are significantly more negative on growth than either Rob or Peter, how do you see the dollar and global yields evolving over the coming six to 12 months? Arthur: I am positive on the trade-weighted U.S. dollar for the following reasons: The U.S. dollar is a countercyclical currency – it exhibits a negative correlation with the global business cycle. Persistent weakness in the global economy emanating from China/EM is positive for the dollar because the U.S. economy is the major economic block least exposed to a China/EM slowdown. Meanwhile, the greenback is only loosely correlated with U.S. interest rates. Thereby, the argument that lower U.S. rates will drive the value of the U.S. currency much lower is overemphasized. The Federal Reserve will cut rates by more than what is currently priced into the market only in a scenario of a complete collapse in global growth. Yet this scenario would be dollar bullish. In this case, the dollar’s strong inverse relationship with global growth will outweigh its weak positive relationship with interest rates. Contrary to consensus views, the U.S. dollar is not very expensive. According to unit labor costs based on the real effective exchange rate – the best currency valuation measure – the greenback is only one standard deviation above its fair value. Often, financial markets tend to overshoot to 1.5 or 2 standard deviations below or above their historical mean before reversing their trend. One of the oft-cited headwinds facing the dollar is positioning, yet there is a major discrepancy between positioning in DM and EM currencies versus the U.S. dollar. In aggregate, investors – asset managers and leveraged funds – have neutral exposure to DM currencies, but they are very long liquid EM exchange rates such as the BRL, MXN, ZAR and RUB versus the greenback. The dollar strength will occur mostly versus EM and commodities currencies. In other words, the euro, other European currencies and the yen will outperform EM exchange rates. I have less conviction on global bond yields. While global growth will disappoint, yields have already fallen a lot and the U.S. economy is currently not weak enough to justify around 90 basis points of rate cuts over the next 12 months. Mathieu: Before we move on to investment recommendations, Anastasios, you have done a lot of interesting work on the outlook for U.S. profits. What is the message of your analysis? Chart 15 (ANASTASIOS)Gravitational Pull
Gravitational Pull
Gravitational Pull
Anastasios: While markets cheered the trade truce following the recent G-20 meeting, no tariff rollback was agreed. Since the tariff rate on $200bn of Chinese imports went up from 10% to 25% on May 10, odds are high that manufacturing will remain in the doldrums. This will likely continue to weigh on profits for the remainder of the year. Profit growth should weaken further in the coming six months. Periods of falling manufacturing PMIs result in larger negative earnings growth surprises as market forecasters rarely anticipate the full breadth and depth of slowdowns. Absent profit growth, equity markets lack the necessary ‘oxygen’ for a durable high-quality rally. Until global growth momentum turns, investors should fade rallies. Our four-factor SPX EPS growth model is flirting with the contraction zone. In addition, our corporate pricing power proxy and Goldman Sachs’ Current Activity Indicator both send a distress signal for SPX profits (Chart 15). Already, more than half of the S&P 500 GICS1 sectors’ profits are estimated to have contracted in Q2, and three sectors could see declining revenues on a year-over-year basis, according to I/B/E/S data. Q3 depicts an equally grim profit picture that will also spill over to Q4. Adding it all up, profits will underwhelm into year-end. Mathieu: Doug, you do not share Anastasios’s anxiety. What offsets do you foresee? Moreover, you are not concerned by the U.S. corporate balance sheets. Can you share why? Doug Peta: As it relates to earnings, we foresee offsets from a revival in the rest of the world. Increasingly accommodative global monetary policy and reviving Chinese growth will give global ex-U.S. economies a boost. That inflection may go largely unnoticed in U.S. GDP, but it will help the S&P 500, as U.S.-based multinationals’ earnings benefit from increased overseas demand and a weaker dollar. When it comes to corporate balance sheets, shifting some of the funding burden to debt from equity when interest rates are at generational lows is a no-brainer. Even so, non-financial corporates have not added all that much leverage (Chart 16). Low interest rates, wide profit margins and conservative capex have left them with ample free cash flow to service their obligations (Chart 17). Chart 16 (DOUG)Corporations Have Not Added Much Leverage ...
Corporations Have Not Added Much Leverage ...
Corporations Have Not Added Much Leverage ...
Chart 17 (DOUG)...Though They Have Ample Cash Flow To Service It
...Though They Have Ample Cash Flow To Service It
...Though They Have Ample Cash Flow To Service It
Every single viable corporate entity with an effective federal tax rate above 21% became a better credit when the top marginal rate was cut from 35% to 21%. Every such corporation now has more net income with which to service debt, and will have that income unless the tax code is revised. You can’t see it in EBITDA multiples, but it will show up in reduced defaults. Mathieu: The last, and most important question. What are each of your main investment recommendations to capitalize on the economic trends you anticipate over the coming 6-12 months? Let’s start with the pessimists: Arthur: First, the rally in global cyclicals and China plays since December has been premature and is at risk of unwinding as global growth and cyclical profits disappoint. Historical evidence suggests that global share prices have not led but have actually been coincident with the global manufacturing PMI (Chart 18). The recent divergence is unprecedented. Chart 18 (ARTHUR)Global Stocks Historically Did Not Lead PMIs
Global Stocks Historically Did Not Lead PMIs
Global Stocks Historically Did Not Lead PMIs
Second, EM risk assets and currencies remain vulnerable. EM and Chinese earnings per share are shrinking. The leading indicators signal that the rate of contraction will deepen, at least the end of this year (Chart 19). Asset allocators should continue underweighting EM versus DM equities. Finally, my strongest-conviction, market-neutral trade is to short EM or Chinese banks and go long U.S. banks. The latter are much healthier than EM/Chinese ones, as we discussed in our recent report.6 Anastasios: The U.S. Equity Strategy team is shifting away from a cyclical and toward a more defensive portfolio bent. Our highest conviction view is to overweight mega caps versus small caps. Small caps are saddled with debt and are suffering a margin squeeze. Moreover, approximately 600 constituents of the Russell 2000 have no forward profits. Only one S&P 500 company has negative forward EPS. Given that both the S&P and the Russell omit these figures from the forward P/E calculation, this is masking the small cap expensiveness. When adjusted for this discrepancy, small caps are trading at a hefty premium versus large caps (Chart 20). Chart 19 (ARTHUR)China And EM Profits Are Contracting
China And EM Profits Are Contracting
China And EM Profits Are Contracting
Chart 20 (ANASTASIOS)Continue To Avoid Small Caps
Continue To Avoid Small Caps
Continue To Avoid Small Caps
We have also upgraded the S&P managed health care and the S&P hypermarkets groups. If the economic slowdown persists into early 2020, both of these defensive subgroups will fare well. In mid-April, we lifted the S&P managed health care group to an above benchmark allocation and posited that the selloff in this group was overdone as the odds of “Medicare For All” becoming law were slim. Moreover, a tight labor market along with melting medical cost inflation would boost the industry’s margins and profits (Chart 21). This week, we upgraded the defensive S&P hypermarkets index to overweight arguing that the souring macro landscape coupled with a firming industry demand outlook will support relative share prices (Chart 22). Chart 21 (ANASTASIOS)Buy Hypermarkets
Buy Hypermarkets
Buy Hypermarkets
Chart 22 (ANASTASIOS)Stick With Managed Health Care
Stick With Managed Health Care
Stick With Managed Health Care
Dhaval: To be fair, I am not a pessimist. Provided the global bond yield stays well below 2.5 percent, the support to risk-asset valuations will prevent a major dislocation. But in a growth down-oscillation, the big game in town will be sector rotation into pro-defensive investment plays, especially into those defensives that have underperformed (Chart 23). Chart 23 (DHAVAL)Switch Out Of Growth-Sensitives Into Healthcare
Switch Out Of Growth-Sensitives Into Healthcare
Switch Out Of Growth-Sensitives Into Healthcare
On this basis: Overweight Healthcare versus Industrials. Overweight the Eurostoxx 50 versus the Shanghai Composite and the Nikkei 225. Overweight U.S. T-bonds versus German bunds. Overweight the JPY in a portfolio of G10 currencies. Mathieu: And now, the optimists: Doug: So What? is the overriding question that guides all of BCA’s research: What is the practical investment application of this macro observation? But Why Now? is a critical corollary for anyone allocating investment capital: Why is the imbalance you’ve observed about to become a problem? As Herbert Stein said, “If something cannot go on forever, it will stop.” Imbalances matter, but Dornbusch’s Law counsels patience in repositioning portfolios on their account: “Crises take longer to arrive than you can possibly imagine, but when they do come, they happen faster than you can possibly imagine.” Look at Chart 24, which shows a vast white sky (bull markets) with intermittent clusters of gray (recessions) and light red (bear markets) clouds. Market inflections are severe, but uncommon. When the default condition of an economy is to grow, and equity prices to rise, it is not enough for an investor to identify an imbalance, s/he also has to identify why it’s on the cusp of reversing. Right now, as it relates to the U.S., there aren’t meaningful imbalances in either markets or the real economy. Chart 24 (DOUG)Recessions And Bear Markets Travel Together
Recessions And Bear Markets Travel Together
Recessions And Bear Markets Travel Together
Even if we had perfect knowledge that a recession would arrive in 18 months, now would be way too early to sell. The S&P 500 has historically peaked an average of six months before the onset of a recession, and it has delivered juicy returns in the year preceding that peak (Table 1). Bull markets tend to sprint to the finish line (Chart 25). If this one is like its predecessors, an investor risks significant relative underperformance if s/he fails to participate in its go-go latter stages. Table 1 (DOUG)The S&P 500 Doesn’t Peak Until Six Months Before A Recession …
What Goes On Between Those Walls? BCA’s Diverging Views In The Open
What Goes On Between Those Walls? BCA’s Diverging Views In The Open
Chart 25
We are bullish on the outlook for the next six to twelve months, and recommend overweighting equities and spread product in balanced U.S. portfolios while significantly underweighting Treasuries. Peter: I agree with Doug. Equity bear markets seldom occur outside of recessions and recessions rarely occur when monetary policy is accommodative. Policy is currently easy, and will get even more stimulative if the Fed and several other central banks cut rates. Global equities are not super cheap, but they are not particularly expensive either. They currently trade at about 15-times forward earnings. Given the ultra-low level of global bond yields, this generates an equity risk premium (ERP) that is well above its historical average (Chart 26). One should favor stocks over bonds when the ERP is high. Chart 26A (PETER)Equity Risk Premia Remain Elevated (I)
Equity Risk Premia Remain Elevated (I)
Equity Risk Premia Remain Elevated (I)
Chart 26B (PETER)Equity Risk Premia Remain Elevated (II)
Equity Risk Premia Remain Elevated (II)
Equity Risk Premia Remain Elevated (II)
The ERP is especially elevated outside the United States. This is partly because non-U.S. stocks trade at a meager 13-times forward earnings, but it also reflects the fact that bond yields are lower overseas. Chart 27 (PETER)EM And Euro Area Equities Outperform When Global Growth Improves
EM And Euro Area Equities Outperform When Global Growth Improves
EM And Euro Area Equities Outperform When Global Growth Improves
As global growth accelerates, the dollar will weaken. Equity sectors and regions with a more cyclical bent will benefit (Chart 27). We expect to upgrade EM and European stocks later this summer. A softer dollar will also benefit gold. Bullion will get a further boost early next decade when inflation begins to accelerate. We went long gold on April 17, 2019 and continue to believe in this trade. Rob: For fixed income investors, the most obvious way to play a combination of monetary easing and recovering global growth is to overweight corporate debt versus government bonds (Chart 28). Within the U.S., corporate bond valuations look more attractive in high-yield over investment grade. Assuming a benign outlook for default risk in a reaccelerating U.S. economy, with the Fed easing, going for the carry in high-yield looks interesting. Emerging market credit should also do well if we see a bit of U.S. dollar weakness and additional stimulus measures in China. Chart 28 (ROB)Best Bond Bets: Overweight Global Corporates & Inflation-Linked Bonds
Best Bond Bets: Overweight Global Corporates & Inflation-Linked Bonds
Best Bond Bets: Overweight Global Corporates & Inflation-Linked Bonds
European corporates, however, may end up being the big winner if the ECB chooses to restart its Asset Purchase Program and ramps up its buying of European company debt. There are fewer restrictions for the ECB to buy corporates compared to the self-imposed limits on government bond purchases. The ECB would be entering a political minefield if it chose to buy more Italian debt and less German debt, but nobody would mind if the ECB helped finance European companies by buying their bonds. If one expects reflation to be successful, a below-benchmark stance on portfolio duration also makes sense given the current depressed level of government bond yields worldwide. Yields are more likely to grind upward than spike higher, and will be led first by increasing inflation expectations. Inflation-linked bonds should feature prominently in fixed income portfolios, especially in the U.S. where TIPS will outperform nominal yielding Treasuries. Mathieu: Thank you very much to all of you. Below is a comparative summary of the main arguments and investment recommendations of each camp. Summary Of Views And Recommendations
What Goes On Between Those Walls? BCA’s Diverging Views In The Open
What Goes On Between Those Walls? BCA’s Diverging Views In The Open
What Goes On Between Those Walls? BCA’s Diverging Views In The Open
What Goes On Between Those Walls? BCA’s Diverging Views In The Open
Anastasios Avgeriou U.S. Equity Strategist anastasios@bcaresearch.com Peter Berezin Chief Global Strategist peterb@bcaresearch.com Arthur Budaghyan Chief Emerging Markets Strategist arthurb@bcaresearch.com Dhaval Joshi Chief European Investment Strategist dhaval@bcaresearch.com Doug Peta Chief U.S. Investment Strategist dougp@bcaresearch.com Robert Robis Chief Fixed Income Strategist rrobis@bcaresearch.com Mathieu Savary The Bank Credit Analyst mathieu@bcaresearch.com Footnotes 1 To be fair to each individual involved, this is simplifying their views. Even within each camp, the negativity or positivity ranges on a spectrum, as you will be able to tell from the debate itself. 2 Please see BCA U.S. Equity Strategy Weekly Report, “Signal Vs. Noise,” dated December 17, 2018, available at uses.bcaresearch.com. 3 Please see BCA U.S. Equity Strategy Weekly Report, “A Recession Thought Experiment,” dated June 10, 2019, available at uses.bcaresearch.com. 4 Please see the European Investment Strategy Weekly Report “Risk: The Great Misunderstanding Of Finance,” October 25, 2018 available at eis.bcaresearch.com. 5 France is a good proxy for the euro area. 6 Please see Emerging Markets Strategy Weekly Report, “On Chinese Banks And Brazil,” available at ems.bcaresearch.com.
Dear Clients, In addition to this Weekly Report, you will also be getting a Special Report authored by some of our top strategists on global growth. The manufacturing recession that began in early 2018 has lasted longer than most expected. The risk is that this is an additional end-of-cycle indicator, with important ramifications for the U.S. dollar. The dollar tends to stage meaningful rallies in recessions. In this week’s publication, we highlight some of the key indicators we are watching for justification on maintaining a pro-cyclical stance, but the internal debate from the Special Report highlights how delicate the balance of forces for this stance are. A fortnight ago we suggested a few portfolio hedges, and recommend maintaining tight stops on all positions until September. Next week, we will be sending you a Special Report on gold, from our colleagues in the Commodity & Energy Strategy team. In the interim, I will be learning from our clients in Latin America about some of the forces currently shaping global FX markets. I will report back with my findings in a few weeks. Kind Regards, Chester Ntonifor Foreign Exchange Strategist Highlights There is very scant evidence that global growth is bottoming. That said, it is usually darkest before dawn. A few key indicators are beginning to flash amber, which we will continue to closely monitor. The deceleration phase this cycle has been as prolonged as others, warning that the rebound could also be V-shaped. The AUD/JPY cross will be a very useful barometer. Stay long a basket of petrocurrencies versus the euro and short USD/JPY. Feature One of the most cyclical developed-market indices is the Japanese Nikkei (Table I-1).1 Almost 60% of all sectors are concentrated in just three: consumer discretionary, information technology and industrials. Boasting a wide spectrum of global robotic, automotive and construction machinery giants, Japanese companies sit at the epicenter of the global manufacturing supply chain. As such, it is very telling when Japanese share prices – which track global bond yields very closely – appear to be making a tentative bottom (Chart I-1).
Chart I-
On the currency front, a lower greenback has also tended to be a very useful confirmation signal that we are entering a reflationary window. A slowing global economy on the back of deteriorating trade is positive for the greenback. As a reserve and counter-cyclical currency, the dollar has tended to rise during times of capital flight. On the other hand, a dovish Federal Reserve knocks down U.S. interest rate expectations relative to the rest of the world. This has historically been bearish for the dollar, and positive for global growth (Chart I-2). More importantly, even if the Fed does not proceed to cut rates as much as the market expects, it will be because global growth has bottomed, which will also favor non-U.S. rates. Chart I-1Japanese Share Prices Usually Bottom Before Bond Yields
Japanese Share Prices Usually Bottom Before Bond Yields
Japanese Share Prices Usually Bottom Before Bond Yields
Chart I-2A Dovish Fed Will Be Dollar Bearish
A Dovish Fed Will Be Dollar Bearish
A Dovish Fed Will Be Dollar Bearish
The commodity and export channel also helps explain why rising global growth is negative for the dollar. In theory, rising commodity prices (or rising terms of trade) allow for increased government spending in export-driven economies, making room for the resident central bank to tighten monetary policy. This is usually bullish for the currency. Rising terms of trade also further increases the fair value of the exchange rate. Balance-of-payments dynamics also tend to improve when exports are booming. Altogether, these forces combine to be powerful undercurrents for pro-cyclical currencies. Both political and domestic pressure for central banks to ease policy is the highest it has ever been. Chart I-3Both Economic And Political Pressure For Central Banks To Alter Policy
Both Economic And Political Pressure For Central Banks To Alter Policy
Both Economic And Political Pressure For Central Banks To Alter Policy
Both political and domestic pressure for central banks to ease policy is the highest it has ever been.2 This suggests that either they have already done so or the conditions warranting stimulus have hit climactic pressure. Going forward, such a synchronized move by global central banks is usually accompanied by a synchronized recovery, for the simple reason that central banks are usually behind the curve (Chart I-3). Finally, the starting point for long dollar positions is one of an overcrowded trade, along with U.S. Treasury bonds. The latest downdraft in global manufacturing has nudged U.S. net speculative long positions to a point where they typically experience exhaustion (Chart I-4). This suggests there may be a scarcity in fresh dollar bulls. 2018 was particularly favorable for the dollar, as a liquidity crunch (the Fed’s balance sheet runoff) underpinned a sizeable rally. The big surge in cryptocurrencies this year (and gold) could suggest that the liquidity environment is once again becoming favorable. Chart I-4Dollar Positioning Is Stretched
Dollar Positioning Is Stretched
Dollar Positioning Is Stretched
Chart I-5Carry Trades Are Usually Consistent With Higher Yields
Carry Trades Are Usually Consistent With Higher Yields
Carry Trades Are Usually Consistent With Higher Yields
An improving liquidity environment will be especially favorable for carry trades. High-beta currencies such as the RUB/USD, ZAR/USD and BRL/USD have stopped falling and are off their lows of the year. These currencies are usually good at sniffing out a change in the investment landscape. The message so far is that the drop in U.S. bond yields may have been sufficient to make these currencies attractive again (Chart I-5). Bottom Line: There is very scant evidence that global growth is bottoming. That said, it is usually darkest before dawn. A few key indicators are beginning to flash amber, which we will continue to monitor closely. A Few Growth Barometers A key difference from last year is that U.S. growth leadership is set to give way to the rest of the world. The U.S. ISM manufacturing Purchasing Manager’s Index (PMI) peaked last August and has been steadily rolling over relative to its trading partners. Historically, the relative growth differential between the U.S. and elsewhere has had a pretty good track record of dictating trends in the dollar. The message is that the manufacturing PMI should pick up from 47.6 currently to the 50 boom/bust level in the coming months. Meanwhile, there is some evidence that there are tentative signs of a bottom in global growth: Chart I-6Euro Area Might Be Close To A Bottom
Euro Area Might Be Close To A Bottom
Euro Area Might Be Close To A Bottom
Europe: The Swedish new orders to inventory ratio has a long and pretty accurate track record of calling bottoms in European growth, and the message is that the manufacturing PMI should pick up from 47.6 currently to the 50 boom/bust level in the coming months. Importantly, the recoveries have tended to be V-shaped pretty much throughout the past two decades. Any further decline in the PMI will pin it at levels consistent with the last European debt crisis (Chart I-6). Japan: Japan is closely impacted by the industrial cycle, especially demand from China. And while overall machinery orders remain weak, machine tool orders from China have bottomed. China: The Chinese credit impulse has bottomed. This suggests the contraction in imports, along with Korean and Taiwanese exports, is near its nadir (Chart I-7). The domestic bond market in China is becoming pretty good at signaling reflationary conditions for domestic demand (Chart I-8). Singapore exports this week were deeply negative, but this could be the bottom if all credit-injection so far in China starts flowing. Shipping indices are already recovering very strongly, and global machinery stocks are re-rating. Chart I-7A Modest Recovery For Exports
A Modest Recovery For Exports
A Modest Recovery For Exports
Chart I-8Chinese Imports Should Bounce
Chinese Imports Should Bounce
Chinese Imports Should Bounce
A pickup in Chinese growth should begin to benefit commodity currencies, especially the Australian dollar. A lot of the bad news already appears to be priced into the Aussie, which is down 14% from its 2018 peak and 37% from its 2011 peak. This suggests outright short AUD bets are susceptible to either upside surprises in global growth or simply forces of mean reversion. Importantly, the AUD/JPY cross is sitting at an important technical level. Ever since the financial crisis, the 72-74 cent zone has proven to be formidable resistance, with the cross failing to break below both during the euro area debt crisis in 2011-2012 and the China slowdown of 2015-2016. Speculators are now massively short the cross, suggesting that any upward move could be powerful and significant (Chart I-9). A rally in the Swedish krona will be another confirmation that global growth may have bottomed. A rally in the Swedish krona will be another confirmation that global growth may have bottomed. On a relative basis, the Swedish economy appears to have troughed relative to that of the U.S., making the USD/SEK an attractive way to play USD downside. From a technical perspective, USD/SEK failed to break decisively above 9.60, and is now trading below a major resistance at 9.40 (Chart I-10). Aggressive investors can slowly begin accumulating short positions, while being cognizant of the negative carry. Chart I-9AUD/JPY Near A Critical Zone
AUD/JPY Near A Critical Zone
AUD/JPY Near A Critical Zone
Chart I-10The Swedish Krona Is Attractive
The Swedish Krona Is Attractive
The Swedish Krona Is Attractive
Bottom Line: We are already long the SEK versus NZD, and the thesis remains intact from our June 7th recommendation. The AUD/JPY cross is very close to a bottom. Hold EUR/CAD For A Trade Chart I-11EUR/CAD Technicals: Limited Downside
EUR/CAD Technicals: Limited Downside
EUR/CAD Technicals: Limited Downside
The EUR/CAD has reached an important technical level, and what will follow is either a major breakdown or a powerful bounce (Chart I-11). With Canadian data firing on all cylinders and the euro area in the depths of a manufacturing recession, the cross has rightly responded to growth divergences. On the downside, the EUR/CAD is at the bottom of the upward trending channel that has existed since 2012, in the vicinity of 1.45-1.46. A bounce here will not meet initial upside resistance until the triple top, a nudge above 1.6. The biggest catalyst for this cross going forward will likely be interest rate differentials, since any improvement in euro area data will continue to reduce the scope by which the European Central Bank stays dovish relative to the Bank of Canada. European rates are further below equilibrium, and the ECB’s dovish shift will help lift the growth potential of the euro area. Meanwhile, the Canadian neutral rate will be heavily weighed down by the large stock of debt in the Canadian private sector, exacerbated by overvaluation in the housing market. Valuations and balance-of-payment dynamics also favor the euro versus the CAD on a long-term basis. Bottom Line: Hold the EUR/CAD for a trade with a stop at 1.45. Chart I-12Gold/Silver Ratio Near Speculative Extreme
Gold/Silver Ratio Near Speculative Extreme
Gold/Silver Ratio Near Speculative Extreme
Trade Idea: Buy Silver, Sell Gold The gold/silver ratio is reaching a speculative extreme. Usually, reflationary cycles benefit silver more than gold, with 100 usually the upper bound of the gold/silver ratio. We are very close to such a tipping point. Stay tuned (Chart I-12). Chester Ntonifor, Foreign Exchange Strategist chestern@bcaresearch.com Currencies U.S. Dollar Chart II-1USD Technicals 1
USD Technicals 1
USD Technicals 1
Chart II-2USD Technicals 2
USD Technicals 2
USD Technicals 2
Recent data in the U.S. have continued to soften: Headline PPI fell to 1.7% year-on-year in June. Core PPI was unchanged at 2.3% year-on-year in June. NY Empire State manufacturing index increased to 4.3 in July. Retail sales increased by 0.4% month-on-month in June. Import and export prices contracted by 0.9% and 2% year-on-year respectively in June. Building permits contracted by 6.1% month-on-month in June. Housing starts softened by 0.9% month-on-month. Philadelphia Fed manufacturing index rose to 21.8 in July from 0.3 in June. Continuing jobless claims fell to 1.686 million this week, while initial jobless claims increased to 216 thousand. DXY increased by 0.4% this week. On Tuesday, Fed Chair Powell gave a short speech in Paris, regarding the current developments in the U.S. economy, and some post-crisis structural shifts. While U.S. economy has been on the 11th consecutive year of expansion, Powell highlighted concerns towards softer growth this year, in the manufacturing sector in particular, weighed down by weaker consumer spending, sluggish business investment, and trade war uncertainties. Report Links: On Gold, Oil And Cryptocurrencies - June 28, 2019 Battle Of The Central Banks - June 21, 2019 EUR/USD And The Neutral Rate Of Interest - June 14, 2019 The Euro Chart II-3EUR Technicals 1
EUR Technicals 1
EUR Technicals 1
Chart II-4EUR Technicals 2
EUR Technicals 2
EUR Technicals 2
Recent data in the euro area have been weak: Industrial production contracted by 0.5% year-on-year in May. Trade balance widened to €20.2 billion in May. Headline and core inflation increased by 1.3% and 1.1% year-on-year respectively in June. EUR/USD fell by 0.36% this week. ZEW data continue to soften in July: The sentiment index in the euro area fell to -20.3, and the sentiment in Germany decreased to -24.5. Moreover, the European Commission’s summer forecast released last week cut the 2020 euro area GDP projection from 1.5% (spring forecast) to 1.4%, and lowered inflation to 1.3% for both this year and next year. Report Links: Battle Of The Central Banks - June 21, 2019 EUR/USD And The Neutral Rate Of Interest - June 14, 2019 Take Out Some Insurance - May 3, 2019 The Yen Chart II-5JPY Technicals 1
JPY Technicals 1
JPY Technicals 1
Chart II-6JPY Technicals 2
JPY Technicals 2
JPY Technicals 2
Recent data in Japan have been negative: Industrial production contracted by 2.1% year-on-year in May. Capacity utilization increased by 1.7% in May. Exports contracted by 6.7% year-on-year in June. Imports also fell by 5.2% year-on-year. Total trade balance increased to ¥589.5 billion. USD/JPY fell by 0.2% this week. The weak Q2 data worldwide, driven by a significant slowdown in the manufacturing sector have raised concerns for a possible near-term recession. This has been exacerbated by a trade war, U.S.-Iranian tensions and Brexit uncertainties. We continue to favor the yen as a safe-haven currency. Hold to the short USD/JPY and short XAU/JPY positions. Report Links: Portfolio Tweaks Into Thin Summer Trading - July 5, 2019 Battle Of The Central Banks - June 21, 2019 Short USD/JPY: Heads I Win, Tails I Don’t Lose Too Much - May 31, 2019 British Pound Chart II-7GBP Technicals 1
GBP Technicals 1
GBP Technicals 1
Chart II-8GBP Technicals 2
GBP Technicals 2
GBP Technicals 2
Recent data in the U.K. have been mixed: Rightmove house price index contracted by 0.2% year-on-year in July. On the labor market front, ILO unemployment rate was unchanged at 3.8% in May. Average earnings including bonus increased by 3.4% in May. Headline inflation was unchanged at 2% year-on-year in June. Core inflation increased to 1.8% year-on-year. Retail sales increased by 3.8% year-on-year in June. GBP/USD fell by 0.5% this week, now trading around 1.2486. The Brexit uncertainties still loom over the U.K. Boris Johnson and Jeremy Hunt are fighting to take over from Theresa May as the leader of the Conservative Party and the UK’s next Prime Minister. In addition, the Q2 credit conditions survey released this Thursday indicates that default rates on loans to corporates increased for small and large businesses in Q2. Meanwhile, these are expected to increase for businesses of all sizes in Q3. Report Links: Battle Of The Central Banks - June 21, 2019 A Contrarian View On The Australian Dollar - May 24, 2019 Take Out Some Insurance - May 3, 2019 Australian Dollar Chart II-9AUD Technicals 1
AUD Technicals 1
AUD Technicals 1
Chart II-10AUD Technicals 2
AUD Technicals 2
AUD Technicals 2
Recent data in Australia have been mixed: Westpac leading index fell by 0.08% month-on-month in June. On the labor market front, unemployment rate was unchanged at 5.2% in June. Participation rate was steady at 66%. 500 new jobs were created in June, including 21.1 thousand new full-time positions, and a loss of 20.6 thousand part-time positions. AUD/USD increased by 0.3% this week. The RBA minutes released this week reiterated that the central bank is ready to adjust interest rates if required, in order to support sustainable growth and achieve the inflation target overtime. The easing financial conditions and rising terms of trade all underpin the Aussie dollar in the long term. Report Links: A Contrarian View On The Australian Dollar - May 24, 2019 Beware Of Diminishing Marginal Returns- April 19, 2019 Not Out Of The Woods Yet - April 5, 2019 New Zealand Dollar Chart II-11NZD Technicals 1
NZD Technicals 1
NZD Technicals 1
Chart II-12NZD Technicals 2
NZD Technicals 2
NZD Technicals 2
Recent data in New Zealand have been mostly positive: House sales keep contracting by 3.8% year-on-year in June. Business manufacturing PMI increased to 51.3 in June. Headline inflation increased to 1.7% year-on-year in Q2. NZD/USD rose by 0.6% this week. Solid incoming data have lifted the New Zealand dollar for the past few weeks. However, the kiwi might lag the Aussie given the RBNZ is behind the RBA. The market is currently pricing in an 84% probability of a rate cut at the beginning of next month, but more cuts could be needed down the road. Hold to our long AUD/NZD and SEK/NZD positions. Report Links: Where To Next For The U.S. Dollar? - June 7, 2019 Not Out Of The Woods Yet - April 5, 2019 Balance Of Payments Across The G10 - February 15, 2019 Canadian Dollar Chart II-13CAD Technicals 1
CAD Technicals 1
CAD Technicals 1
Chart II-14CAD Technicals 2
CAD Technicals 2
CAD Technicals 2
Recent data in Canada have been mostly positive: Headline and core inflation both fell to 2% year-on-year in June. ADP employment shows an increase of 30.4 thousand new jobs in June. USD/CAD increased by 0.3% this week. Just last week, the BoC kept its interest rate on hold. With a more dovish Fed, this might narrow the interest rate differentials between the Fed and the BoC. We favor the loonie in the near-term based on the interest rate differentials, crude oil prices, and relatively more positive data incoming from Canada. Report Links: Portfolio Tweaks Into Thin Summer Trading - July 5, 2019 On Gold, Oil And Cryptocurrencies - June 28, 2019 Currency Complacency Amid A Global Dovish Shift - April 26, 2019 Swiss Franc Chart II-15CHF Technicals 1
CHF Technicals 1
CHF Technicals 1
Chart II-16CHF Technicals 2
CHF Technicals 2
CHF Technicals 2
Recent data in Switzerland have been mixed: Producer and import prices contracted by 1.4% year-on-year in June. Exports increased to CHF 20,328 million, while imports fell to CHF 17,131 million in June. This lifted the trade balance up to 3,251 million. USD/CHF increased by 0.35% this week. We continue to favor the Swiss franc in the long term. The rising market volatility has increased the appetite for the Swiss franc. Moreover, the Swiss franc is still cheap compared to its fair value. Report Links: What To Do About The Swiss Franc? - May 17, 2019 Beware Of Diminishing Marginal Returns - April 19, 2019 Balance Of Payments Across The G10 - February 15, 2019 Norwegian Krone Chart II-17NOK Technicals 1
NOK Technicals 1
NOK Technicals 1
Chart II-18NOK Technicals 2
NOK Technicals 2
NOK Technicals 2
Recent data in Norway have been negative: Trade balance narrowed to NOK 5.2 billion in June. USD/NOK increased by 0.8% this week. The recent energy price volatility, mostly due to the uncertainties of oil demand has knocked down the Norwegian krone. In the long term, we continue to believe that the OPEC 2.0’s production strategy of reducing global oil inventories, and U.S. – Iran tension will drive oil prices higher, thus bullish for petrocurrencies including the Norwegian krone. Report Links: Portfolio Tweaks Into Thin Summer Trading - July 5, 2019 On Gold, Oil And Cryptocurrencies - June 28, 2019 Currency Complacency Amid A Global Dovish Shift - April 26, 2019 Swedish Krona Chart II-19SEK Technicals 1
SEK Technicals 1
SEK Technicals 1
Chart II-20SEK Technicals 2
SEK Technicals 2
SEK Technicals 2
Recent data in Sweden have been positive. Industrial orders increased by 3.2% year-on-year in May. Budget balance came in at SEK -24.8 billion in June. USD/SEK fell by 0.28% this week. Recent data shows that the Swedish government debt is sliding below 35% of GDP. This is triggering political pressure on the government to expand fiscal support. More fiscal expenditure will allow for a more hawkish Risksbank, supporting the Swedish Krona. Report Links: Where To Next For The U.S. Dollar? - June 7, 2019 Balance Of Payments Across The G10 - February 15, 2019 A Simple Attractiveness Ranking For Currencies - February 8, 2019 Footnotes 1 The Global Industry Classification Standard (GICS) classification does not really apply for euro zone companies, so we used the Industry Classification Benchmark (ICB) for the euro area, the U.S., and Japan. The difference between GICS and ICB is that the new GICS standard (which took effect last year) splits Telecom into an additional Communication Services sector. ICB may also apply this later this year. 2 Carola Binder, “Political Pressure on Central Banks,” SSRN, December 16, 2018. Trades & Forecasts Forecast Summary Core Portfolio Tactical Trades Limit Orders Closed Trades
BCA takes pride in its independence. Strategists publish what they really believe, informed by their framework and analysis. Occasionally, this independence results in strongly diverging views and we currently are in one of those times. Within BCA, two views on the cyclical (six to 12-months) outlook for assets have emerged. One camp expects global growth to rebound in the second half of the year. Along with accelerating growth, they anticipate stock prices and risk assets to remain firm, cyclical equities to outperform defensive ones, safe-haven yields to move up, and the dollar to weaken. Meanwhile, another group foresees a further deterioration in activity or a delayed recovery, additional downside in stocks and risk assets, outperformance of defensives relative to cyclicals, low safe-haven yields, and a generally stronger dollar. For the sake of transparency, we have asked representatives of each camp to make their case in a round-table discussion, allowing our clients to decide for themselves which view is more appealing to them. Global Investment Strategy’s Peter Berezin, U.S. Investment Strategy’s Doug Peta, and Global Fixed Income Strategy’s Rob Robis take the mantle for the bullish camp. U.S. Equity Strategy’s Anastasios Avgeriou, Emerging Market Strategy’s Arthur Budaghyan, and European Investment Strategy’s Dhaval Joshi represent the bearish group.1 The round-table discussion below focuses on the cyclical outlook. For longer investment horizons, most strategists agree that a recession is highly likely by 2022. Moreover, on a long-term basis, valuations in both risk assets and safe-haven bonds are very demanding. In this context, a significant back up in yields could hammer risk assets. The BCA Round Table Mathieu Savary: Yield curve inversions have often been harbingers of recessions. Anastasios, you are amongst those investors troubled by this inversion. Do you not worry that this episode might prove similar to 1998, when the curve only inverted temporarily and did not foreshadow a recession? Moreover, how do you account for the highly variable time lags between the inversion of the yield curve and the occurrence of a recession? Anastasios Avgeriou: The yield curve inverts at or near the peak of the business cycle and it eventually forewarns of upcoming recessions. This past December, parts of the yield curve inverted and now, BCA’s U.S. Equity Strategy service is heeding the signal from this simple indicator, especially given that the SPX has subsequently made all-time highs as our research predicted.2 Chart 1 (ANASTASIOS)The 1998 Episode Revisited
The 1998 Episode Revisited
The 1998 Episode Revisited
The yield curve inversion forecasts a Fed rate cut, and it has never been wrong on that front. It served well investors that heeded the message in June of 1998 as the market soon thereafter fell 20% in a heartbeat. If investors got out at the 1998 peak near 1200 and forwent about 350 points of gains until the March 2000 SPX cycle peak, they still benefited if they held tight as the market ultimately troughed near 777 in October 2002 (Chart 1). With regard to timing the previous seven recessions using the yield curve, if we accept that mid-1998 is the starting point of the inversion, it took 33 months before the recession commenced. Last cycle, the recession began 24 months after the inversion. Consequently, December 2020 is the earliest possible onset of recession and September 2021, the latest. Our forecast calls for SPX EPS to fall 20% in 2021 to $140 with the multiple dropping between 13.5x and 16.5x for an SPX end-2020 target range of 1,890-2,310.3 In other words we are not willing to play a 100-200 point advance for a potential 1,000 point drawdown. The risk/reward tradeoff is to the downside, and we choose to sit this one out. Mathieu: Rob, you take a much more sanguine view of the current curve inversion. Why? Rob Robis: While the four most dangerous words in investing are “this time is different,” this time really does appear to be different. Never before have negative term premia on longer-term Treasury yields and a curve inversion coexisted (Chart 2). Longer-term Treasury yields have therefore been pushed down to extremely low levels by factors beyond just expectations of a lower fed funds rate. The negative Treasury term premium is distorting the economic message of the U.S. yield curve inversion. Chart 2 (ROB)Negative Term Premium Distorting The Economic Message Of An Inverted Yield Curve
Negative Term Premium Distorting The Economic Message Of An Inverted Yield Curve
Negative Term Premium Distorting The Economic Message Of An Inverted Yield Curve
Term premia are depressed everywhere, as seen in German, Japanese and other yields, reflecting the intense demand for safe assets like government bonds during a period of heightened uncertainty. Global bond markets may also be discounting a higher probability of the ECB restarting its Asset Purchase Program, as term premia typically fall sharply when central banks embark on quantitative easing. This has global spillovers. Prior to previous recessions, U.S. Treasury curve inversions occurred when the Fed was running an unequivocally tight monetary policy. That is not the case today. The real fed funds rate still is not above the Fed’s estimate of the neutral real rate, a.k.a. “r-star,” which was the necessary ingredient for all previous Treasury curve inversions since 1960 (Chart 3). Chart 3 (ROB)Fed Policy Is Not Tight Enough For Sustained Curve Inversion
Fed Policy Is Not Tight Enough For Sustained Curve Inversion
Fed Policy Is Not Tight Enough For Sustained Curve Inversion
Mathieu: The level of policy accommodation will most likely determine whether Anastasios or Rob is proven right. Peter, you have been steadfastly arguing that policy, in the U.S. at least, remains easy. Can you elaborate why? Peter Berezin: Remember that the neutral rate of interest is the rate that equalizes the level of aggregate demand with the economy’s supply-side potential. Loose fiscal policy and fading deleveraging headwinds are boosting demand in the United States. So is rising wage growth, especially at the bottom of the income distribution. Given that the U.S. does not currently suffer from any major imbalances, I believe that the economy can tolerate higher rates without significant ill-effects. In other words, monetary policy is currently quite easy. Of course, we cannot observe the neutral rate directly. Like a black hole, one can only detect it based on the effect that it has on its surroundings. Housing is by far the most interest rate-sensitive sector of the economy. If history is any guide, the recent decline in mortgage rates will boost housing activity in the remainder of the year (Chart 4). If that relationship breaks down, as it did during the Great Recession, it would suggest that the neutral rate is quite low. Chart 4 (PETER)Declining Mortgage Rates Bode Well For Housing
Declining Mortgage Rates Bode Well For Housing
Declining Mortgage Rates Bode Well For Housing
Given that mortgage underwriting standards have been quite strong and the homeowner vacancy is presently very low, our guess is that housing will hold up well. We should know better in the next few months. Mathieu: Dhaval, you do not agree. Why do you think global rates are not accommodative? Dhaval Joshi: Actually, I think that global rates are accommodative, but that the global bond yield can rise by just 70 bps before conditions become perilously un-accommodative. Here’s where I disagree with Peter: for me, the danger doesn’t come from economics, it comes from the mathematics of ultra-low bond yields. The unprecedented and experimental panacea of our era has been ‘universal QE’ – which has led to ultra-low bond yields everywhere. But what is not understood is that when bond yields reach and remain close to their lower bound, weird things happen to the financial markets.
Chart 5
I refer you to other reports for the details, but in a nutshell, the proximity of the lower bound to yields increases the risk of owning supposedly ‘safe’ bonds to the risk of owning so-called ‘risk-assets’. The result is that the valuation of risk-assets rises exponentially (Chart 5). Because when the riskiness of the asset-classes converges, investors price risk-assets to deliver the same ultra-low nominal return as bonds.4 Comparisons with previous economic cycles miss the current danger. The post-2000 policy easing distorted the global economy by engineering a credit boom – so the subsequent danger emanated from the most credit-sensitive sectors in the economy such as mortgage lending. In contrast, the post-2008 ‘universal QE’ has severely distorted the valuation relationship between bonds and global risk-assets – so this is where the current danger lies. Higher bond yields can suddenly undermine the valuation support of global risk-assets whose $400 trillion worth dwarfs the global economy by five to one. Where is this tipping point? It is when the global 10-year yield – defined as the average of the U.S., euro area,5 and China – approaches 2.5%. Through the past five years, the inability of this yield to remain above 2.5% confirms the hyper-sensitivity of financial conditions to this tipping point (Chart 6). Right now, I agree that bond yields are accommodative. But the scope for yields to move higher is quite limited. Chart 6 (DHAVAL)Since 2015, the Global Long Bond Yield Has Struggled To Surpass 2.5 Percent
Since 2015, the Global Long Bond Yield Has Struggled To Surpass 2.5 Percent
Since 2015, the Global Long Bond Yield Has Struggled To Surpass 2.5 Percent
Mathieu: Monetary policy is important to the outlook, but so is the global manufacturing cycle. The global growth slowdown has been concentrated in the manufacturing sector, tradeable goods in particular. Across advanced economies, the service and consumer sectors have been surprisingly resilient, but this will not last if the industrial sector decelerates further. Arthur, you still do not anticipate any major improvement in global trade and industrial production. Can you elaborate why? Chart 7 (ARTHUR)Global Trade Is Down Due To China Not U.S.
Global Trade Is Down Due To China Not U.S.
Global Trade Is Down Due To China Not U.S.
Arthur Budaghyan: To properly assess the economic outlook, one needs to understand what has caused the ongoing global trade/manufacturing downturn. One thing we know for certain: It originated in China, not the U.S. Chart 7 illustrates that Korean, Japanese, Taiwanese and Singaporean exports to China have been shrinking at an annual rate of 10%, while their shipments to the U.S. have been growing. China’s aggregate imports have also been contracting. This entails that from the perspective of the rest of the world, China has been and remains in recession. U.S. manufacturing is the least exposed to China, which is the main reason why it has been the last shoe to drop. Hence, the U.S. has lagged in this downturn, and one should not be looking to the U.S. for clues about a potential global recovery. We need to gauge what will turn Chinese demand around. In this regard, the rising credit and fiscal spending impulse is positive, but it has so far failed to kick start a recovery (Chart 8). The key reason has been a declining marginal propensity to spend among households and companies. Notably, the marginal propensity to spend of mainland companies leads industrial metals prices by a few months, and it currently continues to point south (Chart 8, bottom panel). The lack of willingness among Chinese consumers and enterprises to spend is due to several factors: (1) the U.S.-China confrontation; (2) high levels of indebtedness among both enterprises and households (Chart 9); (3) ongoing regulatory scrutiny over banks and shadow banking as well as local government debt; and (4) a lack of outright government subsidies for purchases of autos and housing. Chart 8 (ARTHUR)Stimulus Versus Marginal Propensity To Spend
Stimulus Versus Marginal Propensity To Spend
Stimulus Versus Marginal Propensity To Spend
Chart 9 (ARTHUR)Chinese Households Are More Leveraged Than U.S. Ones
Chinese Households Are Leveraged Than U.S. Ones
Chinese Households Are Leveraged Than U.S. Ones
On the whole, the falling marginal propensity to spend will all but ensure that any recovery in mainland household and corporate spending is delayed. Mathieu: Meanwhile, Peter, you have a much more optimistic stance. Why do you differ so profoundly with Arthur’s view? Peter: China’s deleveraging campaign began more than a year before global manufacturing peaked. I have no doubt that slower Chinese credit growth weighed on global capex, but we should not lose sight of the fact there are natural ebbs and flows at work. Most manufactured goods retain some value for a while after they are purchased. If spending on, say, consumer durable goods or business equipment rises to a high level for an extended period, a glut will form, requiring a period of lower production. Chart 10 (PETER)The Global Manufacturing Cycle Has Likely Reached A Bottom
The Global Manufacturing Cycle Has Likely Reached A Bottom
The Global Manufacturing Cycle Has Likely Reached A Bottom
These demand cycles typically last about three years; roughly 18 months on the way up, 18 months on the way down (Chart 10). The last downleg in the global manufacturing cycle began in early 2018, so if history is any guide, we are nearing a trough. The fact that U.S. manufacturing output rose in both May and June, followed by this week’s sharp rebound in the July Philly Fed Manufacturing survey, supports this view. Of course, extraneous forces could complicate matters. If trade tensions ratchet higher, this would weaken my bullish thesis. Nevertheless, with China stimulating its economy again, it would probably take a severe trade war to push the global economy into recession. Mathieu: Dhaval, you are not as negative as Arthur, but nonetheless expect a slowdown in the second half of the year. What is your rationale? Dhaval: To be clear, I am not forecasting a recession or major downturn – unless, as per my previous answer, the global 10-year bond yield approaches 2.5% and triggers a severe dislocation in global risk-assets. In fact, many people get the relationship between recession and financial market dislocation back-to-front: they think that the recession causes the financial market dislocation when, in most cases, the financial market dislocation causes the recession! Nevertheless, I do believe that European and global growth is entering a regular down-oscillation based on the following compelling evidence: From a low last summer, quarter-on-quarter GDP growth rates in the developed economies have already rebounded to the upper end of multi-year ranges. Short-term credit impulses in Europe, the U.S., and China are entering down-oscillations (Chart 11). The best current activity indicators, specifically the ZEW economic sentiment indicators, have rolled over. The outperformance of industrials – the equity sector most exposed to global growth – has also rolled over. Why expect a down-oscillation? Because it is the rate of decline in the bond yield that drove the rebound in growth after its low last summer. Furthermore, it is impossible for the rate of decline in the bond yield to keep increasing, or even stay where it is. Counterintuitively, if bond yields decline, but at a reduced pace, the effect is to slow economic growth. Mathieu: A positive and a negative view of the world logically result in bifurcated outlooks for interest rates and the dollar. Rob, how do you see U.S., German, and Japanese yields evolving over the coming 12 months? Rob: If global growth rebounds, U.S. Treasury yields will have far more upside than Bund or JGB yields. Inflation expectations should recover faster in the U.S., with the Fed taking inflationary risks by cutting rates with a 3.7% unemployment rate and core CPI inflation at 2.1%. The Fed is also likely to disappoint by delivering fewer rate cuts than are currently discounted by markets (90bps over the next 12 months). Treasury yields can therefore increase more than German and Japanese yields, with the ECB and BoJ more likely to deliver the modest rate cuts currently discounted in their yield curves (Chart 12). Chart 11 (DHAVAL)Short-Term Impulses Rebounded... But Are Now Rolling Over
Short-Term Impulses Rebounded... But Are Now Rolling Over
Short-Term Impulses Rebounded... But Are Now Rolling Over
Chart 12 (ROB)U.S. Treasuries Will Underperform Bunds & JGBs
U.S. Treasuries Will Underperform Bunds & JGBs
U.S. Treasuries Will Underperform Bunds & JGBs
Japanese yields will remain mired at or below zero over the next 6-12 months, as wage growth and core inflation remain too anemic for the BoJ to alter its 0% target on 10-year JGB yields. German yields have a bit more potential to rise if European growth begins to recover, but will lag any move higher in Treasury yields. That means that the Treasury-Bund and Treasury-JGB spreads will move higher over the next year. Negative German and Japanese yields may look completely unappetizing compared to +2% U.S. Treasury yields, but this handicap vanishes when all three yields are expressed in U.S. dollar terms. Hedging a 10-year German Bund or JGB into higher-yielding U.S. dollars creates yields that are 50-60bps higher than a 10-year U.S. Treasury. It is abundantly clear that German and Japanese bonds will outperform Treasuries over the next year if global growth recovers. Mathieu: Peter, your positive view on global growth means that the Fed will cut rates less than what is currently priced into the OIS curve. So why do you expect the dollar to weaken in the second half of 2019? Peter: What the Fed does affects interest rate differentials, but just as important is what other central banks do. The ECB is not going to raise rates over the next 12 months. However, if euro area growth surprises on the upside later this year, investors will begin to question the need for the ECB to keep policy rates in negative territory until mid-2024. The market’s expectation of where policy rates will be five years out tends to correlate well with today’s exchange rate. By that measure, there is scope for interest rate differentials to narrow against the U.S. dollar (Chart 13). Chart 13A (PETER)Interest Rate Expectations Against The U.S. Should Narrow (I)
Interest Rate Expectations Against The U.S. Should Narrow (I)
Interest Rate Expectations Against The U.S. Should Narrow (I)
Chart 13B (PETER)Interest Rate Expectations Against The U.S. Should Narrow (II)
Interest Rate Expectations Against The U.S. Should Narrow (II)
Interest Rate Expectations Against The U.S. Should Narrow (II)
Keep in mind that the U.S. dollar is a countercyclical currency, meaning that it moves in the opposite direction of global growth (Chart 14). This countercyclicality stems from the fact that the U.S. economy is more geared towards services than manufacturing compared with the rest of the world. Chart 14 (PETER)The Dollar Is A Countercyclical Currency
The Dollar Is A Countercyclical Currency
The Dollar Is A Countercyclical Currency
As such, when global growth accelerates, capital tends to flow from the U.S. to the rest of the world, translating into more demand for foreign currency and less demand for dollars. If global growth picks up in the remainder of the year, as I expect, the dollar will weaken. Mathieu: Arthur, as you are significantly more negative on growth than either Rob or Peter, how do you see the dollar and global yields evolving over the coming six to 12 months? Arthur: I am positive on the trade-weighted U.S. dollar for the following reasons: The U.S. dollar is a countercyclical currency – it exhibits a negative correlation with the global business cycle. Persistent weakness in the global economy emanating from China/EM is positive for the dollar because the U.S. economy is the major economic block least exposed to a China/EM slowdown. Meanwhile, the greenback is only loosely correlated with U.S. interest rates. Thereby, the argument that lower U.S. rates will drive the value of the U.S. currency much lower is overemphasized. The Federal Reserve will cut rates by more than what is currently priced into the market only in a scenario of a complete collapse in global growth. Yet this scenario would be dollar bullish. In this case, the dollar’s strong inverse relationship with global growth will outweigh its weak positive relationship with interest rates. Contrary to consensus views, the U.S. dollar is not very expensive. According to unit labor costs based on the real effective exchange rate – the best currency valuation measure – the greenback is only one standard deviation above its fair value. Often, financial markets tend to overshoot to 1.5 or 2 standard deviations below or above their historical mean before reversing their trend. One of the oft-cited headwinds facing the dollar is positioning, yet there is a major discrepancy between positioning in DM and EM currencies versus the U.S. dollar. In aggregate, investors – asset managers and leveraged funds – have neutral exposure to DM currencies, but they are very long liquid EM exchange rates such as the BRL, MXN, ZAR and RUB versus the greenback. The dollar strength will occur mostly versus EM and commodities currencies. In other words, the euro, other European currencies and the yen will outperform EM exchange rates. I have less conviction on global bond yields. While global growth will disappoint, yields have already fallen a lot and the U.S. economy is currently not weak enough to justify around 90 basis points of rate cuts over the next 12 months. Mathieu: Before we move on to investment recommendations, Anastasios, you have done a lot of interesting work on the outlook for U.S. profits. What is the message of your analysis? Chart 15 (ANASTASIOS)Gravitational Pull
Gravitational Pull
Gravitational Pull
Anastasios: While markets cheered the trade truce following the recent G-20 meeting, no tariff rollback was agreed. Since the tariff rate on $200bn of Chinese imports went up from 10% to 25% on May 10, odds are high that manufacturing will remain in the doldrums. This will likely continue to weigh on profits for the remainder of the year. Profit growth should weaken further in the coming six months. Periods of falling manufacturing PMIs result in larger negative earnings growth surprises as market forecasters rarely anticipate the full breadth and depth of slowdowns. Absent profit growth, equity markets lack the necessary ‘oxygen’ for a durable high-quality rally. Until global growth momentum turns, investors should fade rallies. Our four-factor SPX EPS growth model is flirting with the contraction zone. In addition, our corporate pricing power proxy and Goldman Sachs’ Current Activity Indicator both send a distress signal for SPX profits (Chart 15). Already, more than half of the S&P 500 GICS1 sectors’ profits are estimated to have contracted in Q2, and three sectors could see declining revenues on a year-over-year basis, according to I/B/E/S data. Q3 depicts an equally grim profit picture that will also spill over to Q4. Adding it all up, profits will underwhelm into year-end. Mathieu: Doug, you do not share Anastasios’s anxiety. What offsets do you foresee? Moreover, you are not concerned by the U.S. corporate balance sheets. Can you share why? Doug Peta: As it relates to earnings, we foresee offsets from a revival in the rest of the world. Increasingly accommodative global monetary policy and reviving Chinese growth will give global ex-U.S. economies a boost. That inflection may go largely unnoticed in U.S. GDP, but it will help the S&P 500, as U.S.-based multinationals’ earnings benefit from increased overseas demand and a weaker dollar. When it comes to corporate balance sheets, shifting some of the funding burden to debt from equity when interest rates are at generational lows is a no-brainer. Even so, non-financial corporates have not added all that much leverage (Chart 16). Low interest rates, wide profit margins and conservative capex have left them with ample free cash flow to service their obligations (Chart 17). Chart 16 (DOUG)Corporations Have Not Added Much Leverage ...
Corporations Have Not Added Much Leverage ...
Corporations Have Not Added Much Leverage ...
Chart 17 (DOUG)...Though They Have Ample Cash Flow To Service It
...Though They Have Ample Cash Flow To Service It
...Though They Have Ample Cash Flow To Service It
Every single viable corporate entity with an effective federal tax rate above 21% became a better credit when the top marginal rate was cut from 35% to 21%. Every such corporation now has more net income with which to service debt, and will have that income unless the tax code is revised. You can’t see it in EBITDA multiples, but it will show up in reduced defaults. Mathieu: The last, and most important question. What are each of your main investment recommendations to capitalize on the economic trends you anticipate over the coming 6-12 months? Let’s start with the pessimists: Arthur: First, the rally in global cyclicals and China plays since December has been premature and is at risk of unwinding as global growth and cyclical profits disappoint. Historical evidence suggests that global share prices have not led but have actually been coincident with the global manufacturing PMI (Chart 18). The recent divergence is unprecedented. Chart 18 (ARTHUR)Global Stocks Historically Did Not Lead PMIs
Global Stocks Historically Did Not Lead PMIs
Global Stocks Historically Did Not Lead PMIs
Second, EM risk assets and currencies remain vulnerable. EM and Chinese earnings per share are shrinking. The leading indicators signal that the rate of contraction will deepen, at least the end of this year (Chart 19). Asset allocators should continue underweighting EM versus DM equities. Finally, my strongest-conviction, market-neutral trade is to short EM or Chinese banks and go long U.S. banks. The latter are much healthier than EM/Chinese ones, as we discussed in our recent report.6 Anastasios: The U.S. Equity Strategy team is shifting away from a cyclical and toward a more defensive portfolio bent. Our highest conviction view is to overweight mega caps versus small caps. Small caps are saddled with debt and are suffering a margin squeeze. Moreover, approximately 600 constituents of the Russell 2000 have no forward profits. Only one S&P 500 company has negative forward EPS. Given that both the S&P and the Russell omit these figures from the forward P/E calculation, this is masking the small cap expensiveness. When adjusted for this discrepancy, small caps are trading at a hefty premium versus large caps (Chart 20). Chart 19 (ARTHUR)China And EM Profits Are Contracting
China And EM Profits Are Contracting
China And EM Profits Are Contracting
Chart 20 (ANASTASIOS)Continue To Avoid Small Caps
Continue To Avoid Small Caps
Continue To Avoid Small Caps
We have also upgraded the S&P managed health care and the S&P hypermarkets groups. If the economic slowdown persists into early 2020, both of these defensive subgroups will fare well. In mid-April, we lifted the S&P managed health care group to an above benchmark allocation and posited that the selloff in this group was overdone as the odds of “Medicare For All” becoming law were slim. Moreover, a tight labor market along with melting medical cost inflation would boost the industry’s margins and profits (Chart 21). This week, we upgraded the defensive S&P hypermarkets index to overweight arguing that the souring macro landscape coupled with a firming industry demand outlook will support relative share prices (Chart 22). Chart 21 (ANASTASIOS)Buy Hypermarkets
Buy Hypermarkets
Buy Hypermarkets
Chart 22 (ANASTASIOS)Stick With Managed Health Care
Stick With Managed Health Care
Stick With Managed Health Care
Dhaval: To be fair, I am not a pessimist. Provided the global bond yield stays well below 2.5 percent, the support to risk-asset valuations will prevent a major dislocation. But in a growth down-oscillation, the big game in town will be sector rotation into pro-defensive investment plays, especially into those defensives that have underperformed (Chart 23). Chart 23 (DHAVAL)Switch Out Of Growth-Sensitives Into Healthcare
Switch Out Of Growth-Sensitives Into Healthcare
Switch Out Of Growth-Sensitives Into Healthcare
On this basis: Overweight Healthcare versus Industrials. Overweight the Eurostoxx 50 versus the Shanghai Composite and the Nikkei 225. Overweight U.S. T-bonds versus German bunds. Overweight the JPY in a portfolio of G10 currencies. Mathieu: And now, the optimists: Doug: So What? is the overriding question that guides all of BCA’s research: What is the practical investment application of this macro observation? But Why Now? is a critical corollary for anyone allocating investment capital: Why is the imbalance you’ve observed about to become a problem? As Herbert Stein said, “If something cannot go on forever, it will stop.” Imbalances matter, but Dornbusch’s Law counsels patience in repositioning portfolios on their account: “Crises take longer to arrive than you can possibly imagine, but when they do come, they happen faster than you can possibly imagine.” Look at Chart 24, which shows a vast white sky (bull markets) with intermittent clusters of gray (recessions) and light red (bear markets) clouds. Market inflections are severe, but uncommon. When the default condition of an economy is to grow, and equity prices to rise, it is not enough for an investor to identify an imbalance, s/he also has to identify why it’s on the cusp of reversing. Right now, as it relates to the U.S., there aren’t meaningful imbalances in either markets or the real economy. Chart 24 (DOUG)Recessions And Bear Markets Travel Together
Recessions And Bear Markets Travel Together
Recessions And Bear Markets Travel Together
Even if we had perfect knowledge that a recession would arrive in 18 months, now would be way too early to sell. The S&P 500 has historically peaked an average of six months before the onset of a recession, and it has delivered juicy returns in the year preceding that peak (Table 1). Bull markets tend to sprint to the finish line (Chart 25). If this one is like its predecessors, an investor risks significant relative underperformance if s/he fails to participate in its go-go latter stages. Table 1 (DOUG)The S&P 500 Doesn’t Peak Until Six Months Before A Recession …
What Goes On Between Those Walls? BCA’s Diverging Views In The Open
What Goes On Between Those Walls? BCA’s Diverging Views In The Open
Chart 25
We are bullish on the outlook for the next six to twelve months, and recommend overweighting equities and spread product in balanced U.S. portfolios while significantly underweighting Treasuries. Peter: I agree with Doug. Equity bear markets seldom occur outside of recessions and recessions rarely occur when monetary policy is accommodative. Policy is currently easy, and will get even more stimulative if the Fed and several other central banks cut rates. Global equities are not super cheap, but they are not particularly expensive either. They currently trade at about 15-times forward earnings. Given the ultra-low level of global bond yields, this generates an equity risk premium (ERP) that is well above its historical average (Chart 26). One should favor stocks over bonds when the ERP is high. Chart 26A (PETER)Equity Risk Premia Remain Elevated (I)
Equity Risk Premia Remain Elevated (I)
Equity Risk Premia Remain Elevated (I)
Chart 26B (PETER)Equity Risk Premia Remain Elevated (II)
Equity Risk Premia Remain Elevated (II)
Equity Risk Premia Remain Elevated (II)
The ERP is especially elevated outside the United States. This is partly because non-U.S. stocks trade at a meager 13-times forward earnings, but it also reflects the fact that bond yields are lower overseas. Chart 27 (PETER)EM And Euro Area Equities Outperform When Global Growth Improves
EM And Euro Area Equities Outperform When Global Growth Improves
EM And Euro Area Equities Outperform When Global Growth Improves
As global growth accelerates, the dollar will weaken. Equity sectors and regions with a more cyclical bent will benefit (Chart 27). We expect to upgrade EM and European stocks later this summer. A softer dollar will also benefit gold. Bullion will get a further boost early next decade when inflation begins to accelerate. We went long gold on April 17, 2019 and continue to believe in this trade. Rob: For fixed income investors, the most obvious way to play a combination of monetary easing and recovering global growth is to overweight corporate debt versus government bonds (Chart 28). Within the U.S., corporate bond valuations look more attractive in high-yield over investment grade. Assuming a benign outlook for default risk in a reaccelerating U.S. economy, with the Fed easing, going for the carry in high-yield looks interesting. Emerging market credit should also do well if we see a bit of U.S. dollar weakness and additional stimulus measures in China. Chart 28 (ROB)Best Bond Bets: Overweight Global Corporates & Inflation-Linked Bonds
Best Bond Bets: Overweight Global Corporates & Inflation-Linked Bonds
Best Bond Bets: Overweight Global Corporates & Inflation-Linked Bonds
European corporates, however, may end up being the big winner if the ECB chooses to restart its Asset Purchase Program and ramps up its buying of European company debt. There are fewer restrictions for the ECB to buy corporates compared to the self-imposed limits on government bond purchases. The ECB would be entering a political minefield if it chose to buy more Italian debt and less German debt, but nobody would mind if the ECB helped finance European companies by buying their bonds. If one expects reflation to be successful, a below-benchmark stance on portfolio duration also makes sense given the current depressed level of government bond yields worldwide. Yields are more likely to grind upward than spike higher, and will be led first by increasing inflation expectations. Inflation-linked bonds should feature prominently in fixed income portfolios, especially in the U.S. where TIPS will outperform nominal yielding Treasuries. Mathieu: Thank you very much to all of you. Below is a comparative summary of the main arguments and investment recommendations of each camp. Summary Of Views And Recommendations
What Goes On Between Those Walls? BCA’s Diverging Views In The Open
What Goes On Between Those Walls? BCA’s Diverging Views In The Open
What Goes On Between Those Walls? BCA’s Diverging Views In The Open
What Goes On Between Those Walls? BCA’s Diverging Views In The Open
Anastasios Avgeriou U.S. Equity Strategist anastasios@bcaresearch.com Peter Berezin Chief Global Strategist peterb@bcaresearch.com Arthur Budaghyan Chief Emerging Markets Strategist arthurb@bcaresearch.com Dhaval Joshi Chief European Investment Strategist dhaval@bcaresearch.com Doug Peta Chief U.S. Investment Strategist dougp@bcaresearch.com Robert Robis Chief Fixed Income Strategist rrobis@bcaresearch.com Mathieu Savary The Bank Credit Analyst mathieu@bcaresearch.com Footnotes 1 To be fair to each individual involved, this is simplifying their views. Even within each camp, the negativity or positivity ranges on a spectrum, as you will be able to tell from the debate itself. 2 Please see BCA U.S. Equity Strategy Weekly Report, “Signal Vs. Noise,” dated December 17, 2018, available at uses.bcaresearch.com. 3 Please see BCA U.S. Equity Strategy Weekly Report, “A Recession Thought Experiment,” dated June 10, 2019, available at uses.bcaresearch.com. 4 Please see the European Investment Strategy Weekly Report “Risk: The Great Misunderstanding Of Finance,” October 25, 2018 available at eis.bcaresearch.com. 5 France is a good proxy for the euro area. 6 Please see Emerging Markets Strategy Weekly Report, “On Chinese Banks And Brazil,” available at ems.bcaresearch.com.
Add Shiny Metal Exposure
Add Shiny Metal Exposure
One way to benefit from the global growth soft-patch is to go long global gold miners/short S&P oil & gas E&P stocks on a tactical three-to-six month basis. Since our Monday inception three days ago, this pair trade is already up 9%. The relative moves in the underlying commodities that serve as pricing power proxies are the key drivers of this share price ratio (top panel). Given the massive currency debasement potential that has gripped Central Banks the world over, such a flush liquidity backdrop will boost the allure of the shiny metal more so than crude oil. Meanwhile, global manufacturing PMIs are foreshadowing recession and our diffusion index has plummeted to the lowest level since 2011 (diffusion shown inverted, middle panel). In the U.S. specifically there is a growth-to-liquidity handoff and the ISM manufacturing survey’s new order versus prices paid subcomponents confirms that global gold miners have the upper hand compared with E&P equities (bottom panel). Bottom Line: We initiated a tactical long global gold miners/short S&P oil & gas E&P pair trade on a three-to-six month time horizon with a stop at the -10% mark. The ticker symbols for the stocks in these indexes are: GDX:US and BLBG – S5OILP – COP, EOG, APC, PXD, CXO, FANG, HES, DVN, MRO, NBL, COG, APA, XEC, respectively. Please refer to this Monday’s Weekly Report for additional details.
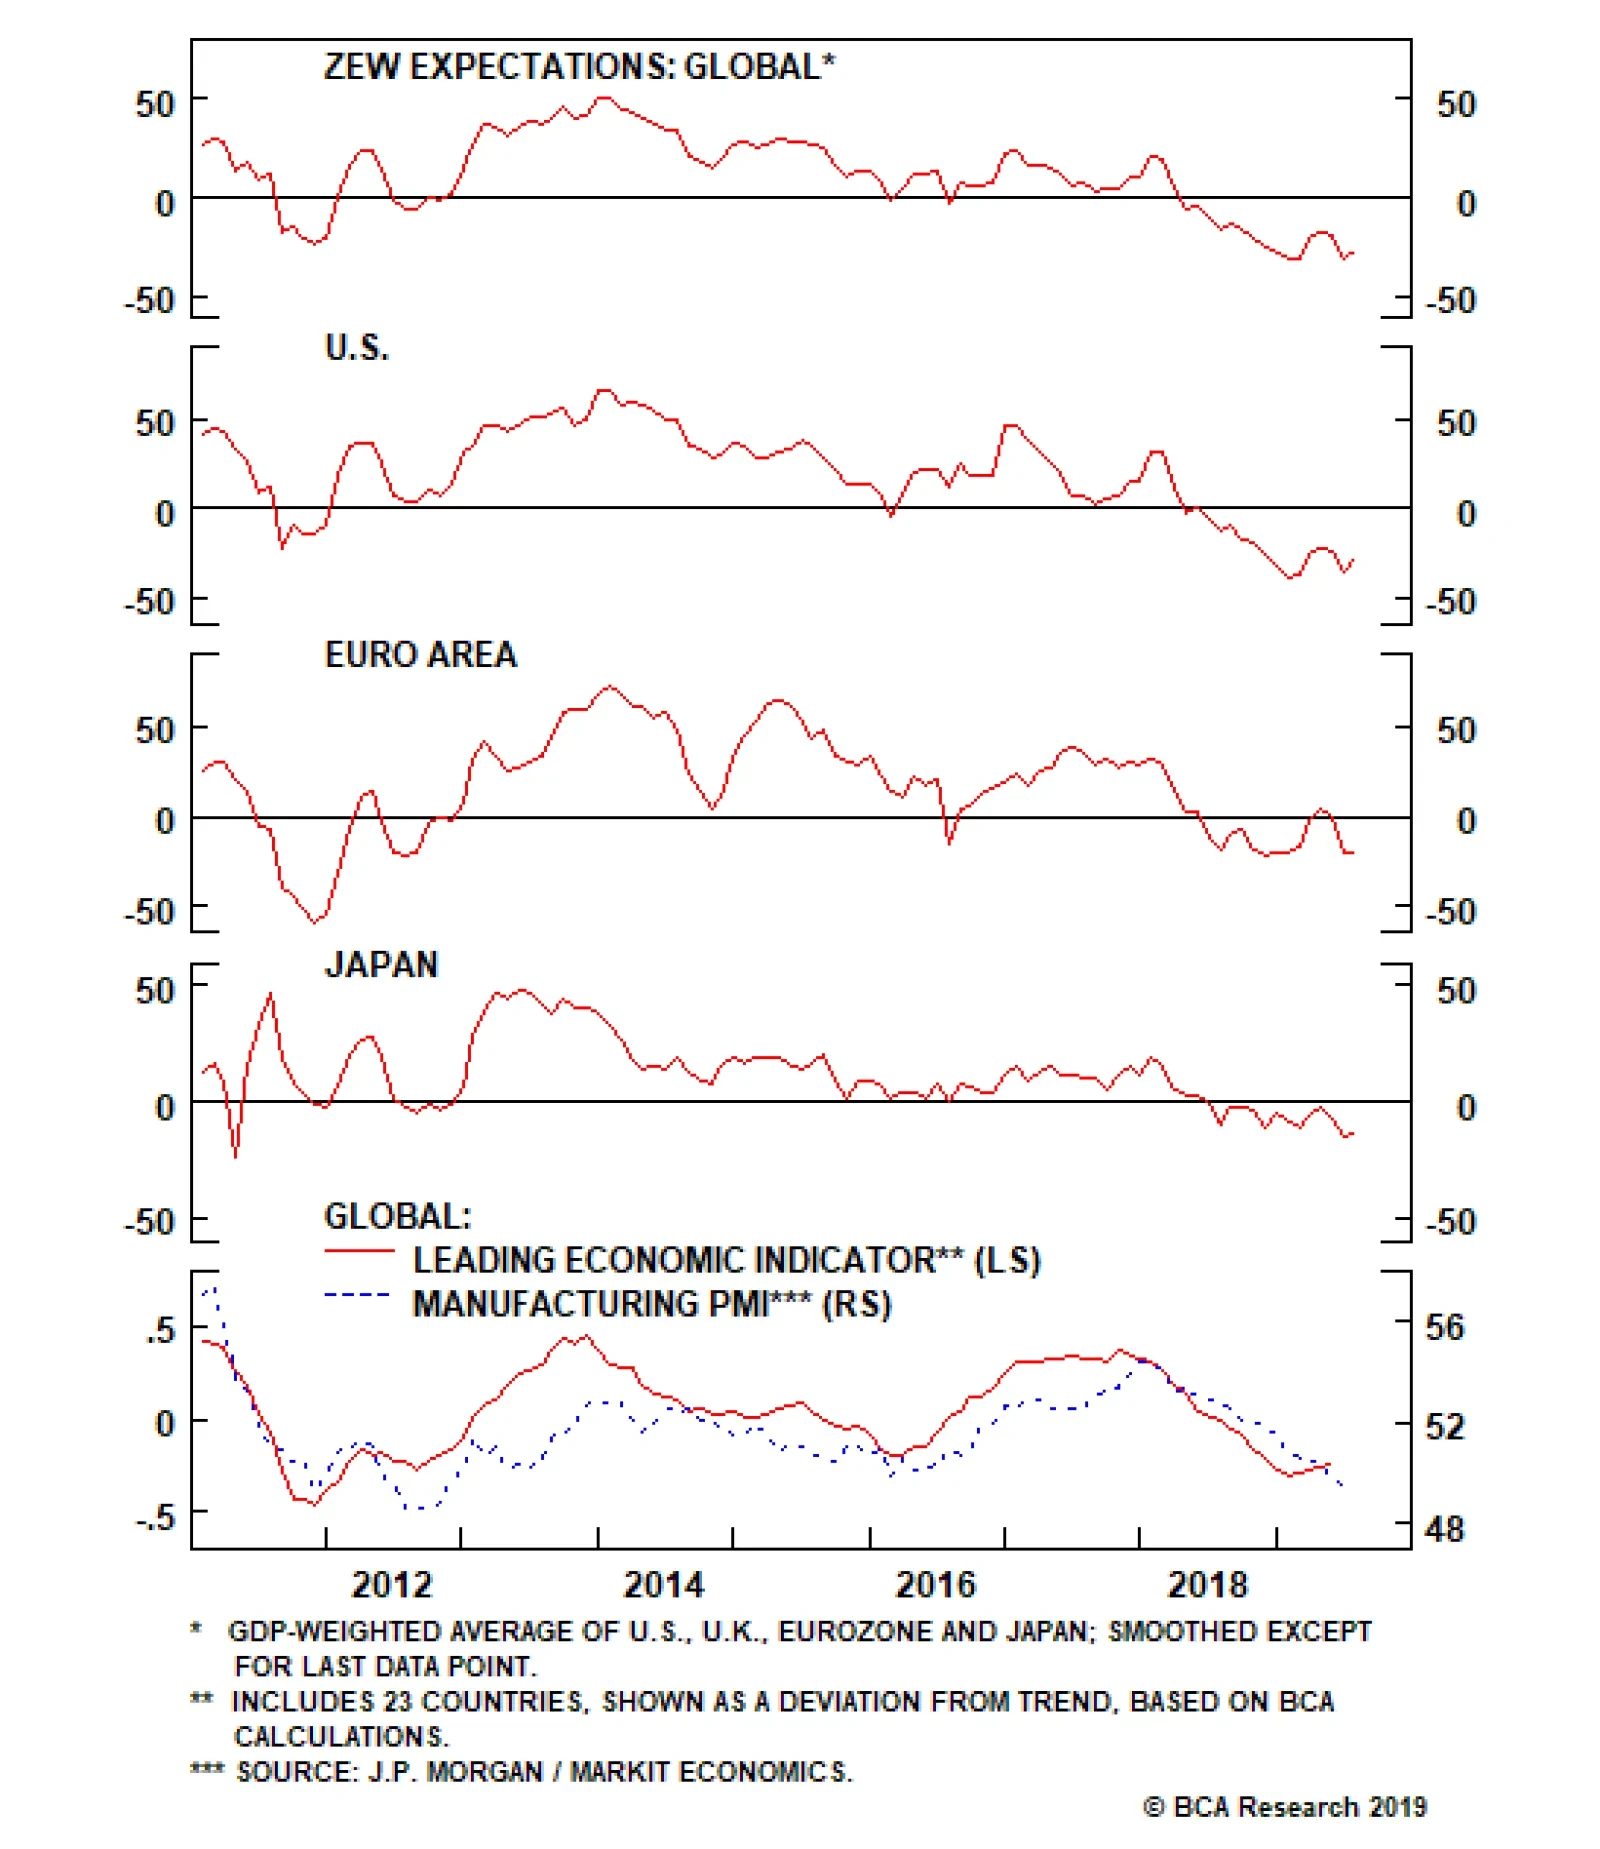
European growth expectations from the July ZEW survey remained stuck at very low levels. This hides a dichotomy. German growth expectations continue to fall significantly while Italian ones are finally rising, thanks to the easing in financial conditions…