Global
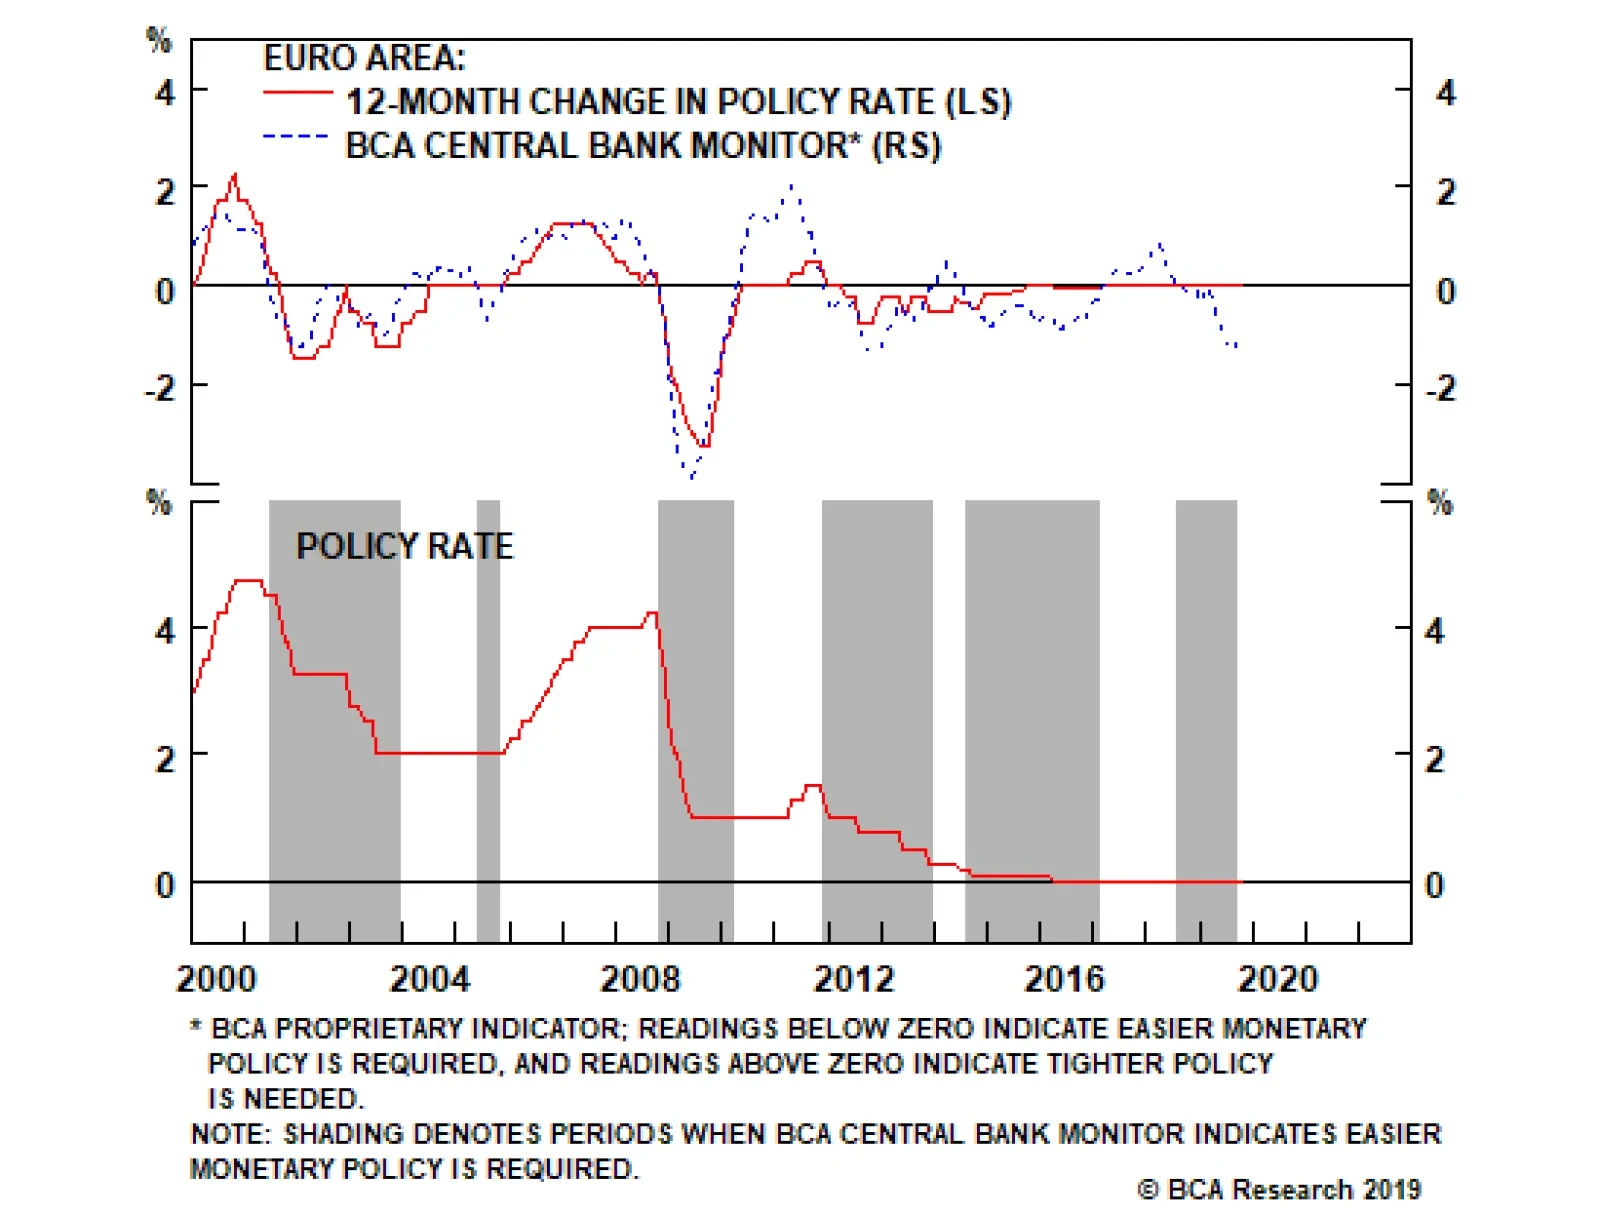
Our European Central Bank (ECB) Monitor is now well below the zero line, signaling a strong need for easier monetary policy. The global manufacturing downturn has hit the export-dependent economies of the euro area hard, with Germany probably in a technical…
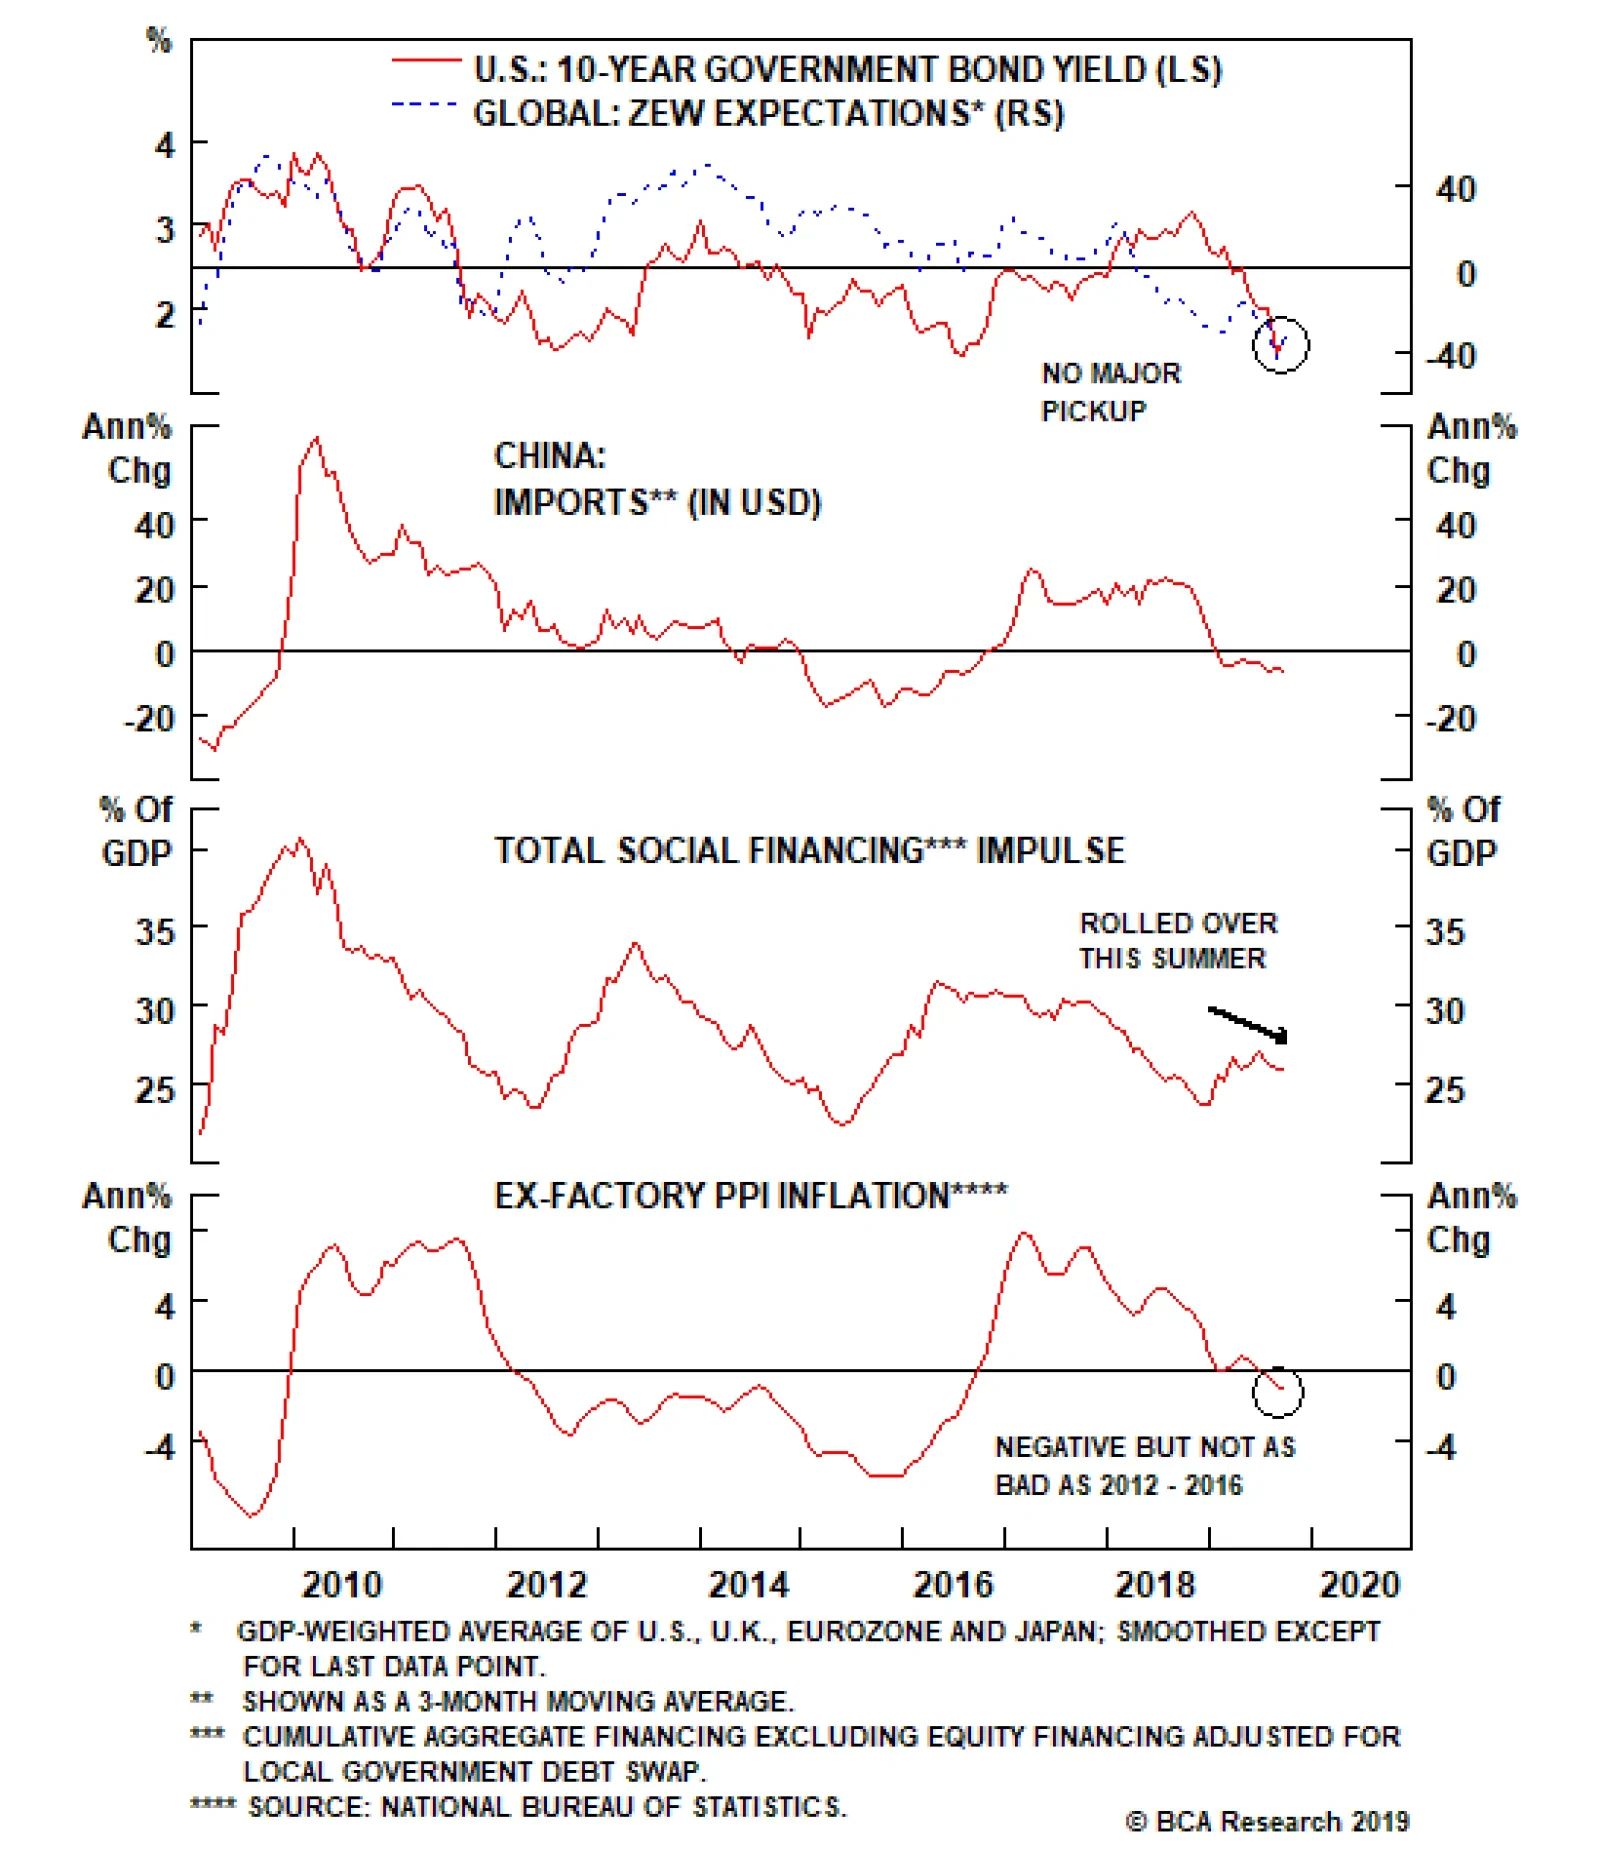
According to the October ZEW numbers released this morning, global growth is not deteriorating anymore, but it remains soft. The global growth expectations measure weakened a touch but is not falling as fast as it did in August. For the euro area and Germany,…
In theory, a food supply shock is transitory. Given that food prices are usually excluded from the core inflation gauges targeted by central banks, monetary policy should not react to these price spikes. Nonetheless, aside from this direct impact on…
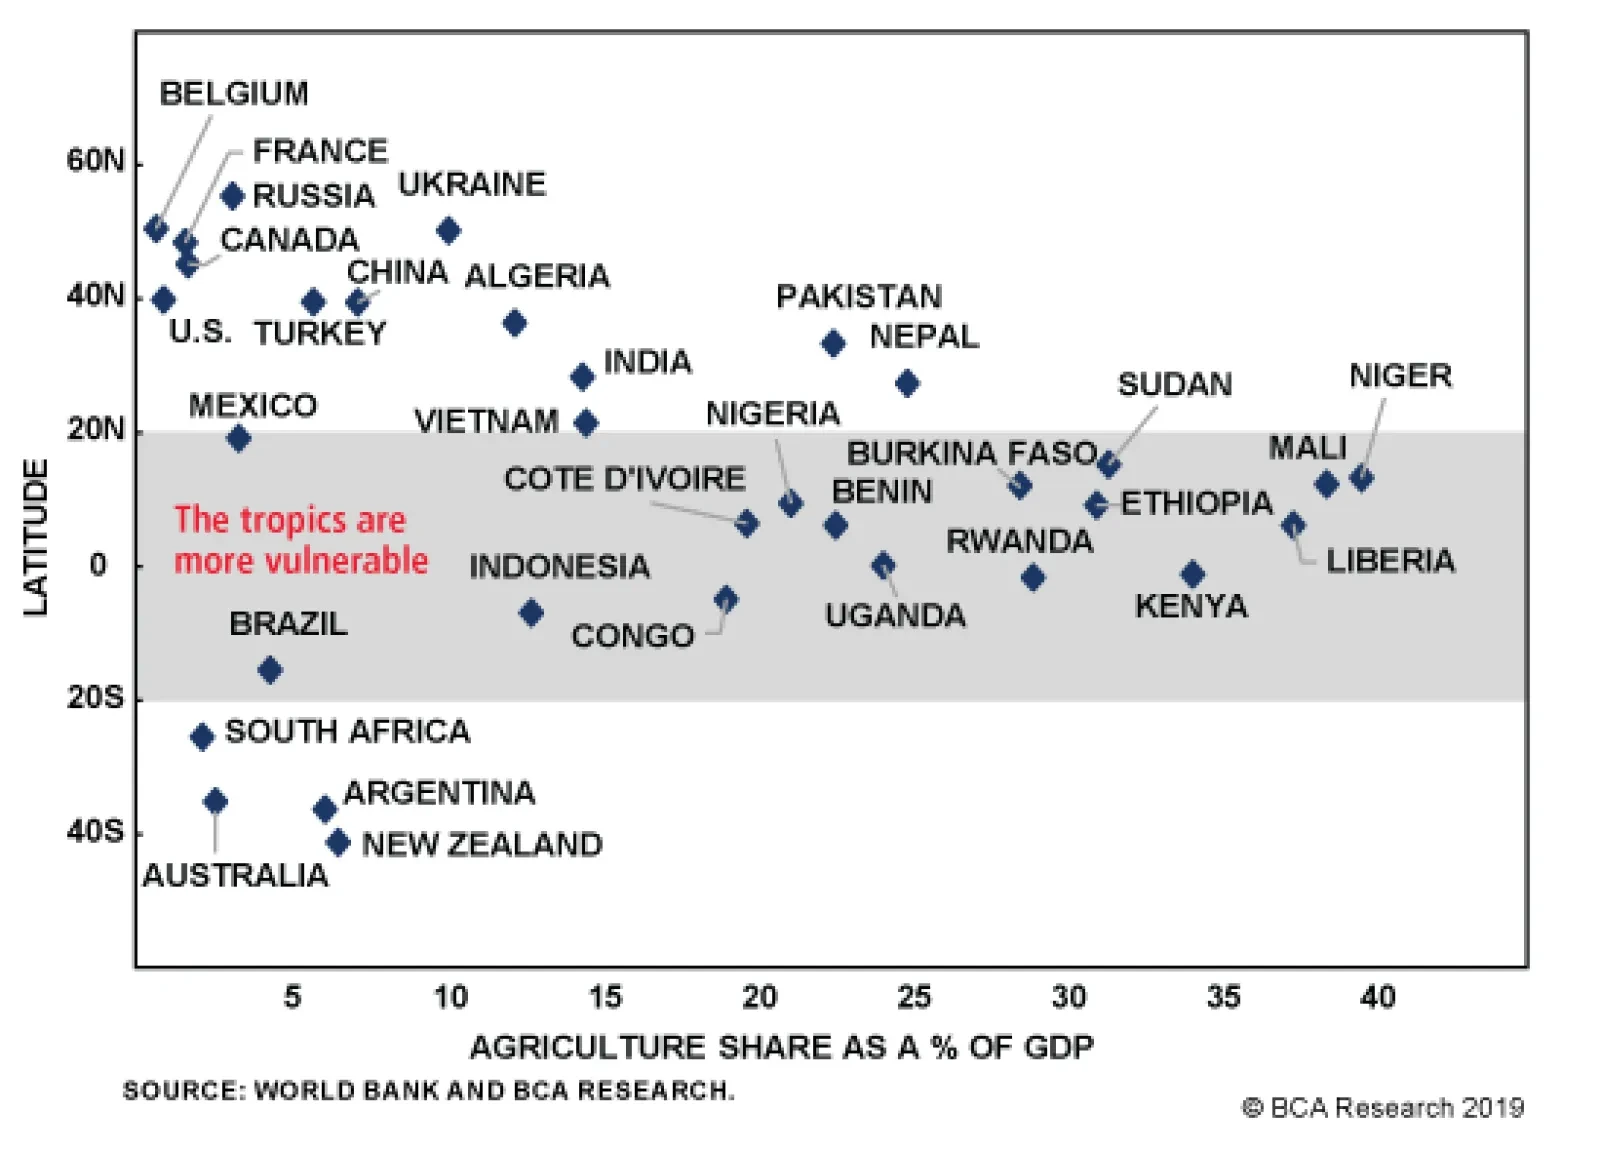
Rising temperatures are expected to result in a negligible impact on agriculture markets over the coming decade, yet this finding is not uniform across all regions. An FAO study finds that by 2030, the projected impact on crop yields will be slightly…
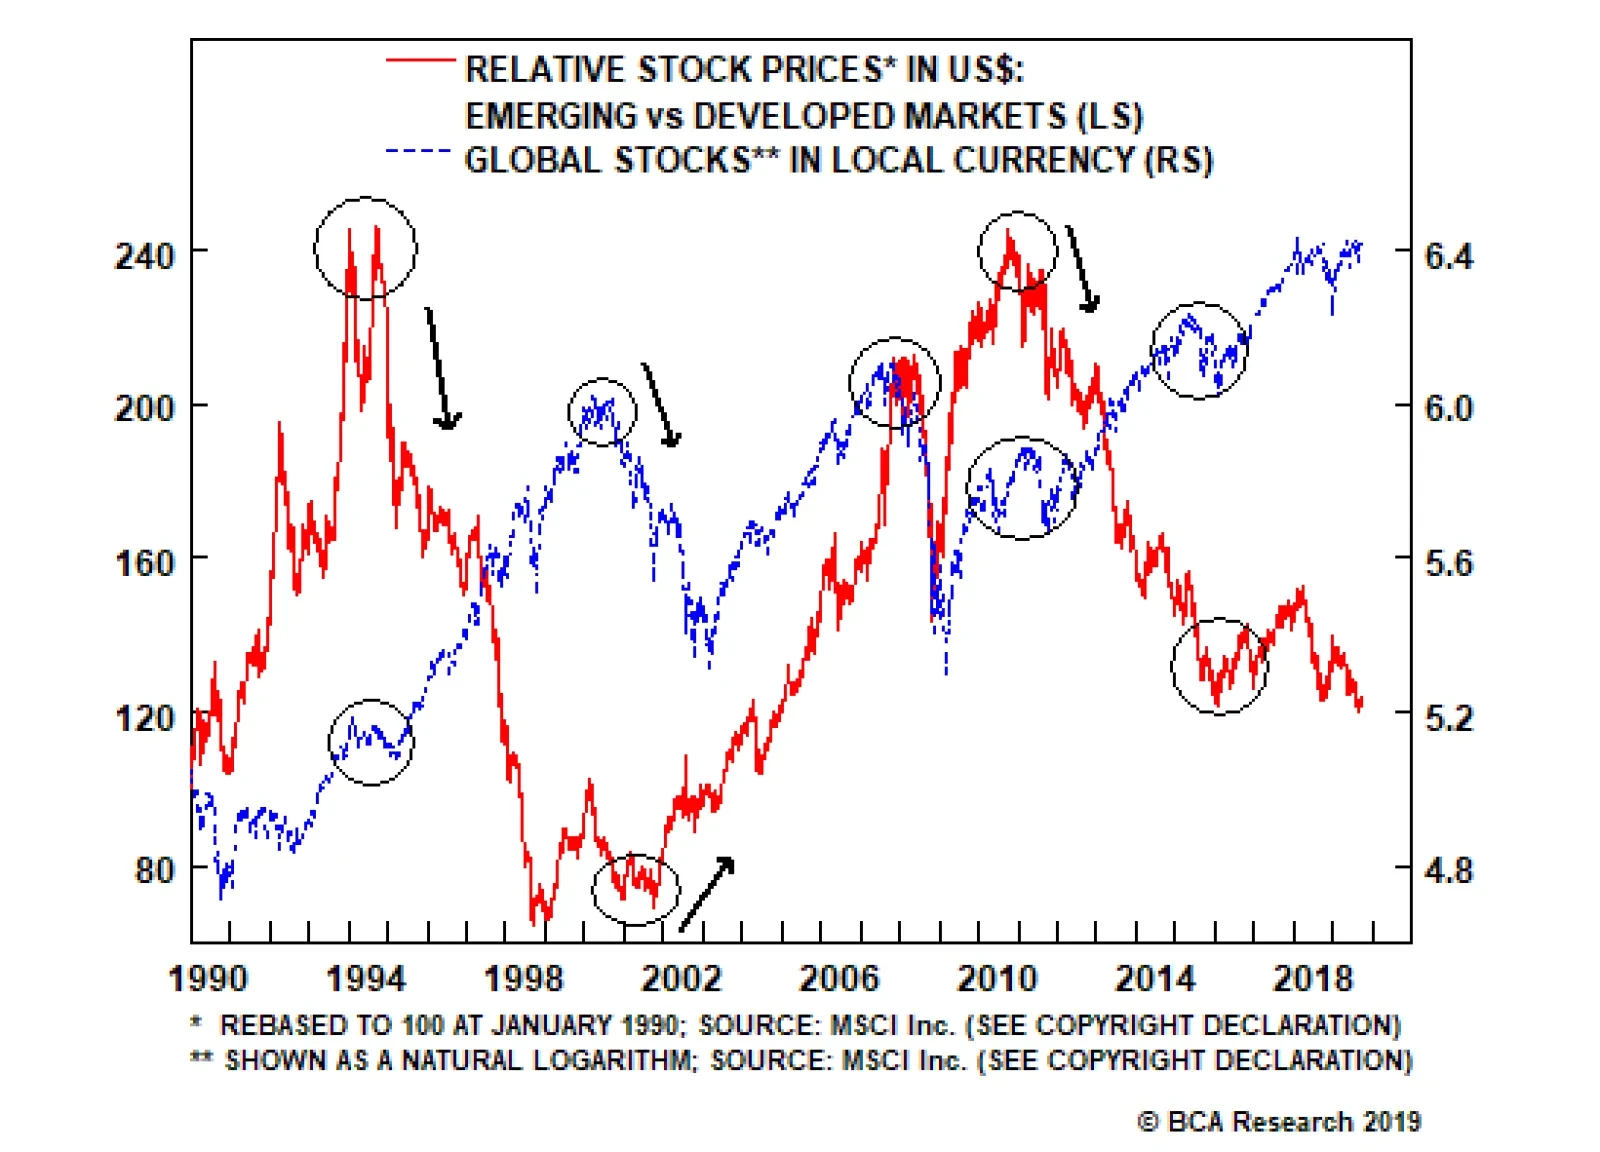
With respect to equity leadership rotation, it is crucial to note that equity leadership rotations typically occur during or after bear markets and/or corrections in global share prices. The chart above illustrates EM stock prices relative to DM along…

Analysis on Turkey is available below. Highlights A dovish Fed or robust U.S. growth does not constitute sufficient conditions for a bull market in EM. China’s business and credit cycles are much more important factors for EM than those of the U.S. A recovery in the Chinese economy and global manufacturing is not imminent. The common signal reverberating from various financial markets is that the risks to the global business cycle are still skewed to the downside. Feature Current investor perceptions of emerging markets are mixed. Some expect EM to benefit greatly from low U.S. interest rates. These investors view even a partial trade deal between the U.S. and China as sufficient for EM to embark on a bull market. BCA’s Emerging Markets Strategy team disagrees with this narrative. We deliberated the significance of the U.S.-China confrontation to EM in our September 19 report; therefore, we will not go over this subject here. Rather, in this report we discuss some of the more common misconceptions surrounding EM currently, and infer what these mean for investment strategies. Perception 1: The share of resource sectors (materials and energy) in the EM equity benchmark has declined substantially. This along with the expanded role of consumers and consumer stocks (Alibaba, Tencent and Baidu) in EM economies and equity markets has made their share prices less exposed to the global trade cycle and commodities prices. Reality: It is true that in many EM bourses, the weight of consumer stocks has been growing. Nevertheless, their financial markets in general, and equity markets in particular, remain very sensitive to the global trade cycle and commodities prices. Chart I-1 illustrates that the aggregate EM equity index has historically been and continues to be strongly correlated with the global basic materials stock index. The latter includes mining, steel and chemical companies. Global materials stocks also exhibit a very strong correlation with Chinese banks’ share prices. Moreover, global materials stocks also exhibit a very strong correlation with Chinese banks’ share prices (Chart I-2). The rationale for the high correlation is that both mainland banks’ profits and global demand for basic materials are driven by a common factor: China’s business cycle. Chart I-1EM And Global Materials Stocks Move Together
EM And Global Materials Stocks Move Together
EM And Global Materials Stocks Move Together
Chart I-2Chinese Bank And Global Materials Share Prices Are Highly Correlated
Chinese Bank And Global Materials Share Prices Are Highly Correlated
Chinese Bank And Global Materials Share Prices Are Highly Correlated
For example, construction in China is contracting (Chart I-3), which entails both higher NPLs for Chinese banks and lower demand for basic materials. China accounts for about 50% of global consumption of industrial metals, cement and many other basic materials. Finally, EM ex-China bank stocks also correlate strongly with global basic materials share prices. The basis is as follows: Many emerging economies export raw materials, and commodities price fluctuations impact their business cycle, exports and exchange rates. Chart I-3China: Construction Activity Is Contracting
China: Construction Activity Is Contracting
China: Construction Activity Is Contracting
Chart I-4High-Yielding EM: Currencies And Local Bond Yields
High-Yielding EM: Currencies And Local Bond Yields
High-Yielding EM: Currencies And Local Bond Yields
Historically, in high-yielding EM markets, currency depreciation has led to higher interest rates and lower bank share prices, and vice versa (Chart I-4). Lately, EM bond yields have not risen in response to EM currency depreciation. However, we believe this correlation will soon be re-established if EM currencies continue drifting lower. In short, China’s money/credit cycles drive not only the mainland’s business cycle, banking profits and NPLs, but also global trade and commodities prices. The latter two - via their impact on exchange rates and in turn interest rates - have historically explained credit and domestic demand cycles in high-yielding EM. Perception 2: EM stocks are a high-beta play on the S&P 500, i.e., EM equities outperform when the S&P 500 rallies, and vice versa. Reality: Since 2012, the beta for EM equity versus the S&P 500 has often been below one (Chart I-5). Furthermore, since 2012, EM share prices often failed to outpace their DM peers during global equity rallies. Indeed, EM relative equity performance versus DM, as well as the EM ex-China currency total return index, have been closely tracking the relative performance of global cyclicals versus global defensive stocks (Chart I-6). Chart I-5EM Equities Beta To The S&P 500
EM Equities Beta To The S&P 500
EM Equities Beta To The S&P 500
Chart I-6Global Cyclicals-To-Defensives Equity Ratio And EM
Global Cyclicals-To-Defensives Equity Ratio And EM
Global Cyclicals-To-Defensives Equity Ratio And EM
In short, EM equities and currencies have been, and will remain, sensitive to the global business cycle rather than the S&P 500. Since 2012, the latter has - on several occasions - decoupled from the global manufacturing and trade cycles. Perception 3: EM stocks, currencies and fixed-income markets are very sensitive to U.S. interest rates. Hence, a dovish Fed will lead to EM currency appreciation. Reality: Chart I-7 reveals that EM currencies, total returns on EM local currency bonds in U.S. dollar terms and EM sovereign credit spreads do not exhibit a strong relationship with U.S. Treasury yields. U.S. interest rate expectations have a much smaller impact on EM financial markets than commonly perceived by the investment community. Overall, U.S. interest rate expectations have a much smaller impact on EM financial markets than commonly perceived by the investment community. Chart I-7EM And U.S. Bond Yields: No Stable Correlation
bca.ems_wr_2019_10_10_s1_c7
bca.ems_wr_2019_10_10_s1_c7
Chart I-8China Cycle And EM Stocks Led U.S. Bond Yields
China Cycle And EM Stocks Led U.S. Bond Yields
China Cycle And EM Stocks Led U.S. Bond Yields
On the contrary, the declines in U.S. bond yields in both 2015/16 and in 2018/19 were due to the growth slowdown that emanated from China/EM. The top panel of Chart I-8 illustrates that Chinese import growth rolled over in December 2017, yet U.S. bond yields rolled over in October 2018. What is more, EM share prices have been leading U.S. bond yields in recent years, not the other way around (Chart I-8, bottom panel). Perception 4: If the U.S. avoids a recession, EM risk assets will recover. Chart I-9EM Profits Are Driven By Chinese Not U.S. Business Cycle
EM Profits Are Driven By Chinese Not U.S. Business Cycle
EM Profits Are Driven By Chinese Not U.S. Business Cycle
Reality: EM per-share earnings contracted in 2012-2014 and in 2019, despite reasonably robust growth in U.S. final demand (Chart I-9, top panel). This suggests that even if the U.S. economy avoids a recession, that will not be a sufficient condition to be bullish on EM. EM corporate profits are highly driven by China’s business cycle. The bottom panel of Chart I-9 illustrates that mainland domestic industrial orders have been the key driver of EM corporate profit cycles since 2008. Perception 5: EM equities, fixed-income markets and currencies are cheap. Reality: EM stocks are not cheap. They are fairly valued. Equity sectors with very poor fundamentals have very low multiples. Hence, they are “cheap” for a reason. These include Chinese banks, state-owned enterprises in various countries and resource companies. Equity segments with robust fundamentals are overpriced. Given that Chinese banks, state-owned enterprises in various countries, resource companies, and cyclical businesses have very large market caps, EM market-cap based equity valuation ratios are low – i.e., they appear cheap. To remove the impact of these large market cap segments, we constructed and have been publishing the following valuation ratios: median, 20% trimmed mean and equal-sub-sector weighted (Chart I-10). Each of these is calculated based on the average of trailing and forward P/E ratios, price-to-book value, price-to-cash earnings and price-to-dividend ratios. EM equities relative to DM are not cheap either. Chart I-11 demonstrates the same ratios – median, 20% trimmed-mean and equal-sub-sector weighted values for EM versus DM. Chart I-10EM Equities Are Not Cheap
bca.ems_wr_2019_10_10_s1_c10
bca.ems_wr_2019_10_10_s1_c10
Chart I-11Relative To DM EM Stocks Are Not Cheap
bca.ems_wr_2019_10_10_s1_c11
bca.ems_wr_2019_10_10_s1_c11
Further, when valuations are not at extremes as in the case of EM equities at the moment, the profit cycle holds the key to share price performance over a 6 to 12-month horizon. EM earnings are presently contracting in absolute terms, and underperforming DM EPS. Two currencies that offer value are the Mexican peso and Russian ruble. Chart I-12EM Local Yields Are Low In Absolute Terms And Relative To U.S.
EM Local Yields Are Low In Absolute Terms And Relative To U.S.
EM Local Yields Are Low In Absolute Terms And Relative To U.S.
In the fixed-income space, EM local bond yields are very low in absolute terms and relative to U.S. Treasury yields (Chart I-12). EM sovereign and corporate spreads are not wide either. As to exchange rates, the cheapest currencies are those with the worst fundamentals, such as the Argentine peso, Turkish lira and South African rand. The majority of other EM currencies are not very cheap. Two currencies that offer value are the Mexican peso and Russian ruble. Yet foreign investors are very long these currencies, and a combination of lower oil prices and portfolio outflows from broader EM will weigh on these exchange rates as well. Takeaways And Investment Strategy Chart I-13EM Currencies And Industrial Metals Prices
bca.ems_wr_2019_10_10_s1_c13
bca.ems_wr_2019_10_10_s1_c13
EM risk assets and currencies exhibit the strongest correlation with global trade and commodities prices. Chart I-13 indicates that the EM ex-China currency total return index closely tracks commodities prices. This corroborates the messages from Chart I-1 on page 1 and Chart I-6 on page 4. China’s business and credit cycles are much more important for EM than those of the U.S. A dovish Fed or strong U.S. growth are not sufficient reasons to bet on an EM bull market. A recovery in the Chinese economy and global manufacturing is not imminent. Individual EM countries’ domestic fundamentals such as return on capital, inflation, banking system health, competitiveness and politics drive individual EM performance. On these accounts, the outlook varies among EM. Readers can find analyses on specific EM economies in our Countries In-Depth page. Asset allocators should continue underweighting EM stocks, credit and currencies versus their DM counterparts. Absolute-return investors should outright avoid EM, or trade them on the short side. Within the EM equity space, our overweights are Mexico, Russia, Central Europe, Korea ex-tech, Thailand and the UAE. Our underweights are South Africa, Indonesia, Philippines, Hong Kong, Turkey and Colombia. The path of least resistance for the U.S. dollar is up. Continue shorting the following basket of EM currencies versus the dollar: ZAR, CLP, COP, IDR, MYR, PHP and KRW. We are also short the CNY versus the greenback. As always, the list of our country allocations for local currency bonds and sovereign credit markets is available at the end of our reports – please refer to page 16. Take Cues From These Markets We suggest investors take cues from the following financial market signals. They are unequivocally sending a downbeat message for global growth and risk assets: The ratio between Sweden and Swiss non-financial stocks in common currency terms is heading south (Chart I-14). Swedish non-financials include many companies leveraged to the global industrial cycle, while Swiss non-financials are dominated by defensive stocks. Hence, the persistent decline in this ratio presages a continued deterioration in the global industrial sector. Where is the next defense line for this ratio? To reach its 2002 and 2008 nadirs, it will need to drop by another 10%. In the interim, investors should maintain a defensive posture. Chart I-14A Message From Swedish And Swiss Equities
A Message From Swedish And Swiss Equities
A Message From Swedish And Swiss Equities
Chart I-15A Breakdown In The Making?
A Breakdown In The Making?
A Breakdown In The Making?
U.S. FAANG stocks appear to be cracking below their 200-day moving average. The relative performance of global cyclical versus global defensive stocks is relapsing below the three-year moving average that served as a support last December (Chart I-15). U.S. FAANG stocks appear to be cracking below their 200-day moving average (Chart I-16). If this support gives, the next one will be about 17% below current levels. Finally, U.S. high-beta share prices are on the verge of a breakdown (Chart I-17). The next technical support is 10% below current levels. Chart I-16FAANG Are On The Support Line
FAANG Are On The Support Line
FAANG Are On The Support Line
Chart I-17U.S. High-Beta Stocks Are On The Edge
U.S. High-Beta Stocks Are On The Edge
U.S. High-Beta Stocks Are On The Edge
Bottom Line: The common message reverberating from these financial markets corroborates our fundamental analysis that a global business cycle recovery is not imminent, and that global risk assets in general, and EM financial markets in particular, are at risk of selling off further. Arthur Budaghyan Chief Emerging Markets Strategist arthurb@bcaresearch.com Turkey: Is The Mean-Reversion Rally Over? Turkish financial markets have rebounded to their respective falling trend lines (Chart II-1). Are they set to break out or is a setback looming? Chart II-1Back To Falling Trend
Back To Falling Trend
Back To Falling Trend
Chart II-2TRY Is Cheap
TRY Is Cheap
TRY Is Cheap
Pros The economy has undergone a considerable real adjustment and many excesses have been purged: The current account balance has turned positive as imports have collapsed. Going forward, lower oil prices are likely to help the nation’s current account dynamics. The lira has become cheap (Chart II-2). According to the real effective exchange rate based on unit labor costs, the currency is one standard deviation below its fair value. Core and headline inflation have fallen, allowing the central bank to cut interest rates aggressively. However, the exchange rate still holds the key: if the currency depreciates anew, local bonds yields will rise and the ability of the central bank to reduce borrowing costs further will diminish. Finally, private credit and broad money growth have decelerated substantially and are contracting in inflation-adjusted terms (Chart II-3). Chart II-3Money & Credit Have Bottomed
Money & Credit Have Bottomed
Money & Credit Have Bottomed
Chart II-4Banks Have Been Aggressively Buying Government Bonds
Banks Have Been Aggressively Buying Government Bonds
Banks Have Been Aggressively Buying Government Bonds
The recent gap between broad money and private credit growth has been due to commercial banks buying government bonds (Chart II-4). When a commercial bank purchases a security from non-banks, a new deposit/new unit of money supply is created. Banks’ purchases of government bonds en masse have capped domestic bond yields. However, if pursued aggressively, such monetary expansion could weigh on the currency’s value. Cons Presently, potential sources of macro vulnerability in Turkey are: Foreign debt obligations (FDOs) – which are calculated as the sum of short-term claims, interest payments and amortization over the next 12 months – are at $168 billion, which is sizable. The annual current account surplus has reached only $4 billion and is sufficient to cover only 2.5% of FDOs, assuming the capital and financial account balance will be zero. Clearly, Turkey needs to both roll over most of its foreign debt coming due and attract foreign capital to finance a potential expansion in its imports if its domestic demand is to recover. Critically, $20 billion of net FX reserves, excluding gold, swap lines with foreign central banks and net of domestic banking and non-banking corporations’ foreign exchange deposits, are not adequate either to cover foreign debt obligations. Even though headline and core inflation measures have fallen, wage inflation remains rampant (Chart II-5). If wage inflation does not drop substantially very soon, rapidly rising unit labor costs will feed into inflation leading to negative ramifications for the exchange rate. This is especially crucial in Turkey given President Erdogan has undermined the central bank’s credibility and is resorting to populist measures to revive his popularity. Finally, Turkish banks remain under-provisioned. Currently, the banking regulator is requiring banks to boost their non-performing loans (NPL) ratio to 6.3% of total loans.This a far cry from the 2001 episode when the NPL ratio shot up to 25% (Chart II-6). Even though interest rates rose much more in 2001 than last year, the private credit penetration in the economy was very low in the early 2000s. A higher credit penetration usually implies weaker borrowers have borrowed money and heralds a higher NPL ratio. Typically, following a credit boom and bust, it is natural for the NPL ratio to exceed 10%. We do not think Turkish banks stocks, having rallied a lot from their lows, are pricing in such a scenario. Chart II-5Surging Wages Are A Risk
Surging Wages Are A Risk
Surging Wages Are A Risk
Chart II-6NPL Ratio Is Unrealistic
NPL Ratio Is Unrealistic
NPL Ratio Is Unrealistic
Investment Recommendation We recommend both absolute-return investors and asset allocators not to chase Turkish financial markets higher. Renewed market volatility lies ahead. Given we expect foreign capital outflows from EM, Turkish companies and banks will encounter difficulties in rolling over their external debt and attracting foreign capital into domestic markets. This will produce a new downleg in the exchange rate. In turn, currency depreciation will weigh on performance of local bonds as well as sovereign and corporate credit. Stay underweight. Andrija Vesic, Research Analyst andrijav@bcaresearch.com Footnotes Equities Recommendations Currencies, Credit And Fixed-Income Recommendations
Feature Financial market stability depends on the availability of liquidity – which means the ability to switch between the market and cash in unlimited size and in either direction without destabilising the market price. Therefore, a fundamental question for investors is: why does liquidity sometimes evaporate and the market lose its stability? (Chart I-1). Feature Chart1929 Wall Street Crash: A Collapsed Fractal Structure Was The Straw The Broke The Camel's Back
1929 Wall Street Crash: A Collapsed Fractal Structure Was The Straw The Broke The Camel's Back
1929 Wall Street Crash: A Collapsed Fractal Structure Was The Straw The Broke The Camel's Back
To answer this question, let’s turn it around: what is the source of market liquidity in the first place? The simple answer is disagreement. If an investor A wants to buy a large quantity of an investment without moving the price, then he must find an investor B who is willing to take the other side and sell the large quantity. Necessarily, this means that the large buyer and the large seller must disagree about the merits of the investment at the current price. It follows that liquidity evaporates and the market loses its stability if there is too much groupthink. After all, if everybody agrees, who will take the other side of the trade without destabilising the price? Market Liquidity Requires A Rich Fractal Structure Why do investors A and B disagree about the merits of the investment when they have the exact same information? The answer is that a healthy market comprises investors with a wide spectrum of investment horizons. This means that two investors can interpret the same information in polar opposite ways. Let’s say a ‘profit surprise’ causes the market price to gap up in euphoria. Investor A, a momentum trader, would interpret that as positive momentum, so he would put on a large buy order. Conversely, investor B, a long-term value investor, would interpret the exaggerated price move as an erosion of value, so he would put on a large sell order at the same price. The two investors have the same ambition: to make money. The difference is that the momentum trader sees the world in time units of days, whereas the long-term value investors sees the world in time units of years. A healthy market comprises investors with a wide spectrum of investment horizons. The presence of these various time horizons means that a healthy market’s price patterns are scale invariant to the time units of measurement – say weeks or months (Chart I-2). This is directly analogous to the scale invariance to length shown by the twigs and branches of a tree (Figure I-1). Just like a healthy tree, the scale invariance of a healthy market defines it as a fractal structure. And we can quantify this by calculating its fractal dimension. For a financial market, a fractal dimension above 1.5 signifies healthy liquidity, efficiency, and stability. Chart I-2AA Healthy Stock Market's Price Patterns Are Scale Invariant
A Healthy Stock Market's Price Patterns Are Scale Invariant
A Healthy Stock Market's Price Patterns Are Scale Invariant
Chart I-2BA Healthy Stock Market's Price Patterns Are Scale Invariant
A Healthy Stock Market's Price Patterns Are Scale Invariant
A Healthy Stock Market's Price Patterns Are Scale Invariant
Figure I-1A Healthy Tree’s Structure Is Scale Invariant
Fractals: The Competitive Advantage In Investing
Fractals: The Competitive Advantage In Investing
Conversely, a withering fractal structure – and declining fractal dimension – signifies a coalescing of investment horizons, and thereby an erosion of liquidity, efficiency, and stability. Too many value investors are joining the momentum herd rather than dispassionately investing on the basis of a valuation framework. At first, their additional buy orders add fuel to the rally. But a denouement occurs when the fractal dimension has collapsed towards its lower bound close to, but just above, 1. At this point, all the value investors have joined the momentum herd. If a value investor then suddenly reverts to type and puts in a large sell order, there are two possible outcomes: The trend reverses substantially to attract a large buy order from an ultra-long-term deep value investor who refuses to join the groupthink. The trend continues substantially, because the ultra-long-term deep value investor jumps on the momentum bandwagon too. It turns out that out of these two possibilities, the probability of a trend reversal is much higher than that of a trend continuation (Chart I-3). Chart I-3Dollar/Yen: Collapsed Fractal Structures Cause Long-Term Tops And Bottoms
Dollar/Yen: Collapsed Fractal Structures Cause Long-Term Tops And Bottoms
Dollar/Yen: Collapsed Fractal Structures Cause Long-Term Tops And Bottoms
When The Fractal Structure Collapses, The Probability Of A Trend Reversal Is 60-70 Percent Almost exactly five years ago in our Special Report “The Universal Constant of Finance” we developed the mathematics to calculate the fractal dimension for any financial asset for any pair of investment horizons (Box I-1). Meaning that the 65 day dimension would measure the fractal structure for the 1 day and 65 day (1 quarter) horizons; the 60 month dimension would measure it for the 1 month and 60 month (5 year) horizons; and so on.1 Box I-1Calculating A Fractal Dimension
Fractals: The Competitive Advantage In Investing
Fractals: The Competitive Advantage In Investing
When the fractal dimension collapsed to its lower bound, we found that the previous trend during the period defined in the dimension – 65 days for a 65 day dimension, 60 months for a 60 month dimension, and so on – had a much higher probability of reversing by a third in the following period (a win) than continuing by a third (a symmetrical loss). In this sense, the collapsed fractal structure signalled the opportunity to toss a coin with the odds significantly tilted in your favour. In the subsequent five years, we have used collapsed fractal structures to recommend 150 countertrend trades in all asset-classes: equities, commodities, bonds, both directional and long/short, and FX. To emphasise, the trades are not back tests, they are live trades with initiations and closes recommended in real time. A denouement occurs when the fractal dimension has collapsed towards its lower bound close to, but just above, 1. Today, we are delighted to report that out of 146 closed trades, 91 turned out as wins while 55 tuned out as losses, equating to a significantly tilted win ratio of 62.3 percent (Table I-1). Analysing the results by asset-class, this approach was particularly lucrative for FX and commodity long/short trades with win ratios of 67 percent (Table I-2). The equity directional and long/short win ratios were also comfortably above 60 percent. The bond win ratios were favourably tilted at just under 60 percent, albeit based on a much smaller sample of trades. Table I-1Fractal Trading System: Results By Year
Fractals: The Competitive Advantage In Investing
Fractals: The Competitive Advantage In Investing
Table I-2Fractal Trading System: Results By Asset-Class
Fractals: The Competitive Advantage In Investing
Fractals: The Competitive Advantage In Investing
How To Bet On A Rigged Coin: The Kelly Criterion Imagine you had the gift of calling a coin toss correctly 60 percent of the time. Would you have a licence to print money? Yes – but with a crucial caveat. If you foolishly bet everything on the first one or two tosses, the chances of going bust would be a not insignificant 40 and 16 percent respectively. Begging the question, what would be the optimal amount to wager on each toss? The answer comes from the so-called ‘Kelly criterion’ named after its creator J L Kelly, a researcher at Bell Labs, in 1956. In this case, the Kelly criterion says the optimal strategy is to bet 20 percent of your pot on each toss (Box I-2). Follow this strategy, and slowly but surely your wealth will mushroom. Box I-2How To Bet On A Rigged Coin: The Kelly Criterion
Fractals: The Competitive Advantage In Investing
Fractals: The Competitive Advantage In Investing
What should a fund manager do faced with the same decision? For the fund manager the loss limit is not 100 percent, instead it is the maximum drawdown he can suffer before being fired. Let’s assume this limit is a 10 percent drawdown. This means the correct strategy for the fund manager is to bet one tenth of the Kelly criterion – 2 percent of the fund – on the rigged coin toss. All of which brings us back to the opportunities that collapsed fractal structures offer. If your maximum tolerable drawdown is 10 percent and the probability of a countertrend ‘win’ is around 60 percent, you should target a 2 percent profit from each collapsed fractal structure opportunity, accepting that in 40 percent of cases the outcome will be a 2 percent loss. Then repeat the strategy over and over again and watch your wealth mushroom. How have our recommendations fared on the 2 percent profit target per trade basis? 91 wins and 55 losses means 36 net wins equalling an arithmetic 72 percent gain. However, a few wins and losses were partial in the sense that the trade did not reach its profit target or stop-loss before being closed. Allowing for this and the effects of compounding, the actual gain was 65 percent, equalling an annualised return of 11 percent since 2015. In terms of risk, the worst drawdown was 9.6 percent, just within the self-imposed 10 percent limit. Fractal analysis is particularly lucrative in the FX markets. To be clear, these results do not include any transaction costs. Against this, the outcome is handicapped by the ‘publishing delay’ between spotting the opportunities and writing a weekly report. Taking these two factors in combination, the outcome seems an accurate assessment of what the recommendations have achieved. The results are very satisfying, but this is still work in progress. Rather than an arbitrary one third reversal of the previous trend, a more calibrated amount – such as a Fibonacci retracement – might boost the win ratio. And by being more selective about which collapsed fractal structure opportunities to exploit the win ratio could be enhanced towards 70 percent. Henceforth, each week we will publish cumulative win ratios as these are the statistics that are most crucial for success. To conclude, the evidence is irrefutable: those investors that harness the lucrative opportunities that come from collapsed fractal structures can gain a major competitive advantage over those investors that do not. Fractal Trading System* Based on its collapsed fractal structure, the substantial underperformance of Poland is susceptible to a countertrend reversal. Accordingly, go long Poland versus the world, setting a profit target at 4 percent, with a symmetrical stop-loss. In other positions, short Athex composite versus Eurostoxx 600 closed in profit, while short New Zealand electricity versus market closed at its stop-loss. For any investment, excessive trend following and groupthink can reach a natural point of instability, at which point the established trend is highly likely to break down with or without an external catalyst. An early warning sign is the investment’s fractal dimension approaching its natural lower bound. Encouragingly, this trigger has consistently identified countertrend moves of various magnitudes across all asset classes. Chart I-4MSCI Poland Vs. MSCI World
MSCI Poland Vs. MSCI World
MSCI Poland Vs. MSCI World
The post-June 9, 2016 fractal trading model rules are: When the fractal dimension approaches the lower limit after an investment has been in an established trend it is a potential trigger for a liquidity-triggered trend reversal. Therefore, open a countertrend position. The profit target is a one-third reversal of the preceding 13-week move. Apply a symmetrical stop-loss. Close the position at the profit target or stop-loss. Otherwise close the position after 13 weeks. Use the position size multiple to control risk. The position size will be smaller for more risky positions. * For more details please see the European Investment Strategy Special Report “Fractals, Liquidity & A Trading Model,” dated December 11, 2014, available at eis.bcaresearch.com. Dhaval Joshi, Chief European Investment Strategist dhaval@bcaresearch.com Footnotes 1 Please see the European Investment Strategy Special Report ‘The Universal Constant of Finance’ September 25, 2014 available at eis.bcaresearch.com. Fractal Trading System Fractal Trades 2018 Fractal Trades
Fractals: The Competitive Advantage In Investing
Fractals: The Competitive Advantage In Investing
2017 Fractal Trades
Fractals: The Competitive Advantage In Investing
Fractals: The Competitive Advantage In Investing
2016 Fractal Trades
Fractals: The Competitive Advantage In Investing
Fractals: The Competitive Advantage In Investing
2015 Fractal Trades
Fractals: The Competitive Advantage In Investing
Fractals: The Competitive Advantage In Investing
The global economy has reached a critical juncture. Growth has been slowing since early 2018, reaching what many would regard as “stall speed.” This is the point where economic weakness begins to feed on itself, potentially triggering a recession. Will the…
Highlights MARKET FORECASTS
Fourth Quarter 2019 Strategy Outlook: A "Show Me" Market
Fourth Quarter 2019 Strategy Outlook: A "Show Me" Market
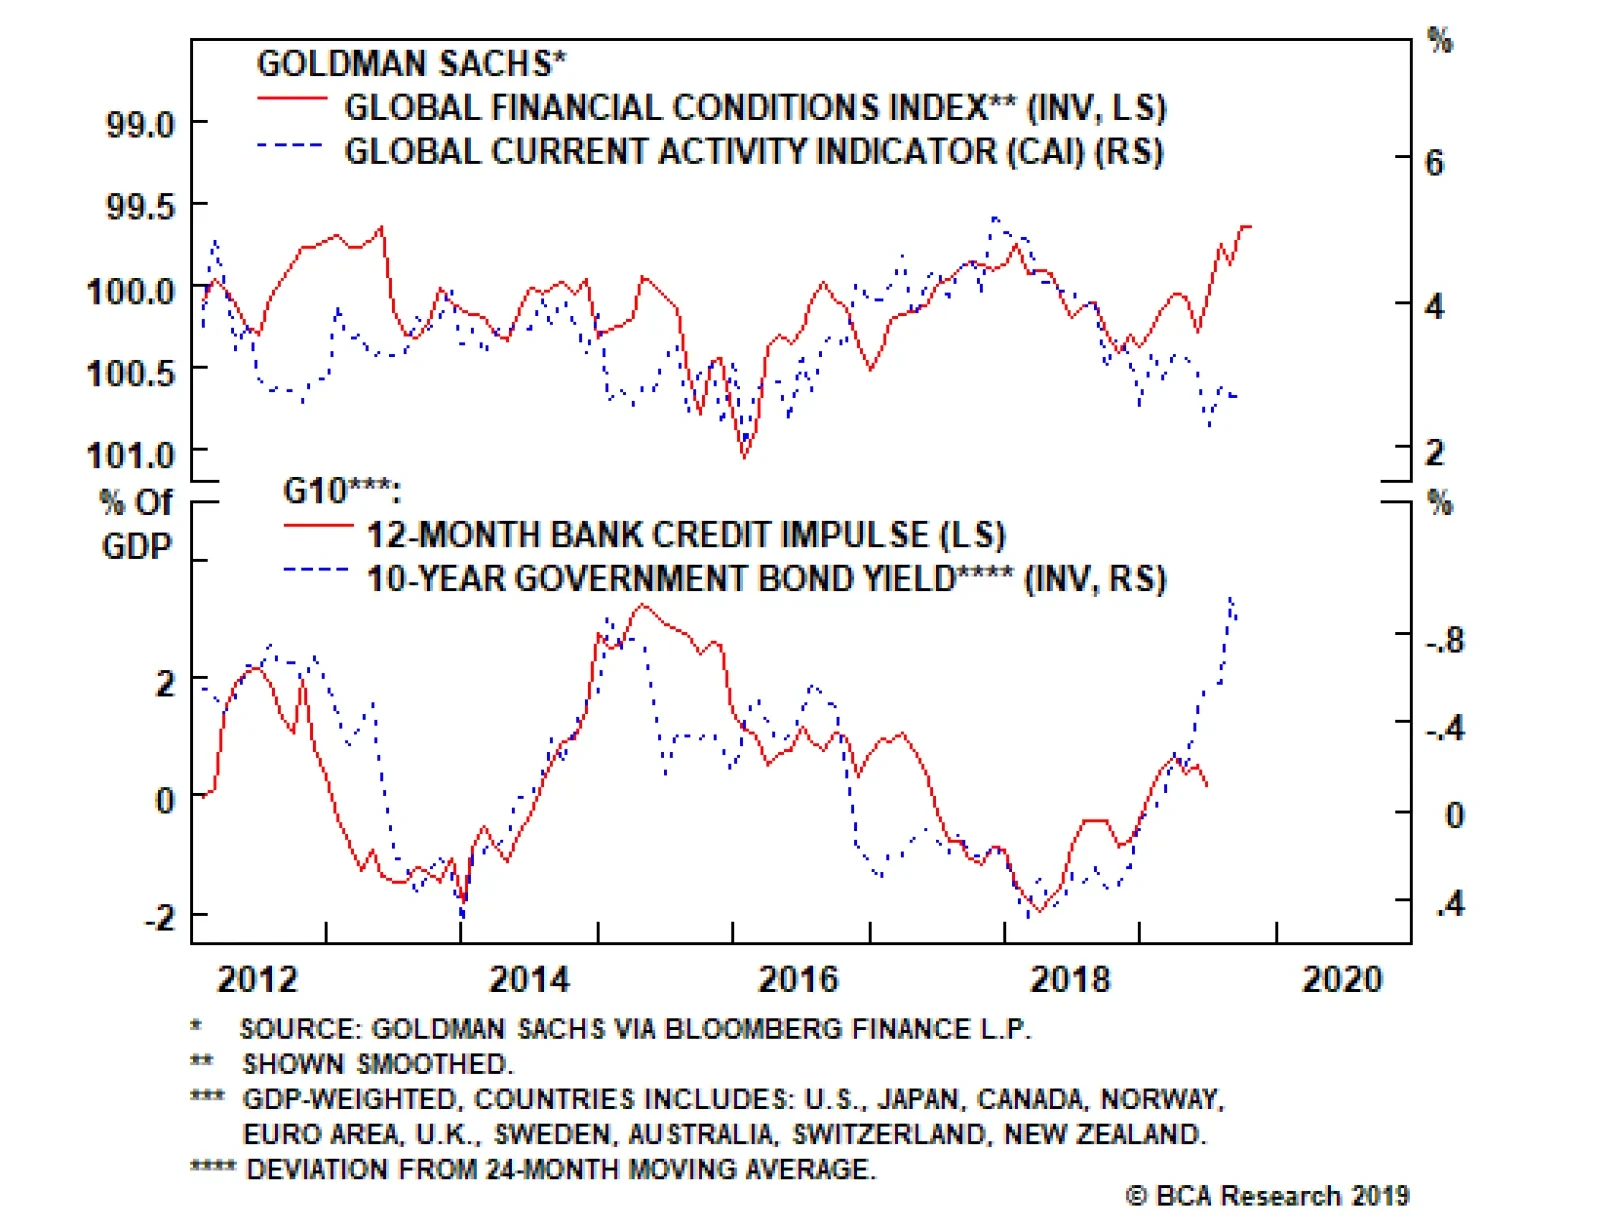
Investment Strategy: Markets have entered a “show me” phase. Better economic data and meaningful progress on the trade negotiations will be necessary for stocks to move sustainably higher. We think both preconditions will be realized. Until then, risk assets could come under pressure. Global Asset Allocation: Investors should overweight stocks relative to bonds over a 12-month horizon, but maintain higher-than-normal cash positions in the near term as a hedge against downside risks. Equities: EM and European stocks will outperform once global growth bottoms out. Cyclical sectors, including financials, will also start to outperform defensives when the growth cycle turns. Bonds: Central banks will remain dovish, but yields will nevertheless rise modestly on the back of stronger global growth. Favor high-yield corporate credit over government bonds. Currencies: As a countercyclical currency, the U.S. dollar should peak later this year. Commodities: Oil and industrial metals prices will move higher. Gold prices have entered a holding pattern, but should shine again late next year or in 2021 when inflation finally breaks out. Feature Dear Client, In lieu of this report, I hosted a webcast on Monday, October 7th at 10:00 AM EDT, where I discussed the major investment themes and views I see playing out for the rest of the year and beyond. Best regards, Peter Berezin, Chief Global Strategist I. Global Macro Outlook A Testing Phase For The Global Economy The global economy has reached a critical juncture. Growth has been slowing since early 2018, reaching what many would regard as “stall speed.” This is the point where economic weakness begins to feed on itself, potentially triggering a recession. Will the growth slowdown worsen? Our guess is that it won’t. Global financial conditions have eased significantly over the past four months, thanks in part to the dovish pivot by most central banks. Looser financial conditions usually bode well for global growth (Chart 1). Our global leading indicator has hooked up, mainly due to a marginal improvement in emerging markets’ data (Chart 2). Chart 1Easier Financial Conditions Will Boost Global Growth
Easier Financial Conditions Will Boost Global Growth
Easier Financial Conditions Will Boost Global Growth
Chart 2Global LEI Has Moved Off Its Lows
Global LEI Has Moved Off Its Lows
Global LEI Has Moved Off Its Lows
An important question is whether the weakness in the manufacturing sector will spread to the much larger services sector. There is some evidence that this is happening, with yesterday’s weaker-than-expected ISM non-manufacturing release being the latest example. Nevertheless, the deceleration in service sector activity has been limited so far (Chart 3). Even in Germany, with its large manufacturing base, the service sector PMI remains in expansionary territory. This is a key difference with the 2001/02 and 2008/09 periods, when service sector activity collapsed in lockstep with manufacturing activity. Chart 3AThe Service Sector Has Softened Less Than Manufacturing (I)
The Service Sector Has Softened Less Than Manufacturing (I)
The Service Sector Has Softened Less Than Manufacturing (I)
Chart 3BThe Service Sector Has Softened Less Than Manufacturing (II)
The Service Sector Has Softened Less Than Manufacturing (II)
The Service Sector Has Softened Less Than Manufacturing (II)
The Drive-By Slowdown If one were to ask most investors the reasons behind the manufacturing slowdown, they would probably cite the trade war or the Chinese deleveraging campaign. These are both valid reasons, but there is a less well-known culprit: autos. According to WardsAuto, global auto sales fell by over 5% in the first half of the year, by far the biggest decline since the Great Recession (Chart 4). Production dropped by even more. Chart 4Weakness In The Auto Sector Has Exacerbated The Manufacturing Downturn
Weakness In The Auto Sector Has Exacerbated The Manufacturing Downturn
Weakness In The Auto Sector Has Exacerbated The Manufacturing Downturn
Chart 5U.S. Auto Demand Is Recovering
U.S. Auto Demand Is Recovering
U.S. Auto Demand Is Recovering
The weakness in the global auto sector reflects a variety of factors. New stringent emission requirements, expiring tax breaks, lagged effects from tighter auto loan lending standards, and trade tensions have all played a role. In addition, the decline in gasoline prices in 2015/16 probably brought forward some automobile purchases. This suggests that the 2015/16 global manufacturing downturn may have helped sow the seeds for the current one. The fact that automobile output is falling faster than sales is encouraging because it means that excess inventories are being worked off. U.S. auto loan lending standards have started to normalize, with banks reporting stronger demand for auto loans in the latest Senior Loan Officer Survey (Chart 5). In China, auto sales have troughed after having declined by as much as 14% earlier this year (Chart 6). The Chinese automobile ownership rate is a fifth of what it is in the U.S., a quarter of what it is in Japan, and a third of what it is in Korea (Chart 7). Given the low starting point, Chinese auto sales are likely to resume their secular uptrend. Chart 6Auto Sector In China Is Finding A Floor
Auto Sector In China Is Finding A Floor
Auto Sector In China Is Finding A Floor
Chart 7China: Structural Outlook For Autos Is Bright
China: Structural Outlook For Autos Is Bright
China: Structural Outlook For Autos Is Bright
The Trade War: Tracking Towards A Détente? Chart 8A Fairly Regular Three-Year Manufacturing Cycle
A Fairly Regular Three-Year Manufacturing Cycle
A Fairly Regular Three-Year Manufacturing Cycle
Manufacturing cycles typically last about three years – 18 months of slowing growth followed by 18 months of rising growth (Chart 8). To the extent that the global manufacturing PMI peaked in the first half of 2018, we should be nearing the end of the current downturn. Of course, much depends on policy developments. As we go to press, high-level negotiations between the U.S. and China have resumed. While it is impossible to predict the outcome of these talks, it does appear that both sides have an incentive to de-escalate the trade conflict. President Trump gets much better marks from voters on his management of the economy than on anything else, including his handling of trade negotiations with China (Chart 9). A protracted trade war would hurt U.S. growth, while weakening the stock market. Both would undermine Trump’s re-election prospects. Chart 9Trump Gets Reasonably High Marks On His Handling Of The Economy, But Not Much Else
Fourth Quarter 2019 Strategy Outlook: A "Show Me" Market
Fourth Quarter 2019 Strategy Outlook: A "Show Me" Market
Chart 10Who Will Win The 2020 Democratic Nomination?
Fourth Quarter 2019 Strategy Outlook: A "Show Me" Market
Fourth Quarter 2019 Strategy Outlook: A "Show Me" Market
China also wants to bolster growth. As difficult as it has been for the Chinese leadership to deal with Donald Trump, trying to secure a trade deal with him after he has been re-elected would be even more challenging. This would especially be the case if Trump thought that the Chinese had tried to sabotage his re-election bid. Even if Trump were to lose the election, it is not clear that China would end up with someone more pliant to deal with on trade matters. Does the Chinese government really want to negotiate over environmental standards and human rights with President Warren, who betting markets now think has a better chance of becoming the Democratic nominee than Joe Biden (Chart 10)? The Democrats’ initiative to impeach President Trump make a trade resolution somewhat more likely. First, it brings attention to Joe Biden’s (and his son’s) own dubious dealings in Ukraine, thus delivering a blow to China’s preferred U.S. presidential candidate. Second, it makes Trump more inclined to want to put the China spat behind him in order to focus his energies on domestic matters. More Chinese Stimulus? Strategically, China has a strong incentive to stimulate its economy in order to prop up growth and gain greater leverage in the trade negotiations. The Chinese credit impulse bottomed in late 2018. The impulse leads Chinese nominal manufacturing output and most other activity indicators by about nine months (Chart 11). So far, the magnitude of China’s credit/fiscal easing has come nowhere close to matching the stimulus that was unleashed on the economy both in 2015/16 and 2008/09. This is partly because the authorities are more worried about excessive debt levels today than they were back then, but it is also because the economy is in better shape. The shock from the trade war has not been nearly as bad as the Great Recession – recall that Chinese exports to the U.S. are only 2.7% of GDP in value-added terms. Unlike in 2015/16, when China lost over $1 trillion in external reserves, capital outflows have remained muted this time around (Chart 12). Chart 11Chinese Stimulus Should Boost Global Growth
Chinese Stimulus Should Boost Global Growth
Chinese Stimulus Should Boost Global Growth
Chart 12China: No Major Capital Outflows
China: No Major Capital Outflows
China: No Major Capital Outflows
Better-than-expected Chinese PMI data released earlier this week offers a glimmer of hope. Nevertheless, in light of the disappointing August activity numbers, China is likely to increase the pace of stimulus in the coming months. The authorities have already reduced bank reserve requirements. We expect them to cut policy rates further in the coming months. They will also front-load local government bond issuance, which should help boost infrastructure spending. European Growth Should Improve A pickup in global growth will help Europe later this year. Germany, with its trade-dependent economy, will benefit the most. Chart 13Spreads Have Come In Across Southern Europe
Spreads Have Come In Across Southern Europe
Spreads Have Come In Across Southern Europe
Chart 14Faster Money Growth Bodes Well For GDP Growth In The Euro Area
Faster Money Growth Bodes Well For GDP Growth In The Euro Area
Faster Money Growth Bodes Well For GDP Growth In The Euro Area
Falling sovereign spreads should also support Southern Europe (Chart 13). The Italian 10-year spread with German bunds has narrowed by almost a full percentage point since mid-August, taking the Italian 10-year yield down to 0.83%. Greek 10-year bonds are now yielding less than U.S. Treasurys (the Greek manufacturing PMI is currently the strongest in the world). With the ECB back in the market buying sovereign and corporate debt, borrowing rates should remain low. Euro area money growth, which leads GDP growth, has already picked up (Chart 14). Bank lending to the private sector should continue to accelerate. A modest serving of fiscal stimulus will also help. The European Commission estimates that the fiscal thrust in the euro area will increase by 0.5% of GDP in 2019 (Chart 15). Assuming, conservatively, a fiscal multiplier of one, this would boost euro area growth by half a percentage point. Owing to lags between changes in fiscal policy and their impact on the real economy, most of the gains to GDP growth will occur over the remainder of this year and in 2020. Chart 15Euro Area Fiscal Stimulus Will Also Boost Growth
Euro Area Fiscal Stimulus Will Also Boost Growth
Euro Area Fiscal Stimulus Will Also Boost Growth
Chart 17Brexit Angst: A Case Of Bremorse
Brexit Angst: A Case Of Bremorse
Brexit Angst: A Case Of Bremorse
Chart 16U.K.: Brexit Uncertainty Is Weighing On Growth
U.K.: Brexit Uncertainty Is Weighing On Growth
U.K.: Brexit Uncertainty Is Weighing On Growth
In the U.K., Brexit uncertainty continues to weigh on growth. U.K. business investment has been especially hard hit (Chart 16). Prime Minister Boris Johnson remains insistent that he will take the U.K. out of the EU with or without a deal at the end of October. We would downplay his bluster. The Supreme Court has already denied his attempt to shutter parliament. The public is having second thoughts about the desirability of Brexit (Chart 17). While we do not have a strong view on the exact plot twists in the Brexit saga, we maintain that the odds of a no-deal Brexit are low. This is good news for U.K. growth and the pound. Japan: Own Goal Recent Japanese data releases have not been encouraging: Machine tool orders declined by 37% year-over-year in August. Exports contracted by over 8%, with imports recording a drop of 12%. The September PMI print exposed further deterioration in manufacturing, with the index falling to 48.9 from 49.3 in August. In addition, industrial production contracted by more than expected in August, falling by 1% month-over-month, and close to 5% year-over-year. The ongoing uncertainty surrounding the U.S.-China trade negotiations, as well as Japan’s own tensions with neighboring South Korea, have also weighed on the Japanese economy. Japanese industrial activity will improve later this year as global growth rebounds. But the government has not helped growth prospects by raising the consumption tax on October 1st. While various offsets will blunt the full effect of the tax hike, it still amounts to unwarranted tightening in fiscal policy. Nominal GDP has barely increased since the early 1990s. What Japan needs are policies that boost nominal income. Such reflationary policies may be the only way to stabilize debt-to-GDP without pushing the economy back into a deflationary spiral.1 The U.S.: Hanging Tough Chart 18U.S. Has A Smaller Share Of Manufacturing Than Most Other Developed Economies
Fourth Quarter 2019 Strategy Outlook: A "Show Me" Market
Fourth Quarter 2019 Strategy Outlook: A "Show Me" Market
The U.S. economy has fared relatively well during the latest global economic downturn, partly because manufacturing represents a smaller share of GDP than in most other economies (Chart 18). According to the Atlanta Fed GDPNow model, real GDP is on track to rise at a trend-like pace of 1.8% in the third quarter (Chart 19). Personal consumption is set to increase by 2.5%, after having grown by 4.6% in the second quarter. Consumer spending should stay robust, supported by rising wage growth. The personal savings rate also remains elevated, which should help cushion households from any adverse shocks (Chart 20). Chart 19U.S. Growth Has Softened, But Is Still Close To Trend
Fourth Quarter 2019 Strategy Outlook: A "Show Me" Market
Fourth Quarter 2019 Strategy Outlook: A "Show Me" Market
Residential investment finally looks as though it is turning the corner. Housing starts, building permits, and home sales have all picked up. Given the tight relationship between mortgage rates and homebuilding, construction activity should accelerate over the next few quarters (Chart 21). Low inventory and vacancy rates, rising household formation, and reasonable affordability all bode well for the housing market (Chart 22). Chart 20The Savings Rate Has (A Lot Of) Room To Drop, Judging From The Historical Relationship With Wealth
The Savings Rate Has (A Lot Of) Room To Drop, Judging From The Historical Relationship With Wealth
The Savings Rate Has (A Lot Of) Room To Drop, Judging From The Historical Relationship With Wealth
Chart 21U.S. Housing Will Rebound
U.S. Housing Will Rebound
U.S. Housing Will Rebound
Chart 22U.S. Housing: On A Solid Foundation
U.S. Housing: On A Solid Foundation
U.S. Housing: On A Solid Foundation
Chart 23U.S. Capex Plans Have Come Off Their Highs, But Are Nowhere Close to Recessionary Levels
U.S. Capex Plans Have Come Off Their Highs, But Are Nowhere Close to Recessionary Levels
U.S. Capex Plans Have Come Off Their Highs, But Are Nowhere Close to Recessionary Levels
In contrast to residential investment, business capex continues to be weighed down by the manufacturing recession, a strong dollar, and trade policy uncertainty. Core durable goods orders declined in August. Capex intention surveys have also weakened, although they remain well above recessionary levels (Chart 23). The ISM manufacturing index hit its lowest level since July 2009 in September. The internals of the report were not quite as bad as the headline. The new orders-to-inventories component, which leads the ISM by two months, moved back into positive territory. The weak ISM print also stands in contrast to the more upbeat Markit U.S. manufacturing PMI, which rose to its highest level since April. Statistically, the Markit PMI does a better job of tracking official measures of U.S. manufacturing output, factory orders, and employment than the ISM. Taking everything together, the U.S. economy is likely to see modestly stronger growth later this year, as the global manufacturing recession comes to an end, while strong consumer spending and an improving housing market bolster domestic demand. II. Financial Markets Global Asset Allocation Markets have entered a “show me” phase. Better economic data and meaningful progress on the trade negotiations will be necessary for stocks to move sustainably higher. As such, investors should maintain larger-than-normal cash positions for the time being to guard against downside risks. Chart 24Stocks Will Outperform Bonds If Growth Recovers
Stocks Will Outperform Bonds If Growth Recovers
Stocks Will Outperform Bonds If Growth Recovers
Fortunately, any pullback in risk asset prices is likely to be temporary. If trade tensions subside and global growth rebounds later this year, as we expect, stocks and spread product should handily outperform government bonds over a 12-month horizon (Chart 24). Admittedly, there are plenty of things that could upend this sanguine 12-month recommendation: Global growth could continue to deteriorate; the trade war could intensify; supply-side shocks could cause oil prices to spike up again; the U.K. could end up leaving the EU in a “hard Brexit” scenario; and last but not least, Elizabeth Warren or some other far-left candidate could end up becoming the next U.S. president. The key question for investors today is whether these risks have been fully discounted in financial markets. We think they have. Chart 25 shows our estimates for the global equity risk premium (ERP), calculated as the difference between the earnings yield and the real bond yield. Our calculations suggest that stocks still look quite cheap compared to bonds. Chart 25AEquity Risk Premia Remain Quite High (I)
Equity Risk Premia Remain Quite High (I)
Equity Risk Premia Remain Quite High (I)
Chart 25BEquity Risk Premia Remain Quite High (II)
Equity Risk Premia Remain Quite High (II)
Equity Risk Premia Remain Quite High (II)
One might protest that the ERP is high only because today’s ultra-low bond yields are reflecting very poor growth prospects. There is some truth to that claim, but not as much as one might think. While trend GDP growth has fallen in the U.S. over the past decade, bond yields have declined by even more. The gap between U.S. potential nominal GDP growth, as estimated by the Congressional Budget Office, and the 10-year Treasury yield is close to two percentage points, the highest since 1979 (Chart 26). Chart 26Bond Yields Have Fallen More Than Trend Nominal GDP Growth
Bond Yields Have Fallen More Than Trend Nominal GDP Growth
Bond Yields Have Fallen More Than Trend Nominal GDP Growth
At the global level, trend GDP growth has barely changed since 1980, largely because faster-growing emerging markets now make up a larger share of the global economy (Chart 27). For large multinational companies, global growth, rather than domestic growth, is the more relevant measure of economic momentum. Gauging Future Equity Returns A high ERP simply says that equities are attractive relative to bonds. To gauge the prospective return to stocks in absolute terms, one should look at the absolute level of valuations. Chart 27The Trend In Global Growth Has Remained Steady Thanks To Faster-Growing EM
chart 27
The Trend In Global Growth Has Remained Steady Thanks To Faster-Growing EM
The Trend In Global Growth Has Remained Steady Thanks To Faster-Growing EM
Chart 28S&P 500: All Of The Increase In Margins Has Occurred In The IT Sector
S&P 500: All Of The Increase In Margins Has Occurred In The IT Sector
S&P 500: All Of The Increase In Margins Has Occurred In The IT Sector
As we argued in a recent report entitled “TINA To The Rescue?,”2 the earnings yield can be used as a proxy for the expected real total return on equities. Empirically, the evidence seems to bear this out: Since 1950, the earnings yield on U.S. equities has averaged 6.7%, compared to a real total return of 7.2%. Today, the trailing and forward PE ratio for U.S. stocks stand at 21.1 and 17.4, respectively. Using a simple average of the two as a guide for future returns, U.S. stocks should deliver a long-term real total return of 5.2%. While this is below its historic average, it is still a fairly decent return. One might complain that this calculation overstates prospective equity returns because the U.S. earnings yield is temporarily inflated by abnormally high profit margins. The problem with this argument is that virtually all of the increase in S&P 500 margins has occurred in just one sector: technology. Outside of the tech sector, S&P 500 margins are not far from their historic average (Chart 28). If high IT margins reflect structural changes in the global economy – such as the emergence of “winner take all” companies that benefit from powerful network effects and monopolistic pricing power – they could remain elevated for the foreseeable future. Regional And Sector Equity Allocation The earnings yield is roughly two percentage points higher outside the U.S., suggesting that non-U.S. stocks will best their U.S. peers over the long haul. In the developed market space, Germany, Spain, and the U.K. appear especially cheap. In the EM realm, China, Korea, and Russia stand out as being very attractively priced (Chart 29). At the sector level, cyclical stocks look more appealing than defensives (Chart 30). Chart 29U.S. Stocks Appear Expensive Compared To Their Peers
Fourth Quarter 2019 Strategy Outlook: A "Show Me" Market
Fourth Quarter 2019 Strategy Outlook: A "Show Me" Market
Chart 31Economic Growth Drives Stocks Over A 12-Month Horizon
Economic Growth Drives Stocks Over A 12-Month Horizon
Economic Growth Drives Stocks Over A 12-Month Horizon
Chart 30Cyclical Stocks Are More Attractive Than Defensives
Cyclical Stocks Are More Attractive Than Defensives
Cyclical Stocks Are More Attractive Than Defensives
Chart 32EM And Euro Area Equities Usually Outperform When Global Growth Improves
EM And Euro Area Equities Usually Outperform When Global Growth Improves
EM And Euro Area Equities Usually Outperform When Global Growth Improves
Valuations are useful mainly as a guide to long-term returns. Over a horizon of say, 12 months, cyclical factors – i.e., what happens to growth, interest rates, and exchange rates – matter more (Chart 31). Fortunately, our cyclical views generally line up with our valuation assessment. Stronger global growth, a weaker dollar, and rising commodity prices should benefit cyclical stocks relative to defensives. To the extent that EM and European stock markets have more of a cyclical sector skew than U.S. stocks, the former should end up outperforming (Chart 32). We would put financials on our list of sectors to upgrade by year end once global growth begins to reaccelerate. Falling bond yields have hurt bank profits (Chart 33). The drag on net interest margins should recede as yields start rising. European banks, which currently trade at only 7.6 times forward earnings, 0.6 times book value, and sport a hefty dividend yield of 6.3%, could fare particularly well (Chart 34). Chart 33AHigher Bond Yields And Steeper Yield Curves Will Benefit Financials (I)
Higher Bond Yields And Steeper Yield Curves Will Benefit Financials (I)
Higher Bond Yields And Steeper Yield Curves Will Benefit Financials (I)
Chart 33BHigher Bond Yields And Steeper Yield Curves Will Benefit Financials (II)
Higher Bond Yields And Steeper Yield Curves Will Benefit Financials (II)
Higher Bond Yields And Steeper Yield Curves Will Benefit Financials (II)
As Chart 35 illustrates, a bet on financials is similar to a bet on value stocks. Growth has trounced value over the past 12 years, but a bit of respite for value is in order over the next 12-to-18 months. Chart 34European Banks Are Attractive
European Banks Are Attractive
European Banks Are Attractive
Chart 35Is Value Turning The Corner?
Is Value Turning The Corner?
Is Value Turning The Corner?
Fixed Income Chart 36AYields Should Rise On Stronger Growth (I)
Yields Should Rise On Stronger Growth (I)
Yields Should Rise On Stronger Growth (I)
Dovish central banks and, for the time being, still-subdued inflation will help keep government bond yields in check over the next 12 months. Nevertheless, yields will still rise from currently depressed levels on the back of stronger global growth (Chart 36). Chart 36BYields Should Rise On Stronger Growth (II)
Yields Should Rise On Stronger Growth (II)
Yields Should Rise On Stronger Growth (II)
Bond yields tend to rise or fall depending on whether central banks adjust rates by more or less than is anticipated (Chart 37). Investors currently expect the Fed to cut rates by another 80 basis points over the next 12 months. While we think the Fed will bring down rates by 25 basis points on October 30th, we do not anticipate any further cuts beyond then. The cumulative 75 basis points in cuts during this easing cycle will be equivalent to the amount of easing delivered during the two mid-cycle slowdowns in the 1990s (1995/96 and 1998). All told, the U.S. 10-year Treasury yield is likely to move back into the low 2% range by the middle of 2020. Chart 37AStronger Economic Growth Will Put Upward Pressure On Government Bond Yields (I)
Stronger Economic Growth Will Put Upward Pressure On Government Bond Yields (I)
Stronger Economic Growth Will Put Upward Pressure On Government Bond Yields (I)
Chart 36BStronger Economic Growth Will Put Upward Pressure On Government Bond Yields (II)
Stronger Economic Growth Will Put Upward Pressure On Government Bond Yields (II)
Stronger Economic Growth Will Put Upward Pressure On Government Bond Yields (II)
Chart 38U.S. Government Bond Yields Are More Procyclical Than Yields Abroad
U.S. Government Bond Yields Are More Procyclical Than Yields Abroad
U.S. Government Bond Yields Are More Procyclical Than Yields Abroad
Unlike U.S. equities, which tend to have a low beta compared to stocks abroad, U.S. bonds possess a high beta. This means that U.S. Treasury yields usually rise more than yields abroad when global bond yields, in aggregate, are increasing, and fall more than yields abroad when global bond yields are decreasing (Chart 38). Moreover, U.S. Treasurys currently yield less than other bond markets once currency-hedging costs are taken into account (Table 1). If U.S. yields were to rise more than those abroad over the next 12-to-18 months, this would further detract from Treasury returns. As a result, investors should underweight Treasurys within a global government bond portfolio. Stronger global growth should keep corporate credit spreads at bay. Lending standards for U.S. commercial and industrial loans have moved back into easing territory, which is usually bullish for corporate credit (Chart 39). According to our U.S. bond strategists, high-yield corporate spreads, and to a lesser extent, Baa-rated investment-grade spreads, are still wider than is justified by the economic fundamentals (Chart 40).3 Better-rated investment-grade bonds, in contrast, offer less relative value. Table 1Bond Markets Across The Developed World
Fourth Quarter 2019 Strategy Outlook: A "Show Me" Market
Fourth Quarter 2019 Strategy Outlook: A "Show Me" Market
Chart 39Easier Lending Standards Bode Well For Corporate Credit
Easier Lending Standards Bode Well For Corporate Credit
Easier Lending Standards Bode Well For Corporate Credit
Chart 40U.S. Corporates: Focus On Baa And High-Yield Credit
U.S. Corporates: Focus On Baa And High-Yield Credit
U.S. Corporates: Focus On Baa And High-Yield Credit
Looking beyond the next 18 months, there is a high probability that inflation will start to move materially higher. The unemployment rate across the G7 has fallen to a multi-decade low (Chart 41). The share of developed economies that have reached full employment has hit a new cycle high (Chart 42). For all the talk about how the Phillips curve is dead, wage growth has remained tightly correlated with labor market slack (Chart 43). Chart 41Unemployment Rates Keep Trending Lower
Unemployment Rates Keep Trending Lower
Unemployment Rates Keep Trending Lower
Chart 42Developed Markets: Full Employment Reaching New Cycle Highs
Developed Markets: Full Employment Reaching New Cycle Highs
Developed Markets: Full Employment Reaching New Cycle Highs
Chart 43The Phillips Curve Is Alive And Well
The Phillips Curve Is Alive And Well
The Phillips Curve Is Alive And Well
As wages continue to rise, prices will start to move up, potentially setting off a wage-price spiral. The Fed, and eventually other central banks, will have to start raising rates at that point. Once interest rates move into restrictive territory, equities will fall and credit spreads will widen. A global recession could ensue in 2022. Currencies And Commodities Chart 44The Dollar Is A Countercyclical Currency
The Dollar Is A Countercyclical Currency
The Dollar Is A Countercyclical Currency
The U.S. dollar is a countercyclical currency, meaning that it tends to move in the opposite direction of the global business cycle (Chart 44). We do not have a strong near-term view on the direction of the dollar at the moment, but expect the greenback to begin to weaken by year end as global growth starts to rebound. EUR/USD should increase to around 1.13 by mid-2020. GBP/USD will rise to 1.29. USD/CNY will move back to 7. USD/JPY is likely to be flat, reflecting the yen’s defensive nature and the drag on Japanese growth from the consumption tax hike. The trade-weighted dollar will continue to depreciate until late-2021, after which time a more aggressive Fed and a slowdown in global growth will cause the dollar to rally anew. During the period in which the dollar is weakening, commodity prices will move higher (Chart 45). Chart 45Dollar Weakness Is A Boon For Commodities
Dollar Weakness Is A Boon For Commodities
Dollar Weakness Is A Boon For Commodities
BCA’s commodity strategists are particularly bullish on oil over a 12-month horizon (Chart 46). They see Brent crude prices rising to $70/bbl by the end of this year and averaging $74/bbl in 2020 based on the expectation that stronger global growth and production discipline will drive down oil inventory levels. OPEC spare capacity – the difference between what the cartel is capable of producing and what it is actually producing – is currently below its historic average (Chart 47). Crude oil reserves have also been trending lower within the OECD. Saudi Arabia’s own reserves have fallen by over 40% since peaking in 2015 (Chart 48). Chart 46Supply Deficit To Continue
Supply Deficit To Continue
Supply Deficit To Continue
Chart 47Limited Availability Of Spare Capacity To Offset Outages
Fourth Quarter 2019 Strategy Outlook: A "Show Me" Market
Fourth Quarter 2019 Strategy Outlook: A "Show Me" Market
Chart 48Key Strategic Petroleum Reserves
Key Strategic Petroleum Reserves
Key Strategic Petroleum Reserves
Higher oil prices should benefit currencies such as the Canadian dollar, Norwegian krone, Russian ruble and Colombian peso. Finally, a few words on gold. We closed our long gold trade on August 29th for a 20-week gain of 20.5%. We still see gold as an excellent long-term hedge against higher inflation. In the near term, however, rising bond yields may take the wind out of gold’s sails, even if a weaker dollar does help bullion at the margin. We will reinitiate our long gold position towards the end of next year or in 2021 once inflation begins to break out. Peter Berezin, Chief Global Strategist Global Investment Strategy peterb@bcaresearch.com Footnotes 1Please see Global Investment Strategy Weekly Report, “Are High Debt Levels Deflationary Or Inflationary?” dated February 15, 2019. 2Please see Global Investment Strategy Special Report, “TINA To The Rescue?” dated August 23, 2019. 3Please see U.S. Bond Strategy Weekly Report, “Corporate Bond Investors Should Not Fight The Fed,” dated September 17, 2019. Strategy & Market Trends MacroQuant Model And Current Subjective Scores
Fourth Quarter 2019 Strategy Outlook: A "Show Me" Market
Fourth Quarter 2019 Strategy Outlook: A "Show Me" Market
Tactical Trades Strategic Recommendations Closed Trades
Analysis on Chile is available below. Highlights Major equity leadership rotations normally occur around bear markets or corrections. Hence, a major broad selloff will likely be a precondition for EM, commodities, global cyclicals and value stocks to commence outperforming. The odds that EM equities will underperform the S&P 500 or DM share prices in an equity drawdown are 65-70%. A weaker dollar is essential to EM outperformance. We remain bullish on the dollar and are underweight/short EM. Feature The current decade has been characterized by the substantial outperformance of growth versus value stocks, the S&P 500 versus emerging and other international markets. BCA held its annual conference in New York last week. One of the key topics that investors wanted to get a handle on was the potential for a leadership rotation in global equity markets. The current decade has been characterized by the substantial outperformance of growth versus value stocks, the S&P 500 versus emerging and other international markets, FAANG share prices versus commodities and “old economy” stocks. Is this trend about to reverse? Opinions among our conference speakers certainly differed. Some still showed a penchant for growth stocks and U.S. equities, while others recommended global value and EM stocks. Our Themes For The Decade Our key long-term themes – laid out in our June 8, 2010 Special Report titled How To Play Emerging Market Growth In The Coming Decade1 – have shaped our investment strategy over the past decade have been: Commodities and materials and energy equity sectors as well as machinery stocks will be in a bear market because Chinese capital spending has peaked. Hence, investors should avoid EMs that are very sensitive to resource prices. Favoring EM/Chinese consumer plays, namely technology as well as healthcare stocks in general and healthcare equipment stocks in particular, is the way to play China/EM growth this decade. Given tech and healthcare account for a smaller weighting in EM stock indexes than in DM ones, we have been recommending that investors underweight EM against DM stocks. Needless to say, these themes have panned out extremely well, with EM, resources, commodities-related and machinery equity sectors underperforming massively (Chart I-1), and tech, consumer and healthcare stocks outperforming (Chart I-2). These themes have guided our strategy over the past nine years, leading us to be underweight EM equities in favor of the S&P 500, which is heavily dominated by tech, consumer and healthcare companies. Chart I-1China Capex Plays Have Underperformed This Decade
China Capex Plays Have Underperformed This Decade
China Capex Plays Have Underperformed This Decade
Chart I-2Our Favorites For This Decade Have Outperformed
Our Favorites For This Decade Have Outperformed
Our Favorites For This Decade Have Outperformed
Any investment trend has a beginning and an end. It is essential not to overstay in winning strategies. Critically, Chart I-3 shows that the magnitude of the rise in FAANG stocks over the past 10 years is comparable to bubbles of previous decades. This chart compares asset prices in real (inflation-adjusted) U.S. dollar terms. Chart I-3FAANG And Previous Bubbles In Perspective
FAANG And Previous Bubbles In Perspective
FAANG And Previous Bubbles In Perspective
Only history will tell whether FAANGs are currently in a bubble or not. Presently, we do not have a high conviction view on this matter. However, even if they are not in a bubble, they are extremely overbought and expensive. Their failure to break above their 2018 highs is a negative technical signal. Altogether, this warrants a cautious stance on the absolute performance of FAANGs. Bottom Line: Regardless of the direction of FAANG stocks, odds are that EM share prices will relapse in absolute terms before a sustainable bottom emerges. For a detailed discussion on this, please refer to pages 6-9. In such a scenario, it is hard to envision FAANG stocks rallying. They may continue outperforming on a relative basis, but they will still deflate in absolute terms. Equity Rotations Occur Around Bear Markets The relative performance of global growth versus value stocks often experiences trend reversals during or after selloffs. With respect to equity leadership rotation, it is crucial to note that equity leadership rotations typically occur during or after bear markets and/or corrections in global share prices. Chart I-4 illustrates EM relative stock prices versus DM along with the global equity index. Over the past 25 years, there have been several major leadership changes between EM and DM – and all of them coincided with, or were preceded by, either a bear market or a correction in global share prices. Similarly, the relative performance of global growth versus value stocks often experiences trend reversals during or after selloffs (Chart I-5). Chart I-4EM Versus DM: Equity Rotations
EM Versus DM: Equity Rotations
EM Versus DM: Equity Rotations
Chart I-5Global Growth Versus Value: Leadership Rotations
Global Growth Versus Value: Leadership Rotations
Global Growth Versus Value: Leadership Rotations
Finally, structural trend changes in the relative performance of the global tech sector, energy stocks and materials have also occurred during or after drawdowns in global share prices (Chart I-6). Chart I-6Global Technology, Energy And Materials: Leadership Rotations
Global Technology, Energy And Materials: Leadership Rotations
Global Technology, Energy And Materials: Leadership Rotations
Bottom Line: Major equity leadership rotations normally occur around bear markets or corrections. Hence, a major selloff is likely before EM, commodities, global cyclicals and value stocks begin to outperform. We will contemplate changing our relative equity strategy if a major broad selloff transpires. In such an equity drawdown, there is a 30-35% chance that EM may outperform the S&P 500, as it did during the carnage in global stocks in the fourth quarter of last year. In short, the probability that EM share prices underperform the S&P 500 and DM is 65-70%. A weaker dollar is essential for EM outperformance. BCA’s Emerging Markets Strategy service remains bullish on the dollar and is underweight/short EM. A Breakdown In EM And Global Cyclicals? With China’s manufacturing PMI once again on the rise, it is critical to challenge our view on the Chinese business cycle as well as global manufacturing and trade. In our opinion, the latest rise in the mainland manufacturing PMI is an aberration rather than a new trend: Chinese share prices over the years have been coincident with or leading mainland manufacturing PMI. Stocks are currently pointing to a relapse in the latter (Chart I-7). The message from Chinese share prices is that the latest improvement in the nation’s manufacturing PMI should be faded. Chart I-7Chinese Share Prices And Manufacturing PMI
Chinese Share Prices And Manufacturing PMI
Chinese Share Prices And Manufacturing PMI
The global manufacturing recession is still spreading. The global manufacturing recession is still spreading. This has yet to be discounted in global cyclical equity sectors. The latter have been moving sideways over the past year and a half, despite the contraction in global manufacturing activity (Chart I-8). Equity investors’ patience may be wearing thin as the expected global manufacturing recovery has so far failed to materialize. Chart I-8Global Cyclical Stocks And Manufacturing PMI
bca.ems_wr_2019_10_03_s1_c8
bca.ems_wr_2019_10_03_s1_c8
Chart I-9EM EPS And Korean Exports: Moving In Tandem
EM EPS And Korean Exports: Moving In Tandem
EM EPS And Korean Exports: Moving In Tandem
Korean exports in September contracted at a rate close to 10% year-on-year (Chart I-9, top panel). Interestingly, the level of EM corporate earnings per share (EPS) in U.S. dollar terms exhibits a similar pattern with Korean exports (Chart I-9, bottom panel). Both are at the same level they were in 2010. Hence, over this decade EM EPS and Korean exports in U.S. dollar terms have not expanded at all. U.S. high-beta stocks in aggregate as well as share prices of high-beta industrials and technology stocks are close to breaking below their technical support lines (Chart I-10). They could be canaries in a coal mine for the S&P 500. Chart I-10U.S. High-Beta Stocks Are Breaking Down
U.S. High-Beta Stocks Are Breaking Down
U.S. High-Beta Stocks Are Breaking Down
Chart I-11A Bearish Signal For EM And Commodities
bca.ems_wr_2019_10_03_s1_c11
bca.ems_wr_2019_10_03_s1_c11
Despite a very weak U.S. manufacturing PMI, the dollar remains well bid. This signifies that the global manufacturing recession emanates from the rest of the world – not the U.S. In fact, the U.S. manufacturing sector has been the last domino to fall. Persistent strength in the greenback is a symptom of weakening global growth. Our Risk-On / Safe-Haven Currency ratio2 – which is agnostic to dollar trends – is plunging, corroborating the downbeat outlook for global growth in general and commodities prices in particular (Chart I-11). Finally, overall EM and Asian high-yield corporate credit spreads are widening versus investment grade ones. This is a sign of rising risk aversion. EM credit markets and local currency bonds have so far been reasonably resilient, despite the selloff in EM share prices and currencies (Chart I-12). The basis for such decoupling has been the indiscriminate search for yield rather than improving EM growth dynamics. Chart I-12EM Credit Markets Will Recouple To Downside With Stocks And Currencies
EM Credit Markets Will Recouple To Downside With Stocks And Currencies
EM Credit Markets Will Recouple To Downside With Stocks And Currencies
Deteriorating growth will eventually cause a widening of EM credit spreads. Besides, persistent EM currency depreciation will likely lead to outflows from EM high-yield local bond markets. Bottom Line: EM equities, credit markets and high-yielding local currency bonds are at risk of a major selloff. Our list of country allocations across various EM asset classes as well as our trades can always be found at the end of our reports, please refer to pages 14-15. We continue to recommend shorting the following basket of EM currencies versus the dollar: ZAR, CLP, COP, IDR, MYR, PHP and KRW. Arthur Budaghyan Chief Emerging Markets Strategist arthurb@bcaresearch.com Chile: Still Favor Bonds Over Stocks; Bet On Lower Inflation We have been betting on sluggish growth, lower interest rates and a weakening currency in Chile. These positions have panned out well as the economy has slowed considerably, local bond yields have plunged and the currency depreciated significantly (Chart II-1, top and middle panels). However, our overweight position in Chilean equities within a dedicated EM stock portfolio has performed poorly (Chart II-1, bottom panel). Is it time to reconsider our position? Chart II-1Our Strategy For Chile
Our Strategy For Chile
Our Strategy For Chile
Having re-examined the cyclical dynamics of this economy and putting it in the context of the global backdrop, we reiterate our investment recommendations. We also see a new investment opportunity within the Chilean fixed-income markets – investors should consider betting on lower inflation expectations, i.e., going long domestic bonds and shorting inflation-linked bonds. We believe the bond market’s medium-to long-term inflation expectations are overstated and will drop in the coming months. The Chilean economy will likely weaken further and inflation is set to drop considerably beyond the near term. Even though the central bank has already cut rates by 100 basis points, it will take both more easing and time before the credit impulse turns positive and lifts domestic demand. The credit impulse for businesses points to a relapse in capital spending (Chart II-2). The adopted fiscal stimulus has been negligible at 0.21% of GDP for 2019 and 2020. While government spending growth is bottoming, overall fiscal expenditures account for 20% of GDP. In brief, they are too small to make a major difference for the economy. Chart II-2Chile: Falling Credit Impulse = Weak Capex
Chile: Falling Credit Impulse = Weak Capex
Chile: Falling Credit Impulse = Weak Capex
With non-mining exports contracting and commodities prices plunging, the export sectors will continue to depress growth. Corporate profits are shrinking and this will dent capital spending and hiring. Critically, rising unit labor costs are depressing corporate profit margins (Chart II-3). The latter have spiked because the output slowdown has not yet been matched by layoffs or lower wage growth. In turn, forthcoming layoffs amid the already rising unemployment rate will certainly lead to considerable wage disinflation (Chart II-4). Chile has seen massive inflows of immigrants from Venezuela in recent years, which will prove to be a major disinflationary force for this economy in the medium-term. Finally, goods price inflation – which has stemmed from currency depreciation – could prevent consumer inflation from falling in the near term. Yet, this phenomena will not be sustainable beyond the near term. Chart II-3Shrinking Profits Will Lead Businesses To Reduce Unit Labor Costs
Shrinking Profits Will Lead Businesses To Reduce Unit Labor Costs
Shrinking Profits Will Lead Businesses To Reduce Unit Labor Costs
Chart II-4Wage Growth Is Unsustainably High
Wage Growth Is Unsustainably High
Wage Growth Is Unsustainably High
On the whole, the fixed-income market will look through currency depreciation-induced goods inflation and begin pricing in much lower inflation expectations. We recommend betting that 3-year inflation expectations will decline from 2.5% to 1.5% in the next 12 months (Chart II-5). We have been receiving 3-year swap rates since May 31st, 2018 and this position remains intact. The peso will continue to depreciate as copper prices fall further. Notably, the real effective exchange rate based on unit labor costs – computed by the OECD – suggests that the peso is still expensive (Chart II-6). The last datapoint is as of September 2019. This is probably due to depreciation in other Latin American currencies. Chart II-5Chile: Inflation Expectations To Plunge
Chile: Inflation Expectations To Plunge
Chile: Inflation Expectations To Plunge
Chart II-6The CLP Is Not Cheap
The CLP Is Not Cheap
The CLP Is Not Cheap
Finally, we are reluctant to downgrade the Chilean bourse within an EM equity portfolio. Policy easing and large underperformance as well as the positive structural outlook should produce a period of outperformance by this stock market amid the selloff in the overall EM equity universe. Local asset allocators should continue favoring bonds versus stocks. Bottom Line: As a new trade for fixed-income investors: We recommend going long 3-year domestic bonds and shorting 3-year inflation-linked bonds. Juan Egaña, Research Associate juane@bcaresearch.com Arthur Budaghyan Chief Emerging Markets Strategist arthurb@bcaresearch.com Footnotes 1 Please see Emerging Markets Strategy Special Report, “How To Play Emerging Market Growth In The Coming Decade”, dated June 8, 2010, available at ems.bcaresearch.com 2 Average of CAD, AUD, NZD, BRL, CLP & ZAR total return indices relative to average of JPY & CHF total returns (including carry). Equities Recommendations Currencies, Credit And Fixed-Income Recommendations