Global

Highlights Go short the DXY index with a target of 90 and a stop loss of 100. The top-performing G10 currencies in 2020 will be the NOK and SEK. Remain short USD/JPY as portfolio insurance. USD/JPY and the DXY are usually positively correlated. A weak dollar will lend support to gold prices. Gold will also benefit from abundant liquidity and persistently low/negative real rates. EUR/USD should touch 1.18, while GBP/USD will retest 1.40. There are abundant trade opportunities at the crosses. Our favorites are long AUD/NZD and short CAD/NOK. Feature The DXY index has been trading on the weaker side in recent months and is breaking below the upward-sloped channel in place since the middle of last year. In a nutshell, the performance of the dollar DXY index has been unimpressive for this year (Chart 1). The decisive break down represents an important fundamental shift, since the next level of support lies all the way towards the 90-92 zone. Given additional confirmation from a few of our indicators in recent weeks, we are selling the DXY at current levels, with a tight stop at 100. Chart 1A Report Card On Currency Performance
2020 Key Views: Top Trade Ideas
2020 Key Views: Top Trade Ideas
Green Shoots On Global Growth Frequent readers of our bulletin are well aware of the observation that the dollar is a countercyclical currency. As such, when global growth is rebounding, more cyclical economies benefit most from this growth dividend. This tends to weaken the dollar. Recent data confirms that this trend remains firmly intact. We expect continued improvement in both the ISM and global manufacturing PMI, but for now, the message is that the epicenter of the growth recovery is from outside the US. Chart 2Major Dollar Tailwinds Have Peaked
Major Dollar Tailwinds Have Peaked
Major Dollar Tailwinds Have Peaked
We expect continued improvement in both the ISM and global manufacturing PMI, but for now, the message is that the epicenter of the growth recovery is from outside the US (Chart 2). This has typically been synonymous with a lower dollar. In the euro area, the expectations components of the ZEW and Sentix surveys continue to outpace current conditions, which tends to lead European PMIs by about six months. It is becoming more and more evident that we will be out of a manufacturing recession in the euro area early next year (Chart 3). Chinese imports surprised to the upside for the month of November, in line with the message from easing in financial conditions (Chart 4). Should stimulus continue to be frontloaded into next year, this should continue to support global growth. The perk-up in copper prices is a good confirmatory signal. Chart 3A V-Shaped Recovery In European Manufacturing
A V-Shaped Recovery In European Manufacturing?
A V-Shaped Recovery In European Manufacturing?
Chart 4Chinese Growth Will Benefit From Stimulus
Chinese Imports Could Soon Rebound
Chinese Imports Could Soon Rebound
Japanese GDP saw a big upward revision for the third quarter, and a few leading indicators suggest nascent green shoots despite the October consumption tax hike. A new fiscal package was announced recently and should go a long way in boosting domestic demand (Chart 5). Chart 5Japanese Growth
The Story Of Japan In One Chart
The Story Of Japan In One Chart
Chart 6USD/SEK Has Peaked
USD/SEK Has Peaked
USD/SEK Has Peaked
The currencies of small, open economies such as the SEK and the NZD have started to stage meaningful reversals. These currencies are usually good at sensing shifts in the investment landscape, and our suspicion is that they were primary funding vehicles for long USD trades (Chart 6). The slowdown in the global economy has been driven by the manufacturing sector, so it is fair to assume that this is the part of the economy that is ripe for mean reversion. Not to mention, cyclical swings in most economies tend to be driven by manufacturing and exports rather than services. More specifically, the currencies that have borne the brunt of the manufacturing slowdown should also experience the quickest reversals. This is already being manifested in a very steep rise in their bond yields vis-à-vis those in the US (Chart 7A and 7B). For example, yields in Norway, Sweden, Switzerland and Japan have risen significantly versus those in the US since the bottom. Should the nascent pickup in global growth morph into a synchronized recovery, this will go a long way in further eroding the US’s yield advantage. Chart 7AInterest Differentials And Exchange Rates
Interest Differentials And Exchange Rates
Interest Differentials And Exchange Rates
Chart 7BInterest Differentials And Exchange Rates
Interest Differentials And Exchange Rates
Interest Differentials And Exchange Rates
The key risk to a bearish dollar view is a US-led global growth rebound, allowing the Federal Reserve to adopt a much more hawkish stance relative to other central banks. This would be an environment in which US inflation would also surprise to the upside. This is not our baseline view, especially following the dovish revisions of the Summary of Economic projections made by the Fed this week. Bottom Line: Given further confirmation from a swath of indicators, we are going short the DXY index at current levels with an initial target of 90 and a stop loss at 100. Go Long SEK Our highest-conviction views on currencies are being long the NOK and SEK. Our highest-conviction views on currencies are being long the NOK and SEK. This view has been in place for a few months via other crosses, but we are taking the leap today in putting these positions on versus the dollar. Less aggressive investors can still stick to NOK and SEK trades as the crosses. Chart 8Soft Data Is Much Worse
Soft Data Is Much Worse
Soft Data Is Much Worse
Of all the G10 currencies we follow, the Swedish krona is probably the most perplexing. The Riksbank is one of the few central banks to have raised rates this year, but the krona remains the weakest G10 currency. Admittedly, the performance of the Swedish manufacturing sector has been dismal, especially so in October (Chart 8). That said, the euro area, which has also experienced a deep manufacturing recession, has seen a better currency performance this year despite a more dovish European Central Bank. The big question for Sweden is whether the manufacturing sector is just in a volatile bottoming process, or about to contract much further. Domestically, retail sales were strong for the month of October and inflation is surprising to the upside. Exchange rates tend to be extremely fluid in discounting a wide swath of economic data, and in the case of Sweden, in discounting the outcome for global growth. This suggests that the quick reversals in the EUR/SEK and USD/SEK – from levels close to or above their 2008 highs – means that it will take anything but a deep recession to justify a weaker krona. Bottom Line: In terms of SEK trading strategy, short USD/SEK and short NZD/SEK are good bets, since the SEK has a higher beta to global growth than the US dollar and the kiwi (Sweden exports 45% of its GDP versus 27% for New Zealand). However, an additional trade suggestion is to go short EUR/SEK for Europe-centric investors. Go Long NOK As Well Chart 9Opportunity Or Regime Shift?
Opportunity Or Regime Shift?
Opportunity Or Regime Shift?
Since the middle of the last decade, another perplexing disconnect has been the divergence between the price of oil and the performance of petrocurrencies. From the 2016 bottom, oil prices have more than doubled, but the petrocurrency basket has massively underperformed versus the US dollar (Chart 9). We agree with our commodity strategists that the outlook for oil prices is to the upside. Oil demand tends to follow the ebbs and flows of the business cycle, with demand having slowed sharply on the back of a manufacturing recession. Transport constitutes the largest share of global petroleum demand. A manufacturing pickup will therefore boost oil demand. Rising oil prices are bullish for petrocurrencies but being long versus the US dollar is no longer an appropriate strategy. This is because the landscape for oil production is rapidly shifting, with the US shale revolution grabbing market share from both OPEC and non-OPEC members. In 2010, only about 6% of global crude output came from the US. Fast forward to today and the US produces almost 15% of global crude, having grabbed market share from many other countries. In short, as the now-largest oil producer in the world, the US dollar is itself becoming a petrocurrency (Chart 10). Chart 10US Has Grabbed Oil Production Market Share
US Has Grabbed Oil Production Market Share
US Has Grabbed Oil Production Market Share
Chart 11Buy Oil Producers Versus Oil Consumers
Buy Oil Producers Versus Oil Consumers
Buy Oil Producers Versus Oil Consumers
The strategy going forward will be twofold. First, buying a petrocurrency basket versus the dollar will require perfect timing in the dollar down leg. The second strategy is to be long a basket of oil producers versus oil consumers. Chart 11 shows that a currency basket of oil producers versus consumers has had both a strong positive correlation with the oil price and has outperformed a traditional petrocurrency basket. Our recommendation is that NOK long positions should be played both via selling the CAD and USD (Chart 12). The discount between Western Canadian Select crude oil and Brent has also widened, which has historically heralded a lower CAD/NOK exchange rate (Chart 13). We are also long the NOK/SEK, given our belief that interest rate differentials and momentum will favor this cross over the next three months. Chart 12CAD/NOK And DXY
CAD/NOK And DXY
CAD/NOK And DXY
Chart 13NOK Will Outperform CAD
NOK Will Outperform CAD
NOK Will Outperform CAD
Bottom Line: Remain short CAD/NOK for a trade, but more aggressive investors should begin accumulating long NOK positions versus the US dollar outright. The Yen As Portfolio Insurance Chart 14Short USD/JPY: A Contrarian Bet
Short USD/JPY: A Contrarian Bet
Short USD/JPY: A Contrarian Bet
The yen tends to underperform at the crosses as global growth rebounds but still outperform versus the dollar, at least, until the Bank of Japan is forced to act (Chart 14). This places short USD/JPY bets in an enviable “heads I win, tails I do not lose too much,” position. Economic data from Japan over the past few weeks suggests the economy is weakening, but not fully succumbing to pressures of weak external growth and the consumption tax hike. The labor market remains relatively tight, and Tokyo office vacancies are hitting post-crisis lows, suggesting the demand for labor remains tight. The final print of third-quarter GDP growth rose to 1.8%. Wages are inflecting higher as well. The new fiscal spending package is likely to lend support to these trends. What these developments suggest is that the BoJ is likely to stand pat in the interim, a course of action that will eventually reignite deflationary pressures in Japan (Chart 15). A return towards falling prices will eventually force the BoJ’s hand, but might see a knee-jerk rise in the yen before. Total annual asset purchases by the BoJ are currently a far cry from the central bank’s soft target of ¥80 trillion, and unlikely to change anytime soon (Chart 16). Chart 15What More Could The BoJ Do?
What More Could The BoJ Do?
What More Could The BoJ Do?
Chart 16Stealth Tapering By The BoJ
Stealth Tapering By The BoJ
Stealth Tapering By The BoJ
It is important to remember why deflation is so pervasive in Japan, making the BoJ’s target of 2% a bit of a pipedream if it stands pat. The overarching theme for prices in Japan is a rapidly falling (and rapidly ageing) population, leading to deficient demand (Chart 17). Meanwhile, domestically, an aging population (that tends to be the growing voting base), prefers falling prices. What is needed is to convince the younger population to save less and consume more, but that is difficult when high debt levels lead to insecurity about the social safety net. On the other side of the coin, the importance of financial stability to the credit intermediation process has been a recurring theme among Japanese policymakers, with the health of the banking sector an important pillar. YCC and negative interest rates have been anathema for Japanese net interest margins and share prices (Chart 18). Any policy shift that is increasingly negative for banks could easily tip them over. This suggests the shock needed for the BoJ to act may be greater than history. Chart 172% Inflation = Mission Impossible?
2% Inflation = Mission Impossible?
2% Inflation = Mission Impossible?
Chart 18Negative Rates Are Anathema To Banks
Negative Rates Are Anathema To Banks
Negative Rates Are Anathema To Banks
We believe global growth is bottoming, but the traditional yen/equity correlation can also shift. Inflows into Japan could accelerate, given cheap equity valuations and improved corporate governance that has been lifting the relative return on capital. The propensity of investors to hedge these purchases will be less if the dollar is in a broad-based decline. Bottom Line: An external shock could tip the Japanese economy back into deflation. The risk is that if the dollar falls, the yen remains flat to lower in the interim. Given cheap valuations and a lack of ammunition by the BoJ, our view is that it is a low cost for portfolio insurance. EUR/USD As The Anti-Dollar Our near-term target for EUR/USD is 1.18. This level will retest the downward sloping trendline in place since the Great Financial Crisis (Chart 19). Chart 20 plots the relative growth performance of the euro area versus the US, superimposed with the exchange rate. The result is very evident: The collapse in the euro since the financial crisis has been driven by falling growth differentials between the Eurozone and the US. There is little the central bank can do about deteriorating demographic trends, but it can at the margin stem falling productivity. One of its levers is to lower the cost of capital in the entire Eurozone, such that it makes sense even for the less productive peripheral countries to borrow and invest. Chart 19EUR/USD
EUR/USD
EUR/USD
Chart 20Structural Slowdown In European Growth
Structural Slowdown In European Growth
Structural Slowdown In European Growth
Importantly, yields across the periphery are rapidly converging towards those in Germany, solving a critical dilemma that has long plagued the Eurozone in general and the euro in particular. In simple terms, ECB policy has historically always been too easy for some member countries while too stimulative for others. This has traditionally led to internal friction for the currency. However, with 10-year government bond yields in France, Spain and even Portugal now close to the neutral rate of interest for the entire Eurozone, this dilemma is slowly fading. Labor market reforms in Mediterranean Europe have seen unit labor costs in Greece, Ireland, Portugal and Spain collectively contract by almost 10%. This has effectively eliminated the competitiveness gap that had accumulated over the past two decades. Italy remains saddled with a rigid and less productive workforce, but overall adjustments have still come a long way to closing a key fissure plaguing the common currency area. Earnings estimates for euro zone equities versus the US are rising. This tends to firmly lead the euro by about nine to 12 months, suggesting we are due for a pop in the coming quarters. Chart 21Relative R-Star* In The Eurozone Could Rebound
Relative R-Star* In The Eurozone Could Rebound
Relative R-Star* In The Eurozone Could Rebound
The bottom line is that the various forces that may have been keeping the neutral rate of interest artificially low in the euro area are ebbing. The proverbial saying is that a chain is only as strong as its weakest link. This means that if the forces pressuring equilibrium rates in the periphery are slowly dissipating, this should lift the neutral rate of interest in the entire euro zone. Over a cyclical horizon, this should be bullish for the euro (Chart 21). Bottom Line: European equities, especially those in the periphery, remain unloved, given they are trading at some of the cheapest cyclically adjusted price-to-earnings multiples in the developed world. Earnings estimates for euro zone equities versus the US are rising. This tends to firmly lead the euro by about nine to 12 months, suggesting we are due for a pop in the coming quarters (Chart 22). Chart 22The Euro Might Soon Pop
The Euro Might Soon Pop
The Euro Might Soon Pop
Concluding Thoughts Being long Treasurys and the dollar has been a consensus trade for many years now (Chart 23). According to CFTC data, this has been expressed mostly through the aussie and kiwi, although our bias is that the Swedish krona and Norwegian krone have been the real victims. Chart 23Unfavorable Dollar Technicals
Unfavorable Dollar Technicals
Unfavorable Dollar Technicals
Chart 24The US Dollar Is Overvalued
The US Dollar Is Overvalued
The US Dollar Is Overvalued
Various models have shown valuation to be a very poor tool for managing currencies, but an excellent one at extremes (Chart 24). The results show the US dollar as overvalued, especially versus the Swedish krona, Japanese yen and Norwegian krone. Commodity currencies are closer to fair value, and within the safe-haven complex the Japanese yen is more attractive than the Swiss franc. The euro is less undervalued than implied by the overvaluation in the DXY index. Finally, we are keeping our long GBP/JPY position for now, but with a new target of 155, and tightening the stop to 145 (near our initial target). Inflows into the UK should improve given more clarity from the political overhang, which can lead to an overshoot in the cross. Reviving global growth will also benefit inflows into sterling assets. On a tactical basis however, EUR/GBP is ripe for mean revision given oversold conditions. Chester Ntonifor Foreign Exchange Strategist chestern@bcaresearch.com Forecast Summary Core Portfolio Tactical Trades Limit Orders Closed Trades
Dear Client, In lieu of our regular report next week, I will be hosting a webcast on Wednesday, December 18th at 10:00 AM EST, where I will discuss the major investment themes and views I see playing out for 2020. This will be the last Global Investment Strategy report of 2019, with publication resuming early next year. On behalf of the entire Global Investment Strategy team, I would like to wish you a Merry Christmas, Happy Holidays, and a Healthy New Year! Best regards, Peter Berezin, Chief Global Strategist Overall Investment Strategy: Global growth should accelerate in 2020. Favor stocks over bonds. A more defensive stance will be appropriate starting in late 2021. Equities: Upgrade non-US equities to overweight at the expense of their US peers. Cyclical stocks, including financials, will outperform defensives. Fixed Income: Central banks will stay dovish, but bond yields will nevertheless rise modestly thanks to stronger global growth. Favor high-yield corporate credit over investment grade and sovereigns. Currencies: The US dollar will weaken in 2020 against EUR, GBP, CAD, AUD, and most EM currencies. The dollar will be flat against the yen and the Swiss franc. Commodities: Oil and industrial metals prices will move higher. Gold prices will be range-bound next year, but should rally in 2021 once inflation finally breaks out. GIS View Matrix
Strategy Outlook – 2020 Key Views: Full Speed Ahead
Strategy Outlook – 2020 Key Views: Full Speed Ahead
I. Global Macro Outlook Stronger Global Growth Ahead We turned bullish on global equities last December after temporarily moving to the sidelines in the summer of 2018. Last month, we increased our procyclical bias by upgrading non-US stocks within our recommended equity allocation at the expense of their US peers. The decision to upgrade non-US equities stems from our expectation that global growth will strengthen in 2020. Global financial conditions have eased sharply this year, largely due to the dovish pivot by many central banks. Monetary policy affects the economy with a lag. This is one reason why the net number of central banks cutting rates has historically led global growth by about 6-to-9 months (Chart 1). Chart 1The Effects Of Easing Monetary Policy Should Soon Trickle Down To The Economy
The Effects Of Easing Monetary Policy Should Soon Trickle Down To The Economy
The Effects Of Easing Monetary Policy Should Soon Trickle Down To The Economy
In addition, there is mounting evidence that the global manufacturing cycle is bottoming out (Chart 2). The “official” Chinese PMI produced by the National Bureau of Statistics rose above 50 in November for the first time since May. The private sector Caixin manufacturing PMI has been improving for five consecutive months. The euro area manufacturing PMI increased over the prior month, led by gains in Germany and France. Chart 2A Fairly Regular Three-Year Manufacturing Cycle
A Fairly Regular Three-Year Manufacturing Cycle
A Fairly Regular Three-Year Manufacturing Cycle
Chart 3The Auto Sector Is Showing Signs Of Life (I)
The Auto Sector Is Showing Signs Of Life (I)
The Auto Sector Is Showing Signs Of Life (I)
The PMI data for the US has been mixed. The ISM manufacturing index weakened in November. In contrast, the Markit PMI rose to a seven-month high. Despite its shorter history, we tend to give the Markit PMI more credence. It is based on a larger sample of companies and has sector weights that closely match the actual composition of US output. As such, the Markit PMI is better correlated with hard data on manufacturing production, employment, and factory orders. The auto sector has been particularly hard hit during this manufacturing downturn. Fortunately, the industry is showing signs of life. The Markit euro area auto sector PMI has rebounded, with the new orders-to-inventory ratio moving back into positive territory for the first time since the autumn of 2018. US banks stopped tightening lending standards for auto loans in the third quarter. They are also reporting stronger demand for vehicle financing (Chart 3). In China, vehicle production and sales are improving on a rate-of-change basis (Chart 4). Both automobile ownership and vehicle sales in China are still a fraction of what they are in most other economies, suggesting further upside for sales (Chart 5). Chart 4The Auto Sector Is Showing Signs Of Life (II)
The Auto Sector Is Showing Signs Of Life (II)
The Auto Sector Is Showing Signs Of Life (II)
Chart 5China: Structural Outlook For Autos Is Bright
China: Structural Outlook For Autos Is Bright
China: Structural Outlook For Autos Is Bright
Trade War Uncertainty The trade war remains the biggest risk to our sanguine view on global growth. As we go to press, rumors are swirling that the US and China have reached a “Phase One” trade deal that would cancel the scheduled December 15th tariff hike and roll back as much as half of the existing tariffs. If this were to occur, it would be consistent with our expectation of a trade truce. Nevertheless, it is impossible to be certain about how things will unfold from here. The best we can do is think through the incentives that both sides face and assume they will act in their own self-interest. For President Trump, the key priority is to get re-elected next year. Trump generally gets poor grades from voters on most issues. The one exception is the economy. Rightly or wrongly, the majority of voters approve of his handling of the economy (Chart 6). An escalation of the trade war would hurt the US economy, especially in a number of Midwestern states that Trump needs to win to remain president (Chart 7). Chart 6Trump Gets Reasonably High Marks On His Handling Of The Economy, But Not Much Else
Strategy Outlook – 2020 Key Views: Full Speed Ahead
Strategy Outlook – 2020 Key Views: Full Speed Ahead
Chart 7Economic Health Of The US Midwest Matters For Trump
Economic Health Of The US Midwest Matters For Trump
Economic Health Of The US Midwest Matters For Trump
A resurgence in the trade war would also hurt Trump’s credibility. The point of the tariffs was not simply to raise revenue; it was to get China to the negotiating table. As a self-described master negotiator, President Trump now has to produce a “great” deal for the American people. If he had finalized an agreement with China a year or two ago, he would currently be on the hook for showing that it resulted in a smaller trade deficit. But with the presidential election only a year away, he can semi-credibly claim that the trade balance will only improve after he is re-elected. For their part, the Chinese would rather grapple with Trump now than face him after the election when he will no longer be constrained by re-election pressures. China would also like to avoid facing someone like Elizabeth Warren or Bernie Sanders, who may insist on including stringent environmental and human rights provisions in any trade deal. At least with Trump, the Chinese know that they are getting someone who is focused on commercial issues. Contrary to most media reports, there is a fair amount of overlap between what Trump wants and what the Chinese themselves would like to achieve. For example, as China has moved up the technological ladder, many Chinese companies have begun to complain about intellectual theft by their domestic rivals. Thus, strengthening intellectual property protection has become a priority for Chinese officials. Along the same vein, China aspires to transform the RMB into a reserve currency. A country cannot have a reserve currency unless it also has an open capital account. Hence, financial market liberalization must be part of China’s long-term reform strategy. These mutual interests between the US and China could provide the basis for a trade truce. The Changing Nature Of Chinese Stimulus Chart 8China: Credit Growth Is Only A Few Percentage Points Above Nominal GDP Growth
China: Credit Growth Is Only A Few Percentage Points Above Nominal GDP Growth
China: Credit Growth Is Only A Few Percentage Points Above Nominal GDP Growth
If a détente in the trade war is reached, will this prompt China to go back to its deleveraging campaign? We do not think so. For one thing, there can be no assurance that a trade truce will last. Thus, China will want to maintain enough stimulus as an insurance policy. In addition, credit growth is currently running only a few percentage points above nominal GDP growth (Chart 8). With the ratio of credit-to-GDP barely rising, there is little need to bring credit growth down much from current levels. This does not mean that the Chinese authorities will allow credit growth to increase significantly further. Instead, the authorities will continue shifting the composition of credit growth from the riskier shadow banking sector to the safer formal banking sector, while increasingly leaning on fiscal policy to buttress growth. One of the developments that has gone largely unnoticed by investors this year is that China’s general government deficit has climbed from around 3% of GDP in mid-2018 to 6.5% of GDP at present (Chart 9). Some of this stimulus has been used to finance tax cuts for households. Some of it has also been used to finance infrastructure spending, which requires imports of raw materials and capital goods. As a result of this fiscal easing, the combined Chinese credit/fiscal impulse has risen to a two-year high. It leads global growth by about nine months (Chart 10). Chart 9China Has Been Stimulating, Fiscally
China Has Been Stimulating, Fiscally
China Has Been Stimulating, Fiscally
Chart 10Chinese Stimulus Should Boost Global Growth
Chinese Stimulus Should Boost Global Growth
Chinese Stimulus Should Boost Global Growth
Europe On The Upswing Chart 11Euro Area Growth: The Good, The Bad, And The Ugly
Euro Area Growth: The Good, The Bad, And The Ugly
Euro Area Growth: The Good, The Bad, And The Ugly
Chart 12German Economy: Some Green Shoots
German Economy: Some Green Shoots
German Economy: Some Green Shoots
The weakness in euro area growth this year has been concentrated in Germany and Italy. France and Spain have actually grown at a trend-like pace (Chart 11). Germany should benefit from stronger global growth and a recovery in automobile production next year. The recent rebound in the German PMI, as well as improvements in the expectations components of the IFO, ZEW, and Sentix surveys are all encouraging in this regard (Chart 12). Italy should also gain from an easing in financial conditions and receding political risks (Chart 13). The Italian 10-year government bond yield has fallen from a high of 3.69% in October 2018 to 1.23% at present. Chart 13Easing Financial Conditions And Less Political Uncertainty Will Help Italy
Easing Financial Conditions And Less Political Uncertainty Will Help Italy
Easing Financial Conditions And Less Political Uncertainty Will Help Italy
Chart 14Euro Area Fiscal Thrust
Euro Area Fiscal Thrust
Euro Area Fiscal Thrust
Fiscal policy across the euro area is also turning more stimulative. The fiscal thrust in the euro area rose to 0.4% of GDP this year mainly due to a somewhat larger budget deficit in France (Chart 14). The thrust should remain positive in 2020. Even in Germany, fiscal policy should loosen. Faster wage growth in Germany is eroding competitiveness relative to the rest of the euro area (Chart 15). That could force German policymakers to ratchet up fiscal stimulus in order to support demand. Already, the Social Democrats are responding to poor electoral performance by adopting a more proactive fiscal policy, hoping to stop the loss of votes to the big spending Greens. Chart 15Germany: Faster Wage Growth Eroding Competitiveness Relative To The Rest Of The Euro Area
Germany: Faster Wage Growth Eroding Competitiveness Relative To The Rest Of The Euro Area
Germany: Faster Wage Growth Eroding Competitiveness Relative To The Rest Of The Euro Area
Chart 16Boris Johnson Won't Pursue A No-Deal Brexit
Boris Johnson Won't Pursue A No-Deal Brexit
Boris Johnson Won't Pursue A No-Deal Brexit
The UK economy should start to recover next year as Brexit uncertainty fades and fiscal policy turns more stimulative. Exit polls suggest that the Conservatives will command a majority government following today's election. There is not enough appetite within the Conservative party for a no-deal Brexit (Chart 16). As such, today's victory will allow Prime Minister Boris Johnson to push his proposed deal through Parliament. It will also allow him to fulfill his pledge to pass a budget that boosts spending. Japan: Own Goal Japan has been hard hit by the global growth slowdown, given its close ties to its Asian neighbors, namely China. Add on a completely unnecessary consumption tax hike, and it is no wonder the economy has been faltering. Despite widespread weakness, there have been some very preliminary signs of improvement of late: The manufacturing PMI ticked up in November, while the services PMI rose back above 50. Consumer confidence also moved up to the highest level since June. Furthermore, Prime Minister Abe announced a multi-year fiscal package worth approximately 26 trillion yen. The headline number grossly overstates the size of the stimulus because it includes previously announced measures as well as items such as land acquisition costs that will not directly benefit GDP. Nevertheless, the package should still boost growth by about 0.5% next year, offsetting part of the drag from higher consumption taxes. US: Chugging Along Despite the slowdown in global growth, a stronger dollar, and the trade war, US real final demand is on track to grow by 2.5% this year (Chart 17). This is above the pace of potential GDP growth of 1.7%-to-2%. Chart 17Underlying US Growth Remains Above Trend
Strategy Outlook – 2020 Key Views: Full Speed Ahead
Strategy Outlook – 2020 Key Views: Full Speed Ahead
The Fed’s 75 basis points of rate cuts has moved monetary policy even further into accommodative territory. Not surprisingly, residential housing – the most interest rate-sensitive part of the economy – has responded favorably (Chart 18). While the tailwind from lower mortgage rates will dissipate by next summer, we do not anticipate much weakness in the housing market. This is because the inventory levels and vacancy rates remain near record-low levels (Chart 19). The shortage of homes should buttress both construction and prices. Chart 18US Housing: On Solid Ground (I)
US Housing: On Solid Ground (I)
US Housing: On Solid Ground (I)
Chart 19US Housing: On Solid Ground (II)
US Housing: On Solid Ground (II)
US Housing: On Solid Ground (II)
Strong labor and housing markets will support consumer spending, which represents nearly 70% of the economy. Business capital spending should also benefit from lower rates, receding trade tensions, and rising wages which are making firms increasingly eager to automate. II. Financial Markets Global Asset Allocation We argued in the section above that global growth should rebound next year thanks to easier financial conditions, an upturn in the global manufacturing cycle, a detente in the trade war, and modest Chinese stimulus. Chart 20 shows that stocks usually outperform bonds when global growth is accelerating. This occurs partly because corporate earnings tend to rise when growth picks up. BCA’s US equity strategy team expects S&P 500 EPS to increase by 5% next year if global growth merely stabilizes. An acceleration in global growth would surely lead to even stronger earnings growth. On the flipside, investors also tend to price out rate cuts (or price in rate hikes) when growth is on the upswing, resulting in lower bond prices (Chart 21). Chart 20Stocks Usually Outperform Bonds When Global Growth Is Accelerating
Stocks Usually Outperform Bonds When Global Growth Is Accelerating
Stocks Usually Outperform Bonds When Global Growth Is Accelerating
Chart 21Improving Global Growth Boosts Earnings Growth...And Expectations Of Rate Hikes
Improving Global Growth Boosts Earnings Growth...And Expectations Of Rate Hikes
Improving Global Growth Boosts Earnings Growth...And Expectations Of Rate Hikes
Relative valuations also favor stocks over bonds. Despite the stock market rally this year, the MSCI All-Country World Index currently trades at a reasonable 15.8-times forward earnings. This is below the forward PE ratio of 16.7 reached in January 2018 and even below the forward PE ratio of 16.4 hit in May 2015. Analysts expect global EPS to increase by 10% next year, below the historic 12-month expectation of 15% (Chart 22). In contrast to most years when analyst forecasts prove to be wildly overoptimistic, the current EPS forecast is likely to be met. Chart 22Analyst Expectations Are Not Wildly Optimistic
Analyst Expectations Are Not Wildly Optimistic
Analyst Expectations Are Not Wildly Optimistic
Chart 23Equity Risk Premium Remains Quite Elevated
Equity Risk Premium Remains Quite Elevated
Equity Risk Premium Remains Quite Elevated
If one inverts the PE ratio, one can calculate an earnings yield for global equities of 6.3%. One can then calculate the implied equity risk premium (ERP) by subtracting the real long-term bond yield from the earnings yield. As Chart 23 illustrates, the ERP remains quite elevated by historic standards. Some observers might protest that the ERP is elevated mainly because bond yields are so low. If low bond yields are discounting very poor economic growth prospects, perhaps today’s PE ratio should be lower than it actually is? The problem with this argument is that growth prospects are not so bad. The IMF estimates that global growth will be slightly above its post-1980 average over the next five years (Chart 24). While trend growth is falling in both developed and emerging economies, the rising share of faster-growing emerging markets in global GDP is helping to prop up overall growth. Chart 24The Trend In Global Growth Has Remained Steady Thanks To Faster-Growing EM
The Trend In Global Growth Has Remained Steady Thanks To Faster-Growing EM
The Trend In Global Growth Has Remained Steady Thanks To Faster-Growing EM
Sector And Regional Equity Allocation US stocks have outperformed their overseas peers by 10% year-to-date and by 137% since 2008. About half of the outperformance of US equities since the Great Recession was due to faster sales-per-share growth, a third was due to stronger margin growth, and the rest was due to relative PE expansion (Chart 25). Chart 25Faster Sales Growth, Rising Margins, And Relative PE Expansion Helped Drive US Outperformance Over The Past Decade
Strategy Outlook – 2020 Key Views: Full Speed Ahead
Strategy Outlook – 2020 Key Views: Full Speed Ahead
It is worth noting that the outperformance of US stocks is a fairly recent phenomenon. Between 1970 and 2008, European equity prices and EPS actually rose slightly faster than in the US (Chart 26). EM stocks also outperformed the US in the decade leading up to the Global Financial Crisis. Chart 26US Earnings Have Not Always Outpaced Their Peers
US Earnings Have Not Always Outpaced Their Peers
US Earnings Have Not Always Outpaced Their Peers
We expect US stocks to rise in 2020 by about 5%-to-10%, but to lag their foreign peers in common-currency terms. There are four reasons for this: Sector skews favor non-US equities. Cyclical stocks tend to outperform defensives when global growth is strengthening and the US dollar is weakening (Chart 27). Cyclical sectors are overrepresented outside the US. We would include financials in our definition of cyclicals. Faster global growth next year will lift long-term bond yields. Since central banks are unlikely to raise rates, yield curves will steepen. Steeper yield curves will boost net interest margins, thus helping bank shares (Chart 28). European banks are more dependent on the spread between lending and borrowing rates than US banks, since the latter derive more of their profits from fees. Non-US stocks are quite a bit cheaper than their US peers. The forward PE for US equities currently stands at 18.1, well above the forward PE of 13.6 for non-US equities. Other valuation measures reveal an even bigger premium on US stocks (Chart 29). Differences in sector weights account for about a quarter of the valuation gap between the US and the rest of the world. The rest of the gap is due to cheaper valuations within sectors. Financials, for example, are notably less expensive in the rest of the world, particularly in Europe (Chart 30). The valuation gap between the US and the rest of the world is even starker if we compare earnings yields with bond yields. Since bond yields are lower outside the US, the implied equity risk premium is significantly higher for non-US stocks. Profit margins have less scope to rise in the US than in the rest of the world. According to MSCI data, net operating margins currently stand at 10.3% in the US compared to 7.9% abroad. Unlike in the US, margins in Europe and EM are still well below their pre-recession peaks (Chart 31). While US margins are unlikely to fall next year thanks to stronger global growth, rising wage growth will negatively impact profits in some labor-intensive industries. Labor slack is generally greater abroad, which should limit cost pressures. Uncertainty over the US election is likely to limit the gains to US equities. All of the Democratic frontrunners have pledged to roll back the 2017 Tax Cuts and Jobs Act to one degree or another. A full repeal of the Act would reduce S&P 500 EPS by about 10%. While such a dramatic move is far from guaranteed – for starters, it would require that the Democrats gain control of both the White House and the Senate – it does pose a risk to investors. The same goes for increased regulatory actions, which Senators Sanders and Warren have both vocally championed. Chart 27Cyclicals Do Well Versus Defensives When Global Growth Is Strengthening And The US Dollar Is Weakening
Cyclicals Do Well Versus Defensives When Global Growth Is Strengthening And The US Dollar Is Weakening
Cyclicals Do Well Versus Defensives When Global Growth Is Strengthening And The US Dollar Is Weakening
Chart 28Steeper Yield Curves Help Financials
Steeper Yield Curves Help Financials
Steeper Yield Curves Help Financials
Chart 29US Equities Are More Expensive Than Stocks Abroad
US Equities Are More Expensive Than Stocks Abroad
US Equities Are More Expensive Than Stocks Abroad
Chart 30European Financials Trade At A Substantial Discount To Their US Peers
European Financials Trade At A Substantial Discount To Their US Peers
European Financials Trade At A Substantial Discount To Their US Peers
Chart 31Profit Margins Have Less Scope To Rise In The US Than In The Rest Of The World
Profit Margins Have Less Scope To Rise In The US Than In The Rest Of The World
Profit Margins Have Less Scope To Rise In The US Than In The Rest Of The World
Within the non-US universe, euro area stocks have the most upside potential. In contrast, we see less scope for Japanese stocks to outperform the global benchmark because of uncertainties over the impact of the consumption tax hike on domestic demand. In addition, a weaker trade-weighted yen next year will annul the currency translation gains that unhedged equity investors can expect to receive from other non-US stock markets. Lastly, the passage of a new investment law that requires investors wishing to “influence management” to receive prior government approval could cast a pall over recent efforts to improve corporate governance in Japan. Fixed Income Chart 32Inflation Excluding Shelter Has Been Muted
Inflation Excluding Shelter Has Been Muted
Inflation Excluding Shelter Has Been Muted
Chart 33Long-Term Bond Yields Will Move Higher As Faster Growth Pushes Up Estimates Of The Neutral Rate
Long-Term Bond Yields Will Move Higher As Faster Growth Pushes Up Estimates Of The Neutral Rate
Long-Term Bond Yields Will Move Higher As Faster Growth Pushes Up Estimates Of The Neutral Rate
Central banks will remain on the sidelines next year. Inflation is still running well below target in most economies. Even in the US, where slack has largely been absorbed and wage growth has risen, core inflation excluding housing has averaged only 1.2% over the past five years (Chart 32). Nevertheless, long-term bond yields will still move higher next year as investors revise up their estimate of the neutral rate in response to faster growth (Chart 33). On a regional basis, BCA’s fixed-income experts favor low-beta bond markets (Chart 34). Japanese bonds have a very low beta to the overall Barclays Global Treasury index because inflation expectations are quite depressed and the Bank of Japan will actively intervene to prevent yields from rising. On a USD currency-hedged basis, the Japanese 10-year yield stands at a relatively decent 2.38%, above the yield of 1.79% on comparable maturity US Treasurys (Table 1). Chart 34Favor Lower-Beta Government Bond Markets In 2020
Favor Lower-Beta Government Bond Markets In 2020
Favor Lower-Beta Government Bond Markets In 2020
Table 1Bond Markets Across The Developed World
Strategy Outlook – 2020 Key Views: Full Speed Ahead
Strategy Outlook – 2020 Key Views: Full Speed Ahead
In contrast to Japan, the beta of US Treasurys to the overall global bond index is relatively high, implying that Treasurys will underperform other sovereign bond markets in a rising yield environment. The beta for Germany, UK, Australia, and Canada lie somewhere between Japan and the US. Consistent with our bullish view on global equities, we expect corporate bonds to outperform sovereign debt in 2020 (Chart 35). Despite the weakness in manufacturing, US banks further eased terms on commercial and industrial loans in Q3, according to the Fed’s Senior Loan Officer Survey. Chart 35Stronger Growth Causes Corporate Spreads To Tighten
Stronger Growth Causes Corporate Spreads To Tighten
Stronger Growth Causes Corporate Spreads To Tighten
At the US economy-wide level, neither interest coverage nor debt-to-asset ratios are particularly stretched (Chart 36). Admittedly, the picture looks less flattering if we focus solely on high-yield issuers (Chart 37). That said, a wave of defaults is very unlikely to occur in 2020, so long as the Fed is on hold and economic growth is on the upswing. Chart 36Corporate Debt: A Benign Top-Down View
Corporate Debt: A Benign Top-Down View
Corporate Debt: A Benign Top-Down View
Chart 37Corporate Debt: More Concerning Picture Among High-Yield Issuers
Corporate Debt: More Concerning Picture Among High-Yield Issuers
Corporate Debt: More Concerning Picture Among High-Yield Issuers
Chart 38US Corporates: Focus On High-Yield Credit
HY Spread Targets US Corporates: Focus On High-Yield Credit
HY Spread Targets US Corporates: Focus On High-Yield Credit
Moreover, despite narrowing this year, high-yield spreads still remain above our fixed-income team’s estimate of fair value (Chart 38). They recommend moving down the credit curve and increasing the weight in Caa-rated bonds. These have underperformed this year largely because of technical factors such as their large exposure to the energy sector and relatively short duration. As oil prices rise next year, energy sector issuers will feel some relief. Moreover, unlike this year, rising long-term government bond yields in 2020 should also make shorter-duration credit more attractive. In contrast to high-yield spreads, investment-grade spreads have gotten quite tight. Investors seeking high-quality bond exposure should shift towards Agency MBS, which still carry an attractive spread relative to Aa- and A-rated corporate bonds. European IG bonds should also outperform their US peers thanks to faster growth in Europe next year and ongoing support from the ECB’s asset purchase program. Looking beyond the next 12-to-18 months, there is a strong chance that inflation will increase materially from current levels. The unemployment rate across the G7 has fallen to a multi-decade low, while the share of developed economies reaching full employment has hit a new cycle high (Chart 39). Chart 39ADeveloped Markets: Unemployment Rates Keep Trending Lower... And Full Employment Reaching New Cycle Highs
Developed Markets: Unemployment Rates Keep Trending Lower... And Full Employment Reaching New Cycle Highs
Developed Markets: Unemployment Rates Keep Trending Lower... And Full Employment Reaching New Cycle Highs
Chart 39BDeveloped Markets: Unemployment Rates Keep Trending Lower... And Full Employment Reaching New Cycle Highs
Developed Markets: Unemployment Rates Keep Trending Lower... And Full Employment Reaching New Cycle Highs
Developed Markets: Unemployment Rates Keep Trending Lower... And Full Employment Reaching New Cycle Highs
Chart 40The Phillips Curve Is Alive And Well
The Phillips Curve Is Alive And Well
The Phillips Curve Is Alive And Well
For all the talk about how the Phillips curve is dead, wage growth remains well correlated with labor market slack (Chart 40). Rising wages will boost real disposable incomes, leading to more spending. If economies cannot increase supply to meet higher demand, prices will rise. It simply does not make sense to argue that the price of apples will increase if the demand for apples exceeds the supply of apples, but that overall prices will not increase if the demand for all goods and services exceeds the supply of all goods and services. It will take at least until mid-2021 for inflation to rise above the Fed’s comfort zone. It will take even longer for rates to reach restrictive territory, and longer still for tighter monetary policy to make its way through the economy. However, at some point in 2022, the interest-rate sensitive sectors of the US economy will buckle, setting off a global economic downturn and a deep bear market in equities and credit. Enjoy it while it lasts. Currencies And Commodities The US dollar is a countercyclical currency, meaning that it usually moves in the opposite direction of the global business cycle (Chart 41). This countercyclicality stems from the fact that the US, with its large service sector and relatively small manufacturing base, is a “low beta economy.” Strong global growth does help the US, but it benefits the rest of the world even more. Thus, capital tends to flow out of the US when global growth strengthens, which puts downward pressure on the dollar. As global growth picks up in 2020, the dollar will weaken. EUR/USD should increase to around 1.15 by end-2020. GBP/USD will rise to 1.40. USD/CNY will move to 6.8. The Australian and Canadian dollars, along with most EM currencies, will strengthen as well. However, the Japanese yen and Swiss franc are likely to be flat-to-down against the dollar, reflecting the defensive nature of both currencies. Today's rally in the pound has raised the return on our short EUR/GBP trade to 10.5%. For now, we would stick with this position. Chart 42 shows that the pound should be trading near 1.30 against the euro based on real interest rate differentials, which is still well above the current level of 1.20. Chart 41The Dollar Is A Countercyclical Currency
The Dollar Is A Countercyclical Currency
The Dollar Is A Countercyclical Currency
Chart 42Interest Rate Differentials Suggest More Upside For The Pound
Interest Rate Differentials Suggest More Upside For The Pound
Interest Rate Differentials Suggest More Upside For The Pound
The trade-weighted dollar will continue to depreciate until late-2021, and then begin to strengthen again as the Fed turns more hawkish and global growth starts to falter. Commodity prices tend to closely track the global growth/dollar cycle (Chart 43). Industrial metal prices will fare well next year. Oil prices will also move up. Globally, the last of the big projects sanctioned prior to the oil-price collapse in late 2014 are coming online in Norway, Brazil, Guyana, and the US Gulf. Our commodity strategists expect incremental oil supply growth to slow in 2020, just as demand reaccelerates. Gold is likely to be range-bound for most of next year reflecting the crosswinds from a weaker dollar on the one hand (bullish for bullion), and receding trade war risks and rising bond yields on the other hand. Gold will have its day in the sun starting in 2021 when inflation finally breaks out. Our key market charts are shown on the following page. Peter Berezin Chief Global Strategist peterb@bcaresearch.com Chart 43Dollar Weakness Is A Boon For Commodities
Dollar Weakness Is A Boon For Commodities
Dollar Weakness Is A Boon For Commodities
Key Financial Market Forecasts
Strategy Outlook – 2020 Key Views: Full Speed Ahead
Strategy Outlook – 2020 Key Views: Full Speed Ahead
MacroQuant Model And Current Subjective Scores
Strategy Outlook – 2020 Key Views: Full Speed Ahead
Strategy Outlook – 2020 Key Views: Full Speed Ahead
Strategic Recommendations Closed Trades
Highlights An analysis on Thailand is available below. In all scenarios of global market performance, EM will underperform DM in the first half of 2020. Absolute return investors should be mindful of downside risks in EM financial markets. The principal drivers for EM corporate profits are domestic demand in both China and EM ex-China. US and European demand are not particularly relevant. We do not expect a recovery in domestic demand in China and the rest of EM in the early months of 2020. EM corporate profit growth is unlikely to turn positive in H1 2020. Volatility Is A Coiled Spring Chart I-1EM Stocks And Profits: An Unsustainable Divergence
EM Stocks And Profits: An Unsustainable Divergence
EM Stocks And Profits: An Unsustainable Divergence
EM share prices and currencies have been range-bound in 2019, despite the strong rally in DM share prices. On one hand, growing hopes of a US-China trade deal, global monetary easing and expectations of a global growth recovery have put a floor under EM (Chart I-1, top panel). On the other hand, a lack of actual growth recovery in EM/China, a deepening contraction in EM corporate profits and lingering structural malaises in many EM economies have capped upside potential (Chart I-1, bottom panel). Consistent with this sideways market action, implied volatility measures for EM equities and currencies have dropped to record lows (Chart I-2, top and middle panels). Similarly, implied volatility measures for commodities currencies – which tend to be strongly correlated with EM risk assets – have plummeted close to their historic lows (Chart I-2, bottom panel). Remarkably, DM currency markets’ implied volatility has also collapsed to the all-time lows recorded in 2007 and 2014 (Chart I-3, top panel). Chart I-2EM Vol Is A Coiled Spring
EM Vol Is A Coiled Spring
EM Vol Is A Coiled Spring
Chart I-3DM Currency Vol Is At Record Low
DM Currency Vol Is At Record Low
DM Currency Vol Is At Record Low
Nevertheless, past performance does not guarantee future performance. The fact that global financial market volatility has been very low over the past 12 months does not imply that it will remain subdued going forward. On the contrary, when DM currency volatility was this low in 2007 and 2014, it was followed by a bear market in EM risk assets (Chart I-3, bottom panel). Both EM and DM market volatility resemble a coiled spring. As such, it is quite likely these coiled springs will snap sometime in the first half of 2020. If this is indeed the case, it will be accompanied by a selloff in EM risk assets. We devote this report to discussing the reasons why such dynamics are likely to play out. An urge on the part of investors to deploy capital in EM has supported EM financial markets despite shrinking corporate profits. Hence, investment portfolios should be positioned for a resurgence in financial market volatility in general and currency volatility in particular in H1 2020. As we argued in our November 14 report, the US dollar is still enjoying tailwinds, especially versus EM and commodities currencies. All in all, asset allocators should continue to underweight EM stocks, credit markets and currencies relative to their DM counterparts. In all scenarios of global market performance, EM will underperform DM in the first half of 2020. Absolute return investors should be mindful of downside risks in EM financial markets. As always, the list of our recommended country allocations across EM equities, currencies, credit markets and domestic bonds is presented in the tables at the end of our report – please refer to pages 18-19. An Urge To Deploy Capital Amid Poor EM Fundamentals Investors’ unrelenting urge to deploy capital in EM financial markets put a floor under EM equities and currencies in 2019. Yet poor fundamentals have prevented EM equities and currencies from rallying. Such a battle between two opposing forces has produced a stalemate in EM financial markets. The same is true for commodities and many global market segments sensitive to global growth. Chart I-4Global Industrials: A Rally Without Profit Amelioration
Global Industrials: A Rally Without Profit Amelioration
Global Industrials: A Rally Without Profit Amelioration
This stalemate is unlikely to last forever. Next year will likely be a year of either an EM breakout or breakdown. EM corporate earnings hold the key, and China’s domestic demand is of paramount importance to the EM profit cycle. We discuss our outlook for both the China and EM business cycles below. Following are the reasons why we believe market expectations of a rebound in global growth are too optimistic, and that EM risk assets are at risk: First, there is a widening gap between share prices and corporate profits. Not only are EM per-share earnings shrinking at a double-digit rate, as shown in Chart I-1 on page 1, but also EM EPS net revisions have not yet turned positive. This widening gap between share prices and net EPS revisions is also striking for global industrials (Chart I-4). If corporate profits stage an imminent recovery, stocks will continue to advance. Alternatively, investor expectations will not be met, and a selloff will ensue. As the top panel of Chart I-5 illustrates, the annual growth rate of EM EPS will at best begin bottoming – from double-digit contraction territory – only in the second quarter of 2020. Odds are that investor patience might run out before that occurs and EM markets will sell off in such a scenario. Second, improvement in US and European growth is not in and of itself a sufficient reason to be positive on EM/China growth. In fact, neither US nor euro area consumer spending have been weak (Chart I-5, middle and bottom panels). Yet, EM growth and corporate profits have plunged. Hence, EM growth is by and large not contingent on consumer spending in the US and Europe. As we have repeatedly argued, EM profit growth and risk assets are driven by China/EM domestic demand, rather than by US or European growth cycles. Third, EM financial markets are not cheap. Our composite valuation indicators based on 20% trimmed-mean and equal-weighted multiples indicate that stocks are trading close to their fair value (Chart I-6). These indicators are composed based on the trailing and forward P/E ratios, price-cash earnings, price-to-book value and price-to-dividend ratios for 50 EM equity subsectors. Chart I-5EM Profits Are Driven By China Not US Or Europe
EM Profits Are Driven By China Not US Or Europe
EM Profits Are Driven By China Not US Or Europe
Chart I-6EM Equities Are Fairly Valued
EM Equities Are Fairly Valued
EM Equities Are Fairly Valued
When valuations are neutral, stock prices can rise or drop depending on the outlook for corporate profits. Provided we believe EM corporate profits will continue to contract for now, risks to share prices are skewed to the downside. Finally, several markets are still conveying a cautious message regarding EM assets. Specifically: There are cracks forming in EM credit markets. EM sovereign credit spreads are widening. Remarkably, emerging Asian high-yield corporate bond yields – shown inverted in Chart I-7 – are beginning to rise. Rising borrowing costs for high-yield borrowers in emerging Asia have historically heralded lower share prices in the region (Chart I-7). Chains often break in their weak links. Similarly, selloffs commence in the weakest segments and then spread from there. Hence, the budding weakness in emerging Asian junk corporate bonds and EM sovereign credit could be signals of a forthcoming selloff in EM/China plays. Remarkably, emerging Asian and Chinese small-cap stocks have failed to stage a rally in the past three months – despite global risk appetite having been strong (Chart I-8). This also signifies the lack of a meaningful recovery in emerging Asia in general and China in particular. Chart I-7A Canary In A Coal Mine?
A Canary In A Coal Mine?
A Canary In A Coal Mine?
Chart I-8No Rally In Chinese And Emerging Asian Small Caps
No Rally In Chinese And Emerging Asian Small Caps
No Rally In Chinese And Emerging Asian Small Caps
Chart I-9Semiconductor Prices Are Still Subdued
Semiconductor Prices Are Still Subdued
Semiconductor Prices Are Still Subdued
Last but not least, cyclical currencies and commodities markets are not signaling a global business cycle recovery. Neither industrial metals nor oil prices have been able to rally meaningfully. EM currencies have also failed to appreciate versus the dollar. In addition, semiconductor prices – both DRAM and NAND – remain weak (Chart I-9). Bottom Line: An urge on the part of investors to deploy capital in EM has supported EM financial markets despite a poor growth background, in general, and shrinking corporate profits, in particular. China: Structural Malaises To Delay A Cyclical Recovery Recent macro data, particularly PMIs, have once again raised hopes of a business cycle recovery in China. While it is reasonable to infer that the industrial cycle in China has recently stabilized, sequential improvements will be hard to achieve in the coming months for the following reasons: The credit and fiscal spending impulse has historically led the manufacturing cycle in China on average by about nine months. However, this time gap has varied – from three months in the first quarter of 2009 to about 20 months in 2017 (Chart I-10). Chart I-10China Credit/Fiscal Impulse And Business Cycle: Varying Time Lags
China Credit/Fiscal Impulse And Business Cycle: Varying Time Lags
China Credit/Fiscal Impulse And Business Cycle: Varying Time Lags
There are several reasons why the time lag could be longer than nine months in the current cycle: (1) The US-China confrontation is dampening sentiment among both enterprises and households in China. Marginal propensity to spend among households and enterprises is low and has not improved (Chart I-11). A Phase One deal is unlikely to reverse this. The fact remains that the US and China have failed to reach an even small and limited accord in the past year of negotiations. With this in mind, even if there is a Phase One deal, businesses both in China and around the world are unlikely to alter their investment plans substantially. (2) Regulatory pressures on banks and on the shadow banking sector to deleverage remain acute. Although the People’s Bank of China has reduced interest rates and is providing ample liquidity, the regulatory tightening measures from 2016-2018 have not been reversed. Consistently, commercial banks’ assets and broad bank credit growth are rolling over anew (Chart I-12). Chart I-11China: Lack Of Appetite To Spend For Enterprises And Households
China: Lack Of Appetite To Spend For Enterprises And Households
China: Lack Of Appetite To Spend For Enterprises And Households
Chart I-12Banking System Is Now More Restrained Compared With Previous Stimulus Episodes
Banking System Is Now More Restrained Compared With Previous Stimulus Episodes
Banking System Is Now More Restrained Compared With Previous Stimulus Episodes
(3) There has been no stimulus targeting the real estate market. Without a recovery in the property market – both strong price appreciation and construction activity – it will be difficult to achieve a business cycle recovery. The basis is that real estate – not exports to the US – has been the key pillar driving China’s growth over the past 10 years. Even if there is a Phase One deal, businesses both in China and around the world are unlikely to alter their investment plans substantially. In the onshore bond market, government bond yields do not confirm the sustainability of the improvement in the national manufacturing PMI (Chart I-13). China’s local currency government bond yields have generally been a good coincident indicator for the industrial cycle, and they are not flashing green. Chart I-13Chinese Local Bond Yields Doubt The Sustainability Of A Stronger PMI
Chinese Local Bond Yields Doubt The Sustainability Of A Stronger PMI
Chinese Local Bond Yields Doubt The Sustainability Of A Stronger PMI
November Asian and Chinese trade data have been somewhat mixed. Korea’s total exports and exports to China still show double-digit contraction (Chart I-14, top panel). Similarly, Japanese foreign machine tool orders – both total and from China – remain in deep contraction (Chart I-14, middle panel). In contrast, Taiwanese exports to China and to the world ex-China have improved (Chart I-14, bottom panel). The recuperation in Taiwanese exports to China could be attributed to stockpiling of semiconductors by mainland companies. Odds are that China has decided to stockpile semiconductors from Taiwan, given the lingering uncertainty over the China-US relationship, especially regarding China’s access to semiconductors. Real estate – not exports to the US – has been the key pillar driving China’s growth over the past 10 years. Infrastructure spending remains lackluster, despite a surge in special bond issuance by local governments over the past 12 months (Chart I-15, top panel). Chart I-14Asian Trade Was Still Very Weak In November
Asian Trade Was Still Very Weak In November
Asian Trade Was Still Very Weak In November
Chart I-15China: Domestic Demand Is Lackluster
China: Domestic Demand Is Lackluster
China: Domestic Demand Is Lackluster
Chart I-16EM Ex-China: No Recovery In Domestic Demand
EM Ex-China: No Recovery In Domestic Demand
EM Ex-China: No Recovery In Domestic Demand
The reason is that special bond issuance accounts for a small share of infrastructure investment. Bank loans, corporate bond issuance by LFGVs and land sales are still the main source of funding for capital expenditures on infrastructure. Finally, on the consumer side, auto sales are contracting for a second straight year, while smartphone sales are flat-to-down for a third year in a row (Chart I-16, middle and bottom panels). EM Ex-China: Mind The Deflationary Forces In EM ex-China, Korea and Taiwan, not only are their exports weak, but their domestic demand trajectory is also downbeat (Chart I-16). Despite rate cuts by EM central banks, their interest rates remain elevated in real terms (adjusted for inflation). The basis is that inflation has dropped as much as policy rate cuts. In fact, in many economies, inflation is flirting with all-time lows (Chart I-17). Furthermore, lending rates by banks have not been adjusted sufficiently low in line with the declines in policy rates. Consequently, local borrowing costs in EM remain elevated. Not surprisingly, broad money growth is close to a record low (Chart I-18). Chart I-17EM Ex-China: Inflation Is At A Record Low
EM Ex-China: Inflation Is At A Record Low
EM Ex-China: Inflation Is At A Record Low
Chart I-18EM Ex-China: More Aggressive Monetary Easing Is Necessary
EM Ex-China: More Aggressive Monetary Easing Is Necessary
EM Ex-China: More Aggressive Monetary Easing Is Necessary
Table I-1EM Corporate Profits Across Sectors
2020 Key Views: A Resolution Of The EM Stalemate
2020 Key Views: A Resolution Of The EM Stalemate
Without recognizing non-performing loans and recapitalizing banks, a sustainable credit cycle - and hence domestic demand recovery - is implausible in many EM countries. This will impede the corporate profit recovery, especially for banks that account for 28% of MSCI EM corporate profits (Table I-1). As we argued in our November 14 report, such deflationary tendencies in many EM economies warrant a weaker currency. Bottom Line: The principal drivers for EM corporate profits are domestic demand in China and EM ex-China, rather than the ones in the US or Europe. We do not expect a recovery in domestic demand in both China and the rest of EM in the early months of 2020. Arthur Budaghyan Chief Emerging Markets Strategist arthurb@bcaresearch.com Thailand: Bet On More Monetary Easing Chart II-1Thailand Is Flirting With Deflation
Thailand Is Flirting With Deflation
Thailand Is Flirting With Deflation
Deflationary pressures are mounting in Thailand. This will lead the central bank to cut interest rates much further. We therefore recommend to continue overweighting Thai domestic bonds within an EM local bond portfolio, currency unhedged. Thailand’s economy is flirting with deflation and needs lower interest rates, a cheaper currency and a fiscal boost: Core inflation has fallen to a mere 0.5%. Likewise, headline inflation has plunged to 0.2%, which is far below the central bank’s lower-bound target of 1% (Chart II-1). Further, nominal GDP growth has dropped below the prime lending rate (Chart II-2). Adjusted for core inflation, real lending rates are too high for the economy to handle. If lending rates are not brought down, credit demand will decline further and non-performing loans will mushroom (Chart II-3). Chart II-2Thailand: Nominal GDP Growth Is Below Prime Lending Rate
Thailand: Nominal GDP Growth Is Below Prime Lending Rate
Thailand: Nominal GDP Growth Is Below Prime Lending Rate
Chart II-3Thailand: Decelerating Domestic Credit
Thailand: Decelerating Domestic Credit
Thailand: Decelerating Domestic Credit
High borrowing costs are especially detrimental for the non-financial private sector – households in particular. Consumer debt currently stands at 125% of disposable income. The central bank is set to deliver more rate cuts and will probably begin intervening in the foreign exchange market to weaken the baht. Thailand’s economic growth has decelerated and more downside is likely. Business sentiment is deteriorating, companies’ book orders are falling and manufacturing production is contracting (Chart II-4, top panel). Overall, corporate earnings are shrinking 8% from a year ago in local currency terms (Chart II-4, bottom panel). Declining corporate profitability is beginning to hurt capex and employment. In turn, slower employment and wage growth have hit consumer confidence. Private consumption volume has decelerated decisively (Chart II-5, top panel) and passenger vehicle sales are falling (Chart II-5, bottom panel). Chart II-4Thailand: Business Sentiment Is Falling
Thailand: Business Sentiment Is Falling
Thailand: Business Sentiment Is Falling
Chart II-5Thailand: Consumer Spending Has Been Hit
Thailand: Consumer Spending Has Been Hit
Thailand: Consumer Spending Has Been Hit
Chart II-6Thailand's Real Estate Market Is Weak
Thailand's Real Estate Market Is Weak
Thailand's Real Estate Market Is Weak
The real estate market is also slowing down. Chart II-6 shows various types of residential property prices. Specifically, house price appreciation has either decelerated or turned into deflation. Accordingly, construction activity has been weak. Overall, the Thai economy needs significant monetary and fiscal easing. Yet the 2020 fiscal budget entails only a 6% increase in expenditures in nominal terms, which is insufficient to halt the economy’s downtrend momentum. With the budget already set, aggressive monetary easing - in the form of generous rate cuts and foreign exchange interventions to induce some currency depreciation – is the only tool available to the authorities at the moment. Bottom Line: The Thai economy is facing strong deflationary forces and requires lower interest rates and a cheaper currency. The central bank is set to deliver more rate cuts and will probably begin intervening in the foreign exchange market to weaken the baht. Investment Recommendations Local interest rates will drop further and the Bank of Thailand (BoT) will keep cutting interest rates next year in the face of mounting deflationary trends in the economy. For dedicated EM fixed-income portfolios, we recommend keeping overweight positions in Thai local currency bonds and sovereign credit within their respective EM portfolios. While the Thai baht could depreciate because of monetary easing, the currency will still perform better than many other EM currencies. Thailand carries a very robust current account surplus of 6% of GDP. This will provide a cushion for the baht. Furthermore, foreign ownership of local currency bonds is low at 18%. This limits potential foreign outflows from local bonds in case the currency depreciates. In addition, Thailand’s foreign debt obligations - which are calculated as the sum of short-term claims, interest payments and amortization over the next 12 months - are small, accounting for 14% of exports. This limits hedging needs by Thai debtors with foreign currency liabilities and, hence, the currency’s potential downside. We recommend EM equity investors to keep an overweight position in Thai equities. First, Thai bourse is defensive in nature – with utilities, consumer staples and healthcare accounting for 27% of the MSCI Thailand market cap – and will begin outperforming as EM share prices come under renewed stress (Chart II-7, top panel). Second, net EPS revision in Thailand vs. EM has plummeted to a 16-year low (Chart II-7, bottom panel). This entails that a lot of bad news has already been priced in relative terms. Finally, narrow money (M1) growth seems to be bottoming. This is occurring because the central bank has begun accumulating foreign exchange reserves. While it might take some time before monetary easing leads to an economic recovery, Thai share prices will benefit from it early on (Chart II-8). Chart II-7Thailand vs. EM: Relative Stock Prices And Earnings Revisions
Thailand vs. EM: Relative Stock Prices And Earnings Revisions
Thailand vs. EM: Relative Stock Prices And Earnings Revisions
Chart II-8Thailand: Narrow Money And Share Prices
Thailand: Narrow Money And Share Prices
Thailand: Narrow Money And Share Prices
Ayman Kawtharani Editor/Strategist ayman@bcaresearch.com Footnotes Equities Recommendations Currencies, Credit And Fixed-Income Recommendations
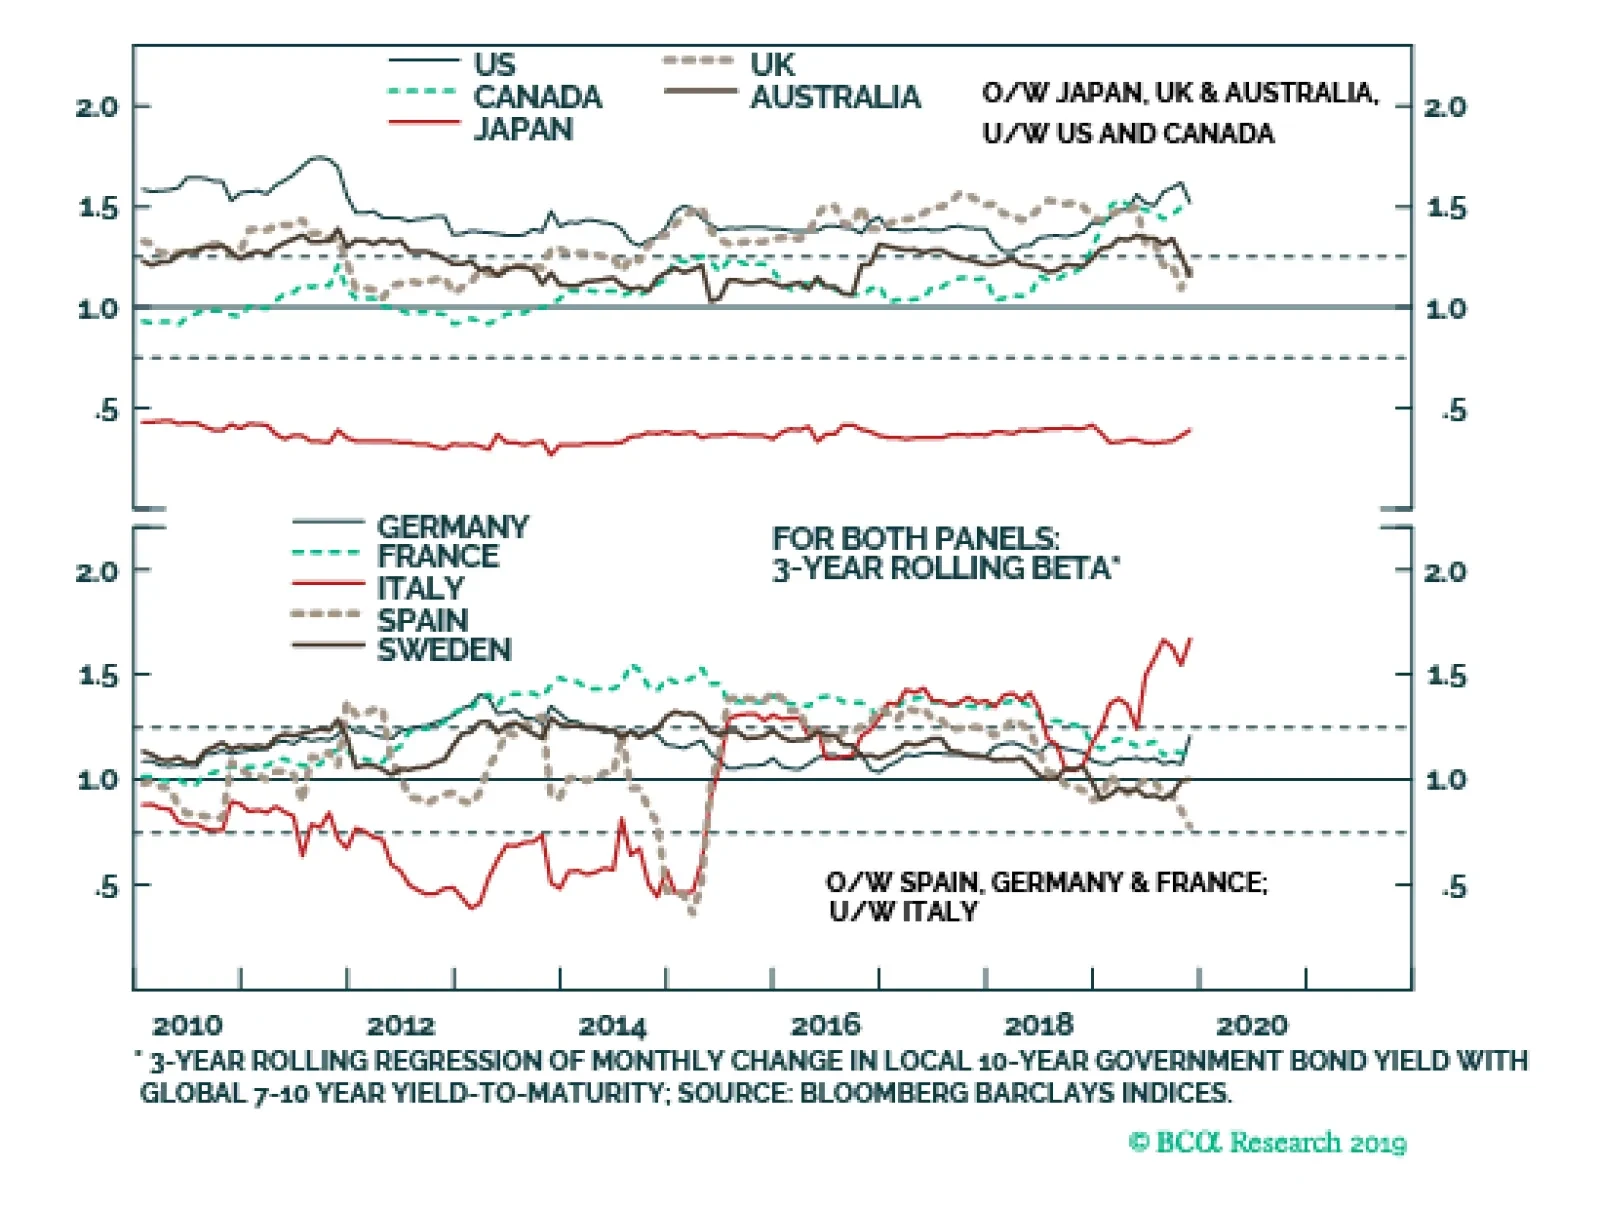
Government bonds investors should focus their country exposure on lower-beta markets where yields are less correlated to moves in the overall level of global bond yields. We define a “high-beta” bond market as having a yield beta of 1.25 or higher, and a…
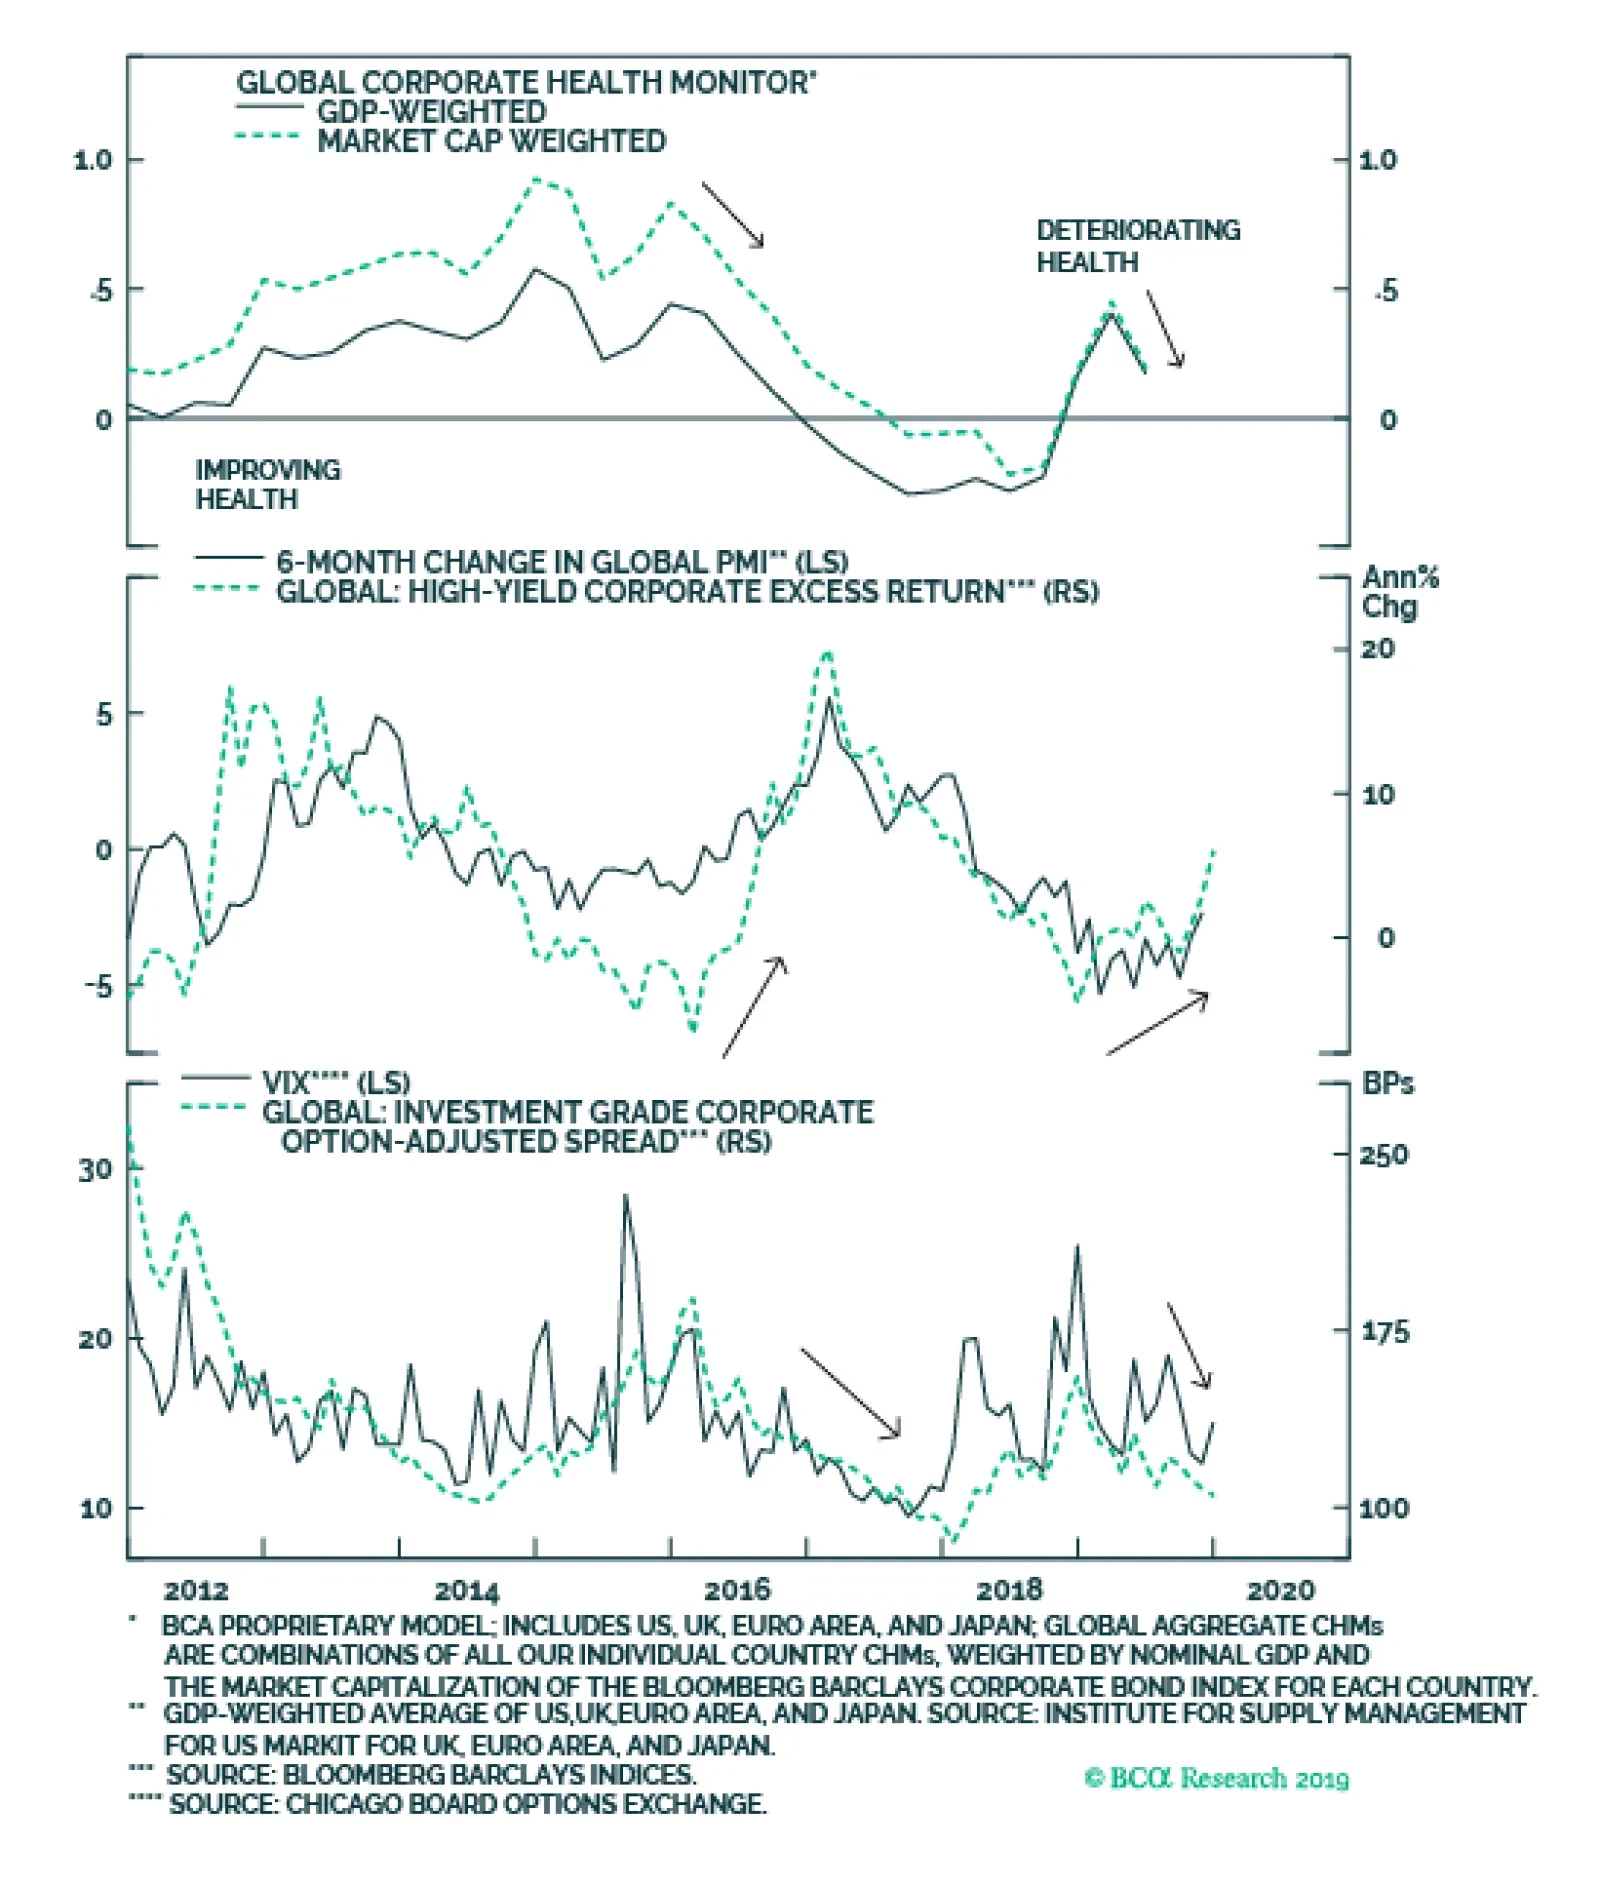
The combination of faster global growth and accommodative monetary policies laid out in the BCA Outlook 2020 report will delay the peak of the global credit cycle. This means investors should expect another year of corporate bond outperformance versus…
Highlights Global growth will rebound in 2020, led by the US and China, putting upward pressure on global bond yields. Maintain below-benchmark overall duration exposure. Central banks will stay dovish until policy reflation has clearly turned into inflation, limiting how high bond yields can climb in 2020 but sowing the seeds for a far more bond-bearish backdrop in 2021. Expect mild bear-steepening pressure on global yield curves, led by rising inflation expectations. Accommodative monetary policy and faster growth will delay the peak in the aging global credit cycle. Stay overweight global corporate debt versus sovereign bonds. Returns on global fixed income will be far lower in 2020 than in 2019, given rich valuation starting points. Country and sector selection will be more important in driving fixed income outperformance. For sovereign bonds, favor countries where yields are less sensitive to change in overall global yields; for credit, favor sectors with lower interest rate durations and lower spread volatility. Feature BCA Research’s Outlook 2020 report, outlining the main investment themes for next year from the collective mind of our strategists, was sent to all clients in late November.1 In this report, we discuss the broad implications of those themes for the direction of global fixed income markets in 2020. In a follow-up report to be published in the first week of the new year, we will translate those themes into specific recommended allocations and weightings within our model bond portfolio framework. A Summary Of The 2020 Outlook Chart 1Expect A Cyclical Rise In Global Yields In 2020
Expect A Cyclical Rise In Global Yields In 2020
Expect A Cyclical Rise In Global Yields In 2020
The main conclusions from the Outlook 2020 report were cyclically bullish looking out over the next twelve months, but more cautious beyond that. The downturn in global growth seen in 2019 is projected to end in response to several headwinds that have become tailwinds: a small wave of Chinese stimulus and reflation; more stimulative global monetary policies; the substantial easing of global financial conditions as risk assets have rallied worldwide; a fading drag on global manufacturing from inventory destocking; both China (weak growth) and the US (the 2020 US election) have good reasons to de-escalate the trade war in 2020. This backdrop should push global bond yields moderately higher in 2020, while maintaining a backdrop that is once again favorable for risk assets on a relative basis versus government debt (Chart 1). A critical element to this story is the supportive monetary policy backdrop. Central banks worldwide, led by interest rate cuts from the US Federal Reserve and a resumption of asset purchases from the European Central Bank (ECB), are now running more stimulative policies in response to this year’s global manufacturing slump and elevated level of political uncertainty. Policymakers will maintain accommodative monetary policy through 2020 to try and bring depressed inflation expectations back up to central bank targets. This will create a “sweet spot” for global risk assets, with improving economic growth and accommodative monetary policy. A repeat of the spectacular total return numbers seen across the majority of asset classes in 2019 is unlikely, but global equity and credit markets should solidly outperform government bonds. Yet all that monetary stimulus does not come without a price. Policymakers will maintain accommodative monetary policy through 2020 to try and bring depressed inflation expectations back up to central bank targets. This will create a “sweet spot” for global risk assets, with improving economic growth and accommodative monetary policy. A revival of inflationary pressures in 2021 will force central banks to raise rates much more aggressively. Combined with a China that remains wary of promoting excess leverage, this will drive the current prolonged global business cycle expansion to its recessionary endgame, taking equity and credit markets down with it. This will eventually trigger a new decline in global bond yields as policymakers shift back to easing mode, but from much higher levels than today. Our Four Main Key Views For Global Fixed Income Markets In 2020 The following are the main implications for global fixed income investment strategy based off the conclusions from the 2020 BCA Outlook: Key View #1: Maintain below-benchmark overall duration exposure. The pickup in global growth that we expect in 2020 has its roots in two locations: China and the US. For China, policymakers are keenly aware that the current growth slowdown cannot continue, as it has already pushed nominal GDP growth below 8% (Chart 2). For an economy as highly leveraged as China, slowing nominal growth is lethal and must be avoided to prevent a surge in private sector defaults and rising unemployment. Already, China has delivered significant policy stimulus in 2019: the reserve requirement ratio has been cut by 400bps; taxes have been cut by 2.8% of GDP; capital spending at state-owned enterprises has increased; the currency has depreciated; and, more recently, monetary policy has been eased via traditional interest rate cuts. These measures have eased our index of Chinese monetary conditions and triggered a surge in the China credit impulse, which leads Chinese import growth (i.e. China’s most direct impact on the global economy) by nine months. There are signs that Chinese growth is already bottoming out, as evidenced by the recent pickup in the China manufacturing PMI. Expect more signs of improvement in the first half of 2020. The BCA global leading economic indicator (LEI) has been rising since January of this year, and the global LEI diffusion index is signaling that the upturn will continue in 2020 (Chart 3). With global financial conditions at highly stimulative levels thanks to the robust performance of risk assets in 2019, the backdrop is already conducive to faster global growth. BCA’s geopolitical strategists are of the view that a “détente” in the US-China trade war is still the most likely base case scenario, which would go a long way in reducing the growth-inhibiting effects of elevated uncertainty (bottom panel). Chart 2A Boost To Global Growth From China In 2020
A Boost To Global Growth From China In 2020
A Boost To Global Growth From China In 2020
Chart 3Lower Uncertainty + Easy Financial Conditions = Faster Growth
Lower Uncertainty + Easy Financial Conditions = Faster Growth
Lower Uncertainty + Easy Financial Conditions = Faster Growth
As for the US, the lagged impact of the Fed’s 75bps of rate cuts this year has boosted domestic liquidity conditions in a pro-growth fashion. The BCA US Financial Liquidity Indicator, which leads not only US growth but also leads the BCA global LEI and commodity prices by 18 months, is already signaling that US economic momentum is set to bottom out in early 2020 (Chart 4). This signal is in addition to the leading properties of US financial conditions (middle panel), which suggests a reacceleration of real GDP growth back above trend is about to unfold. Chinese policy reflation has typically been a good leading indicator for US capex and is heralding a rebound in investment spending (bottom panel). The pickup in global growth would also help revive the dormant euro zone economy, which has been hit hard though plunging export demand and overall weakness in the manufacturing sector. The entire slump in euro area real GDP growth since the start of 2018 can be attributed to plunging net exports, while domestic demand has held steady (Chart 5). The increase in the China credit impulse and our global LEI diffusion index – both leading indicators of euro area export growth – are signaling that euro area export demand is already in the process of bottoming out (bottom two panels) and should gain momentum in the first half of 2020. Chart 4US Growth Is Poised To Accelerate
US Growth Is Poised To Accelerate
US Growth Is Poised To Accelerate
Chart 5The Drag On European Growth From Trade Will Soon End
The Drag On European Growth From Trade Will Soon End
The Drag On European Growth From Trade Will Soon End
This better growth backdrop will put moderate upward pressure on global bond yields in 2020. This better growth backdrop will put moderate upward pressure on global bond yields in 2020. Key View #2: Expect mild bear-steepening pressure on global yield curves, led by rising inflation expectations. While we expect bond yields to drift higher in the next 6-12 months, the upside will be capped with central banks likely to stay dovish until policy reflation has clearly turned into higher inflation. Interest rate markets will not begin to price in expectations of tighter monetary policy without evidence of actual inflation picking up. The Fed, ECB, Bank of Japan and other central banks have all stated publicly that they will maintain current accommodative policy settings until realized inflation has sustainably returned to target levels, typically around 2%. This would be a major change in the modus operandi of these policymakers, who have typically signaled rate hikes based simply on forecasts of higher inflation. The implication is that interest rate markets will not begin to price in expectations of tighter monetary policy without evidence of actual inflation picking up (Chart 6). Chart 6Central Banks Will Stay Dovish Until Inflation Sustainably Accelerates
Central Banks Will Stay Dovish Until Inflation Sustainably Accelerates
Central Banks Will Stay Dovish Until Inflation Sustainably Accelerates
A critical ingredient for global inflation to begin moving higher again is a softer US dollar (USD). The year-over-year growth rate of the trade-weighted USD is correlated to global export price inflation and commodity price inflation, more generally (Chart 7). The typical drivers of the USD are all pointing in a more bearish direction: Chart 7The USD Is Critical For Global Reflation
The USD Is Critical For Global Reflation
The USD Is Critical For Global Reflation
Chart 8Global Real Yields & Inflation Expectations Will Drift Higher In 2020
Global Real Yields & Inflation Expectations Will Drift Higher In 2020
Global Real Yields & Inflation Expectations Will Drift Higher In 2020
the Fed has cut interest rates multiple times since the summer and is expanding its balance sheet via repo operations and treasury bill purchases; global (non-US) growth is bottoming out, and capital tends to flow out of the USD into more cyclical currencies in Europe and EM when global growth is accelerating; elevated policy uncertainty, which tends to attract inflows into the safety of the USD, is starting to diminish. The combination of improving global growth and a softer USD would normally be enough to generate a significant increase in global bond yields. Yet we do not expect the sort of move higher in the real component of bond yields signaled by our global LEI diffusion index in 2020 (Chart 8, top panel). While real yields should move higher alongside faster growth, if there is no expected tightening of monetary policy as well, the move in real yields will be more limited. The grind higher in global bond yields that we expect in 2020 will come first through faster inflation expectations and, much later in the year, higher real bond yields when central bankers (starting with the Fed) begin to signal a need to turn more hawkish. The grind higher in global bond yields that we expect in 2020 will come first through faster inflation expectations and, much later in the year, higher real bond yields when central bankers (starting with the Fed) begin to signal a need to turn more hawkish. This suggests that inflation-linked bonds should perform reasonably well in countries where inflation is likely to accelerate the fastest, like the US. Faster inflation expectations will also result in some bear-steepening of global government bond yield curves in the first half of 2020 (Chart 9). There is very little curve steepening discounted in bond forward rates in the developed markets – a consequence of the general flatness of yield curves – which suggests that yield curve steepening trades could prove to be profitable in 2020. Chart 9Expect A Mild Bear-Steepening Of Global Yield Curves
Expect A Mild Bear-Steepening Of Global Yield Curves
Expect A Mild Bear-Steepening Of Global Yield Curves
Chart 10The Fed Has Dis-Inverted The Treasury Curve
The Fed Has Dis-Inverted The Treasury Curve
The Fed Has Dis-Inverted The Treasury Curve
In the case of the US, the Fed’s recent easing actions have pushed short-term interest rates below longer-term Treasury yields, removing the yield curve inversion that sparked recession fears among investors during the summer of 2019 (Chart 10). With the Fed likely to sit on its hands for most of next year, even as US growth and inflation are likely to improve, this will put additional bear-steepening pressure on the US Treasury curve. In Europe, bond markets have already discounted a very significant impact from the ECB restarting its Asset Purchase Program, which only began last month. Investment grade corporate bond spreads, as well as Italy-Germany government bond spreads, have narrowed substantially despite a weak euro area economy (Chart 11, bottom panel). Meanwhile, the term premium on 10-year German bunds is back to the deeply negative levels middle panel) seen when the ECB was expanding its balance sheet at a 30-40% pace, rather than the 5% pace implied by the current announced pace of purchases of 20 billion euros per month (top panel). This potentially leaves longer-term European yields exposed to the same bear-steepening pressures seen in other bond markets, even within the context of a renewed ECB bond-buying program. Chart 11European Bonds Already Discount A Very Dovish ECB
European Bonds Already Discount A Very Dovish ECB
European Bonds Already Discount A Very Dovish ECB
Chart 12The Wild Card For Bonds Markets In 2020: Fiscal Policy
The Wild Card For Bonds Markets In 2020: Fiscal Policy
The Wild Card For Bonds Markets In 2020: Fiscal Policy
A potentially big wild card for global bond markets next year will be fiscal policy, which can also exacerbate yield curve steepening pressures. Any sign of a push toward more government spending, particularly in Europe where there has been such reluctance to open the fiscal taps, would result in a sharper upward move in global bond yields than we are expecting. This is not because of a supply effect related to more government bond issuance that would require higher yields to attract buyers. It is because fiscal stimulus (Chart 12) would push growth to an even faster pace that would bring forward the date when inflation returns to policymaker targets and tighter monetary policy could commence. This would follow a similar path to the curve steepening dynamics described earlier, with a fiscal boost to growth pushing up longer-term inflation expectations before starting to push up short-term interest rate expectations. Key View #3: Stay overweight global corporate debt versus sovereign bonds. Investors should expect another year of corporate bond outperformance versus sovereign debt in the developed economies. The combination of faster global growth, somewhat higher inflation and accommodative monetary policies laid out in the BCA Outlook 2020 report will delay the peak in the aging global credit cycle. This means investors should expect another year of corporate bond outperformance versus sovereign debt in the developed economies. Low borrowing rates are already helping to extend the credit cycle by making it easier for highly indebted borrowers to service their debts. This can be seen in the US, where interest coverage ratios (using top-down data for the non-financial corporate sector) remain above the levels that have preceded previous recessions (Chart 13). Low borrowing rates are also helping indebted borrowers in Europe, particularly in Italy and Spain where the banking system is now far less exposed to non-performing loans than during the peak years of the 2011-12 European Debt Crisis (Chart 14). Chart 13Low Rates Helping Extend The US Credit Cycle
Low Rates Helping Extend The US Credit Cycle
Low Rates Helping Extend The US Credit Cycle
Chart 14Low Rates Helping Ease Stress In European Banks Declining Non-Performing Loans Are A Positive For The European Periphery
Low Rates Helping Ease Stress In European Banks Declining Non-Performing Loans Are A Positive For The European Periphery
Low Rates Helping Ease Stress In European Banks Declining Non-Performing Loans Are A Positive For The European Periphery
Chart 15A Cyclically Positive Backdrop For Global Corporates
A Cyclically Positive Backdrop For Global Corporates
A Cyclically Positive Backdrop For Global Corporates
According to our checklist of indicators to watch for an end of the corporate credit cycle in the US – tight monetary policy, deteriorating corporate sector financial health, and tightening bank lending standards – only corporate financial health is flashing a warning signal according to our Corporate Health Monitor as we discussed in a recent report.2 In fact, our global Corporate Health Monitor is rolling over – a trend that should continue as growth improves in 2020 – which should support global corporate bond outperformance versus government debt next year (Chart 15). Key View #4: Returns on global fixed income will be far lower in 2020 than in 2019. Country and sector selection will be more important in driving fixed income outperformance in 2020. The start of 2020 looks far different in terms of fixed income valuations compared to the beginning of 2019. For example, the 10yr US Treasury yield started the year at 2.72% and is now 1.83%, while the 10yr German bund yield started this year at 0.24% and is now MINUS-0.31%. These lower yields reflect the slower pace of global economic growth and monetary policy easing delivered by the Fed and ECB. Yet at the same time, corporate credit spreads have narrowed in both the US (the high-yield index OAS is down from 526bps to 360bps) and the euro area (the investment grade index OAS is down from 152bps to 100bps). These massive rallies in global bond markets this year resulted in both lower government bond yields and tighter credit spreads - even with slower global growth that would normally be a trigger for wider spreads/higher risk premiums. Looking at the current valuation of government bond yields in the major developed markets from a long-run perspective, it is difficult to make the case that it is attractive. Medium-term real bond yields remain well below potential GDP growth rates, a consequence of central banks keeping policy rates well below neutral levels suggested by measures like the Taylor Rule (Chart 16). Chart 16Global Government Bonds Are Expensive
2020 Key Views: Delay Of Reckoning
2020 Key Views: Delay Of Reckoning
Without the initial starting point of cheap valuations, fixed income return expectations for 2020 should be tempered. This means that rather than loading up on maximum duration risk and/or credit risk to capture big yield and spread moves, bond investors should be more selective in country, maturity and credit exposure to generate outperformance in 2020. Chart 17Favor Lower-Beta Government Bond Markets In 2020
Favor Lower-Beta Government Bond Markets In 2020
Favor Lower-Beta Government Bond Markets In 2020
For government bonds, that means focusing country exposures on lower-beta markets where yields are less correlated to moves in the overall level of global bond yields. Our preferred way to measure this is to look at the beta of monthly yield changes for the benchmark 10-year government yields of the major developed market countries to the overall Bloomberg Barclays Global Treasury index yield for the 7-10 year maturity bucket, over a rolling three-year window. We define a “high-beta” bond market as having a yield beta of 1.25 or higher, and a “low-beta” bond market as having a yield beta of 0.75 or lower. Under that definition, global bond investors should underweight higher-beta Canada, the US and Italy, and overweight low-beta Japan and Spain (Chart 17). Bond markets with betas between 1.25 and 0.75 (Germany, Australia, Sweden, the UK) can also be considered on their own fundamental merits. Of that list, we see Germany and Australia having a better chance of outperforming the UK and Sweden, given the greater odds that the Bank of England or Riksbank could signal a need to hike rates in 2020 compared to the ECB or Reserve Bank of Australia. Chart 18Stay Overweight Global Spread Product In 2020, But Be Selective
2020 Key Views: Delay Of Reckoning
2020 Key Views: Delay Of Reckoning
For spread product, that means focusing exposure on sectors that are less risky, either defined by interest rate duration or spread volatility (i.e. spread duration). With credit spreads remaining near the low end of long-run historical ranges for nearly all major markets (Chart 18), it is hard to find examples of spread product being cheap in absolute terms. On a risk-adjusted basis, however, negatively-convex spread product like US and euro area high-yield debt and US agency MBS actually look more interesting in the rising yield environment we expect in 2020, since the interest rate durations of those fixed income sectors fell as bond yields declined in 2019. Thus, we recommend owning high-yield corporates over higher-duration investment grade corporates in the US and euro area, while also favoring US agency MBS over higher-quality credit tiers of US investment grade corporate credit. Robert Robis, CFA Chief Fixed Income Strategist rrobis@bcaresearch.com Footnotes 1 Please see The Bank Credit Analyst, “Outlook 2020: Heading Into The End Game”, dated November 22, 2019, available at bca.bcaresearch.com. 2 Please see BCA Research Global Fixed Income Strategy Weekly Report, “The Lowdown On Low-Rated High-Yield”, dated November 27, 2019, available at gfis.bcaresearch.com. Recommendations The GFIS Recommended Portfolio Vs. The Custom Benchmark Index
2020 Key Views: Delay Of Reckoning
2020 Key Views: Delay Of Reckoning
Duration Regional Allocation Spread Product Tactical Trades Yields & Returns Global Bond Yields Historical Returns
Dear Client, I have been visiting clients in the US Midwest this week. In lieu of our regular report, we are sending you a Special Report from our Global Asset Allocation team. The report includes a review of recently published books that BCA Research strategists found most helpful in terms of understanding the global economy and how to invest. Next week, the Global Investment Strategy service will be publishing its economic and investment outlook for 2020 and beyond. Best regards, Peter Berezin, Chief Global Strategist Highlights To answer that question, the GAA team asked BCA Research’s strategists for suggestions of recent books that helped their understanding of the world economy or of how to invest. Their suggestions include books on artificial intelligence, the information in Google searches, debt crises, the growing monopolization of the US economy, and the death of “liberal hegemony”. Some recommendations are more esoteric: a textbook on climate economics, a paper on the Lewis Turning-Point, and the history of Russia’s 1917 default. Feature “What’s the best thing you read recently?” was the rather sharp question we were asked by a client not long ago. BCA Research believes that one of its roles is to contribute to the intellectual debate on what drives the economy and investment markets…indeed, simply what makes the world tick. Part of that is sharing interesting books (or articles or academic papers) that deserve to be widely read and discussed. The client question set us thinking. Twice in recent years, ahead of the holiday season, Global Asset Allocation has published a list of its favorite investment-related books that clients might read during down-time over the break.1 So this time we polled our senior colleagues at BCA Research on what they had read this year that most aided their understanding of the global economy or investment. We asked them to limit their choice to something published recently (say, in the past year or two). The 12 items they picked follow (in no particular order). Most are well-known books, published this year and favorably reviewed. But some are a little more obscure (the lessons from Russia’s default of 1917, for instance). Our strategists also identified a must-read university-level textbook (on climate economics) and a seminal Richard Koo conference paper on why there is a lack of borrowers globally. We are sure you will find much here for stimulating and entertaining reading during the holidays. Life 3.0: Being Human In The Age Of Artificial Intelligence By Max Tegmark The only thing special about human intelligence is that it is the minimum level necessary to create a technologically advanced society. What happens when artificial intelligence reaches human capabilities? At that point, there will be an intelligence explosion, argues Max Tegmark in his new book Life 3.0. AI will be smart enough to figure out how to make itself even smarter which, in turn, will allow it to make itself smarter still. Forget about a Star Trek future. AI will blow through that in the blink of an eye. Within days, or perhaps even hours, AI will be constrained only by the laws of physics. When will this day arrive? No one really knows, although Tegmark notes that the median estimate among AI researchers is somewhere around 2050. Not imminent, but still within the lifetime of most investors. What role will finance and economics play in this brave new world? Scarcity is the bedrock on which economics is built. Diamonds cost more than water not because water is less useful – life could not exist without it – but because diamonds are much more scarce than water. Will the cornucopia produced by superhuman AI render the market mechanism obsolete? It is possible. Even before that fateful day when AI surpasses human capabilities, advances in AI technologies will leave their mark on society. Workers who can harness AI to increase their productivity will benefit. Workers who are displaced by AI will suffer. The demand for redistributive policies will grow. Efforts to rein in companies that gain monopolistic control over AI technologies will intensify. More worrying, superintelligent AI may eventually render all humans – including the original creators of the AI – obsolete. Tegmark spends a lot of time discussing the difficulty in getting advanced AI to understand, adopt, and retain the goals that its human masters try to program into it. The risk is not of a “Terminator” style scenario. Rather, it is that superintelligent AI will end up treating humans with the same ambivalence we treat ants: You may not purposely try to step on an ant while you are walking in the woods, but if you do, well, tough luck for the ant. Failure to apply to AI research the sort of safety engineering that made the lunar landing possible could be humanity’s ultimate undoing. Peter Berezin Chief Global Strategist Narrative Economics: How Stories Go Viral And Drive Major Economic Events By Robert J. Shiller Shiller’s Narrative Economics is a book within the realm of behavioral economics, but it is distinct in its focus on how ideas that turn out to have significant economic influence begin, spread, and die (if they die!). Shiller metaphorically links the adoption of economic narratives to the spread of diseases, noting that both occur through interpersonal contact. A framework exists to model the latter, and Shiller argues that this is an excellent starting-point to understand the spread of ideas with important economic implications. Like most behavioral research to date, the book is foundational rather than definitive: it presents a helpful conceptual framework to think about the “transmission” of influential economic ideas but, after reading the book, investors will not walk away with any specific tools to predict when and how economic narratives will influence macroeconomic behavior or asset prices. Still, we liked the book because it gets the reader thinking about how to identify narratives. Investors have already seen several false narratives emerge this cycle: the hyperinflationary nature of quantitative easing, that low interest rates mean low inflation (neo-Fisherian economics), comparisons to 1938 at the onset of US monetary policy normalization, the inevitably of debt deflation in China, and the imminence of a US fiscal crisis are just a few examples. The mere practice of identifying narratives should increase the ability of investors to identify which narratives are more likely to be right or wrong, and we would challenge our clients to read Shiller’s book with the narrative of secular stagnation in mind. True or false? Jonathan LaBerge, CFA Vice President, Special Reports Everybody Lies: Big Data, New Data, And What The Internet Can Tell Us About Who We Really Are By Seth Stephens-Davidowitz Stephens-Davidowitz argues that people’s personal Google search history amounts to digital truth serum, the opposite of one’s carefully curated public social-media footprint. The book examines the new age of Big Data from a sociological lens, and offers vital insights about the pitfalls of this new discipline – data science – which is still in its infancy. The critical premise is that people’s primordial need to look good, and equally, avoid looking bad, drives their digital behavior. A person’s search history reveals their inner hopes, dreams, fears, and anxieties in the same way that their social media presence obscures them. In this way, Big Data can be harnessed to uncover unaddressed suffering, political bias, inequality of opportunity, and a host of other social trends that direct questioning and surveys never will. Anyone with an interest in understanding how Big Data is shaping our reaction function to the world around us will enjoy this book. The thesis of social desirability bias is a useful framework for tempering our expectations about what we can and cannot hope to achieve through data analysis across a spectrum of real-world and business applications. To the extent that data is the new oil, investors need to understand how it is collected, filtered, and broadcast, in order to have any hope of deciphering signals from noise, in markets and beyond. Caroline Miller Senior Vice President, Global Strategy A Crisis Of Beliefs: Investor Psychology And Financial Fragility By Nicola Gennaioli and Andrei Shleifer This book is partly a re-telling of the events leading up to the 2008 financial crisis, but from a much different perspective than other accounts of that period. To explain the crisis, Gennaioli and Shleifer present a model based on how people form expectations and on what can happen when those expectations are shown to be divorced from reality. We found that this model can be easily applied to the corporate credit cycle, the pattern where long periods of tightening corporate bond spreads and rising corporate debt are interrupted by short bursts of spread widening and a flurry of defaults. We even wrote a Special Report making just that connection.2 The model presented in this book should be in the back of every corporate bond investor’s mind. Because investor expectations are “extrapolative rather than rational”, corporate spreads can tighten dramatically if the recent past was trouble free. But this also means that spreads will eventually become divorced from economic reality. When that happens, even a seemingly minor event can lead to sharp spread widening and economic pain. As corporate bond investors, our chief goal should be to identify when investor expectations have deviated too far from reality, knowing that once that happens, a shock can occur at any time. Ryan Swift Vice President, US Bond Strategy The Great Delusion: Liberal Dreams And International Realities By John J. Mearsheimer The Great Delusion is a worthy attempt at making sense of the contemporary geopolitical context. John Mearsheimer – father of the offensive realism school of international relations theory – posits that “liberal hegemony”, the policy of remaking the world in America’s moral image, is bound to fail, is failing, and ought to be replaced by a more restrained policy that accepts the guardrails of geopolitics: realism and nationalism. Realist thought has been woven into the sinews of BCA’s Geopolitical Strategy since 2011. As such, we have no qualms with his discourse, but do find it unusual that he equates nationalism with realism. The latter is an a priori force compelling policymakers into the path of least resistance – and thus quite diagnostic – whereas the former is an ideology, much as the global liberalism that Mearsheimer largely criticizes as an ordering principle. This is not merely a pedantic concern. Mearsheimer is at his best when he uses realist theory to hack away at the normative and moralistic fat hanging onto the red meat of analysis. He did so at the turn of the millennium when he correctly predicted that China and the US would eventually clash, that their enmity was inevitable. His Tragedy of Great Power Politics therefore remains one of our favorite geopolitical reads. However, whenever he treats nationalism as a tool of analysis, he is thrown off the scent. In that same classic he predicted that the European Union would collapse, thrown asunder by the forces of nationalism. That forecast has not proven correct. As long as the reader keeps this track record in mind, and separates the analytical tool (realism) from a normative one (nationalism), The Great Delusion will be a fantastic read. Marko Papic Consulting Editor, BCA Research Chief Strategist, Clocktower Group Bankers And Bolsheviks: International Finance And The Russian Revolution By Hassan Malik Financial historian Hassan Malik takes us back to the first era of unchecked globalization, the late 19th century. At the time, Russia was not just a major geopolitical power, but also an investment thesis that inspired many to plunge their wealth into its frozen tundra in the search of the “next industrialization” story. What followed was one of the greatest sovereign defaults in history. Investors ignored the obvious signs of geopolitical and political risk, focusing instead on linear extrapolation of returns from similar narratives of industrialization. Given that the 1917 revolution was preceded by several major political crises, including a disastrous war in 1904-1906 and a revolution in 1905, the episode is a great warning sign to investors and illustrates the folly of a blind search for investment returns. Malik argues that the 1917 default caused by the Bolshevik Revolution was the greatest default in history. Why is the ranking important? Because Russia in 1917 was not a peripheral economy – as Greece in 2012 and Argentina in 2002 were. It was a major economy at the center of an ever-more globalizing world economy. Malik implicitly criticizes the work of Carmen Reinhart and Kenneth Rogoff – which sits on the far end of the social science spectrum – whose This Time Is Different is built upon a dataset of cases in countries that few investors could locate on a globe (although the 1876 Guatemala default episode is a riveting read!). The point Malik makes is that it is better to spend a lot of time on a critical case than to draw broad conclusions from a bevy of irrelevant ones. Marko Papic Consulting Editor, BCA Research Chief Strategist, Clocktower Group Climate Economics: Economic Analysis Of Climate, Climate Change And Climate Policy By Richard S.J. Tol Richard Tol’s book provides the necessary background for investors who wish to integrate climate-change economics into their investment process. Tol teaches Climate Change and Environmental Economics at the University of Sussex. This is an unusual book to make it to our list as it is written in a textbook format. In fact, the book is used for teaching advanced undergraduate and graduate level courses. Be that as it may, it is an excellent introduction to the economics of climate change. Climate change – and especially climate economics – is a complex and evolving field. Tol’s presentation of the core science of climate change is one of the clearest and most balanced we’ve read. It mostly uses data from the IPCC and gives a condensed – only 230 pages – and clear rundown of the projected impact of climate change and the degree of uncertainty around it as supported by present research. Building on this scientific consensus and the neoclassical approach to climate economics, the author applies various theoretical frameworks to assess the uncertainty around the climate impact on the economy, determine the optimal policy prescriptions, and to understand the interaction between adaptation and mitigation policies, and the limitations of international agreements. Some of Tol’s conclusions about climate impacts are controversial and debatable – and are even more so in his academic work for which he is occasionally considered a "climate skeptic" or "lukewarmer." Notably, the book’s final chapter concludes that the impact of climate change will be only slightly negative, and that it is easily manageable with a modest carbon tax. Tol’s controversial opinions are secondary to the sound analysis of climate-change economics he provides. For investors, we believe the prudent course of action for portfolio construction is to consider the scientific consensus developing around climate change – and the impact it will have on policymakers – and to hedge or invest appropriately. Hugo Belanger Senior Analyst, Climate Change Special Project Team Principles For Navigating Big Debt Crises By Ray Dalio Low interest rates, central bank intervention and increasingly profligate governments continue to propel debt levels around the world to record highs. Rightly, investors have grown concerned about the looming threat that a major debt crisis poses to financial markets. But how do we spot when such a crisis will come? How it could play out? How will different assets react? Dalio attempts to answer these questions through the three parts of his book: In Part I, Dalio provides his framework for thinking about both inflationary and deflationary crises. Specifically, he describes the early warning signs of a debt bubble, how each type of crisis typically plays out, and the scenarios that result from different policy responses. Part II is a detailed account of the three most significant debt crises of the past century: the hyperinflationary crisis in Germany during the 1920s; the 1930s' Great Depression; and the 2008 Housing Crisis. Part III consists of shorter accounts of 48 debt crises from different countries around the world. While the book is an exceptional compendium of financial history, its real value comes not from its descriptions of what happened but rather from its analysis of why. Dalio uses his case studies to explain the different economic, financial, and political mechanisms at work during a debt crisis, elevating the book from a history lesson to a roadmap that investors can use to understand and navigate debt crises in the future. Juan Manuel Correa Ossa Senior Analyst, Global Asset Allocation The Other Half Of Macroeconomics And Three Stages Of Economic Development By Richard C. Koo Paper by Richard C. Koo written as part of World Economics Association Conferences, 2016: Capital Accumulation, Production and Employment: Can We Bend The Arc of Global Capital Toward Justice. In this paper, Dr. Koo presents his customary case that the problem ailing advanced economies today is a lack of borrowers, not a paucity of lenders. What makes this paper different is its emphasis on the cause of this absence of borrowers. It is because of the limited investment opportunities offered by advanced economies. To understand how we got to this point, Dr. Koo introduces the concept of the Lewis Turning-Point (LTP). This is the point of economic development where all the surplus labor (mostly former farm workers) has been absorbed by urban factories. Before the LTP has been reached, real wages are stagnant, inequalities are rife and consumption growth is limited. Post the LTP, workers have stronger bargaining power; as a result real wages boom, inequality declines, and consumption growth strengthens. Moreover, because consumption is strong and labor costs are rising, companies continue to invest to service growing domestic demand and to shift much of their production function toward capital, which raises productivity. The economy thus enters a golden age, similar to the one advanced economies experienced in the post-World War Two era until the late 1970s. Dr. Koo’s key insight is that with globalization and the entry into the global supply chains of emerging markets in general and China in particular, the world has moved back to a pre-LTP environment. As a result, wages are again stagnating, inequalities are rising, productivity is declining, and growth in advanced economies is anemic. As a corollary, investment opportunities become scarcer, which is why borrowers are lacking and interest rates are low. Dr. Koo argues that solving this problem is essential, otherwise democracy will suffer, populism will rise, and so will protectionism. He advocates for advanced economies to do more to stay at the leading edge of the technological frontier in order to create opportunities for growth and insulate labor from EM competition. This requires tax and regulatory reforms and investments in human capital. Mathieu Savary Vice President, The Bank Credit Analyst Identity: The Demand For Dignity And The Politics Of Resentment By Francis Fukuyama Francis Fukuyama’s Identity is an important book, coming as it does at a time when many institutions underpinning liberal societies are being challenged by the revival of nationalism defined by race, ethnicity, and religion. This comes in the wake of sundry crises that have steadily eroded economic prospects of the middle class in numerous states – globalization, automation, immigration, financial crises, and polarization of incomes. As jobs are lost, dignity and respect are lost. This undermines democratic institutions, and paves the way for nationalism to fill the void. At the individual level, Fukuyama notes, “The nationalist can translate loss of relative economic position into loss of identity and status: you have always been a core member of our great nation, but foreigners, immigrants, and your own elite compatriots have been conspiring to hold you down; your country is no longer your own, and you are not respected in your own land.” States crave respect and recognition as well. “A host of new populist nationalist leaders claiming democratic legitimacy via elections have emphasized national sovereignty and national traditions in the interest of ‘the people,’” Fukuyama notes. Fukuyama is at pains to stress a strong national identity is not necessarily evil. Indeed it is necessary to reverse the trend toward nationalism in its more toxic forms. Strong national identities promote security – larger states unified by common beliefs are able to marshal the resources necessary to govern and defend themselves. Strong national identities allow democracy to thrive, under an implied contract between citizens and governments. These functions and roles cannot be contracted out to international organizations, as Fukuyama observes: “The functioning of democratic institutions depends on shared norms, perspectives, and ultimately culture, all of which can exist on the level of a national state, but which do not exist internationally.” Rebuilding and sustaining democracies in an age of global, instantaneous communication – which can contribute to toxic nationalism, polarization and radicalization – remains the critical work of civilized society. “We need to remember that the identities dwelling deep inside us are neither fixed nor necessarily given to us by our accidents of birth,” Fukuyama concludes. “Identity can be used to divide, but it can and has also been used to integrate. That in the end will be the remedy for the populist politics of the present.” Robert P. Ryan Chief Commodity & Energy Strategist Crashed: How A Decade Of Financial Crises Changed The World By Adam Tooze In 2007, former Federal Reserve Chairman Alan Greenspan said, “Thanks to globalization, policy decisions in the US have been largely replaced by global market forces. National security aside, it hardly makes any difference who will be the next president. The world is governed by market forces.” Historian Adam Tooze’s Crashed is a lengthy but highly readable attempt to show the folly of this statement – not cheaply to bash Greenspan, but rather to chronicle the monumental failure of the western political-economic consensus prior to the crisis and capture the magnitude of the shock that has transformed the world since. The chief value of the book for investors is that it refreshes one’s memory and understanding of the Great Recession and its aftermath within a global, rather than merely American, context. The author never loses sight of the truth that the underlying political and economic crisis is still unfolding. Events fall in their proper sequence, are weighed by the author with respect to their long-term consequences, and are placed into a larger puzzle that points to the “shape of things to come.” While many investors will feel they do not need another review of the causes and consequences of the Global Financial Crisis, the latter chapters are useful for providing an authoritative history of the post-crisis period – the latter stages of the European turmoil, the normalization of Fed policy, Brexit, and the rise of Donald Trump. We recommend the book. It is difficult to find “authoritative histories” that are not plodding. Tooze maintains a comfortable stride throughout. His tone can be a little inflated at times but he avoids academic pretensions in treating the most significant events and controversies. Our chief critique is that he is overly indulgent toward politicians in the emerging world, emphasizing their criticisms of western-led globalization to the neglect of their own corrupt mismanagement at home. Nowhere is this more apparent than in his treatment of the Chinese government. Nevertheless he generally rises to the occasion as a historian, maintaining a measured posture and casting a critical eye all around. Matt Gertken Vice President, Geopolitical Strategist The Myth Of Capitalism: Monopolies And The Death Of Competition By Jonathan Tepper, with Denise Hearn The US economy has become increasingly concentrated over the past 30 years. Just two companies comprise 90% of beer sales, five banks control over half of banking assets, Delta Airlines has an 80% market share in Atlanta, 79% of households have access to only one high-speed internet provider, and even the funeral industry is an oligopoly. The result of this concentration, Tepper argues, has been higher prices, fewer start-ups, lower productivity, lower wages, higher income inequality, less investment, and a decline in localism and diversity. “Capitalism without competition is not capitalism,” he argues. Tepper dates the trend back to the 1970s and Judge Robert Bork’s attacks on anti-trust. Bork argued that high market share by one firm was probably due to economies of scale and greater efficiency; the only thing that mattered was “consumer welfare”, i.e. lower prices. Bork’s arguments were very influential with the Reagan administration and led to fewer mergers being blocked by the Department of Justice over subsequent decades. Tepper’s solutions to excess concentration include new anti-trust laws, tougher merger enforcement based on clear rules (for example, any industry should have six or more players), new laws on predatory pricing, a shorter time-limit on patents and copyrights, a limit to share buybacks – and even a ban on horizontal shareholdings (no shareholder should be able to buy more than 5% of shares in competitors in the same industry). This is an important book, with vigorous writing, good data, and detailed examples of distorting competition. But it is also rather polemical and over-written. While Tepper’s aim is to improve capitalism not replace it, some of his proposals on reregulation and his anti-business rhetoric will put off many readers. He is also weak on the legal framework of anti-trust regulation, and barely covers the situation outside the US (does Europe’s tougher competition policy work better?). Readers looking for a more sober and nuanced (but also less readable) treatment might prefer The Great Reversal: How America Gave Up On Free Markets by Thomas Philippon. Garry Evans Chief Global Asset Allocation Strategist Footnotes 1 Please see GAA Special Reports, “The Books Every CIO Should Read”, dated 7 December 2017, and “Investment Books Of The Year”, dated 12 December 2016, available at gaa.bcaresearch.com 2 Please see US Bond Strategy Special Report, “The Risk From US Corporate Debt: Theory And Evidence”, dated April 23, 2019, available at usbs.bcaresearch.com Strategy & Market Trends Strategic Recommendations Closed Trades
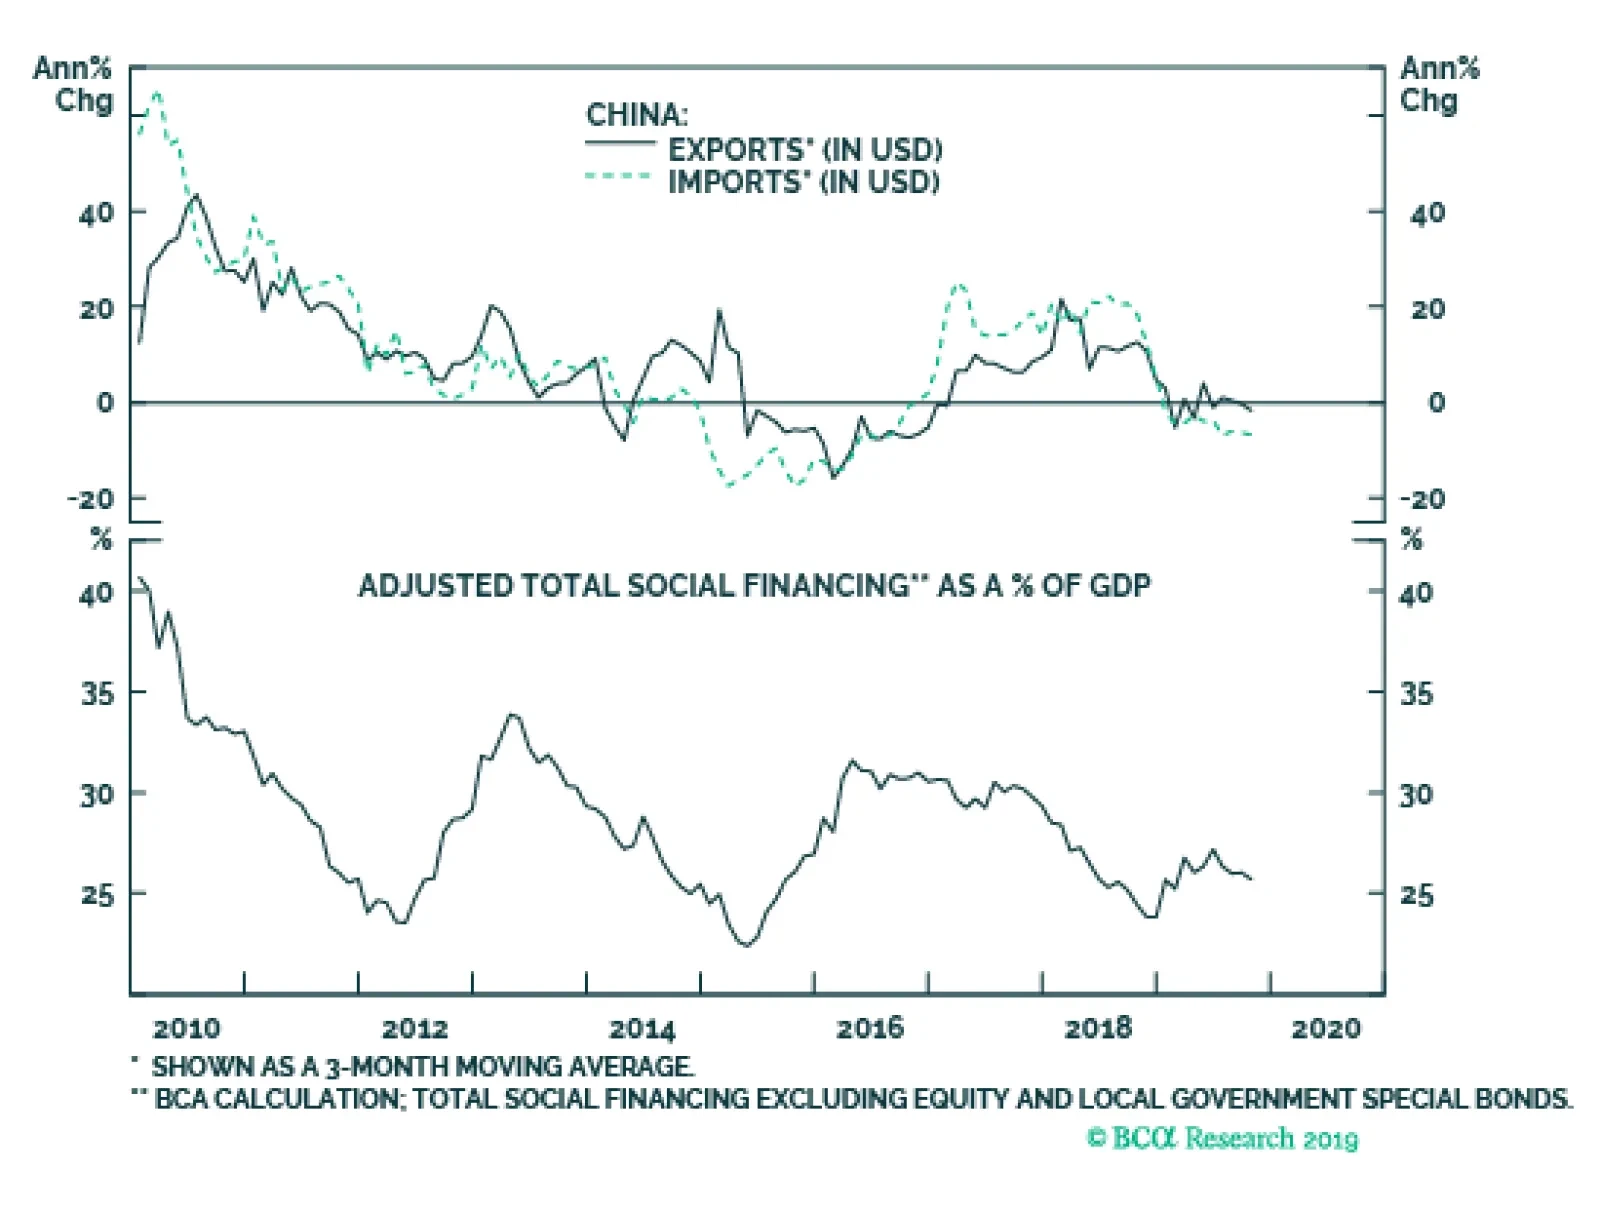
Next week, we will focus on the following key six items: The FOMC meeting ending Wednesday. We do not expect the Fed to adjust policy, but the new set of economic forecasts will give a glimpse into how the FOMC expects the economy and policy to evolve…
Highlights A 400k b/d addition to OPEC 2.0’s official production cut of 1.2mm b/d will have little effect on actual supplies. The market already has seen ~ 2.0mm to 2.5mm b/d of output removed from the market via excess voluntary cuts (e.g., from Saudi Arabia and others) and involuntary cuts (e.g., from Iran and Venezuela). The incremental 400k b/d would just be another target for free-rider states to ignore. However, if Iraq and other states with on-and-off compliance at the margin can be persuaded to follow through on producing at lower quotas following OPEC 2.0’s meetings today and tomorrow, markets could rally as actual output falls (Chart of the Week). A rally on the back of lower OPEC 2.0 production would support the IPO of Saudi Aramco, which is expected to price while the producer coalition is meeting in Vienna. Production from the “Other Guys” – our moniker for all producers excluding Gulf OPEC, US shale and Russia – will account for a lesser and lesser share of global output. New production – much of it from the last of the big conventional projects sanctioned prior to the 2014 price collapse – from Norway, Brazil, Guyana and the US Gulf of Mexico will come on strong in 2020 – but most of this has been priced in already. The rate of growth of US shale-oil production will slow. Feature Brent crude oil prices could get a boost from OPEC 2.0, if free-rider states – specifically Iraq and states with marginal quota compliance shown in the Chart of the Week – actually were to abide by production cuts they agree to. This would be amplified if cuts are extended to end-June, from end-March. The impact would be marginal, to be sure, given most of the production cuts that matter to the market already are in place – i.e., Saudi Arabia’s overcompliance of ~ 400k b/d, and Iran and Venezuela’s involuntary production cuts of ~ 1.8mm b/d resulting from US sanctions, as of October 2019. Ahead of the Vienna meetings today and tomorrow, the putative leaders of the producer coalition – the Kingdom of Saudi Arabia (KSA) and Russia – have been lobbying at cross purposes. KSA is seeking support for deeper cuts and an extension to mid-year of the deal. Russia is lobbying to keep the original deal’s expiry at end-March, and also is seeking to have its ultra-light crude (i.e., condensates) production excluded from its quota, as it is from OPEC members’ production calculations. Russia is creating additional volumes of condensate – ~ 800k b/d this year of its total 11.2mm b/d output – to dispose of as it ramps natural gas production to new feed markets, particularly China.1 Our expectation is the production-cutting deal will be extended to end-June with an official target of 1.6mm b/d removed from the market. Whether the new deal matters to the market will depend on the actions of heretofore free-rider OPEC 2.0 states. Prices could go up, but market share for the producer coalition will remain under pressure (Chart 2). Chart of the WeekAdditional OPEC 2.0 Cuts Could Be Bullish For Crude Oil
On OPEC 2.0’s Agenda In Vienna: More Production Cuts, Longer Deal
On OPEC 2.0’s Agenda In Vienna: More Production Cuts, Longer Deal
Chart 2OPEC 2.0 Market Share Under Pressure
OPEC 2.0 Market Share Under Pressure
OPEC 2.0 Market Share Under Pressure
Saudi Aramco IPO Due To Price Follow-through by all OPEC 2.0 members on additional production cuts would benefit Saudi Arabia, as it is expected to price the Saudi Aramco IPO while the producer coalition is meeting in Vienna. The Aramco IPO price is expected to value the company between $1.5 and $1.8 trillion. We recently looked at the IPO and believe Aramco will be valued closer to $2 trillion than to $1 trillion, the literal range in which the offering was being valued by banks and analysts.2 To briefly recap, in the first six months of this year, Aramco produced 10.0mm b/d of crude oil and condensates. Aramco accounted for 12.5% of global crude output in 2016 - 18 and reported in its red herring that its proved liquids reserves were ~ five times larger than the combined proved liquids reserves of the five major independent oil companies. Aramco’s 3.1mm b/d of refining capacity makes it the fourth largest integrated refiner in the world. In 2018, Aramco’s free cash flow amounted to almost $86 billion. Net income last year was $111 billion, more than the combined profits of the next six largest oil companies in the world. For its first year as a public company, Aramco has indicated it will pay an annual dividend of $75 billion. Improving compliance with the OPEC 2.0 production-cutting deal is of obvious importance for the Aramco IPO. The member states are quick to stress they support the deal and will do their part, but free riding has been a problem in terms of compliance. As we noted above, full compliance will lower OPEC 2.0 crude oil production from current levels, but Saudi Arabia’s voluntary over-compliance, coupled with the involuntary production losses from Iran and Venezuela already are doing most of the work in restraining production. The “Other Guys” Continue Treading Water Since 2010, most of the growth in world oil production came from three regions: US onshore shale-oil producers, Gulf OPEC and Russia. These regions added 14mm b/d of supply between 2010 and 2019. The “Other Guys” often are overlooked in the oil market, but they still accounted for 45% of global oil production this year on average. Production from the “Other Guys” – our moniker for all producers excluding Gulf OPEC, US shale and Russia – has been falling as a share of global production for years, due to a lack of domestic and foreign direct investment in their energy sectors. We expect their production will remain flat next year and could start falling in 2021. The “Other Guys” often are overlooked in the oil market, but they still accounted for 45% of global oil production this year on average: Their combined output was ~ 45mm b/d of crude and liquids (Chart 3). The “Other Guys’” production is mostly long-cycle projects and these countries do not possess spare capacity. Thus, they are reacting to oil prices and maximizing production now, if they can. Even so, their share of global production continues to fall (Chart 4). Chart 3The "Other Guys" Production Is Stagnant
The "Other Guys" Production Is Stagnant
The "Other Guys" Production Is Stagnant
Chart 4The "Other Guys" Market Share Plummets
The "Other Guys" Market Share Plummets
The "Other Guys" Market Share Plummets
The 3- to 5-year lag between final investment decisions and first production for projects in these states strongly suggests the global oil market is entering a period of lower supply additions from the “Other Guys,” given the last mega-projects were probably sanctioned in 2014 while prices still were above $100/bbl for both Brent and WTI. The "Other Guys’" rig count recovered, along with oil prices, since the 2016 downturn. However, this is still a low level of rigs vs. the 2010-2014 period – a period during which production from this group barely grew despite prices averaging more than $100/bbl. We expect their rig count to remain weak next year (Chart 5). Conventional production takes time to ramp up, therefore we should not expect a large increase in production over the next few years. Chart 5The "Other Guys" Rig Counts Will Remain Under Pressure
The "Other Guys" Rig Counts Will Remain Under Pressure
The "Other Guys" Rig Counts Will Remain Under Pressure
Oil Supply Looks Tighter Toward 2021 Globally, the last of the big projects sanctioned prior to the oil-price collapse beginning in 2H14 and lasting to 1H16 are coming online in Norway, Brazil, Guyana and the US Gulf. Up to this year, US onshore production was the sole growing region globally. If capital discipline caps growth prospects in key US shale basins, global oil supply will grow only modestly in 2020 and 2021. For the most part, the “Other Guys” haven't been attracting the capital needed to sustain and grow their production. Given the ongoing drive by E&P companies globally to return capital to shareholders via buybacks or dividends, and the insistence of capital markets to fund only solid, profitable projects, capital likely will remain constrained for the “Other Guys.” States that were able to attract capital prior to the 2014 oil price collapse – Canada, Brazil, Norway, Guyana and the US – are expected to increase production next year; however, we believe much of this production increase already has been priced in by the market, as it has been by BCA (Chart 6). In our balances, we have oil production for Canada up 50k b/d next year vs 2019; Brazil +330k b/d and Norway +360k b/d. This is 740k b/d ex-Guyana in 2020. Guyana is still doing exploratory drilling and recently announced they expect to have their first commercial flows online this month. Oil markets are expecting initial commercial flows of ~ 120k b/d between December and 1Q20, and a ramp to 750k b/d by 2025, which would be significant. We will be updating our balances in two weeks, in our final publication of the year. Up to this year, US onshore production was the sole growing region globally. If capital discipline caps growth prospects in key US shale basins, global oil supply will grow only modestly in 2020 and 2021 (Chart 7). US shale output reaches ~ 9.35mm b/d on average next year in the Big Five basins (Permian, Eagle Ford, Bakken, Niobrara and Anadarko), in our modeling. This amounts to an 800k b/d increase in our US lower 48 production estimate for the US, vs. a 900k b/d increase we expected earlier.3 Chart 6"The New Guys" Production vs. The "Other Guys" Production
"The New Guys" Production vs. The "Other Guys" Production
"The New Guys" Production vs. The "Other Guys" Production
Chart 7US Shale Oil Production Growth Will Slow
US Shale Oil Production Growth Will Slow
US Shale Oil Production Growth Will Slow
Going forward, it is important to re-emphasize that even the prolific shales in the US are being constrained by investors demanding the shale guys either return capital to shareholders via share buybacks or steady dividends and dividend increases. If they don’t accommodate investor interests, these shale producers – and all oil producers for that matter – will simply be denied access to funding markets. Capital is, finally, the binding constraint on the growth of global oil supplies. This has not always been the case, as we’ve noted. 2020 Could See Stronger Prices Markets generally are responding as expected to more accommodative financial conditions globally, which will allow oil demand growth, particularly in the EM economies, to revive in 2020. As a result, we are maintaining our expectation for growth of 1.4mm b/d next year, which is up 300k b/d from our expectation for growth this year. The rebound in demand we expect next year will force prices higher to incentivize additional supply and the release of inventories – mostly in 2H20. This will push the entire futures curve up, especially nearby futures, which will steepen the backwardation in Brent and WTI futures. Bottom Line: Further actual production cuts by OPEC 2.0, emerging threats to US shale growth, and stagnant output from the “Other Guys” facing off against higher demand growth next year could result in higher prices than we currently expect for 2020 – i.e., $67/bbl for Brent and $63/bbl for WTI. Robert P. Ryan Chief Commodity & Energy Strategist rryan@bcaresearch.com Hugo Bélanger Senior Analyst Commodity & Energy Strategy HugoB@bcaresearch.com Market Round-Up Energy: Overweight Brent prices remain stuck between $60/bbl and $65/bbl awaiting clear signals about the US-China trade negotiations and OPEC 2.0’s decisions on its supply management beyond March 2020. Money managers are increasing their net long position, expecting bullish news on both these developments. They are increasing their Brent exposure to 414k long contracts vs. 64k short. Base Metals: Neutral SHFE copper inventories fell 11% on a week on week basis to 120k MT as of last Friday. Combined, the LME, COMEX and SHFE fell by 6%. The larger decline in Chinese inventory is partly attributed to the reduced import quotas on copper scraps, which limited the total available supply to meet domestic demand. As discussed in last week’s report, fundamentals in the two largest components of the LMEX – i.e. copper and aluminum – are tight and the rebound in demand showing up in our proprietary indicators will support prices. We remain long the LMEX tactically. Last week, we recommended getting long the LMEX index. We have subsequently learned the LME ceases trading the index. We will, nonetheless, continue to track the reported level of the index, as if it were tradeable. Precious Metals: Neutral Closing at $1479/bbl on Tuesday, gold prices broke out of the narrow range in which the metal has traded over the past month. Gold’s daily-return 1-year rolling correlation with the U.S. dollar is at its weakest level since 2011 and is below the 5th percentile of its distribution since 2004. On the other hand, the correlation with U.S. 10-year TIPS yields is strengthening and is now above the 95th percentile of its distribution. As safe-haven demand dissipates – alongside the rebound in global growth we expect – we believe these correlations will move back to their historical relationships, supporting gold as the U.S. dollar depreciates. Ags/Softs: Underweight CBOT Corn March Futures Contracts rallied at the beginning of the week on the back of a blizzard in the Midwest that stalled the already delayed corn harvest, which the USDA reported to be 89% complete as of Dec. 1, well behind the five-year average of 98%. After reaching multi-months highs last week, wheat futures fell due to profit taking and weaker than expected export figures. Soybean fell for the eighth straight day on Monday, with the most active contract closing at $8.73/Bu, the lowest in six months. A possible delay in the US-China trade deal together with expectations of a bumper crop in Brazil remain headwinds to prices.
Money Managers Increasing Brent Long Positions
Money Managers Increasing Brent Long Positions
On OPEC 2.0’s Agenda In Vienna: More Production Cuts, Longer Deal
On OPEC 2.0’s Agenda In Vienna: More Production Cuts, Longer Deal
Footnotes 1 Please see Russia to press OPEC+ to change its oil output calculations published by reuters.com November 27, 2019. 2 Please see our Special Report Aramco’s IPO: The Tie That Binds KSA And China, published November 15, 2019. It is available at ces.bcaresearch.com. 3 We discuss further risks to shale oil production growth in Lingering Oil-Demand Weakness Will Fade, including the high levels of flaring in the Permian and Bakken basins. This report is available at ces.bcaresearch.com. Investment Views and Themes Recommendations Strategic Recommendations Tactical Trades TRADE RECOMMENDATION PERFORMANCE IN 2019 Q3
On OPEC 2.0’s Agenda In Vienna: More Production Cuts, Longer Deal
On OPEC 2.0’s Agenda In Vienna: More Production Cuts, Longer Deal
Commodity Prices and Plays Reference Table Trades Closed in 2019 Summary of Closed Trades
On OPEC 2.0’s Agenda In Vienna: More Production Cuts, Longer Deal
On OPEC 2.0’s Agenda In Vienna: More Production Cuts, Longer Deal
Highlights To answer that question, the GAA team asked BCA Research’s strategists for suggestions of recent books that helped their understanding of the world economy or of how to invest. Their suggestions include books on artificial intelligence, the information in Google searches, debt crises, the growing monopolization of the US economy, and the death of “liberal hegemony”. Some recommendations are more esoteric: a textbook on climate economics, a paper on the Lewis Turning-Point, and the history of Russia’s 1917 default. Feature “What’s the best thing you read recently?” was the rather sharp question we were asked by a client not long ago. BCA Research believes that one of its roles is to contribute to the intellectual debate on what drives the economy and investment markets…indeed, simply what makes the world tick. Part of that is sharing interesting books (or articles or academic papers) that deserve to be widely read and discussed. The client question set us thinking. Twice in recent years, ahead of the holiday season, Global Asset Allocation has published a list of its favorite investment-related books that clients might read during down-time over the break.1 So this time we polled our senior colleagues at BCA Research on what they had read this year that most aided their understanding of the global economy or investment. We asked them to limit their choice to something published recently (say, in the past year or two). The 12 items they picked follow (in no particular order). Most are well-known books, published this year and favorably reviewed. But some are a little more obscure (the lessons from Russia’s default of 1917, for instance). Our strategists also identified a must-read university-level textbook (on climate economics) and a seminal Richard Koo conference paper on why there is a lack of borrowers globally. We are sure you will find much here for stimulating and entertaining reading during the holidays. Life 3.0: Being Human In The Age Of Artificial Intelligence By Max Tegmark The only thing special about human intelligence is that it is the minimum level necessary to create a technologically advanced society. What happens when artificial intelligence reaches human capabilities? At that point, there will be an intelligence explosion, argues Max Tegmark in his new book Life 3.0. AI will be smart enough to figure out how to make itself even smarter which, in turn, will allow it to make itself smarter still. Forget about a Star Trek future. AI will blow through that in the blink of an eye. Within days, or perhaps even hours, AI will be constrained only by the laws of physics. When will this day arrive? No one really knows, although Tegmark notes that the median estimate among AI researchers is somewhere around 2050. Not imminent, but still within the lifetime of most investors. What role will finance and economics play in this brave new world? Scarcity is the bedrock on which economics is built. Diamonds cost more than water not because water is less useful – life could not exist without it – but because diamonds are much more scarce than water. Will the cornucopia produced by superhuman AI render the market mechanism obsolete? It is possible. Even before that fateful day when AI surpasses human capabilities, advances in AI technologies will leave their mark on society. Workers who can harness AI to increase their productivity will benefit. Workers who are displaced by AI will suffer. The demand for redistributive policies will grow. Efforts to rein in companies that gain monopolistic control over AI technologies will intensify. More worrying, superintelligent AI may eventually render all humans – including the original creators of the AI – obsolete. Tegmark spends a lot of time discussing the difficulty in getting advanced AI to understand, adopt, and retain the goals that its human masters try to program into it. The risk is not of a “Terminator” style scenario. Rather, it is that superintelligent AI will end up treating humans with the same ambivalence we treat ants: You may not purposely try to step on an ant while you are walking in the woods, but if you do, well, tough luck for the ant. Failure to apply to AI research the sort of safety engineering that made the lunar landing possible could be humanity’s ultimate undoing. Peter Berezin Chief Global Strategist Narrative Economics: How Stories Go Viral And Drive Major Economic Events By Robert J. Shiller Shiller’s Narrative Economics is a book within the realm of behavioral economics, but it is distinct in its focus on how ideas that turn out to have significant economic influence begin, spread, and die (if they die!). Shiller metaphorically links the adoption of economic narratives to the spread of diseases, noting that both occur through interpersonal contact. A framework exists to model the latter, and Shiller argues that this is an excellent starting-point to understand the spread of ideas with important economic implications. Like most behavioral research to date, the book is foundational rather than definitive: it presents a helpful conceptual framework to think about the “transmission” of influential economic ideas but, after reading the book, investors will not walk away with any specific tools to predict when and how economic narratives will influence macroeconomic behavior or asset prices. Still, we liked the book because it gets the reader thinking about how to identify narratives. Investors have already seen several false narratives emerge this cycle: the hyperinflationary nature of quantitative easing, that low interest rates mean low inflation (neo-Fisherian economics), comparisons to 1938 at the onset of US monetary policy normalization, the inevitably of debt deflation in China, and the imminence of a US fiscal crisis are just a few examples. The mere practice of identifying narratives should increase the ability of investors to identify which narratives are more likely to be right or wrong, and we would challenge our clients to read Shiller’s book with the narrative of secular stagnation in mind. True or false? Jonathan LaBerge, CFA Vice President, Special Reports Everybody Lies: Big Data, New Data, And What The Internet Can Tell Us About Who We Really Are By Seth Stephens-Davidowitz Stephens-Davidowitz argues that people’s personal Google search history amounts to digital truth serum, the opposite of one’s carefully curated public social-media footprint. The book examines the new age of Big Data from a sociological lens, and offers vital insights about the pitfalls of this new discipline – data science – which is still in its infancy. The critical premise is that people’s primordial need to look good, and equally, avoid looking bad, drives their digital behavior. A person’s search history reveals their inner hopes, dreams, fears, and anxieties in the same way that their social media presence obscures them. In this way, Big Data can be harnessed to uncover unaddressed suffering, political bias, inequality of opportunity, and a host of other social trends that direct questioning and surveys never will. Anyone with an interest in understanding how Big Data is shaping our reaction function to the world around us will enjoy this book. The thesis of social desirability bias is a useful framework for tempering our expectations about what we can and cannot hope to achieve through data analysis across a spectrum of real-world and business applications. To the extent that data is the new oil, investors need to understand how it is collected, filtered, and broadcast, in order to have any hope of deciphering signals from noise, in markets and beyond. Caroline Miller Senior Vice President, Global Strategy A Crisis Of Beliefs: Investor Psychology And Financial Fragility By Nicola Gennaioli and Andrei Shleifer This book is partly a re-telling of the events leading up to the 2008 financial crisis, but from a much different perspective than other accounts of that period. To explain the crisis, Gennaioli and Shleifer present a model based on how people form expectations and on what can happen when those expectations are shown to be divorced from reality. We found that this model can be easily applied to the corporate credit cycle, the pattern where long periods of tightening corporate bond spreads and rising corporate debt are interrupted by short bursts of spread widening and a flurry of defaults. We even wrote a Special Report making just that connection.2 The model presented in this book should be in the back of every corporate bond investor’s mind. Because investor expectations are “extrapolative rather than rational”, corporate spreads can tighten dramatically if the recent past was trouble free. But this also means that spreads will eventually become divorced from economic reality. When that happens, even a seemingly minor event can lead to sharp spread widening and economic pain. As corporate bond investors, our chief goal should be to identify when investor expectations have deviated too far from reality, knowing that once that happens, a shock can occur at any time. Ryan Swift Vice President, US Bond Strategy The Great Delusion: Liberal Dreams And International Realities By John J. Mearsheimer The Great Delusion is a worthy attempt at making sense of the contemporary geopolitical context. John Mearsheimer – father of the offensive realism school of international relations theory – posits that “liberal hegemony”, the policy of remaking the world in America’s moral image, is bound to fail, is failing, and ought to be replaced by a more restrained policy that accepts the guardrails of geopolitics: realism and nationalism. Realist thought has been woven into the sinews of BCA’s Geopolitical Strategy since 2011. As such, we have no qualms with his discourse, but do find it unusual that he equates nationalism with realism. The latter is an a priori force compelling policymakers into the path of least resistance – and thus quite diagnostic – whereas the former is an ideology, much as the global liberalism that Mearsheimer largely criticizes as an ordering principle. This is not merely a pedantic concern. Mearsheimer is at his best when he uses realist theory to hack away at the normative and moralistic fat hanging onto the red meat of analysis. He did so at the turn of the millennium when he correctly predicted that China and the US would eventually clash, that their enmity was inevitable. His Tragedy of Great Power Politics therefore remains one of our favorite geopolitical reads. However, whenever he treats nationalism as a tool of analysis, he is thrown off the scent. In that same classic he predicted that the European Union would collapse, thrown asunder by the forces of nationalism. That forecast has not proven correct. As long as the reader keeps this track record in mind, and separates the analytical tool (realism) from a normative one (nationalism), The Great Delusion will be a fantastic read. Marko Papic Consulting Editor, BCA Research Chief Strategist, Clocktower Group Bankers And Bolsheviks: International Finance And The Russian Revolution By Hassan Malik Financial historian Hassan Malik takes us back to the first era of unchecked globalization, the late 19th century. At the time, Russia was not just a major geopolitical power, but also an investment thesis that inspired many to plunge their wealth into its frozen tundra in the search of the “next industrialization” story. What followed was one of the greatest sovereign defaults in history. Investors ignored the obvious signs of geopolitical and political risk, focusing instead on linear extrapolation of returns from similar narratives of industrialization. Given that the 1917 revolution was preceded by several major political crises, including a disastrous war in 1904-1906 and a revolution in 1905, the episode is a great warning sign to investors and illustrates the folly of a blind search for investment returns. Malik argues that the 1917 default caused by the Bolshevik Revolution was the greatest default in history. Why is the ranking important? Because Russia in 1917 was not a peripheral economy – as Greece in 2012 and Argentina in 2002 were. It was a major economy at the center of an ever-more globalizing world economy. Malik implicitly criticizes the work of Carmen Reinhart and Kenneth Rogoff – which sits on the far end of the social science spectrum – whose This Time Is Different is built upon a dataset of cases in countries that few investors could locate on a globe (although the 1876 Guatemala default episode is a riveting read!). The point Malik makes is that it is better to spend a lot of time on a critical case than to draw broad conclusions from a bevy of irrelevant ones. Marko Papic Consulting Editor, BCA Research Chief Strategist, Clocktower Group Climate Economics: Economic Analysis Of Climate, Climate Change And Climate Policy By Richard S.J. Tol Richard Tol’s book provides the necessary background for investors who wish to integrate climate-change economics into their investment process. Tol teaches Climate Change and Environmental Economics at the University of Sussex. This is an unusual book to make it to our list as it is written in a textbook format. In fact, the book is used for teaching advanced undergraduate and graduate level courses. Be that as it may, it is an excellent introduction to the economics of climate change. Climate change – and especially climate economics – is a complex and evolving field. Tol’s presentation of the core science of climate change is one of the clearest and most balanced we’ve read. It mostly uses data from the IPCC and gives a condensed – only 230 pages – and clear rundown of the projected impact of climate change and the degree of uncertainty around it as supported by present research. Building on this scientific consensus and the neoclassical approach to climate economics, the author applies various theoretical frameworks to assess the uncertainty around the climate impact on the economy, determine the optimal policy prescriptions, and to understand the interaction between adaptation and mitigation policies, and the limitations of international agreements. Some of Tol’s conclusions about climate impacts are controversial and debatable – and are even more so in his academic work for which he is occasionally considered a "climate skeptic" or "lukewarmer." Notably, the book’s final chapter concludes that the impact of climate change will be only slightly negative, and that it is easily manageable with a modest carbon tax. Tol’s controversial opinions are secondary to the sound analysis of climate-change economics he provides. For investors, we believe the prudent course of action for portfolio construction is to consider the scientific consensus developing around climate change – and the impact it will have on policymakers – and to hedge or invest appropriately. Hugo Belanger Senior Analyst, Climate Change Special Project Team Principles For Navigating Big Debt Crises By Ray Dalio Low interest rates, central bank intervention and increasingly profligate governments continue to propel debt levels around the world to record highs. Rightly, investors have grown concerned about the looming threat that a major debt crisis poses to financial markets. But how do we spot when such a crisis will come? How it could play out? How will different assets react? Dalio attempts to answer these questions through the three parts of his book: In Part I, Dalio provides his framework for thinking about both inflationary and deflationary crises. Specifically, he describes the early warning signs of a debt bubble, how each type of crisis typically plays out, and the scenarios that result from different policy responses. Part II is a detailed account of the three most significant debt crises of the past century: the hyperinflationary crisis in Germany during the 1920s; the 1930s' Great Depression; and the 2008 Housing Crisis. Part III consists of shorter accounts of 48 debt crises from different countries around the world. While the book is an exceptional compendium of financial history, its real value comes not from its descriptions of what happened but rather from its analysis of why. Dalio uses his case studies to explain the different economic, financial, and political mechanisms at work during a debt crisis, elevating the book from a history lesson to a roadmap that investors can use to understand and navigate debt crises in the future. Juan Manuel Correa Ossa Senior Analyst, Global Asset Allocation The Other Half Of Macroeconomics And Three stages Of Economic Development By Richard C. Koo Paper by Richard C. Koo written as part of World Economics Association Conferences, 2016: Capital Accumulation, Production and Employment: Can We Bend The Arc of Global Capital Toward Justice. In this paper, Dr. Koo presents his customary case that the problem ailing advanced economies today is a lack of borrowers, not a paucity of lenders. What makes this paper different is its emphasis on the cause of this absence of borrowers. It is because of the limited investment opportunities offered by advanced economies. To understand how we got to this point, Dr. Koo introduces the concept of the Lewis Turning-Point (LTP). This is the point of economic development where all the surplus labor (mostly former farm workers) has been absorbed by urban factories. Before the LTP has been reached, real wages are stagnant, inequalities are rife and consumption growth is limited. Post the LTP, workers have stronger bargaining power; as a result real wages boom, inequality declines, and consumption growth strengthens. Moreover, because consumption is strong and labor costs are rising, companies continue to invest to service growing domestic demand and to shift much of their production function toward capital, which raises productivity. The economy thus enters a golden age, similar to the one advanced economies experienced in the post-World War Two era until the late 1970s. Dr. Koo’s key insight is that with globalization and the entry into the global supply chains of emerging markets in general and China in particular, the world has moved back to a pre-LTP environment. As a result, wages are again stagnating, inequalities are rising, productivity is declining, and growth in advanced economies is anemic. As a corollary, investment opportunities become scarcer, which is why borrowers are lacking and interest rates are low. Dr. Koo argues that solving this problem is essential, otherwise democracy will suffer, populism will rise, and so will protectionism. He advocates for advanced economies to do more to stay at the leading edge of the technological frontier in order to create opportunities for growth and insulate labor from EM competition. This requires tax and regulatory reforms and investments in human capital. Mathieu Savary Vice President, The Bank Credit Analyst Identity: The Demand For Dignity And The Politics Of Resentment By Francis Fukuyama Francis Fukuyama’s Identity is an important book, coming as it does at a time when many institutions underpinning liberal societies are being challenged by the revival of nationalism defined by race, ethnicity, and religion. This comes in the wake of sundry crises that have steadily eroded economic prospects of the middle class in numerous states – globalization, automation, immigration, financial crises, and polarization of incomes. As jobs are lost, dignity and respect are lost. This undermines democratic institutions, and paves the way for nationalism to fill the void. At the individual level, Fukuyama notes, “The nationalist can translate loss of relative economic position into loss of identity and status: you have always been a core member of our great nation, but foreigners, immigrants, and your own elite compatriots have been conspiring to hold you down; your country is no longer your own, and you are not respected in your own land.” States crave respect and recognition as well. “A host of new populist nationalist leaders claiming democratic legitimacy via elections have emphasized national sovereignty and national traditions in the interest of ‘the people,’” Fukuyama notes. Fukuyama is at pains to stress a strong national identity is not necessarily evil. Indeed it is necessary to reverse the trend toward nationalism in its more toxic forms. Strong national identities promote security – larger states unified by common beliefs are able to marshal the resources necessary to govern and defend themselves. Strong national identities allow democracy to thrive, under an implied contract between citizens and governments. These functions and roles cannot be contracted out to international organizations, as Fukuyama observes: “The functioning of democratic institutions depends on shared norms, perspectives, and ultimately culture, all of which can exist on the level of a national state, but which do not exist internationally.” Rebuilding and sustaining democracies in an age of global, instantaneous communication – which can contribute to toxic nationalism, polarization and radicalization – remains the critical work of civilized society. “We need to remember that the identities dwelling deep inside us are neither fixed nor necessarily given to us by our accidents of birth,” Fukuyama concludes. “Identity can be used to divide, but it can and has also been used to integrate. That in the end will be the remedy for the populist politics of the present.” Robert P. Ryan Chief Commodity & Energy Strategist Crashed: How A Decade Of Financial Crises Changed The World By Adam Tooze In 2007, former Federal Reserve Chairman Alan Greenspan said, “Thanks to globalization, policy decisions in the US have been largely replaced by global market forces. National security aside, it hardly makes any difference who will be the next president. The world is governed by market forces.” Historian Adam Tooze’s Crashed is a lengthy but highly readable attempt to show the folly of this statement – not cheaply to bash Greenspan, but rather to chronicle the monumental failure of the western political-economic consensus prior to the crisis and capture the magnitude of the shock that has transformed the world since. The chief value of the book for investors is that it refreshes one’s memory and understanding of the Great Recession and its aftermath within a global, rather than merely American, context. The author never loses sight of the truth that the underlying political and economic crisis is still unfolding. Events fall in their proper sequence, are weighed by the author with respect to their long-term consequences, and are placed into a larger puzzle that points to the “shape of things to come.” While many investors will feel they do not need another review of the causes and consequences of the Global Financial Crisis, the latter chapters are useful for providing an authoritative history of the post-crisis period – the latter stages of the European turmoil, the normalization of Fed policy, Brexit, and the rise of Donald Trump. We recommend the book. It is difficult to find “authoritative histories” that are not plodding. Tooze maintains a comfortable stride throughout. His tone can be a little inflated at times but he avoids academic pretensions in treating the most significant events and controversies. Our chief critique is that he is overly indulgent toward politicians in the emerging world, emphasizing their criticisms of western-led globalization to the neglect of their own corrupt mismanagement at home. Nowhere is this more apparent than in his treatment of the Chinese government. Nevertheless he generally rises to the occasion as a historian, maintaining a measured posture and casting a critical eye all around. Matt Gertken Vice President, Geopolitical Strategist The Myth Of Capitalism: Monopolies And The Death Of Competition By Jonathan Tepper, with Denise Hearn The US economy has become increasingly concentrated over the past 30 years. Just two companies comprise 90% of beer sales, five banks control over half of banking assets, Delta Airlines has an 80% market share in Atlanta, 79% of households have access to only one high-speed internet provider, and even the funeral industry is an oligopoly. The result of this concentration, Tepper argues, has been higher prices, fewer start-ups, lower productivity, lower wages, higher income inequality, less investment, and a decline in localism and diversity. “Capitalism without competition is not capitalism,” he argues. Tepper dates the trend back to the 1970s and Judge Robert Bork’s attacks on anti-trust. Bork argued that high market share by one firm was probably due to economies of scale and greater efficiency; the only thing that mattered was “consumer welfare”, i.e. lower prices. Bork’s arguments were very influential with the Reagan administration and led to fewer mergers being blocked by the Department of Justice over subsequent decades. Tepper’s solutions to excess concentration include new anti-trust laws, tougher merger enforcement based on clear rules (for example, any industry should have six or more players), new laws on predatory pricing, a shorter time-limit on patents and copyrights, a limit to share buybacks – and even a ban on horizontal shareholdings (no shareholder should be able to buy more than 5% of shares in competitors in the same industry). This is an important book, with vigorous writing, good data, and detailed examples of distorting competition. But it is also rather polemical and over-written. While Tepper’s aim is to improve capitalism not replace it, some of his proposals on reregulation and his anti-business rhetoric will put off many readers. He is also weak on the legal framework of anti-trust regulation, and barely covers the situation outside the US (does Europe’s tougher competition policy work better?). Readers looking for a more sober and nuanced (but also less readable) treatment might prefer The Great Reversal: How America Gave Up On Free Markets by Thomas Philippon. Garry Evans Chief Global Asset Allocation Strategist Footnotes 1 Please see GAA Special Reports, “The Books Every CIO Should Read”, dated 7 December 2017, and “Investment Books Of The Year”, dated 12 December 2016, available at gaa.bcaresearch.com 2 Please see US Bond Strategy Special Report, “The Risk From US Corporate Debt: Theory And Evidence”, dated April 23, 2019, available at usbs.bcaresearch.com