Global

Highlights The Chinese government will be applying more scrutiny and tighter oversight over lending for ‘Belt and Road’ Initiative (BRI) projects going forward. As a result, total BRI investment with Chinese financing will fall moderately – by 5% to US$135 billion in 2020 from US$142 billion in 2019. BRI investment is too small relative to mainland capital spending. Hence, the global outlook for capital goods and industrial commodities will be driven by Chinese capex, not BRI. BRI Overview Chart I-1Chinese BRI Investment: Likely To Decline In 2020
Chinese BRI Investment: Likely To Decline In 2020
Chinese BRI Investment: Likely To Decline In 2020
China has been promoting and implementing its strategic ‘Belt and Road’ Initiative (BRI) since late 2013. The country has so far signed about 200 BRI cooperation documents with 137 countries and 30 international organizations. The government’s strong push has resulted in a surge in Chinese BRI investment, albeit with a major downturn in 2018 (Chart I-1). BRI projects center on infrastructure development such as transportation (railways, highways, subways and bridges), energy (power plants and pipelines) and telecommunications infrastructure in recipient countries covered by the BRI program. Chart I-2 demonstrates the geographical reach of the BRI as well as transportation linkages/routes being built and funded by it. We discussed the BRI in great detail in a special report published in September 2017. Chart I-2The Belt And Road Program
China’s Belt And Road Initiative: Entering A Cooling-Down Phase
China’s Belt And Road Initiative: Entering A Cooling-Down Phase
The cumulative size of the signed contracts with BRI-recipient countries over the past six years is about US$700 billion, of which US$460 billion has already been completed. However, the value of newly signed contracts in a year does not equal the actual project investment that occurred in that year, as these contracts generally take several years to be implemented and completed. In this report, “BRI investment” encompasses realized investments for BRI projects, which we derive from the official data of “BRI newly signed contracts.” Based on our calculations, Chinese BRI investment reached about US$142 billion in 2019, equaling about 2% of nominal gross fixed capital formation (GFCF) in China. The latter in 2019 was about US$6 trillion. Yet, BRI is much larger than multilateral funding for the developing world. For example, current annual financing disbursements from the World Bank are only about US$50 billion. Looking into 2020, due to a number of considerations, the Chinese government’s attitude towards BRI project financing will continue to shift from aggressive to a stricter and more-cautious stance. Looking into 2020, due to a number of considerations, the Chinese government’s attitude towards BRI project financing will continue to shift from aggressive to a stricter and more-cautious stance. Consequently, we expect a 10% decline in the total value of annual newly signed contracts in 2020, slightly less than the 13% decline in 2018. In addition, we also expect the average implementation period for BRI projects to be slightly longer this year than last year. Based on these expectations, our projection is that realized Chinese BRI investment in 2020 will likely fall moderately – by 5% to US$135 billion this year from US$142 billion in 2019 (Chart I-1 and Table I-1). Table I-1Projection Of Chinese BRI Project Investment In 2020
China’s Belt And Road Initiative: Entering A Cooling-Down Phase
China’s Belt And Road Initiative: Entering A Cooling-Down Phase
BRI Investments: More Scrutiny Ahead The Chinese authorities are constantly recalibrating their BRI implementation strategy. The lessons learned over the past six years as well as shifting domestic macro and global geopolitical landscapes all suggest even more scrutiny ahead. First, the Chinese government has learned hard lessons that easy large lending/financing can result in unanticipated negative consequences. In the past six years, the Chinese government has actively promoted the BRI by providing considerable amounts of financing to BRI projects. The main objectives of the BRI have been: (1) to export China’s excess capacity in heavy industries and construction to other countries; and (2) to build transportation and communication networks to facilitate trade between China and other regions. Although the projects have indeed improved infrastructure and connectivity and boosted both current and potential growth rates in the recipient countries, there have been numerous cases of debt restructuring demand by borrowers as well as growing criticism on China’s BRI as “debt trap diplomacy.” The argument is that China makes loans and uses the debt as leverage to secure land or strategic infrastructure in the recipient countries – in addition to the Middle Kingdom promoting its own geopolitical interests. History will eventually reveal whether BRI constituted “debt trap diplomacy.” As of now, China has either renegotiated or written off debt for some debt-strapped BRI- recipient countries rather than seize their assets. Among all BRI projects spreading over 60 countries in the past six years, there has been only one asset seizure case in Sri Lanka. Crucially, increasingly more BRI-recipient countries are now demanding to renegotiate the terms of their loans and financing, asking China for more favorable concessions, debt forgiveness and write-offs. The reasons run the gamut: from BRI projects not generating enough cash flow to service debt to simple requests among recipient countries for better financing terms. These demands are reducing the value of China’s claims on both BRI projects and recipient countries, and curtailing its willingness to finance more BRI projects. In general, China has learned again that substantially augmenting investments in a single stroke – whether on the mainland or in other countries – produces capital misallocation. The latter results in unviable debtors and bad assets on balance sheets of financiers. Second, many BRI investment projects have suffered delays or cancellations due to changes in the recipient countries’ governments. Reducing both unanticipated negative consequences and unexpected delays/ cancellations requires more scrutiny and tighter oversight on BRI projects by the Chinese government, which is on the way. In April 2019, Chinese President Xi Jinping called for high-quality, sustainability and transparency in implementing BRI projects, as well as a zero-tolerance policy towards corruption. He also stressed that China would only support open cooperation and clean governance when pursuing BRI projects. China’s Ministry of Finance last year released a new document titled, The Debt Sustainability Framework for Participating Countries of the Belt and Road Initiative, in order to identify debt stress among recipient countries and prevent defaults. China, in April, rejected the Kenyan government’s request of US$3.7 billion in new loans for the third phase of its standard gauge railway (SGR) line amid concerns about the country’s finances. In Zimbabwe, the Export-Import Bank of China backed out of providing financing for a giant solar project due to the government’s legacy debts. To be sure, like any lender, the risks and costs fall to Chinese banks and financing providers in the event of a default. Therefore, increasing scrutiny of such projects is in the best interests of China as a whole. That said, the BRI is a signature initiative of President Xi and still has many positives for China. Specifically, it helps the country export its excess capacity, increase its trade with the rest of the world and expand the country’s geopolitical influence. Therefore, any slowdown in the BRI will be marginal. China will tweak and may reduce the pace of BRI investment moderately, but it will not halt it outright. Like any lender, the risks and costs fall to Chinese banks and financing providers in the event of a default. Therefore, increasing scrutiny of such projects is in the best interests of China as a whole. Bottom Line: There will be increasing scrutiny of BRI projects by the Chinese government. Consequently, it will become incrementally more difficult for BRI countries to obtain financing from China in 2020. Nevertheless, the pace of BRI will slow somewhat but not plunge, given the program’s strategic benefits for China. BRI Financing: Switching From Dollar- To Yuan-Denominated Chinese banks have been the major BRI funding providers. Table I-2 shows Chinese policy banks and large state-owned commercial banks accounted for about 51% and 41% of BRI funding in the past five years, respectively. Table I-2China's BRI Funding Sources During 2014-2018
China’s Belt And Road Initiative: Entering A Cooling-Down Phase
China’s Belt And Road Initiative: Entering A Cooling-Down Phase
Debt and equity financing are the two major types of BRI funding, with the former playing the dominant role in the form of bank loans and BRI-specialized bond issuance. While the majority of BRI financing to date – about 83% of the total, according to our estimates – has been denominated in foreign currency (mainly in US dollars), there has been a noticeable rise in loans and bond issuance denominated in yuan. In May 2017, President Xi encouraged domestic financial institutions to promote overseas RMB-denominated financing for BRI projects. In the past two and a half years, about 17% of BRI financing has been in yuan. Before May 2017, such yuan-denominated loans for BRI projects were insignificant. Yuan-denominated BRI loans: The two Chinese policy banks have provided more than RMB 380 billion (equivalent to US$55 billion) in BRI-specialized loans in RMB terms over the past two and half years. Offshore yuan-denominated BRI-related bond issuance by Chinese banks and companies: There has been an increasing amount of BRI-specialized bond issuance in RMB terms offshore over the past several years as well. Onshore yuan-denominated BRI-related bond issuance by governments and organizations/companies of recipient countries: Since 2018, foreign private companies and government agencies have been allowed to issue RMB-denominated BRI bonds onshore in China. There are three reasons why the Chinese authorities will continue to encourage more yuan-denominated financing for BRI projects. Chart I-3China: Few FX Reserves Compared With RMB Money Supply
China: Few FX Reserves Compared With RMB Money Supply
China: Few FX Reserves Compared With RMB Money Supply
First, balance-of-payment constraints make RMB funding for BRI more desirable. US dollar financing for BRI initiatives inevitably creates demand for the People’s Bank of China’s increasingly precious foreign-exchange resources. The main risk to China’s balance of payments is the 177 trillion of local currency deposits of households and enterprises. The PBoC’s US$3 trillion in foreign exchange reserves accounts for only 12% of Chinese total deposits (Chart I-3). Chinese households and private enterprises prefer to hold a higher proportion of their assets in foreign currencies than they do now. This will continue to generate capital outflows, and risks depleting the nation’s foreign currency reserves. Given potential capital outflows from the domestic private sector, China will be careful in expanding state-sponsored capital outflows, including US dollar-denominated BRI financing. Therefore, increasing RMB-denominated funding will reduce US dollar outflows and diminish pressure on China’s foreign exchange reserves. Second, providing BRI financing in yuan promotes RMB internationalization, which is a major long-term objective of China. When a borrower (whether Chinese or foreign entity) with a BRI project obtains yuan-denominated financing, it is encouraged to also pay its suppliers in yuan. As a result, more global trade is settled in renminbi, promoting its internationalization. This is especially convenient when the borrower buys goods and services from China, as they can easily pay in yuan. In cases where a borrower has to buy services and equipment from other countries and is required to pay in US dollars, the renminbis will go into foreign exchange markets. On margin, this will drive the yuan’s value versus the US dollar lower. Provided China has excess capacity in many raw materials and industrial goods, there is a lot of scope to expand RMB financing for BRI projects, with limited downward pressure on the yuan’s exchange rate. In short, RMB-denominated funding will be used to buy Chinese goods. Chart I-4Low Odds Of Acceleration In Bank Financing In 2020
Low Odds Of Acceleration In Bank Financing In 2020
Low Odds Of Acceleration In Bank Financing In 2020
Finally, in any country, banks originate local-currency denominated loans “out of thin air,” – i.e., bank balance sheet expansion is not constrained by national savings. We have written about this extensively in numerous past reports. Theoretically, there is no hard limit on much in yuan-denominated loans Chinese commercial banks can originate, nor how many yuan-denominated bonds they can buy. What constrains commercial banks from expanding their assets infinitely is banking regulation, liquidity constraints (their excess reserves at the central bank rather than deposits), worries about asset impairment and a lack of loan demand among borrowers. Among these, the most pertinent that could cap the amount of BRI financing originated by Chinese banks is macro-prudential bank regulation that is being implemented by regulators in a piecemeal way to cap leverage among enterprises, households, local governments and banks themselves. Chart I-4 illustrates that banks’ asset growth is on par with nominal GDP, and has recently rolled over. The Chinese authorities target bank assets, bank broad credit and broad money growth at the level of potential nominal GDP growth. This entails low odds of acceleration in bank financing in general and BRI projects in particular. Meanwhile, the need for BRI debt restructuring and provisioning will also lead mainland commercial banks to become slightly more cautious in BRI financing. Bottom Line: Both RMB- and US dollar- denominated financing for BRI projects will marginally diminish in 2020. Macro Implications Chart I-5Deep Contraction In Chinese Property Construction...
Deep Contraction In Chinese Property Construction...
Deep Contraction In Chinese Property Construction...
Implications For Commodities And Capital Goods The size of BRI investments in 2019 – US$142 billion – accounts for only about 2% of China’s nominal GFCF. Hence, BRI investment is too small relative to mainland capital spending. This is why we often do not incorporate BRI when analyzing China’s capital spending cycle. In 2020, we are still negative on China’s property construction activity due to weak real estate demand and increasing difficulty for indebted property developers to secure financing (Chart I-5). There will likely be a moderate growth rebound in Chinese infrastructure investment. However, it will not be able to offset the negative impact on commodities and capital goods from weaker BRI investment and mainland contracting property construction. All in all, the recovery in Chinese capital goods imports will be moderate (Chart I-6). Notably, prices of steel, industrial metals and other raw materials do not signal widespread and robust recovery as of now (Chart I-7). Chart I-6...And In Chinese Capital Goods Imports
...And In Chinese Capital Goods Imports
...And In Chinese Capital Goods Imports
Chart I-7Commodity Prices Do Not Signal Widespread And Robust Recovery
Commodity Prices Do Not Signal Widespread And Robust Recovery
Commodity Prices Do Not Signal Widespread And Robust Recovery
Impact On Chinese Exports Chinese exports to BRI countries have done much better than its shipments elsewhere (Chart I-8). For example, Chinese exports to ASEAN countries showed a strong 10.4% year-on-year growth in 2019, versus a 1% contraction in overall exports. The ASEAN countries that received significant amounts of BRI investments posted double-digit growth in imports from China. There are two primary reasons behind the stronger growth in Chinese exports to BRI-recipient countries. 1. As most of China’s BRI investment has focused on infrastructure projects, it has significantly increased recipient countries’ imports of capital goods and raw materials. Chart I-9 shows that Chinese exports of digging and excavating machines have gone vertical. Chart I-8Strong Growth In Chinese Exports To BRI Countries
Strong Growth In Chinese Exports To BRI Countries
Strong Growth In Chinese Exports To BRI Countries
Chart I-9Surging Chinese Exports Of Digging And Excavating Machines
Surging Chinese Exports Of Digging And Excavating Machines
Surging Chinese Exports Of Digging And Excavating Machines
2. Considerable BRI investment has propelled recipient countries’ income growth. Chart I-10 reveals a positive correlation between capital spending as a share of GDP and real GDP growth across 33 BRI-receiving developing economies during the BRI implementation period of 2014-2018. Hence, BRI investments have considerable impact on both potential and current growth of recipient countries. Chart I-10Strong Capital Spending Tend To Facilitate Real Economic Growth
China’s Belt And Road Initiative: Entering A Cooling-Down Phase
China’s Belt And Road Initiative: Entering A Cooling-Down Phase
Chart I-11BRI Helped Boost Chinese Consumer Goods Exports
BRI helped Boost Chinese Consumer Goods Exports
BRI helped Boost Chinese Consumer Goods Exports
Robust income growth has boosted demand for household goods (Chart I-11). China has a very strong competitive advantage in consumer goods production, especially in low-price segments that are popular in developing economies. Despite a slight drop in overall BRI investment, we still expect solid growth (albeit less than in 2019) in Chinese exports to BRI countries in 2020. Ellen JingYuan He Associate Vice President ellenj@bcaresearch.com Footnotes
Highlights 2020 Model Bond Portfolio Positioning: Translating our 2020 global fixed income Key Views into recommended positioning within our model bond portfolio comes up with the following conclusions: target a moderately aggressive level of overall portfolio risk, with below-benchmark duration exposure alongside meaningful overweight allocations to global corporate credit. Country Allocations: The cyclical improvement in global growth heralded by leading indicators should put upward pressure on overall global bond yields in 2020. With central banks likely to maintain accommodative policy settings to try and boost depressed inflation expectations, government bond allocations should reflect each country’s “beta” to global yield changes. That means favoring lower-beta countries (Japan, Germany, Spain, Australia, the UK) over higher-beta countries (the US, Canada, Italy). Spread Product: Better global growth, combined with stimulative monetary conditions, will provide an ideal backdrop for growth-sensitive spread product like corporate bonds to outperform government debt this year. We are maintaining an overweight stance on US high-yield credit, while increasing overweights to euro area corporates (both investment grade and high-yield). With the US dollar likely to soften as 2020 evolves, emerging market hard currency debt, both sovereign and corporate, is poised to outperform – we are upgrading both to overweight. Feature Welcome to our first report of the New Year. Just before our holiday break last month, we published our 2020 “Key Views” report, outlining the thematic implications of the BCA 2020 Outlook for global bond markets.1 In this follow-up report, we turn those themes into specific investment recommendations for the next twelve months. We will also make any necessary changes to the allocations in the Global Fixed Income Strategy (GFIS) model bond portfolio to reflect our themes. The main takeaway is that 2020 will be a much different year than 2019, when virtually all global fixed income classes delivered solid absolute returns. The unusual combination of rapidly falling government bond yields and stable-to-narrowing spreads on the majority of credit products – especially in developed market corporate debt – will not be repeated in 2020. Absolute returns from fixed income will be far lower than in 2019, forcing bond investors to focus on relative returns across maturities, countries and credit sectors to generate outperformance. With global monetary policy to remain stimulative, alongside improved global growth, market volatility should remain subdued over the next 6-12 months. Being more aggressive on overall levels of portfolio risk, particularly through higher allocations to markets like high-yield corporates and emerging market (EM) credit, is a solid strategy in a world of low risk-free interest rates and tame volatility. Top-Down Bond Market Implications Of Our Key Views As a reminder, the main fixed income investment themes from our 2020 Key Views report were the following: Global growth will rebound in 2020, led by the US and China, putting upward pressure on global bond yields. Central banks will stay dovish until policy reflation has clearly turned into inflation, limiting how high bond yields can climb in 2020 but sowing the seeds for a far more bond-bearish backdrop in 2021. Accommodative monetary policy and faster growth will delay the peak in the aging global credit cycle. Returns on global fixed income will be far lower in 2020 than in 2019, given rich valuation starting points. Country and sector selection will be more important in driving fixed income outperformance. We now present the specific fixed income investment recommendations that derive from those themes, described along the following lines: overall portfolio risk, overall duration exposure, country allocations within government bonds, yield curve allocations within countries, and corporate credit allocations by country and credit rating. Overall Portfolio Risk: MODERATELY AGGRESSIVE Global growth is in the process of bottoming out after the sharp manufacturing-driven slowdown in 2019. The cumulative lagged impact of monetary easing by central banks last year, led by the US Federal Reserve cutting rates and the European Central Bank (ECB) restarting its Asset Purchase Program, is a main reason why growth is set to rebound. Reduced trade uncertainty between the US and China should augment the impact of easier monetary policy through improved business confidence. Our global leading economic indicator (LEI), which has increased for nine consecutive months, is already heralding this improvement in the global economy. Our global LEI diffusion index – which measures the number of countries with a rising LEI and is itself a leading indicator of the LEI – suggests more gains ahead as 2020 progresses. The LEI diffusion index is also a reliable leading indicator of bond market volatility, with the former signaling that the latter will remain quiescent in 2020 (Chart 1). At the same time, cross-asset correlations across fixed income sectors should drift a bit higher alongside a more broad-based upturn in global economic growth and expanding monetary liquidity via central bank asset purchases (Chart 2). This pickup in correlations suggests that there is scope for markets that lagged the 2019 global credit rally, like EM USD-denominated sovereign debt, to make up for that underperformance in 2020. Chart 1Improving Global Growth Will Keep Volatility Subdued
Improving Global Growth Will Keep Volatility Subdued
Improving Global Growth Will Keep Volatility Subdued
Chart 2Cross-Asset Correlations Should Increase In 2020
Cross-Asset Correlations Should Increase In 2020
Cross-Asset Correlations Should Increase In 2020
The combination of better growth, stable volatility – but with only a mild rise in correlations – is a good backdrop to take a somewhat more aggressive investment stance in fixed income portfolios in 2020. The combination of better growth, stable volatility – but with only a mild rise in correlations – is a good backdrop to take a somewhat more aggressive investment stance in fixed income portfolios in 2020. We prefer to take that additional risk by adding to our recommended overweight to global credit, rather than further reducing our below-benchmark overall duration exposure. Overall Portfolio Duration Exposure: BELOW BENCHMARK Chart 3Global Bond Yields Poised To Move Higher
Global Bond Yields Poised To Move Higher
Global Bond Yields Poised To Move Higher
The improvement in global growth that we are anticipating in 2020 would normally be expected to put upward pressure on the real component of global government bond yields (Chart 3, top panel). This would initially manifest itself through asset allocation shifts out of bonds into equities and, later, through expectations of rate hikes and tighter monetary policy. However, with all major developed market central banks now expressing a desire to keep policy as easy as possible to try and boost inflation expectations, the cyclical move higher in real yields is likely to be more muted in 2020. However, given our expectation that the US dollar is likely to see a moderate decline, as global capital flows move into more growth-sensitive markets in EM and Europe, there is scope for global bond yields to rise via higher inflation expectations – especially with global oil prices likely to move a bit higher, as our commodity strategists expect (bottom two panels). We recommend only a moderate below-benchmark overall duration exposure in global fixed income portfolios in 2020, given that real yields will likely stay relatively muted. Investors should maintain core allocations to inflation-linked bonds, however, to benefit from the pickup in inflation expectations that is likely to occur this year. We recommend only a moderate below-benchmark overall duration exposure in global fixed income portfolios in 2020, given that real yields will likely stay relatively muted. Investors should maintain core allocations to inflation-linked bonds, however, to benefit from the pickup in inflation expectations that is likely to occur this year. Government Bond Country Allocation: UNDERWEIGHT HIGHER-BETA MARKETS, OVERWEIGHT LOWER-BETA MARKETS At the country level, we would typically let our expectations of monetary policy changes guide our recommended allocations. Yet in 2020, we see very little potential for any change in monetary policy outside of Australia (where rate cuts can happen early in the year) and Canada (where a rate hike may be possible later in the year). Thus, we think that a more useful framework for making fixed income country allocation decisions in 2020 is to rely on the “yield betas” of each country to changes in the overall level of global bond yields. Chart 4 shows the three-year trailing yield betas for 10-year government bonds of the major developed markets. Changes in the 10-year yields are compared to the yield of the 7-10 year maturity bucket of the Bloomberg Barclays Global Treasury Index (as a proxy for the unobservable “global bond yield”). On that basis, the higher-beta markets are the US, Canada and Italy, while the lower-beta markets are Japan, Germany, France, Spain, Australia and the UK. Thus, we want to maintain underweight positions in the former group and overweight positions in the latter group. At the moment, we already have most of those tilts within our model bond portfolio, with two exceptions: we are currently neutral (benchmark index weight) in the UK and Canada. For the UK, Brexit uncertainty has made it difficult to take a strong view on the direction of Gilt yields - a problem now compounded further with Andrew Bailey set to take over from Mark Carney as the new Governor of the Bank of England. Staying neutral, for now, still seems like the best strategy until all the policy uncertainties are fully resolved. Canadian bond yields are more likely to maintain their “higher-beta” status as global yields rise, as we discussed in a recent report.2 Thus, this week, we move our recommended allocation for Canadian government bonds to underweight from neutral. For Canada, the growth and inflation data continue to print strong enough to keep the Bank of Canada on a relatively more hawkish path than the other developed market central banks. This suggests that Canadian bond yields are more likely to maintain their “higher-beta” status as global yields rise, as we discussed in a recent report.2 Thus, this week, we move our recommended allocation for Canadian government bonds to underweight from neutral. Applying Our Global Golden Rule To Government Bond Allocations In September 2018, we published a Special Report introducing a government bond return forecasting methodology called the “Global Golden Rule.”3 This is an extension of a framework introduced by our sister service, US Bond Strategy, that links US Treasury returns (versus cash) to changes in the fed funds rate not already discounted in the US Overnight Index Swap (OIS) curve. That relationship also holds in other developed market countries, where there is a clear correlation between the level of bond yields and our 12-month discounters, which measure the change in policy rates over the next year priced into OIS curves (Chart 5). Chart 4Favor Lower-Beta Government Bond Markets In 2020
Favor Lower-Beta Government Bond Markets In 2020
Favor Lower-Beta Government Bond Markets In 2020
In Table 1, we show the expected returns generated by the Global Golden Rule (shown hedged into US dollars) for the countries in our model bond portfolio universe, based on monetary policy scenarios that we deem to be most plausible for 2020. Chart 5Monetary Policy Expectations Will Remain Critical For Bond Yields
Monetary Policy Expectations Will Remain Critical For Bond Yields
Monetary Policy Expectations Will Remain Critical For Bond Yields
In Table 2, we show the returns on a duration-adjusted basis (expected total return divided by duration). We then rank the return scenarios for overall country indices, aggregating the returns of the individual yield curve maturity buckets shown in those two tables, in Table 3. Table 1Global Golden Rule Forecasts For 2020
Our Model Bond Portfolio Strategy For 2020: Selectively Aggressive
Our Model Bond Portfolio Strategy For 2020: Selectively Aggressive
The results in Table 1 show that expected returns are still expected to be positive across most countries, although this is largely due to the gains from hedging into higher-yielding US dollars. The duration-adjusted returns shown in Table 2 look most attractive at the front-end of yield curves across all the countries. This is somewhat consistent with our view, discussed in the 2020 Key Views report, that investors should expect some “bear-steepening” of global yield curves over the course of this year as inflation expectations drift higher (Chart 6). Table 2Global Golden Rule Duration-Adjusted Forecasts For 2020
Our Model Bond Portfolio Strategy For 2020: Selectively Aggressive
Our Model Bond Portfolio Strategy For 2020: Selectively Aggressive
Chart 6Expect A Mild Reflationary Bear Steepening Of Global Yield Curves
Expect A Mild Reflationary Bear Steepening Of Global Yield Curves
Expect A Mild Reflationary Bear Steepening Of Global Yield Curves
Table 3Ranking The 2020 Return Scenarios
Our Model Bond Portfolio Strategy For 2020: Selectively Aggressive
Our Model Bond Portfolio Strategy For 2020: Selectively Aggressive
The results in Table 3 show that the best expected returns would come in rate cutting scenarios – an unsurprising outcome given that there is very little change in policy rates currently discounted in OIS curves in all countries in our model bond portfolio universe. We see rates more likely to remain stable across all countries, however, making the “rates flat” scenarios in the middle of Table 3 more likely in 2020. After our downgrade of Canada this week, our recommended country allocations now reflect both yield betas and the results of our Global Golden Rule. Spread Product Allocation: OVERWEIGHT GLOBAL CORPORATES VERSUS GOVERNMENT BONDS, IN THE US, EURO AREA AND EM Chart 7Stay Overweight US High-Yield
Stay Overweight US High-Yield
Stay Overweight US High-Yield
Turning to credit markets, the shift of global central banks to a more accommodative stance – with global growth improving – has opened a window for another year of outperformance versus sovereign bonds in 2020. With market volatility likely to remain low, as discussed earlier, there is a strong case to increase credit allocations relative to government debt as 2020 begins. Turning to credit markets, the shift of global central banks to a more accommodative stance – with global growth improving – has opened a window for another year of outperformance versus sovereign bonds in 2020. We already have a recommended overweight allocation to US high-yield corporate debt within our model bond portfolio. As we discussed in a recent report, the conditions that would lead us to become more cautious on US junk bonds – deteriorating corporate health, restrictive Fed policy and tightening bank lending standards – are currently not in place (Chart 7).4 If US economic growth starts to rebound in the first half of 2020, as we expect, then the case for US junk bond outperformance is even stronger. We are maintaining only a neutral allocation to US investment grade corporates, however, but this is part of a relative value view versus US Agency mortgage backed securities, which look more attractive on a volatility-adjusted basis.5 We are comfortable with our US credit views, but we are making the following changes this week to raise the credit allocation in our model bond portfolio: Upgrade EM USD-denominated sovereign and corporate debt to overweight. The two conditions that typically must be in place before EM hard currency debt can outperform – a softer US dollar and improving global growth – are now both in place. The two conditions that typically must be in place before EM hard currency debt can outperform – a softer US dollar and improving global growth – are now both in place (Chart 8). The momentum in the US dollar has clearly rolled over and even in level terms, the trade-weighted dollar is peaking. Add in the improvement in both our global LEI and the global manufacturing PMI (and the China PMI, most importantly) and the case for upgrading EM hard currency debt for 2020 is a strong one. Increase the size of overweights to euro area investment grade and high-yield corporate debt. We already have a modest overweight stance on euro area corporate bonds in our model bond portfolio, based on our expectations that the ECB will maintain a highly-accommodative stance – which could include buying more corporate debt in its Asset Purchase Program. Yet with an increasing body of evidence highlighting that the sharp downturn in European growth seen in 2019 is bottoming out, the argument for raising euro area corporate bond allocations for this year is compelling. This is especially true for euro area high-yield, where the backdrop looks even more constructive (Chart 9) compared to US junk bonds using the same metrics described above – corporate health (not deteriorating), monetary policy (not restrictive) and lending standards (not tightening). Chart 8Upgrade EM Credit To Overweight
Upgrade EM Credit To Overweight
Upgrade EM Credit To Overweight
Chart 9Increase Overweights To European Credit
Increase Overweights To European Credit
Increase Overweights To European Credit
Summing It All Up: Our Model Bond Portfolio Adjustments To Begin 2019 The outlook described in our 2020 Key Views report, and in this week’s report, lead us to make several adjustments to our model bond portfolio weightings seen in the table on Pages 15 and 16. The results of those changes are the following: Duration: We are maintaining an overall portfolio duration of 6.5 years, which is 0.5 years below that of our custom benchmark portfolio index (Chart 10). Credit Allocation: We are increasing the allocation to EM USD-denominated debt, funded by reducing exposure to US Treasuries. We are also increasing the size of the overweight positions in euro area investment grade and high-yield corporate debt, funded by cutting allocations to German and French government bonds. The net effect of these changes is to increase our total spread product weighting to 57% of the portfolio (Chart 11), which represents an overweight tilt versus the benchmark of +15% (versus a +8% overweight prior to this week’s changes). Chart 10Stay Below-Benchmark On Duration Exposure
Stay Below-Benchmark On Duration Exposure
Stay Below-Benchmark On Duration Exposure
Chart 11A Larger Recommended Allocation To Spread Product For 2020
Our Model Bond Portfolio Strategy For 2020: Selectively Aggressive
Our Model Bond Portfolio Strategy For 2020: Selectively Aggressive
Country Allocation: We are cutting the Canadian government bond allocation to underweight, while making additional modest adjustments to yield curve positioning in the US, Japan, and the UK to reflect the output from our Global Golden Rule. The net result of these changes, combined with the increased allocation to corporate bonds, is to boost the overall portfolio yield to 3%, which represents a positive carry of +43bps versus our benchmark index (Chart 12). Chart 12Greater Portfolio Yield To Begin 2020
Greater Portfolio Yield To Begin 2020
Greater Portfolio Yield To Begin 2020
Chart 13Move To A Moderately Aggressive Level Of Portfolio Risk
Move To A Moderately Aggressive Level Of Portfolio Risk
Move To A Moderately Aggressive Level Of Portfolio Risk
Overall Portfolio Risk: All of the above changes represent an increase in the usage of the “risk budget” of our model bond portfolio, which is now running a tracking error (or excess volatility versus that of the benchmark) of 73bps (Chart 13). This is higher than the 58bps prior to this week’s changes, but is still below the maximum allowable tracking error of 100bps that we have imposed on the model portfolio since its inception. This is consistent with our view that investors should maintain a “moderately aggressive” level of risk in fixed income portfolios in 2020. Robert Robis, CFA Chief Fixed Income Strategist rrobis@bcaresearch.com Footnotes 1 Please see BCA Global Fixed Income Strategy Weekly Report, “2020 Key Views: Delay Of Reckoning”, dated December 12th 2019, available at gfis.bcarsearch.com. 2 Please see BCA Research Global Fixed Income Strategy Weekly Report, “How Sweet It Is”, dated November 6, 2019, available at gfis.bcaresearch.com. 3 Please see BCA Research Global Fixed Income Strategy Special Report, “The Global Golden Rule Of Bond Investing”, dated September 25th 2018, available at gfis.bcaresearch.com. 4 Please see BCA Research Global Fixed Income Strategy Weekly Report, “The Lowdown On Low-Rated High-Yield”, dated November 27, 2019, available at gfis.bcaresearch.com. 5 Please see BCA Research Global Fixed Income Strategy Weekly Report, “Big Mo(mentum) Is Turning Positive”, dated October 29, 2019, available at gfis.bcaresearch.com. Recommendations The GFIS Recommended Portfolio Vs. The Custom Benchmark Index
Our Model Bond Portfolio Strategy For 2020: Selectively Aggressive
Our Model Bond Portfolio Strategy For 2020: Selectively Aggressive
Duration Regional Allocation Spread Product Tactical Trades Yields & Returns Global Bond Yields Historical Returns
Feature Recommended Allocation
Monthly Portfolio Update: Counting The Milestones
Monthly Portfolio Update: Counting The Milestones
Since BCA published its 2020 Outlook,1 and the December GAA Monthly Portfolio Update,2 nothing has happened to make us fundamentally change our views. We see the global manufacturing cycle rebounding over the coming quarters, but major central banks remaining dovish. This combination of accelerating growth and easy monetary policy should be positive for risk assets. We accordingly continue to recommend an overweight on equities versus bonds, prefer the more cyclical euro zone and EM equity markets over the US, and selectively like credit (particularly the riskier end of the US junk bond universe). In the 2020 Outlook, we laid out a series of milestones that would indicate how our scenario is playing out: whether we need to reconsider it, or whether we should be adding further to risk (Table 1). Here is how those milestones are progressing. Table 1Milestones For The 2020 Outlook
Monthly Portfolio Update: Counting The Milestones
Monthly Portfolio Update: Counting The Milestones
Chinese growth. Total Social Financing picked up in November (CNY1.75 trillion versus CNY619 billion the previous month) and the most recent hard data (notably retail sales and industrial production) showed improvement. But the momentum of credit creation and activity generally remain weak (Chart 1). We expect that Chinese growth will begin to accelerate in early 2020, due to the lagged effect of monetary stimulus in the first half of last year, and easier fiscal policy. Moreover, December’s annual Central Economic Work Conference pointed to greater government emphasis on growth stability.3 The clampdown on shadow banking also seems to be easing (Chart 2). However, we need to see further signs of Chinese growth accelerating before, for example, we become more bullish on Emerging Markets and commodities. Chart 1Chinese Credit And Activity Remain Weak
Chinese Credit And Activity Remain Weak
Chinese Credit And Activity Remain Weak
Chart 2Clampdown On Shadow Banking Easing?
Clampdown On Shadow Banking Easing?
Clampdown On Shadow Banking Easing?
Trade war. The last-minute agreement to cancel the December 15 rise in US tariffs on Chinese imports represents the “ceasefire” we expected, rather than “phase one” of a more profound agreement. It is still unclear whether previous tariffs will be rolled back (Chart 3). China’s supposed promise to increase imports of US agricultural products from $10 billion a year to $40 billion-$50 billion seems unrealistic. Progress on more fundamental topics such as China’s subsidies for state-owned companies seems far off. For now, President Trump has done enough to minimize the negative impact on the US economy in an election year. But there remains a possibility that trade war reemerges as a risk during 2020. Chart 3How Far The Rollback?
How Far The Rollback?
How Far The Rollback?
Progress against these milestones suggests that our current asset allocation recommendation structure – moderately risk-on, but with hedges against downside risk – is appropriate for now. Global growth. Data confirming the rebound in the manufacturing cycle remain mixed. Economic surprises have generally been positive in the euro zone, but have slipped in the US and Japan, and remain soft in the Emerging Markets (Chart 4). In Germany, the manufacturing PMI slipped back to 43.7 in December, but the Ifo and ZEW surveys both rebounded (Chart 5). There is, however, still little sign that the weakness in manufacturing is spilling over into consumption and services. In Germany, unemployment remains at a record low and wages are strong. In the US, wage growth continues to trend up, and there is no indication in the weekly initial claims data that companies are starting to lay off workers at more than the seasonally normal pace (Chart 6). Market indicators of the cycle are also showing some positive signs. Among commodities, the price of copper – the most cyclical metal – has begun to rise. Chinese cyclical stocks are outperforming defensives. But the US dollar has not yet showed any significant depreciation (Chart 7). Chart 4Economic Surprises Mixed
Economic Surprises Mixed
Economic Surprises Mixed
Chart 5Germany Showing Signs Of Bottoming
Germany Showing Signs Of Bottoming
Germany Showing Signs Of Bottoming
Chart 6No Problems In The Labor Market
No Signs Of Weakening Labor Market No Problems In The Labor Market
No Signs Of Weakening Labor Market No Problems In The Labor Market
Chart 7Some Positive Signs From The Markets
Some Positive Signs From The Markets
Some Positive Signs From The Markets
US politics. President Trump’s approval rating has picked up slightly – we warned that its slipping might cause him to get aggressive on trade or foreign policy (Chart 8). Markets might worry at the possibility of “President Warren” given her focus on increased regulation of industries such as finance, energy, and technology. But she has fallen a little in the polls. Even in liberal California (where the primary will be unusually early next year – March 3), she is only level with Biden and Sanders in opinion polls. Our geopolitical strategists see US politics as one of the key geopolitical risks this year,4 but the risk seems subdued for now. Chart 8Trump’s Approval Rating Stable To Rising
Monthly Portfolio Update: Counting The Milestones
Monthly Portfolio Update: Counting The Milestones
Fed tightening. Expansions usually end when inflation rises, either causing the Fed to raise rates to choke it off, or with the Fed ignoring the inflation and allowing debt and asset bubbles to form. Any signs, therefore, that inflation, or inflation expectations, are rising would signal that we are truly in the “end game”. For now, there are no such signs. US inflation is likely to soften over the next six months, as a result of the economic slowdown and strong dollar. And TIPS breakevens imply the market believes the Fed will miss its inflation target by an average of 80-90 BPs a year over the next decade (Chart 9). The Fed is likely to sound very dovish over the coming year. The review of its monetary policy framework, probably to be announced in July, may result in some sort of “catch-up” policy: under this, if inflation undershoots the Fed’s target, the target automatically rises the following year.5 Its efforts to support the repo market, including short-term Treasury securities purchases of $60 billion a month, will increase the Fed’s balance-sheet, and represent a “mini-QE” (Chart 10). The Fed is likely to be reluctant to turn more hawkish ahead of the presidential election. These dovish moves – and continued accommodative policies from the ECB and Bank of Japan – mean that monetary policy will be supportive for risk assets throughout 2020. Chart 9Inflation Remains Subdued
Inflation Expectations Driven By Oil Inflation Remains Subdued
Inflation Expectations Driven By Oil Inflation Remains Subdued
These milestones suggest, therefore, that our current asset allocation recommendation structure – moderately risk-on, but with hedges (long cash and gold) against downside risk – is appropriate for now. Chart 10A "Mini-QE"?
A Mini-"QE"?
A Mini-"QE"?
Equities: We shifted last month to an underweight on US equities, with an overweight on the euro zone, and neutral on Emerging Markets. The US tends to underperform during upswings in the global manufacturing cycle (Chart 11). Europe looks attractive because of its heavy weighting in sectors we like such as Financials, Autos and Capital Goods. Europe’s returns will also be boosted by the appreciation in the euro and pound that we expect (our equity recommendations assume no currency hedging). For EM, we would turn more positive if we saw a clear pickup in Chinese credit and economic growth. Chart 11US Underperforms When Growth Picks Up
US Underperforms When Growth Picks
US Underperforms When Growth Picks
Chart 12Fed Won't Cut As The Market Expects
Fed Won't Cut As The Market Expects
Fed Won't Cut As The Market Expects
Fixed Income: Our positive view on global growth implies that long-term rates will rise. We see the US Treasury 10-year yield reaching 2.5% by mid-2020. The market still expects the Fed to cut rates once over the next 12 months. If it stays on hold, as we expect, that slight hawkish surprise would be compatible with a moderate rise in rates (Chart 12). Core euro zone rates might rise by a little less, perhaps by 30-40 BPs, and Japanese government bond yields by 10-15 BPs. We, therefore, continue to recommend a small underweight on duration and an overweight on TIPS which look particularly cheaply valued. Within credit, our preferences are for European investment grade (not as expensive as in the US, and with the ECB buying corporate debt again) and the lower end of the US junk-bond universe (since CCC-rated bonds missed out on 2019’s rally). In a rebounding global economy, the US dollar should depreciate, particularly since it looks somewhat over-valued, and with speculative positions long the dollar. Currencies: In a rebounding global economy, the US dollar should depreciate, particularly since it looks somewhat over-valued (Chart 13), and with speculative positions long the dollar (Chart 14). But its performance is likely to vary depending on the currency pair. Our FX strategists expect the dollar to weaken to 1.18 against the euro and 1.40 against the pound over the next 12 months, and even more against currencies such as the NOK, SEK, and AUD.6 But the dollar is likely to strengthen against the yen (an even more counter-cyclical currency) and against currencies in EM, where central banks will continue to cut rates and inject liquidity aggressively to support their economies. Chart 13Dollar Looks Expensive...
Dollar Looks Expensive...
Dollar Looks Expensive...
Chart 14...And Speculators Are Long
Monthly Portfolio Update: Counting The Milestones
Monthly Portfolio Update: Counting The Milestones
Commodities: Supply in the oil market remains tight, with OPEC deepening its production cuts to 1.7 million barrels/day. The crude oil price was held down in 2019 by weakening demand, which should recover along with the cycle in 2020 (Chart 15). Our energy strategists expect Brent to average $67 a barrel in 2020 (compared to $66 now), with WTI $4 lower. Metal prices could rise in 2020 as Chinese growth recovers and the US dollar depreciates – the two most important factors that drive them (Chart 16). Given the uncertainty over both, we remain neutral for now, but would turn more positive (including on commodity-related assets, such as Australian or EM equities) if we see clear signs of their moving in the right direction. We see gold as a good downside hedge in a world of ultra-low interest rates, especially since central banks may allow inflation to overshoot over the coming years. Chart 15Supply/Demand Balance Points To Higher Oil Price
Markets Will Tighten In 2020 Supply/Demand Balance Points To Higher Oil Price
Markets Will Tighten In 2020 Supply/Demand Balance Points To Higher Oil Price
Chart 16Metals Are Driven By The Dollar And China
Metals Are Driven By The Dollar And China
Metals Are Driven By The Dollar And China
Garry Evans, Senior Vice President Chief Global Asset Allocation Strategist garry@bcaresearch.com Footnotes 1 Please see "Outlook 2020: Heading Into The End Game," dated 22 November 2019, available at bca.bcaresearch.com. 2 Please see "GAA Monthly Portfolio Update: How To Position For The End Game," dated 2 December 2019, available at gaa.bcaresearch.com. 3 Please see China Investment Strategy Weekly Report, "A Year-End Tactical Upgrade," dated 18 December 2019, available at cis.bcaresearch.com 4 Please see Geopolitical Strategy "Strategic Outlook: 2020 Key Views: The Anarchic Society," dated 6 December 2019, available at gps.bcaresearch.com 5 For example, if the Fed's inflation target is 2% but inflation is only 1.7% one year, the target would automatically rise to 2.3% the following year. 6 Please see Foreign Exchange Strategy, "2020 Key Views: Top Trade Ideas," dated December 13, 2019, available at fes.bcaresearch.com GAA Asset Allocation
Over the next two weeks, we will focus on the following key items: The December Global PMIs on January 2nd. With the release of the final PMIs, we will be able to see how the global PMI is evolving. The recent European numbers were soft, but the…
Feature The purpose of this Special Report is to identify and provoke a healthy debate on the prevailing investment themes for the 2020s and to speculate on what the key US sector beneficiaries and likely losers may be. Every decade a dominant theme captures investors’ imaginations and morphs into a bubble. Massive speculation typically propels the relevant asset class into the stratosphere as investors extrapolate the good times far into the future and go on a buying frenzy. Chart 1 shows previous manic markets starting with the Nifty Fifty, gold bullion, the Nikkei 225, the NASDAQ 100, crude oil and most recently the FAANGs. Chart 1Manias: An Historical Roadmap
Manias: An Historical Roadmap
Manias: An Historical Roadmap
What will be the dominant themes of the next decade? How should investors capitalize on some of these big trends? The purpose of this Special Report is to identify and provoke a healthy debate on the prevailing investment themes for the 2020s and to speculate on what the key US sector beneficiaries and likely losers may be. Theme #1: De-Globalization Picks Up Steam The first investment theme for the upcoming decade is the “apex of globalization” or “de-globalization”. We have written about this theme extensively at BCA Research and it is the mega-theme of our sister Geopolitical Strategy (GPS) service. Odds are high that countries will continue looking inward as the US adopts a more aggressive trade policy, China’s trend growth slows, and US-China strategic tensions intensify. The three pillars of globalization are the free movement of goods, capital, and people across national borders. We expect to see marginally less of each in the future. Chart 2 shows that we are at the conclusion of a period of tranquility. Pax Americana underpinned globalization as much as Pax Britannica before it. The US is in a relative decline after decades of geopolitical stability allowed countries like China to rise to “great power” status and rivals like Russia to recover from the chaos of the 1990s. Chart 2De-globalization Has Commenced
De-globalization Has Commenced
De-globalization Has Commenced
De-globalization has become the consensus since the election of Donald Trump. But Trump is not the prophet of de-globalization; he is its acolyte. Globalization is ending because of structural factors, not cyclical ones. And its decline was pre-written into its “source code.” Three factors stand at the center of this assessment, outlined in our 2014 Special Report, “The Apex Of Globalization – All Downhill From Here”: multipolarity, populism and protectionism. Events have since confirmed this view. The three pillars of globalization are the free movement of goods, capital, and people across national borders. We expect to see marginally less of each in the future. Investment Implication #1: Profit Margin Peak The most profound and provocative investment implication from de-globalization is that SPX profit margins have peaked and will likely come under intense pressure, especially for US conglomerates that – on a relative basis to international peers – most enthusiastically embraced globalization. Reconstructed S&P 500 profits and sales data date back to the late-1920s. Historically, corporate profit margins and globalization (depicted as global trade as a percentage of GDP) have been positively correlated (Chart 3). Chart 3Profit Margin Trouble
Profit Margin Trouble
Profit Margin Trouble
As countries are more outward looking, trade flourishes and openness to trade allows the free flow of capital to take advantage of profit-maximizing projects. Following the Great Recession and similar to the Great Depression, trade has suffered and trade barriers have risen. The Sino-American trade war has accelerated the inward movement of countries, including Korea and Japan, and has had negative knock-on effects on trade as evidenced by the now two-year old global growth deceleration. China’s response to President Trump’s election was to redouble its pursuit of economic self-sufficiency, which meant a crackdown on corporate debt and a fiscal boost to household consumption. Trump’s tariffs then damaged sentiment and trade between the two countries. Any deal reached prior to the 2020 US election will remain in doubt among global investors. The longer the trade war remains unresolved, the deeper the cracks will be in the foundations of the global trading system. Such a backdrop is negative for profit margins, as inward looking countries prevent capital from being allocated most efficiently. Moreover, the uprooting of supply chains due to the trade war hurts margins and the redeployment of equipment in different jurisdictions will do the same at a time when final demand is suffering a setback. In addition, rising profit margins are synonymous with wealth accruing to the top 1% of US families and vice versa. This relationship dates back to the late-1920s, as far back as our dataset goes. Using Piketty and Saez data, which exclude capital gains, it is clear that profit margin expansion exacerbates income inequality (top panel, Chart 4). Chart 4Heightened Risk Of Wealth Re-distribution
Heightened Risk Of Wealth Re-distribution
Heightened Risk Of Wealth Re-distribution
Expanding margins lead to higher profits. Because families at the top of the income distribution are more often than not business owners, income disparities are the widest when margins are in overshoot territory. Eventually this income chasm comes to a head and generates political discontent. Populism has emerged on both the right and left wings of the US political spectrum – and since the rise of Trump, even Republicans complain about inequality and the excesses of “corporate welfare” and laissez-faire capitalism. Because inequality is extreme – relative to America’s developed peers – and political forces are mobilizing against it, the probability of wealth re-distribution is rising in the coming decades (middle panel, Chart 4). Labor’s share of national income has nowhere to go but higher in coming years and that is negative for profit margins, ceteris paribus (bottom panel, Chart 4). Drilling beneath the surface, the three secular US equity sector/factor implications of the apex of globalization paradigm shift are: prefer small caps over large caps prefer value over growth overweight the pure-play BCA Defense Index Investment Implication #2: Small Is Beautiful While a small cap bias is contrary to the cyclical US Equity Strategy view of preferring large caps to small caps, the issue is timing: the small cap preference is a secular view with a time horizon that spans the next decade. The small versus large cap share price ratio’s ebbs and flows persist over long cycles. Small caps outshined large caps uninterruptedly from 1999 to 2010. Since then large caps have had the upper hand (Chart 5). Were the apex of globalization theme to gain traction in the 2020s, small caps should reclaim the lead from large caps, especially in the wake of the next US recession. Similar to the death of the global banking model, companies with global footprints will suffer the most, especially compared with domestically focused outfits. One way to explore this theme is via domestic versus global sector preference. But a more investable way to position for this sea change, is to buy small caps (or microcaps) at the expense of large caps (or mega caps). Small caps are traditionally domestically geared compared with large caps that have significantly more foreign sales exposure. Chart 5It’s A Small World After All
It’s A Small World After All
It’s A Small World After All
The closest ETF ticker symbols resembling this trade is long IWM:US/short SPY:US. Investment Implication #3: Buy Value At The Expense Of Growth Similar to the size bias, the style bias also moves in secular ways. Value outperformed growth from the dot com bust until the GFC. Since then growth has crushed value, even temporarily breaking below the year 2000 relative trough. This breakneck pace of appreciation for growth stocks is clearly unsustainable and offers long-term oriented investors a compelling entry point near two standard deviations below the historical mean (Chart 6). Chart 6Value Has The Upper Hand Versus Growth
Value Has The Upper Hand Versus Growth
Value Has The Upper Hand Versus Growth
Financials populate value indexes, a similarity with small cap outfits. Traditionally, financials are a domestically focused sector with export exposure registering at half of the S&P’s average 40% level of internationally sourced revenues. On the flip side, tech stocks sit atop the growth table and they garner 60% of their revenue from abroad. This value over growth style preference will pay handsome dividends if the de-globalization theme becomes more main stream as countries become more hawkish on trade and the Sino-American war continues to erect barriers to trade that took decades to lift. The caveat? If President Trump strikes a short-term deal with China ahead of the 2020 election, the de-globalization theme will suffer a setback. But our geopolitical strategists expect a ceasefire at best, not a durable deal, and also expect the trade war to resume in some way, shape or form in 2021-22, regardless of the outcome of the US election. The closest ETF ticker symbols resembling this trade is long IVE:US/short IVW:US. Investment Implication #4: Defense Fortress One final long-term playable investment idea from the apex of globalization is a structural bull market in defense stocks (Chart 7). Our October 2016 “Brothers In Arms” Special Report drew parallels with the late nineteenth century period of European rearmament, and the American and Soviet arms race of the 1960s. These movements were greatly beneficial to the aerospace and defense industry. Currently, the move by several countries to adopt more independent foreign policies, i.e. to move away from collaboration and cooperation toward isolationism and self-sufficiency, entails an accompanying arms race. Chart 7Stick With Pure-play Defense Stocks
Stick With Pure-play Defense Stocks
Stick With Pure-play Defense Stocks
Table 1
Top US Sector Investment Ideas For The Next Decade
Top US Sector Investment Ideas For The Next Decade
China’s challenge to the regional political status quo motivates a boost to defense spending globally. In fact SIPRI data on global military spending by 2030 (Table 1) increases our conviction that this trade will succeed on a five-to-ten year horizon. Beyond the global arms race, two additional forces are at work underpinning pure-play defense contractors. A global space race with China, India and the US wanting to have manned missions to the moon, and the rise of global cybersecurity breaches. Defense companies are levered to both of these secular forces and should be prime sales and profit beneficiaries to rising space budgets and increasing cybersecurity combat budgets. The ticker symbols for the stocks in the pure-play BCA defense index are: LMT, RTN, NOC, GD, HII, AJRD, BWXT, CW, MRCY. Theme #2: Tech Sector Regulation, US Enacts Privacy Laws The second long-term geopolitical theme that we are exploring is the regulatory or “stroke of pen” risk that is rising on FAANG stocks – Facebook, Apple, Amazon, Netflix, and Google. These companies were this decade’s undisputed stock market winners. The US anti-trust regulatory framework was designed to curb broad anti-competitive actions of trusts. As Lina Khan discusses in her seminal article, these actions “include not only cost but also product quality, variety, and innovation.” However, through subsequent regulatory evolution, the Chicago School has focused the US anti-trust process on consumer welfare and prices. If President Reagan and the courts could change how anti-trust laws were administered in the 1980s, so too can future administrations and courts. Today the US Congress, on both sides of the aisle, is looking into regulatory tightening, while the judicial system will take longer to change its approach. Moreover, the impetus for tougher anti-trust policy is here. It comes from a long period of slow growth, income inequality, and economic volatility – such as in the 1870s-80s. This was certainly the case for Standard Oil in 1911, which became a nation-wide boogeyman despite most of its transgressions occurring in the farm belt states. Today, income inequality is a prominent political theme and source of consumer discontent. A narrative is emerging – which will be super-charged during the next recession – that growth has been unequally distributed between the old economy and the twenty-first century technology leaders. With regard to privacy, the news is equally grim for large tech outfits. The EU General Data Protection Regulation (GDPR), which came into force on May 2018, imposes compliance burdens on any company handling user data. In the US, California has signed its own version of the law – the Consumer Privacy Act – which will go into effect in January 2020. These laws give consumers the right to know what information companies are collecting about them and what companies that data is being shared with. They also allow consumers to ask technology companies to delete their data or not to sell it. While tech companies are likely to fight the new California law, and the US court system is a source of uncertainty, we believe the writing is on the wall. The EU is by some measures the largest consumer market on the planet. California is certainly the largest US market of the states. It is unlikely that the momentum behind consumer protection will change, especially with the EU and California taking the lead. The odds of a federal privacy law, following in the footsteps of the Consumer Privacy Act, are also rising. Investment Implication #5: Shun Interactive Media & Services Stocks These risks introduce a severe overhang for FAANG stocks. We are especially worried for the S&P interactive media & services index that includes GOOGL and FB. Tack on the threat of federal regulation and this represents another major headwind for profits and net profit margins that are extremely elevated for these near monopolies. Given that advertising revenue is crucial to the business model of social media companies (GOOGL and FB included), a significant uptick in privacy regulation will likely hurt their bottom line. With regard to profit margins, tech stocks in general command a profit margin twice as high as the SPX. Specifically, FB and GOOGL enjoy margins that are 500 basis points higher than the broad tech sector (Chart 8)! This is unsustainable and will likely serve as easy prey for policymakers. Our view does not necessarily call for breaking up these monopolies. The US will have to weigh the economic consequences of anti-trust policy in a context of multipolarity in which China’s national tech champions are emerging to compete with American companies for global market share. Nevertheless increased regulation is inevitable and some forced sales of crown jewel assets may take place. Moreover, the threat of a breakup will lurk in the background, creating uncertainty until key legislative and judicial battles have already been fought. That will take years. Finally, we doubt the tech sector will be left alone to “self-regulate” its incumbents and negotiate a price on consumers’ privacy. More likely, a new privacy law will loom overhead, serving as a negative catalyst for profit growth. Uncertainty will weigh on the S&P interactive media & services relative performance. Chart 8Regulation Will Squeeze Tech Margins
Regulation Will Squeeze Tech Margins
Regulation Will Squeeze Tech Margins
The ticker symbols to short/underweight the S&P interactive media & services index are an equally weighted basket of GOOGL and FB (they command a 98% market cap weight in the index). Theme #3: SaaS, Artificial Intelligence, Augmented Reality And Autonomous Driving Are Not Fads The third big theme that will even outlive the upcoming decade is the proliferation of software as a service (SaaS). The move to cloud computing and SaaS, the wider adoption of artificial intelligence, machine learning, autonomous driving and augmented reality are not fads, but enjoy a secular growth profile. In the grander scheme of things today’s world is surrounded by software. Millions of lines of code go even into gasoline powered automobiles, let alone electric vehicles. Autonomous driving is synonymous with software, the Internet of Things (IoT) needs software, the space race depends on software, modern manufacturing and software are closely intertwined, phone calls for quite some time have been a software solution, and the list goes on and on. This tidal effect is hard to reverse and is already embedded in workflows across industries. Opportunities to penetrate health care and financial services more deeply remain unexplored and it is difficult to envision another competing industry unseating “king software”. These secular trends are not only productivity enhancing, but will also most likely prove recession-proof. When growth is scarce investors flock to any source of growth they can come by and we are foreseeing that when the next recession arrives, investors will likely seek shelter in pure play SaaS firms. Investment Implication #6: Software Is Eating The World Buying software stocks for the long haul seems like a bulletproof investment idea. But the recent stellar performance of software stocks that has moved valuations to overshoot territory. Our recommended strategy is to buy or add software stock exposure on any weakness with a 10-year investment time horizon. All of these secular trends have pushed capital outlays on software into a structural uptrend. Software related capex is not only garnering a larger slice of the tech spending budgets but also of the overall capex pie. If it were not for software capex, the contraction in non-residential investment in recent quarters would have been more severe (Chart 9). Private sector software capex is near all-time highs as a share of total outlays. Government investment in software is also reaccelerating at the fastest pace since the tech bubble. When productivity gains are anemic, both the business and government sectors resort to software upgrades in order to boost productivity. Cyber security is another more recent source of software related demand as governments around the globe are taking such risks extremely seriously (bottom panel, Chart 9). Given this upbeat demand backdrop and ongoing equity retirement, software stocks are primed to grow into their pricey valuations. Chart 9Software Is Eating The World
Software Is Eating The World
Software Is Eating The World
Finally, this long-term trade will also serve as a hedge to the short/underweight position we recommend in the S&P interactive media & services index. The closest ETF ticker symbol resembling the S&P software index is IGV:US. Theme #4: Millennials Already Are The Largest Cohort And Will Dominate Spending The fourth long-term theme we anticipate will gain traction in the 2020s is the demographic rise of the Millennial generation. Much has been made of preparing for the arrival of the Millennial generation, accompanied by well-worn stereotypes of general "failure to launch" as they reach adulthood. However, "arrival" is a misnomer as this age cohort is already the largest and "failure" is simply untrue. According to the U.S. Census Bureau, Millennials are the US’s largest living generation. Millennials (or Echo Boomers) defined as people aged 18 to 37 (born 1982 to 2000), now number more than 80mn and represent more than one quarter of the US’s population. Baby Boomers (born 1946 to 1964) number about 75mn. Stealthily becoming the largest age group in the US over the last few years, Millennials per-year-birth-rate peaked at 4.3mn in 1990. Surprisingly, the pace matched that of the post-war Baby Boom peak-per-year-birth-rate in 1957 - the per-year average over the period was higher for the Baby Boomers (Chart 10). Chart 10Millennials Are The Largest Cohort
Millennials Are The Largest Cohort
Millennials Are The Largest Cohort
This gap is now set to grow rapidly as the death rate of Baby Boomers accelerates. What is more, the largest one-year age cohort is only 25 years old, thus, Millennials will be the dominant generation for many years. It is unclear how these “kids” will impact the market as they become the most important consumers, borrowers and investors, but make no mistake: this is a seismic shift in economic power and it is here to stay. The Echo Boom is a big, generational demographic wave. A difficult and painful delay has not tempered its looming importance. Finally, this wave of echo-boomers is educated, relatively unburdened by debt (please see BOX in the June 11, 2018 Special Report on demystifying the student debt load as it pertains to Millennials), and as they inevitably “grow up”, form new households and have kids. They will borrow, spend, earn, but not necessarily save and invest to the same extent as the Boomers. And this will be an important long-term theme going forward. Near term we might already be seeing signs of their arrival and firms have begun to pivot accordingly. Investment Implication #7: Buy The BCA Millennials Equity Basket Millennials will boost consumption spending in a number of different ways. The relatively unburdened Millennial cohort will be entering prime home acquisition age soon and this should underpin the long-term prospects of the US housing market and derivative industries. Further, Millennials consume differently from their parents; social media, online shopping and smart phones are not the consumption categories of the Baby Boomers. With this in mind, we have created a basket of ten stocks that we think will be driven over the long term by the demographic rise of the Millennial. We note that these stocks are heavily weighted to the technology and consumer discretionary sectors, which is logical as Millennial consumption habits tend to be discretionary focused and technology-based. Beginning with consumer discretionary, we are highlighting AMZN, NFLX and SPOT as core holdings in our Millennials basket. AMZN’s heft dwarfs consumer discretionary indexes but it could fall in several categories; the acquisition of Whole Foods makes it a Millennials-focused consumer staples retailer and its cloud computing web services segment is a tech leader. NFLX and SPOT represent the means by which Millennials consume media, by streaming movies and music over the internet. The idea of owning physical media is rapidly becoming an anachronism. The home ownership themes noted in the report above lead us to add HD and LEN to the basket. Millennials are “doers” and are set to be the dominant DIYers in the next few years, making HD a logical choice. LEN, as the nation’s largest home builder, should benefit from the Millennials coming of age into home buyers. We are also adding TSLA to our basket as a lone clean tech-oriented equity. TSLA capitalizes on the increasing shift to clean energy of Millennials (the key reason why no traditional energy companies have a spot in our basket). The technology stocks in our Millennials basket are AAPL, UBER (which replaces FB as of today) and MSFT, together representing more than 9% of the total value of the S&P 500. AAPL’s inclusion in the list is predictable as the leading domestic purveyor of devices on which Millennials consume media content. FB is a predictable holding, with more than half of all Americans being monthly active users, dominated by the Millennial cohort. It has served our basket well since inception, but today we are compelled to remove it and replace it with UBER. UBER is a Millennial favorite and the epitome of the sharing economy. In reality UBER is a logistics company and while it is losing money it is eerily reminiscent of AMZN in its early days. Maybe UBER will dominate all means of transportation and its ease of use will propel it to a mega cap in the coming decade. Our inclusion of MSFT is based on its leadership in cloud computing, a rapidly growing industry. We expect the connectivity and mobile computing demands of Millennials will accelerate. The last stock we are adding to our basket is also the only financial services equity. Though avid consumers, Millennials have shown an aversion to cash, preferring card payment systems, including both debit and credit-based. Accordingly, we are adding the leader in both of these, V, to our Millennials basket (Chart 11). Chart 11Buy BCA’s Millennial Equity Basket
Buy BCA’s Millennial Equity Basket
Buy BCA’s Millennial Equity Basket
Investors seeking long term exposure to stocks lifted by the supremacy of the Millennial generation should own our Millennial basket (AAPL, AMZN, UBER, HD, LEN, MSFT, NFLX, SPOT, TSLA, V). We would not hesitate to add other sharing economy stocks, including Airbnb, to this basket should they become investable in the near future. Theme #5: ESG Becomes Mainstream Investors are increasingly looking at allocating assets based on environmental, social, and governance (ESG) considerations, and this mini-theme has the potential to become a big trend in the 2020s. There are a number of factors that underpin ESG investing. First, Millennials are climate conscious and given that they already are the largest cohort in the US they will not only dominate spending, but also influence election results. Moreover, via social media Millennials can sway public opinion and participate in the ESG conversation. Second, ECB President Christine Lagarde recent speech to the Economic and Monetary Affairs Committee of the European Parliament is a must read.1 If the ECB were to explicitly focus on climate change policy as part of its monetary policy operations then this is a game changer. Green investment financing including “green bonds” could become mainstream. Keep in mind the as reported in the FT “the European Parliament has declared a climate emergency; the new European Commission (EC) has taken office on a promise of an imminent “green new deal”, and Commission president Ursula von der Leyen has vowed to accelerate emissions cuts.” Last Wednesday, the EC released “The European Green Deal” with a pretty aggressive time table. The EC president said “The green deal is Europe’s man on the moon moment” and presented 50 policies slated to get rolled by 2022 to meet revamped climate goals. The implication is that once ESG takes center stage at a number of these institutions it will be easier to become mainstream and propagate the world over. Third, large institutional investors are starting to adopt an ESG mindset, especially pension plans. These investors with trillions of dollars at their disposal can not only disfavor fossil fuel investment, but also undertake investments in “green projects” via private and public equity markets. Banks are also moving in the “greening of finance” direction and given that they are the pipelines of the global plumbing system, swift adoption will go a long way in taking ESG mainstream. Finally, the electric vehicle (EV) proliferation is another key driver on how the ESG theme will play out in the 2020s. As a reminder, in the US 50% of all energy consumption is gasoline related linked to automobiles. While battery technology still has limitations, EV is no longer a fad as the German and Japanese automakers are starting to make inroads on TSLA. These car manufacturers do not want to be left out, especially if this shift toward EV becomes mainstream in the 2020s. The Chinese are not far behind on the EV manufacturing front, however government policy can really become a game changer. If a number of countries and/or California mandate a large share of all new vehicles sold be EV, then the investment implications will be massive. Investment Implication #8: Avoid Fossil Fuels, Gambling, Alcohol And Tobacco… While there are a few ESG related ETFs, we would rather explore this theme’s investment implications of sectors to avoid in the coming decade. We are believers that ESG criteria will continue to gain in importance in institutional investment management decisions. Accordingly, we would tend to avoid ‘sin stocks’, including gambling, tobacco and alcohol; demand for their services is unlikely to decline but investment weightings should mean that share prices will underperform. Further, we think a clean energy shift will mean energy stocks will likely continue to be long-term underperformers (Chart 12). Chart 12Areas To Avoid As ESG Becomes Mainstream
Areas To Avoid As ESG Becomes Mainstream
Areas To Avoid As ESG Becomes Mainstream
Final Thoughts On The US Dollar In this report, we tried to focus on the upcoming decade’s big themes that we deem will play out, and centered recommendations on US equities/sectors. We do not want to neglect some macroeconomic variables that tend to mean revert over time. Specifically, the US dollar, interest rates and most importantly US indebtedness, will also be key drivers of investment theses in the 2020s. Currently, debt is rising faster than nominal GDP growth with the government and non-financial business debt-to-GDP profiles on an unsustainable path (second panel, Chart 13). Granted, the saving grace has been generationally low interest rates as the debt service ratios have fallen (top panel, Chart 13). However, if the four decade bull market in Treasury bonds is over, or may end definitively with the next US recession sometime in the early 2020s, then rising interest rates are the only mechanism to concentrate CEOs’ and politicians’ minds. On the dollar front, Chart 14 highlights the ebbs and flows of the trade-weighted US dollar since it floated in the early-1970s. The DXY index has moved in six-to-ten year bull and bear markets. The most recent trough was during the depths of the Great Recession, while the (tentative?) peak was in late-2016. If history repeats, eventually the dollar will mean revert lower in the 2020s, especially given the fiscal profligacy of the current administration that may continue into 2024, assuming President Trump gets re-elected next November. Chart 13Unsustainable Debt Profiles
Unsustainable Debt Profiles
Unsustainable Debt Profiles
Chart 14Greenback’s Historical Ebbs And Flows
Greenback’s Historical Ebbs And Flows
Greenback’s Historical Ebbs And Flows
The US dollar remains the reserve currency of the world today, but that exorbitant privilege is clearly fraying on the edges as the balance-of-payments dynamics are heading in the wrong direction. Over the next five years, the US Congressional Budget Office (CBO) estimates that the US budget deficit will swell to 4.8% of GDP. Assuming the current account deficit widens a bit then stabilizes (usually happens when global growth improves), this will pin the twin deficits at 8% of GDP. This assumes no recession, which would have the potential to swell the deficit even further. The US saw its twin deficits swell to almost 13% of GDP following the financial crisis, but the difference then was that in the wake of the commodity boom the dollar was cheap (and commodity currencies overvalued). The subsequent shale revolution also greatly cushioned the US trade deficit. Shale productivity remains robust and US output will continue to rise, but the low-hanging fruit has already been plucked. Another dollar-negative force is its expensiveness. By rising 35% since its trough, the USD has sapped the competitiveness of the US manufacturing sector, which is accentuating the American trade deficit outside of the commodity sector (Chart 14). If the ESG trend ends up hurting oil prices, the US current account will follow the widening deficit in manufactured products. Moreover, the US is lagging Europe on the green revolution. Either the US will have to import green technologies, or the US government will have to provide more subsidies to the private sector. Either way, both of these dynamics will hurt the US current account deficit further. Historically, the currency market is the main vehicle to correct such imbalances. Chart 15Twin Deficits Will Weigh On The US Dollar
Twin Deficits Will Weigh On The US Dollar
Twin Deficits Will Weigh On The US Dollar
The apex of globalization will also hurt the greenback. In a world where all the markets are integrated, borrowers in EM nations often use the reserve currency to issue liabilities at a lower cost. This boosts the demand by EM central banks for US dollar reserves to protect domestic banking systems funded in USD. Moreover, some countries like China implement pegs (both official and unofficial) to the US dollar in order to maintain their competitiveness and export their production surpluses to the US. To do so they buy US assets. If the global economy becomes more fragmented and the Sino-US relationship continues to deteriorate structurally as we expect, then these sources of demand for the dollar will recede. Overlay the widening US current account deficit, and you have the perfect recipe for a depreciating trade-weighted US dollar. Finally, the US is likely to experience more inflation than the rest of the world following the next recession. The US economy has a smaller capital stock as a share of GDP than Europe or Japan, and American demographics are much more robust. This means that the neutral rate of interest is higher in the US than in other advanced economies. As a result, the Fed will have an easier time generating inflation by cutting real rates than both the ECB and the BoJ. Higher inflation will ultimately erode the purchasing power of the dollar and prove to be a structurally negative force for the USD. Anastasios Avgeriou US Equity Strategist anastasios@bcaresearch.com Matt Gertken Geopolitical Strategist mattg@bcaresearch.com Marko Papic Chief Strategist, Clocktower Group marko@clocktowergroup.com Chester Ntonifor Foreign Exchange Strategist chestern@bcaresearch.com Mathieu Savary The Bank Credit Analyst mathieu@bcaresearch.com References Please click on the links below to view reports: Peak Margins - October 7, 2019 The Polybius Solution - July 5, 2019 War! What Is It Good For? Global Defense Stocks! - October 31, 2018 The Dollar: Will The U.S. Invoke A "Nuclear" Option? - August 30, 2018 Is The Stock Rally Long In The FAANG? - August 1, 2018 Millennials Are Not Coming Of Age; They Are Already Here - June 11, 2018 Brothers In Arms - October 31, 2016 The End Of The Anglo-Saxon Economy? - April 13, 2016 Apex of Globalization - November 12, 2014 Footnotes 1 https://www.imf.org/en/News/Articles/2019/09/04/sp090419-Opening-Statement-by-Christine-Lagarde-to-ECON-Committee-of-European-Parliament
Every decade a dominant theme captures investors’ imaginations and morphs into a bubble. Massive speculation typically propels the relevant asset class into the stratosphere as investors extrapolate the good times far into the future and go on a buying frenzy. Chart II-1 shows previous manic markets starting with the Nifty Fifty, gold bullion, the Nikkei 225, the NASDAQ 100, crude oil and most recently the FAANGs. Chart II-1Manias: An Historical Roadmap
Manias: An Historical Roadmap
Manias: An Historical Roadmap
What will be the dominant themes of the next decade? How should investors capitalize on some of these big trends? The purpose of this Special Report is to identify and provoke a healthy debate on the prevailing investment themes for the 2020s and to speculate on what the key US sector beneficiaries and likely losers may be. Theme #1: De-Globalization Picks Up Steam The first investment theme for the upcoming decade is the “apex of globalization” or “de-globalization”. We have written about this theme extensively at BCA Research and it is the mega-theme of our sister Geopolitical Strategy (GPS) service. Odds are high that countries will continue looking inward as the US adopts a more aggressive trade policy, China’s trend growth slows, and US-China strategic tensions intensify. The small cap preference is a secular view with a time horizon that spans the next decade. Chart II-2 shows that we are at the conclusion of a period of tranquility. Pax Americana underpinned globalization as much as Pax Britannica before it. The US is in a relative decline after decades of geopolitical stability allowed countries like China to rise to “great power” status and rivals like Russia to recover from the chaos of the 1990s. Chart II-2De-globalization Has Commenced
De-globalization Has Commenced
De-globalization Has Commenced
De-globalization has become the consensus since the election of Donald Trump. But Trump is not the prophet of de-globalization; he is its acolyte. Globalization is ending because of structural factors, not cyclical ones. Three factors stand at the center of this assessment, outlined in our 2014 Special Report, “The Apex Of Globalization – All Downhill From Here”: multipolarity, populism and protectionism. Events have since confirmed this view. One final long-term playable investment idea from the apex of globalization is a structural bull market in defense stocks. The three pillars of globalization are the free movement of goods, capital, and people across national borders. We expect to see marginally less of each in the future. Investment Implication #1: Profit Margin Peak The most profound and provocative investment implication from de-globalization is that SPX profit margins have peaked and will likely come under intense pressure, especially for US conglomerates that – on a relative basis to international peers – most enthusiastically embraced globalization. Chart II-3 shows reconstructed S&P 500 profits and sales data back to the late-1920s. Historically, corporate profit margins and globalization (depicted as global trade as a percentage of GDP) have been positively correlated. Chart II-3Profit Margin Trouble
Profit Margin Trouble
Profit Margin Trouble
As countries are more outward looking, trade flourishes and openness to trade allows the free flow of capital to take advantage of profit-maximizing projects. Following the Great Recession and similar to the Great Depression, trade has suffered and trade barriers have risen. The Sino-American trade war has accelerated the inward movement of countries, including Korea and Japan, and has had negative knock-on effects on trade as evidenced by the now two-year old global growth deceleration. China’s response to President Trump’s election was to redouble its pursuit of economic self-sufficiency, which meant a crackdown on corporate debt and a fiscal boost to household consumption. Trump’s tariffs then damaged sentiment and trade between the two countries. Any deal reached prior to the 2020 US election will remain in doubt among global investors. The longer the trade war remains unresolved, the deeper the cracks will be in the foundations of the global trading system. We are especially worried for the S&P interactive media & services index that includes GOOGL and FB. Such a backdrop is negative for profit margins, as inward looking countries prevent capital from being allocated most efficiently. Moreover, the uprooting of supply chains due to the trade war hurts margins and the redeployment of equipment in different jurisdictions will do the same at a time when final demand is suffering a setback. In addition, rising profit margins are synonymous with wealth accruing to the top 1% of US families and vice versa. This relationship dates back to the late-1920s, as far back as our dataset goes. Using Piketty and Saez data, which exclude capital gains, it is clear that profit margin expansion exacerbates income inequality (top panel, Chart II-4). Chart II-4Heightened Risk Of Wealth Re-distribution
Heightened Risk Of Wealth Re-distribution
Heightened Risk Of Wealth Re-distribution
Expanding margins lead to higher profits. Because families at the top of the income distribution are often business owners, income disparities are the widest when margins are in overshoot territory. Eventually this income chasm comes to a head and generates political discontent. Populism has emerged on both the right and left wings of the US political spectrum – and since the rise of Trump, even Republicans complain about inequality and the excesses of “corporate welfare” and laissez-faire capitalism. Because inequality is extreme – relative to America’s developed peers – and political forces are mobilizing against it, the probability of wealth re-distribution is rising in the coming decades (middle panel, Chart II-4). Labor’s share of national income has nowhere to go but higher in coming years and that is negative for profit margins, ceteris paribus (bottom panel, Chart II-4). Buy or add software stock exposure on any weakness with a 10-year investment time horizon. Drilling beneath the surface, the three secular US equity sector/factor implications of the apex of globalization paradigm shift are: prefer small caps over large caps prefer value over growth overweight the pure-play BCA Defense Index Investment Implication #2: Small Is Beautiful Chart II-5It's A Small World After All
It's A Small World After All
It's A Small World After All
While a small cap bias is contrary to the cyclical US Equity Strategy view of preferring large caps to small caps, the issue is timing: the small cap preference is a secular view with a time horizon that spans the next decade. The small versus large cap share price ratio’s ebbs and flows persist over long cycles. Small caps outshined large caps uninterruptedly from 1999 to 2010. Since then large caps have had the upper hand (Chart II-5). Were the apex of globalization theme to gain traction in the 2020s, small caps should reclaim the lead from large caps, especially in the wake of the next US recession. Similar to the death of the global banking model, companies with global footprints will suffer the most, especially compared with domestically focused outfits. One way to explore this theme is via domestic versus global sector preference. But a more investable way to position for this sea change, is to buy small caps (or microcaps) at the expense of large caps (or mega caps). Small caps are traditionally domestically geared compared with large caps that have significantly more foreign sales exposure. The closest ETF ticker symbols resembling this trade is long IWM:US/short SPY:US. Investment Implication #3: Buy Value At The Expense Of Growth Similar to the size bias, the style bias also moves in secular ways. Value outperformed growth from the dot com bust until the GFC. Since then growth has crushed value, even temporarily breaking below the year 2000 relative trough. This breakneck pace of appreciation for growth stocks is clearly unsustainable and offers long-term oriented investors a compelling entry point near two standard deviations below the historical mean (Chart II-6). Chart II-6Value Has The Upper Hand Versus Growth
Value Has The Upper Hand Versus Growth
Value Has The Upper Hand Versus Growth
Financials populate value indexes, a similarity with small cap outfits. Traditionally, financials are a domestically focused sector with export exposure registering at half of the S&P’s average 40% level of internationally sourced revenues. On the flip side, tech stocks sit atop the growth table and they garner 60% of their revenue from abroad. This value over growth style preference will pay handsome dividends if the de-globalization theme becomes more mainstream as countries become more hawkish on trade and the Sino-American war continues to erect barriers to trade that took decades to lift. We have created a basket of ten stocks that we think will be driven over the long term by the demographic rise of the Millennial. The caveat? President Trump's recent short-term deal with China could set back the de-globalization theme. But our geopolitical strategists do not anticipate it to be a durable deal, and they also expect the trade war to resume in some way, shape or form in 2021-22, regardless of the outcome of the US election. The closest ETF ticker symbols resembling this trade is long IVE:US/short IVW:US. Investment Implication #4: Defense Fortress Chart II-7Stick With Pure-play Defense Stocks
Stick With Pure-play Defense Stocks
Stick With Pure-play Defense Stocks
One final long-term playable investment idea from the apex of globalization is a structural bull market in defense stocks (Chart II-7). The US Equity Sector service's October 2016 “Brothers In Arms” Special Report drew parallels with the late nineteenth century period of European rearmament, and the American and Soviet arms race of the 1960s.1 These movements were greatly beneficial to the aerospace and defense industry. Currently, the move by several countries to adopt more independent foreign policies, i.e. to move away from collaboration and cooperation toward isolationism and self-sufficiency, entails an accompanying arms race. Table II-1
January 2020
January 2020
China’s challenge to the regional political status quo motivates a boost to defense spending globally. In fact, SIPRI data on global military spending by 2030 (Table II-1) increases our conviction that this trade will succeed on a five-to-ten year horizon. Beyond the global arms race, two additional forces are at work underpinning pure-play defense contractors. A global space race with China, India and the US wanting to have manned missions to the moon, and the rise of global cybersecurity breaches. Defense companies are levered to both of these secular forces and should be prime sales and profit beneficiaries of rising space budgets and increasing cybersecurity combat budgets. The ticker symbols for the stocks in the pure-play BCA defense index are: LMT, RTN, NOC, GD, HII, AJRD, BWXT, CW, MRCY. Theme #2: Tech Sector Regulation, US Enacts Privacy Laws The second long-term geopolitical theme that we are exploring is the regulatory or “stroke of pen” risk that is rising on FAANG stocks – Facebook, Apple, Amazon, Netflix, and Google. These companies were this decade’s undisputed stock market winners. The US anti-trust regulatory framework was designed to curb broad anti-competitive actions of trusts. As Lina Khan discusses in her seminal article, these actions “include not only cost but also product quality, variety, and innovation.” However, through subsequent regulatory evolution, the Chicago School has focused the US anti-trust process on consumer welfare and prices. If President Reagan and the courts could change how anti-trust laws were administered in the 1980s, so too can future administrations and courts. Today the US Congress, on both sides of the aisle, is looking into regulatory tightening, while the judicial system will take longer to change its approach. Moreover, the impetus for tougher anti-trust policy is here. It comes from a long period of slow growth, income inequality, and economic volatility – such as in the 1870s-80s. This was certainly the case for Standard Oil in 1911, which became a nation-wide boogeyman despite most of its transgressions occurring in the farm belt states. Today, income inequality is a prominent political theme and source of consumer discontent. A narrative is emerging – which will be super-charged during the next recession – that growth has been unequally distributed between the old economy and the twenty-first century technology leaders. While there are a few ESG related ETFs, we would rather explore this theme’s investment implications of sectors to avoid in the coming decade. With regard to privacy, the news is equally grim for large tech outfits. The EU General Data Protection Regulation (GDPR), which came into force on May 2018, imposes compliance burdens on any company handling user data. In the US, California has signed its own version of the law – the Consumer Privacy Act – which will go into effect in January 2020. These laws give consumers the right to know what information companies are collecting about them and who that data is shared with. They also allow consumers to ask technology companies to delete their data or not to sell it. While tech companies are likely to fight the new California law, and the US court system is a source of uncertainty, we believe the writing is on the wall. The EU is by some measures the largest consumer market on the planet. California is certainly the largest US market. It is unlikely that the momentum behind consumer protection will change, especially with the EU and California taking the lead. The odds of a federal privacy law, following in the footsteps of the Consumer Privacy Act, are also rising. Investment Implication #5: Shun Interactive Media & Services Stocks These risks introduce a severe overhang for FAANG stocks. We are especially worried for the S&P interactive media & services index that includes GOOGL and FB. Chart II-8Regulation Will Squeeze Tech Margins
Regulation Will Squeeze Tech Margins
Regulation Will Squeeze Tech Margins
Tack on the threat of federal regulation and this represents another major headwind for profits and margins that are extremely elevated for these near monopolies. Given that advertising revenue is crucial to the business model of social media companies (GOOGL and FB included), a significant uptick in privacy regulation will likely hurt their bottom line. With regard to profit margins, tech stocks in general command a profit margin twice as high as the SPX. Specifically, FB and GOOGL enjoy margins that are 500 basis points higher than the broad tech sector (Chart II-8)! This is unsustainable and they will likely serve as easy prey for policymakers. Our view does not necessarily call for breaking up these monopolies. The US will have to weigh the economic consequences of anti-trust policy in a context of multipolarity in which China’s national tech champions are emerging to compete with American companies for global market share. Nevertheless, increased regulation is inevitable and some forced sales of crown jewel assets may take place. Moreover, the threat of a breakup will lurk in the background, creating uncertainty until key legislative and judicial battles have already been fought. That will take years. Finally, we doubt the tech sector will be left alone to “self-regulate” its incumbents and negotiate a price on consumers’ privacy. More likely, a new privacy law will loom, serving as a negative catalyst for profit growth. Uncertainty will weigh on the S&P interactive media & services relative performance. The ticker symbols to short/underweight the S&P interactive media & services index are an equally weighted basket of GOOGL and FB (they command a 98% market cap weight in the index). Theme #3: SaaS, Artificial Intelligence, Augmented Reality And Autonomous Driving Are Not Fads The third big theme that will even outlive the upcoming decade is the proliferation of software as a service (SaaS). The move to cloud computing and SaaS, the wider adoption of artificial intelligence, machine learning, autonomous driving and augmented reality are not fads, but enjoy a secular growth profile. In the grander scheme of things today’s world is surrounded by software. Millions of lines of code go even into gasoline powered automobiles, let alone electric vehicles. Autonomous driving is synonymous with software, the Internet of Things (IoT) needs software, the space race depends on software, modern manufacturing and software are closely intertwined, phone calls for quite some time have been a software solution, and the list goes on and on. This tidal effect is hard to reverse and is already embedded in workflows across industries. Opportunities to penetrate health care and financial services more deeply remain unexplored and it is difficult to envision another competing industry unseating “king software”. These secular trends are not only productivity enhancing, but will also most likely prove recession-proof. When growth is scarce investors flock to any source of growth they can come by and we are foreseeing that when the next recession arrives, investors will likely seek shelter in pure play SaaS firms. Investment Implication #6: Software Is Eating The World Chart II-9Software Is Eating The World
Software Is Eating The World
Software Is Eating The World
Buying software stocks for the long haul seems like a bulletproof investment idea. But the recent stellar performance of software stocks has moved valuations to overshoot territory. Our recommended strategy is to buy or add software stock exposure on any weakness with a 10-year investment time horizon. All of these secular trends have pushed capital outlays on software into a structural uptrend. Software related capex is not only garnering a larger slice of the tech spending budgets but also of the overall capex pie. If it were not for software capex, the contraction in non-residential investment in recent quarters would have been more severe (Chart II-9). Private sector software capex is near all-time highs as a share of total outlays. Government investment in software is also reaccelerating at the fastest pace since the tech bubble. When productivity gains are anemic, both the business and government sectors resort to software upgrades in order to boost productivity. Cyber security is another more recent source of software related demand as governments around the globe are taking such risks extremely seriously (bottom panel, Chart II-9). Given this upbeat demand backdrop and ongoing equity retirement, software stocks are primed to grow into their pricey valuations. Finally, this long-term trade will also serve as a hedge to the short/underweight position we recommend in the S&P interactive media & services index. The closest ETF ticker symbol resembling the S&P software index is IGV:US. Theme #4: Millennials Already Are The Largest Cohort And Will Dominate Spending The fourth long-term theme we anticipate to gain traction in the 2020s is the demographic rise of the Millennial generation. Much has been made of preparing for the arrival of the Millennial generation, accompanied by well-worn stereotypes of general "failure to launch" as they reach adulthood. However, "arrival" is a misnomer as this age cohort is already the largest and "failure" is simply untrue. According to the US Census Bureau, Millennials are the US’s largest living generation. Millennials (or Echo Boomers) defined as people aged 18 to 37 (born 1982 to 2000), now number more than 80mn and represent more than one quarter of the US’s population. Baby Boomers (born 1946 to 1964) number about 75mn. Stealthily becoming the largest age group in the US over the last few years, Millennials per-year-birth-rate peaked at 4.3mn in 1990. Surprisingly, the pace matched that of the post-war Baby Boom peak-per-year-birth-rate in 1957 - the per-year average over the period was higher for the Baby Boomers (Chart II-10). Chart II-10Millennials Are The Largest Cohort
Millennials Are The Largest Cohort
Millennials Are The Largest Cohort
This gap is now set to grow rapidly as the death rate of Baby Boomers accelerates. What is more, the largest one-year age cohort is only 25 years old, thus, Millennials will be the dominant generation for many years. It is unclear how these “kids” will impact the market as they become the most important consumers, borrowers and investors, but make no mistake: this is a seismic shift in economic power and it is here to stay. The Echo Boom is a big, generational demographic wave. A difficult and painful delay has not tempered its looming importance. Finally, this wave of echo-boomers is educated, relatively unburdened by debt (please see BOX in the June 11, 2018 Special Report on demystifying the student debt load as it pertains to Millennials), and as they inevitably “grow up”, form new households and have kids. They will borrow, spend, earn, but not necessarily save and invest to the same extent as the Boomers. And this will be an important long-term theme going forward. Near term, we might already be seeing signs of their arrival and firms have begun to pivot accordingly. Investment Implication #7: Buy The BCA Millennials Equity Basket Millennials will boost consumption spending in a number of different ways. The relatively unburdened Millennial cohort will be entering prime home acquisition age soon and this should underpin the long-term prospects of the US housing market and related industries. Furthermore, Millennials consume differently from their parents; social media, online shopping and smart phones are not the consumption categories of the Baby Boomers. With this in mind, we have created a basket of ten stocks that we think will be driven over the long term by the demographic rise of the Millennial. We note that these stocks are heavily weighted to the technology and consumer discretionary sectors, which is logical as Millennial consumption habits tend to be discretionary focused and technology-based. Beginning with consumer discretionary, we are highlighting AMZN, NFLX and SPOT as core holdings in our Millennials basket. AMZN’s heft dwarfs consumer discretionary indexes but it could fall in several categories; the acquisition of Whole Foods makes it a Millennials-focused consumer staples retailer and its cloud computing web services segment is a tech leader. NFLX and SPOT represent the means by which Millennials consume media, by streaming movies and music over the internet. The idea of owning physical media is rapidly becoming an anachronism. The home ownership theme noted in this report leads us to add HD and LEN to the basket. Millennials are “doers” and are set to be the dominant DIYers in the next few years, making HD a logical choice. LEN, as the nation’s largest home builder, should benefit from the Millennials coming of age into home buyers. We are also adding TSLA to our basket as a lone clean tech-oriented equity. TSLA capitalizes on the increasing shift to clean energy of Millennials (the key reason why no traditional energy companies have a spot in our basket). Chart II-11Buy BCA's Millennial Equity Basket
Buy BCA's Millennial Equity Basket
Buy BCA's Millennial Equity Basket
The technology stocks in our Millennials basket are AAPL, UBER (which replaces FB as of today) and MSFT, together representing more than 9% of the total value of the S&P 500. AAPL’s inclusion in the list is predictable as the leading domestic purveyor of devices on which Millennials consume media content. FB is a predictable holding, with more than half of all Americans being monthly active users, dominated by the Millennial cohort. It has served our basket well since inception, but today we are compelled to remove it and replace it with UBER. UBER is a Millennial favorite and the epitome of the sharing economy. In reality UBER is a logistics company and while it is losing money, it is eerily reminiscent of AMZN in its early days. Maybe UBER will dominate all means of transportation and its ease of use will propel it to a mega cap in the coming decade. Our inclusion of MSFT is based on its leadership in cloud computing, a rapidly growing industry. We expect the connectivity and mobile computing demands of Millennials will accelerate. The last stock we are adding to our basket is also the only financial services equity. Though avid consumers, Millennials have shown an aversion to cash, preferring card payment systems, including both debit and credit-based. Accordingly, we are adding the leader in both of these, V, to our Millennials basket (Chart II-11). Investors seeking long-term exposure to stocks lifted by the supremacy of the Millennial generation should own our Millennial basket (AAPL, AMZN, UBER, HD, LEN, MSFT, NFLX, SPOT, TSLA, V). We would not hesitate to add other sharing economy stocks, including Airbnb, to this basket should they become investable in the near future. Theme #5: ESG Becomes Mainstream Investors are increasingly looking at allocating assets based on environmental, social, and governance (ESG) considerations, and this mini-theme has the potential to become a big trend in the 2020s. There are a number of factors that underpin ESG investing. First, Millennials are climate conscious and given that they already are the largest cohort in the US they will not only dominate spending, but also influence election results. Moreover, via social media Millennials can sway public opinion and participate in the ESG conversation. Second, ECB President Christine Lagarde recent speech to the Economic and Monetary Affairs Committee of the European Parliament is a must read.2 If the ECB were to explicitly focus on climate change policy as part of its monetary policy operations then this is a game changer. Green investment financing including “green bonds” could become mainstream. Keep in mind that as reported in the FT, “the European Parliament has declared a climate emergency; the new European Commission (EC) has taken office on a promise of an imminent “green new deal”, and Commission president Ursula von der Leyen has vowed to accelerate emissions cuts.” Last week, the EC released “The European Green Deal” with a pretty aggressive time table. The EC president said “The green deal is Europe’s man on the moon moment” and presented 50 policies slated to get rolled by 2022 to meet revamped climate goals. The implication is that once ESG takes center stage at a number of these institutions, it will be easier to become mainstream and propagate the world over. Third, large institutional investors are starting to adopt an ESG mindset, especially pension plans. These investors with trillions of dollars at their disposal can not only disfavor fossil fuel investment, but also undertake investments in “green projects” via private and public equity markets. Banks are also moving in the “greening of finance” direction and given that they are the pipelines of the global plumbing system, swift adoption will go a long way in taking ESG mainstream. Finally, the electric vehicle (EV) proliferation is another key driver on how the ESG theme will play out in the 2020s. As a reminder, in the US 50% of all energy consumption is gasoline related linked to automobiles. While battery technology still has limitations, EV is no longer a fad as the German and Japanese automakers are starting to make inroads on TSLA. These car manufacturers do not want to be left out, especially if this shift toward EV becomes mainstream in the 2020s. The Chinese are not far behind on the EV manufacturing front, however government policy can really become a game changer. If a number of countries and/or California mandate a large share of all new vehicles sold be EV, then the investment implications will be massive. Investment Implication #8: Avoid Fossil Fuels, Gambling, Alcohol And Tobacco… While there are a few ESG related ETFs, we would rather explore this theme’s investment implications of sectors to avoid in the coming decade. We are believers that ESG criteria will continue to gain in importance in institutional investment management decisions. Accordingly, we would tend to avoid ‘sin stocks’, including gambling, tobacco and alcohol; demand for their services is unlikely to decline but investment weightings should mean that share prices will underperform. Further, we think a clean energy shift will mean energy stocks will likely continue to be long-term underperformers (Chart II-12). Final Thoughts On The US Dollar In this report, we tried to focus on the upcoming decade’s big themes that we expect to play out, and centered our recommendations on US equities/sectors. We do not want to neglect some macroeconomic variables that tend to mean revert over time. Specifically, the US dollar, interest rates and most importantly US indebtedness, will also be key drivers of investment theses in the 2020s. Currently, debt is rising faster than nominal GDP growth with the government and non-financial business debt-to-GDP profiles on an unsustainable path (second panel, Chart II-13). Chart II-12Areas To Avoid As ESG Becomes Mainstream
Areas To Avoid As ESG Becomes Mainstream
Areas To Avoid As ESG Becomes Mainstream
Chart II-13Unsustainable Debt Profiles
Unsustainable Debt Profiles
Unsustainable Debt Profiles
Granted, the saving grace has been generationally low interest rates as the debt service ratios have fallen (top panel, Chart II-13). However, if the four decade bull market in Treasurys is over, or may end definitively with the next US recession sometime in the early 2020s, then rising interest rates are the only mechanism to concentrate CEOs’ and politicians’ minds. On the dollar front, Chart II-14 highlights the ebbs and flows of the trade-weighted US dollar since it floated in the early-1970s. The DXY index has moved in six-to-ten year bull and bear markets. The most recent trough was during the depths of the Great Recession, while the (tentative?) peak was in late-2016. If history repeats, eventually the dollar will mean revert lower in the 2020s, especially given the fiscal profligacy of the current administration that may continue into 2024, assuming President Trump gets re-elected next November. Chart II-14Greenback's Historical Ebbs And Flows
Greenback's Historical Ebbs And Flows
Greenback's Historical Ebbs And Flows
The US dollar remains the reserve currency of the world today, but that exorbitant privilege is clearly fraying on the edges as the balance-of-payments dynamics are heading in the wrong direction. Over the next five years, the US Congressional Budget Office (CBO) estimates that the US budget deficit will swell to 4.8% of GDP. Assuming the current account deficit widens a bit then stabilizes (usually happens when global growth improves), this will pin the twin deficits at 8% of GDP. This assumes no recession, which would have the potential to swell the deficit even further. The US saw its twin deficits swell to almost 13% of GDP following the financial crisis, but the difference then was that in the wake of the commodity boom the dollar was cheap (and commodity currencies overvalued). The subsequent shale revolution also greatly cushioned the US trade deficit. Shale productivity remains robust and US output will continue to rise, but the low-hanging fruit has already been plucked. Chart II-15Twin Deficits Will Weigh On The US Dollar
Twin Deficits Will Weigh On The US Dollar
Twin Deficits Will Weigh On The US Dollar
For one reason or another, foreign central banks are diversifying out of dollars. If due to the changing landscape in trade, this is set to continue. If it is an excuse to shy away from the rapidly rising US twin deficits, this will continue as well. In a nutshell, there has been hardly a time in recent history when the twin deficits in the US were rising and the dollar was in a secular uptrend (Chart II-15). Another dollar-negative force is its expensiveness. By rising 35% since its trough, the USD has sapped the competitiveness of the US manufacturing sector, which is accentuating the American trade deficit outside of the commodity sector. If the ESG trend ends up hurting oil prices, the US current account will follow the widening deficit in manufactured products. Moreover, the US is lagging Europe on the green revolution. Either the US will have to import green technologies, or the US government will have to provide more subsidies to the private sector. Either way, both of these dynamics will hurt the US current account deficit further. Historically, the currency market is the main vehicle to correct such imbalances. The apex of globalization will also hurt the greenback. In a world where all the markets are integrated, borrowers in EM nations often use the reserve currency to issue liabilities at a lower cost. This boosts the demand by EM central banks for US dollar reserves to protect domestic banking systems funded in USD. Moreover, some countries like China implement pegs (both official and unofficial) to the US dollar in order to maintain their competitiveness and export their production surpluses to the US. To do so they buy US assets. If the global economy becomes more fragmented and the Sino-US relationship continues to deteriorate structurally as we expect, then these sources of demand for the dollar will recede. Overlay the widening US current account deficit, and you have the perfect recipe for a depreciating trade-weighted US dollar. Finally, the US is likely to experience more inflation than the rest of the world following the next recession. The US economy has a smaller capital stock as a share of GDP than Europe or Japan, and American demographics are much more robust. This means that the neutral rate of interest is higher in the US than in other advanced economies. As a result, the Fed will have an easier time generating inflation by cutting real rates than both the ECB and the BoJ. Higher inflation will ultimately erode the purchasing power of the dollar and prove to be a structurally negative force for the USD. Anastasios Avgeriou US Equity Strategist Matt Gertken Geopolitical Strategist Marko Papic Chief Strategist, Clocktower Group Chester Ntonifor Foreign Exchange Strategist Mathieu Savary Vice President The Bank Credit Analyst Footnotes 1 Please see US Equity Strategy Special Report "Brothers In Arms," dated October 31, 2016, available at uses.bcaresearch.com 2 https://www.imf.org/en/News/Articles/2019/09/04/sp090419-Opening-Statement-by-Christine-Lagarde-to-ECON-Committee-of-European-Parliament
Highlights OPEC 2.0 production discipline and the capital markets’ parsimony in re funding US shale-oil producers will restrain oil supply growth. Monetary and fiscal stimulus will revive EM demand. These fundamentals will push inventories lower, further backwardating forward curves. Base metals demand will pick up as EM income growth revives. Demand also will get a boost from the ceasefire in the Sino-US trade war. Gold will remain range-bound for most of next year: A weaker USD and rising inflation expectations are bullish, but rising bond yields and reduced trade tensions will be headwinds. Grain markets will drift, although dry conditions in Argentina and the trade-war ceasefire could provide short-term price support, along with a weaker USD. Risk to our view: Continued elevated global policy uncertainty would support a stronger USD and stymie central bank efforts to revive global growth in 2020. Feature Dear Client, We present our key views for 2020 in this issue of Commodity & Energy Strategy. This will be our last publication of 2019, and we would like to take the opportunity to thank you for your on-going interest in the commodity markets and in our publication. It has been our privilege to serve you. We wish you and your loved ones all the best of this beautiful Christmas season and a prosperous New Year in 2020! Robert Ryan Chief Commodity & Energy Strategist Going into 2020, policy uncertainty again will be a key driver of commodity demand, the Sino-US trade-war ceasefire and UK election results notwithstanding.1 As uncertainty has increased, demand for safe havens like the USD and gold have increased. The principal impact of this uncertainty shows up in FX markets. As uncertainty has increased, demand for safe havens like the USD and gold has increased. Indeed, the Fed’s Broad Trade-Weighted USD index for goods (TWIBG) has become highly correlated with the Global Economic Policy Uncertainty index (GEPU). The three-year rolling correlation between these indexes reached a record high in November 2019 (Chart of the Week).2 Individually, the record for the TWIBG was posted in September 2019, while the GEPU record was hit in August 2019. Chart of the WeekGlobal Economic Policy Uncertainty Highly Correlated With USD
2020 Key Views: Policy Uncertainty Continues To Drive Commodity Markets
2020 Key Views: Policy Uncertainty Continues To Drive Commodity Markets
A strong USD affects commodity demand directly, because it slows income growth in EM economies – the engine-house of commodity demand. A stronger USD raises the local-currency cost of consuming commodities – an important driver of EM demand – and reduces the local-currency cost of producing commodities. So, at the margin, demand is pressured lower and supply growth is incentivized – together, these effects combine to push prices lower. Economic policy uncertainty likely will diminish in early 2020, following the Sino-US trade-war ceasefire, the decisive UK election results and continued central-bank signaling – particularly from the Fed – that rates policy will remain accommodative for the foreseeable future. That said, the ceasefire does not mark the end of the Sino-US trade war, and many issues – ongoing US-China tensions, US election uncertainty, global populism and nationalism, rising geopolitical tensions in the Persian Gulf, ad hoc monetary policy globally – still are to be resolved. Terra Incognita The GEPU index does not measure uncertainty per se, as uncertainty per se cannot be measured.3 The index picks up word usage connected with the word “uncertainty.” So, it is more the perception of uncertainty that is being reported by Economic Policy Uncertainty in its data. Nonetheless, this is a good way to measure such sentiment, as research from the St. Louis Fed found: “Increases in the economic uncertainty index tend to be associated with declines (or slower growth) in real GDP and in real business fixed investment.” In past three years, increased policy uncertainty also has been fueling demand for safe havens, chiefly the USD and gold. This is a highly unusual coincidence – i.e., a rising USD accompanied by a rising gold price. Typically, a weaker USD puts a bid under gold prices. Indeed, this relationship is one of the primary drivers of our gold model, which suggests the effect of the heightened policy uncertainty dominates the USD impact on gold prices in the current environment (Chart 2). Chart 2Gold Typically Rallies When the USD Weakens
Gold Typically Rallies When the USD Weakens
Gold Typically Rallies When the USD Weakens
The flip-side of the deleterious effects of higher economic policy uncertainty is its resolution: Growing cash balances and a higher capacity to lever balance sheets of households, firms and investor accounts means there is a lot of dry powder available to recharge growth in the real and financial economies globally.4 Chart 3BCA's Grwowth Gauges Indicate Global Economy Rebounding
BCA's Grwowth Gauges Indicate Global Economy Rebounding
BCA's Grwowth Gauges Indicate Global Economy Rebounding
Our commodity-driven economic activity gauges are picking up growth impulses, most likely in response to the global monetary stimulus that has been deployed this year (Chart 3). In addition, systemically important central banks have given no indication they are going to be reversing this stimulus. A meaningful reduction in uncertainty could turbo-charge global growth prospects. Below, we provide our key views for each of the commodity complexes we cover. Oil Outlook Energy: Overweight. The oil market is poised to move higher on the back of OPEC 2.0’s deepening of production cuts to 1.7mm b/d, mostly because of actions by the Kingdom of Saudi Arabia (KSA) to cut output deeper, to a total of close to 900k b/d vs. its October 2018 production levels.5 Combined with the loss of ~ 1.9mm b/d of production in Iran and Venezuela due to US sanctions, the supply side can be expected to tighten next year (Chart 4). The Vienna meeting – which ended December 6, 2019 – demonstrated commitment to OPEC 2.0’s production-restraint strategy, and we expect member states will deliver. At least they will reduce the incidence of free riding at KSA’s expense – there were subtle hints from the Saudis they will not tolerate such behavior. KSA’s threats in this regard are credible, given its follow-through in 1986 when they surged production and briefly drove WTI prices below $10/bbl to send a message to free riders in the OPEC cartel. The Saudis acted similarly during the 2014 – 2016 market share war. US shale-oil production growth will slow next year to 800k b/d y/y, vs. the 1.35mm b/d we expect for this year. US lower 48 crude production will increase to 10.7mm b/d in 2020, taking total US production to 13.1mm b/d, a ~ 850k b/d increase y/y. On the demand side, we lowered our expectation for 2019 growth to 1.0mm b/d, given the continued downgrades of historical consumption estimates this year from the EIA, IEA and OPEC. Nonetheless, we continue to expect 2020 growth of 1.4mm b/d, on the back of continued easing of global financial conditions, led by central-bank accommodation. Given our view, we remain long oil exposures in several ways. First, we remain long WTI futures outright going into 2020; this position is up 30% from January 3, 2019 when it was initiated. Second, we recommended getting long 2H20 vs. short 2H21 Brent futures, expecting crude oil forward curves to backwardate further as tighter supply and stronger demand force refiners to draw inventories harder next year (Chart 5). Chart 4Markets Will Tighten In 2020
Markets Will Tighten In 2020
Markets Will Tighten In 2020
Chart 5Oil Inventories Will Draw Harder In 2020
Oil Inventories Will Draw Harder In 2020
Oil Inventories Will Draw Harder In 2020
We expect Brent crude oil to average $67/bbl next year, given the fundamentals outlined above. We also expect a weaker dollar to be supportive of demand ex-US. WTI will trade at a $4/bbl discount to Brent next year, based on our modeling (Chart 6). Chart 6Brent, WTI Will Trade Higher
Brent, WTI Will Trade Higher
Brent, WTI Will Trade Higher
We remain overweight energy, crude oil in particular, given our expectation markets will tighten on the supply side and demand growth, particularly in EM economies, will revive. Bottom Line: We remain overweight energy, crude oil in particular, given our expectation markets will tighten on the supply side and demand growth, particularly in EM economies, will revive. This expectation will be challenged by continued economic policy uncertainty. On the flip side, however, a meaningful resolution to this uncertainty could turbo-charge growth as real economic activity picks up and the USD weakens. Base Metals Outlook Base Metals: Neutral. We remain strategically neutral base metals going into 2020, but tactically bullish, carrying a long LMEX and iron-ore spread position into the new year.6 The behavior of base metals prices – used by economists as proxies for EM growth – is indicating industrial demand is picking up (Chart 7). This aligns well with our proprietary indicators of commodity demand and global industrial activity (Chart 8). Base metals prices are more sensitive to changes in global growth than other commodities. For this reason, we use these prices to confirm the signals coming from the proprietary models we use to gauge EM growth. Chart 7Base Metals Prices Signaling EM Growth Revival
Base Metals Prices Signaling EM Growth Revival
Base Metals Prices Signaling EM Growth Revival
The so-called phase-one agreement to reduce tariffs in the Sino-US trade war will support global demand at the margin for base metals. This is a ceasefire in the trade war not a resolution, so we are not expecting a surge in demand. Chart 8BCA Proprietary Indicators Also Signaling Growth Revival
BCA Proprietary Indicators Also Signaling Growth Revival
BCA Proprietary Indicators Also Signaling Growth Revival
That said, base metals – aluminum and copper, in particular – have a tailwind in the form of global monetary accommodation by central banks. This was undertaken to reverse the negative effect on global financial conditions brought about by the Fed’s rates normalization policy last year and China’s 2017-18 deleveraging campaign. In addition, our China strategists expect modest fiscal and monetary stimulus from Beijing, which also will be supportive of demand.7 Aluminium and copper comprise 75% of the LMEX index. These are primary industrial markets, in which China accounts for ~ 50% of global demand, and EM ex-China demand remains stout. Even with a trade war raging for most of 2019, the supply and demand of aluminum and copper – the largest components of the LMEX index – was diverging: Consumption outpaced production – a multi-year trend – which forced inventories to draw hard (Charts 9A and 9B). Chart 9AGlobal Aluminum Markets Getting Tighter …
Global Aluminum Markets Getting Tighter ...
Global Aluminum Markets Getting Tighter ...
Chart 9B… As Are Copper Markets
... As Are Copper Markets
... As Are Copper Markets
Bottom Line: Inventories in industrial-metals markets have been drawing hard for years – particularly in aluminum – as metals' demand remained above supply. Given this, we are long the LMEX index: Even a marginal growth pick-up could rally prices. Precious Metals Outlook Precious Metals: Neutral. Going into 2020, gold’s outlook could be volatile – especially in 1H20 – as the metal’s key drivers will send conflicting signals (Table 1). Table 1Fundamental And Technical Gold-Price Drivers
2020 Key Views: Policy Uncertainty Continues To Drive Commodity Markets
2020 Key Views: Policy Uncertainty Continues To Drive Commodity Markets
Gold prices are holding up above $1,450/oz. Our latest fair-value estimate indicates gold will hover around $1,475/Oz over the short-term (Chart 10). We break next year’s gold forecast into two parts: Phase 1: Growth revival and uncertainty respite. These two factors are closely intertwined; the magnitude of global growth’s rebound is conditional on a reduction of global economic policy uncertainty. We expect this relief will come from a ceasefire in the US-China trade war. Combined, accelerating economic activity – mainly driven by EM economies – and falling uncertainty will push the US dollar lower.8 For gold prices, this phase will be characterized by two contrasting forces: A falling USD (bullish gold) vs. lower safe-haven demand and rising US interest rates (bearish gold). US rates will increase early next year as global uncertainty is reduced and bond markets price-out Fed rates cuts. The current unusually high correlation between gold and US rates implies gold will face selling pressures during this period (Chart 11). Nonetheless, we expect the Fed will stay on hold and not start raising rates next year, which will cap price risks to gold. Chart 10High USD Correlation Throws Off Fair-Value Model Gold Prices Will Rise 4Q20
High USD Correlation Throws Off Fair-Value Model Gold Prices Will Rise 4Q20
High USD Correlation Throws Off Fair-Value Model Gold Prices Will Rise 4Q20
Chart 11US Rates Could Hurt Gold Prices In 1H20
US Rates Could Hurt Gold Prices In 1H20
US Rates Could Hurt Gold Prices In 1H20
Phase 2: EM wealth effect and inflation rebound. As income growth accelerates, EM households will slowly accumulate jewelry, coins, and bars – of which China and India are the largest consumers. Demand pressure from these consumers will manifest itself in 2H20, adding to buoyant central-banks purchases of gold. The upside in bond yields will be limited by major central banks’ dovish stance until inflation is well-established above target. Closely monitoring the evolution of inflation will become increasingly important in 2020, given inflation pressures are building in the US and globally (Chart 12). A lower USD – supporting stronger commodity demand – will magnify global inflation trends (Chart 13). There is a very real risk inflation shoots up in 4Q20, keeping real rates low. This differs from our BCA House view, which does not see inflation pressures building until 2021. Chart 12Inflationary Pressures Are Building Up In The US And Globally
Inflationary Pressures Are Building Up In The US And Globally
Inflationary Pressures Are Building Up In The US And Globally
Political uncertainty likely will return ahead of the 2020 US election. A resurgence in popular support for one of the progressive Democratic candidates – Elizabeth Warren or Bernie Sanders – could disrupt US stock markets. Gold would advance in such an environment. Chart 13No Inflation Without A Weaker USD
No Inflation Without A Weaker USD
No Inflation Without A Weaker USD
Progressive populists would lead to domestic policy uncertainty and larger budget deficits, yet would not remove the threat of trade protectionism. We expect the Fed will stay on hold and not start raising rates next year, which will cap price risks to gold. Bottom Line: Gold prices will move sideways in 1H20 and will drift higher in 4Q20 supported by depressed real rates, a lower dollar, and US election uncertainty. Silver Market Chart 14Silver Prices Will Move Higher With Gold Prices
Silver Prices Will Move Higher With Gold Prices
Silver Prices Will Move Higher With Gold Prices
Silver prices have traded closely with gold since the Global Financial Crisis (GFC), moreso than with industrial metals (Chart 14). Prior to the GFC, silver traded like a base metal, owing to the high growth rates in EM economies undergoing rapid industrialization. Post-GFC, the evolution of silver’s price more closely tracked gold prices, following the massive injections of money and credit by central banks globally. Thus, we expect it will continue to follow the evolution of gold prices outlined above. Nonetheless, industrial applications still represent ~ 50% of silver’s physical demand and its supply-demand balance is estimated to have been tight this year. Silver likely will outperform gold next year as global growth and industrial activity rebound. PGM Markets The palladium market will remain tight in 2020. According to Johnson Matthey, the 10-year-long supply deficit is expected to widen massively this year, when all’s said and done. Prices surpassed $1,900/oz in December, forcing inventory liquidation (Chart 15). We believe the platinum-to-palladium ratio is at a level that would incentivize substitution in the pollution-control technology in gasoline-powered engines, and supports higher platinum content in diesel catalyzers (Chart 16).9 Nonetheless, swapping palladium for platinum is complex and requires a redesign of the production process. A lot will depend on how much the added cost of the more expensive palladium affects new-car buyers’ demand.10 To date, there are no signs car makers have already – or are willing to – initiate this process on a significant scale. Chart 15Palladium Inventories Are Depleted
Palladium Inventories Are Depleted
Palladium Inventories Are Depleted
A few factors need to align to incentivize substitution of palladium for platinum. The price ratio between the two metals should reach extreme levels; the price divergence should be expected to last for a prolonged period of time, and concerns over supply security of platinum should be low. Chart 16Relative Inventory levels Drive The Palladium To Platinum Price Ratio
Relative Inventory levels Drive The Palladium To Platinum Price Ratio
Relative Inventory levels Drive The Palladium To Platinum Price Ratio
In today’s context, this last condition could slow substitution. South African platinum supply – which represents close to 73% of the world primary supply – is projected to fall by close to 3% next year. Automakers need stable platinum supplies as they increase their demand for the metal and with persistent power-supply issues in South Africa – exacerbated by recent flooding – this condition will be hard to meet. No market has been harder hit by the Sino-US trade war than grains and ags generally. Thus, palladium holds an advantage over platinum on that front. Its supply sources are more diversified, and with 15% comes from stable North American countries and 40% comes from Russia. We believe substitution will commence, but this is a gradual process and will only slowly affect the metals’ price ratio.11 For 2020, we expect palladium prices to continue increasing due to stricter pollution regulation in China, India, and Europe.12 Ag Outlook Chart 17Sino-US Trade War, USD Hammer Grain Prices
Sino-US Trade War, USD Hammer Grain Prices
Sino-US Trade War, USD Hammer Grain Prices
Ags/Softs: Underweight. The final form of the ceasefire in the Sino-US trade war – i.e., the “phase one” deal between China and the US to roll back tariffs – has yet to show itself. Last Friday, US Trade Representative Robert Lighthizer stated China has agreed to buy $32 billion – over the next two years – of US ag products as part of a “phase one” deal. This news moved corn, wheat and beans prices up 6.3%, 3.2%, and 3.4% respectively as of Tuesday’s close. Another positive news for US farmers was an announcement from the USDA that the final $3.6 billion of the $14.5 billion budgeted for farm subsidies this year to offset the trade war impact on US farmers most likely would be made in the near future by the Trump administration.13 No market has been harder hit by the Sino-US trade war than grains and ags generally. Severe weather across much of the US Midwest should have produced a rally, as offshore demand competed for available supply, which likely would have been lower at the margin last year absent a trade war. Instead, corn, wheat and beans are going into 2020 pretty much at the same price levels they went into 2019. In addition to the deleterious effect of the US-China trade war, ag markets have been particularly hard hit by the strong USD, which makes exports from the US expensive relative to alternative suppliers – e.g., Argentina and Brazil, which are posing serious challenges to US farmers (Chart 17). Global inventories are, nonetheless, being whittled away, which is good news for farmers generally (Chart 18). And, this likely will continue in 2020, given the physical deficits expected this year (Chart 19). Chart 18GLOBAL GRAIN STOCKS BEING WHITTLED DOWN ...
GLOBAL GRAIN STOCKS BEING WHITTLED DOWN ...
GLOBAL GRAIN STOCKS BEING WHITTLED DOWN ...
Chart 19... Physical Deficits Will Whittle Stocks Further Next Year
... Physical Deficits Will Whittle Stocks Further Next Year
... Physical Deficits Will Whittle Stocks Further Next Year
Markets are still awaiting final details of the ceasefire in the Sino-US trade war. The deal is expected to be signed in the first week of January. 2020 could be the year the global ag markets come more into balance, with stocks-to-use levels falling and normal trade resuming. We are not inclined to take a view on this possibility and are therefore remaining underweight the ag complex. Robert P. Ryan Chief Commodity & Energy Strategist rryan@bcaresearch.com Hugo Bélanger Senior Analyst Commodity & Energy Strategy HugoB@bcaresearch.com Footnotes 1 Our outlook last year was entitled 2019 Key Views: Policy-Induced Volatility Will Drive Markets. It was published December 13, 2018, and is available at ces.bcaresearch.com. This year’s outlook again reflects our House view, which was published in the Bank Credit Analyst on November 28, 2019, entitled OUTLOOK 2020: Heading Into The End Game. It was sent to all clients last month and is available at bca.bcaresearch.com. 2 Uncertainty is measured using the Baker-Bloom-Davis Global Economic Policy Uncertainty (GEPU) index. GEPU is a monthly GDP-weighted index of newspaper headlines containing a list of words related to three categories – “economy,” “policy” and “uncertainty.” Newspapers from 20 countries representing almost 80% of global GDP (on an exchange rates-weighted basis) are scoured monthly to create the index. Please see Economic Policy Uncertainty for additional information. We use the Fed's USD broad trade-weighted index for goods (TWIBG) reported by the St. Louis Fed to track the USD. Please see the St. Louis Fed’s FRED website at Trade Weighted U.S. Dollar Index: Broad, Goods. 3In a June 2011 interview with the Minneapolis Fed, Ricardo Caballero, a professor of economics at MIT, provided a succinct description of risk and uncertainty, paraphrasing former US Defense Secretary under President George W. Bush Donald Rumsfeld: “(W)hen he talked about the difference between known unknowns and unknown unknowns. The former is risk; the latter is uncertainty. Risk has a more or less well-defined set of outcomes and probabilities associated with them. Uncertainty does not—things are much less clear.” Kevin L. Kliesen of the St. Louis Fed explores the link between rising uncertainty and slower economic growth in Uncertainty and the Economy (April 2013), observing, “If the business and financial community believes the near-term outlook is murkier than usual, then the pace of hiring and outlays for capital spending projects may be unnecessarily constrained, thereby slowing the overall pace of economic activity.” 4The Wall Street Journal reported investors have accumulated a $3.4 trillion cash position, a decade-high level; this is consistent with the risk aversion that can be expected when economic uncertainty is high. Please see Ready to Boost Stocks: Investors’ Multitrillion Cash Hoard, published by The Wall Street Journal November 5, 2019. 5 Accounting for Saudi Arabia's 400k b/d of additional voluntary cuts. 6 The LMEX no long trades on the LME, but we are using the index as a proxy for a position. In iron ore, we are long December 2020 65% Fe futures vs. short 62% Fe futures on the Singapore Exchange, expecting steelmakers will favor the high-grade material in the new mills they’ve brought on line. 7 Our China strategists expect “Chinese policymakers will roll out more stimulus to secure an economic recovery in 2020, and external demand will improve. But we expect growth in both the domestic economy and exports to only modestly accelerate.” Please see 2020 Key Views: Four Themes For China In The Coming Year, published by BCA Research’s China Investment Strategy December 11, 2019. It is available at cis.bcareserach.com. 8 The US dollar is a countercyclical – i.e. it is inversely correlated with the global business cycle – due to the fact that the US economy is driven more by services than manufacturing. 9 Palladium is used mostly in pollution-abatement catalysts in gasoline-powered cars, while Platinum is favored in diesel-engine cars (along with a small amount of palladium). Catalysts production represents close to 80% and 45% of palladium's and platinum's total demand. 10 Considering there’s ~ 3.5g of palladium in a new car and palladium trades at ~ $1,900/oz, close to $240 is added to the cost of a new gasoline-powered car by using this metal in pollution-abatement technology. 11 Please see South African Mines Grind To Halt As Floods Deepen Power Crisis, published by reuters.com on December 10, 2019. 12 Stricter emissions standards in the car industry – mainly in China where China 6 emissions legislation is taking effect – are increasing the PGMs loadings in each car, supporting demand growth. 13 Please see China May Agree to Buy U.S. Ag Exports, But a Final Tranche of Cash to Farmers is Still Likely, published by agriculture.com’s Successful Farming news service. Investment Views and Themes Recommendations Strategic Recommendations Tactical Trades TRADE RECOMMENDATION PERFORMANCE IN 2019 Q3
2020 Key Views: Policy Uncertainty Continues To Drive Commodity Markets
2020 Key Views: Policy Uncertainty Continues To Drive Commodity Markets
Commodity Prices and Plays Reference Table Trades Closed in 2019 Summary of Trades Closed
2020 Key Views: Policy Uncertainty Continues To Drive Commodity Markets
2020 Key Views: Policy Uncertainty Continues To Drive Commodity Markets
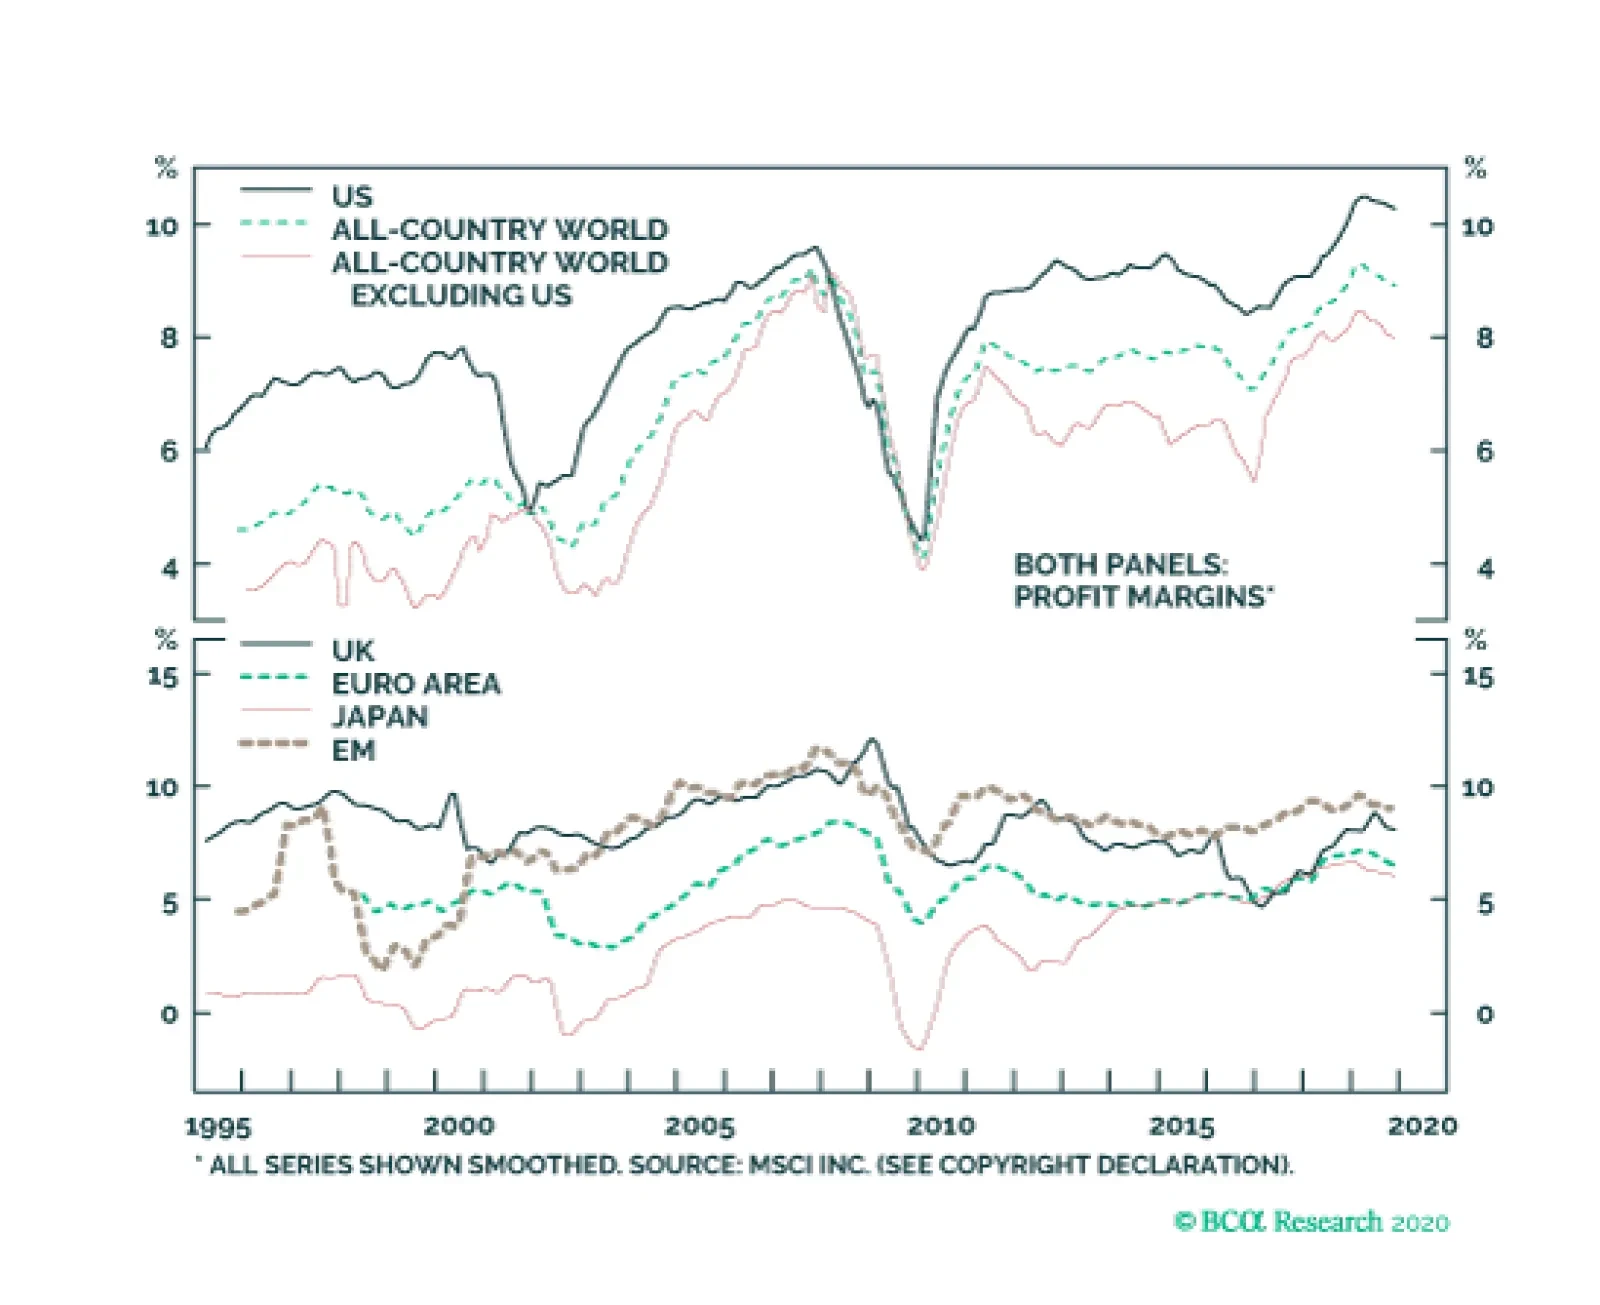
We expect US stocks to rise in 2020 by about 5%-to-10%, but to lag their foreign peers in common-currency terms. There are four reasons for this: Sector skews favor non-US equities. Cyclical stocks tend to outperform defensives when global growth is…
Feature The purpose of this Special Report is to identify and provoke a healthy debate on the prevailing investment themes for the 2020s and to speculate on what the key US sector beneficiaries and likely losers may be. Every decade a dominant theme captures investors’ imaginations and morphs into a bubble. Massive speculation typically propels the relevant asset class into the stratosphere as investors extrapolate the good times far into the future and go on a buying frenzy. Chart 1 shows previous manic markets starting with the Nifty Fifty, gold bullion, the Nikkei 225, the NASDAQ 100, crude oil and most recently the FAANGs. Chart 1Manias: An Historical Roadmap
Manias: An Historical Roadmap
Manias: An Historical Roadmap
What will be the dominant themes of the next decade? How should investors capitalize on some of these big trends? The purpose of this Special Report is to identify and provoke a healthy debate on the prevailing investment themes for the 2020s and to speculate on what the key US sector beneficiaries and likely losers may be. Theme #1: De-Globalization Picks Up Steam The first investment theme for the upcoming decade is the “apex of globalization” or “de-globalization”. We have written about this theme extensively at BCA Research and it is the mega-theme of our sister Geopolitical Strategy (GPS) service. Odds are high that countries will continue looking inward as the US adopts a more aggressive trade policy, China’s trend growth slows, and US-China strategic tensions intensify. The three pillars of globalization are the free movement of goods, capital, and people across national borders. We expect to see marginally less of each in the future. Chart 2 shows that we are at the conclusion of a period of tranquility. Pax Americana underpinned globalization as much as Pax Britannica before it. The US is in a relative decline after decades of geopolitical stability allowed countries like China to rise to “great power” status and rivals like Russia to recover from the chaos of the 1990s. Chart 2De-globalization Has Commenced
De-globalization Has Commenced
De-globalization Has Commenced
De-globalization has become the consensus since the election of Donald Trump. But Trump is not the prophet of de-globalization; he is its acolyte. Globalization is ending because of structural factors, not cyclical ones. And its decline was pre-written into its “source code.” Three factors stand at the center of this assessment, outlined in our 2014 Special Report, “The Apex Of Globalization – All Downhill From Here”: multipolarity, populism and protectionism. Events have since confirmed this view. The three pillars of globalization are the free movement of goods, capital, and people across national borders. We expect to see marginally less of each in the future. Investment Implication #1: Profit Margin Peak The most profound and provocative investment implication from de-globalization is that SPX profit margins have peaked and will likely come under intense pressure, especially for US conglomerates that – on a relative basis to international peers – most enthusiastically embraced globalization. Reconstructed S&P 500 profits and sales data date back to the late-1920s. Historically, corporate profit margins and globalization (depicted as global trade as a percentage of GDP) have been positively correlated (Chart 3). Chart 3Profit Margin Trouble
Profit Margin Trouble
Profit Margin Trouble
As countries are more outward looking, trade flourishes and openness to trade allows the free flow of capital to take advantage of profit-maximizing projects. Following the Great Recession and similar to the Great Depression, trade has suffered and trade barriers have risen. The Sino-American trade war has accelerated the inward movement of countries, including Korea and Japan, and has had negative knock-on effects on trade as evidenced by the now two-year old global growth deceleration. China’s response to President Trump’s election was to redouble its pursuit of economic self-sufficiency, which meant a crackdown on corporate debt and a fiscal boost to household consumption. Trump’s tariffs then damaged sentiment and trade between the two countries. Any deal reached prior to the 2020 US election will remain in doubt among global investors. The longer the trade war remains unresolved, the deeper the cracks will be in the foundations of the global trading system. Such a backdrop is negative for profit margins, as inward looking countries prevent capital from being allocated most efficiently. Moreover, the uprooting of supply chains due to the trade war hurts margins and the redeployment of equipment in different jurisdictions will do the same at a time when final demand is suffering a setback. In addition, rising profit margins are synonymous with wealth accruing to the top 1% of US families and vice versa. This relationship dates back to the late-1920s, as far back as our dataset goes. Using Piketty and Saez data, which exclude capital gains, it is clear that profit margin expansion exacerbates income inequality (top panel, Chart 4). Chart 4Heightened Risk Of Wealth Re-distribution
Heightened Risk Of Wealth Re-distribution
Heightened Risk Of Wealth Re-distribution
Expanding margins lead to higher profits. Because families at the top of the income distribution are more often than not business owners, income disparities are the widest when margins are in overshoot territory. Eventually this income chasm comes to a head and generates political discontent. Populism has emerged on both the right and left wings of the US political spectrum – and since the rise of Trump, even Republicans complain about inequality and the excesses of “corporate welfare” and laissez-faire capitalism. Because inequality is extreme – relative to America’s developed peers – and political forces are mobilizing against it, the probability of wealth re-distribution is rising in the coming decades (middle panel, Chart 4). Labor’s share of national income has nowhere to go but higher in coming years and that is negative for profit margins, ceteris paribus (bottom panel, Chart 4). Drilling beneath the surface, the three secular US equity sector/factor implications of the apex of globalization paradigm shift are: prefer small caps over large caps prefer value over growth overweight the pure-play BCA Defense Index Investment Implication #2: Small Is Beautiful While a small cap bias is contrary to the cyclical US Equity Strategy view of preferring large caps to small caps, the issue is timing: the small cap preference is a secular view with a time horizon that spans the next decade. The small versus large cap share price ratio’s ebbs and flows persist over long cycles. Small caps outshined large caps uninterruptedly from 1999 to 2010. Since then large caps have had the upper hand (Chart 5). Were the apex of globalization theme to gain traction in the 2020s, small caps should reclaim the lead from large caps, especially in the wake of the next US recession. Similar to the death of the global banking model, companies with global footprints will suffer the most, especially compared with domestically focused outfits. One way to explore this theme is via domestic versus global sector preference. But a more investable way to position for this sea change, is to buy small caps (or microcaps) at the expense of large caps (or mega caps). Small caps are traditionally domestically geared compared with large caps that have significantly more foreign sales exposure. Chart 5It’s A Small World After All
It’s A Small World After All
It’s A Small World After All
The closest ETF ticker symbols resembling this trade is long IWM:US/short SPY:US. Investment Implication #3: Buy Value At The Expense Of Growth Similar to the size bias, the style bias also moves in secular ways. Value outperformed growth from the dot com bust until the GFC. Since then growth has crushed value, even temporarily breaking below the year 2000 relative trough. This breakneck pace of appreciation for growth stocks is clearly unsustainable and offers long-term oriented investors a compelling entry point near two standard deviations below the historical mean (Chart 6). Chart 6Value Has The Upper Hand Versus Growth
Value Has The Upper Hand Versus Growth
Value Has The Upper Hand Versus Growth
Financials populate value indexes, a similarity with small cap outfits. Traditionally, financials are a domestically focused sector with export exposure registering at half of the S&P’s average 40% level of internationally sourced revenues. On the flip side, tech stocks sit atop the growth table and they garner 60% of their revenue from abroad. This value over growth style preference will pay handsome dividends if the de-globalization theme becomes more main stream as countries become more hawkish on trade and the Sino-American war continues to erect barriers to trade that took decades to lift. The caveat? If President Trump strikes a short-term deal with China ahead of the 2020 election, the de-globalization theme will suffer a setback. But our geopolitical strategists expect a ceasefire at best, not a durable deal, and also expect the trade war to resume in some way, shape or form in 2021-22, regardless of the outcome of the US election. The closest ETF ticker symbols resembling this trade is long IVE:US/short IVW:US. Investment Implication #4: Defense Fortress One final long-term playable investment idea from the apex of globalization is a structural bull market in defense stocks (Chart 7). Our October 2016 “Brothers In Arms” Special Report drew parallels with the late nineteenth century period of European rearmament, and the American and Soviet arms race of the 1960s. These movements were greatly beneficial to the aerospace and defense industry. Currently, the move by several countries to adopt more independent foreign policies, i.e. to move away from collaboration and cooperation toward isolationism and self-sufficiency, entails an accompanying arms race. Chart 7Stick With Pure-play Defense Stocks
Stick With Pure-play Defense Stocks
Stick With Pure-play Defense Stocks
Table 1
Top US Sector Investment Ideas For The Next Decade
Top US Sector Investment Ideas For The Next Decade
China’s challenge to the regional political status quo motivates a boost to defense spending globally. In fact SIPRI data on global military spending by 2030 (Table 1) increases our conviction that this trade will succeed on a five-to-ten year horizon. Beyond the global arms race, two additional forces are at work underpinning pure-play defense contractors. A global space race with China, India and the US wanting to have manned missions to the moon, and the rise of global cybersecurity breaches. Defense companies are levered to both of these secular forces and should be prime sales and profit beneficiaries to rising space budgets and increasing cybersecurity combat budgets. The ticker symbols for the stocks in the pure-play BCA defense index are: LMT, RTN, NOC, GD, HII, AJRD, BWXT, CW, MRCY. Theme #2: Tech Sector Regulation, US Enacts Privacy Laws The second long-term geopolitical theme that we are exploring is the regulatory or “stroke of pen” risk that is rising on FAANG stocks – Facebook, Apple, Amazon, Netflix, and Google. These companies were this decade’s undisputed stock market winners. The US anti-trust regulatory framework was designed to curb broad anti-competitive actions of trusts. As Lina Khan discusses in her seminal article, these actions “include not only cost but also product quality, variety, and innovation.” However, through subsequent regulatory evolution, the Chicago School has focused the US anti-trust process on consumer welfare and prices. If President Reagan and the courts could change how anti-trust laws were administered in the 1980s, so too can future administrations and courts. Today the US Congress, on both sides of the aisle, is looking into regulatory tightening, while the judicial system will take longer to change its approach. Moreover, the impetus for tougher anti-trust policy is here. It comes from a long period of slow growth, income inequality, and economic volatility – such as in the 1870s-80s. This was certainly the case for Standard Oil in 1911, which became a nation-wide boogeyman despite most of its transgressions occurring in the farm belt states. Today, income inequality is a prominent political theme and source of consumer discontent. A narrative is emerging – which will be super-charged during the next recession – that growth has been unequally distributed between the old economy and the twenty-first century technology leaders. With regard to privacy, the news is equally grim for large tech outfits. The EU General Data Protection Regulation (GDPR), which came into force on May 2018, imposes compliance burdens on any company handling user data. In the US, California has signed its own version of the law – the Consumer Privacy Act – which will go into effect in January 2020. These laws give consumers the right to know what information companies are collecting about them and what companies that data is being shared with. They also allow consumers to ask technology companies to delete their data or not to sell it. While tech companies are likely to fight the new California law, and the US court system is a source of uncertainty, we believe the writing is on the wall. The EU is by some measures the largest consumer market on the planet. California is certainly the largest US market of the states. It is unlikely that the momentum behind consumer protection will change, especially with the EU and California taking the lead. The odds of a federal privacy law, following in the footsteps of the Consumer Privacy Act, are also rising. Investment Implication #5: Shun Interactive Media & Services Stocks These risks introduce a severe overhang for FAANG stocks. We are especially worried for the S&P interactive media & services index that includes GOOGL and FB. Tack on the threat of federal regulation and this represents another major headwind for profits and net profit margins that are extremely elevated for these near monopolies. Given that advertising revenue is crucial to the business model of social media companies (GOOGL and FB included), a significant uptick in privacy regulation will likely hurt their bottom line. With regard to profit margins, tech stocks in general command a profit margin twice as high as the SPX. Specifically, FB and GOOGL enjoy margins that are 500 basis points higher than the broad tech sector (Chart 8)! This is unsustainable and will likely serve as easy prey for policymakers. Our view does not necessarily call for breaking up these monopolies. The US will have to weigh the economic consequences of anti-trust policy in a context of multipolarity in which China’s national tech champions are emerging to compete with American companies for global market share. Nevertheless increased regulation is inevitable and some forced sales of crown jewel assets may take place. Moreover, the threat of a breakup will lurk in the background, creating uncertainty until key legislative and judicial battles have already been fought. That will take years. Finally, we doubt the tech sector will be left alone to “self-regulate” its incumbents and negotiate a price on consumers’ privacy. More likely, a new privacy law will loom overhead, serving as a negative catalyst for profit growth. Uncertainty will weigh on the S&P interactive media & services relative performance. Chart 8Regulation Will Squeeze Tech Margins
Regulation Will Squeeze Tech Margins
Regulation Will Squeeze Tech Margins
The ticker symbols to short/underweight the S&P interactive media & services index are an equally weighted basket of GOOGL and FB (they command a 98% market cap weight in the index). Theme #3: SaaS, Artificial Intelligence, Augmented Reality And Autonomous Driving Are Not Fads The third big theme that will even outlive the upcoming decade is the proliferation of software as a service (SaaS). The move to cloud computing and SaaS, the wider adoption of artificial intelligence, machine learning, autonomous driving and augmented reality are not fads, but enjoy a secular growth profile. In the grander scheme of things today’s world is surrounded by software. Millions of lines of code go even into gasoline powered automobiles, let alone electric vehicles. Autonomous driving is synonymous with software, the Internet of Things (IoT) needs software, the space race depends on software, modern manufacturing and software are closely intertwined, phone calls for quite some time have been a software solution, and the list goes on and on. This tidal effect is hard to reverse and is already embedded in workflows across industries. Opportunities to penetrate health care and financial services more deeply remain unexplored and it is difficult to envision another competing industry unseating “king software”. These secular trends are not only productivity enhancing, but will also most likely prove recession-proof. When growth is scarce investors flock to any source of growth they can come by and we are foreseeing that when the next recession arrives, investors will likely seek shelter in pure play SaaS firms. Investment Implication #6: Software Is Eating The World Buying software stocks for the long haul seems like a bulletproof investment idea. But the recent stellar performance of software stocks that has moved valuations to overshoot territory. Our recommended strategy is to buy or add software stock exposure on any weakness with a 10-year investment time horizon. All of these secular trends have pushed capital outlays on software into a structural uptrend. Software related capex is not only garnering a larger slice of the tech spending budgets but also of the overall capex pie. If it were not for software capex, the contraction in non-residential investment in recent quarters would have been more severe (Chart 9). Private sector software capex is near all-time highs as a share of total outlays. Government investment in software is also reaccelerating at the fastest pace since the tech bubble. When productivity gains are anemic, both the business and government sectors resort to software upgrades in order to boost productivity. Cyber security is another more recent source of software related demand as governments around the globe are taking such risks extremely seriously (bottom panel, Chart 9). Given this upbeat demand backdrop and ongoing equity retirement, software stocks are primed to grow into their pricey valuations. Chart 9Software Is Eating The World
Software Is Eating The World
Software Is Eating The World
Finally, this long-term trade will also serve as a hedge to the short/underweight position we recommend in the S&P interactive media & services index. The closest ETF ticker symbol resembling the S&P software index is IGV:US. Theme #4: Millennials Already Are The Largest Cohort And Will Dominate Spending The fourth long-term theme we anticipate will gain traction in the 2020s is the demographic rise of the Millennial generation. Much has been made of preparing for the arrival of the Millennial generation, accompanied by well-worn stereotypes of general "failure to launch" as they reach adulthood. However, "arrival" is a misnomer as this age cohort is already the largest and "failure" is simply untrue. According to the U.S. Census Bureau, Millennials are the US’s largest living generation. Millennials (or Echo Boomers) defined as people aged 18 to 37 (born 1982 to 2000), now number more than 80mn and represent more than one quarter of the US’s population. Baby Boomers (born 1946 to 1964) number about 75mn. Stealthily becoming the largest age group in the US over the last few years, Millennials per-year-birth-rate peaked at 4.3mn in 1990. Surprisingly, the pace matched that of the post-war Baby Boom peak-per-year-birth-rate in 1957 - the per-year average over the period was higher for the Baby Boomers (Chart 10). Chart 10Millennials Are The Largest Cohort
Millennials Are The Largest Cohort
Millennials Are The Largest Cohort
This gap is now set to grow rapidly as the death rate of Baby Boomers accelerates. What is more, the largest one-year age cohort is only 25 years old, thus, Millennials will be the dominant generation for many years. It is unclear how these “kids” will impact the market as they become the most important consumers, borrowers and investors, but make no mistake: this is a seismic shift in economic power and it is here to stay. The Echo Boom is a big, generational demographic wave. A difficult and painful delay has not tempered its looming importance. Finally, this wave of echo-boomers is educated, relatively unburdened by debt (please see BOX in the June 11, 2018 Special Report on demystifying the student debt load as it pertains to Millennials), and as they inevitably “grow up”, form new households and have kids. They will borrow, spend, earn, but not necessarily save and invest to the same extent as the Boomers. And this will be an important long-term theme going forward. Near term we might already be seeing signs of their arrival and firms have begun to pivot accordingly. Investment Implication #7: Buy The BCA Millennials Equity Basket Millennials will boost consumption spending in a number of different ways. The relatively unburdened Millennial cohort will be entering prime home acquisition age soon and this should underpin the long-term prospects of the US housing market and derivative industries. Further, Millennials consume differently from their parents; social media, online shopping and smart phones are not the consumption categories of the Baby Boomers. With this in mind, we have created a basket of ten stocks that we think will be driven over the long term by the demographic rise of the Millennial. We note that these stocks are heavily weighted to the technology and consumer discretionary sectors, which is logical as Millennial consumption habits tend to be discretionary focused and technology-based. Beginning with consumer discretionary, we are highlighting AMZN, NFLX and SPOT as core holdings in our Millennials basket. AMZN’s heft dwarfs consumer discretionary indexes but it could fall in several categories; the acquisition of Whole Foods makes it a Millennials-focused consumer staples retailer and its cloud computing web services segment is a tech leader. NFLX and SPOT represent the means by which Millennials consume media, by streaming movies and music over the internet. The idea of owning physical media is rapidly becoming an anachronism. The home ownership themes noted in the report above lead us to add HD and LEN to the basket. Millennials are “doers” and are set to be the dominant DIYers in the next few years, making HD a logical choice. LEN, as the nation’s largest home builder, should benefit from the Millennials coming of age into home buyers. We are also adding TSLA to our basket as a lone clean tech-oriented equity. TSLA capitalizes on the increasing shift to clean energy of Millennials (the key reason why no traditional energy companies have a spot in our basket). The technology stocks in our Millennials basket are AAPL, UBER (which replaces FB as of today) and MSFT, together representing more than 9% of the total value of the S&P 500. AAPL’s inclusion in the list is predictable as the leading domestic purveyor of devices on which Millennials consume media content. FB is a predictable holding, with more than half of all Americans being monthly active users, dominated by the Millennial cohort. It has served our basket well since inception, but today we are compelled to remove it and replace it with UBER. UBER is a Millennial favorite and the epitome of the sharing economy. In reality UBER is a logistics company and while it is losing money it is eerily reminiscent of AMZN in its early days. Maybe UBER will dominate all means of transportation and its ease of use will propel it to a mega cap in the coming decade. Our inclusion of MSFT is based on its leadership in cloud computing, a rapidly growing industry. We expect the connectivity and mobile computing demands of Millennials will accelerate. The last stock we are adding to our basket is also the only financial services equity. Though avid consumers, Millennials have shown an aversion to cash, preferring card payment systems, including both debit and credit-based. Accordingly, we are adding the leader in both of these, V, to our Millennials basket (Chart 11). Chart 11Buy BCA’s Millennial Equity Basket
Buy BCA’s Millennial Equity Basket
Buy BCA’s Millennial Equity Basket
Investors seeking long term exposure to stocks lifted by the supremacy of the Millennial generation should own our Millennial basket (AAPL, AMZN, UBER, HD, LEN, MSFT, NFLX, SPOT, TSLA, V). We would not hesitate to add other sharing economy stocks, including Airbnb, to this basket should they become investable in the near future. Theme #5: ESG Becomes Mainstream Investors are increasingly looking at allocating assets based on environmental, social, and governance (ESG) considerations, and this mini-theme has the potential to become a big trend in the 2020s. There are a number of factors that underpin ESG investing. First, Millennials are climate conscious and given that they already are the largest cohort in the US they will not only dominate spending, but also influence election results. Moreover, via social media Millennials can sway public opinion and participate in the ESG conversation. Second, ECB President Christine Lagarde recent speech to the Economic and Monetary Affairs Committee of the European Parliament is a must read.1 If the ECB were to explicitly focus on climate change policy as part of its monetary policy operations then this is a game changer. Green investment financing including “green bonds” could become mainstream. Keep in mind the as reported in the FT “the European Parliament has declared a climate emergency; the new European Commission (EC) has taken office on a promise of an imminent “green new deal”, and Commission president Ursula von der Leyen has vowed to accelerate emissions cuts.” Last Wednesday, the EC released “The European Green Deal” with a pretty aggressive time table. The EC president said “The green deal is Europe’s man on the moon moment” and presented 50 policies slated to get rolled by 2022 to meet revamped climate goals. The implication is that once ESG takes center stage at a number of these institutions it will be easier to become mainstream and propagate the world over. Third, large institutional investors are starting to adopt an ESG mindset, especially pension plans. These investors with trillions of dollars at their disposal can not only disfavor fossil fuel investment, but also undertake investments in “green projects” via private and public equity markets. Banks are also moving in the “greening of finance” direction and given that they are the pipelines of the global plumbing system, swift adoption will go a long way in taking ESG mainstream. Finally, the electric vehicle (EV) proliferation is another key driver on how the ESG theme will play out in the 2020s. As a reminder, in the US 50% of all energy consumption is gasoline related linked to automobiles. While battery technology still has limitations, EV is no longer a fad as the German and Japanese automakers are starting to make inroads on TSLA. These car manufacturers do not want to be left out, especially if this shift toward EV becomes mainstream in the 2020s. The Chinese are not far behind on the EV manufacturing front, however government policy can really become a game changer. If a number of countries and/or California mandate a large share of all new vehicles sold be EV, then the investment implications will be massive. Investment Implication #8: Avoid Fossil Fuels, Gambling, Alcohol And Tobacco… While there are a few ESG related ETFs, we would rather explore this theme’s investment implications of sectors to avoid in the coming decade. We are believers that ESG criteria will continue to gain in importance in institutional investment management decisions. Accordingly, we would tend to avoid ‘sin stocks’, including gambling, tobacco and alcohol; demand for their services is unlikely to decline but investment weightings should mean that share prices will underperform. Further, we think a clean energy shift will mean energy stocks will likely continue to be long-term underperformers (Chart 12). Chart 12Areas To Avoid As ESG Becomes Mainstream
Areas To Avoid As ESG Becomes Mainstream
Areas To Avoid As ESG Becomes Mainstream
Final Thoughts On The US Dollar In this report, we tried to focus on the upcoming decade’s big themes that we deem will play out, and centered recommendations on US equities/sectors. We do not want to neglect some macroeconomic variables that tend to mean revert over time. Specifically, the US dollar, interest rates and most importantly US indebtedness, will also be key drivers of investment theses in the 2020s. Currently, debt is rising faster than nominal GDP growth with the government and non-financial business debt-to-GDP profiles on an unsustainable path (second panel, Chart 13). Granted, the saving grace has been generationally low interest rates as the debt service ratios have fallen (top panel, Chart 13). However, if the four decade bull market in Treasury bonds is over, or may end definitively with the next US recession sometime in the early 2020s, then rising interest rates are the only mechanism to concentrate CEOs’ and politicians’ minds. On the dollar front, Chart 14 highlights the ebbs and flows of the trade-weighted US dollar since it floated in the early-1970s. The DXY index has moved in six-to-ten year bull and bear markets. The most recent trough was during the depths of the Great Recession, while the (tentative?) peak was in late-2016. If history repeats, eventually the dollar will mean revert lower in the 2020s, especially given the fiscal profligacy of the current administration that may continue into 2024, assuming President Trump gets re-elected next November. Chart 13Unsustainable Debt Profiles
Unsustainable Debt Profiles
Unsustainable Debt Profiles
Chart 14Greenback’s Historical Ebbs And Flows
Greenback’s Historical Ebbs And Flows
Greenback’s Historical Ebbs And Flows
The US dollar remains the reserve currency of the world today, but that exorbitant privilege is clearly fraying on the edges as the balance-of-payments dynamics are heading in the wrong direction. Over the next five years, the US Congressional Budget Office (CBO) estimates that the US budget deficit will swell to 4.8% of GDP. Assuming the current account deficit widens a bit then stabilizes (usually happens when global growth improves), this will pin the twin deficits at 8% of GDP. This assumes no recession, which would have the potential to swell the deficit even further. The US saw its twin deficits swell to almost 13% of GDP following the financial crisis, but the difference then was that in the wake of the commodity boom the dollar was cheap (and commodity currencies overvalued). The subsequent shale revolution also greatly cushioned the US trade deficit. Shale productivity remains robust and US output will continue to rise, but the low-hanging fruit has already been plucked. Another dollar-negative force is its expensiveness. By rising 35% since its trough, the USD has sapped the competitiveness of the US manufacturing sector, which is accentuating the American trade deficit outside of the commodity sector. If the ESG trend ends up hurting oil prices, the US current account will follow the widening deficit in manufactured products. Moreover, the US is lagging Europe on the green revolution. Either the US will have to import green technologies, or the US government will have to provide more subsidies to the private sector. Either way, both of these dynamics will hurt the US current account deficit further. Historically, the currency market is the main vehicle to correct such imbalances. Chart 15Twin Deficits Will Weigh On The US Dollar
Twin Deficits Will Weigh On The US Dollar
Twin Deficits Will Weigh On The US Dollar
The apex of globalization will also hurt the greenback. In a world where all the markets are integrated, borrowers in EM nations often use the reserve currency to issue liabilities at a lower cost. This boosts the demand by EM central banks for US dollar reserves to protect domestic banking systems funded in USD. Moreover, some countries like China implement pegs (both official and unofficial) to the US dollar in order to maintain their competitiveness and export their production surpluses to the US. To do so they buy US assets. If the global economy becomes more fragmented and the Sino-US relationship continues to deteriorate structurally as we expect, then these sources of demand for the dollar will recede. Overlay the widening US current account deficit, and you have the perfect recipe for a depreciating trade-weighted US dollar. Finally, the US is likely to experience more inflation than the rest of the world following the next recession. The US economy has a smaller capital stock as a share of GDP than Europe or Japan, and American demographics are much more robust. This means that the neutral rate of interest is higher in the US than in other advanced economies. As a result, the Fed will have an easier time generating inflation by cutting real rates than both the ECB and the BoJ. Higher inflation will ultimately erode the purchasing power of the dollar and prove to be a structurally negative force for the USD. Anastasios Avgeriou US Equity Strategist anastasios@bcaresearch.com Matt Gertken Geopolitical Strategist mattg@bcaresearch.com Marko Papic Chief Strategist, Clocktower Group marko@clocktowergroup.com Chester Ntonifor Foreign Exchange Strategist chestern@bcaresearch.com Mathieu Savary The Bank Credit Analyst mathieu@bcaresearch.com References Please click on the links below to view reports: Peak Margins - October 7, 2019 The Polybius Solution - July 5, 2019 War! What Is It Good For? Global Defense Stocks! - October 31, 2018 The Dollar: Will The U.S. Invoke A "Nuclear" Option? - August 30, 2018 Is The Stock Rally Long In The FAANG? - August 1, 2018 Millennials Are Not Coming Of Age; They Are Already Here - June 11, 2018 Brothers In Arms - October 31, 2016 The End Of The Anglo-Saxon Economy? - April 13, 2016 Apex of Globalization - November 12, 2014 Footnotes 1 https://www.imf.org/en/News/Articles/2019/09/04/sp090419-Opening-Statement-by-Christine-Lagarde-to-ECON-Committee-of-European-Parliament
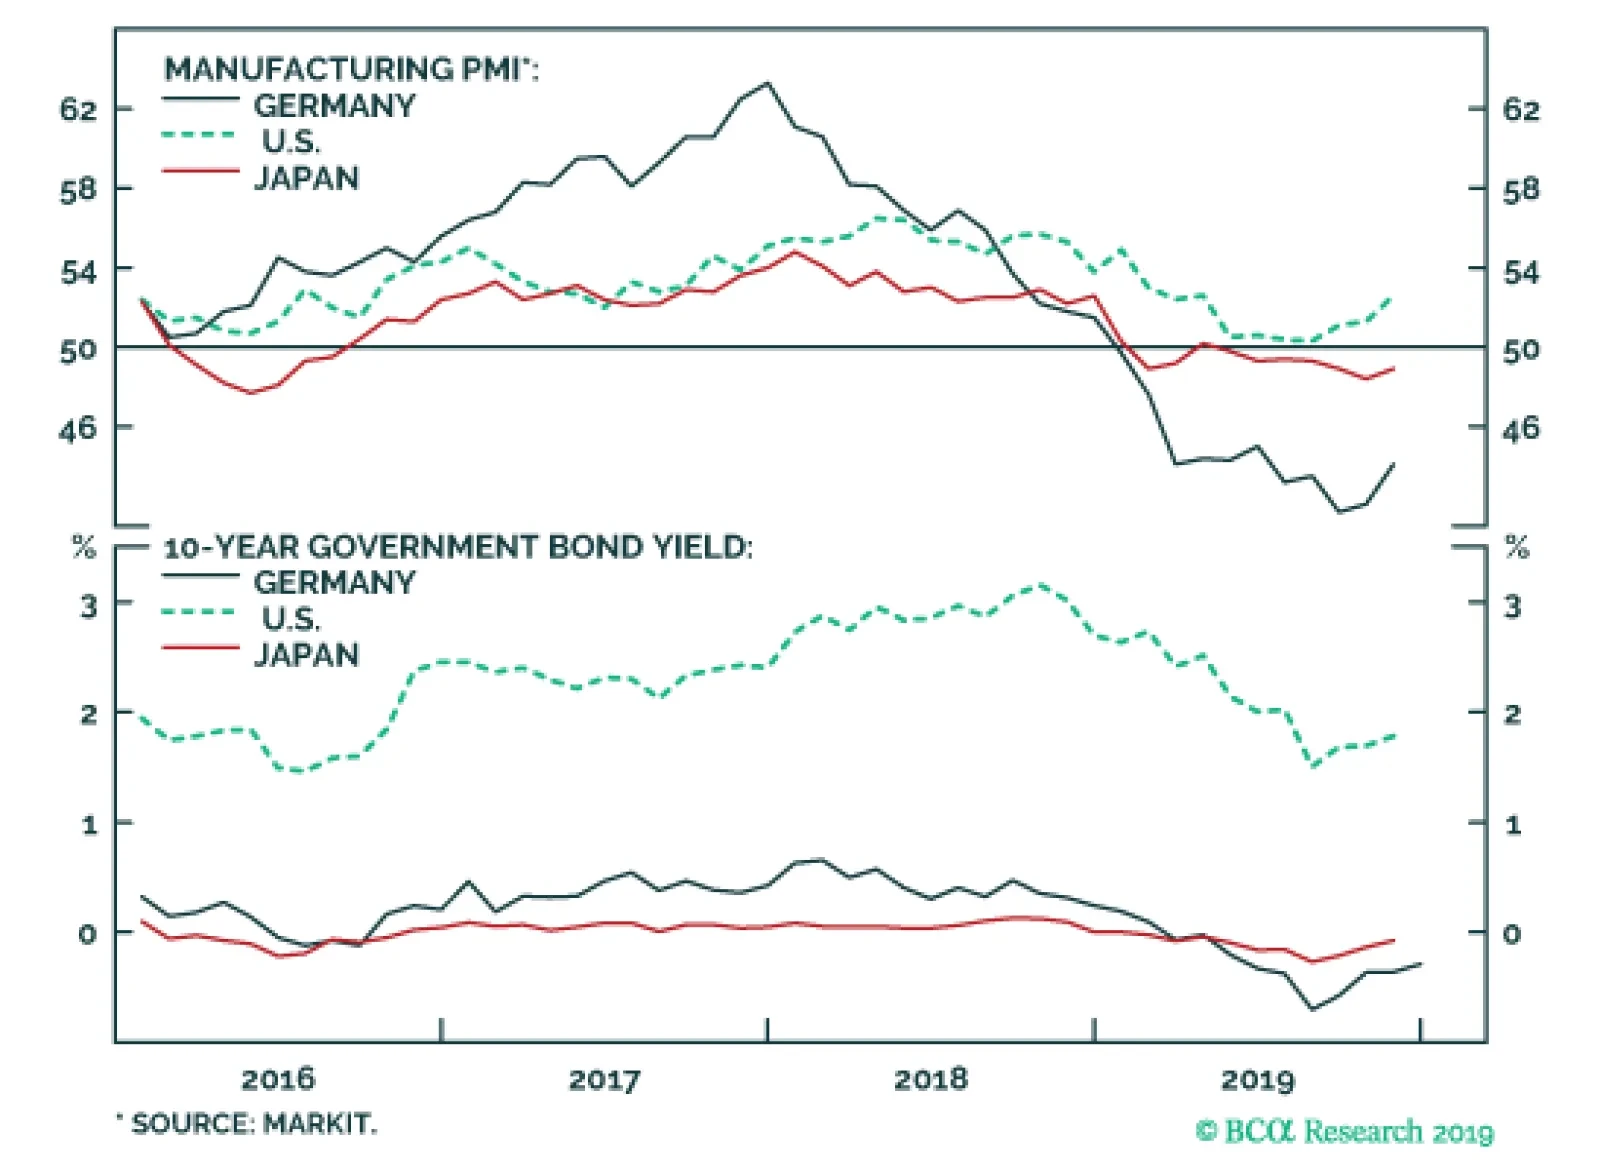
Next week, we will focus on the following key items: The December Flash PMIs for the US, Europe and Japan on Monday. This is the first read on the global manufacturing cycles. The manufacturing PMIs have bottomed but remain at low levels. Investors will…