Global

Highlights The near-term is fraught with risk for US equities and global risk assets. Investors concerned over uncertainty, a slow recovery, and economic aftershocks must also guard against geopolitics. COVID-19 is not a victory for dictatorship over democracies. Democracies face voters and will ultimately improve government effectiveness. President Trump is likely to lose the US election. As this becomes increasingly likely, his policy will turn more aggressive, increasing geopolitical risks – particularly in US-China relations. Stay short CNY-USD. Stay long defense stocks. Feature Chart 1Another Downdraft Is Likely
Geopolitics Is The Next Shoe To Drop
Geopolitics Is The Next Shoe To Drop
US equity prices have risen 26% since their March 23 low point, but our review of systemic global crises suggests that a re-test of the bottom would not be surprising (Chart 1). A range of mitigating health policies – plus still-growing policy stimulus – will most likely prevent a depression. But a longer than expected economic trough, due to some persistent level of social distancing pre-vaccine, and negative second-order effects, such as emerging market crises, could trigger another wave of selling. Moreover we expect another shoe to drop: geopolitics. A Light At The End Of The Tunnel Governments are starting to get a handle on the COVID-19 pandemic. The number of daily new cases in the European Union, which is most clearly correlated with global equities, has subsided (Chart 2). Chart 2Any Setbacks Will Hit Equity Market Hard
Any Setbacks Will Hit Equity Market Hard
Any Setbacks Will Hit Equity Market Hard
The US is also seeing new cases crest. To be safe one should count on a subsidiary spike that could easily set back US equities after a notable stock market rally (Chart 2, second panel). But Europe has shown that social distancing works, which US investors will recognize. Italy’s Prime Minister Giuseppe Conte is expected to begin the gradual loosening of social controls to restart the economy. Since Italy is the hardest hit of the western nations (second only to Spain), its leaders will not relax lockdown measures unless they are sure they can do so safely (Chart 2, bottom panel). Still, if governments loosen controls too soon, they may have to tighten them again. Uncertainty will therefore persist regarding the pace of economic normalization, which is bound to be slow due to the fact that discretionary spending will remain suppressed, as it is today in China, and the special precautions that at-risk populations like the elderly will have to take. Economic stimulus measures are still growing in size. Japan’s stimulus, which we count at 16% of GDP, is smaller than the headline 20% but still very large. We have long argued that Japan was on the forefront of the move toward debt monetization among developed markets, but COVID-19 has accelerated the paradigm shift. The United Kingdom has now explicitly stated that the Bank of England will directly finance government debt. The Spanish government is proposing Universal Basic Income (UBI), which it hopes to make permanent, rather than merely for the duration of the pandemic. The jury is still out on whether the weak Pedro Sanchez government will be able to pass it but the current is in favor of “whatever it takes.” Italy’s Five Star Movement has long advocated universal basic income and is part of a ruling coalition that has received a wave of popular support to combat the crisis. At present only a more limited “income of emergency” is being legislated, in keeping with the more centrist Democratic Party, a coalition partner. But Italy’s devastation creates the impetus for bolder moves, either by this government or a subsequent government in 2021 or after. The European institutions are backstopping these states, at least for now, so any deeper disagreements about climbing down from stimulus will have to wait until the coming years. The EU itself is likely to announce additional fiscal measures, via the European Stability Mechanism, whose austerity requirements will be waived, and the European Investment Bank. We can see a token agreement on “coronabonds” (joint debt issuance by the Euro Area), but investors should not fixate on the eurobond debate. These would require a new mechanism, which is inexpedient, whereas the existing mechanisms are already sufficient to bankroll the huge deficit spending plans that the member states are already rolling out. The United States is negotiating an additional “phase four” package that could range between $500 billion and $2 trillion, meaning anywhere from 2.5% to 10% of GDP in new measures (Chart 3). Our estimate would err on the high side because it will largely consist of the same key elements as the “phase three” $2.3 trillion package: unemployment benefits and cash to households, plus a larger dollop for local governments than in the last package. Chart 3Fiscal Tsunami Is Still Building
Geopolitics Is The Next Shoe To Drop
Geopolitics Is The Next Shoe To Drop
Congress is scheduled to return to vote the week of April 20, but an early return is entirely possible if the pandemic worsens. If the infection curve is flattening, then Republican Senators may hold out longer in negotiations. Squabbling would cause temporary agitation in equity markets. The Democrats and the Republicans still have a mutual interest in spending profusely: the Republicans to try to salvage their seats through economic improvement by November; the Democrats to prove their election proposition that a larger role for government is necessary. Finally, China is preparing to announce more stimulus. So far Chinese measures amount to only 3% of GDP but this is insufficient given the weakness in China’s economic rebound thus far. The expansion in quasi-fiscal spending (government-controlled credit expansion) is an open question, but we would guesstimate a minimum of 3% of GDP. Dramatic measures should be expected because China is undergoing the first recessionary environment since the Cultural Revolution and President Xi Jinping risks a monumental economic destabilization if he hesitates to shore up aggregate demand, which would ultimately threaten single-party rule. We see little chance of him making this mistake. The problem is that animal spirits and external demand will remain weak regardless, an occasion for disappointments among bullish equity investors. Moreover US-China geopolitical risks are rising again, as discussed below. Our updated list of fiscal measures for 25 countries can be found in the Appendix. Bottom Line: The pandemic is peaking in the US and EU, while more stimulus is coming. This is positive for equity investors with a 12-month time frame but the near-term remains vulnerable to another selloff. Democracies Are Not Less Effective Than Dictatorships The pandemic has given rise to wildly misleading narratives in the financial community and mainstream media about the political ramifications for different nations. Getting these narratives right is important for one’s investment strategy. The most popular is that China “won” – is expanding its global influence – while the United States “lost” – is failing at global leadership. More broadly the authoritarian eastern model is said to be triumphing over the western democratic model. The real distinction among states is whether they were familiar with pandemics emanating from China, the unreliability of China’s transparency and communications, and the need to track and trace infections from the beginning. Thus South Korea, Taiwan, Singapore, Vietnam, and Japan have all had relatively benign experiences and all but Vietnam are democracies, with varying degrees of representation and contestation. Nor is COVID-19 an “eastern” versus “western” thing. Germany did an effective job testing, tracking, and tracing infections as well. Germans are relatively law-abiding and trust Chancellor Angela Merkel and the state governments to “do the right thing.” Canada, with its experience of SARS, has also reacted effectively. Denmark, Austria, and the Czech Republic are already tentatively reopening their economies. Yet the number of new confirmed cases per million people shows that Germany is not wildly different from the US and Italy (Chart 4). The truth is that Italy’s bad fortune alerted the US and G7 states to take the threat more seriously – the US has had good outcomes in Washington State but bad outcomes in highly populated New York. Nor is it true that the American health care system is uniquely terrible in treating patients, as is so widely claimed. US deaths per million are worse than Germany but better than Italy (Chart 5) – and Italy’s health system is also not to blame. Failure of ruling parties to spring into decisive action is the main differentiator. Chart 4US In Line With Italy In New Cases …
Geopolitics Is The Next Shoe To Drop
Geopolitics Is The Next Shoe To Drop
Chart 5… But Better In Limiting Deaths
Geopolitics Is The Next Shoe To Drop
Geopolitics Is The Next Shoe To Drop
Chart 6Dictatorships Good At Halting Freedoms
Geopolitics Is The Next Shoe To Drop
Geopolitics Is The Next Shoe To Drop
Dictatorships have had fewer cases and deaths, if their statistics can be trusted – which is a big if.1 This does not suggest that their governance model is better, but rather that they are better at halting freedoms, such as free movement (Chart 6). North Korea has zero cases of COVID-19. People were already under lockdown. Variation within the dictatorships stems from their policy responses and experience fighting pandemics. China, the origin of several recent outbreaks, has extensive experience. It also has a functional health system, fiscal resources, and a heavily centralized power structure. Iran, however, has less experience and capability. The question now is Russia, which was slow to react and has a growing outbreak, yet has a heavily centralized power structure to flatten the curve. Incidentally domestic risk is an important reason for Russia to cooperate with OPEC on oil production cuts, as we have argued. These points can be demonstrated by comparing COVID-19 deaths per million to each nation’s health capabilities and underlying vulnerability to the disease. Note that our intention is to highlight the role of policy in outcomes, not to attempt a full explanation of an epidemiological phenomenon. In Chart 7A, we judge health capacity by health spending per head and life expectancy at the age of 60. Nations that spend a lot per person, and whose people live longer, have better health systems. Yet many of these states are seeing the highest number of deaths because they are European and Europe was the epicenter of the outbreak. Chart 7ARich, Healthy Countries Got Hit Hardest Because Unprepared
Geopolitics Is The Next Shoe To Drop
Geopolitics Is The Next Shoe To Drop
The US ranks right along with Germany and Sweden.2 Policy responses – early testing, tracking, and tracing – explain why South Korea has far fewer deaths than Italy and Spain on a population-weighted basis. However, the underlying conditions still matter, as the US’s health system, travel bans, and distance from the crisis produced better outcomes than its other policy responses would have implied. These data will be more accurate once the infection curve has flattened across the world. The situation is changing rapidly. If the US rises up in deaths per capita, it will be because of its slow responses, or subsequent policies. The same goes for emerging market economies that are ranking low in deaths but either have not seen the full effect of the pandemic, or had more time to adjust policy due to the crisis in Europe. Emerging market economies have lower health capacity, but also younger and hence healthier populations. The older the society, and the higher proportion of severe illnesses like heart and lung disease, the more susceptible to COVID-19 deaths, as Chart 7B shows. But yet again, the policy response still proves decisive. China has more deaths than some countries that are more vulnerable, because it got hit first. If Brazil and Turkey rise higher and higher above China in deaths, as is likely, it is because of policy failure, not basic vulnerability. Chart 7BEurope And US: Vulnerable Populations, Governments Slow To React
Geopolitics Is The Next Shoe To Drop
Geopolitics Is The Next Shoe To Drop
Russia stands out as especially vulnerable in this Chart 7B. Here is where authoritarian measures may pay off, as with China, but only in the short term – since Russia will still be left with an elderly population highly prone to severe illness and a creaking health system. As mentioned above, the risk to Russian stability is a factor pushing for geopolitical cooperation in oil market cartel behavior to push prices up and improve the fiscal outlook to enable better domestic stability management. Bottom Line: Government policy, particularly preparedness and rapid action, have been the decisive factors in containing COVID-19, not dictatorial or democratic government types. The richest countries have the most freedoms and the most vulnerable elderly demographics. Within the rich countries, southern Europe reacted slowly and got hit hardest, with some exceptions. The US’s incompetence has been overrated, based on deaths, probably because of President Trump’s general unpopularity. These results are preliminary but they suggest that the US and EU will experience political change to address their lack of rapid action. Non-democracies will still have to deal with the recession and the consequences on social stability. Democracies Face Voter Blowback Democracies will face the wrath of voters once the immediate crisis dies down. The crisis has driven people to rally around the flag, creating polling bounces for national leaders and ruling parties. In some cases the trough-to-peak increase in popular support is remarkable – President Trump's approval reached 10 percentage points briefly, and he rose over 50% approval in some polls for the first time in his presidency (Chart 8A). Yet these initial bounces are already subsiding, as in Trump’s case (Chart 8B). Chart 8ADemocracies Are Accountable To Voters
Geopolitics Is The Next Shoe To Drop
Geopolitics Is The Next Shoe To Drop
Chart 8BAnd Polling Bounces Are Fading
Geopolitics Is The Next Shoe To Drop
Geopolitics Is The Next Shoe To Drop
By this measure, the US, Italy, France, and Spain all face serious political reckonings going forward. Trump is the first in the firing line. Our quantitative election model relies on state-level leading economic indicators that are lagging and show him still winning with 273 Electoral College votes (Chart 9A). However, if we introduce a 2008-magnitude economic shock to these indexes, the Democrats flip Michigan, Wisconsin, Pennsylvania, and New Hampshire, yielding 334 Electoral College votes for former Vice President Joe Biden (Chart 9B). This is assuming Trump’s approval rating stays the same, which, at 46%, is strong relative to the whole term in office. Chart 9AOur Quant Election Model Will Turn Against Trump When Data Catches Up
Geopolitics Is The Next Shoe To Drop
Geopolitics Is The Next Shoe To Drop
Chart 9BA 2008-Style Shock To States Gives Democrats The White House
Geopolitics Is The Next Shoe To Drop
Geopolitics Is The Next Shoe To Drop
Our qualitative judgement reinforces our election model. Historically, US elections are referendums on the ruling party. An incumbent president helps the party win reelection. But a recession is usually insurmountable. George Bush Sr lost in 1992 despite a shallow recession that ended the year before. While Joe Biden is a flawed candidate in numerous ways, the question voters face in November is whether they are better off than they were four years ago. With thousands of deaths and an unemployment rate at or above 20%, it is hard to see swing state voters answering “yes.” Not impossible, but we subjectively put the odds at 35%, and that could easily be revised downward if Trump’s polling falls back down to the 42% range. Trump will also be responsible for the handling of the pandemic itself. His administration obviously made several policy mistakes. A paper trail will highlight intelligence warnings as early as November, and warnings from his inner circle as early as January, that will hurt him.3 Objectively, the Republican Party’s greatest policy flaw, prior to COVID-19, was health care – and this will connect with COVID-19 even if the Affordable Care Act (Obamacare) has little to do with crisis response. Bottom Line: The first and most important political casualty of the pandemic will be Trump’s presidency. Not because the US is uniquely incompetent in the face of the pandemic – although it obviously could have done better, judging by several of the other democracies – but because this year happens to be an election year and democracies hold governments accountable. Major Risk Of Clash With China Chart 10China Likely To Depreciate The Renminbi
China Likely To Depreciate The Renminbi
China Likely To Depreciate The Renminbi
There are two downside geopolitical risks that follow directly from the above. First, while the Democratic candidate Joe Biden is a “centrist,” his position will move to the left of the political spectrum. This is to energize the progressive faction of the party – which is already energized. The market will be taken aback if Biden produces major leftward shifts, in the direction of Senator Bernie Sanders, on taxes, regulation, health care, pharmaceuticals, banks, energy, or tech. This is not a problem when the market is down 36%, but as the market rallies, it becomes more relevant. While US taxes and regulation will go up, Biden will still have to win over the Midwestern Rust Belt voter through trade protectionism, a la Trump and Bernie. This will be exacerbated by the pandemic, which has supercharged American popular enmity toward China and fear of supply chain vulnerability toward China. When Biden reveals that he is protectionist too, US equities will react negatively. Second, more immediately, the clash with China may happen much sooner. As President Trump comes to realize he is losing his grip on power, he will have an incentive to retaliate against China for its mishandling of the pandemic, shift the blame, and achieve long-term strategic objectives as well. This makes Trump’s approval rating a critical indicator – not only of his reelection odds, but of whether he determines he has lost and therefore adopts more belligerent foreign or trade policy. We view the danger zone as anything less than 43%. If Trump becomes a lame duck, he could target China, or other countries, such as Venezuela. The advantage of the latter is that it could have the desired political effect without threatening the economic restart. A conflict with Iran would have bigger consequences – particularly negative for Europe. But in the COVID-19 context, Venezuela and Iran are not relevant to American voters. A conflict with North Korea, however, is part of the strategic conflict with China and would be hard to keep separate from broader tensions. This is only likely if Kim Jong Un stages a major provocation. At present, Washington and Beijing are keeping a lid on tensions. Presidents Trump and Xi are in communication. Beijing has rebuked the foreign minister who accused the US military of bringing COVID-19 to Wuhan. Trump has stopped using inflammatory rhetoric about the “Chinese virus.” China is not depreciating the renminbi, it is upholding other aspects of the trade deal, and it is sending face masks and ventilators to assist the US with the health crisis. But this could change. With its economy under extreme pressure, Beijing must take greater moves to stimulate. An obvious victim will be the renminbi, which is arguably stronger than it should be, especially if China cuts interest rates further, no doubt in great part because of the “phase one” trade deal with the United States (Chart 10). If and when Beijing decides that it must ease the downward pressure on exports and the economy, the renminbi will slide. This will provoke Trump. If he is convinced he cannot salvage the economy anyway, then he has an incentive to channel American anger toward China into new punitive measures over currency manipulation. Finally, the ingredients for our “Taiwan black swan” scenario are falling into place. Taiwan has long attempted to gain representation in the World Health Organization but has been blocked by Beijing’s assertion of the One China principle. However, Taiwan is now caught in an escalating tussle with the WHO leadership that involves both Washington and Beijing. Taipei warned the WHO as early as December that COVID-19 could be transmitted by humans and that the pandemic risk was high.4 Both China and the WHO leadership are simultaneously under pressure from the Trump administration for failing to share information and sound the alarm to prepare other nations. Bottom Line: If President Trump decides to prosecute China for its handling of the virus, and/or promote US-Taiwan relations in a way that aggravates China, then the trigger for a major geopolitical incident will have arrived. Investment Implications It is impossible to predict the precise catalyst or timing of such a crisis. We observe that the US and China are each experiencing historic economic dislocation, their strategic relationship has broken down over the past decade, and their populations are incensed at each other over grievances relating to the trade war, COVID-19, and various disinformation campaigns. Taiwan is at the epicenter of this conflict, due to its defense relationship with the United States and renewed political tensions with China under Xi Jinping. But the Chinese tech sector, North Korea, the South and East China Seas, Xinjiang, and Iran are also potential catalysts. Geopolitics is the other shoe to drop in the wake of COVID-19. Presidents Trump and Xi Jinping are the biggest sources of geopolitical risk, as we outlined in our 2020 forecast. They are cooperating in the immediate crisis, but in the aftermath there will be recriminations. A worsening domestic situation, a loss of prestige for either leader, or a foreign policy provocation could trigger punitive measures, saber rattling, or even military incidents. Risk assets are rallying on the light at the end of the tunnel. We are reaching and in some countries passing the peak intensity of the (first wave of the) pandemic. But the economic aftermath is extremely uncertain and the political fallout has hardly begun. In the US, the implication is clearly negative for Trump. But if that implication is realized, it points to much higher geopolitical risks within 2020 than are currently being considered as the world focuses on the virus. If President Trump chooses to wag the dog with Venezuela, that is obviously a much more positive outcome for global risk assets than if he attempts to achieve American strategic objectives of curbing China’s global assertiveness. Tactically, we remain defensive and recommend defensive US equity sectors and the Japanese yen. On a 12-month and beyond time frame we are more bullish on global growth and are long gold and oil. We remain strategically short CNY-USD and short Taiwanese equities relative to Korean. Matt Gertken Vice President Geopolitical Strategist mattg@bcaresearch.com Appendix Appendix TableThe Global Fiscal Stimulus Response To COVID-19
Geopolitics Is The Next Shoe To Drop
Geopolitics Is The Next Shoe To Drop
Footnotes 1 Given that one of Iran’s top health officials has criticized China for its questionable data and lack of transparency, one does not need to trust the US Intelligence Community’s assessment that China misled the world in the early days of the outbreak. See Matthew Petti, "Even Iran Doesn't Believe China's Coronavirus Stats," April 6, 2020. 2 Readers accustomed to the apocalyptic view of the US health system may wonder that the US comes out looking very well on health capacity. This is because we combine and standardize the scores for per capita spending and longevity. However our data also show that the US is inefficient on health: its life expectancy scores are slightly lower than those of the Europeans, yet it spends more per head. 3 See Josh Margolin and James Gordon Meek, "Intelligence report warned of coronavirus crisis as early as November: Sources," ABC News, April 8, 2020, and Maggie Haberman, "Trade Adviser Warned White House in January of Risks of a Pandemic," New York Times, April 6, 2020. 4 See "Taiwan says WHO failed to act on coronavirus transmission warning," Financial Times, March 19, 2020.
Highlights A World Organization of the Petroleum Exporting Countries (WOPEC) looks set to emerge after today’s OPEC 2.0 video conference to discuss production cuts in the wake of the COVID-19 pandemic, and the market-share war between the leaders of the coalition led by the Kingdom of Saudi Arabia (KSA) and Russia. WOPEC will not be memorialized by a Declaration of Cooperation as OPEC 2.0 was. Oil exporters globally will cooperate on harmonizing policy to meet demand. In our latest scenario concentrating on likely supply responses, we show cuts of ~ 8mm b/d will be sufficient to clear the storage overhang caused by COVID-19-induced demand destruction of close to 4mm b/d this year. Based on this modeling, we see Brent prices averaging $36/bbl and $64/bbl this year and next, with WTI trading $2-$6/bbl lower, depending on US Gulf storage availability. This is roughly in line with our previous scenario (Chart of the Week).1 Demand destruction over 4mm b/d would require additional production cuts. Feature The 2020 oil price collapse brought on by COVID-19 – and super-charged by the market-share war declared by Russia following the breakdown of OPEC 2.0’s March 6 meeting – has spurred oil-producing states globally to action. Chart of the WeekExpect A Sharp Oil Price Recovery
Expect A Sharp Oil Price Recovery
Expect A Sharp Oil Price Recovery
Chart 2The Oil-Price Collapse Of 2020
The Oil-Price Collapse Of 2020
The Oil-Price Collapse Of 2020
WOPEC is bigger than OPEC 3.0 – an unofficial grouping we hypothesized at the end of March to encompass the expected future cooperation of KSA, Russia and the Texas Railroad Commission (RRC) – our shorthand for US oil-producing interests – succeeding OPEC 2.0. Today’s OPEC 2.0 video conference originally was called by KSA for Monday, but was moved to today – presumably – to give member states time to agree production cuts. The conference most likely was delayed by the acrimonious public exchange between its leaders this past weekend.2 On the heels of the OPEC 2.0 video conference comes a hastily called video conference on Friday of G20 energy ministers to discuss energy security. The G20 is led by KSA this year.3 The 2020 oil price collapse brought on by COVID-19 – and super-charged by the market-share war declared by Russia following the breakdown of OPEC 2.0’s March 6 meeting – has spurred oil-producing states globally to action (Chart 2). KSA, Russia and their respective OPEC 2.0 allies all are fully invested in this meeting, as are producers in the US, Canada, Norway and Brazil.4 Supply Destruction Vs.Production Cuts Oil producers face a stark choice: Either cut production voluntarily to counter the global demand destruction of a pandemic, or have the market do it for them by driving prices through cash costs toward zero (i.e., $0.00/bbl), as global crude oil and product storage fills. Prices in some basins have fallen close to zero after accounting for the basis differentials to benchmark prices and transport costs (e.g., WTI-Midland), which, in the US has begun to force shut-ins (Chart 3).5 Continued weak pricing close to zero risks shutting older, high-cost landlocked production in permanently, and many states simply cannot afford to lose the critical revenue provided by oil exports. Chief among these states are the non-Gulf members of OPEC, excluding Russia, US onshore, and Canada, which we identify as “The Other Guys” (Chart 4).6 Chart 3Some Crude Grades Priced Close To $0.00/bbl
Some Crude Grades Priced Close to $0.00/bbl
Some Crude Grades Priced Close to $0.00/bbl
Chart 4"The Other Guys" Production Declines Would Moderate With OPEC 2.0 Deal
The "Other Guys" Production Declines Would Moderate With OPEC 2.0 Deal
The "Other Guys" Production Declines Would Moderate With OPEC 2.0 Deal
We expect The Other Guys in OPEC 2.0 will lose 700k b/d, with 400k b/d of that realized over the course of 2021. The chief contribution of The Other Guys to the OPEC 2.0 coalition’s production-management scheme is their managed production decline. These states were only starting to recover from the Global Financial Crisis (GFC) beginning in 2010 when the OPEC market-share war of 2014-16 was declared. The COVID-19 price collapse, coupled with the knock-on effects of the 2020 KSA-Russia market-share war likely accelerates the rate of production decline for the Other Guys, as capital continues to avoid developing their resources. We expect The Other Guys in OPEC 2.0 will lose 700k b/d, with 400k b/d of that realized over the course of 2021. Core OPEC and Russia can increase (and decrease) production, and we expect they will deliver the largest part of the OPEC 2.0 production cuts. In this week’s simulation, we project KSA will cut 2mm b/d, from their April level of from 12mm b/d; and Russia will cut 1.1mm b/d, down from 11.6mm b/d. We then project Iraq will cut 460k b/d; Kuwait 280k b/d; and the UAE 315k b/d. Outside OPEC 2.0, a lot of the production we expect will be cut is out of necessity. Canada, for example, will be forced to either shut in high-cost tar-sands production or go back to pro-rating production as it did last year, owing to a lack of storage in Alberta and pipeline takeaway capacity to move their crude south to US refiners. We expect Canada to cut 350k b/d this year, as a result. Brazil’s Petrobras already has shut in 100k b/d, and US producers have begun shutting in shale-oil production.7 US Production Cuts Some of the more efficient producers in The Great State of Texas have been calling for pro-rationing of up to 20%, which would push the cuts in Texas’s Permian and Eagle Ford shale basins alone to 1.23mm b/d. Production cuts most likely will be focused on the US, as this is the most easy-to-adjust output in the world. It also still is higher up the global cost curve, although, as we have noted earlier, this will change in the event bankruptcies pick up.8 In the US, production cuts already have begun. They are and will continue to be focused on the shales. We continue to project cuts in the US shales of ~ 1.5 mm b/d this year. However, this number could be higher: If producers respond to the collapse in prices by not sending any new rigs to the field in the next 12 months, production will fall by 2.9mm b/d from production declines alone. Just to keep production flat, the US shales will need an average of ~ 520 rigs per month (assuming no drilled-uncompleted wells are finished). The risk on our rig-count estimates are straightforward: If rig counts go much lower, we could see a large decline in shale production in the coming months (Chart 5). Chart 5US Shale Output Falls This Year And Next
The Birth Of WOPEC
The Birth Of WOPEC
Some of the more efficient producers in The Great State of Texas have been calling for pro-rationing of up to 20%, which would push the cuts in Texas’s Permian and Eagle Ford shale basins alone to 1.23mm b/d. Including the Anadarko Basin, most of which is in Oklahoma, which also permits pro-rationing, 20% pro-rationing would push TX-OK cuts to ~ 1.33mm b/d. As we have been writing over the past month, we could see a return of pro-rationing in the states of Texas and Oklahoma. In the Great State, producers have filed a petition before the Texas RRC asking the Commission to reprise its 1928-73 production-management role.9 The Texas RRC will hold a video conference Tuesday, April 14, to consider this petition. We’re expecting this petition to be granted, and for pro-rationing to begin in the near future. On the demand side, we are staying with the scenario we presented March 30, with 2Q20 demand falling ~ 12mm b/d (y/y vs. 2Q19). In 2H20, we project demand to grow at a rate of 800k b/d by 4Q20. For all of 2020, we model average demand losses equal to 3.8mm b/d. For 2021, massive fiscal and monetary stimulus globally will lift demand 5.3mm b/d. With the supply cuts projected above and our demand view, we see balances tightening over the course of the year and moving into a physical deficit in 4Q20 (Chart 6). While near-term oversupply will force inventories to grow sharply, we expect them to draw as sharply beginning by September and continuing into next year (Chart 7). Chart 6Supply-Demand Imbalance Will Tighten Into 2021
Supply-Demand Imbalance Will Tighten Into 2021
Supply-Demand Imbalance Will Tighten Into 2021
Chart 7Inventories Will Build Sharply, Then Draw Sharply in 2021
Inventories Will Build Sharply, Then Draw Sharply in 2021
Inventories Will Build Sharply, Then Draw Sharply in 2021
Investment Implications Our projections for supply presented this week and our demand scenario presented at the end of March are evolving into our base case for oil and gas. We still do not know with certainty the OPEC 2.0 coalition will agree to production cuts today, or whether the Texas RRC will return to the business of pro-rationing. If either or both of these outcomes does not materialize, markets will take over and savagely destroy supply. This will be extremely volatile. For our part, we expect OPEC 2.0, the Other Guys outside the coalition, and the US shales to deliver something that looks like voluntary cuts. This will occur via voluntary cuts, “managed” declines, and pro-rationing and shut-ins. Unlike many of our economist colleagues who argue against such jointly coordinated policies – invoking a free-market, pure-competition paradigm that has not existed for any meaningful period in the modern history of the oil market – we believe producers are intelligently pursuing their interests by jointly coordinating the boom-bust mayhem of unfettered oil markets. Similarly, we believe consumers are better served by diversified sources of energy vs. an over-reliance on large concentrated supplies who can use their low-cost endowment to monopolize supply and set up barrier to entry to competition. Given our view, we remain constructive to the oil market, expecting a rally that will look a lot like the Chart of the Week and the balances we show in Chart 7. As a result, we are getting long 2H21 Brent vs. short 2H22 Brent futures. Robert P. Ryan Chief Commodity & Energy Strategist rryan@bcaresearch.com Hugo Bélanger Associate Editor Commodity & Energy Strategy HugoB@bcaresearch.com Fernando Crupi Research Associate Commodity & Energy Strategy FernandoC@bcaresearch.com Commodities Round-Up Energy: Overweight Defying the global rush to cut oil production, Mexico apparently is moving toward increasing production. Petroleos Mexicanos (PEMEX) is looking to drill 423 wells this year, according to Bloomberg. A March 26 Journal of Petroleum Technology survey suggests capex by E&P companies will fall by up to 35% this year. Base Metals: Neutral This week Japan’s Nippon Steel became the latest producer to idle blast furnaces, halting about 15% of the company’s total capacity. More generally an iron ore surplus in other parts of Asia and in Europe is expected as steel mills idle furnaces amidst lower demand for their output. However, diminished activities in mines – severely impacted by lockdowns – will offset some of the demand loss. COVID-19 induced shutdown in South Africa, Iran, India and Canada have curtailed exports from those countries until late April. Additionally, bad weather in Brazil led iron ore exports to fall on a yoy basis for the third month in a row in March. A decline of ~ 2% vs. last year’s already depressed – following the Vale dam incident – levels. China’s anticipated infrastructure stimulus will support iron ore demand, drawing down inventories and pushing up prices, but it, too, will be tempered by the pace of the recovery in its export markets. Precious Metals: Neutral A strong US dollar remains an important risk for precious metals. The dollar rose 1.6% since March 28 despite the Fed’s actions to calm the global dollar liquidity squeeze. This signals the funding crisis has not been thoroughly controlled and that swap lines will have to be extended to additional EM central banks. However, a large share of outstanding foreign exchange swaps/forwards resides in non-bank financial corporations and institutions with limited access to dollar funding via central bank swap lines. Over the short-term, our gold price recommendation remains vulnerable to deterioration, due to uncertain liquidity conditions (Chart 8). Ags/Softs: Underweight This week we begin tracking the lumber market. Lumber consumption fell sharply as the coronavirus spread in the United States, pushing front-month futures down 44% from February highs. With housing starts already weak in February – down 1.5% month on month – and expected to be even weaker in March (Chart 9), continued lumber supply curtailments will stabilize prices in the short term and eventually push prices up once lower interest rates kick in and demand resumes. Chart 8
Global USD Squeeze Could Threaten Gold Again
Global USD Squeeze Could Threaten Gold Again
Chart 9
Lumber Hammered As COVID-19 Pounds Housing Starts
Lumber Hammered As COVID-19 Pounds Housing Starts
1 Please see OPEC 3.0 In the Offing?, published March 30, 2020, which focused on demand destruction. 2 Please see OPEC+ meeting delayed as Saudi Arabia and Russia row over oil price collapse: sources, and G20 energy ministers to hold video conference on Friday: document published by reuters.com April 4 and April 7, 2020. 3 The G20 consists of Argentina, Australia, Brazil, Canada, China, Germany, France, India, Indonesia, Italy, Japan, Mexico, the Russian Federation, Saudi Arabia, South Africa, South Korea, Turkey, the UK, the US and the EU. 4 Please see A look at the major players in this week’s “OPEC++” meeting, a Bloomberg analysis published by worldoil.com April 7, 2020. 5 Please see Can the world agree a deal to boost oil prices? Published by Wood MacKenzie April 3, 2020. 6 The Other Guys is our moniker for all producers excluding core-OPEC, US shale, Russia and Canada. Production from this group of producers has been falling as a share of global production for years, due to a lack of domestic and foreign direct investment in their energy sectors. 7 In its latest Short-Term Energy Forecast, the EIA estimates US crude oil production will fall 500k b/d this year and 700k b/d next year, driven by market forces. 8 For a discussion, please see How Long Will The Oil-Price Rout Last?, a Special Report we published with BCA Research’s Geopolitical Strategy March 9, 2020. It is available at ces.bcaresearch.com. 9 Please see Oil Prorationing in the Spotlight at Texas Railroad Commission, published by Baker Botts, a Texas law firm, on March 30, 2020. Investment Views and Themes Recommendations Strategic Recommendations Tactical Trades Trade Recommendation Performance In 2019 Q4
The Birth Of WOPEC
The Birth Of WOPEC
Commodity Prices and Plays Reference Table Trades Closed in 2020 Summary of Closed Trades
The Birth Of WOPEC
The Birth Of WOPEC
Highlights Global growth should bounce back in the third quarter, as mass COVID-19 testing allows more people to return to work. Temporary layoffs have accounted for the vast majority of the increase in unemployment so far. Ample fiscal and monetary support should prevent these layoffs from becoming permanent. The equity risk premium remains quite high, which warrants overweighting equities relative to bonds over a 12-month horizon. The near-term outlook for stocks is less flattering, given the strong rally in equities over the past two weeks and the fact that earnings estimates are likely to fall sharply once companies begin to report first quarter results. Accordingly, we recommend that investors take some chips off the table in preparation for a temporary stock market pullback. We are also shifting our near-term regional equity allocation and currency views in a somewhat more defensive direction. As Bad As It Gets? Chart 1Nosedive In High-Frequency Activity Indicators
Nosedive In High-Frequency Activity Indicators
Nosedive In High-Frequency Activity Indicators
The global economy has plunged into a deep recession. The New York Fed’s weekly economic index, which tracks a variety of high-frequency activity indicators such as same-store retail sales, consumer sentiment, fuel sales, and unemployment insurance claims, has plunged below its 2008 lows (Chart 1). Service-sector purchasing manager indices have collapsed to the weakest levels on record (Chart 2). The OECD estimates that the shutdowns have reduced the level of output by between one-fifth and one-quarter in most advanced economies (Chart 3).1 If business closures were to last three months, this would shave between 4-to-6 percentage points from annual growth in the OECD in 2020. Chart 2Service-Sector Activity Has Collapsed To Unprecedented Lows
Service-Sector Activity Has Collapsed To Unprecedented Lows
Service-Sector Activity Has Collapsed To Unprecedented Lows
Chart 3Severe Economic Consequences Resulting From World War V
Testing Times
Testing Times
At times like these, it is easy to despair about the future. Yet, there are three reasons to think that the worst of the economic damage will be over within the next few months: The measures necessary to control the virus are likely to be relaxed without this leading to a new wave of infections. Recessions following exogenous shocks, such the one we are currently experiencing, tend to produce faster recoveries than those stemming from endogenous slowdowns. Policy will remain highly supportive, mitigating possible adverse second-round effects. Quarantine Measures Are Likely To Be Relaxed In our recently published Q2 Strategy Outlook, we likened the current situation to one where a cyclist fails to apply the brakes when starting to descend a steep hill. Not only does the cyclist need to squeeze the brake levers to slow down, he needs to squeeze them harder than he would otherwise have in order to compensate for failing to squeeze them at the outset. Only once the bicycle has decelerated to a safe speed can he ease off the brakes a bit. Most countries find themselves in the position of the cyclist. Policymakers were too slow to react at the outset of the pandemic, and now have to compensate for their inaction by imposing draconian containment measures. In epidemiological language, policymakers are seeking to reduce the effective reproduction number – the average number of people a carrier of the virus will infect – from well above one to well below one. As long as the reproduction number stays below one, the number of new infections will keep falling. Once the number of new cases has declined to a level that no longer overwhelms hospitals, policymakers will be able to relax containment measures by just enough to bring the reproduction number back to one. This will create a new steady state where the number of new infections remains at a stable and manageable level. The good news is that the strategy appears to be working. The number of new cases and deaths have started to decline in both Italy and Spain, the two hardest hit European countries. In the US, while the number of new cases has yet to show a clear downward trend, there are glimmers of hope (Chart 4). For example, the net number of people admitted to New York hospitals has declined sharply since the beginning of April (Chart 5). Chart 4New Cases And Deaths: Have We Turned The Corner?
Testing Times
Testing Times
Chart 5Glimmer Of Hope Emanating From The Big Apple?
Testing Times
Testing Times
Test, Test, Test While keeping the reproduction number from rising above one will still require a variety of containment measures, the economic burden of these measures will decline over time. Using the bicycle analogy above, this is equivalent to saying that the road will become flatter the further down we go. To some extent, we will be able to relax containment measures because the virus will find it more difficult to propagate as more people are infected. However, unless it turns out that the number of asymptomatic cases is currently much greater than most estimates suggest, the benefits from this effect are likely to be small. The bigger impact will come not from making headway towards herd immunity, but from scaling up existing testing technologies to figure out who is dangerous to others and who is not. Forcing almost everyone who is not deemed to be an “essential worker” to stay at home is hardly an optimal strategy. Rather than trying to isolate most people, it would be preferable to isolate only those who are infected. The problem is that we currently do not know who those people are. That will change as testing capacity ramps up. Right now, we are in the same predicament as if there had been a major terrorist attack using an explosive device that was invisible to conventional detectors. Just like there would have been a temptation to stop all air travel until we figured out how to detect the new type of bomb, we have decided to stop most commerce because we do not know who may be carrying the virus. The good news is that the technology to test people for COVID-19 exists. Abbott Labs has already unveiled a PCR test, which detects specific genetic material within the virus, that can render a positive result in as little as five minutes and a negative one in thirteen minutes. Last Wednesday, the FDA authorized a rapid antibody blood test for COVID-19 developed by Cellex, which can determine if someone previously had the virus and has recovered. Pessimists would highlight that there is currently a severe shortage of test kits. That is true, but we should avoid the trap of linear thinking that got us into this mess to begin with. Producing more tests is an engineering problem that will be solved. As the number of tests performed begins to increase exponentially, testing will become ubiquitous. How much would mass testing help? The answer is a lot. Paul Romer has shown that a strategy of randomly testing everyone roughly once every two weeks would bring down the total number of people who contract the virus to under 20% of the population.2 In his simulation, only 5%-to-10% of the population would need to be quarantined at any given time. In the absence of mass testing, 50% of the population would need to be quarantined to yield the same result (See Appendix 1 for details). The economy can handle isolating 5%-to-10% of its population at any given time. It cannot handle isolating half its population. Just like you have to X-ray your luggage at the airport, you may end up having to take a COVID-19 test before boarding a flight. Children will be tested at school several times a week; first responders more often than that. It will be a nuisance, but the alternative of a Great Depression is much worse. And if it is any consolation, at least this is one test you won’t have to study for! Unemployment Dynamics Following Exogenous Shocks Chart 6Historically, It Has Taken Some Time For Employment To Return To Pre-Recession Levels
Historically, It Has Taken Some Time For Employment To Return To Pre-Recession Levels
Historically, It Has Taken Some Time For Employment To Return To Pre-Recession Levels
Economic life is full of asymmetries. It is easier to go bankrupt than to start a new business. It is also easier to lose a job than to find a new one. Once the links between companies and workers are severed, it can be difficult to restore them. This is partly because it is time-consuming and costly to match available workers with open positions. It is also because there are feedback loops at work: If someone is unemployed and not earning an income, they have less money to spend. If people are not spending much, there is less incentive for firms to hire new workers. In the United States, it took more than six years for the level of employment to return to its January 2008 peak. Even during the fairly mild 2001 downturn, employment did not return to pre-recession levels until February 2005 (Chart 6). Given the recent steep drop in output, it is likely that the unemployment rate will eclipse 10% in the US and most other economies during the coming months. Does this mean that it will take many years for the labor market to heal? Not necessarily. So far, most of the workers who have lost their jobs have been furloughed rather than permanently dismissed. According to the Bureau of Labor Statistics, 86% of the roughly 1.2 million US workers who lost their jobs in March were laid off temporarily (Chart 7). As a share of all unemployed, the number of workers on temporary layoff doubled in March to the highest level on record (Chart 8). Chart 7US Job Losses: Furlough Or Permanent Dismissal?
Testing Times
Testing Times
Chart 8US Temporary Job Losses Have Skyrocketed
US Temporary Job Losses Have Skyrocketed
US Temporary Job Losses Have Skyrocketed
The Role Of Stimulus Of course, it is possible that temporary layoffs will turn into permanent ones. This is where governments need to step in. Nothing can be done about the near-term decline in economic activity. That is the price which needs to be paid to keep the virus under control. However, transfers of income from governments to struggling households and firms can alleviate a lot of needless hardship, while making sure there is enough pent-up demand around for when businesses reopen their doors. We have discussed at length the various monetary and fiscal measures that have been introduced to combat the crisis.3 We will not get into the nitty-gritty of that discussion now, other than to note that the sizes of the various rescue packages have generally been in the ballpark of what is needed. And if it turns out that more help is necessary, it will be forthcoming. Chart 9 shows that there is widespread bipartisan support for further stimulus among US voters of all ages and backgrounds. Chart 9US: Support For Further Stimulus Is Widespread
Testing Times
Testing Times
The WWII Comparison In some economic respects, the pandemic may end up resembling World War II. Just like today, the volume of nonessential goods and services was greatly curtailed during the war in order to make room for essential production (Chart 10). Instead of an exponential increase in facemasks and test kits, there was an exponential increase in the production of military equipment (Chart 11). Chart 10WW2 Versus World War V
WW2 Versus World War V
WW2 Versus World War V
Chart 11Now Let's Do The Same For Test Kits And Ventilators
Testing Times
Testing Times
Similar to today, the US government ran massive budget deficits to finance the war effort. The ratio of federal debt-to-GDP rose from 45% in 1942 to more than 100% by the end of 1945. Today there is widespread fear that returning workers will find themselves out of a job. Back then, people worried that returning soldiers would be unable to secure work, leading to a second Great Depression. Future Nobel laureate Paul Samuelson warned that the US faced the “greatest period of unemployment and industrial dislocation” unless wartime controls were extended. Gunnar Myrdal, another future Nobel laureate, predicted an “epidemic of violence” stemming from mass unemployment. Looking back, while the unemployment rate did rise briefly after the war, it quickly fell back, as the pent-up demand from years of frugality and a slew of war-time inventions ushered in two decades of unprecedented growth. Policy also did its part. Even though government spending fell by 75% in real terms between 1944 and 1947, the GI Bill, which provided free education, low-cost mortgages, and unemployment benefits to returning soldiers, cushioned the blow. The Marshall Plan also helped rebuild post-war Europe, boosting US exports in the process. We are not predicting that the pandemic will usher in a period of unparalleled prosperity. Nevertheless, just like the bleak forecasts following WWII proved to be unfounded, today’s forecasts of prolonged mass unemployment will likely not materialize. Gauging The Fair Value Of Equities To what extent has the recession reduced the fair value of corporate equities? Let us try to answer this question analytically. Consider a baseline where earnings grow by 2% per year, the risk-free rate is 2%, and the equity risk premium is 5%. Now suppose that the recession temporarily reduces corporate profits by 60% this year, 40% next year, and 20% the year after next relative to the aforementioned baseline, with earnings returning to trend beyond then. Chart 12 shows that such a recessionary shock would reduce the present value of earnings by 5.4%. Now let’s consider a more ominous scenario where corporate profits fall by 60% this year, 40% next year, 20% the year after that, and then remain 10% lower relative to the baseline forever. In that case, the present value of future earnings would fall by 14.1%. One might notice that even in this ominous scenario, the present value of future earnings falls less than one might have assumed. And this is before we take into account any possible mitigating effects from a drop in the risk-free rate. For example, suppose that the risk-free rate declines by one percentage point, which is roughly how much both the US 30-year Treasury yield and our 5-year/5-year forward terminal rate proxy have fallen since the start of the year (Chart 13). In that case, the present value of earnings would increase by 7.3% even if profits followed the ominous path described above. Chart 12What Happens To Earnings During A Recessionary Shock?
Testing Times
Testing Times
Chart 13Long-Term Rates Have Dropped This Year
Long-Term Rates Have Dropped This Year
Long-Term Rates Have Dropped This Year
Of course, in practice, stocks tend to fall a lot more during recessions than you would expect based on the sort of fair value calculations described above. This is because the equity risk premium, which we have kept constant in our examples, usually rises in periods of economic turmoil. A higher risk premium increases the discount rate applied to future earnings, leading to lower stock prices. The equity risk premium is mean reverting. This explains why the prospective return to equities is usually highest during recessions and lowest following long economic booms. The equity risk premium is quite high at present, which warrants overweighting equities relative to bonds over a 12-month horizon (Chart 14). That said, the high equity risk premium mainly reflects exceptionally low bond yields. In absolute terms, stocks are not especially cheap, particularly in the US, where the S&P 500 trades at 17.3-forward earnings (Chart 15). That is actually above the P/E ratio of 15.1 that the S&P 500 reached in October 2007 at the peak of the bull market before the start of the Global Financial Crisis. Chart 14The Equity Risk Premium Is Quite High, Especially Outside The US
The Equity Risk Premium Is Quite High, Especially Outside The US
The Equity Risk Premium Is Quite High, Especially Outside The US
Chart 15US Stocks Are Not Particularly Cheap In Absolute Terms
US Stocks Are Not Particularly Cheap In Absolute Terms
US Stocks Are Not Particularly Cheap In Absolute Terms
Moreover, today’s forward P/E ratio is based on stale earnings estimates which will come down over the coming weeks. The bottom-up consensus calls for S&P 500 companies to earn $153 per share this year. Our US equity strategists expect something closer to $100. We noted earlier this month that we would be aggressive buyers of stocks if the S&P 500 fell below 2250, but would turn neutral if the S&P 500 rose above 2750. The index briefly fell below 2250 on March 23, only to surge to 2789 as of the close of trading today. As such, we are downgrading our tactical 3-month view on global equities back to neutral. We are also trimming our tactical 3-month recommendation on the more cyclical currencies and stock markets such as those in Europe and EM. For now, we are maintaining our overweight stance on global stocks over a 12-month horizon, but will consider curbing that too if the S&P 500 rises above 3000 without a corresponding improvement in the news flow. Our full slate of views is shown in the matrix at the end of this report. Going forward, we will use this matrix as the primary tool for communicating our market views, reserving trade recommendations only for special situations that are not well covered by the views expressed in the matrix. To enhance accountability, we will start tracking all the positions in the matrix versus an appropriate market benchmark. Peter Berezin Chief Global Strategist peterb@bcaresearch.com APPENDIX 1: Testing Versus Mass Quarantines (I) In a series of blog posts, Paul Romer presented a model that simulates and visualizes the effects of various policies aimed at containing the spread of Covid-19. At its core, similar to models used by epidemiologists, Romer’s model shows that without any intervention, a vast majority of populations will end up becoming infected. His simulations suggest that the policy of isolation based on random testing can be as effective in containing the virus as mass indiscriminate isolation. However, the economic and social costs of the latter are much higher than they are for the former. In Romer’s simulations, the policy of test-based isolation keeps the cumulative fraction of the population that is infected at below 20%. This policy relies on frequent testing where 7% of the population is randomly tested every day, equivalent to testing everyone roughly once every two weeks. Those who test positive are isolated. It is further assumed that these tests are imperfect: they yield 20% false negatives and 1% false positives. To achieve a similar profile of virus propagation without tests, Romer finds that a random isolation policy would require an average isolation rate in the population of about 50%. Appendix Chart 1 provides a graphical comparison of the intensity of the quarantining that is required under the two policy simulations. It shows that an isolation policy relying on tests results in much less disruption to normal patterns of social interactions. Appendix Chart 1
Testing Times
Testing Times
Testing Times
Testing Times
APPENDIX 1: Testing Versus Mass Quarantines (II) The following two animations visualize the differences between the two policies: The blue inverted triangles show those who are vulnerable to catching the virus; the red circles signify those who are infectious; the purple squares mark those who were previously infectious but have now recovered and can neither catch nor transmit the virus; and the hollow orange box illustrates isolation. Isolating Based On Test Results .iframe-container{ position: relative; width 100%; padding-bottom: 56.25%; height: 0; } .iframe-container iframe{ position: absolute; top:0; left:0; width:100%; height: 100%; } Isolating At Random .iframe-container{ position: relative; width 100%; padding-bottom: 56.25%; height: 0; } .iframe-container iframe{ position: absolute; top:0; left:0; width:100%; height: 100%; } Source: Paul Romer, “Simulating Covid-19: Part 2,” March 24, 2020. For more details about the models and simulations as well as sensitivity analysis, please visit: https://paulromer.net/. Footnotes 1 “Evaluating The Initial Impact Of Covid-19 Containment Measures On Economic Activity,” OECD, 2020. 2 Paul Romer, “Simulating Covid-19: Part 2,” March 24, 2020. 3 Please see Global Investment Strategy, “Second Quarter 2020 Strategy Outlook: World War V,” dated March 27, 2020. Global Investment Strategy View Matrix
Testing Times
Testing Times
Current MacroQuant Model Scores
Testing Times
Testing Times
Highlights Please note that we are publishing an analysis on Vietnam below. The unprecedented depth of this recession entails that many businesses will likely be operating below their break-evens for a while, even after the confinement measures are eased. Consequently, the process of bottoming in this bear market will be drawn out, and share prices will gyrate substantially in the interim. Elevated foreign currency debt levels among some EM corporations, plunging revenues and local currency depreciation combine for a perfect storm in EM corporate credit. Continue underweighting EM stocks and credit within global equity and credit portfolios, respectively. Take profits on the long EM currency volatility trade. Feature If history is any guide, the speed of the rebound in global equities is more consistent with a bear market rally than the beginning of a new bull market. Typically, for a new durable bull market to emerge after a vicious bear market, a consolidation period or a base-building phase is needed. As of now, share prices have not formed such a base. Playing bear market rallies is all about timing, in which fundamental analysis is not useful. Rebounds die as abruptly as they begin. Hence, it is all about chasing momentum on either side. The unprecedented depth of this recession heralds that many businesses will likely be operating below their break-evens for a while, even after the confinement measures are eased. We closed our absolute short position in EM equities on March 19 but we have continued shorting EM currencies versus the US dollar. Even though EM share prices have become cheap based on their cyclically-adjusted P/E ratio (Chart I-1), valuation is not a good timing tool. This is especially true for this structural valuation indicator. Chart I-1EM Equities Are As Cheap As In Previous Bottoms
EM Equities Are As Cheap As In Previous Bottoms EM Equities Are Cheap According To The Cyclically-Adjusted P/E Ratio
EM Equities Are As Cheap As In Previous Bottoms EM Equities Are Cheap According To The Cyclically-Adjusted P/E Ratio
Why The Rebound? After the massive selloff, investor sentiment on risk assets in general, and cyclicals specifically, has become very depressed. In particular: Sentiment of traders and investment advisors on US stocks has plummeted (Chart I-2). That said, net long positions in US equity futures are still above their 2016 and 2011 lows, as we noted last week. Traders’ sentiment on cyclical currencies such as the CAD and AUD as well as on copper and oil has dropped to their previous lows (Chart I-3). Chart I-2Investor Sentiment On US Equities Is Poor
Investor Sentiment On US Equities Is Poor
Investor Sentiment On US Equities Is Poor
Chart I-3Investor Sentiment On Copper And Oil Is Depressed
Investor Sentiment On Copper And Oil Are Depressed
Investor Sentiment On Copper And Oil Are Depressed
Consistently, net long positions of investors in both copper and oil have been trimmed substantially (Chart I-4A and I-4B). Chart I-4AInvestors’ Net Long Positions In Copper...
Investors Net Long Positions In Copper...
Investors Net Long Positions In Copper...
Chart I-4B…And Oil
...And Oil
...And Oil
On the whole, it should not be surprising that after having become very oversold, risk assets rebounded in the past two weeks. Nevertheless, depressed investor sentiment is a necessary but not sufficient condition for a major bear market bottom. As illustrated in Chart I-3, sentiment on oil and copper was extremely depressed in late 2014. Yet with the exception of brief rebounds, both oil and copper prices continued to plunge for about a year before bottoming in January 2016. The necessary and sufficient condition for a durable bottom in global cyclical assets is an improvement in global demand. Chart I-5The S&P 500 And VIX In The Last Two Bear Markets
The S&P 500 And VIX In The Last Two Bear Markets
The S&P 500 And VIX In The Last Two Bear Markets
Given the US and Europe are still in strict confinement and the Chinese economy remains quite weak (please see our more detailed discussion on this below), the global recession is still deepening. Further, while the enormous amounts of stimulus injected by policymakers is certainly positive, it is not yet clear whether these efforts are sufficient to entirely offset the collapse in the level of economic activity and its second round effects. Nevertheless, the Federal Reserve and the European Central Bank have probably contained the acute phase of the financial market crisis by buying financial assets and providing credit to the real economy. Odds are that the VIX and other volatility measures will not retest their recent highs. However, this does not mean that risk assets cannot retest their lows or make fresh ones. For example, in the previous 2001-2002 and 2008 bear markets, the S&P 500 re-tested its low in early 2003 and made a deeper trough in early 2009 even though the VIX drifted lower (Chart I-5). Finally, as we discuss below, a unique feature of this recession makes it unlikely that a definite equity market bottom has been established so quickly. How This Recession Is Distinct From an investor viewpoint, this global recession stands out from others in a particularly distinct way: In an average recession, nominal output levels do not contract. In the US, since 1960 it was only during 2008 that the level of nominal GDP contracted (Chart I-6). Presently, we are experiencing the gravest collapse in nominal output/sales since the 1930s – much worse than what transpired in 2008. Chart I-6US Nominal GDP And Corporate Profits Growth
US Nominal GDP And Corporate Profits Growth
US Nominal GDP And Corporate Profits Growth
When a company’s sales shrink, a critical threshold for sustainability is the level of its revenues relative to its break-even point. The latter is the level of sales where total revenue is equal to total cost – i.e., where profits are nil. Break-even points have ramifications for share prices and the shape of a potential recovery. In an average recession, break-even points for the majority of companies are not breached – i.e., they remain profitable. As a result, a moderate and sequential revival in sales boosts profits, often exponentially. Share prices react positively to even modest sequential growth. Besides, when profits are expanding, managers and owners of these businesses are often quick to augment their capital spending and hiring. A marginal and sequential recovery from this very low point is not sufficient to produce a durable bull market for stocks or corporate credit. When a company’s sales drop below its break-even level, a moderate sequential recovery in sales could be insufficient to make the company profitable. In such a case, the share price may not rally vigorously unless they had priced in a much worse outcome – i.e., a bankruptcy. Crucially, a moderate sequential revival in activity may not lead to more capital spending and hiring. Given US and global nominal GDP are presently contracting at an unprecedented double-digit pace, the revenue of a majority of companies has fallen below costs – i.e., they are presently operating below their break-evens (experiencing losses). This makes this recession distinct from others. On the whole, the loosening of confinement measures and the resumption of business operations may not be sufficient reasons to turn bullish on equities. So long as a company operates below its break-even, its share price may not rally much in response to marginal sequential growth. In short, the pace of recovery will be crucial. Yet, there is considerable uncertainty with respect to these dynamics. Such uncertainty also warrants a high equity risk premium. A U-shaped recovery is most likely, but the latter assumes that many companies will be operating with losses for some time. Consequently, odds are that the process of bottoming in this bear market will be drawn out, and share prices will gyrate substantially in the interim. Taking Pulse Of The Global Economy In our March 19 report, we argued that this global recession is much worse than the one in 2008. High-frequency data are confirming our view: The weekly US economic index from the New York Fed has plunged more than it did in 2008 (Chart I-7). Capital spending plans have been shelved around the world. Odds are many businesses will be operating below their break-evens even after confinement measures are eased. Therefore, they will not rush to invest in new capacity and equipment, or rush to hire. China is a case in point. Commodities prices on the mainland remain in a downtrend, despite the resumption of business activity (Chart I-8). This is a sign of lingering weakness in construction/capital spending. Chart I-7An Unprecedented Plunge In Economic Activity
An Unprecedented Plunge In Economic Activity
An Unprecedented Plunge In Economic Activity
Chart I-8Commodities Prices In China Are Drifting Lower
Commodities Prices In China Are Drifting Lower
Commodities Prices In China Are Drifting Lower
The world’s oil consumption is presently probably down by more than 35%. According to INRIX, US car traffic last week was 47% below its level in late February before the confinement measures were introduced. Plus, airline travel has literally ground to a halt worldwide. In China’s major cities, traffic during rush hour is re-approaching its pre-pandemic levels. However, automobile congestion data from TomTom shows that in the afternoons and evenings, traffic remains well below where it was before the lockdown. This reveals that people go to work, spend most of their time at the office, and then quickly return home. They do not go out during lunch time or in the evenings. Hence, we infer that China’s service sector remains in recession. Chart I-9EM ex-China, Korea And Taiwan: Nominal Growth Was Very Weak Before The Pandemic
EM ex-China, Korea And Taiwan: Nominal Growth Was Very Weak Before The Pandemic
EM ex-China, Korea And Taiwan: Nominal Growth Was Very Weak Before The Pandemic
The Chinese manufacturing and service PMI indexes registered 51 and 47 respectively in March, revealing that their economic recoveries are very subdued. As per our discussion above, we suspect revenues for many businesses in February dropped below break-even levels. The fact that only about a half of both manufacturing and service sector companies said their March activity improved from February is rather underwhelming. EM ex-China, Korea and Taiwan nominal GDP and core consumer price inflation were at very low levels before the pandemic (Chart I-9). The ongoing plunge in economic activity will produce the worst nominal output recession for many developing economies. Consequently, corporate profits of companies exposed to domestic demand will crash in local currency terms. Bottom Line: The unprecedented depth of this recession heralds that many businesses will likely be operating below their break-evens for a while, even after the confinement measures are eased. Thus, a marginal and sequential recovery from this very low point is not sufficient to produce a durable bull market for stocks or corporate credit. Credit Markets Hold The Key Solvency concerns for companies become acute and doubt about their debt sustainability persist when their revenues drop below their break-evens. Thus, a marginal improvement in revenue – as lockdowns worldwide are relaxed – may not suffice to produce a material tightening in EM corporate credit spreads. Playing bear market rallies is all about timing, in which fundamental analysis is not useful. Rebounds die as abruptly as they begin. Interestingly, equity markets often take their cues from credit markets. Chart I-10 demonstrates that EM US dollar corporate bond yields (inverted on the chart) correlate with equity prices. This chart unambiguously expounds that what matters for EM share prices is not US Treasurys yields but rather their own borrowing costs in US dollars. Chart I-10EM US Dollar Corporate Bond Yields And Stock Prices
EM US Dollar Corporate Bond Yields And Stock Prices
EM US Dollar Corporate Bond Yields And Stock Prices
Presently, there are no substantive signs that US dollar borrowing costs for EM companies or sovereigns are declining. Chart I-11 illustrates that investment and high-yield corporate bond yields for aggregate EM and emerging Asia remain elevated. Remarkably, bank bond yields in overall EM and emerging Asia have not eased much (Chart I-12). The latter is crucial as banks’ external high borrowing costs will dampen their appetite to originate credit domestically. Chart I-11EM US Dollar Corporate Bond Yields
EM US Dollar Corporate Bond Yields
EM US Dollar Corporate Bond Yields
Chart I-12EM Banks US Dollar Bond Yields
EM Banks US Dollar Bond Yields
EM Banks US Dollar Bond Yields
Chart I-13EM Credit Spreads, Currencies And Commodities
EM Credit Spreads, Currencies And Commodities
EM Credit Spreads, Currencies And Commodities
In turn, the direction of EM corporate and sovereign credit spreads is contingent on EM exchange rates and commodities prices, as demonstrated in Chart I-13. Credit spreads are shown inverted in both panels of this chart. We remain negative on both EM currencies and commodities prices, and argue for a cautious approach to EM credit markets. Bottom Line: Elevated foreign currency debt levels among some EM corporations, plunging revenues and local currency depreciation combine for a perfect storm in EM corporate credit. To make matters worse, this asset class as well as EM sovereign credit were extremely overbought before this selloff. Therefore, there could be more outflows from these markets as adverse fundamentals persist. Investment Strategy And Positions We continue to recommend underweighting EM stocks and credit versus their DM counterparts. Importantly, the EM equity index has been underperforming the global equity benchmark in the recent rebound (Chart I-14). Aggressive policy stimulus in the US and Europe have improved investor sentiment towards their credit and equity markets. Yet, the Chinese stimulus has so far been less aggressive than in the past. This will weigh on the growth outlook for emerging Asia and Latin America. The outlook for oil prices is currently a coin toss. Price volatility will remain enormous and it is not worth betting on either the long or short side of crude. Apart from oil, industrial metal prices remain at risk due to subdued demand from China. In general, this is consistent with lower EM currencies (Chart I-15). Chart I-14Continue Underweighting EM Stocks Versus The Global Benchmark
Continue Underweighting EM Stocks Versus The Global Benchmark
Continue Underweighting EM Stocks Versus The Global Benchmark
Chart I-15EM Currencies Correlate With Industrial Metals Prices
EM Currencies Correlate With Industrial Metals Prices
EM Currencies Correlate With Industrial Metals Prices
Chart I-16Book Profits On Long EM Currency Volatility Trade
Book Profits On Long EM Currency Volatility Trade
Book Profits On Long EM Currency Volatility Trade
In accordance with our discussion above that the most acute phase of this crisis might be over, we are booking profits on our long EM currency volatility trade. We recommended this trade on January 23, 2020 and the JP Morgan EM currency implied volatility measure has risen from 6% to 12% (Chart I-16). While EM currencies could still sell off, we doubt this volatility measure will make a new high. Arthur Budaghyan Chief Emerging Markets Strategist arthurb@bcaresearch.com Vietnamese Stocks: Stay Overweight Like many EM bourses, Vietnamese stocks have plunged 35% over the past two months in US dollar terms. How should investors now position themselves with regard to Vietnamese equities, in both absolute and relative terms? In absolute terms, there are near-term risks to Vietnamese equities: Vietnam’s economy is highly dependent on exports, which amount to more than 100% of the country’s GDP. The deepening global recession entails that overseas demand for Vietnamese exports will be decimated. Chart II-1 illustrates how share prices often swing along with export cycles. Customers from the US and EU, which together account for 40% of Vietnamese exports, have been cancelling their orders. In addition, the number of visitor arrivals has already dropped significantly, and tourism revenue – which amounts to about 14% of GDP – will continue to contract (Chart II-2). Chart II-1Vietnamese Stocks: Risks Are External
Vietnamese Stocks: Risks Are External
Vietnamese Stocks: Risks Are External
Chart II-2Tourism Has Crashed
Tourism Has Crashed
Tourism Has Crashed
Nevertheless, we expect Vietnamese stocks to outperform the EM benchmark, in USD terms, both cyclically and structurally. First, Vietnam has solid macro fundamentals. The country’s annualized trade surplus has ballooned, reaching $12 billion in March (Chart II-3). Even as exports contract, the current account balance is unlikely to turn negative. Notably, Vietnam imports many of the materials required to produce its exported goods. As such, its imports will shrink along with its exports, which will support its current account balance. Meanwhile, the year-on-year growth of domestic nominal retail sales of goods has slowed down, but remains at 8% as of March, which is quite remarkable (Chart II-4). Chart II-3Vietnam Has Large Trade Surplus
Vietnam Has Large Trade Surplus
Vietnam Has Large Trade Surplus
Chart II-4Consumer Spending To Slow But Not Contract
Consumer Spending To Slow But Not Contract
Consumer Spending To Slow But Not Contract
Second, the government has announced a sizable policy stimulus package. On March 16, the State Bank of Vietnam cut its policy rate by 50bps, from 4% to 3.5%, and its refinancing rate by 100bps, from 6% to 5%. On April 3, Vietnam's Ministry of Finance passed a fiscal stimulus package worth VND180 trillion (equal to US$7.64 billion, or 2.9% of its GDP). Third, Vietnam has contained the COVID-19 outbreak better than many other countries. With aggressive testing and isolation, the country has so far limited the infection rate to only three out of one million citizens, and reported zero deaths. This reduces the probability that Vietnam will be forced to adopt severe confinement measures that would derail its economy. This nation’s success also contrasts with the difficulties that many emerging and frontier economies are having in their struggle with COVID-19 containment. We continue to overweight Vietnamese stocks relative to EM due to healthy fundamentals, attractive valuations, a large current account balance and a successful economic and health response to the COVID-19 outbreak. Fourth, the country remains quite competitive in global trade. For some time, multinational companies have been moving their supply chains to Vietnam in order to take advantage of its cheap and productive labor, inexpensive land and supportive government policies. As a result, Vietnamese exports have been outpacing those of China across many industries (Chart II-5). Given the geopolitical confrontation between the US and China is likely to persist over many years, more manufacturing will shift from China to Vietnam. Investment Recommendations In absolute terms, we believe Vietnamese stocks are still at risk. Stock prices falling to their 2016 low is possible over the coming weeks and months, which corresponds to a 10-15% downslide from current levels (Chart II-6, top panel). Chart II-5Vietnam Continues Gaining Export Market Share
Vietnam Continues Gaining Export Market Share
Vietnam Continues Gaining Export Market Share
Chart II-6Vietnamese Stocks: Absolute & Relative Performance
Vietnamese Stocks: Absolute & Relative Performance
Vietnamese Stocks: Absolute & Relative Performance
Relative to the EM equity benchmark, however, we continue overweighting Vietnam equities, both cyclically and structurally. Technically, this bourse’s relative performance has declined to a major support line and it could be bottoming at current levels (Chart II-6, bottom panel). Ellen JingYuan He Associate Vice President ellenj@bcaresearch.com Footnotes Equities Recommendations Currencies, Credit And Fixed-Income Recommendations
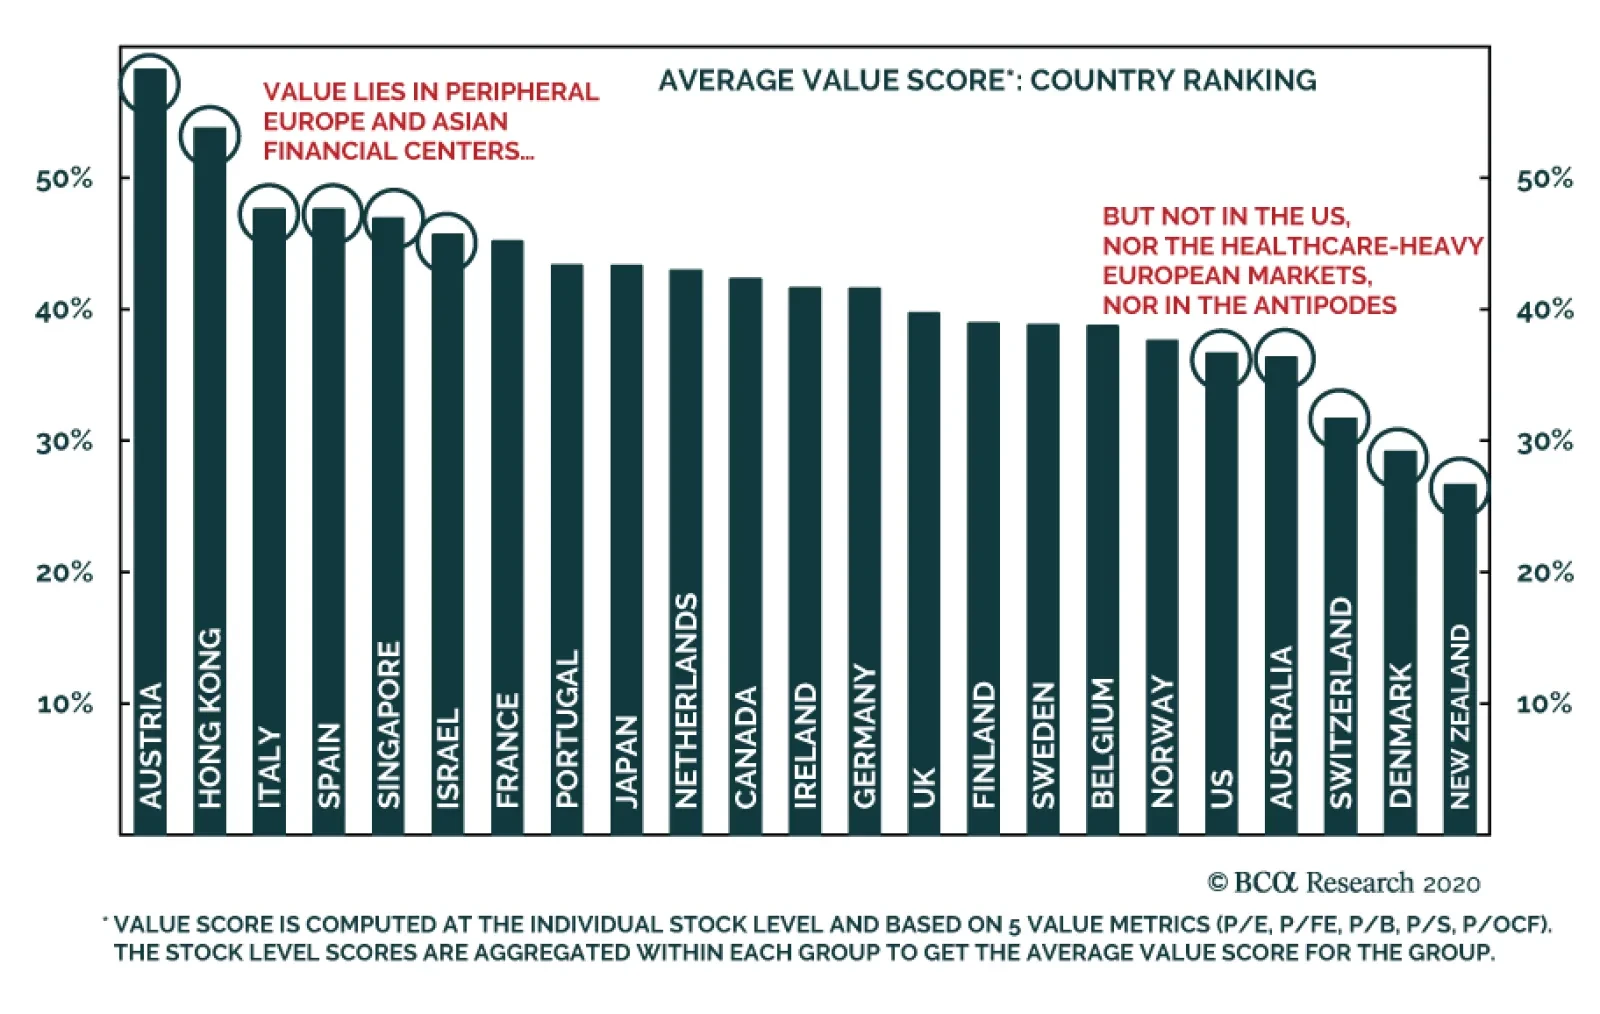
In the same way, as we could construct a sector ranking based on the ETS value score, we can also build a country ranking, using the same bottom-up approach. This bottom-up ranking currently suggests that amongst major markets the US offers the least…
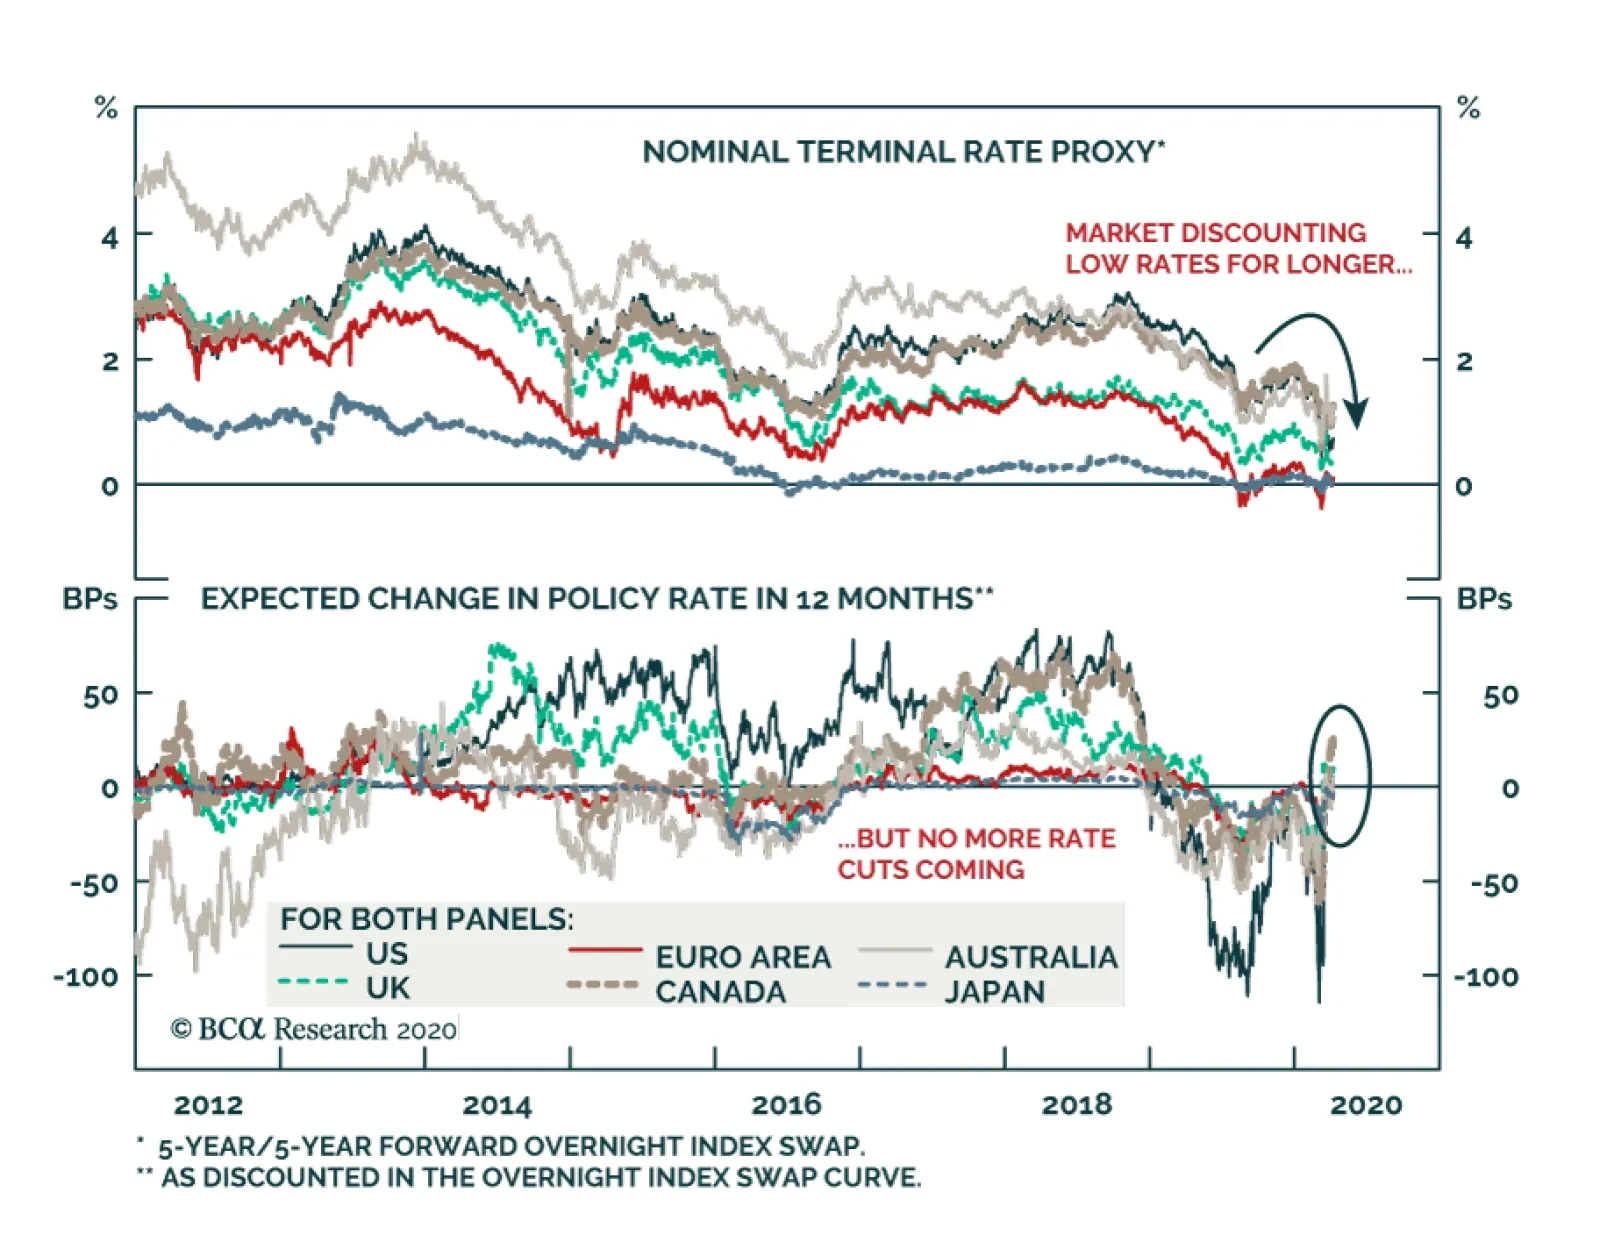
On Tuesday, BCA Research's Global Fixed Income Strategy service concluded that global government bond yields are likely to remain range-bound for at least one to two more months. Market expectations of future policy rates are driving the term structure of…
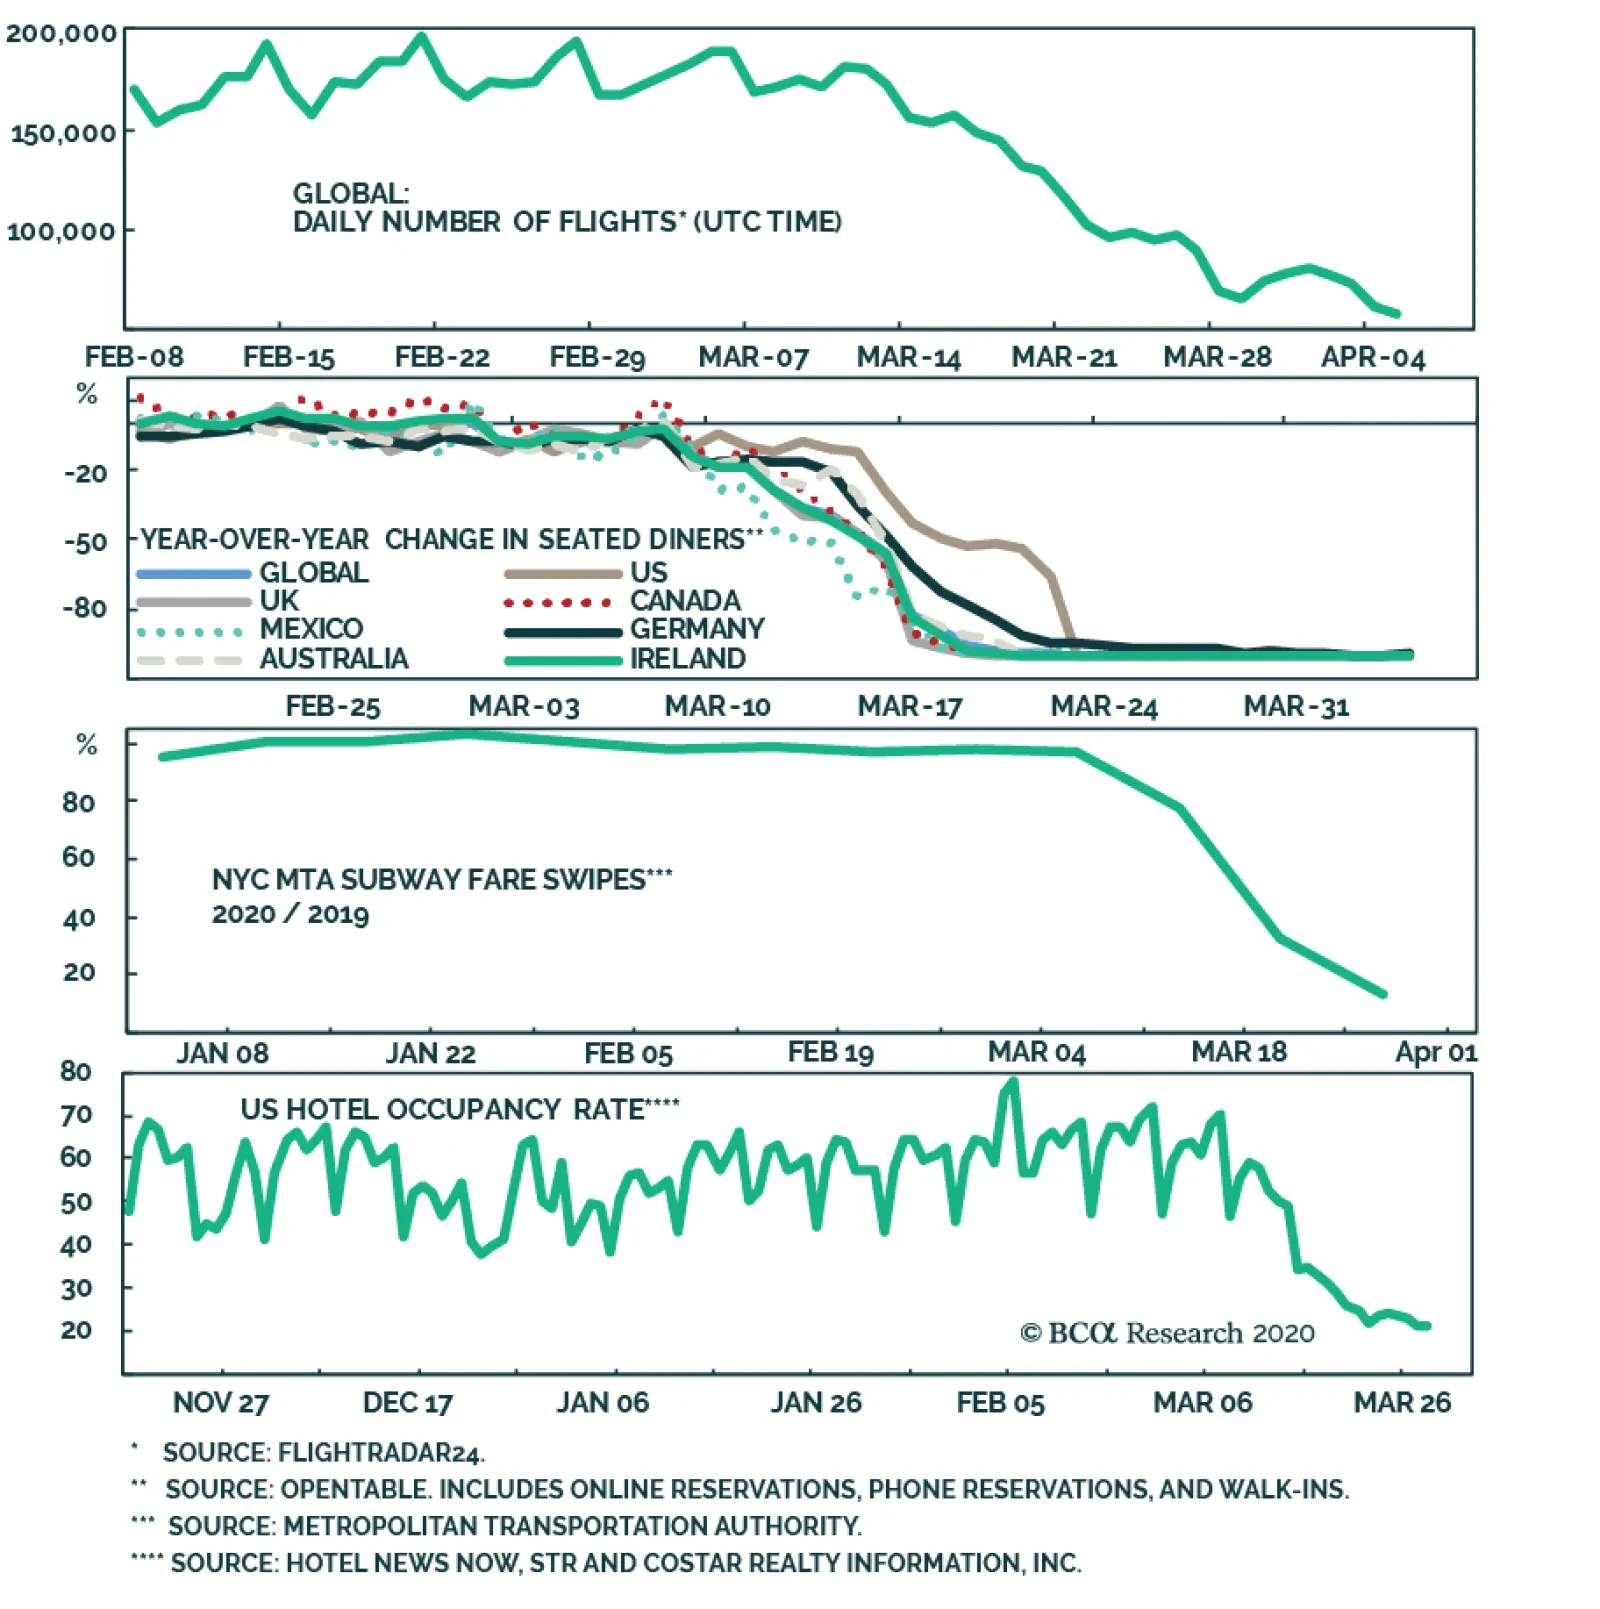
For now, the most up-to-date indicators of economic activity show that the global economy continues to decelerate, especially in the service sector. For example, the number of flights around the world has fallen by more than 70% since February, and the number…
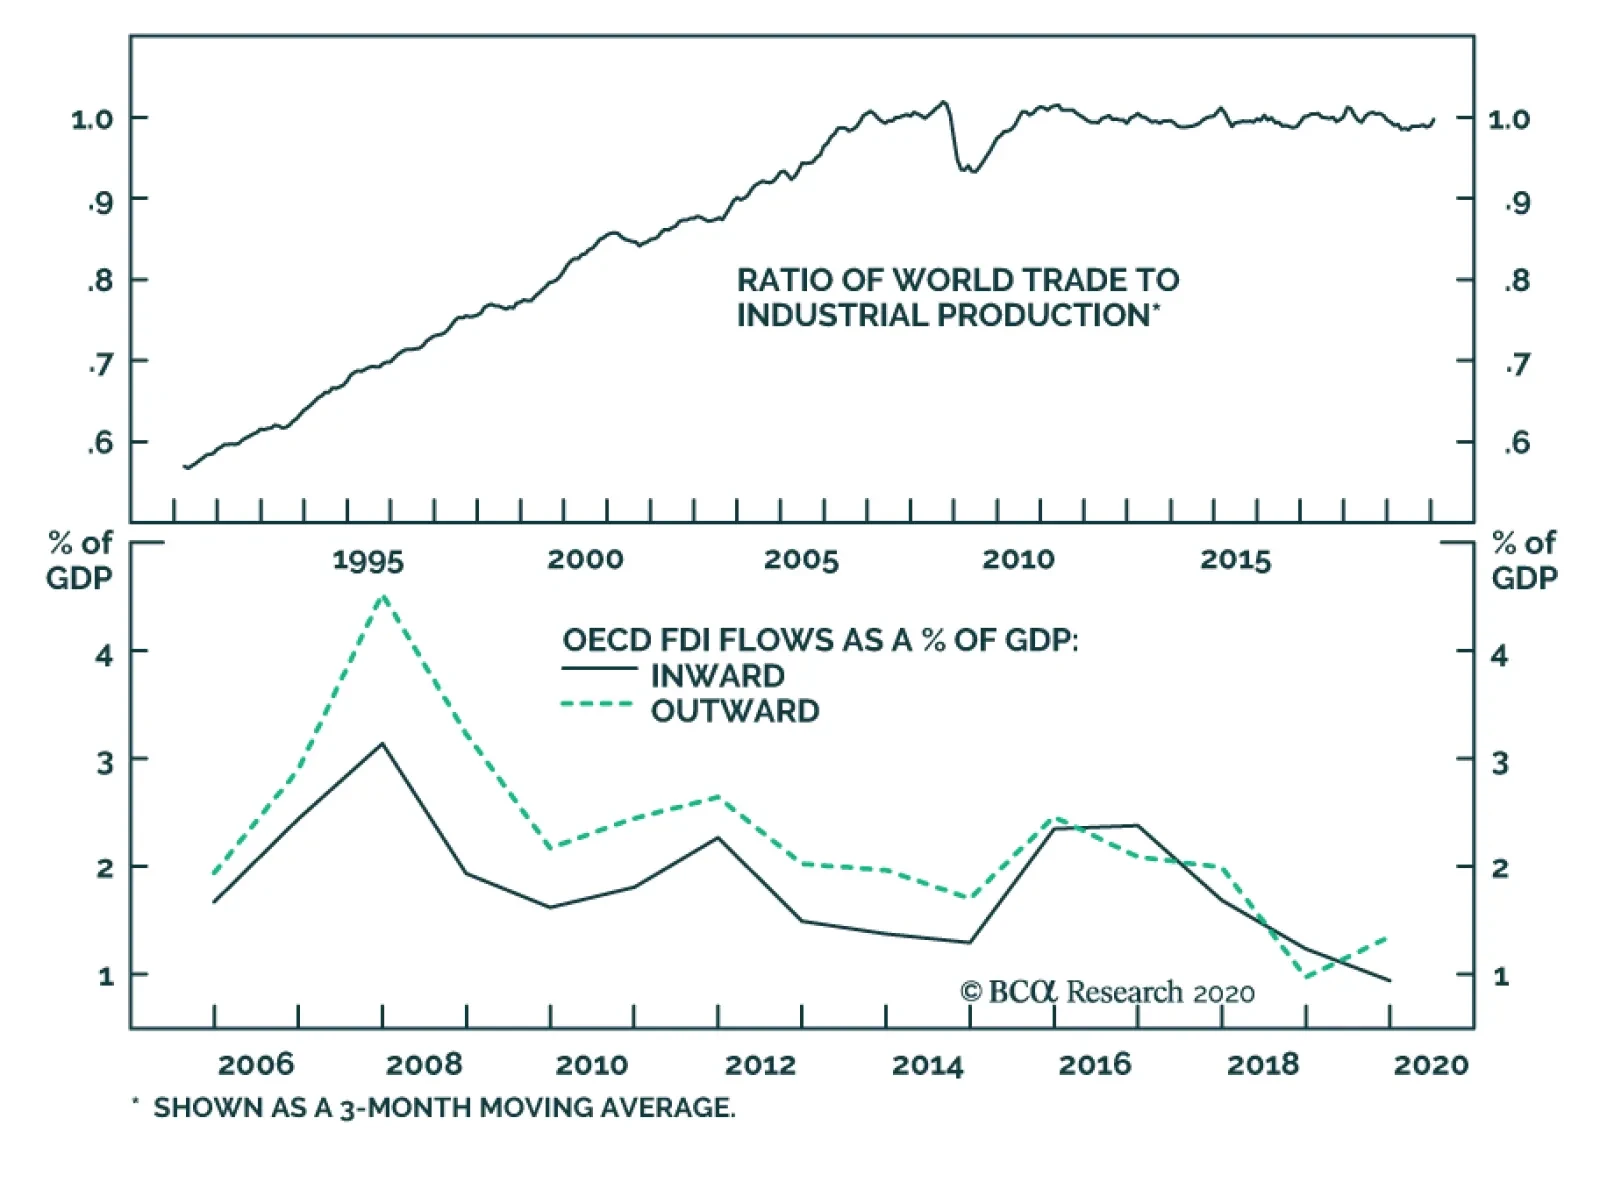
Last Friday, BCA Research's chief economist Martin Barnes wrote a special report addressing the potential longer-term consequences of the COVID-19 pandemic and subsequent global recession. Among these consequences, Martin noted that globalization has peaked…
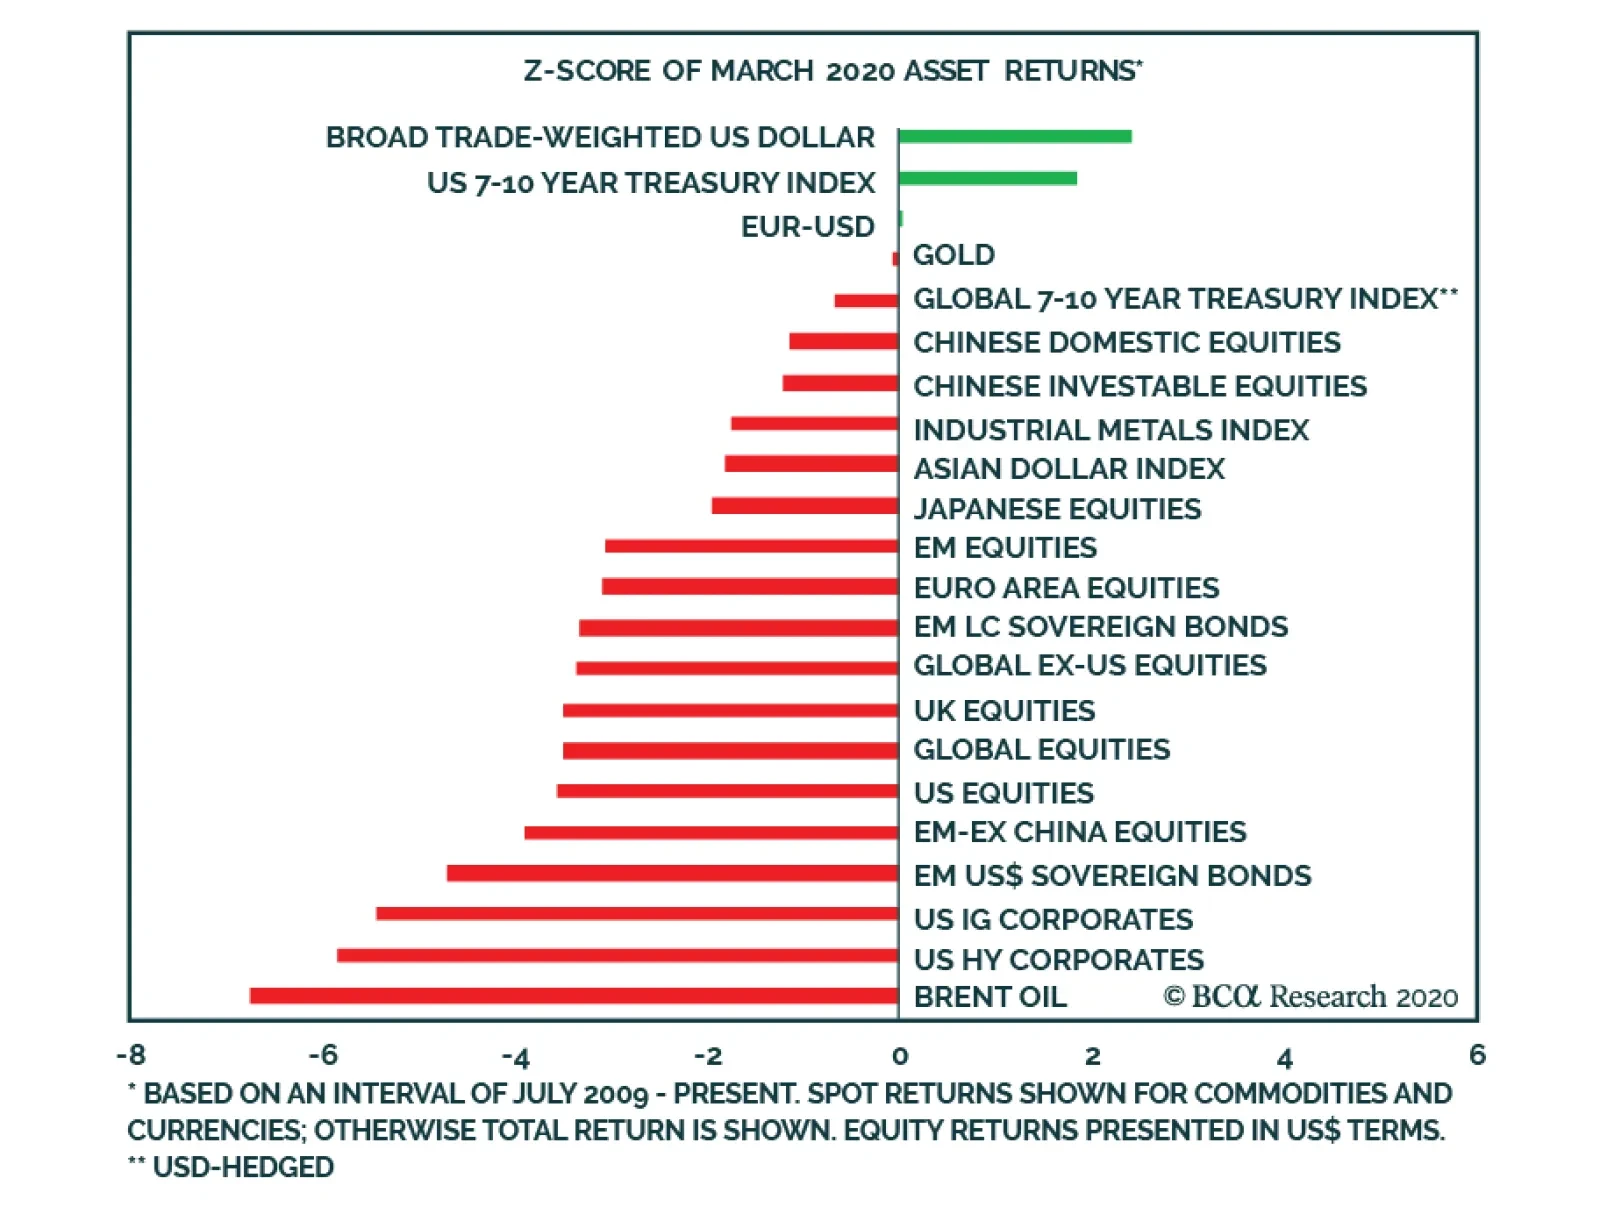
The chart above presents the March monthly returns of a variety of important financial assets, shown as the number of standard deviations from the average that has prevailed since the end of the Great Recession in 2009. Several points are noteworthy: The…
Making predictions about the economic and market outlook seems a futile exercise in the midst of such massive uncertainty. The deluge of articles about COVID-19 merely serves to highlight that nobody really knows how things will play out in the year ahead. Much depends on whether an effective vaccine or treatment becomes available within a reasonable timescale and that remains an open question. Social and economic disruption will continue to intensify until the spread of the virus starts to abate. One thing is certain. Economic activity around the world faces its biggest contraction in modern times. Declines in second quarter GDP will be mind-numbingly bad in a wide range of countries, especially those that have instituted lockdowns and the closure of non-essential businesses. According to the OECD, the median economy faces an initial output decline of around 25% as a result of shutdowns and restrictions.1 Chart 1A Meltdown In Economic Activity
A Meltdown In Economic Activity
A Meltdown In Economic Activity
Estimates for the drop in US real GDP in the second quarter range as high as 50% at an annual rate. To put this into perspective, the peak-to-trough decline in US real GDP in the 2007-09 recession was a mere 4% over six quarters, and that felt catastrophic at the time. The New York Fed’s weekly economic index2 has already fallen to the lows of 2008 and worse is still to come (Chart 1). Could things be as bad as the 1930s Great Depression when US real GDP contracted by 25% over a three-year period? That would require an extreme apocalyptic view about the progression of the virus and does not bear thinking about. I am not that gloomy. Policymakers are acting aggressively to limit the economic damage. Central banks are flooding the system with liquidity and the cost of money is negligible. Meanwhile, fiscal caution has been thrown to the wind with massive government stimulus in many countries. While this will not prevent a deep recession, it will minimize the downside risks and support the eventual rebound. Markets are understandably in a deep funk because it is hard to price unknown risks. If this is no more than a two-quarter economic downturn followed by a sharp recovery, then a good buying opportunity in risk assets is in place given that monetary policy will stay hyper accommodative for a considerable time. If the downturn lingers much longer than that, then equities remain at risk. While loath to make a prediction, I am uncharacteristically tending to the more optimistic side. Let’s make the heroic assumption that we are not in an end of days scenario and that this crisis will pass at some point in the next year- hopefully sooner than later. What are some of the longer-run implications? A few come to mind. The backlash against globalization will gather impetus. Public sector debt will rise to unimaginable peacetime levels. Meanwhile, the crisis puts the final nail in the coffin of the private sector Debt Supercycle. Monetary policy will err on the side of ease for a very long time. The way that companies and other institutions have been forced to adapt to the crisis could trigger lasting changes in how they operate. Globalization In Full Retreat Chart 2A Retreat From Globalization
A Retreat From Globalization
A Retreat From Globalization
The peak of globalization has been a central part of the BCA view for several years.3 Long before the current crisis, it was clear that anti-globalization forces were gathering strength, illustrated by increased trade barriers, a backlash against inward migration in many countries, and reduced flows of foreign direct investment (Chart 2). The Trump Administration’s imposition of tariffs and the Brexit vote were two of the more obvious examples of the change in attitudes. The supply-chain interruptions caused by factory shutdowns in China will reinforce the view that shifting production to cheaper-cost countries overseas went too far. At a minimum, it seems inevitable that many companies will seek to reduce their reliance on a single producer for critical components. On the medical front, one striking fact to emerge was that China supplies around 80% of US antibiotics. There will be massive pressure to develop greater homegrown supplies of medical supplies and other products deemed critical for economic and national security. The crisis also has led to a breakdown of the Schengen Area of open borders within the European Union (EU). Many member countries have reinstituted border controls and it is unclear when these might be removed. The free movement of people is a core principle of the EU. Meanwhile, the Maastricht Treaty rules on fiscal discipline, a key element of economic union, have been thrown out of the window. Even Germany has bowed to the pressure of relaxing fiscal constraints. Finally, a worsening situation for the already troubled Italian banking system will threaten EU financial stability. Overall, the crisis will leave a huge question mark over the long-term viability of the EU. Globalization was a major force behind disinflation as production shifted to low-cost producers. A reversal of this trend will thus be inflationary, at the margin. For many, this will be a price worth paying if it means increased job security and reduced vulnerability of supply chains. But the shift away from globalization will not be the only trend that threatens an eventual resurgence of inflation. The Explosion In Government Debt: Last Gasp Of The Debt Supercycle BCA introduced the concept of the Debt Supercycle more than 40 years ago to describe the actions of policymakers to pump up demand rather than allow financial imbalances to be fully unwound during economic downturns. This inevitably meant that each new cycle began with a higher level of financial imbalances. As indebtedness rose, the economic costs of a financial cleansing increased, requiring ever-more desperate policy measures to shore things up. Unfortunately, such actions merely created the conditions for greater excesses and imbalances down the road. For example, the Federal Reserve’s aggressive response to the bursting of the tech bubble in 2000 helped set the scene for the even bigger housing bubble later in the decade. In that sense, the Debt Supercycle was a self-reinforcing trap that was bound to end badly, and that occurred in 2007. Chart 3The US Household Love Affair With Debt Died A Decade Ago
The US Household Love Affair With Debt Died A Decade Ago
The US Household Love Affair With Debt Died A Decade Ago
Our discussion of the US Debt Supercycle was focused largely on the private sector because that is where rising imbalances posed the greatest threat to economic and financial stability. Rising public sector imbalances were less of a concern because governments do not finance themselves through the banking sector. Moreover, unlike the private sector, taxes can always be raised to boost revenues or, in extremis, the authorities can resort to the printing press. At the end of 2014, we wrote that the Debt Supercycle was dead. By that, we meant that easing policy would no longer be able to encourage a new cycle of leverage-financed private-sector spending. The downturn of 2007-09 was a turning point in attitudes toward debt, much in the way that those who lived through the Great Depression were financially conservative for the rest of their lives. Our view has been vindicated by the fact the ratio of household debt to income has decisively broken its pre-housing bubble uptrend and has failed to revive in the face of record-low interest rates (Chart 3). Corporate borrowing has been strong, but largely to finance stock buybacks and M&A activity. Capital spending has been disappointing this cycle, despite strong profits and margins. The current deep downturn will add a further nail in the coffin of the private sector Debt Supercycle. The shock of the recession and destruction of wealth will leave a legacy of increased financial caution with households wanting to build precautionary savings and companies striving to repair damaged balance sheets. It would not be a surprise to see the US personal saving rate head back to the double-digit levels of the early 1980s. While the private sector embraces greater financial conservatism, we are witnessing the start of an extraordinary surge in public sector deficits and debt from already high levels. Chart 4A Bad Starting Point For A Surge In The Federal Deficit
A Bad Starting Point For A Surge In The Federal Deficit
A Bad Starting Point For A Surge In The Federal Deficit
Budget deficits automatically rise during recessions because tax receipts drop and spending on unemployment and welfare programs goes up (Chart 4). In the past, the starting point for deficits generally was low before a recession took hold. This time, the federal deficit has breached 5% of GDP when the economy was doing fine. With the current recession set to be deeper than in 2007-09 and fiscal stimulus likely to end up much more than the initial $2 trillion package, the deficit will far exceed the previous post-WWII peak of almost 10% of GDP, reached in fiscal 2009. The ratio of federal debt to GDP will soar past 100% within the next few years, exceeding the peak reached in WWII. A speedy decline in WWII debt burdens was helped by a sharp rebound in economic activity, supported by a powerful combination of demographics (the post-WWII baby boom) and pent-up demand. Real GDP grew at an average annualized pace of 4.3% in both the 1950s and 1960s. Unfortunately, slower population growth means that growth in the next one and two decades will be less than half that pace. At the same time, the federal deficit will be under upward pressure because of the impact of an aging population on healthcare and social security. In other words, restoring order to fiscal finances through normal measures (growth and/or austerity) will be an impossible task. High levels of government debt are perfectly manageable when private sector savings are plentiful, interest rates are negligible, and investors seek the safety of low-risk bonds. Thus, $1 trillion US federal deficits have not prevented Treasury yields from falling to all-time lows. However, such conditions will not last indefinitely. The timing of when bloated budget deficits start to impact markets and thus the economy will partly depend on the actions of the Fed. Monetary Policy: Is There A Limit To What It Can Do? Gone are the days when monetary policy was a rather technical exercise: tweaking the level of interest rates to ensure that money and credit trends delivered the economic growth consistent with low and stable inflation. In the past decade, the old rule book has been discarded with policymakers forced to take ever-more extreme measures to prevent total collapse of the economic and financial system. The 2007-9 downturn was easier to deal with than the current crisis. The primary problem a decade ago was a financial rather than economic seizure. While policymakers had to be creative, the main task was to shore up systemically important financial institutions and inject enough liquidity into the system to restore normal market functioning. And it worked. This time, the issue is an economic not financial seizure and associated liquidity strains are a symptom, not the primary problem. The immediate role of central banks is again to ensure that the financial system continues to function by injecting whatever amounts of liquidity are necessary. But monetary policy cannot directly bail out all the businesses that face bankruptcy or help those that have lost their jobs. That is the role of fiscal policy. What central banks can do is print money to finance the rise in budget deficits. During WWII, the Fed had an agreement with the Treasury Department to peg the level of long-term yields below 2.5% and this arrangement persisted until 1951, long after the war ended. This ensured that a post-war rebound in private credit demand would not cause a spike in interest rates that might short-circuit the recovery. We could well see a similar arrangement in the coming years, though it might be an informal rather than publicized agreement. The key point is that the Fed will be massively biased toward easy policy for many years. The current generation of central bankers have experienced periodic threats of deflation rather than inflation during the past 20 years and that will shape how they perceive the balance of risks going forward. After the Great Depression of the 1930s, fears of deflation lingered well into the 1950s and policymakers’ resulting complacency toward inflation led to the inflation spike of the 1970s. We are at a similar point again. The Fed will remain a massive buyer of Treasury bonds, even as the economy recovers because it will not want to risk higher yields undermining growth. Even if inflation starts to rise, the Fed will justify a continued easy stance on the grounds that inflation has fallen far short of its 2% target for many years. Given the combination of a global blowout in central bank balance sheets and the retreat from globalization, the scene will be set for inflation to surprise on the upside. But this may not occur for several years because the recession will create a lot of spare capacity and deflation is a greater near-term threat than inflation. We have long argued that a sustained upturn in inflation would be preceded by a final bout of deflation. The revival of inflation may be gradual but its insidious nature ultimately will make it more dangerous. It seems inevitable that there will have to be monetization of public sector debt, not only in the US but in other major economies. Once investor confidence returns, the demand for government bonds will recede and yields will be under upward pressure. Financial repression may help contain the rise, but that cannot be a long-term solution. In the end, central banks will be the bond buyers of last resort and ultimately it will have to be written off via making the debt effectively non-maturing. If the economic picture continues to deteriorate could central banks use quantitative easing to start buying assets such as equities and real estate? Current legislation prevents such purchases in the case of the Fed and European Central Bank. Of course, legislation can always be changed but the Fed would be reluctant for Congress to change the Federal Reserve Act. That could open a can of worms including amendments such as requiring regular audits of policy decisions and altering how regional presidents are chosen. But it will not be the Fed’s decision and if things get bad enough then nothing should be ruled out. An Accelerated Move To Virtual Activity? The restrictions on travel and public meetings and the closure of many businesses have forced companies to embrace online ways of conducting operations. And the same applies to schools and universities. In many cases, companies may find that virtual meetings between far-flung offices work rather well. This could cause a major rethink about future spending on business travel. Replacing travel with virtual meetings not only saves on airfares but also frees up employee time and reduces stress. And the improvements in communication technology make virtual meetings almost as good as the real thing. Of course, this is not a great story for airlines. The same arguments can be made for education but are slightly less compelling because of the social dimension. Mixing with friends and peers is one of the big attractions for students and most would be loath to give this up. And for working parents, it is not feasible to have children stuck at home. Nonetheless, at the post-secondary level, there could be a move to more online teaching. Another consequence of the current crisis has been a forced shift to more online shopping. This trend was already well established but is now likely to accelerate. Those retailers who fail to adapt will fall by the wayside. Market Implications As noted at the outset, it is hard to make predictions without knowing how the virus will progress. But we know a few things. First, there is not much scope for bond yields to fall from current levels. Second, equity valuations have improved as a result of the collapse in prices. Third, monetary policy will remain supportive of markets for a long time. On this basis, it is easy to conclude that stocks should beat bonds handsomely over the medium and long term. The short-term picture is cloudier. If the recession is short-lived and economic activity rebounds strongly, then we currently have a good buying opportunity for stocks. But there is no way to make a prediction about this with any conviction. The case for a strong recovery is that policy is massively stimulative and there will be a lot of pent-up demand. The case for a slow and drawn-out recovery is that consumers and businesses will be left with greatly weakened balance sheets and the loss of small businesses and associated jobs could be a lasting problem. A final issue is that fears of another virus wave could weigh on consumer and business confidence. Initially, there will be some extremely strong quarters of growth but beyond that, the odds favor a drawn-out recovery rather than a vigorous one. Faced with such uncertainty, one strategy is to rely on technical indicators rather than economic forecasts as a judge of whether it is safe to rebuild positions in risk assets. This gives some reason for encouragement as measures of sentiment are at depressed extremes, typically seen only at major bottoms. And this is supported by momentum indicators at oversold extremes. However, a word of caution: these indicators make the case for a near-term bounce but say nothing about the durability of any rally. For some time, non-US markets have looked more appealing than Wall Street from a valuation perspective. That remains the case, but there is an important caveat. Thus far, the virus has been more of a problem for the developed countries than emerging ones (China and Iran excepted). It remains to be seen whether Africa, and Latin America and other countries in Asia and the Middle East can avoid a catastrophic spread of the virus. It could potentially be disastrous given the poor infrastructure and lack of government resources in those regions. Moreover, a shift away from globalization is not bullish for the emerging world. Some positions in gold are a good hedge given current uncertainties and the fact that inflation fears will rise long before actual inflation picks up. In normal circumstances, the extraordinary rise in the US budget deficit would be bearish for the US dollar. But other countries are following the same path so in relative terms, the US is no worse off. And there is still no serious competition to the dollar as the global reserve currency. Thus, while the dollar might weaken somewhat, it should not be a major source of risk to US assets. In closing, it is impossible to provide the certainty and high-conviction predictions that investors crave. That makes it rash to make aggressive bets on how things will play out in the economy and markets. At BCA, we favor equities over bonds but advise continued near-term caution. The bottoming process in equities could be volatile and drawn-out. Building positions gradually seems the most sensible strategy. Martin H. Barnes, Senior Vice President Chief Economist mbarnes@bcaresearch.com Footnotes 1 For an estimate of the virus impact on a range of economies, please see the recent OECD report “Evaluating the initial impact of COVID-19 containment measures on economic activity”. Available at: www.oecd.org 2 The report and underlying data are available at www.newyorkfed.org. 3 For example, the retreat from globalization was discussed in our 2015 Outlook report published at the end of 2014.