Global

Highlights The strength in global semiconductor sales in recent months has been due to one-off factors stemming from pandemic-related lockdowns. As the one-off demand surge subsides, global semiconductor sales will decline modestly toward the end of this year. In the near term, global semiconductor stock prices are vulnerable due to overbought conditions, excessive valuations and demand disappointment. The global semiconductor industry is at the epicenter of the US-China confrontation, and more US restrictions on chips sales to China are probable. This is another risk for this sector's share prices. Nevertheless, the structural outlook for global semiconductor demand is constructive. Its CAGR may rise from 3% during 2014-2019 to 5% during 2020-2024. Feature Investor euphoria has taken hold of semiconductor stocks. Global semiconductor stock prices have skyrocketed by 68% from March lows and 96% from December 2018 lows. Meanwhile, global semiconductor sales during March-June rose only by 5% from a year ago. As a result, the ratio of market cap for global semiconductor stocks relative to global semiconductor sales has reached its highest level since at least the inception of data in 2003 (Chart 1). Chart 1Global Semiconductor Sector: Market Cap-To-Sales Ratio Has Surged
Global Semiconductor Sector: Market Cap-To-Sales Ratio Has Surged
Global Semiconductor Sector: Market Cap-To-Sales Ratio Has Surged
With semi equity multiples very elevated, their share prices have become even more sensitive to global semiconductor demand growth. Hence, the focus of this report is to try to gauge the strength of global semiconductor demand, both in the near term and structurally. Near-term semiconductor stock prices could disappoint due to weak chip demand from the smartphone sector and diminishing purchases of personal computers (PCs) and servers. However, structurally, we are positive on global semiconductor demand, which is underpinned by the continuing rollout of 5G networks and phones, a wider adoption of data centers, and further technological advancements in artificial intelligence (AI), cloud computing, edge computing and smaller nodes for chip manufacturing (Box 1). Box 1 Key Technologies Underpinning Potential Global Semiconductor Demand AI refers to the simulation of human intelligence in machines, for example, computers that play chess and self-driving cars. The goals of AI include learning, reasoning and perception. Cloud computing is the delivery of computing services – including servers, storage, databases, networking, software, analytics and intelligence – over the Internet (“the cloud”) to offer faster innovation, flexible resources and economies of scale. Edge computing is a form of distributed computing, which brings computation and data storage closer to where it is needed, to improve response times and save bandwidth. Technology node refers to the width of line that can be processed with a minimum width in the semiconductor manufacturing industry, such as technology nodes of 10 nanometers (nm), 7nm, 5nm and 3nm. The smaller the nodes are, the more advanced they are. Near-Term Headwinds Chart 2World Semiconductor Sales Diverged From The Global Business Cycle
World Semiconductor Sales Diverged From The Global Business Cycle
World Semiconductor Sales Diverged From The Global Business Cycle
Semiconductor demand worldwide grew by 6% year-on-year in the first half of this year. There has been a remarkable divergence between world semiconductor sales and the global business cycle (Chart 2). The divergence between semiconductor sales and economic activity was most striking in the US and China. Semiconductor sales in China rose by 5% year-on-year in Q12020, and in the US they grew by 29% year-on-year in Q22020, despite a contraction in their aggregate demand during the same period. By contrast, Q2 annual growth of semiconductors sales was -2.2% for Japan, -17% for Europe and 1.8% for Asia ex. China and Japan (Chart 3). The reasons why the US and China posted a surge in semiconductor demand while Europe and Japan experienced a contraction in domestic semiconductor sales are as follows: Most data center investment is occurring in the US and China. Chart 4 shows that 40% of global hyperscale data centers are operating in the US, much larger than any other countries/regions. China, in turn, ranked second, with a global share of 8%. Chart 3Strong Semiconductor Sales In The US And China, But Not Elsewhere
Strong Semiconductor Sales In The US And China, But Not Elsewhere
Strong Semiconductor Sales In The US And China, But Not Elsewhere
Chart 4The US Has The Most Global Hyperscale Data Centers
Global Semiconductor Stocks: A Hiatus Is Overdue In A Structural Bull Market
Global Semiconductor Stocks: A Hiatus Is Overdue In A Structural Bull Market
Demand contraction in Europe and Japan is due to semiconductor demand in these regions mainly originating from the automobile sector, where production was severely hit by the global pandemic. About 37% of European semiconductor sales were from last year’s automotive market. We believe the divergence between global economic activity and semiconductor sales, as demonstrated by Chart 2 on page 3, has been due to one-off factors, as the global pandemic lockdowns have spurred semiconductor demand. Such a one-off demand boost will likely dissipate in the coming months. Traditional PCs and tablets: There has been a surge in demand for traditional PCs1 and tablets in the past six months. This was due to the significant increase in online activities, such as working from home, education, e-commerce, gaming and entertainment. Data from the International Data Corporation (IDC) has revealed that shipments of traditional PCs and tablets in volume terms had a strong year-on-year growth of 11.2% and 18.6%, respectively, in the period of April-June (Chart 5). Looking forward, even renewed lockdowns will not lead to a similar rush to buy these products. Many households are already equipped to work from home and for other online activities. With many countries gradually opening their economies, such demand will diminish. The traditional PC and tablet sectors together account for about 13% of global chip demand (Chart 6). Chart 5Personal Computers Sales Have Surged Amid Lockdowns
Personal Computers Sales Have Surged Amid Lockdowns
Personal Computers Sales Have Surged Amid Lockdowns
Chart 6The Breakdown Of Global Semiconductor Sales By Type Of Usage
Global Semiconductor Stocks: A Hiatus Is Overdue In A Structural Bull Market
Global Semiconductor Stocks: A Hiatus Is Overdue In A Structural Bull Market
Chart 7Server Sales Have Surged Amid Lockdowns
Server Sales Have Surged Amid Lockdowns
Server Sales Have Surged Amid Lockdowns
Server demand: Another major semiconductor demand contribution in Q2020 was from the server sector, which spiked by 21% year-on-year (Chart 7). The surge in online activities triggered a strong demand for cloud services and remote work applications, both of which require computer servers to run on. However, demand from the server sector is also set to diminish in 2H2020 and Q1 2021. Provided the inventories at major data center operators, including Microsoft, Google and Amazon, remain at high levels,2 global cloud service providers will likely reduce their orders of servers next quarter.3 Enterprises will also likely cut their investment in computer servers in 2H2020, as many of them had already increased their purchases of servers to prepare employees and business processes for remote working. We expect global server demand growth to soften in 2H2020. The Digitimes Research forecasted a 5.6% quarter-on-quarter contraction in 3Q2020 and a further cut in global sever shipment in the 4Q2020.2 The global server sector accounts for about 10% of global chip demand and, together with PCs and tablets, they make for 23% (please refer to Chart 6 on page 5). Further, the smartphone sector – accounting for 27% of global semiconductor demand – will continue struggling in H2 this year. The global total smartphone demand has been hit severely, as households delayed their new smartphone purchases. According to Canalys’ data, global smartphone shipments dropped by 13% and 14% year-on-year in Q1 and Q2, respectively. The strength in global semiconductor sales in recent months has been due to one-off factors stemming from the lockdowns. Chart 8Global Smartphone Shipments Will Likely Remain Weak In 2020H2
Global Smartphone Shipments Will Likely Remain Weak In 2020H2
Global Smartphone Shipments Will Likely Remain Weak In 2020H2
We expect smartphone shipments to continue contracting over the next three-to-six months (Chart 8). We believe global consumers will remain cautious in their spending on discretionary goods, such as smartphones, due to lowered incomes and increased job uncertainty. The IDC also forecasted that global smartphone shipments would not grow until 1Q2021.4 The Chinese smartphone sales showed a considerable weakness in July, with a 35% year-on-year contraction, which is much deeper than the 20% decline in H1 this year. 5G smartphone shipments also slowed last month, with a 21% drop from the previous month. Bottom Line: The strength in global semiconductor sales in recent months has been due to one-off factors stemming from the lockdowns. As this one-off demand subsides, global semiconductor sales will decline modestly toward the end of this year. Given the overbought conditions and the elevated equity valuations, global semiconductor stocks are currently vulnerable to near-term disappointments in semiconductor demand. At The Epicenter Of The US-China Rivalry Semiconductors are at the epicenter of the US-China confrontation. Ultimately, the US-China contention is about future technological dominance. That is access to technology and the capability to develop new technologies. The global semiconductor industry is at the epicenter of the US-China confrontation. China currently accounts for about 35% of the global semiconductor demand. US restrictions on semi producers worldwide to supply semiconductors to Chinese buyers constitute a major risk to semiconductor stock prices. On August 17, the US announced fresh sanctions that restrict all US and foreign semiconductor companies from selling chips developed or produced using US software or technology to Huawei, without first obtaining a license. In May, the US had already limited companies, such as the Taiwan Semiconductor Manufacturing Company (TSMC), from making and supplying Huawei with its self-designed chips. In addition, the US recently threatened bans on Chinese-owned apps TikTok and WeChat, and signaled that it could soon restrict Alibaba’s operations in the US. Chart 9Global Semi Companies' Sales To China Are Substantial
Global Semiconductor Stocks: A Hiatus Is Overdue In A Structural Bull Market
Global Semiconductor Stocks: A Hiatus Is Overdue In A Structural Bull Market
The global semiconductor sector is highly vulnerable to further escalation in the tension between these two superpowers. Major global semiconductor companies’ sales are heavily exposed to China, and their revenue from China ranges from 16% to 50% of total (Chart 9). We have been puzzled why global semi share prices have been rallying in spite of US limitations on semiconductor shipments to Huawei and its affiliated entities. One explanation could be that the Chinese companies that are not affiliated with Huawei are able to import semiconductors and then supply them to Huawei. If this is true, the US will have no other choice but to limit all semiconductor sales to China. This will be devastating for global semi producers given their large exposure to China. In anticipation of US punitive policies limiting its access to semiconductors, China had boosted its semiconductor imports over the past 12 months (Chart 10, top panel). Chinese imports of integrated circuits rose by 12% year-on-year in 1H2020, which is much higher than the 5% year-on-year increase in Chinese semiconductor demand during the same period (Chart 10, bottom panel). This gap suggests the country had restocked its semiconductor inventories. China has particularly restocked its imports of non-memory chips with imports of processor & controller and other non-memory chips in H1, surging by 30% and 20%, respectively, in US dollar terms (Chart 11). For memory chips, the contraction in Chinese imports was mainly due to a decline in global memory chip prices. Chart 10China Had Likely Restocked Its Semi Inventories
China Had Likely Restocked Its Semi Inventories
China Had Likely Restocked Its Semi Inventories
Chart 11Strong Chinese Imports In Non-Memory Chips
Strong Chinese Imports In Non-Memory Chips
Strong Chinese Imports In Non-Memory Chips
Bottom Line: The global semiconductor industry is at the epicenter of the US-China confrontation, and more restrictions on sales to China are probable. In turn, the restocked semiconductor inventory in China raises the odds of weakening mainland semiconductor import demand in H2 of this year. Structural Tailwinds Table 1Global Semiconductor Demand CAGR Forecast Over 2020-2024 By Device
Global Semiconductor Stocks: A Hiatus Is Overdue In A Structural Bull Market
Global Semiconductor Stocks: A Hiatus Is Overdue In A Structural Bull Market
We are optimistic on structural global semiconductor demand. Its nominal CAGR may rise from 3% during 2014-2019 to 5% during 2020-2024 in US dollar terms. Table 1 shows our demand growth forecasts for global chips in the main consuming sectors over the next five years. The major contributing sectors during 2020-2024 will be 5G smartphones, servers, industrials, electronics and automotive manufacturing. The underlying driving forces are the continuing rollout of 5G networks and phones, the development of data centers, and further technological advancements in AI, cloud computing and edge computing. Currently, the world is still in the early stages of 5G network development. AI, cloud computing and edge computing are constantly evolving. With increasing adoption of 5G smartphones, computer servers and IoT devices, global semiconductor demand is in a structural uptrend (Box 2). Box 2 Key Components For The Virtual World In Development Data centers and cloud computing allow data to be stored and applications to be running off-premises and to be accessed remotely through the internet. Edge computing allows data from Internet of things (IoT) devices to be analyzed at the edge of the network before being sent to a data center or cloud. IoT devices contain sensors and mini-computer processors that act on the data collected by the sensors via machine learning. The IoT is a growing system of billions of devices — or things — worldwide that connect to the internet and to each other through wireless networks. AI technology empowers cloud computing, edge computing and IoT devices. 5G is at the heart of the IoT industry transformation, making a world of everything connected possible. 5G Smartphone Currently, China is the world’s largest 5G-smartphone consumer and the leading 5G-adopter in the world. According to Digitimes Research, global 5G smartphone shipments will reach over 250 million units in 2020, with 170 million (68%) in China and only 80 million units in the world ex. China. Looking forward, 5G smartphone shipments are set to accelerate worldwide over the coming years. Chart 125G Phone Shipments In China Will Continue To Rise
5G Phone Shipments In China Will Continue To Rise
5G Phone Shipments In China Will Continue To Rise
The 5G phone shipments in China will continue to rise. The 5G phone sales penetration rate in China is likely to rise from 60% in July to 95% by the end of 2022. In such a case, we estimate that the monthly Chinese 5G phone shipments will increase from the current 16 million units to about 25-30 million units in 2022 (Chart 12). In the rest of the world, the 5G smartphone adoption pace will also likely speed up over the next five years. The 5G phone selling prices in the world outside China will drop, as more models are introduced and become more affordable. 5G smartphone prices have already fallen in China and will inevitably fall elsewhere. Chinese 5G smartphone producers will ship their low-priced 5G phones overseas, putting pressure on other producers to lower their prices. The 5G infrastructure development is accelerating in China and will accelerate in the rest of the world. Both China and South Korea have been very aggressive in their respective 5G network development. As of the end of June, China's top three carriers: China Mobile, China Unicom, and China Telecom – which together serve more than 1.6 billion mobile users in the country – had installed 400,000 5G base stations against an annual target of 500,000. In comparison, as of April 2020, American carriers had only put up about 10,000 5G base stations.5 As the US is competing with China on the 5G front, the country will likely boost its investment in 5G network development aggressively over the next five years in order to catch up to, or even exceed, China. Importantly, the 5G smartphone has more silicon content than 4G smartphones. More silicon content means higher semiconductor value. Rising 5G smartphone sales and higher silicon content together will more than offset the loss in semiconductor sales due to falling global 4G smartphone shipments. Based on our analysis, we expect a CAGR growth of 4% in semiconductor demand from the global smartphone sector over the next five years, slightly lower than the 5% in previous five years (Table 1 on page 10). This also takes into consideration that the 5G network will be more difficult and more expensive to develop than the 4G network. Servers Global server shipment growth will be highly dependent on both the pace and the scale of data center development (Box 3). Data centers account for over 60% of global server demand. The future growth of data centers is promising. The global trend of data localization6 due to the concerns of data privacy and national security will also bolster a boom of data centers over the next five years. A growing number of countries are adopting data localization requirements, such as China, Russia, Indonesia, Nigeria, Vietnam and some EU countries. While the Chinese data center market is expected to expand by a CAGR of about 28% over 2020-2022,7 a report recently released by Technavio forecasted the global data center industry’s CAGR at over 17% during 2019-2023. We forecast that the global semiconductor demand from servers will grow at a CAGR of 12% over 2020-2024. Box 3 Data Centers There are four main types of data centers – enterprise data centers, managed services data centers, colocation data centers, and cloud data centers. Data centers can have a wide range of number of servers. Corporate data centers tend to have either 200 (small companies), or 1000 servers (large companies). In comparison, a hyperscale data center usually has a minimum of 5,000 servers linked with an ultra-high speed, high fiber count network. Outsourcing and a move towards the cloud are driving the growth of the hyperscale data center. Instead of companies investing in physical hardware, they can rent server space from a cloud provider to both save their data and reduce costs. Amazon, Microsoft, Google, Apple and Alibaba are all top global cloud service providers. The more hyperscales to be built up, the higher the demand for servers. In 2019, about 13% of the total number of data centers in China were of the hyperscale and large-scale varieties. The plan of new infrastructure development announced earlier this year by Beijing was aiming to increase the number of hyperscale and large-scale data centers in China. Among current data centers either under construction or to be developed in the near future, 36% of them are hyperscale and large-scale data centers. IoTs Technological advancements in AI, cloud computing and edge computing, in combination with 5G network development, will facilitate the IoTs adoption. According to the GSMA,8 46 operators in 24 markets had launched commercially available 5G networks by 30 January 2020. It forecasted that global IoT connections will be increased from 12 billion mobile devices in 2019 to 25 billion in 2025 with a CAGR at 13%.9 IoTs chips include the Artificial Intelligence of Things (AIoT) – a powerful convergence of AI and the IoT. IoTs is an interconnected network of physical devices. Every device in the IoT is capable of collecting and transferring data through the network. Looking forward, global demand of AI chips and IoT chips will have significant potential to grow with creation of “smarter manufacturing”, “smarter buildings”, “smarter cities”, etc. AI applications can be used in manufacturing processes to render them smarter and more automated. Productivity will be enhanced as machines achieve significantly improved uptime while also reducing labor costs. There are plenty of upsides in industrial semiconductor demand (Chart 13). We expect the CAGR of industrial electronics to increase from 3.4% during 2014-2019 to 8% during 2020-2024. AI applications can create smart buildings by increasing connectivity across enterprise assets, enabling home network infrastructure (e.g., routers and extenders) and employing home-security devices (e.g., cameras, alarms and locks). AI applications can be used to create smart cities. A smart city is an urban area that uses different types of IoT electronic sensors to collect data. Insights gained from that data are used to manage assets, resources and services efficiently; in return, that data is used improve operations across the city. China has already developed about 750 trial sites of smart cities with different degrees of smartness in the past decade. As AI and 5G technology advances, the existing smart cities’ “smartness” will be upgraded and new trial smart cities will be implemented. Based on IDC data, China’s investment in smart cities will rise at a CAGR of 13.5% over 2020-2023 (Chart 14). Globally, the U.S., Japan, European countries and other nations are also actively developing smart cities. According to a new study conducted by Grand View Research, the global smart cities market size is expected to grow at a CAGR of 24.7% from 2020 to 2027.10 Chart 13Plenty Of Upside In Industrial Semiconductor Demand
Plenty Of Upside In Industrial Semiconductor Demand
Plenty Of Upside In Industrial Semiconductor Demand
Chart 14China’s Investment In Smart Cities Will Continue To Grow
Global Semiconductor Stocks: A Hiatus Is Overdue In A Structural Bull Market
Global Semiconductor Stocks: A Hiatus Is Overdue In A Structural Bull Market
Automotive We expect the global automotive chip market to grow at a CAGR of 9% during 2020-2024, as in 2014-2019. The increase in consumption of semiconductors by the auto industry will continue to be driven by the market evolution toward autonomous, connected, electric and shared mobility. Most new vehicles now include some level of advanced driver assist systems (ADAS), such as adaptive cruise control, automatic brakes, blind spot monitoring, and parallel parking. The whole industry is progressing toward fully autonomous vehicles in the coming years. Increasing adoption of automotive chips and recovering car sales will revive automotive chip sales. In addition, rising penetration of new energy vehicles (NEVs) is beneficial to semiconductor sales, as NEVs contain higher semiconductor content than conventional vehicles. Conventional vehicles contain an average of a $330 value of semiconductor content while hybrid electric vehicles can contain up to $1,000 and $3,500 worth of semiconductors.11 Regarding other sectors, we are also positive on structural demand of storage and consumer electronics. AI applications generate vast volumes of data—about 80 exabytes per year, which is expected to increase by about tenfold to 845 exabytes by 2025.12 In addition, developers are now using more data in AI and deep learning (DL) training, which also increases storage requirements. With massive potential demand for storage, we estimate a CAGR of 7% over 2020-2024 (Table 1 on page 10). A recent report from ABI Research predicts that the COVID-19 pandemic will increase global sales of wearables (such as a Fitbit or Apple Watch) by 29% to 30 million shipments of the devices this year. With contribution from wearables, we expect global semiconductor demand from the consumer sector to grow at a CAGR of 3% over 2020-2024, the same rate as in the previous five years. Bottom Line: Continuing rollout of 5G networks and phones, development of data centers, and further technological advancements in AI and cloud computing will provide tailwinds to structural global semiconductor demand, accelerating its CAGR growth from 3% during 2014-2019 to 5% during 2020-2024. Valuations And Investment Conclusions Most global semiconductor stocks are currently over-hyped. Critically, both DRAM and NAND prices have been deflating since January, reflecting weak demand for memory chips. Yet, share prices of memory producers have rallied (Chart 15). Overall, global semiconductor stock prices have diverged from their sales and profits. Overall, global semiconductor stock prices have diverged from their sales and profits (Chart 16). Chart 15Falling Memory Prices Pose Risk To Memory Stocks
Falling Memory Prices Pose Risk To Memory Stocks
Falling Memory Prices Pose Risk To Memory Stocks
Chart 16Global Semiconductor Stocks Have Deviated From Profits
Global Semiconductor Stocks Have Deviated From Its Profits
Global Semiconductor Stocks Have Deviated From Its Profits
Consequently, the multiples of semiconductor stocks have spiked to multi-year highs (Chart 17). Even after adjusting for negative US real bond yields, valuations of semiconductor stocks are not cheap. Chart 18 illustrates the equity risk premium for global semiconductor stocks is at the lower end of its range of the past 10 years. The ERP is calculated as forward earnings yield minus 10-year US TIPS yields. It is impossible to time a correction or know what the trigger would be (US-China tensions have been our best guess). Nevertheless, we do not recommend chasing semiconductor stocks higher due to their overstretched technicals and valuations on the one hand and potential weakening demand in H2 on the other. Chart 17Global Semiconductor Stocks: Elevated Valuations
Global Semiconductor Stocks: Elevated Valuations
Global Semiconductor Stocks: Elevated Valuations
Chart 18Equity Risk Premium For Global Semi Stocks Is Historically Low
Equity Risk Premium For Global Semi Stocks Is Historically Low
Equity Risk Premium For Global Semi Stocks Is Historically Low
In addition, the ratio of global semi equipment stock prices relative to the semi equity index correlates with absolute share prices of global semi companies. This is because equipment producers are higher-beta as they outperform during growth accelerations and underperform during growth slumps. The basis is that semi manufacturers have to purchase equipment if there is actual strong demand coming up and vice versa. The recent underperformance by global semi equipment stocks relative to the semi equity index might be an early sign of a potential reversal in semi share prices in absolute terms (Chart 19). Chart 19A Signal Of A Potential Reversal In Semi Share Prices
A Signal Of A Potential Reversal In Semi Share Prices
A Signal Of A Potential Reversal In Semi Share Prices
Meanwhile, we believe the subsector- memory chip stocks - will outperform the overall semiconductor index amidst the potential correction, because they have lagged and are less over-extended. Finally, we remain neutral on Taiwanese and Korean bourses within the EM equity space for now. Escalation in US-China confrontation, as well as their exposure to semiconductors, put these bourses at near-term risk. That said, we are reluctant to underweight these markets because fundamentals in EM outside North Asia remain challenging. Ellen JingYuan He Associate Vice President ellenj@bcaresearch.com Footnotes 1Traditional PCs are comprised of desktops, notebooks, and workstations. 2Global server shipments to contract 5.6% sequentially in 3Q2020, says Digitimes Research 3Global server shipments forecast to increase by 5% this year: TrendForce 4IDC Expects Worldwide Smartphone Shipments to Plummet 11.9% in 2020 Fueled by Ongoing COVID-19 Challenges 5America does not want China to dominate 5G mobile networks 6“Data localization” can be defined as the act of storing data on a device that is physically located within the country where the data was created. Data localization requirements are governmental obligations that explicitly mandate local storage of personal information or strongly encourage local storage through data protection laws that erect stringent legal compliance obligations on cross-border data transfers. 7The big data center industry ushered in another outbreak 8The GSMA represents the interests of mobile operators worldwide, uniting more than 750 operators with almost 400 companies in the broader mobile ecosystem, including handset and device makers, software companies, equipment providers and internet companies, as well as organizations in adjacent industry sectors. 9GSMA: 5G Moves from Hype to Reality – but 4G Still King 10Smart Cities Market Size Worth $463.9 billion By 2027 11The Automotive Semiconductor Market – Key Determinants of U.S. Firm Competitiveness 12AI is data Pac-Man. Winning requires a flashy new storage strategy.
BCA Research's Global Fixed Income Strategy service concludes the easy part of the liquidity-driven rally in credit is over. More gains are to come but investors will need to be more selective. We have described the Fed’s corporate bond-buying programs as…
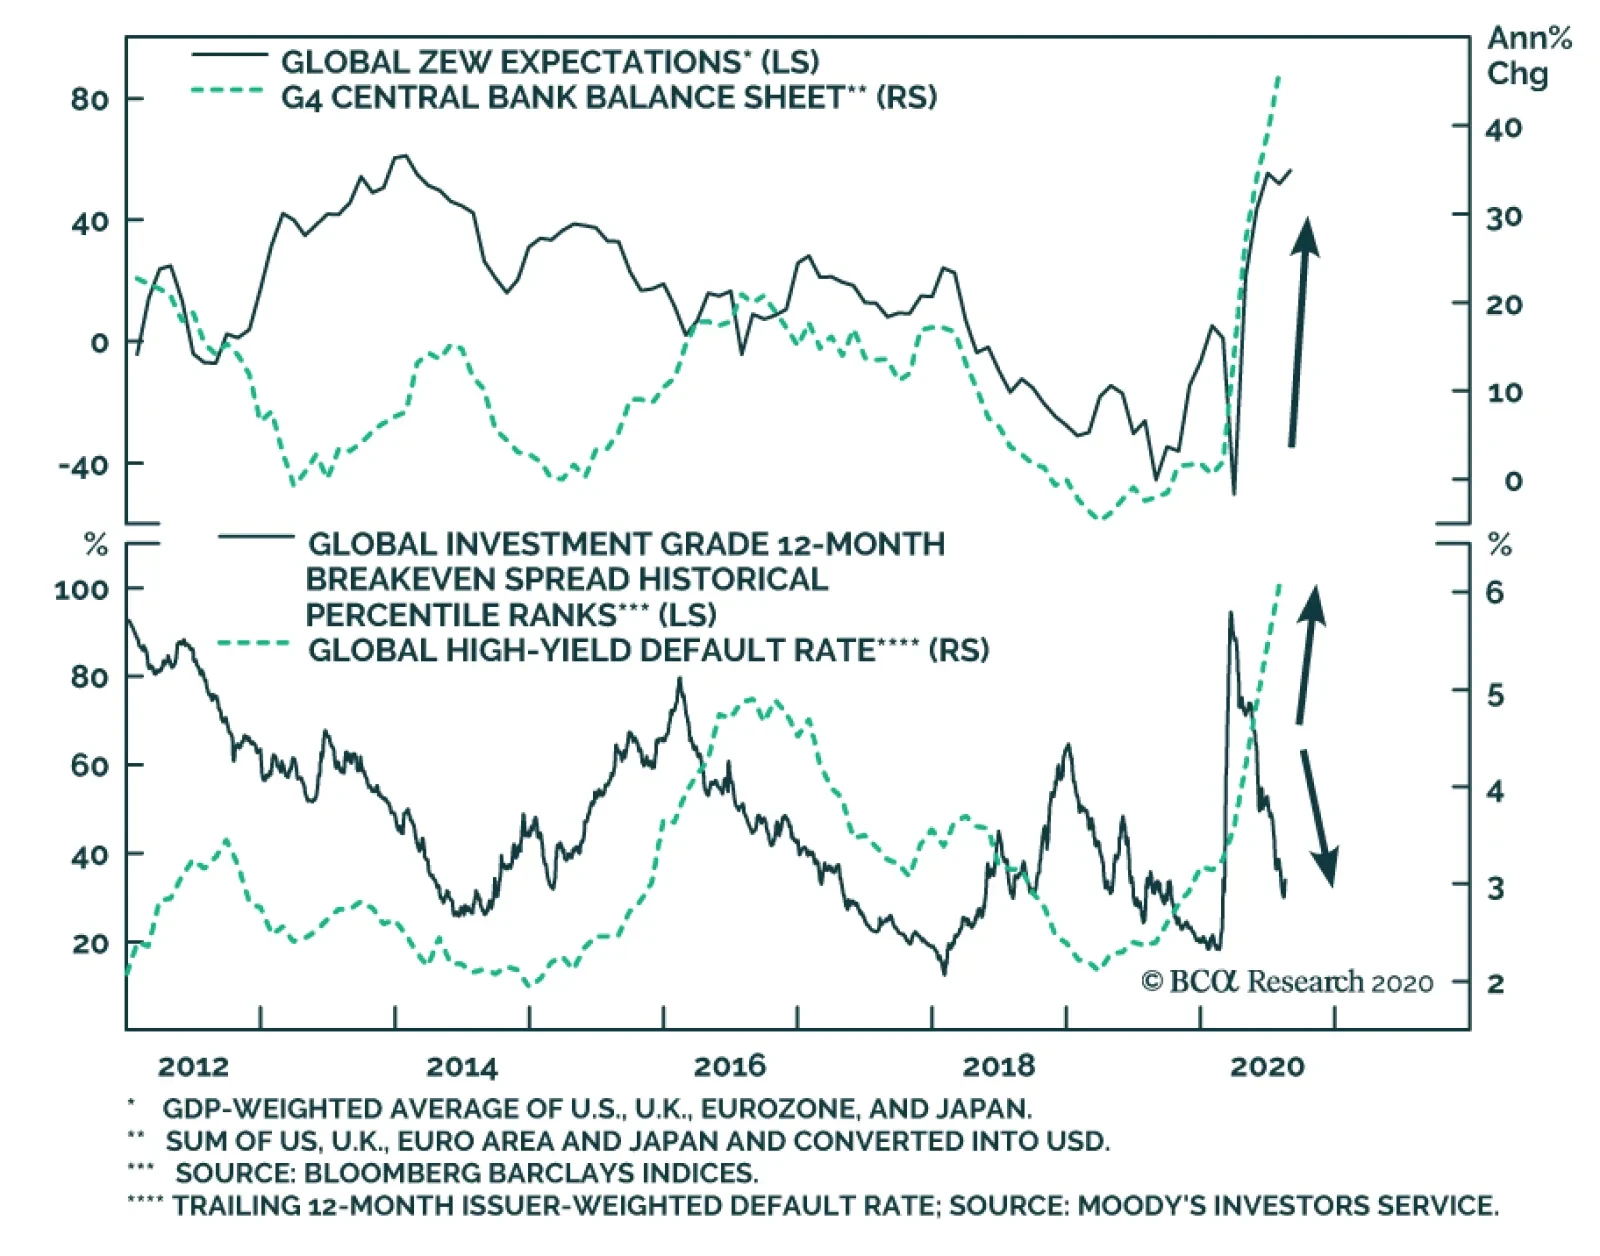
Highlights Global Credit Spreads: The relentless rally in global credit markets since the rout in February and March has driven corporate spreads to near pre-pandemic lows in the US, Europe and even emerging markets. Central bank liquidity is dominating uncertainties over the coronavirus and US politics. Credit Strategy: Valuations now look far less compelling in US investment grade corporates, even with the Fed backstop. EM USD-denominated corporates offer better value versus US equivalents. High-yield spreads offer mixed signals in both the US and Europe: historically attractive breakeven spreads that offer no compensation for likely default losses over the next 6-12 months. Remain neutral US junk and underweight euro area junk, favoring Ba-rated names in both. Feature Chart of the WeekA Pandemic? Credit Markets Are Not Concerned
A Pandemic? Credit Markets Are Not Concerned
A Pandemic? Credit Markets Are Not Concerned
Global credit markets have enjoyed a spectacular recovery from the carnage seen just five months ago when investors realized the magnitude of the COVID-19 shock. The option-adjusted spread (OAS) on the Bloomberg Barclays Global Investment Grade Corporate index has tightened from the 2020 high of 326bps to 130bps, while the OAS on the Global High-Yield index has narrowed from the 2020 high of 1192bps to 556bps. Unsurprisingly, those spread peaks both occurred on the same day: March 23, the day the US Federal Reserve announced their corporate bond buying programs. We have described the Fed’s actions as effectively removing the “left tail risk” of investing in credit, and not just in the US, by introducing a central bank liquidity backstop to the US corporate bond market. The backdrop for global credit markets, on the surface, seems typical for sustained spread compression (Chart of the Week). Economic optimism is buoyant, with the global ZEW expectations index now at the highest level since 2014. Monetary conditions are highly supportive, with near-0% policy rates across all developed economies and the balance sheets of the Fed, ECB, Bank of Japan and Bank of England growing at a combined year-over-year pace of 46%. Credit markets seem to be signaling boom times ahead, ignoring the pesky details of an ongoing global pandemic and election-year political uncertainty in the US. Credit markets seem to be signaling boom times ahead, ignoring the pesky details of an ongoing global pandemic and election-year political uncertainty in the US. The next moves in credit will be more challenging and less rewarding than the past five months. Investment grade corporate credit spreads no longer offer compelling value in most developed economies, while high-yield spreads are tightening in the face of rising default rates in the US and Europe. While additional spread tightening is not out of the question in these markets, investors should consider rotating into credit sectors that still offer some relative value – like emerging market (EM) hard currency corporates. A World Tour Of Our Spread Valuation Indicators The sharp fall in global bond yields over the past several months has not just been confined to government debt. Yields have fallen toward, and even below, pre-virus lows for a variety of sectors ranging from US mortgage-backed securities (MBS) to EM USD-denominated sovereign debt (Chart 2). Investors are clearly reaching for yield in the current environment of tiny risk-free government bond yields, with no greater sign of this than the recent new issue by a US sub-investment grade borrower of a 10-year bond with a coupon below 3%.1 The drop in credit yields has also occurred alongside tightening credit risk premiums, although spreads remain above the pre-virus lows for most sectors in the US, Europe and EM (Chart 3). The degree of correlation across global credit markets has been intense, with very little differentiation between countries. Investment grade corporate spreads in the US, UK and euro area are all closing in on 100bps; high-yield spreads in those same regions are all around 500bps. Chart 2Global Credit Yields Are Low
Global Credit Yields Are Low
Global Credit Yields Are Low
Chart 3Global Credit Spreads Are Getting Tight
Global Credit Spreads Are Getting Tight
Global Credit Spreads Are Getting Tight
Last week, we introduced the concept of “yield chasing” to describe how the ranking of returns in developed market government bonds was becoming increasingly correlated to the ranking of outright yield levels.2 We have seen a similar dynamic unfold in global credit markets, especially since that peak in spreads in late March. In Chart 4 and Chart 5, we present the relationship between starting benchmark index yields, and the subsequent excess returns over risk-free government bonds, for a variety of developed market and EM credit products. The first chart covers the time from start of 2020 to the March 23 peak in spreads, while the second chart shows the relationship since then. The two charts are mirror images of each other. Chart 4Starting Yields & Subsequent Global Credit Excess Returns In 2020 (January 1 To March 20)
What Next For Global Corporate Credit Spreads?
What Next For Global Corporate Credit Spreads?
Chart 5Starting Yields & Subsequent Global Credit Excess Returns In 2020 (Since March 23)
What Next For Global Corporate Credit Spreads?
What Next For Global Corporate Credit Spreads?
The worst performing markets in the first three months of the year were those with the highest yield to begin 2020: high-yield corporates in the US and Europe along with EM credit, which have been the best performing markets since late March. The opposite is true for lower yielders like investment grade credit in Japan, the euro area and Australia, which were among the top performers before March 23 and have lagged sharply since then. While there appears to be “yield chasing” going on in credit markets, much of the spread tightening over the past five months has been a reflection of reduced market volatility that justify lower risk premiums. Chart 6Lower Vol = Lower Credit Risk Premia
Lower Vol = Lower Credit Risk Premia
Lower Vol = Lower Credit Risk Premia
While there appears to be “yield chasing” going on in credit markets, much of the spread tightening over the past five months has been a reflection of reduced market volatility that justify lower risk premiums. Measures of bond volatility like the MOVE index of US Treasury options prices have declined to pre-pandemic lows, while the VIX index of US equity volatility is now down to 22 from the 2020 peak around 80 (Chart 6). The excess return volatility of US corporate bond markets has followed suit, thus allowing for lower US credit spreads. Even allowing for the lower levels of overall market volatility, corporate credit spreads do look relatively tight in the US and Europe. The ratio of the US investment grade index OAS to the VIX is now one standard deviation below the median since 2000 (Chart 7). A similar reading exists for the ratio of the US high-yield index OAS to the VIX, which is also one standard deviation below the long-run average (bottom panel). In the euro area, the ratios of investment grade and high-yield OAS to European equity volatility, the VStoxx index, are not as stretched as in the US, but remain below long-run median levels (Chart 8). Chart 7Very Tight US Corporate Credit Spreads Relative To Equity Vol
Very Tight US Corporate Credit Spreads Relative To Equity Vol
Very Tight US Corporate Credit Spreads Relative To Equity Vol
Chart 8Tight Euro Area Corporate Credit Spreads Relative To Equity Vol
Tight Euro Area Corporate Credit Spreads Relative To Equity Vol
Tight Euro Area Corporate Credit Spreads Relative To Equity Vol
While these simple comparisons of spread to market volatility suggest that corporate credit spreads are tight in most major markets, other indicators paint a more nuanced picture of cross-market valuations. Our preferred measure of the attractiveness of credit spreads is the 12-month breakeven spread. That measures the amount of spread widening that must occur over a one-year horizon for a credit product to have the same return as government bonds. In other words, how much must spreads increase to eliminate the carry advantage of a credit product over a risk-free bond, after accounting for the volatility of that product. We compare those 12-month breakeven spreads with their own history in a percentile ranking, which determines the attractiveness of spreads. While the valuations for US investment grade credit look the least compelling among those three main regions, the power of the Fed liquidity backstop will continue to put downward pressure on spreads. A look at breakeven spread percentile rankings for the major credit groupings in the US (Chart 9), euro area (Chart 10) and EM (Chart 11) shows more diverging spread valuations. Chart 9US Corporate Bond Breakeven Spread Percentile Rankings
US Corporate Bond Breakeven Spread Percentile Rankings
US Corporate Bond Breakeven Spread Percentile Rankings
Chart 10Euro Area Corporate Bond Breakeven Spread Percentile Rankings
Euro Area Corporate Bond Breakeven Spread Percentile Rankings
Euro Area Corporate Bond Breakeven Spread Percentile Rankings
Chart 11EM USD Credit Breakeven Spread Percentile Rankings
EM USD Credit Breakeven Spread Percentile Rankings
EM USD Credit Breakeven Spread Percentile Rankings
The US investment grade breakeven spread is just below the 25th percentile of their long-run history, although the high-yield breakeven spread remains in the top quartile of its history. Euro area breakeven spreads are “fairly” valued, both sitting around the 50th percentile. The EM USD-denominated sovereign breakeven spread is in the third quartile below the 50th percentile, while the EM USD-denominated corporate breakeven spread looks better, sitting just at the 75th percentile. While the valuations for US investment grade credit look the least compelling among those three main regions, the power of the Fed liquidity backstop will continue to put downward pressure on spreads. We would not be surprised to see US investment grade spreads tighten back to the previous cyclical low at some point in the next 6-12 months. There are more compelling opportunities in other global credit markets, however, especially on a risk-adjusted basis. The only investment grade sectors that have attractive breakeven spreads are in Japan, Canada and, most interestingly, EM. Bottom Line: The relentless rally in global credit markets since the out in February and March has driven credit spreads to near pre-pandemic lows in the US, Europe and even emerging markets. Central bank liquidity is dominating uncertainties over the virus and US politics. Spread valuations are looking more stretched, but “yield chasing” and “spread chasing” behavior will remain dominant with central banks encouraging risk-seeking behavior with easy money policies. Putting It All Together: Recommended Allocations One way to look at the relative attractiveness of global spread product sectors is to compare them all by 12-month breakeven spread percentile rankings. We show that in Chart 12, not just for the overall credit indices by country but also among credit tiers within each country. Sectors rated below investment grade are in red to differentiate from higher-quality markets. Chart 12Global Corporate Bond Breakeven Spreads, Ordered By Percentile Ranks
What Next For Global Corporate Credit Spreads?
What Next For Global Corporate Credit Spreads?
The main conclusion form the chart is that there is a lot of red on the left side and none on the right side. That means junk bonds in the US and Europe have relatively high breakeven spreads, while investment grade credit in most countries have relatively lower breakeven spreads. The only investment grade sectors that have attractive breakeven spreads are in Japan, Canada and, most interestingly, EM. To further refine the cross-country comparisons, we must look at those breakeven spreads relative to the riskiness of each sector. In Chart 13, we present a scatter graph plotting the 12-month breakeven spreads versus our preferred measure of credit risk, duration-times-spread (DTS), for all developed market corporate credit tiers, as well as EM USD-denominated sovereign and corporate debt. The shaded region represents all values within +/- one standard error of the fitted regression line. Thus, sectors below that shaded region have breakeven spreads that are low relative to its DTS, suggesting a poor valuation/risk tradeoff. The opposite is true for sectors above the shaded region. Chart 13Comparing Value (Breakeven Spreads) With Risk (Duration Times Spread)
What Next For Global Corporate Credit Spreads?
What Next For Global Corporate Credit Spreads?
The sectors that stand out as most attractive in this framework are B-rated and Caa-rated US high-yield, and EM USD-denominated investment grade corporates. The least attractive sectors are US investment grade corporates, for both the overall index and the Baa-rated credit tier. While those US high-yield valuations suggest overweighting allocations to the lower credit tiers, we remain reluctant to make such a recommendation. Looking beyond the spread and volatility measures presented in this report, we must consider the default risk of high-yield bonds. Our preferred measure of valuation that incorporates default risk is the default-adjusted spread, which measures the current high-yield index spread net of default losses. While those US high-yield valuations suggest overweighting allocations to the lower credit tiers, we remain reluctant to make such a recommendation. The current US high-yield default-adjusted spread is now well below its long-run average (Chart 14). We expect a peak US default rate over the next year between 10-12% (levels seen after past US recessions) and a recovery rate given default between 20-25% (slightly below previous post-recession levels). That combination would mean that expected default loses from the COVID-19 recession could exceed the current level of the US high-yield index spread by as much as 400bps (see the bottom right of the chart). Given that risk of default losses overwhelming the attractiveness of US high-yield as measured by the 12-month breakeven spread, we prefer to stay up in quality by focusing on Ba-rated names within an overall neutral allocation to US junk bonds. For euro area high-yield, where default-adjusted spreads are also projected to be negative next year but with less attractive 12-month breakeven spreads, we recommend a cautious up-in-quality allocation to Ba-rated names only but within an overall underweight allocation. After ruling out increasing allocations to US B-rated and Caa-rated high-yield, that leaves the two remaining valuation outliers from Chart 13 - US investment grade and EM USD-denominated investment grade corporates. The gap between the index OAS of the two has narrowed from the March peak of 446bps to the latest reading of 259bps (Chart 15). We believe that gap can narrow further towards 200bps, especially given the supportive EM backdrop of USD weakness and China policy stimulus – both factors that were in place during the last sustained period of EM corporate bond outperformance in 2016-17. Chart 14No Cushion Against Credit Losses For US & Euro Area HY
No Cushion Against Credit Losses For US & Euro Area HY
No Cushion Against Credit Losses For US & Euro Area HY
Chart 15EM IG Corporates Remain Attractive Vs US IG
EM IG Corporates Remain Attractive Vs US IG
EM IG Corporates Remain Attractive Vs US IG
We upgraded our recommended allocation to EM USD-denominated credit out of US investment grade back in mid-July, and we continue to view that as the most attractive relative value opportunity in global spread product on a risk/reward basis. Bottom Line: Valuations now look far less compelling in US investment grade corporates, even with the Fed backstop. EM USD-denominated corporates offer better value versus US equivalents. High-yield spreads offer mixed signals in both the US and Europe: historically attractive breakeven spreads that offer no compensation for likely default losses over the next 6-12 months. Remain neutral US junk and underweight euro area junk, favoring Ba-rated names in both. Robert Robis, CFA Chief Fixed Income Strategist rrobis@bcaresearch.com Footnotes 1https://www.bloomberg.com/news/articles/2020-08-10/u-s-junk-bond-market-sets-record-low-coupon-in-relentless-rally 2 Please see BCA Research Global Fixed Income Strategy Weekly Report, "We’re All Yield Chasers Now", dated August 11, 2020, available at gfis.bcaresearch.com. Recommendations The GFIS Recommended Portfolio Vs. The Custom Benchmark Index
What Next For Global Corporate Credit Spreads?
What Next For Global Corporate Credit Spreads?
Duration Regional Allocation Spread Product Tactical Trades Yields & Returns Global Bond Yields Historical Returns
BCA Research's Global Fixed Income Strategy service observes that the correlation between relative global government bond returns and yield levels is becoming more positive. The trend should continue as long as policymakers stick to their promises and…
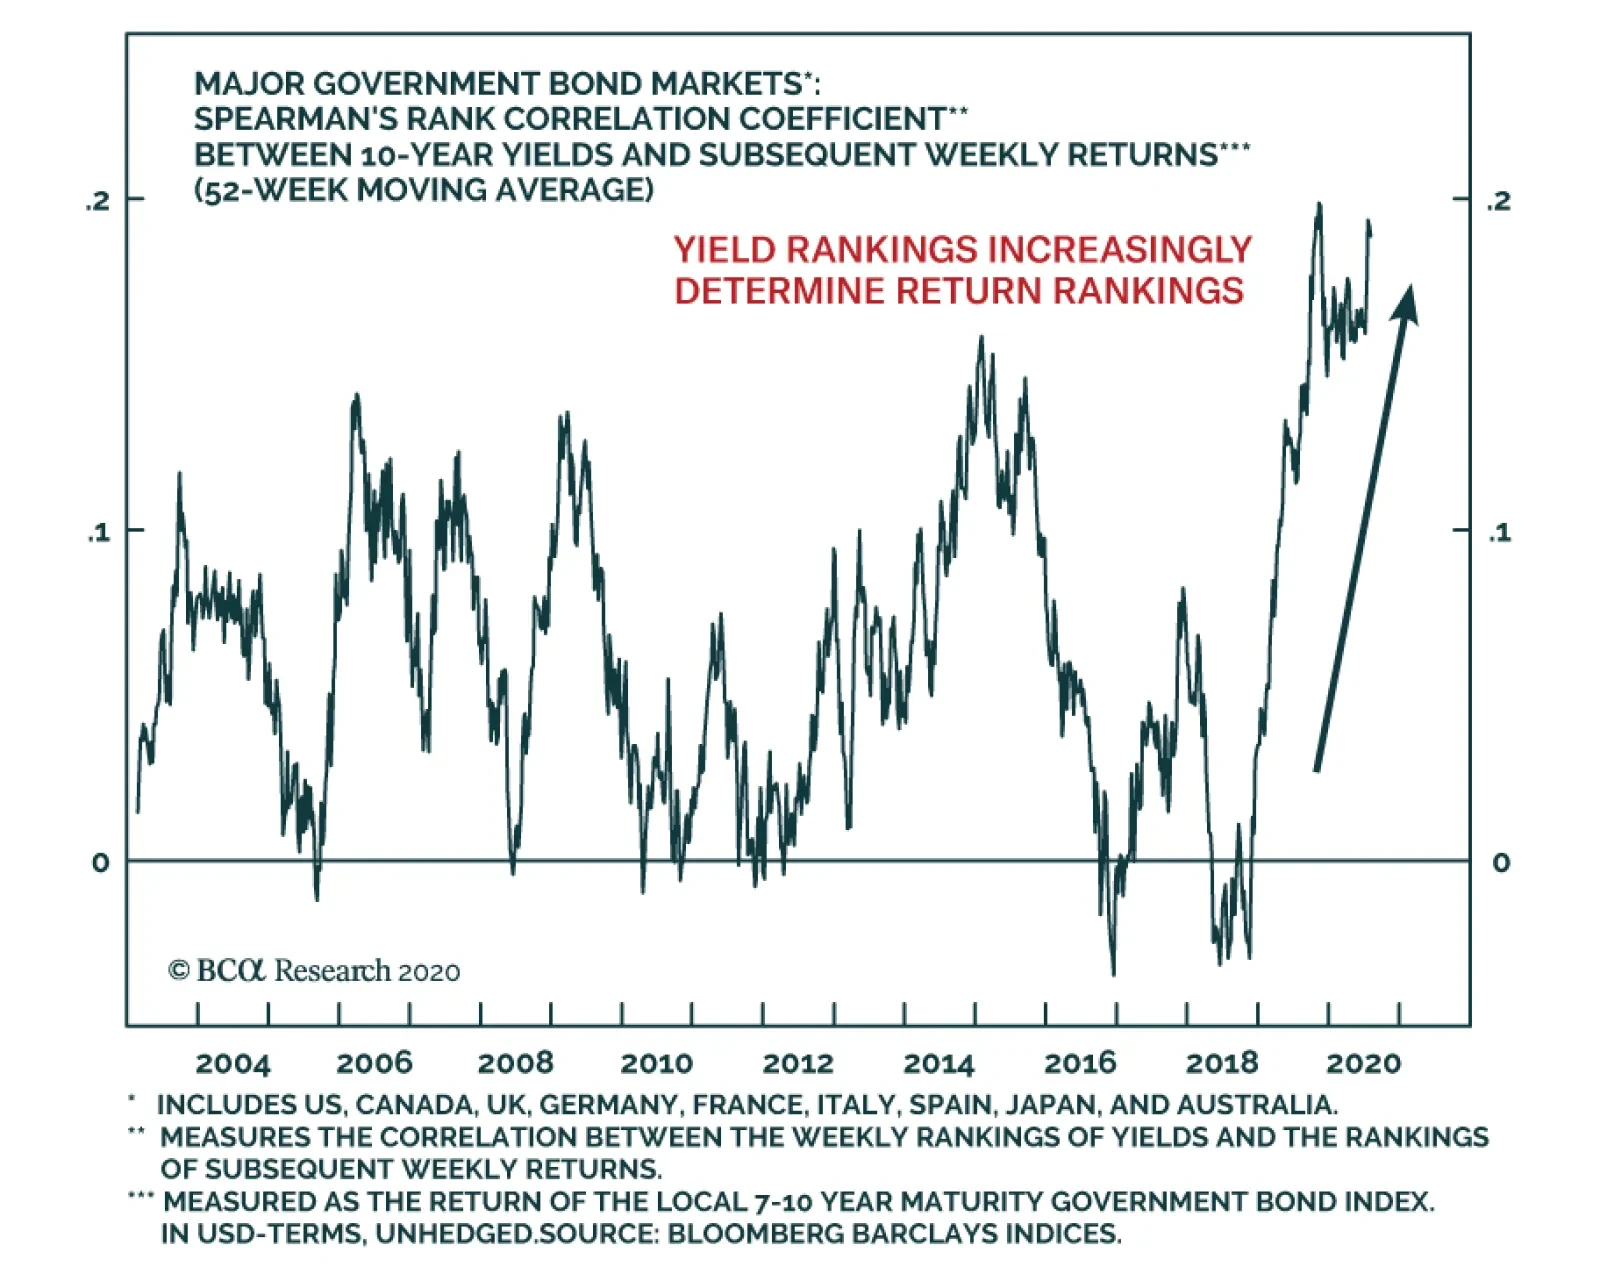
Highlights Scarce Yield: The correlation of relative global government bond returns and yield levels is becoming more positive. The trend should continue if central bankers across the developed world stick to their promises to maintain very loose monetary policy settings for at least the next two years, forcing investors to chase scarce yields while worrying less about cyclical economic and inflation factors. Country Allocations: Maintain overweights to higher-yielding government bonds (Italy, the US, Canada) versus low-yielders (Germany, France, Japan) within USD-hedged fixed income portfolios. Upgrade higher-yielders Spain and Australia to overweight, at the expense of the low-yielding UK and Germany. Feature “What is the investment rationale for buying developed market government bonds now?” We begin this week with a question posed by a BCA client in a recent meeting. It was a perfectly logical inquiry given the current microscopic level of yields on offer almost everywhere. Why bother buying a 10-year US Treasury barely yielding more than 0.5%, or a 10-year Italian BTP yielding less than 1%, with both offering little compensation for future inflation or fiscal risks? Chart of the WeekYield Chasing Is Now The Only Winning Strategy
Yield Chasing Is Now The Only Winning Strategy
Yield Chasing Is Now The Only Winning Strategy
Our answer to the question – “because the Fed and ECB will do whatever is needed to prevent nominal bond yields from rising over the foreseeable future” – did little to influence the client’s view on the attractiveness of those yields (but did make her more comfortable about the equity and corporate credit exposures in her portfolio). In the current environment, where all countries are experiencing the ultimate exogenous negative growth shock – a deadly and highly contagious pandemic - the usual analysis of the cyclical economic and inflation dynamics of any single country now offers far less payoff to government bond investing. It is hard to find a country not suffering from weak growth, very low inflation, high unemployment (some of which is likely to be permanent) and ongoing uncertainty related to the spread of COVID-19. It is also hard to find a country where interest rates have not been cut to 0% (or even lower) and central banks have not ramped up bond buying activity. Increasingly, the relative performance of government bonds between countries reflects simple yield differentials, rather than differing monetary policy outlooks. Higher-yielding markets are outperforming the lower-yielding markets – a trend that has persisted throughout 2020 and is likely to intensify in the coming months (Chart of the Week). Growth? Inflation? Who Cares? Give Me Yield! Developed market government bond yields have been ignoring the usual message sent by cyclical economic indicators. The latest round of global manufacturing PMI data showed continued solid rebounds from the COVID-19 collapse in the US, UK, most of the euro area and other major regions. Nominal 10-year government bond yields in those countries typically track the path of the PMIs, but yields are now as much as 180bps (for US Treasuries) below the levels seen the last time PMIs were so elevated (Chart 2). There is an easy way to explain this discrepancy between bond yields and economic activity. In years past, markets would price in higher inflation expectations, and a greater probability of a future monetary tightening, when growth was improving. Today, policymakers worldwide are bending over backwards to let investors know that no interest rate increases should be expected for at least the next two years – even if growth is improving and inflation were to accelerate. This is having the effect of both lowering real bond yields and increasing inflation expectations, with central bankers also expressing a greater tolerance for future inflation that will limit “pre-emptive” rate increases. Our Central Bank Monitors continue to signal a need for easier monetary policies, even with the rebound in manufacturing data and economic optimism surveys witnessed in the US and UK lifting the Monitors there from the lows (Chart 3). Real bond yields are mirroring the trend in the Central Bank Monitors, indicating that some of the decline in real yields seen in the US, Europe, Canada and Australia is likely related to markets pricing in a lower-for-longer period of monetary policy rates, as we discussed in last week’s report.1 Chart 2Bond Yields Ignoring Improving PMIs
Bond Yields Ignoring Improving PMIs
Bond Yields Ignoring Improving PMIs
Chart 3Plunging Real Yields Reflect Pressure On CBs To Stay Dovish
Plunging Real Yields Reflect Pressure On CBs To Stay Dovish
Plunging Real Yields Reflect Pressure On CBs To Stay Dovish
Chart 4A Low-Volatility Backdrop Encourages Yield Chasing Behavior
A Low-Volatility Backdrop Encourages Yield Chasing Behavior
A Low-Volatility Backdrop Encourages Yield Chasing Behavior
With bond markets having little reason to expect a shift to more bond-unfriendly monetary policies, it is no surprise that higher yielding government bond markets are outperforming low-yielders at an accelerating rate. When there is little to be gained or lost from the duration exposure of government bonds, then the expected returns on government bonds will more closely track yield levels. Fixed income investors seeking the highest returns will be forced to chase the bonds with the highest yields. The current calm volatility backdrop is also fostering an environment of yield-chasing, carry-driven strategies. Measures of yield volatility like the MOVE index of US Treasury option prices and swaption volatilities in Europe have calmed dramatically from the spike seen during February and March (Chart 4). Liquidity in government bond markets has also improved, with bid/ask spreads on 30-year US Treasuries and UK Gilts now back to normal tight levels.2 In a world of low bond volatility and yield chasing behavior, markets with the highest yields should end up outperforming lower yielding markets. Chart 5"High" Yielders Are The Winners In A Low-Yield Environment
We’re All Yield Chasers Now
We’re All Yield Chasers Now
In Chart 5, we show the 2020 year-to-date government bond returns, for the 7-10 year maturity bucket, for the countries we include in our model bond portfolio (the US, Germany, France, Italy, Spain, the UK, Japan, Canada and Australia). The returns are shown both currency unhedged (in USD terms) and hedged into US dollars, with the yield levels from the start of 2020 shown at the top of each bar. The ranking of the returns does generally follow the ranking of yields at the start of the year – the US, Canada, Australia and Italy outperforming low-yielding Germany, France and Japan. What is more interesting is how that correlation between yield levels and performance has evolved over the course of 2020, and even dating back to 2019. If a dynamic of strict yield chasing behavior was gaining steam, then the performance rankings of government bonds should increasingly reflect the rankings of available yields. One way to measure such a dynamic is with a statistic called a Spearman’s rank correlation. Simply put, the Spearman’s rank shows the correlation between the rankings of two sets of variables within each set, rather than the correlation of the variables themselves. If the correlation between the rankings is increasing, this suggests that the relationship between the two variables is becoming more dependent on the levels of the variables relative to each other. We present the Spearman’s rank correlation between yield levels and subsequent bond returns for the nine countries in our model bond portfolio universe in Chart 6. Weekly correlations are calculated using the ranking of the 10-year government bond yields from those nine countries and the rankings of the subsequent weekly total returns (currency unhedged) for those same markets. We present a rolling 52-week correlation coefficient in the chart, which shows a steadily rising trend over the past year of relative bond market performance becoming more dependent on relative initial yield levels. Chart 6High' Yielders Are The Winners In A Low-Yield Environment
High' Yielders Are The Winners In A Low-Yield Environment
High' Yielders Are The Winners In A Low-Yield Environment
While the Spearman’s rank correlation is still relatively low, around 0.2 on the latest data point of the 52-week moving average, that does represent the highest level seen over the past two decades. On the margin, the more recent observations are showing an even higher level of correlation – a trend that should continue given the current easy global monetary policy settings described above that should continue to promote yield-chasing behavior. Another way to measure how much more yield driven government bond markets have become is to look at the relative performance of investment strategies that focus on allocations informed by yield levels. A simple such strategy is presented in Chart 7, using a rule of going long the highest yielding 10-year bond in our list of nine countries at the start of each week and holding only that bond for the subsequent week. We show the return of that simple strategy relative to the return Bloomberg Barclays 7-10 year Global Treasury index in the top panel of the chart, all measured in US dollars on an unhedged basis. The simple strategy of picking the highest yielding bond has been delivering solid outperformance versus the benchmark over the past 2-3 years, with year-over-year relative returns of between 5-10%. The strategy performed very well during the last period similar to today in the post-crisis years of 2012-16, when global policy rates were near 0% and central banks were aggressively expanding their balance sheets through quantitative easing. The year-over-year returns of this simple strategy were always positive during the period (shaded in the chart), which included some major moves in the US dollar that influenced unhedged bond returns. A simple strategy of selecting only the highest yielding government bond has also delivered solid returns of late when focused on other bond maturities besides the 10-year point (Chart 8). The information ratios of these strategies, shown in the chart as the relative year-over-year return of each strategy versus the benchmark compared to the volatility of that relative performance, are all at similar levels in the 0.27-0.94 range. Chart 7Chase The Highest Yields During Global QE & Extended ZIRP
Chase The Highest Yields During Global QE & Extended ZIRP
Chase The Highest Yields During Global QE & Extended ZIRP
Chart 8Yield Chasing Strategies Outperforming Across All Maturities
Yield Chasing Strategies Outperforming Across All Maturities
Yield Chasing Strategies Outperforming Across All Maturities
The efficiency of these strategies will likely not return to the levels seen during that 2012-16 period of extended easy global monetary policy, given the much lower yield levels seen across all bonds including outright negative yields in places like Germany and Japan. However, in a more general sense, selecting higher yielding bonds over lower yielding ones should continue to deliver stronger returns than passive low-yielding benchmarks for as long as policymakers continue to err on the side of reflation (0% rates, more quantitative easing, even yield curve control to limit yields from rising) when setting monetary policy. Selecting higher yielding bonds over lower yielding ones should continue to deliver stronger returns than passive low-yielding benchmarks for as long as policymakers continue to err on the side of reflation. Bottom Line: The correlation of relative global government bond returns and yield levels is becoming more positive. The trend should continue if policymakers stick to their promises to maintain very loose monetary policy settings for at least the next two years, forcing investors to chase scarce yields regardless of cyclical economic and inflation trends. Investment Implications & Alterations To Our Model Bond Portfolio Chart 9Higher-Yielding Government Bonds Will Continue To Shine
Higher-Yielding Government Bonds Will Continue To Shine
Higher-Yielding Government Bonds Will Continue To Shine
The intensified yield chasing behavior has obvious implications for fixed income investors. Within dedicated global government bond portfolios, exposures should be concentrated in higher yielding markets at the expense of the low yielders. Already, the relative returns year-to-date (on a USD-hedged and duration-matched basis versus the Global Treasury index) reflect that conclusion, with the US (+692bps versus the index), Canada (+458bps) and Italy (+87bps) outperforming and Germany (-111bps), France (-77bps) and Japan (-472bps) lagging (Chart 9). Our current investment recommendations, both on a medium-term strategic basis and within our more flexible model bond portfolio, are generally in line with those rankings. Our recommendations already include overweights in the US, Canada, Italy and the UK; with underweights in Germany, France and Japan. We are currently neutral Spain and Australia. The view on Spain was a relative value consideration, as we preferred an overweight on Italy as our recommended exposure within the European peripherals. For Australia, we closed our long-standing overweight stance there back in May, primarily due to signs that the Australian economy was showing signs of recovery after what was a very modest initial wave of COVID-19 cases.3 Now, we see good reasons to upgrade Spain and Australia to overweight to gain even more exposure to high-yielding government bonds in a yield-scarce, yield-chasing world. Our recommendations already include overweights in the US, Canada, Italy and the UK; with underweights in Germany, France and Japan. In Chart 10, we present a scatter chart showing 10-year government bond yields, hedged into US dollars, plotted versus the latest trailing 1-year beta of yield changes to those of the 7-10 maturity bucket for the Global Treasury index. This is a simple way to present a reward versus risk relationship, using the yield beta as the measure of risk. The chart shows that Spain and Australia offer relatively attractive yields compared to other markets with similar yield betas. This offers a way to boost the expected yield from our recommended portfolio without raising the yield beta of the portfolio. Chart 10Upgrade Spain & Australia, Downgrade The UK In Global Bond Portfolios
We’re All Yield Chasers Now
We’re All Yield Chasers Now
Specifically, we see two allocation changes that can be made to our model bond portfolio to reflect this view on relative yields: Upgrade Spain to overweight, while reducing the weight on UK Gilts to neutral Upgrade Australia to overweight, funded by reducing the German underweight allocation even further. We see good reasons to upgrade Spain and Australia to overweight to gain even more exposure to high-yielding government bonds in a yield-scarce, yield-chasing world. The USD-hedged yield pickup on both of those switches is substantial, as can be seen in Table 1 where we present unhedged and USD-hedged yields for 2-year, 5-year, 10-year and 30-year government bonds across all developed markets. Switching from the UK to Spain generates a modest yield pick-up on an unhedged basis at the 10-year and 30-year maturity points. The pickup is far more attractive across all maturity points on a USD-hedged basis, ranging from +22bps for 2-year maturities to +101bps for 30-year bonds. Table 1Developed Market Bond Yields, Both Unhedged & Hedged Into USD
We’re All Yield Chasers Now
We’re All Yield Chasers Now
In fact, UK Gilt yields across the entire maturity spectrum are now some of the lowest on offer within the developed market space, both on an unhedged and USD hedged basis. This alone is enough reason to downgrade Gilt exposure, especially with the Bank of England continuing to shoot down the notion of a move to negative UK policy rates that could also drive longer-dated Gilt yields into negative territory. As for Australia, the recent severe COVID-19 outbreak in Melbourne, the country’s second largest city, has raised fears that a new and more extended period of lockdowns may be necessary Down Under. This goes against our original thesis for downgrading Australian bond exposure a few months ago, thus a return to overweight as a yield pickup also makes sense on a fundamental basis – particularly with the RBA already using extreme measures like yield curve control to anchor the level of 3-year Australian bond yields from the short end of the curve. The yield pick-up from our recommended switch from Germany to Australia is significant from the 2-year to 30-year maturity points, ranging between 94bps to 182bps on an unhedged basis and 20bps to 109bps on a USD-hedged basis. The changes to our recommended country allocations in our model bond portfolio can be found on pages 12-13. Bottom Line: Maintain overweights to higher-yielding government bonds (Italy, the US, Canada) versus low-yielders (Germany, France, Japan) within USD-hedged fixed income portfolios. Upgrade higher-yielders Spain and Australia to overweight, at the expense of the low-yielding UK and Germany. Robert Robis, CFA Chief Fixed Income Strategist rrobis@bcaresearch.com Footnotes 1 Please see BCA Research Global Fixed Income Strategy Weekly Report, "Are Bond Markets Throwing In The Towel On Long-Term Growth?", dated August 4, 2020, available at gfis.bcaresearch.com. 2 The bid-ask spreads shown are taken from the Bank of England’s latest Financial Stability Review, available here: https://www.bankofengland.co.uk/-/media/boe/files/financial-stability-report/2020/august-2020.pdf 3 Please see BCA Research Global Fixed Income Strategy Special Report, "Australia: All Good Streaks Must Come To An End", dated May 13, 2020, available at gfis.bcaresearch.com. Recommendations
We’re All Yield Chasers Now
We’re All Yield Chasers Now
Duration Regional Allocation Spread Product Tactical Trades Yields & Returns Global Bond Yields Historical Returns
The winners in a post-COVID-19 world could be the automation/robotics/capital goods sectors. This seems very plausible, according to our Global Asset Allocation service. First, unable to tap into the pool of cheap international labor as easily as before,…
Highlights Even after the COVID-19 pandemic is over, likely within 18 months, many behavioral changes that were forced on society by social distancing will remain. Individuals who have gotten used to working from home, shopping online, and using the internet for socializing and entertainment will continue to do so. Amid any large structural shift, it is easier to spot losers than winners. The biggest losers are likely to be: (1) Parts of the real estate industry, as companies shed expensive city-center office space and office workers move away from big cities; and (2) the travel industry, since business travel will decline. The winners will include: Health care (as governments spend to strengthen medical services); capital-goods producers (with US manufacturers increasingly reshoring production but automating more); and the broadly-defined IT sector which, while expensively valued, is nowhere near its 2000 level and has several years of strong growth ahead. “We always overestimate the change that will occur in the next two years and underestimate the change that will occur in the next ten.” – Bill Gates “There are decades where nothing happens, and there are weeks where decades happen.” – Lenin Introduction The world has been turned upside down since February by the coronavirus pandemic. Households all around the globe have been forced to stay indoors; companies have been forced to drastically change working practices; some industries, such as online shopping or videoconferencing software, have seen a surge in demand. But once the pandemic is over, how many of these changes will stick? What will be the long-term impact on society, the workplace, consumer attitudes, and companies’ strategic planning? How should investors position themselves to take advantage of secular changes in the sectors that will be most affected, ranging from health care and technology, to real estate, retailing, and travel? In this Special Report (which should be read in conjunction with two other recent BCA Research Special Reports on the macro-economic and geopolitical consequences, respectively, of COVID-191), we look at the social and industry implications of the coronavirus pandemic. We assume that, within the next 12-to-18 months, the pandemic will be a thing of the past, either because a vaccine has been developed, or because enough people have caught it for herd immunity to develop. This does not mean that people will be unconcerned about a reoccurrence, or about a new virus triggering another epidemic. Pandemics are not rare, even in modern history (Table 1). And COVID-19 may return as an annual mild seasonal flu (as the 1968 Asian flu did), but which is not serious enough to alter behavior. But the assumption in this report is that, within a couple of years, people will feel comfortable again about being in crowded spaces and traveling, without a need for social distancing or periodic lockdowns. Table 1Estimated Mortality And Infection Rates Of Pandemics During The Past Century
The World After COVID-19: What Will Change, What Will Not?
The World After COVID-19: What Will Change, What Will Not?
But that doesn’t mean that everything will return to the status quo ante. At least some individuals who have gotten used to working from home, video conferencing, and shopping online will continue these practices. Companies will, therefore, need to rethink their employment policies, as well as how they manage their office space, global supply chains, and just-in-time inventories. Government policies towards health care and education will need to be rethought. None of these changes are new. Indeed, the result of an exogenous shock is often simply to accelerate trends that were already in place. E-commerce, telecommuting, and “reshoring” have already been growing steadily for years. COVID-19 is, however, likely to accelerate these shifts. Not every individual or company will change their behavior, but even small changes at the margin can have a significant impact. Ultimately, what these changes amount to is a liberalization of space and time. Employees do not need to be in the same physical space to work together. Students can choose when to listen to a lecture. Music lovers based in a small city can have the same access to a live (streamed) concert as those in London or New York. This Special Report is divided into two sections. In the first section, we examine the meta-changes in consumer and corporate behavior that could result from the pandemic. How widely will the shift from office-based work to “working from home” stick? How much will shopping, entertainment, and education stay online? Will companies really bring back a large chunk of manufacturing from overseas? In the second section, we analyze the impact on specific industries, such as real estate, health care, technology, and retailing, and make some suggestions as to how investors should tilt their portfolios over the longer term to take advantage of these trends. In summary, we identify the winners as health care, technology, and capital-goods producers. The clear losers are in real estate and travel. Retailing and consumer goods will see a significant shakeout, with both winners and losers, but the overall impact on these industries will be neutral. Social Impacts Working From Home Teleworking, or working from home, is hardly new. Craftsmen before the industrial revolution did so as a matter of course. But the development of computers and telecommunications in the 1980s made it feasible for white-collar workers to work from home too. As Peter Drucker wrote as long ago as 1993: "...commuting to office work is obsolete. It is now infinitely easier, cheaper and faster to do what the nineteenth century could not do: move information, and with it office work, to where the people are."2 Until now, however, teleworking has been rare. But the requirements imposed by the pandemic could cause that to change. Technically, it is possible for workers in many job categories to telework effectively. A recent study by Jonathan Dingel and Brent Neiman3 estimated, based on job characteristics, that it is feasible for 37% of all jobs in the US to be done entirely from home (46% if weighted by wages). The vast majority of jobs in sectors such as education, professional services, and company management could be done from home (Table 2). Extending the analysis to other countries, they find that more than 35% of jobs in most developing countries can be done from home, but less than 25% in manufacturing-heavy emerging economies such as Turkey and Mexico (Chart 1). Table 2Share Of Jobs That Can Be Done At Home, By Industry
The World After COVID-19: What Will Change, What Will Not?
The World After COVID-19: What Will Change, What Will Not?
Chart 1Share Of Jobs That Can Be Done At Home, By Country
The World After COVID-19: What Will Change, What Will Not?
The World After COVID-19: What Will Change, What Will Not?
But, in practice, before the coronavirus pandemic, many fewer people than this worked from home. Partly this was simply because many companies did not allow it. A survey by OWL Labs in 2018 found that 44% of companies around the world required employees to work from an office, with no option to work remotely.4 The percentage was even higher, 53%, in both Asia and Latin America. By contrast, OWL did find that 52% of employees globally worked from home at least occasionally, and that as many as 18% of respondents reported working from home always. The pandemic forced many white-collar workers to telework for the first time. The Pew Research Center found that 40% of US adults – and as many as 62% of those with at least a bachelor’s degree – worked from home during the crisis.5 How white-collar workers found the experience, and whether they plan to continue to work from home some of the time even if not required to do so, vary widely. Employers are generally positive about the idea. A survey of hiring managers by Upwork found that 56% believed that remote working functioned better than expected during the crisis (Chart 2). They cited reduced meetings, fewer distractions, increased productivity, and greater autonomy as reasons for this. The major drawbacks were technological issues, reduced team cohesion, and communication difficulties. Another survey, by realtor Redfin, found that 76% of US office workers had worked from home during the crisis (compared to only 36% who worked from home at least some of the time beforehand) and that 33% of respondents who had not worked remotely pre-shutdown expect to work remotely after shutdowns end (with another 39% unsure) (Chart 3). Chart 2Employers Found That Teleworking Worked Well
The World After COVID-19: What Will Change, What Will Not?
The World After COVID-19: What Will Change, What Will Not?
Chart 3Many Employees Expect To Continue Working Remotely After The Pandemic Ends
The World After COVID-19: What Will Change, What Will Not?
The World After COVID-19: What Will Change, What Will Not?
But there are problems too. Research published in the Journal of Applied Psychology found that, while teleworking has some clear advantages, such as improved work-family interface, greater job satisfaction, and enhanced autonomy, it also has drawbacks. Most notably, if workers aren’t in the office at least half the week, relationships with fellow workers suffer, as does collaboration.6 There are also developed countries where backward technology has made the experience of working from home difficult. This is particularly the case in Japan. A survey by the Japan Productivity Center found that 66% of office workers said their productivity fell when working from home; 43% were dissatisfied with the experience. The reasons cited for the dissatisfaction were “lack of access to documents when not in the office” (49%), “a poor telecommunications environment” (44%), and a difficult working environment, such as lack of desk space (44%). Japanese companies remain rather paper-based, and household living space tends to be small. Research carried out on employees at Chinese online travel company Ctrip before the pandemic concluded that home working led to a 13% performance increase but, crucially, there were four requirements for working from home to succeed: Children must be in school or daycare; employees must have a home office that is not a bedroom; complete privacy in that room is essential; and employees must have a choice of whether to work from home.7 After the pandemic, a significant shift in the pattern of office work is likely. Many workers will work remotely part or most of the time. But they will also benefit from coming to an office a certain number of days a month to work together, bond with co-workers, exchange ideas, etc. Online Shopping E-commerce has been growing steadily for years. In the US, it increased by 15% year-on-year in 2019, to reach $602 bn, or 16% of total retail sales (Charts 4 and 5). The share is even higher in some other countries: For example, 25% in China and 22% in the UK. The pandemic caused a big acceleration in e-commerce the first few months of this year, as consumers in most countries around the world were either not allowed to go outside, or felt unsafe doing so. Chart 4The Share Of E-commerce Has Been Steadily Expanding For Years…
The World After COVID-19: What Will Change, What Will Not?
The World After COVID-19: What Will Change, What Will Not?
Data from Mastercard show that, in the worst period of lockdowns in April, e-commerce grew by 63% in the US, and 64% in the UK year-on-year, compared to a decline of 15% and 8%, respectively, in overall retail sales (Chart 6). The growth was particularly apparent in products such as home improvement, footwear, and apparel (Chart 7). Chart 5…With Growth Of Around 15% A Year
The World After COVID-19: What Will Change, What Will Not?
The World After COVID-19: What Will Change, What Will Not?
Chart 6In April, Online Sales Soared…
The World After COVID-19: What Will Change, What Will Not?
The World After COVID-19: What Will Change, What Will Not?
Chart 7…Especially In Certain Categories
The World After COVID-19: What Will Change, What Will Not?
The World After COVID-19: What Will Change, What Will Not?
Moreover, many consumers in advanced economies bought goods such as clothing, medicine, and books online for the first time, and used services such as online grocery delivery, and apps to order food from restaurants (Chart 8). Note, however, that few consumers bought financial services, magazines, music, and videos online for the first time. Presumably these are products that the vast majority of households had already been consuming online. Chart 8Consumers Shifted Purchases Of Many Items Online
The World After COVID-19: What Will Change, What Will Not?
The World After COVID-19: What Will Change, What Will Not?
It is hard to know how sticky these trends will be. Once shops permanently reopen without restrictions, will consumers simply return to their old habits of going to supermarkets, restaurants, and clothing stores? Perhaps many enjoy the experience of browsing. It seems likely, however, that the newly acquired habit of shopping online will at least accelerate the trend towards e-commerce. Many of those who ordered, for example, supermarket deliveries online for the first time will continue to do so at least occasionally in the future. Other changes are likely too: Many smaller retailers were forced to close their physical stores during the pandemic and so had no choice but to set up an online delivery service. Some struggled with this, but others were aided by companies such as Shopify, which simplify the process of setting up a website, processing payments, and arranging delivery. Shopify now works with over a million merchants. These smaller retailers are now better able to compete with giants such as Amazon. During the lockdown, US consumers notably diversified their online product searches away from Amazon and Google to smaller retailers (Chart 9). Chart 9Search Diversified Away From Amazon And Google
The World After COVID-19: What Will Change, What Will Not?
The World After COVID-19: What Will Change, What Will Not?
We might see a trend towards smaller-scale, local shops benefiting as consumers stick to shopping in smaller stores closer to their homes. Many stores during the pandemic refused to accept cash; this might accelerate the shift towards contactless payments. Consumers may be less focused in future on conspicuous consumption. The trend towards wellness, home-cooking, gardening, crafts, and self-investment might continue. Other Uses Of Technology It is not only work and shopping habits that changed during lockdowns. Individuals also got used to a range of technologies for socializing, entertainment, education, and medical consultation. Consumer surveys by the Pew Research Center show that a third of American adults have socialized online using services such as Zoom, and a quarter have used online systems for work or conferences (Chart 10). But these percentages are much higher for certain demographics. For example, 48% of 18-to-29 year-olds have socialized online, and 30% of this age group have taken online fitness classes. The percentage using video systems for work is as high as 48% for people with a college degree. And, unsurprisingly, with many university courses moving online since the spring, 38% of 18-to-29 year-olds say they have taken an online class. Chart 10Individuals Have Been Socializing And Communicating More Online
The World After COVID-19: What Will Change, What Will Not?
The World After COVID-19: What Will Change, What Will Not?
How sticky these trends will be once the pandemic is over is not easy to forecast. But further research by Pew showed that 27% of US adults believed that online and telephone contacts are “just as good as in-person contact,” and only 8% thought of them as not much help at all, although a rather larger 64% answered that online socializing is “useful but will not be a replacement for in-person contact.” The responses differed little between gender, race, and political views, although fewer people under the age of 30 thought online contacts were as good as in-person ones (Table 3). Table 3How Do Online Interactions Compare To In-Person Ones?
The World After COVID-19: What Will Change, What Will Not?
The World After COVID-19: What Will Change, What Will Not?
Another survey in Japan by Ipsos suggests that people’s values have changed as a result of the pandemic and quarantines, with a greater focus on wellbeing, home-based activities such as cooking, and self-improvement. When questioned, a large percentage of people believe they will persist with these habits even when lockdowns end. For example, 51% of Japanese respondents believe they will continue to enjoy themselves as much as possible at home in their spare time, compared to only 20% who favored entertainment at home before the pandemic (Chart 11). Chart 11Pandemic Brought A Greater Focus On Wellbeing And Home-Based Activities
The World After COVID-19: What Will Change, What Will Not?
The World After COVID-19: What Will Change, What Will Not?
Other areas that have moved online en masse include education, health care, the judiciary, concerts, and sports (e-sports, and popular sports such as soccer and baseball that are now being played in empty venues). Education at the tertiary level in advanced economies was already partly online before the pandemic. In the US, out of 19.7 million tertiary students in 2017, 2.2 million (13.3%) were enrolled in exclusively online/distance learning courses, and another 3.2 million (19.5%) took at least one course online.8 Of course, everything changed during the pandemic, with 98% of US institutions moving the majority of in-person courses online, and many planning to continue this through the Fall 2020 semester. At the elementary and secondary school level, online education was much more limited pre-pandemic. According to the National Center for Educational Statistics, 21% of US schools offered some courses entirely online in 2016 but, of this 21%, only 6% offered all their courses online and only another 6% the majority of courses. Many of these schools were forced to shift entirely online during lockdowns: According to UNESCO data, at the peak of the pandemic 1.6 billion children (90% of the total in school) in 191 countries attended schools that had closed physically. It seems likely that, while in-person teaching will remain the central method of education, distance and online learning solutions, even at the high school level, will become more prevalent in the future. The health care sector has lagged in technology, in terms of using AI for diagnosis, digitalizing patient records, and offering online doctor-patient consultation. But the use of digital tools had started to increase in recent years, particularly in the number of practices using telemedicine and virtual visits (Chart 12). At the peak of the pandemic in April, the number of telehealth visits in the US rose by 14% year-on-year, compared to a 69% decline in in-person visits to a doctor.9 It seems likely that this trend will continue, as medical practitioners find viritual consultations more efficient and effective for many simple initial diagnoses, and as sick or elderly patients prefer to avoid a physical visit to a surgery.10 Chart 12The Transition To A Digital-Driven Health Care Model
The World After COVID-19: What Will Change, What Will Not?
The World After COVID-19: What Will Change, What Will Not?
Travel Travelers have been very reluctant to get back on airplanes and stay in hotels again, even in countries and regions where the pandemic has eased over the past couple of months (Chart 13). Based on our assumption that the pandemic will be completely over within 18 months, it seems likely that people will eventually resume travelling, at least for leisure and to see family and friends. After previous disruptions to global travel, such as 9/11 and SARS, it took only two-to-three years for air travel to resumed its pre-crisis trend (Chart 14). Chart 13Travelers Remained Reluctant Even When Pandemic Eased
The World After COVID-19: What Will Change, What Will Not?
The World After COVID-19: What Will Change, What Will Not?
Chart 14
Business travel might be very different, however. Salespeople who have become used to making sales calls over Zoom may not feel the need to travel to see clients so much. Conferences, exhibitions, and other events will be increasingly (at least partly) online. Travel budgets are a large expense for many companies. According to estimates by Certify, a travel software provider, spending on business trips in 2019 totalled $1.5 trillion (including $315 billion by US businesses). The availability of a technological alternative to at least some business trips will provide a good excuse for many companies to meaningfully reduce the number of trips and their travel budget. In the future, business travel may become more of a privilege than a necessity. It is easy to imagine a significant decline in overall business travel. Manufacturing Supply Chains Corporate behavior could also change as a result of the disruptions caused by the coronavirus. Companies in the US and Europe realized how vulnerable their complex supply chains are. Popular and political pressure is pushing firms to reshore at least some of their overseas production. Firms will need to build in more “operational resilience,” with higher levels of inventory, less debt, and greater redundancy in their systems. Developed economies such as the US have been deindustrializing for 40 years – since reforms in China in the late 1970s, followed by Mexico and central Europe in the 1990s, made these countries appealing locations for cheap manufacturing. US manufacturing employment has almost halved since 1980, falling to only 27% of the workforce (Chart 15). Manufacturing output, especially outside of the computer sector, has substantially lagged that of the overall private sector (Chart 16). The US has also fallen behind in automation, with a much lower number of robots per manufacturing worker than in countries such as Germany and Japan (Chart 17). Chart 15US Manufacturing Employment Has Halved Since 1980
US Manufacturing Employment Has Halved Since 1980
US Manufacturing Employment Has Halved Since 1980
Chart 16Manufacturing Output Outside The Computer Sector Has Lagged
The World After COVID-19: What Will Change, What Will Not?
The World After COVID-19: What Will Change, What Will Not?
Chart 17The US Has Relatively Few Robots
The World After COVID-19: What Will Change, What Will Not?
The World After COVID-19: What Will Change, What Will Not?
The pandemic highlighted how vulnerable widely distributed supply chains are. This was clearest in the health care sector. The US is far away the biggest spender on health care research and development (Chart 18). And yet it was unable to provide critical medical equipment such as face masks, testing kits, and ventilators to its population at an adequate rate, mainly because almost 70% of the facilities which manufacture essential medicines are based abroad (Chart 19). During the pandemic, countries such as China and India prioritized their own citizens, forcing the US government to strike emergency deals to avoid drug shortages. Chart 18The US Spends A Lot On R&D In Health Care…
The World After COVID-19: What Will Change, What Will Not?
The World After COVID-19: What Will Change, What Will Not?
Chart 19…But Drug Production Is Mostly Done Overseas
The World After COVID-19: What Will Change, What Will Not?
The World After COVID-19: What Will Change, What Will Not?
Once the crisis subsides, CEOs of American companies (as well as the US government) will have to decide if they are comfortable with the fact that, while they possess a vast store of intellectual capital, the manufacturing of their products happens halfway around the world. What happens if there is another pandemic? What about a global disaster caused by climate change? Finally, and perhaps more worryingly, what happens if tensions between the US and China escalate seriously? This shift will not happen overnight: China still has much cheaper labor, an enormous manufacturing base of factories and parts suppliers, and formidable transportation infrastructure. Many aspects of supply chains are too deep-rooted and the economics too compelling for them to be unwound quickly. Some production will shift from China to other emerging economies. A Biden administration might be less confrontational with China, and could lower some of the Trump tariffs. But, at the margin, companies will choose to build new factories in the US (and in western Europe and Japan), with highly automated systems. Government policy (via both subsidies and tariffs) will encourage these trends. Manufacturers which have lived “on the edge” in recent years, with dispersed supply chains, just-in-time processes, minimal inventories, the fewest possible workers, and the maximum amount of debt compatible with their targeted credit rating (often BBB) now understand the need to build redundancy into their systems. Corporate debt levels are high by historical standards in many countries (Chart 20). Companies may want to build up a buffer of net cash in the future, as Japanese companies did for decades after the bubble there burst in 1990. Inventories have risen a little relative to sales since the Global Financial Crisis but will probably rise further (Chart 21). These trends are likely to be negative for profit margins. Chart 20In The Future, Will Companies Be Happy With This Much Debt...
In The Future, Will Companies Be Happy With This Much Debt...
In The Future, Will Companies Be Happy With This Much Debt...
Chart 21...And Such Low Level Of Inventories?
...And Such Low Level Of Inventories?
...And Such Low Level Of Inventories?
Implications For Industries In light of the social changes described above, how will various industries be reshaped over the coming years? Which sectors should investors tilt towards because they are likely to emerge as winners from post-COVID structural shifts? And which are the sectors that investors should avoid since they will suffer from the creative destruction? In the midst of major social and technological change, it is often easier to spot losers than winners. Think of the arrival of the internet in the 1990s. How many investors would have correctly picked Google, Amazon, Apple, and only a handful of others as the winners? It would have been easier to correctly identify industries that were likely to lose out to disruption, such as book retailers, travel agents, newspaper publishers, and TV broadcasters. We start, therefore, with the industries likely to lose out from post-COVID changes. The Losers Real Estate Over the next few years, prime real estate seems the most likely loser. It is not clear how many white-collar workers will choose to work from home in the future, or how many days a month they will want to come into an office to meet with fellow workers. But it seems likely there will be a strong continued trend in the direction of remote working. As a result, demand for prime central-business-district property will fall, given that it is very expensive. In Manhattan, for example, the average workspace for each of the 1.5 million office workers is around 310 square feet. At pre-COVID rental costs, that amounts to an average of $20,000 per employee – and more than $30,000 for A+ grade buildings. And rent is only part of what a company pays: There are also costs for cleaning, utilities, technology, security, coffee machines, and cafeterias on top of that. Employees working at home pay for their own space, utilities, food (and often even computer equipment). The size, location, and layout of offices will need to be rethought. Maybe companies will choose to build a campus in the suburbs, with a range of different working spaces (for meetings, quiet work, or collaboration). They may prefer to rent shared co-working spaces by the day or week. Some real estate developers and builders would be beneficiaries of this. Companies would save money in real estate costs. But they may need to pay a stipend to employees who work at home to cover the extra space they will require, and to upgrade their technology (computer equipment, internet speed, and so on). On the other hand, companies may pay lower salaries for workers who move out of high-cost locations such as Manhattan or London to places where it is cheaper to live. Many office spaces are leased on a long-term basis, so some companies will not be able to move out of big cities immediately. But residential property is more liquid. The trends in work practices might accelerate a shift to the suburbs which has already been emerging over the past few years (Chart 22). Workers will not need to live so close to the company’s office if they will visit it for only a few days a month. Small towns with a lively community and pleasant environment (and decent transportation links to a big city) could grow in popularity. This would be bad news for developers which are specialized in developing residential property in cities such as London, Sydney, Toronto, and Vancouver, and for the owners of those properties. But it might be positive for builders who will develop the new houses and out-of-town office campuses. Chart 22The Shift To The Suburbs Was Already Taking Place
The World After COVID-19: What Will Change, What Will Not?
The World After COVID-19: What Will Change, What Will Not?
This does not mean that cities will wither away. After previous epidemics and crises in history (think the Great Plague of London in the 17th century, or 9/11), they have always bounced back. “Casual collisions” – chance meetings with interesting people which lead to collaborative relationships – are crucial in creative industries, and happen online only with difficulty. Buildings will be repurposed: Retail space will be turned into warehouses or apartments, for example. A fall in rents would allow cities to “degentrify” and attract back young people, making the city more dynamic again. But the period of transition could be painful for some segments of the real estate industry. Travel A permanent decline in business travel would be a significant blow to airlines and hotel chains. Business travelers account for only about 12% of the number of air tickets purchased, but they generate 70%-75% of airlines’ profits. Even discount leisure airlines such as Southwest have in recent years started to target business travelers. And it will not just be airlines that are affected. Data from the US Travel Association show that 26% of the $2.5 trillion in travel-related revenues in the US in 2018 came from business travelers. Of that, 17% goes to air travel, 13% to accommodation, and 5% to car rental. An even larger portion goes to food (21%). Around 40% of hotel rooms are occupied by business travelers. Conference organizers and venues could also suffer: 62% of US business trips are to attend conferences. “Sharing economy” companies would be affected too. In 2018, 700,000 business travelers booked accommodation through AirBnB, and 78% of business travelers use Uber and other ride-sharing services. Furthermore, a slowdown in business travel would have knock-on effects on the leisure travel sector. Surveys suggest that almost 40% of business trips in the US are extended to include leisure activities (“bleisure” in the travel industry parlance). The Winners Health Care A recent report by BCA Research’s Global Asset Allocation service argued in detail that the macro environment for global health care equities will remain very positive in the coming years.11 An aging population in the world, and a growing middle class in emerging countries will steadily raise demand for health care services (Charts 23 and 24). China, in particular, has underinvested in health care: It spends only 5% of GDP, barely higher than it did 20 years ago, and well behind other emerging economies such as Brazil and South Africa (Chart 25). Chart 23Positives For Health Care Include An Aging Population…
Positives For Health Care Include An Ageing Population...
Positives For Health Care Include An Ageing Population...
Chart 24…And A Growing Emerging Market Middle Class
...And A Growing Emerging Market Middle Class
...And A Growing Emerging Market Middle Class
As a result of the COVID-19 pandemic, governments everywhere will need to spend more money on health care (or, in the case of the US, perhaps spend it more effectively). In the US, before the pandemic, intensive-care beds were sufficient to cope only with the peak of a normal seasonal influenza breakout. The World Health Organization warns that, while pandemics are rare, highly disruptive regional and local outbreaks of infectious diseases are becoming more common (Chart 26). More money will need to be spent, in particular, on developing health care technology (online consultations, digitalized patient records, track-and-trace systems), on improving senior care homes (80% of COVID-19 deaths in the Canadian province of Quebec were in such facilities), and on biotech (such as gene-related therapies). Chart 25Expenditures On Health Care Will Have To Grow
Expenditures On Health Care Will Have To Grow
Expenditures On Health Care Will Have To Grow
Chart 26Number Of Countries Experiencing Serious Outbreak Of Infectious Disease
The World After COVID-19: What Will Change, What Will Not?
The World After COVID-19: What Will Change, What Will Not?
The health care equity sector is not expensive, trading in line with its long-run average valuation (Chart 27). Within the sector, biotech and health care technology look more attractive than pharmaceuticals, which are expensive and vulnerable to the price caps proposed by Joe Biden if he is elected US president this November. Chart 27Health Care Stocks Are Not Expensive
Health Care Stocks Are Not Expensive
Health Care Stocks Are Not Expensive
Technology In a plethora of ways, the pandemic has propelled the use of technology: For working at home, communication, online shopping, entertainment, etc. Companies such as Zoom have moved from niche players to mainstream business providers: Zoom’s peak daily users rose from 10 million in December 2019 to 300 million in April. Chart 28Tech Stocks Are Nowhere Close To Previous Peaks
Tech Stocks Are Nowhere Close To Previous Peaks
Tech Stocks Are Nowhere Close To Previous Peaks
Assuming that at least some of these developments remain in place once the pandemic is over, it is easy to see how technology stocks (broadly defined to include any company that uses information technology as a central part of its business) will continue to prosper. These stocks will not be just in the IT sector, but also in communications and consumer discretionary. Picking the individual winners will be hard: Will Microsoft overtake Amazon in cloud computing? Will Zoom’s much-discussed privacy issues undermine it? Will competitors emerge to Shopify in merchant services? Can Spotify compete with Apple in online music streaming? But the broadly-defined sector seems likely to have improving fundamentals for some years to come. The only question is whether the good news is already priced in, after the huge run-up in stock prices over the past few years. We do not believe it is fully. The valuations of these sectors are still nowhere close to the level they reached at the peak of the TMT Bubble in 1999-2000 (Chart 28), they have strong balance-sheets, and considerable earnings power. For their outperformance to end, it will take one of two things. The first trigger could be a significant shift down in growth. Over the past three years, Amazon has grown EPS at a compound rate of 47%, and Netflix at 76% (Chart 29). Over the next three years (2020-2023), analysts forecast compound EPS growth of 32% for Netflix, 30% for Amazon, 15% for Facebook (compared to 24% in 2016-2019), and 12% for Microsoft (compared to 16%). Those are still impressive growth numbers, and should be achievable as long as these companies can continue to grow market share. Chart 29Can The Big Tech Stocks Keep Growing Earnings At This Rate?
The World After COVID-19: What Will Change, What Will Not?
The World After COVID-19: What Will Change, What Will Not?
The second set of risks would be regulatory: A move to break up companies such as Google and Amazon, the US introducing data privacy legislation similar to that in the European Union, or a move to a digital tax or minimum global taxation. None of these seems likely in the immediate future. Automation/Robotics/Capital Goods The return, at the margin, of some manufacturing to the United States (and other developed economies) will bring about economic changes. Unable to tap into the pool of cheap international labor as easily as before, companies will have to invest significantly in this sector. This will result in the following: A resurgence of manufacturing productivity, thanks to increased investment. An intensification of automation. The US will need to boost the number of robots per capita to compete with Korea, Germany, and Japan. This will further improve productivity. The development of a high-tech manufacturing sector. Analogous to the FAANG stocks during the 2010s, a new group of innovative manufacturing companies could emerge. New infrastructure, roads, factories, and machinery will be needed to replace what is now an outdated capital stock in the US (Chart 30). These trends should all be positive for the capital-goods sector. Such a project would also need large amounts of raw materials. This might push up the prices of commodities such as industrial metals, and benefit materials producers. As mentioned above, it could boost the price of real estate outside of the major cities, where the new manufacturers would be likely to set up. Chart 30The US Capital Stock Is Becoming Outdated
The World After COVID-19: What Will Change, What Will Not?
The World After COVID-19: What Will Change, What Will Not?
Mixed Retailing / Consumer Goods Retailing is likely to see a significant shakeout over the next few years. The cracks have been apparent for some years: Decreasing footfall, and empty units on many high streets and shopping malls, amid the shift to online shopping. A shift to the suburbs and further growth in online shopping will change retailing further. Rents in the highest end Manhattan shopping districts have already fallen noticeably since the start of the year, especially Lower Fifth Avenue (between 42nd and 49th Streets) which is dominated by large chain stores (Chart 31). Shopping malls, particularly undistinguished ones in poorer areas, will continue to suffer. Overall, the US in particular has an excess of retailing space, almost five times as much per capita as the major European economies (Chart 32). Chart 31Manhattan Retail Store Rents Already Falling Sharply
The World After COVID-19: What Will Change, What Will Not?
The World After COVID-19: What Will Change, What Will Not?
Chart 32The US Has Far Too Much Retail Space
The World After COVID-19: What Will Change, What Will Not?
The World After COVID-19: What Will Change, What Will Not?
But it is hard to predict the winners from this shake-out. Overall spending by consumers is unlikely to be significantly affected, so it is a matter of forecasting which companies and formats will emerge victorious. Will Walmart and Target and other large retail chains improve their online offering to fight back against Amazon? Facebook, Shopify, and others have set up new services to compete with Amazon on price – will they be successful? Will small stores start to win back market share? Will supermarkets figure out how to make profits from their order-online-and-deliver services (which are now very costly because most often a human has to run around the store picking out the items ordered), or will new, fully automated competitors emerge? Will new technologies materialize to make it easier to buy clothes online (for example, digitized body measuring systems)? These changes will also affect producers of consumer products. They will have to understand the new channels, and adapt their offerings and positioning strategies accordingly. These changes will make the sector a tricky one. A skilled fund manager might be able to predict which companies’ strategies will be successful. But it could be a problematic area for investors owning individual stocks within the sector who do not have detailed expertise. Garry Evans, Senior Vice President Global Asset Allocation garry@bcaresearch.com Footnotes 1 Please see The Bank Credit Analyst, "Beyond The Virus," dated May 22, 2020 and Geopolitical Strategy, "Nationalism And Globalization After COVID-19," dated June 26, 2020. 2 Peter E. Drucker, "The Ecological Vision: Reflections on the American Condition," 1993, p.340. 3 Jonathan I. Dingel and Brent Neiman, "How Many Jobs Can Be Done At Home?" NBER Working Paper No. 26948, April 2020. 4 OWL Labs, “The State of Remote Work Report,” available at www.owllabs.com. 5 Pew Research Center survey conducted March 19-24 2020. Please see https://www.pewsocialtrends.org/2020/03/30/most-americans-say-coronavirus-outbreak-has-impacted-their-lives/psdt_03-30-20_covid-impact-00-4/ 6 Gajendran, R.S., & Harrison, D.A., “The Good, the Bad, and the Unknown about Telecommuting”, Journal of Applied Psychology 92(6), 2007. 7 Nicholas Bloom, James Liang, John Roberts & Zhichun Jenny Ying, “Does Working from Home Work? Evidence From a Chinese Experiment,” The Quarterly Journal of Economics (2015), 165-218. 8 Please see educationdata.org. 9 Ateev Mehrotra, Michael Chernew, David Linetsky, Hilary Hatch, and David Cutler, "The Impact of the COVID-19 Pandemic on Outpatient Visits: A Rebound Emerges," The Commonwealth Fund, dated May 19, 2020. 10For more on the long-term outlook for the health care sector, Global Asset Allocation Special Report, "The Healthcare Revolution: The Case For Staying Overweight," dated July 24, 2020, available at gaa.bcaresearch.com. 11Please see Global Asset Allocation Special Report, "The Healthcare Revolution: The Case For Staying Overweight,"dated July 24, 2020, available at gaa.bcaresearch.com.
Highlights While difficult to forecast, the trajectory of global auto sales likely will follow that of GDP growth (Chart of the Week). As a result, palladium’s supply constraints will re-emerge, but its “epic rally” likely unfolds at a slower pace as global economic conditions normalize at an uneven rate.1 We expect the COVID-19 pandemic will be contained – likely via a vaccine later this year or early next year, if public-health officials are correct in their assessments, and populations become habituated to observing social-distancing and face-mask measures.2 There is evidence to suggest that in the post-pandemic world consumers will avoid public transportation in favor of their own vehicles. This would lift palladium demand at the margin – assuming environmental regulations are not relaxed dramatically. South Africa’s derelict power grid will continue to limit palladium supply growth, despite new investment in Russia. We expect palladium prices to remain close to current levels at ~ $2,300/oz to year-end. Chart of The WeekGlobal Auto Production Will Follow GDP’s Trajectory
Global Auto Production Will Follow GDP's Trajectory
Global Auto Production Will Follow GDP's Trajectory
Feature COVID-19 clobbered palladium, just as it has commodities generally – taking prices from close to $2,900/oz in February to just under $1,600/oz in mid-March (Chart 2). Since then, prices rallied to more than $2,350/oz and are now languishing just above $2,200/oz. As dramatic as the metal’s price action has been, the pandemic's demand destruction only provided a respite from what remains a fraught supply backdrop. Chart 2Palladium’s Rollercoaster Ride Will Not Encourage New Output
Expect Backwardation To Persist Palladium's Rollercoaster Ride ill Not Encourage New Output
Expect Backwardation To Persist Palladium's Rollercoaster Ride ill Not Encourage New Output
South African palladium output, which represents 36% of global supply, is once again threatened by rolling electricity blackouts, which have plagued the economy for years.3 Russia accounts for 42% of global palladium supply, and its top producer, Nornickel is maintaining production guidance of ~2.7mm ounces of palladium output this year. Even so, Nornickel expects global palladium output will total ~ 6.3mm ounces this year, down 1.3 mm ounces from 2019 levels (Chart 3).4 Inventories remain tight, and, with any recovery, can be expected to contract further (Chart 4). Chart 3Palladium's Physical Deficit Will Persist
Palladium's Physical Deficit Will Persist
Palladium's Physical Deficit Will Persist
Chart 4Any Increase In Automobile Demand Will Further Strain Inventories
Any Increase In Automobile Demand Will Further Strain Inventories
Any Increase In Automobile Demand Will Further Strain Inventories
This will continue a decade-long contraction in supply relative to demand, which spurred prices from $407.3/oz in 2010 to current levels but failed to energize supply growth or capex, which, from 2015 to 2019, grew by 7% and 15.2%, respectively. Auto Production Drives Palladium Demand Forecasting a recovery in palladium demand is extremely difficult, so much so even the most in-the-know market participants have suspended their usual balances assessments.5 All the same, there is a strong relationship between GDP and automobile production, as the Chart of the Week shows.6 This production drives the demand for palladium, as it is critical to the functioning of anti-pollution technology in gasoline-powered cars, which predominate in the global automobile market. Monthly car production in our sample peaked in November 2017 at 5.6mm units. In our modeling, we expected production will come in at ~ 4.3mm units in December of this year, and 4.6mm units in December 2021. This translates into a downturn of close to 6% in auto production this year versus 2019, and a recovery of ~ 9% for next year. If realized, this year’s downturn in auto production would only amount to a brief respite from the chronic supply-side weakness that has plagued the palladium market for a decade. In its May 2020 assessment, Johnson Matthey (JM) projects South African platinum-group metals (PGM) mining output will fall “at least 20%” this year. This suggests to us the physical deficits in palladium will widen and continue to do so over the medium term, which, all else equal – i.e., the global economic recovery we anticipate remains on track – will force prices higher if for no other reason than to attract capex to the PGM space. Upside Price Risk For Palladium Palladium prices will be prone to upside risk if the massive fiscal and monetary stimulus deployed globally is effective in reviving consumer demand for automobiles as household budgets are restored (Chart 5). Chart 5Rising Incomes Will Boost Auto Demand
Rising Incomes Will Boost Auto Demand
Rising Incomes Will Boost Auto Demand
We find GDP (income) growth is an important explanatory variable for price, and would expect rising incomes in DM and EM markets would restore global employment growth and consumer confidence, leading to higher demand for new autos (Chart 6). In addition, anti-pollution regulations continue to be enforced, although states could relax these to help auto manufacturers reduce unsold inventories and to reduce the overall contribution palladium makes to a vehicle’s cost (Chart 7). Chart 6Fiscal And Monetary Stimulus Will Revive Consumer Demand
Fiscal And Monetary Stimulus Will Revive Consumer Demand
Fiscal And Monetary Stimulus Will Revive Consumer Demand
These regulations pushed palladium loadings in internal-combustion engines globally up 14% last year, led by stout increases in Europe and China, according to JM. At 9.6mm ounces of the total gross demand for palladium, autocatalysts accounted for ~ 84% of global consumption last year (Chart 8). Chart 7Environmental Regulations Drive Palladium Demand
Environmental Regulations Drive Palladium Demand
Environmental Regulations Drive Palladium Demand
Chart 8Autocatalysts Dominate Palladium Demand
Palladium’s Recovery To Follow Auto Sales
Palladium’s Recovery To Follow Auto Sales
Bottom Line: The COVID-19 pandemic provided a respite for the palladium market’s relentless drive to take prices high enough to encourage new capex to bring no new supply. However, with the massive stimulus now deployed globally, we expect global GDP growth to revive in line with the World Bank’s estimates, which drive our modeling of GDP growth. This will cause demand for automobiles to revive next year, pushing demand for palladium higher as supplies are contracting – assuming, of course, governments do not relax environmental regulations pushing demand for the metal higher. Robert P. Ryan Chief Commodity & Energy Strategist rryan@bcaresearch.com Fernando Crupi Research Associate Commodity & Energy Strategy FernandoC@bcaresearch.com Commodities Round-Up Energy: Overweight Brent crude oil trade through $46/bbl, or ~ 3.7% in early trading Wednesday, on the back of sharp inventory drawdowns for the week ended reported by the US EIA Wednesday. We continue to forecast a physical deficit for the balance of the year and expect to see continued draws as a result. Our price forecast for the 2H20 remains at $44/bbl and $65/bbl next year for Brent, with WTI expected to trade ~ $3/bbl below that this year and next (Chart 9). Base Metals: Neutral Copper production in Peru, the second-largest producer in the world, fell 20.4% y/y in 1H20, according to mining.com. Production appears to have recovered by June, with output increasing almost 41% m/m to 180,792 MT. The government began relaxing its quarantine restrictions, imposed in March, in May. Precious Metals: Neutral We are moving our rolling stop on gold to $1,950/oz at tonight’s close, up from our previous stop of $1,850/oz. Gold was trading close to $2,050/oz early Wednesday. We also are moving our silver stop-loss to $26/oz at tonight’s close, up from $23.50/oz, and making this a strategic position. We remain bullish these precious metals, expecting central banks globally, led by the Fed, to continue to flood markets with liquidity, particularly USD liquidity. This will keep real rates low, and will, in our view, continue to support a weakening of the USD, both of which are bullish for gold and silver (Chart 10). The Fed has made it clear they are not considering any rate increases in the foreseeable future, which will lead markets to expect continued weakness in real rates. Ags/Softs: Underweight The USDA reported 72% of the US corn crop was in good-to-excellent condition for the week ended August 2, compared to 57% for the same period last year in the 18 states accounting for 91% of the crop. 73% of the soybean crop was in good-to-excellent condition vs. 54% last year at this time. Chart 9
Oil Price Rally Remains Intact
Oil Price Rally Remains Intact
Chart 10
USD Weakening Bullish For Precious Metals
USD Weakening Bullish For Precious Metals
Footnotes 1 Please see Epic Palladium Rally Likely Continues, which we published February 27, 2020. 2 Please see Anthony Fauci Explains Why the US Still Hasn’t Beaten Covid published by wired.com July 29, 2020. 3 Eskom, the South African electricity monopoly supplying ~ 90% of the country’s power, resumed rolling blackouts last month as COVID-19-induced lockdowns were relaxed. The lockdowns provided a brief respite to the overloaded grid. Please see Eskom: SA on the brink of load shedding again, as six units ‘trip-out’ published by thesouthafrican.com news service July 27, 2020. We discuss this in our earlier publication cited in fn 1. 4 Please see Pandemic helps Russia tighten its grip on a key strategic metal published by miningweekly.com July 2, 2020. 5 See, e.g., Johnson Matthey’s Pgm Market Report: May 2020 published May 18, 2020, which notes, “At the time of writing, it was not possible to quantify these changes to supply and demand and we have elected not to publish forecasts for 2020. Our autocatalyst pgm demand models incorporate external industry estimates of vehicle production; at the time of preparing our report, these industry forecasts for 2020 were undergoing regular downgrades as the pandemic progressed across Asia and then to Europe and North America. It is also unclear to what extent primary and secondary supplies will be disrupted.” 6 Automobile demand also could get a boost at the margin from more people choosing to use their own cars and light vehicles instead of public transportation in the post-COVID-19 world. The IBM Institute for Business Value surveyed 25k US consumers in April, and found COVID-19 prompted almost 20% of their sample to say they intended to use their personal vehicles more frequently. Please see https://newsroom.ibm.com/2020-05-01-IBM-Study-COVID-19-Is-Significantly-Altering-U-S-Consumer-Behavior-and-Plans-Post-Crisis. Investment Views and Themes Recommendations Strategic Recommendations Tactical Trades Trade Recommendation Performance In 2020 Q2
Palladium’s Recovery To Follow Auto Sales
Palladium’s Recovery To Follow Auto Sales
Commodity Prices and Plays Reference Table Trades Closed In Summary of Trades Closed In
Palladium’s Recovery To Follow Auto Sales
Palladium’s Recovery To Follow Auto Sales
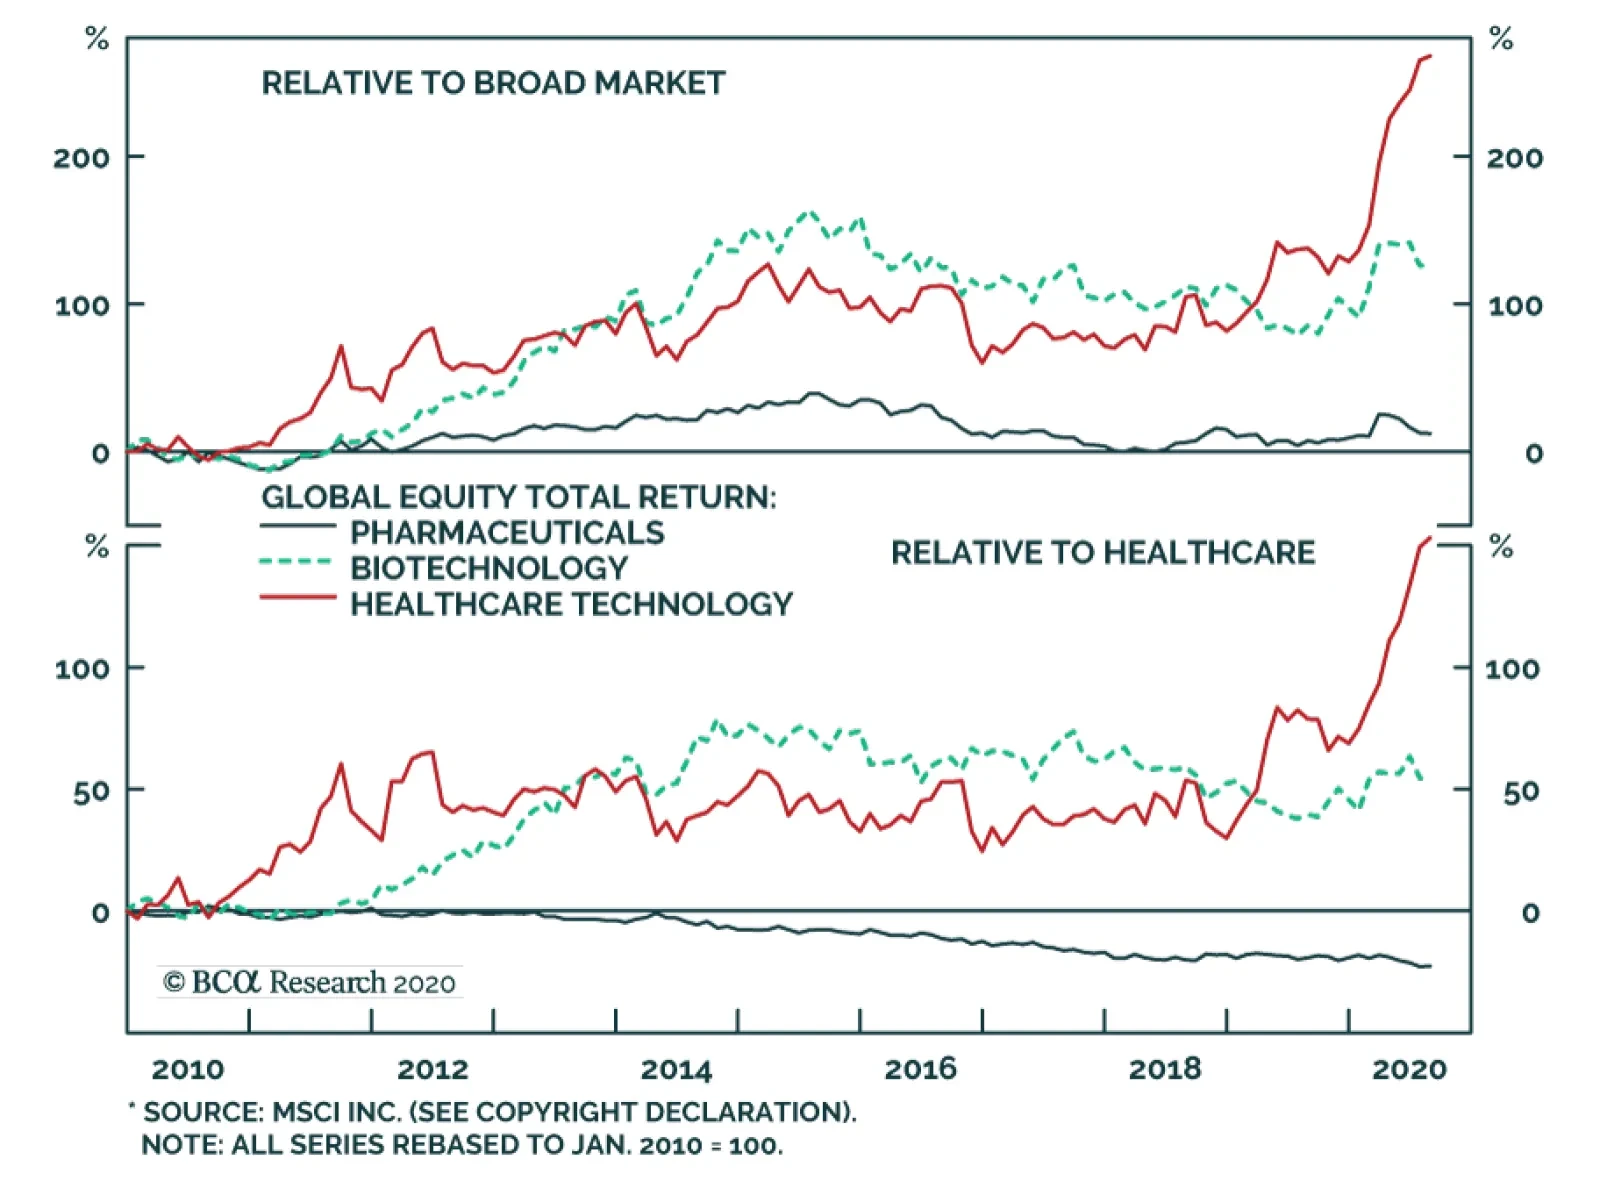
BCA Research's Global Asset Allocation service reiterates its longstanding overweight on healthcare equities for the next 12 months and possibly beyond. The macro environment, as well as underlying demand factors, will continue to drive the sector’s…
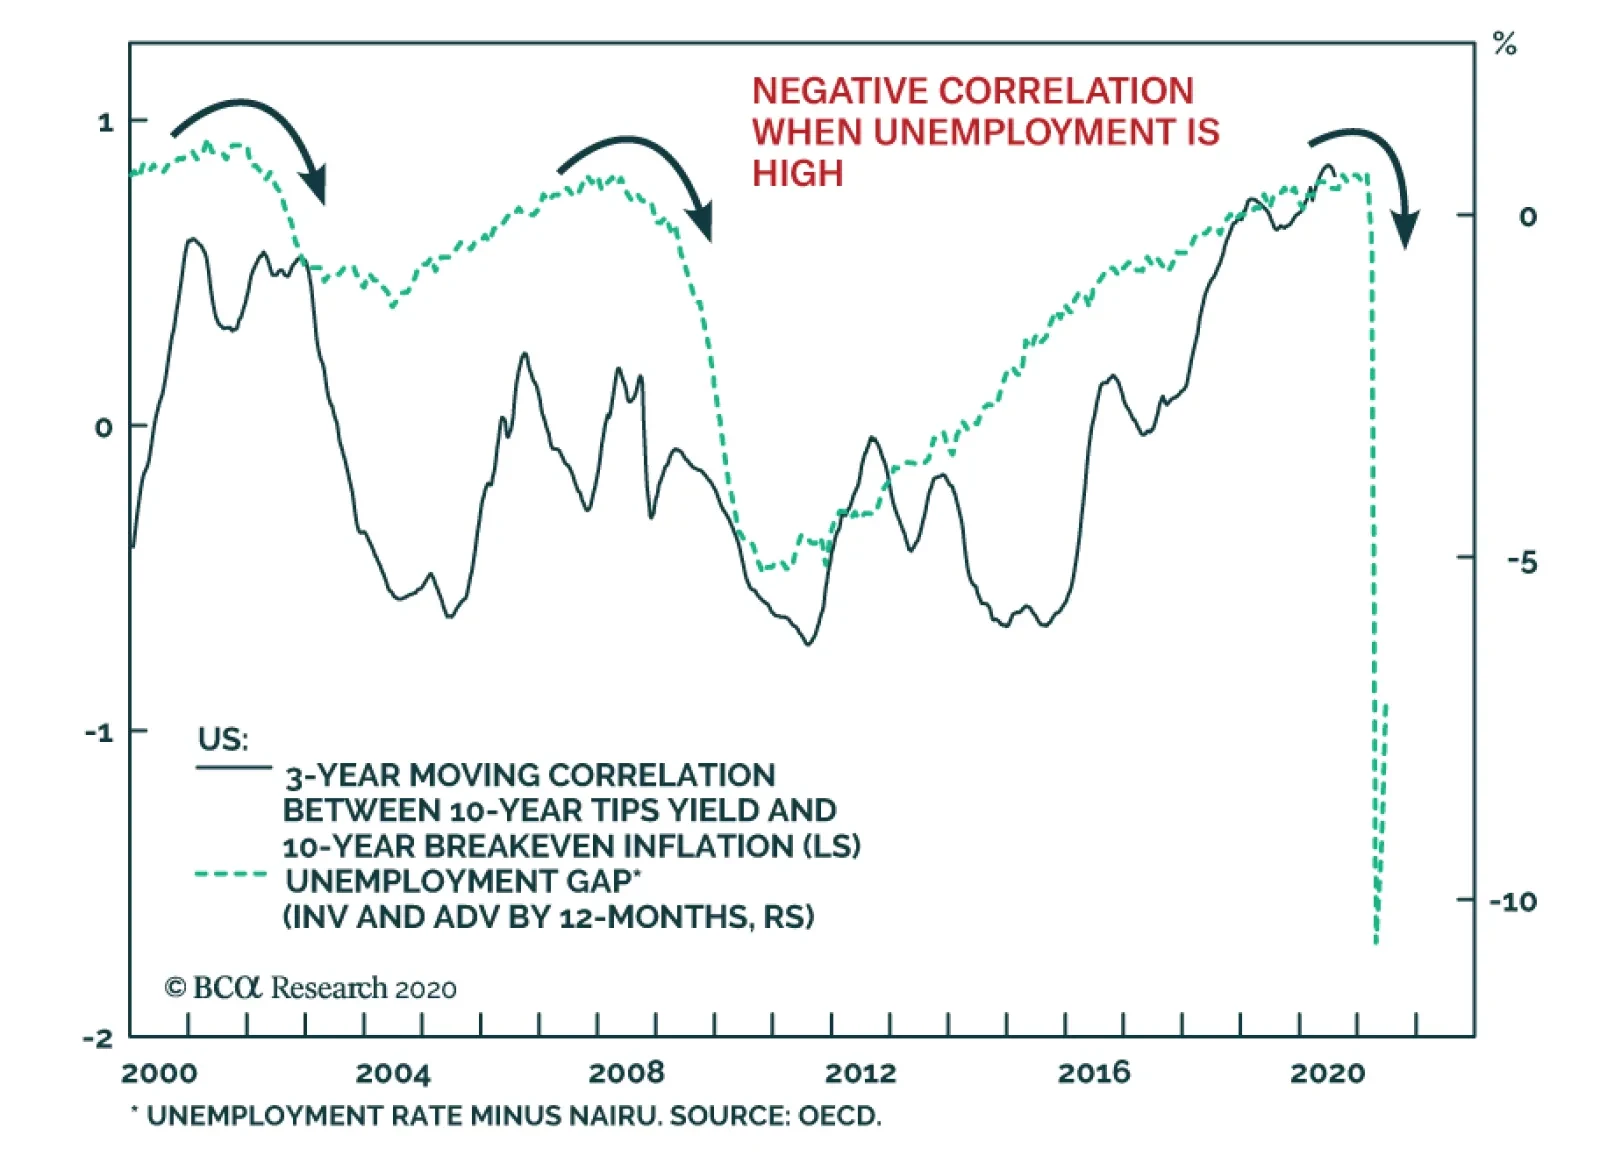
BCA Research's Global Fixed Income Strategy service concludes that the growing divide between falling negative real bond yields and rising inflation expectations in major developed economies may be a sign of investors pricing in slower long-run potential…