Global
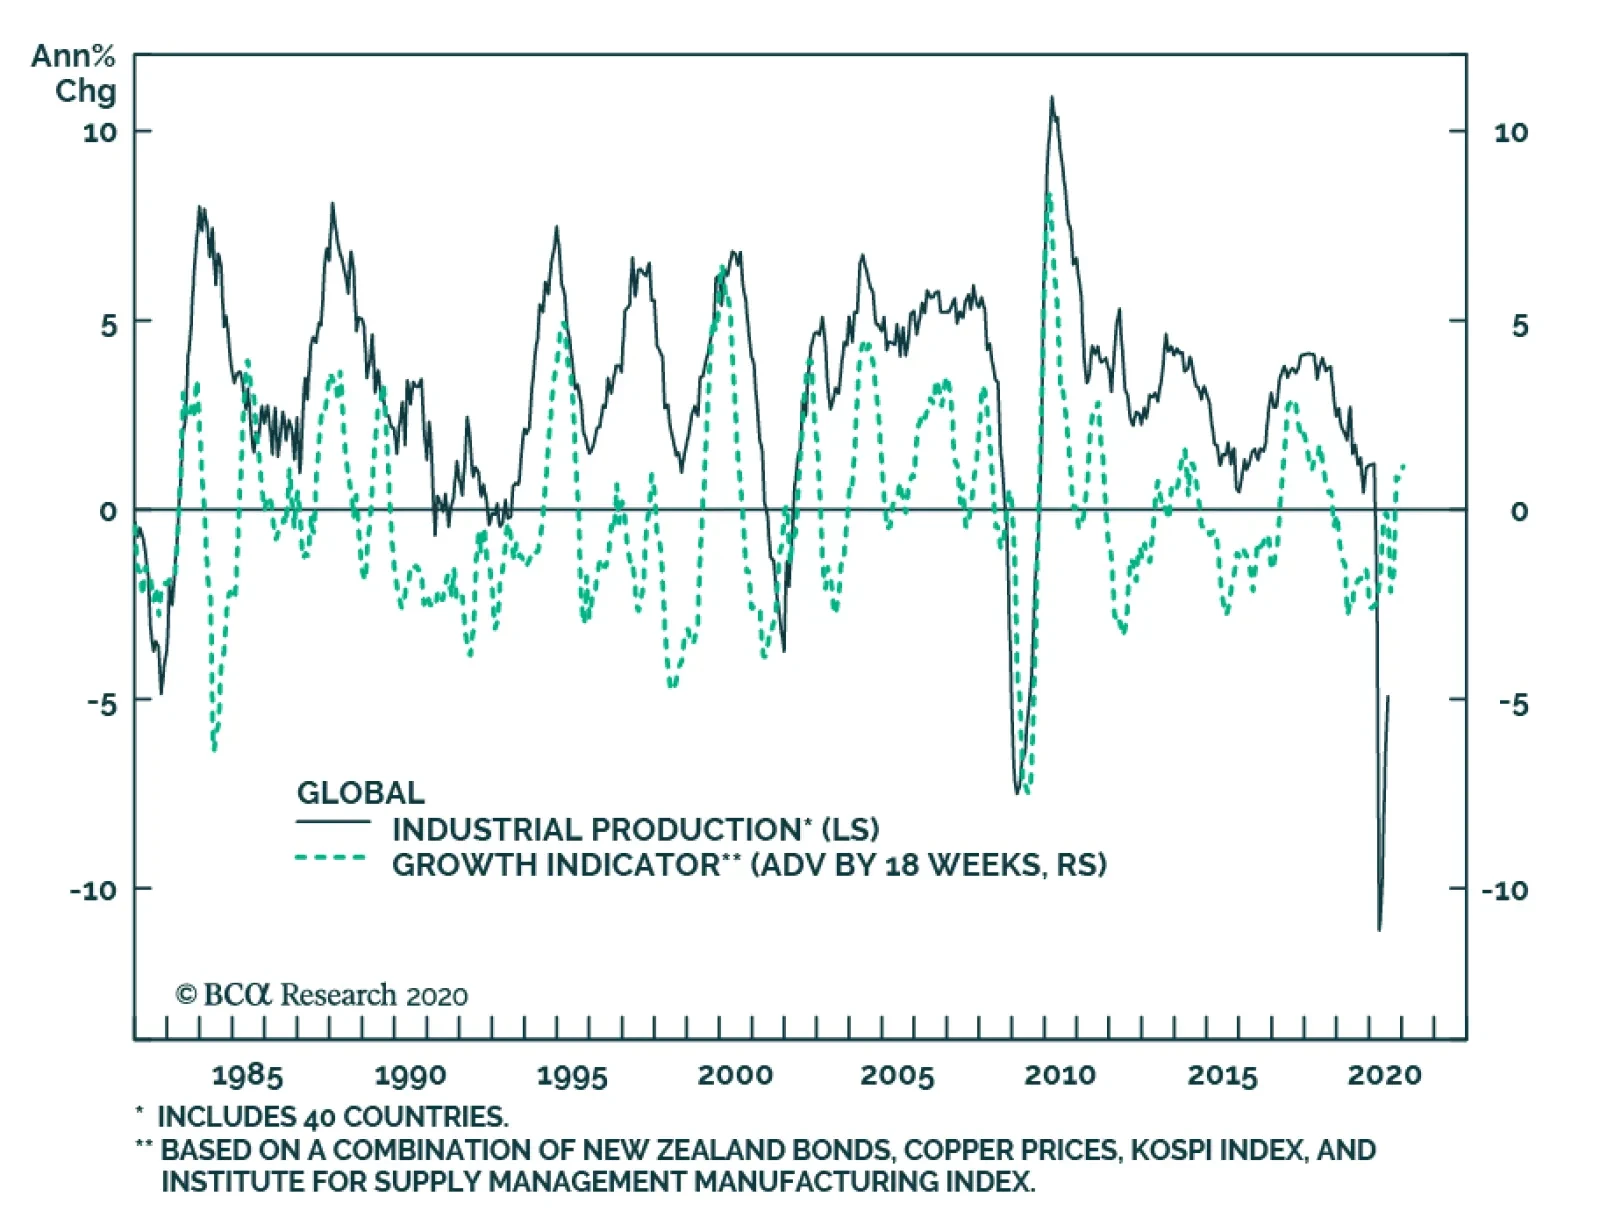
Our Global Growth Indicator continues to firm up, which suggests that the global industrial recovery has further to run. This sustained increase in the Global Growth Indicator is a reflection of five factors. First, the global policy environment remains…

Highlights China’s surge in refined copper imports allows it to cover a structural short position it has in this critical commodity – mostly in its unrefined state – and ensures the stimulus being deployed to revive its economy ahead of the 100th anniversary of the founding of the Communist Party in July will not falter due to a lack of basic raw materials (Chart of the Week). We expect continued resilience in commodities generally into 2021 – particularly in base metals, iron ore and crude oil – as markets realize China’s Communist Party is intent on showcasing its brand of policy-driven, vertically integrated capitalism as the engine of its robust economic growth. As with oil, we expect copper demand will benefit from a weaker USD and stronger global trade. The odds of a COVID-19 vaccine being available by year-end or early 2021 remain favorable, which also will support a revival in demand.1 We are keeping our COMEX copper forecast at $3.00/lb at end-2020, and expect 2021 to finish at $3.15/lb. We would not be surprised by higher prices, and are, therefore, getting long December 2021 COMEX copper at tonight's close. Feature The surge in refined copper imports hedged Chinese firms against supply disruptions caused by the pandemic and reduced availability of scrap copper on global markets this year. COVID-19 may have derailed the Communist Party’s realization of the “Chinese Dream” this year, wherein the leadership vowed real per-capita GDP would double in the decade ending in 2020, but it is unlikely to diminish the celebration of the Party’s 100th anniversary in July.2 Chart of the WeekVol Falls As Know Unknowns Are Resolved
Vol Falls As Know Unknowns Are Resolved
Vol Falls As Know Unknowns Are Resolved
The global commodity-demand destruction caused by the COVID-19 pandemic depressed the prices of commodities generally, particularly those which China is structurally short – e.g., copper, iron ore, oil and natural gas. As terrible as the pandemic has been in human terms, it has allowed Chinese firms and the State Reserve Bureau to sharply increase imports of refined copper, which rose 34% in the January-to-July period to 2.5mm MT amid such low prices, which bottomed at $2.10/lb in late March and now are trading above $3.00/lb.3 China accounts for more than 50% of global refined copper consumption and ~ 40% of refined production (Chart 2).4 Chart 2China Dominates Metals Consumption
China's Copper Buying Spree Heralds Communist Party's Centenary Celebrations
China's Copper Buying Spree Heralds Communist Party's Centenary Celebrations
The surge in refined copper imports hedged Chinese firms against supply disruptions caused by the pandemic and reduced availability of scrap copper on global markets this year. Global copper ore and concentrate supply fell ~ 3% y/y in 2Q20, led by a 28% decline in Peru’s mine production, according to the World Bureau of Metal Statistics (Chart 3). This was a result of containment policies that limited mining activities to slow the pandemic’s spread in Latin America. In Chile, COVID-19 cases stabilized in recent months at around 100 per million people (Chart 4). In Peru, cases have been declining since August, but from an elevated level. Supply is expected to recover rapidly as these economies reopen, but further mine disruptions remain a risk. Chart 3Peru's Copper Ore Supplies Recovering
Peru's Copper Ore Supplies Recovering
Peru's Copper Ore Supplies Recovering
Chart 4COVID-19 Copper Supply Risks Falling
COVID-19 Copper Supply Risks Falling
COVID-19 Copper Supply Risks Falling
Commodity-Demand Indicators Move Higher we expect the effect of expansionary monetary and fiscal policies globally will continue to show up in our indicators and for the US dollar to resume its downward trajectory. Global central banks and government stimulus unleashed in the wake of the COVID-19 pandemic, combined with a depreciating US dollar, pushed our commodity-demand indicators higher over the last few months (Chart 5). This supported copper prices, which are up 42% since their March 23 low. Moreover, the pickup in economic activity in China’s major trading partners provided further support to copper demand, given that ~ 17% of China’s copper consumption comes from exports of products containing copper (Chart 6).5 Chart 5Commodity Demand Is Reviving
Commodity Demand Is Reviving
Commodity Demand Is Reviving
Chart 6Expect Chinese Employment Gains As Economy Continues To Recover
Expect Chinese Employment Gains As Economy Continues To Recover
Expect Chinese Employment Gains As Economy Continues To Recover
For the balance of 2H20, we expect the effect of expansionary monetary and fiscal policies globally will continue to show up in our indicators and for the US dollar to resume its downward trajectory. These are key factors driving our positive view on metal – especially copper – prices. Communist Party’s 100th Anniversary Will Boost Commodity Prices China’s buying spree for commodities it is structurally short – particularly copper, iron ore and oil – minimizes the risk fiscal and monetary stimulus deployed to revive its economy will be derailed this year or next. This is particularly important next year: We expect stimulus will continue and will be hitting the economy full force in time for the Communist Party’s centennial celebrations in July. For the infrastructure and construction spending that will be spurred by the massive stimulus, this is critical to spurring employment – a key goal of the Party’s domestic harmony focus – domestic manufacturing, services, and exports (Chart 6).6 This will keep demand for copper – and commodities generally – strong into 2021, as markets realize China’s Communist Party is intent on showcasing its brand of policy-driven, vertically integrated capitalism as the engine of its world-beating economic performance. And, because stocks of critical commodities are increasing as stimulus is hitting the domestic economy next year, the risk of massively inflating prices while the county is celebrating the Party’s centennial in July – as happened following the Global Financial Crisis (GFC) – is minimized, but not completely eliminated (Chart 7). Chart 7COMEX Stocks Will Move To China
COMEX Stocks Will Move To China
COMEX Stocks Will Move To China
That said, we still expect copper to move higher next year. In our modeling of prices, we note world PMIs, EM FX rates, the USD, also drive copper prices, in addition to those factors discussed above specific to China. We expect COMEX high-grade copper prices to end 2020 at $3.00/lb, and to average $3.11/lb next year (Chart 8). On the back of this expectation, we are getting long December 2021 COMEX copper at tonight’s close, expecting 2021 to end at $3.15/lb. Chart 8Copper Prices Expected To Increase
Copper Prices Expected To Increase
Copper Prices Expected To Increase
Risks To Our Copper View Geopolitical risks remain the chief threat to our bullish copper view. The US Presidential election campaign rhetoric, in particular, has turned bellicose vis-à-vis China, with President Donald Trump threatening to “decouple” economically from China if he is reelected.7 These sorts of pronouncement threaten to escalate what could now be considered a trade dispute to an all-out trade war, particularly if it includes sanctions against US firms investing in manufacturing and services in China, as Trump promises. At the limit, this would put a long-term bid under the USD, and reverse the nascent recovery in commodity demand resulting from a weaker dollar. Outright military confrontation between the US and China also is a risk, particularly as tensions in the South China Sea and the Asia-Pacific region continue. The most likely confrontation would be an escalation of hostilities resulting from a naval or aerial face-off, the number of which has been steadily increasing. The threat of a second wave of COVID-19 also remains a risk, particularly if it results in another round of lockdowns globally. That said, we believe the odds of this are very low, as the capacity to absorb another shutdown in economic activity in DM and EM economies likely has been exhausted by measures already implemented this year. It is highly unlikely any economy can afford another round of economic shutdown without triggering an economic depression. Bottom Line: China’s surge in refined copper imports allows it to cover its structural short position in the commodity, and, equally importantly, to ensure an expected revival of economic activity into 2021 – when the Communist Party celebrates its 100th anniversary – will not falter because it lacks basic raw materials. We are keeping our COMEX copper forecast at $3.00/lb at end-2020, and expect 2021 prices to average $3.11/lb. On the back of this expectation, we are getting long December 2021 COMEX copper at tonight’s close. Robert P. Ryan Chief Commodity & Energy Strategist rryan@bcaresearch.com Hugo Bélanger Associate Editor Commodity & Energy Strategy HugoB@bcaresearch.com Commodities Round-Up Energy: Overweight Brent prices dipped below $40/bbl for the first time since mid-June. Prior to this move, prices had been stable in a narrow range around $43/bbl since mid-June. Pessimism is increasing re the outlook for demand, as Saudi Arabia reduced its official selling prices (OSPs) for crude delivered to Asian buyers by $1.40/bbl. The negative sentiment was exacerbated by the selloff in tech stocks that began last Thursday. WTI net speculative positions are down to 20% of total open interests vs. 22% in July, as hedge funds exit oil markets. Base Metals: Neutral The LMEX index is up 4% over the past four weeks, supported by higher metals’ consumption and imports in China. Moreover, mobility trends in Europe, Japan, and the US have begun to turn up again in recent weeks based on Apple mobility data. The recovery in China’s economic activity remains the main pillar of our base metals outlook. However, Europe, Japan, and the US still represent a non-negligible share of global metal demand (e.g. ~ 24% copper consumption). Hence, the recent uptick in mobility data is constructive for base metal prices. Precious Metals: Neutral Gold prices are down 2% since last week, pressured by a slight increase in the US dollar and real rates. The divergence in COVID-19 cases between the US and Europe increases the risk of a short-term bounce higher if this leads to the US economy outperforming that of the EU (Chart 9). Still, mounting geopolitical risks ahead of the US election, lower-for-longer interest rates, and a resumption of the downward trend in the USD over the medium term should support gold later this year. Ags/Softs: Underweight Soybean prices remain steady, near 2-year highs. The USDA crop progress report listed 55% of soybeans in good or excellent condition for the week ending September 6, 2020. This is a substantial deterioration compared to 66% in those categories last week and 73% at the beginning of August. Corn futures were supported by similar weak supply fundamentals. The USDA reported 55% of corn crops in good or excellent condition against 62% the previous week. Going forward, it will be important to monitor the DXY as it has been strengthening since the beginning of September and could be a headwind to these commodity prices if it breaks to the upside (Chart 10). Chart 9EU Cases Are Rising
EU Cases Are Rising
EU Cases Are Rising
Chart 10US DXY Strengthening
US DXY Strengthening
US DXY Strengthening
Footnotes 1 Please see Lower Vol As OPEC 2.0 Gains Control, published September 3, 2020, for additional discussion of vaccine availability. 2 Please see Iron Ore, Steel Poised For Rally, which we published February 13, 2020, for a discussion of the commodity-market implications of China’s dual policy goals of doubling GDP between 2010 and 2020 and preparing for the celebration of the 100th anniversary of the founding of the Chinese Communist Party in 1921. It is available at ces.bcaresearch.com. 3 Please see China's July refined copper imports surge 90% on year boosted by open arbitrage published by S&P Global Platts September 1, 2020. 4 China also accounts for close to 50% of copper ore imports, according to he Observatory of Economic Complexity (OEC). 5 Please see The Impact of the COVID-19 Pandemic on World Copper Supply, published by the International Copper Study Group on May 21, 2020. 6 For an update of the stimulus measures and China’s economic performance, please see China Macro And Market Review published September 9, 2020, by our China Investment Strategy colleagues. It is available at cis.bcaresearch.com. 7 Please see Trump threatens to ‘decouple’ U.S. economy from China, accuses Biden of ‘treachery’ published by marketwatch.com September 7, 2020. Investment Views and Themes Recommendations Strategic Recommendations Tactical Trades Trade Recommendation Performance In 2020 Q2
Lower Vol As OPEC 2.0 Gains Control
Lower Vol As OPEC 2.0 Gains Control
Commodity Prices and Plays Reference Table Trades Closed in 2020 Summary of Closed Trades
Lower Vol As OPEC 2.0 Gains Control
Lower Vol As OPEC 2.0 Gains Control
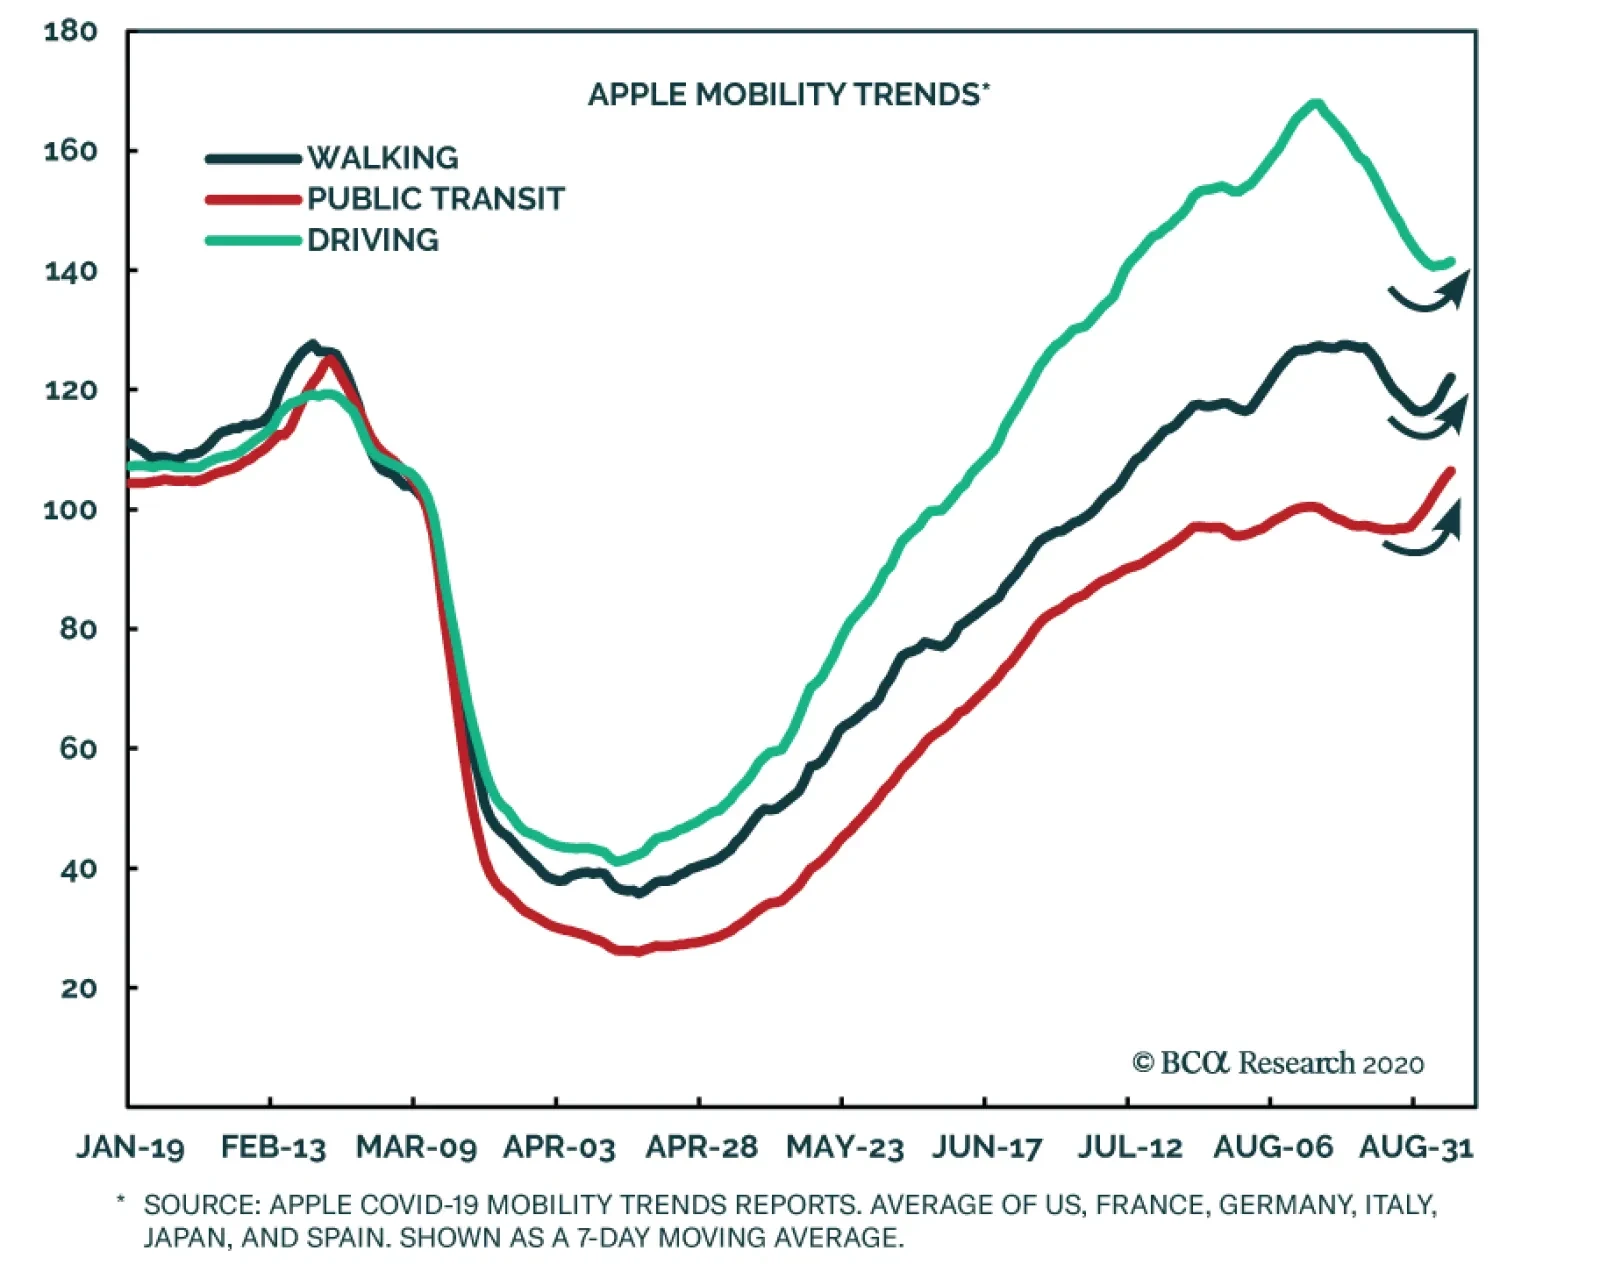
The rolling second wave of infections between the US, Europe and Japan has done little more than to flatten the curve of mobility in recent months. In fact, the August vacations in Europe had a more pronounced effect on driving patterns for advanced economies…
To all clients, Next week, in lieu of publishing a regular report, I will be hosting a webcast on September 15th at 10 am EDT, discussing our latest views on global fixed income markets. Sign up details for the Webcast will arrive in your inboxes later this week. Best regards, Robert Robis, Chief Fixed Income Strategist Feature Much of the global rebound in economic activity, and recovery in equity and credit markets, seen since the COVID-19 shock earlier this year can be attributed to historic levels of monetary and fiscal stimulus. However, the effective transmission of various monetary policy measures such as liquidity injections and refinancing operations, and by extension a sustained global recovery, is dependent on the continued smooth flow of credit from lenders to borrowers. As such, the tightening in bank lending standards seen across developed markets in the second quarter of 2020 could imperil the recovery if banks remain cautious with borrowers (Chart 1). Chart 1Credit Standards Across Developed Markets
Introducing The GFIS Global Credit Conditions Chartbook
Introducing The GFIS Global Credit Conditions Chartbook
This week, we are introducing the BCA Research Global Fixed Income Strategy (GFIS) Global Credit Conditions Chartbook—a review of central bank surveys of bank lending standards and loan demand. We will be publishing this chartbook on an occasional basis going forward to help inform our fixed income investment recommendations. Where it is relevant to our analysis, we will also make special note of the one-off questions asked in some of these surveys that are germane to the economic situation at hand. Where To Find The Bank Lending Surveys A number of central banks publish regular surveys of bank lending conditions in their domestic economies. The surveys, and the details on how they are conducted, can be found on the websites of the central banks: US Federal Reserve: https://www.federalreserve.gov/data/sloos.htm European Central Bank: https://www.ecb.europa.eu/stats/ecb_surveys/bank_lending_survey/html/index.en.html Bank of England: https://www.bankofengland.co.uk/credit-conditions-survey/ Bank of Japan: https://www.boj.or.jp/en/statistics/dl/loan/loos/index.htm/ Bank of Canada: https://www.bankofcanada.ca/publications/slos/ Reserve Bank of New Zealand: https://www.rbnz.govt.nz/statistics/c60-credit-conditions-survey US Chart 2US Credit Conditions
US Credit Conditions
US Credit Conditions
Overall credit standards for US businesses, measured as an average of standards faced by small, medium and large firms, tightened dramatically in Q2/2020 (Chart 2). Unsurprisingly, gloomier economic outlooks, reduced risk tolerance, and worsening industry-specific problems were the top reasons cited by US banks for tightening standards. US banks reported that commercial and industrial (C&I) loan demand from all firms also weakened in Q2, owing to a decrease in customers’ inventory financing and fixed investment needs. This suggests that the surge in actual C&I loan growth data during the spring was fueled by companies drawing down credit lines to survive the lack of cash flow during the COVID-19 lockdowns and should soon peak. Standards for consumer loans tightened significantly in Q2, as well. A continuation of this trend would pose a major risk to the US economic recovery, given the still fragile state of US consumer confidence. Business lending standards typically lead US high-yield corporate bond default rates by about one year, suggesting that defaults will continue to climb over the next few quarters (Chart 2, top panel). Tightening US junk bond spreads have ignored the rising trend in defaults and now provide no compensation for the likely amount of future default losses, suggesting poor value in the overall US high-yield market (Chart 3). Turning to the real estate market, lending standards have tightened significantly for both commercial and residential mortgage loans (Chart 4). In a special question asked in the Q2 survey, US banks indicated that lending standards for both those categories are at the tighter end of the range that has prevailed since 2005. Business lending standards typically lead US high-yield corporate bond default rates by about one year, suggesting that defaults will continue to climb over the next few quarters. Chart 3US Junk Spreads Do Not Compensate For Default Risk
US Junk Spreads Do Not Compensate For Default Risk
US Junk Spreads Do Not Compensate For Default Risk
Chart 4The White Picket Fence Is Looking Out Of Reach
The White Picket Fence Is Looking Out Of Reach
The White Picket Fence Is Looking Out Of Reach
Euro Area Italy is seeing the greater benefit from ECB support, however, with loan growth now at a new cyclical high. Chart 5Euro Area Credit Conditions
Euro Area Credit Conditions
Euro Area Credit Conditions
In contrast to the US, credit standards actually eased slightly in the euro area in Q2/2020 (Chart 5). Banks reported increased perceptions of overall risk from a worsening economic outlook, but that was more than offset by the massive liquidity and loan guarantee programs that were part of the policy response to the COVID-19 recession. Going forward, banks expect lending standards to tighten as the maximum impact of those policies begins to fade. Credit demand from firms rose in Q2, driven by acute liquidity needs during the COVID-19 lockdowns. At the same time, demand for longer-term financing for capital expenditure was very depressed. Banks expect credit demand to normalize in Q3, as easing lockdown restrictions dampen the immediate need for liquidity. Credit demand from euro area households plummeted in Q2. Banks reported that plunging consumer confidence was the leading cause of decline in credit demand, followed closely by reduced spending on durable goods. Consumer confidence has already rebounded and banks expect demand to follow suit, as economies re-open and spending opportunities return. Chart 6HY Spreads In The Euro Area Are Unattractive
HY Spreads In The Euro Area Are Unattractive
HY Spreads In The Euro Area Are Unattractive
As with the US, we expect that tighter credit standards to firms will drive up euro area high-yield default rates. Current euro area high-yield spreads offer little compensation for the coming increase in default losses, suggesting a similar poor valuation backdrop to US junk bonds (Chart 6). Looking at the four major euro area economies, credit standards eased across the board in Q2, with the largest moves seen in Italy and Spain (Chart 7). The ECB’s liquidity operations have helped support lending in those countries, each with a take-up from long-term refinancing operations (LTROs) equal to around 14% of total bank lending (Chart 8). Italy is seeing the greater benefit from ECB support, however, with loan growth now at a new cyclical high and Spanish banks projecting a much sharper tightening of lending standards in Q3 relative to Italian banks. Chart 7Loan Growth Accelerating Across Most Of The Euro Area
Loan Growth Accelerating Across Most Of The Euro Area
Loan Growth Accelerating Across Most Of The Euro Area
Chart 8Italy & Spain Taking Full Advantage Of LTROs
Italy & Spain Taking Full Advantage Of LTROs
Italy & Spain Taking Full Advantage Of LTROs
UK For consumers, UK banks are projecting loan demand to improve in Q3, although that will require a sharper rebound in consumer confidence than has been seen to date. Chart 9UK Credit Conditions
UK Credit Conditions
UK Credit Conditions
In the UK, corporate credit standards eased significantly in Q2 2020 thanks to the massive liquidity support programs provided by the UK government (Chart 9). Lenders reported a larger proportion of loan application approvals from all business sizes, with the greatest improvements seen in small businesses and medium-sized private non-financial corporations (PNFCs). However, lenders indicated that average credit quality on new PNFC borrowing facilities had actually declined, with default rates increasing, for all sizes of borrowers. This divergence between increased lending and declining borrower creditworthiness attests to the impact of the UK’s substantial liquidity provisions in response to the COVID-19 shock. The credit demand side mirrors the supply story with a massive spike in Q2 2020. In contrast to euro area counterparts, UK businesses reportedly borrowed primarily to facilitate balance sheet restructuring. However, as with the euro area, the story for Q3 is much more bearish. Banks are projecting credit standards to turn more restrictive as stimulus programs run out and borrowers rein in credit demand. Going forward, decreasing risk appetite of UK banks will likely contribute to a tightening in lending standards. For consumers, UK banks are projecting loan demand to improve in Q3, although that will require a sharper rebound in consumer confidence than has been seen to date. UK banks surprisingly reported that the average credit quality of new consumer loans improved in Q2, suggesting that consumer loan demand could rebound strongly in Q3 as lockdown restrictions fade. Japan Perversely, the latest improvement in Japanese business optimism could translate to lower business loan demand going forward. Chart 10Japan Credit Conditions
Japan Credit Conditions
Japan Credit Conditions
Before the pandemic hit, credit standards in Japan were in a structural tightening trend for both firms and households (Chart 10). Fiscal authorities have taken a number of measures to ease conditions for businesses, including low interest rate loan programs and guarantees for large businesses as well as small and medium-sized enterprises, which has translated into the easiest credit standards for Japanese firms since 2005. The correlation between business loan demand and business conditions is not as clear-cut in Japan compared to other countries. Japanese firms tend to borrow more when the economic outlook is poor, indicating that loans are being used to meet emergency funding or restructuring needs rather than being put towards capital expenditure or inventory financing. Perversely, the latest improvement in Japanese business optimism could translate to lower business loan demand going forward. However, the consumer picture is a bit more conventional—consumer loan demand and confidence tend to track quite closely. While consumer confidence has yet to stage a convincing rebound, it has clearly bottomed. The more positive projections for consumer loan demand from the Japan bank lending survey seem to confirm this message. Canada And New Zealand In Canada, business lending standards tightened in Q2/2020 as loan growth slowed (Chart 11). Although loan growth is far from contracting on a year-on-year basis, further tightening in conditions could pose an obstacle to Canadian recovery. On the mortgage side, the Canadian government has been active in easing pressures for lenders by relaxing loan-to-value requirements for mortgage insurance, making it easier for them to collateralize and sell their assets to the Canadian Mortgage and Housing Corporation (CMHC). Although this has yet to translate to the standards faced by borrowers, residential mortgage growth remains buoyant. In New Zealand, credit standards for firms (including both corporates and SMEs) tightened significantly in Q2 (Chart 12). Many banks expect to apply tighter lending standards to borrowers in industries most impacted by the pandemic, such as tourism, accommodation, and construction. Demand for credit from firms was driven by working capital needs while capital expenditure funding demands fell drastically. Chart 11Canada Credit Conditions
Canada Credit Conditions
Canada Credit Conditions
Chart 12New Zealand Credit Conditions
New Zealand Credit Conditions
New Zealand Credit Conditions
On the consumer side, residential mortgage standards increased somewhat, and banks expect to perform more due diligence on income and job security. The hit to credit demand was broad-based across credit card, secured, and unsecured lending and coincided with a sharp fall in loan demand. Shakti Sharma Research Associate ShaktiS@bcaresearch.com Robert Robis, CFA Chief Fixed Income Strategist rrobis@bcaresearch.com Recommendations The GFIS Recommended Portfolio Vs. The Custom Benchmark Index
Introducing The GFIS Global Credit Conditions Chartbook
Introducing The GFIS Global Credit Conditions Chartbook
Duration Regional Allocation Spread Product Tactical Trades Yields & Returns Global Bond Yields Historical Returns
BCA Research’s Global Investment Strategy service predicts inflation will rise when unemployment rates return to their pre-pandemic level in three or four years. National savings can shrink either because the private sector is spending more or earning less.…
Highlights Oil-price volatility will remain subdued as markets correctly downgrade measurable risks on the supply side and upgrade financial conditions supporting demand (Chart of the Week). OPEC 2.0’s spare capacity – ~ 7mm b/d – presents the producer coalition with an opportunity to gain control of the evolution of global supply, and to restrain price volatility as global storage levels fall. Scaling production and delivery of a COVID-19 vaccine will be challenging, given limited global production and distribution capacity.1 This will slow down – but not derail – a recovery in demand. Lingering policy uncertainty will restrain a speedy return to pre-COVID-19 demand levels. Looming large are US election uncertainty and mounting geopolitical tensions. Our forecast attaches a significantly higher probability to Brent crude oil prices trading above $65/bbl next year, vs. the 15% probability the market is discounting in options for December 2021 delivery. Feature As OPEC 2.0 gains control of the evolution of the supply side, global fiscal and monetary policy accommodation will keep global financial conditions supportive of demand. Oil-price volatility will remain subdued, as market participants correctly price in continued OPEC 2.0 production discipline and cohesion within the coalition led by the Kingdom of Saudi Arabia (KSA) and Russia. In addition, the coalition’s substantial spare capacity – ~ 7mm b/d, most of which is in KSA – will, as we have argued elsewhere, present OPEC 2.0 with an opportunity to influence production moreso than in pre-COVID-19 markets: It will be able to respond to higher prices quicker than US shale oil producers, as was demonstrated in 2018 when KSA took its production from less than 10mm b/d to 11.1mm b/d between June and November (Chart 2). This means OPEC 2.0 can move quickly to capture economic rents, which will slow the recovery of the shales – already limited by parsimonious capital markets – and increase OPEC 2.0’s global market share (Chart 3).2 Chart of the WeekVol Falls As Known Unknowns Are Resolved
Vol Falls As Known Unknowns Are Resolved
Vol Falls As Known Unknowns Are Resolved
Chart 2OPEC 2.0 Quick Response Spare Capacity Advantage
OPEC 2.0 Quick Response Spare Capacity Advantage
OPEC 2.0 Quick Response Spare Capacity Advantage
Chart 3Ensures Production Restraint
Ensures Production Restraint
Ensures Production Restraint
As OPEC 2.0 gains control of the evolution of the supply side, global fiscal and monetary policy accommodation will keep global financial conditions supportive of demand (Chart 4). We expect the US Federal Reserve’s monetary policy, which will now focus on reviving the labor market and on achieving a 2% average PCE index core inflation rate, to weaken the USD, which also will be supportive of oil demand.3 Demand also will be supported by expectations – and the realization – of a COVID-19 vaccine, which is expected later this year or early next year. Limited production and logistical constraints will make it difficult to scale delivery of a vaccine globally until infrastructure is built out. This will restrain – but not derail – the recovery in demand we expect (Chart 5). Lingering policy uncertainty – particularly around the upcoming US elections and mounting geopolitical tensions – remain obstacles for the recovery. Chart 4Global Financial Conditions Will Support Demand
Global Financial Conditions Will Support Demand
Global Financial Conditions Will Support Demand
Chart 5Demand Expected To Recover Smartly
Demand Expected To Recover Smartly
Demand Expected To Recover Smartly
Well-managed supply, coupled with steadily improving demand already apparent in the data, will allow storage to draw over the next year without raising oil-price volatility, which typically occurs when spare capacity is low (Chart 6).4 Chart 6Falling Storage Will Not Spike Vol This Time
Lower Vol As OPEC 2.0 Gains Control
Lower Vol As OPEC 2.0 Gains Control
Oil Vol Will Stay Lower Volatility bursts typically are presaged by increases in implied volatility as hedgers and speculators react to new information coming into the market. As the Chart of the Week indicates, a surge in volatility caused by either a supply or demand shock typically is followed by a more tranquil period after markets adjust to the shock. These volatility bursts typically are presaged by increases in implied volatility as hedgers and speculators react to new information coming into the market.5 Following the resolution of the elevated risk conditions prompting the increased option trading, historical volatility, which is calculated using the annualized returns of the underlying assets, typically increases then tails off, as can be seen in the experience of 2019-20 – i.e., pre- and intra-COVID-19 markets (Chart 7). Chart 7Implied Vol Typically Leads Realized Vol
Lower Vol As OPEC 2.0 Gains Control
Lower Vol As OPEC 2.0 Gains Control
Ahead of meetings of OPEC and its Ministerial Monitoring Subcommittee, internet searches move upward along with implied volatilities. Increases in oil-price volatility also are accompanied by heightened interest in news specific to oil markets or OPEC. Market participants usually expect OPEC countries will adjust output as needed following swift changes in underlying global demand – e.g., the COVID-19 demand shock – and non-OPEC supply. Ahead of meetings of OPEC and its Ministerial Monitoring Subcommittee, internet searches move upward along with implied volatilities in expectation of supply adjustments from OPEC (Chart 8). The relationship actually has strengthened since 2014, following OPEC’s market-share war and the ensuing OPEC 2.0 agreement to drain the accumulated global oil inventories. Since its formation, OPEC 2.0 has played a crucial role in balancing oil markets. This makes every meeting highly relevant for markets. Moreover, when oil prices move abruptly, internet searches for “OPEC” or “OPEC MEETING” generally move higher as investors seek guidance from the producer coalition to assess where prices will go next. High levels of speculation can affect oil price volatility. Hence, the higher the interest in oil prices from retail and institutional investors, the larger the increase in implied volatility ahead of these meetings.6 Chart 8Implied Vol Follows Google Search Activity
Implied Vol Follows Google Search Activity
Implied Vol Follows Google Search Activity
Implied Volatility And Efficient Markets Implied volatility, like prices discovered in competitive trading markets, impounds all information available to market participants buying and selling options. As it is an estimate of the standard deviations of returns for the underlying asset against which options are traded, it can be used to estimate the probability market participants assign to the realization of a particular price outcome (Chart 9). As an be seen in Chart 9, the market is pricing more in line with the US EIA’s expectation Brent prices will average $50/bbl next year, as opposed to our estimate of $65/bbl. Based on the settlement values for prices and volatilities on Monday, the December 2021 Brent futures contract has a 15% probability of expiring above $65/bbl (Chart 10). Chart 9Markets Pricing To EIA Assumptions
Lower Vol As OPEC 2.0 Gains Control
Lower Vol As OPEC 2.0 Gains Control
Chart 10BCA Price Forecasts
Lower Vol As OPEC 2.0 Gains Control
Lower Vol As OPEC 2.0 Gains Control
Investment Implications Our forecast attaches a higher probability to Brent crude oil prices trading above $65/bbl next year, vs. the 15% probability the market currently is discounting in options for December 2021 delivery. Our econometric modeling gives us a higher expected value for Brent prices next year than what markets currently are pricing in, based on our assessment of the distributions derived from option implied volatilities. This means the cost of gaining exposure to the upside in the Brent market next year is low, relative to our expected value, as vol drives option prices. We remain long 2H21 Brent vs. short 2H22 Brent given our expectation. We also will be looking for opportunities to get long call options or option spreads in 2H21. Bottom Line: OPEC 2.0’s spare capacity of ~ 7mm b/d (OPEC + Russia and its allies spare capacity), will allow it to gain control of global supply growth, and to manage price volatility as global storage levels fall. Our forecast attaches a higher probability to Brent crude oil prices trading above $65/bbl next year, vs. the 15% probability the market currently is discounting in options for December 2021 delivery. We remain long Brent exposure next year and look for opportunities to buy calls and call spreads. Robert P. Ryan Chief Commodity & Energy Strategist rryan@bcaresearch.com Hugo Bélanger Associate Editor Commodity & Energy Strategy HugoB@bcaresearch.com Commodities Round-Up Energy: Overweight Brent prices remain in the $40/bbl to $46/bbl range in which it had been trading since mid-June. The Fed’s shift to an average inflation targeting regime makes inflation expectations an increasingly important variable to its monetary policy decisions. This implies commodities – oil in particular – will have a larger effect on interest rates due to their crucial influence on market-based inflation expectations (Chart 11). Base Metals: Neutral The LMEX and copper prices rose 5% and 6%, respectively, in August, supported by rising global manufacturing PMIs. At first glance, China’s manufacturing PMI disappointed last month as it fell to 51 from 51.1 in July. However, the underlying recovery in its industrial sector remains in place according to our China Investment strategists. The New Orders and Export Orders components of the index increased, indicating the demand-side of the economy is picking up. Metals’ prices also continued being supported by further declines in the US dollar index. The USD index ended the month of August below the upward trend line that has supported its lows since 2011.7 Precious Metals: Neutral Gold and silver prices are up 2% and 5%, respectively, since Jerome Powell’s Jackson Hole speech. According to our US and Global Bond strategists “The official shift to an average inflation targeting regime represents a massive structural break relative to how the Fed conducted monetary policy in the past.”8 Consequently, precious metals will benefit from a lower dollar and a prolonged period of depressed interest rates. The Fed’s decision also increased gold’s attractiveness as an inflation hedge. Ags/Softs: Underweight Soybean prices have rallied to their highest level since June 2018 (Chart 12). Crops were affected by droughty weather in the Midwest during August. The Crop Progress report listed 66% of soybeans in good or excellent condition, compared with 73% of soybeans in those categories at the beginning of the month. Strong demand from China has been supportive of prices. According to the data, for the 2019/20 marketing year, US soybean exports to China are higher than last year, but still account for only half of pre-trade war exports in volume terms. Outstanding sales to China booked for the 2020/21 marketing year are the highest since 2012/13. This is a clear indication of continued commitment to the phase one trade deal. Finally, the weak USD has been yet another tailwind for soybean prices. Chart 11Rising Oil Prices Will Revive Inflation Expectations
Rising Oil Prices Will Revive Inflation Expectations
Rising Oil Prices Will Revive Inflation Expectations
Chart 12Soybeans Prices Rising
Soybeans Prices Rising
Soybeans Prices Rising
Footnotes 1 Please see The latest in the global race for a COVID-19 vaccine published by the American Enterprise Institute August 25, 2020, which notes that 29 of the 167 vaccines under development are in human trials. Six of these candidates are in Phase III trials. 2 This outsized spare capacity also gives KSA a potent tool in enforcing production discipline within the OPEC 2.0 coalition, which was demonstrated earlier this year in the brief market-share war initiated by Russia following the breakdown in negotiations to extend the coalition’s production cuts. Please see KSA, Russia Will Be Forced To Quit Market-Share War, which we published March 19, 2020. It is available at ces.bcaresearch.com. 3 For an excellent discussion of the Fed’s policy change, which was announced by Chair Jerome Powell last week, please see A New Dawn For US Monetary Policy, a Special Report published by BCA Research’s Global Fixed Income Strategy and US Bond Strategy on September 1, 2020. It is available at gfis.bcaresearch.com. 4 For our latest view on oil fundamentals, please see The Oil Markets' Knife Edge, which we published last week. 5 Implied volatility is the estimated standard deviation of returns that solves an option pricing model. This empirical fact was explored in depth in Ogawa, Yoshiki, (1989), “Market Expectations Evident In Crude Oil Futures Options Volatility Measures Since The Opening Of The Option Trading In November 1986,” IFAC Energy Systems. Management and Economics, Tokyo, Japan, pp. 337-341. See also Feedback Loop: Spec Positioning & Oil Price Volatility, which we published May 10, 2018; and Ryan, Bob and Tancred Lidderdale (2009), “Energy Price Volatility and Forecast Uncertainty,” published by the US EIA. 6 Please see Campos, I., Cortazar, G., and Reyes, T. (2017), "Modeling and predicting oil VIX: Internet search volume versus traditional variables," Energy Economics, Elsevier, 66(C): 194-204. 7 Please see BCA Research Daily Insights A Worrying Month of August For The Dollar published August 31, 2020. 8 Please see A New Dawn For US Monetary Policy, a Special Report published by BCA Research’s Global Fixed Income Strategy and US Bond Strategy on September 1, 2020. Investment Views and Themes Recommendations Strategic Recommendations Tactical Trades Trade Recommendation Performance In 2020 Q2
Lower Vol As OPEC 2.0 Gains Control
Lower Vol As OPEC 2.0 Gains Control
Commodity Prices and Plays Reference Table Trades Closed in 2020 Summary of Closed Trades
Lower Vol As OPEC 2.0 Gains Control
Lower Vol As OPEC 2.0 Gains Control
Highlights EM domestic fundamentals, global trade and commodities prices, as well as global financial market themes are the main drivers of EM financial assets and currencies. The positive effect of improving global growth and rising commodity prices on EM currencies (ex-China, Korea and Taiwan) has been offset by these countries’ inferior domestic fundamentals. The odds of a near-term US dollar rebound are rising. This will likely produce a setback in EM currencies, fixed-income markets and equities. However, such a setback will likely prove to be a buying opportunity. Increased central bank intervention in asset markets may diminish the importance of fundamentals in determining the asset prices. Feature Chart I-1Unusual Divergences
Unusual Divergences
Unusual Divergences
EM risk assets have done well in absolute terms but have underperformed their DM counterparts. This is unusual given the substantial weakness in the US dollar and the rally in commodities prices since April (Chart I-1). Until early this year, many commentators had argued that monetary policies of DM central banks were the principal drivers of EM financial markets. Given the zero interest rates and money printing that is prevalent in DM, the underperformance of EM equities and currencies is especially intriguing. Is this underperformance an aberration or is it fundamentally justified? What really drives EM performance? Back To Basics As we have argued over the years, EM risk assets and currencies are primarily driven by their domestic fundamentals, rather than by the actions and policies of the US Federal Reserve or the ECB. The critical determinant of EM stocks’ absolute as well as relative performance versus DM equities has been corporate profits. Chart I-2 illustrates that relative equity performance and relative EPS between EM and the US move in tandem, both in common and, critically, local currency terms. Similarly, the main reason why EM share prices in absolute terms have failed to deliver positive returns over the past 10 years is that their profits have been stagnant over the same period, even prior to the pandemic (Chart I-3). Interestingly, fluctuations in EM EPS resemble those of Korea’s exports. This reflects the importance of global growth in shaping EM profit trends. Chart I-2Corporate Profits Drive EM Absolute And Relative Performance
Corporate Profits Drive EM Absolute And Relative Performance
Corporate Profits Drive EM Absolute And Relative Performance
Chart I-3EM EPS Has Been Flat For 10 Years
EM EPS Has Been Flat For 10 Years
EM EPS Has Been Flat For 10 Years
The key drivers of EM risk assets and currencies have been and remain: 1. EM domestic fundamentals that can be encapsulated by a potential risk-adjusted return on capital. The latter is impacted by both cyclical and structural growth trajectories, as well as by the quality and composition of growth. Risks to growth can be gauged based on factors such as (but not limited to): productivity, wages, inflation, fiscal and balance of payment positions, the global economic and financial environment, and the health of the banking system. In EM (ex-China, Korea and Taiwan), the fundamentals remain challenging: The business cycle recovery is slower in these economies than it is in China and advanced economies. Fiscal stimulus has not been as large as in many advanced countries, while the pandemic situation has been worse. Their banking systems were already fragile before the pandemic, and have lately been hit by defaults stemming from the unprecedented recession. These governments have less room than in DM and China, to stimulate fiscally and bail out debtors and banks. Banks in EM (ex-China, Korea and Taiwan) will continue struggling for some time, and their ability to finance a new expansion cycle will, for now, remain constrained (Chart I-4). A restructuring of non-performing loans and a recapitalization of banks will be required to kick-start a new credit cycle in many of these economies. 2. Global growth, especially relating to China’s business cycle and commodities. The recovery in China since April, along with rising commodities prices have been positive for EM (ex-China, Korea and Taiwan). Given the substantial stimulus injected into the Chinese economy, its recovery will continue well into next year (Chart I-5). As a result, higher commodities prices will benefit resource producing economies by supporting their balance of payments and enhancing income growth. Chart I-4EM ex-China: Limited Bank Support For Growth
EM ex-China: Limited Bank Support For Growth
EM ex-China: Limited Bank Support For Growth
Chart I-5China's Stimulus Entails More Upside In Commodity Prices
China's Stimulus Entails More Upside In Commodity Prices
China's Stimulus Entails More Upside In Commodity Prices
3. Global financial market themes: a search for yield and leadership of new economy stocks. Global investment themes have an important bearing on EM financial markets. For example, in recent years, the increased market cap of new economy and semiconductor stocks – due to an exponential rise in their share prices – has amplified their importance for the aggregate EM equity index. The largest six mega cap stocks in the EM benchmark are new economy and semiconductor companies, and make up about 25% of the EM MSCI market cap. The six FAANGM stocks presently account for about 25% of the S&P 500. Hence, the concentration risk in EM is as high as it is in the US. Consequently, the trajectory of new economy and semiconductor stocks globally will be essential to the performance of the EM equity index. On August 20, we published an in-depth Special Report assessing near-term and structural outlooks for global semiconductor stocks. With new economy and semiconductor share prices going parabolic worldwide, we are witnessing a full-fledged mania, as we discussed in our July 16 report. The equal-weighted US FAANGM stock index has risen by 24-fold in nominal and 20-fold in real (inflation-adjusted) terms, since January 1, 2010 (Chart I-6). Chart I-6History Of Manias Of Past Decades
History Of Manias Of Past Decades
History Of Manias Of Past Decades
In brief, with respect to magnitude and duration, the bull market in FAANGM is on par with the bubbles of previous decades (Chart I-6). Those bubbles culminated in bear markets, where prices fell by at least 50% after topping out. Chart I-7EM ex-TMT Stocks: Absolute And Relative Performance
EM ex-TMT Stocks: Absolute And Relative Performance
EM ex-TMT Stocks: Absolute And Relative Performance
We do not know when the FAANGM rally will end. Timing a reversal in a powerful bull market is impossible. Also, we are not certain about the magnitude of such a potential drawdown. Nevertheless, our message is that the risk-reward tradeoff of chasing FAANGM at this stage is very unattractive. Excluding technology, media and telecommunication (TMT) – as most growth stocks are a part of TMT– EM equities remain in a bear market (Chart I-7, top panel). In relative terms, EM ex-TMT stocks have massively underperformed their global peers (Chart I-7, bottom panel). Even with a larger weighting of mega-cap growth TMT stocks than the overall DM equity index, the aggregate EM equity index has underperformed the overall DM index. Bottom Line: EM domestic fundamentals, global trade and commodities prices, and global financial market themes are the main drivers of EM financial assets and currencies. What About The Dollar? The high correlation of the trade-weighted US dollar and EM equities is due to the following: (1) the greenback has been a countercyclical currency; and (2) the US dollar’s exchange rate against EM currencies reflects relative fundamentals in the US versus EM economies. When a global business cycle accelerates, the broad trade-weighted US dollar weakens. If this growth acceleration is led by China and other emerging economies, the greenback depreciates considerably versus EM currencies. The opposite is also true. In other words, the US dollar exchange rate’s strong negative correlation to EM equities is primarily due to the fact that the greenback’s exchange rates against EM currencies reflect both the global business cycle as well as EM growth and fundamentals. Chart I-8Divergence Between DM And EM Currencies
Divergence Between DM And EM Currencies
Divergence Between DM And EM Currencies
In recent months, the greenback has: (1) depreciated due to the global economic recovery; (2) tumbled versus DM currencies due to the still raging pandemic and the socio-political instability in the US as well as the Fed’s commitment to staying behind the inflation curve in the years to come; and (3) not fallen much against EM (ex-China, Korea and Taiwan) currencies because their fundamentals have been poor, as discussed above. Bottom Line: Exchange rates in EM (ex-China, Korea and Taiwan) have failed to appreciate versus the dollar despite the latter’s plunge versus other DM currencies (Chart I-8). The positive effect of improving global growth and rising commodities prices on EM currencies (ex-China, Korea and Taiwan) has been offset by these countries’ inferior domestic fundamentals. Flows And Cash On The Sidelines Chart I-9Cash On The Sidelines Has Been Produced By The Fed's Debt Monetization
Cash On The Sidelines Has Been Produced By The Fed's Debt Monetization
Cash On The Sidelines Has Been Produced By The Fed's Debt Monetization
What about capital flows? Aren’t they essential in driving EM financial markets? Of course, they are important. However, we view flows as resulting from and determined by fundamentals. Over the medium and long term, we assume that capital flows to regions where the return on capital is high or rising. Thus, we see ourselves as responsible for directing investors to those areas that we have identified as providing a high or rising return on capital (and cautioning investors when the opposite is true). The presumption is that beyond short-term volatility, investment flows will gravitate to countries/sectors/asset classes with high or rising returns on capital, just as they will abandon areas of low or falling returns on capital. In brief, fundamentals drive flows and flows determine asset price performance. Isn’t sizable cash on the sidelines a reason to be bullish? Yes, there is substantial cash on the sidelines. Along with zero short-term rates, this has been the potent force leading investors to purchase equities, credit and other risk assets since late March. Below we examine the case of the US, but this has also been true in many markets around the world. The top panel of Chart I-9 demonstrates that US institutional and retail money market funds – a measure of cash on the sidelines - presently stand at $4.2 trillion, having increased by $900 billion since March. Yet, the Fed and US commercial banks have increased their debt securities holdings by $2.9 trillion since March. Furthermore, the Fed and US commercial banks hold $10.6 trillion of debt securities (Chart I-9, middle panel) – amounting to 18% of the aggregate equity and US dollar fixed-income market value (Chart I-9, bottom panel). These securities, held by the Fed and US commercial banks, are not available to non-bank investors. Chart I-10Investors' Cash Holdings Ratio Is Still Elevated
Investors' Cash Holdings Ratio Is Still Elevated
Investors' Cash Holdings Ratio Is Still Elevated
Excluding debt securities owned by the Fed and commercial banks, we reckon that cash on the sidelines is equal to 8.4% of the value of equities and US dollar debt securities available to non-bank investors (Chart I-10). This is a relatively high cash ratio. Unprecedented purchases by the Fed and US commercial banks have not only removed a considerable chuck of debt securities from the market; they have also created money “out of thin air”. When central or commercial banks acquire a security from, or lend to, a non-bank entity, they are creating new money “out of thin air”. No one needs to save for the central bank and commercial banks to lend to or purchase a security from a non-bank. In short, savings versus spending decisions by economic agents (non-banks) do not affect the stock of money supply. We have deliberated on these topics at length in past reports. In sum, the Fed’s large purchases of debt securities amount to a de facto monetization of public and private debt. These operations have both reduced the amount of securities available to investors and boosted the latter’s cash balances. Hence, the Fed has boosted asset prices not only indirectly, by lowering short-term interest rates, but also directly, by printing new money and shrinking the amount of securities available to investors. We have in recent months argued that global risk assets are overpriced relative to fundamentals. However, investors have continued to deploy cash in asset markets, pushing prices higher. Given the zero money market interest rates and the still elevated cash balances, one can envision a scenario in which cash continues to be deployed in asset markets, pushing valuations to bubble levels across all risk assets. Pressure on investors to deploy their cash amid rising asset prices implies that only a major negative shock might be able to reverse this rally. There have been plenty of reasons to be cautious, including escalating US-China geopolitical tensions, the increasing odds of a contested US presidential election and, hence, elevated political uncertainty, the possibility of a US fiscal cliff, and a potential second wave of the pandemic. However, investors have so far shrugged off all of these and continue to allocate capital to risk assets. Bottom Line: Increased central bank intervention in asset markets may diminish the importance of fundamentals in determining the price of risk assets. This would also mean that the role of momentum investing and psychology may increase. Investment Strategy Currencies: The US dollar has become oversold and could stage a rebound in the near term. The euro has risen to its technical resistance (Chart I-11). The EM currency index (ex-China, Korea and Taiwan) has failed to break above its 200-day moving average (Chart I-12, top panel). The emerging Asian trade-weighted currency index (ADXY) has rebounded to the upper boundary of its falling channel (Chart I-12, bottom panel). Chart I-11A Short-Term Resistance For Euro/USD
A Short-Term Resistance For Euro/USD
A Short-Term Resistance For Euro/USD
Chart I-12EM Currencies Have Not Entered A Bull Market
EM Currencies Have Not Entered A Bull Market
EM Currencies Have Not Entered A Bull Market
Such technical profiles suggest that EM currencies have not yet entered a bull market despite the greenback’s considerable depreciation against DM currencies. This is a reflection of the poor fundamentals of EM (ex-China, Korea and Taiwan). In short, the odds of a US dollar rebound are rising. This could dent commodities prices and weigh on EM currencies. We continue recommending shorting a basket of EM currencies versus the euro, CHF and JPY. The downside in these DM currencies versus the greenback is limited. The euro could drop to 1.15, but not much below that level. Our basket of EM currencies to short includes: BRL, CLP, ZAR, TRY, PHP, KRW and IDR. Chart I-13EM Local Currency Bonds: Looking For A Better Entry Point
EM Local Currency Bonds: Looking For A Better Entry Point
EM Local Currency Bonds: Looking For A Better Entry Point
Fixed-Income Markets: We have been neutral on EM local currency bonds and EM credit markets (USD bonds) since April 23 and June 4, respectively. The strategy is to wait for a correction in these markets before going long. The rebound in the US dollar and correction in commodities will provide a better entry point for these fixed-income markets (Chart I-13). Equities: On July 30, we recommended shifting the EM equity allocation within a global equity portfolio from underweight to neutral. In the near term, EM share prices will likely continue underperforming their DM counterparts. A bounce in the US dollar, rising geopolitical tensions between the US and China, as well as the continuation of a FAANGM-driven mania in US equities will result in EM equity underperformance versus DM. However, in the medium- to long-term, the balance of risks no longer justifies an underweight allocation. Arthur Budaghyan Chief Emerging Markets Strategist arthurb@bcaresearch.com Equities Recommendations Currencies, Credit And Fixed-Income Recommendations
The month of August continued to deliver outsized returns for global equities. US stocks remained among the best performing markets globally. That being said, while Japanese equities underperformed US stocks, they generated greater abnormal returns than the…
Recommended Allocation
Monthly Portfolio Update: Can Monetary Policy Alone Propel The Market?
Monthly Portfolio Update: Can Monetary Policy Alone Propel The Market?
Chart 1Only Internet Stocks Have Kept On Rising
Only Internet Stocks Have Kept On Rising
Only Internet Stocks Have Kept On Rising
It has been a very strange bull market. Although global equities are up 52% since their bottom on March 23rd, the rally has been limited largely to internet-related stocks. Excluding the three sectors (IT, Consumer Discretionary, and Communications) which house the internet names, equities have moved only sideways since May (Chart 1). Moreover, the rally comes amid sporadic serious new outbreaks of COVID-19 cases, most recently in Europe (Chart 2). Fears of the pandemic and much-reduced business activity in leisure-related industries have caused consumer confidence to diverge from the stock market in an unprecedented way (Chart 3). Chart 2New Outbreaks Of COVID-19 In Europe
New Outbreaks Of COVID-19 In Europe
New Outbreaks Of COVID-19 In Europe
Chart 3Why Are Stocks Rising When Consumers Are So Wary?
Why Are Stocks Rising When Consumers Are So Wary?
Why Are Stocks Rising When Consumers Are So Wary?
The only explanation for these phenomena is the unprecedented amount of monetary stimulus, which is causing excess liquidity to flow into risk assets. Since March, the balance-sheets of major central banks have increased by $7 trillion (Chart 4), and M2 money supply growth has soared (Chart 5). Chart 4Central Banks Have Grown Their Balance-Sheets...
Central Banks Have Grown Their Balance-Sheets...
Central Banks Have Grown Their Balance-Sheets...
Chart 5...Leading To A Big Rise in Money Growth
...Leading To A Big Rise in Money Growth
...Leading To A Big Rise in Money Growth
Moreover, the Fed’s new strategic framework announced in late August represents a commitment to keep monetary policy loose even when the economy begins to overheat. The Fed will (1) target 2% inflation on average over time which means that, after a period of low inflation, it will “aim to achieve inflation moderately above 2 percent for some time”; and (2) treat its employment mandate as asymmetrical, so that when employment is below potential the Fed will be accommodative, but that a rise in employment above its “maximum level” will not necessarily trigger tightening. Historically the Fed has raised rates when unemployment approached its natural rate (Chart 6). The new policy implies it will no longer do so. The aim of the policy is to raise inflation expectations which have become unanchored, with headline PCE inflation above the Fed’s 2% target for only 14 out of 102 months since the target was introduced in February 2012 (Chart 6, panel 3). Chart 6The Fed's Behavior Will Be Different In Future
The Fed's Behavior Will Be Different In Future
The Fed's Behavior Will Be Different In Future
Chart 7More Permanent Job Losses To Come
More Permanent Job Losses To Come
More Permanent Job Losses To Come
This commitment to easier monetary policy for longer will certainly help risk assets. But will it be enough? The global economic environment remains weak. Permanent job losses continue to increase, as workers initially put on furlough or dismissed temporarily, are fired (Chart 7). A second wave of COVID-19 cases in the Northern Hemisphere winter would worsen the situation. While central banks everywhere remain committed to aggressive policy, fiscal policy decision-makers are getting cold feet, with the UK’s wage-replacement scheme due to end in October, and government support in the US set to decline absent a big new fiscal package agreed by Congress (Chart 8). Credit risks are beginning to emerge, with bankruptcies surging (Chart 9), and mortgage delinquencies starting to rise (Chart 10). As a result, banks are becoming significantly more reluctant to lend (Chart 11). Chart 8Fiscal Support Is Starting To Slide
Fiscal Support Is Starting To Slide
Fiscal Support Is Starting To Slide
Chart 9Bankruptcies Are Surging…
Monthly Portfolio Update: Can Monetary Policy Alone Propel The Market?
Monthly Portfolio Update: Can Monetary Policy Alone Propel The Market?
Chart 10...Along With Mortgage Delinquencies
...Along With Mortgage Delinquencies
...Along With Mortgage Delinquencies
Chart 11Banks Turning Increasingly Cautious
Banks Turning Increasingly Cautious
Banks Turning Increasingly Cautious
To those concerns, we should add political risk ahead of the US presidential election. President Trump is probably not as far behind as the 7-percentage point gap in opinion polls suggests: After the Republican National Convention, online betting sites give him a 46% probability of being reelected (Chart 12). Over the next two months, he could be aggressive in foreign policy, particularly towards China. A disputed election is not unlikely. Investors might be wise to hedge against that possibility: BCA Research’s Geopolitical service recommends buying December VIX futures, which are still cheaply priced, and selling January VIX futures (Chart 13). 1 Chart 12Trump Could Still Pull It Off
Trump Could Still Pull It Off
Trump Could Still Pull It Off
Chart 13Hedge Against A Disputed Election Result
Monthly Portfolio Update: Can Monetary Policy Alone Propel The Market?
Monthly Portfolio Update: Can Monetary Policy Alone Propel The Market?
Given the power of monetary stimulus, we are reluctant to bet against equities – not least since the yield on fixed-incomes assets is so low. Nonetheless, we see the risk of a sharp correction over the coming six months, driven by a second pandemic wave, a renewed downturn in the global economy, or political events. We continue to recommend, therefore, only a neutral position on global equities. We would hold a large overweight in cash, to keep powder dry for when a better buying opportunity for risk assets arises. But a warning: The long-run return from all asset classes will be poor. The global bond index is unlikely to produce a nominal return much above zero over the coming decade. While equities look more attractive, our valuation indicator points to a nominal annual return of only around 3% (Chart 14). For the US, valuation suggests a return of zero. Investors will need to become more realistic about their return assumptions. The 7% annual return still assumed by the average US pension fund might have made sense when the yield on BBB-rated corporate bonds was 8%, but it no longer does when it has fallen to 2.3% (Chart 15). Chart 14Long-Term Equity Returns Will Be Poor
Long-Term Equity Returns Will Be Poor
Long-Term Equity Returns Will Be Poor
Chart 15Investors' Return Assumptions Are Unrealistic
Investors' Return Assumptions Are Unrealistic
Investors' Return Assumptions Are Unrealistic
Chart 16Value Sectors' Profits Have Been Terrible
Value Sectors' Profits Have Been Terrible
Value Sectors' Profits Have Been Terrible
Equities: The most vigorous debate among BCA Research strategists currently is over whether growth stocks will continue to outperform, or whether value will take over leadership. The Global Asset Allocation service is on the side of growth. The poor performance of value stocks (concentrated in Financials, Energy, and Materials) is explained by the structural decline in their profits for the past 12 years (Chart 16). With the yield curve unlikely to steepen and non-performing loans set to rise, we do not see Financials’ earnings recovering. China’s economic shifts represent a long-term headwind for Materials. Internet stocks are expensively valued, but we do not see them underperforming until (1) their earnings’ growth slows sharply, (2) regulation on them is significantly tightened, or (3) long-term bond yields rise, lowering the NPV of their future earnings. This view drives our Overweight on US equities versus Europe and Japan. US stocks have continued to outperform even in the risk-on rally since March (Chart 17). We are a little more enthusiastic (with a Neutral recommendation) about Emerging Market stocks, which are very cheaply valued (Chart 18). Chart 17US Stocks Have Outperformed Even In A Risk-On Market
US Stocks Have Outperformed Even In A Risk-On Market
US Stocks Have Outperformed Even In A Risk-On Market
Chart 18EM Stocks Are Cheap
EM Stocks Are Cheap
EM Stocks Are Cheap
Chart 19Short USD Is Now A Consensus Trade
Monthly Portfolio Update: Can Monetary Policy Alone Propel The Market?
Monthly Portfolio Update: Can Monetary Policy Alone Propel The Market?
Currencies: The US dollar has depreciated by 10% since mid-March. Over the next 12 months, the trend for the USD is likely to continue to be down. The new Fed policy emphasizes that real rates will stay low, and US inflation will probably be higher than in other developed economies. Nonetheless, short-USD/long-euro positions have become consensus (Chart 19) and, given the safe-haven nature of the dollar, a period of risk-off could push the dollar back up temporarily. Chart 20IG Spreads Are No Longer Attractive
Investment Grade Breakeven Spreads IG Spreads Are No Longer Attractive
Investment Grade Breakeven Spreads IG Spreads Are No Longer Attractive
Fixed Income: We don’t expect to see a sustained rise in nominal US Treasury yields, despite the Fed’s new monetary policy framework. The Fed has an implicit yield curve control policy, and would react if yields showed signs of rising significantly. TIPS breakevens should eventually rise further to reflect the likelihood of higher inflation in the longer term, though the recent sharp rise in inflation (core CPI rose by 0.6% month-on-month in July, the largest increase since 1991) will likely subside and so the upside for breakeven yields might be limited over the next six months. We are becoming a little more cautious on credit. Investment-grade spreads are now close to historic lows and so returns are likely to be limited (Chart 20). We lower our recommendation to Neutral. Ba-rated bonds still offer attractive yields and are supported by Fed purchases. But we would not go further down the credit curve, and so stay Neutral on high yield. This by definition means that we must also be Neutral within fixed income on government bonds, which is compatible with our view that rates will not rise much. Note, though, that we remain Underweight the fixed-income asset class overall, but no longer have a preference for spread product within it. One exception is EM dollar-denominated debt, both sovereign and corporate, which offers spreads that are attractive in a world of low returns from fixed income. Chart 21Crude Prices Can Rise Further As Demand Recovers
Crude Prices Can Rise Further As Demand Recovers
Crude Prices Can Rise Further As Demand Recovers
Commodities: Industrial metals prices have further to run up, as China continues its credit stimulus, which should lead to a rise in infrastructure investment and increased imports of commodities. The outlook for crude oil will be dominated by the demand side: OPEC forecasts demand destruction this year of 9 million barrels per day (compared to consensus expectations of 8 million) and so will be cautious about loosening its supply constraints. Demand should be boosted by increased driving, as people avoid using public transport for commuting and airlines for vacations. Based on a robust demand forecast (Chart 21), BCA Research’s energy strategists see Brent crude stable at around current levels through to the end of 2020 but averaging $65 a barrel next year. Garry Evans, Senior Vice President Global Asset Allocation garry@bcaresearch.com Footnotes 1 Please see Geopolitical Strategy Special Report, “What Is The Risk Of A Contested US Election?” dated July 27, 2020. GAA Asset Allocation
GAA DM Equity Country Allocation Model Update The GAA DM Equity Country Allocation model is updated as of August 31, 2020. The country allocation model still favors the US as its largest overweight. Despite Japan’s outstanding performance in August, the model still maintains its large underweight in Japanese equities, as shown in Table 1. Table 1Model Allocation Vs. Benchmark Weights
GAA Quant Model Updates
GAA Quant Model Updates
As shown in Table 2 and Charts 1, 2 and 3, the overall model slightly underperformed the MSCI World benchmark by 7 bps in August. The Level 1 model outperformed by 19 bps because of the overweight in the US, while the Level 2 model underperformed its benchmark by 104 bps partly because of its large underweight in Japan. August was a very strange month in the sense that only the US and Japan outperformed while the rest underperformed the MSCI World benchmark. As such, except for the US and Japan bets, all other six underweight choices made positive contributions to the overall performance of the model, while all other four overweight bets made negative contributions. Since going live, the overall model has outperformed its MSCI World benchmark by 404 bps, with 604 bps of outperformance from the Level 2 model, and 111 bps of outperformance from the Level 1 model. Table 2Performance (Total Returns In USD %)
GAA Quant Model Updates
GAA Quant Model Updates
Chart 1GAA DM Model Vs. MSCI World
GAA DM Model Vs. MSCI World
GAA DM Model Vs. MSCI World
Chart 2GAA US Vs. Non US Model (Level 1)
GAA US Vs. Non US Model (Level 1)
GAA US Vs. Non US Model (Level 1)
Chart 3GAA Non US Model (Level 2)
GAA Non US Model (Level 2)
GAA Non US Model (Level 2)
For more on historical performance, please refer to our website https://www.bcaresearch.com/site/trades/allocation_performance/latest/G…. For more details on the models, please see Special Report, “Global Equity Allocation: Introducing The Developed Markets Country Allocation Model,” dated January 29, 2016, available at https://gaa.bcaresearch.com. Please note that the overall country and sector recommendations published in our Monthly Portfolio Update and Quarterly Portfolio Outlook use the results of these quantitative models as one input, but do not stick slavishly to them. We believe that models are a useful check, but structural changes and unquantifiable factors need to be considered as well when making overall recommendations. GAA Equity Sector Selection Model The GAA Equity Sector Model (Chart 4) is updated as of August 31, 2020. Chart 4Overall Model Performance
Overall Model Performance
Overall Model Performance
The model continues to maintain its pro-cyclical stance driven by an improvement in its global growth proxy, and remains exposed to cyclical sectors. Over the past month, the model outperformed its benchmark by 58 basis points. Year-to-date, the model has outperformed its benchmark by 212 basis points, and 227 basis points since going live. The model’s global growth proxy continues to signal a bullish stance – driven by its three components: Appreciating EM currencies, rising metal prices, and an improvement in broad business climate. The model therefore continues to remain positive on cyclical sectors. Global monetary easing for the coming years and low rates should keep the liquidity component favoring a mixed bag of cyclical and defensive sectors. The valuation component remains muted across all sectors except Energy. However, several sectors continue to be near the expensive and cheap zones – mainly Info Tech and Consumer Discretionary (expensive), and Real Estate and Consumer Staples (cheap). The model awaits confirming momentum signals to change recommendations for those sectors. The model upgraded Industrials this month based on an improvement in its momentum component. Table 3Overall Model Performance
GAA Quant Model Updates
GAA Quant Model Updates
Table 4Current Model Allocations
GAA Quant Model Updates
GAA Quant Model Updates
The model is now overweight five cyclical sectors in total. These are Information Technology, Consumer Discretionary, Communication Services, Materials, and Industrials. For more details on the model, please see the Special Report “Introducing the GAA Equity Sector Selection Model”, dated July 27, 2016, as well as the Sector Selection Model section in the Special Alert “GAA Quant Model Updates”, dated March 1, 2019 available at https://gaa.bcaresearch.com. Xiaoli Tang Associate Vice President xiaoliT@bcaresearch.com Amr Hanafy Senior Analyst amrh@bcaresearch.com