Global

Your feedback is important to us. Please take our client survey today. Highlights A surge in the number of Covid cases worldwide and the failure of the US Congress to forge a stimulus deal has cast doubt on the “reflation trade.” European governments have responded to rising case counts with a flurry of restrictions. While not quite as extreme as those introduced in March, the new lockdown rules will still weigh on growth over the coming months. The good news is that progress on a vaccine continues, with the vast majority of experts expecting one to be widely available within the next 12 months. The degree to which US fiscal policy will turn stimulative again depends on the outcome of the election. A “blue wave” would produce the most fiscal stimulus, while a Biden victory coupled with continued Republican control of the Senate would produce the least. However, even in the latter scenario, popular support for further fiscal easing – including among Republican voters – will help catalyze a deal. The near-term picture for stocks is murky. Nevertheless, investors should remain overweight global equities on a one-to-two year horizon, while shifting exposure to non-US markets and value stocks. Worries About The Sanguine Narrative Chart 1The Number Of New Cases Continues To Rise Globally... But Mortality Rates Are Lower Than Earlier This Year
Doubts About The Reflation Trade
Doubts About The Reflation Trade
Equities recovered some of their losses on Thursday, but remain down on the week. Investors have become increasingly concerned about the viability of the so-called reflation trade. Stocks rallied in the spring and summer on hopes that the worst of the pandemic was over and that fiscal stimulus would continue to prop up employment and spending. Now, both assumptions are being challenged. The number of coronavirus cases continues to rise worldwide (Chart 1). In both Europe and the US, the daily tally of confirmed new cases exceeds its March peak. The only saving grace is that the number of deaths has not risen by as much as many had feared. Governments are reacting to rising case counts by tightening social distancing rules. The German government ordered bars, clubs, theaters, concert halls, museums, cinemas, sit-down restaurants, and most athletic facilities to close in November. Hotels will no longer be able to cater to tourists, while private meetings of over 10 people will be prohibited. Along the same lines, France has imposed a comprehensive nationwide lockdown until December 1st, with President Macron stating the nation has been “overpowered by a second wave.” Earlier this week, the Italian government announced that bars and restaurants must close by 6pm. News reports indicate that the UK government is preparing a slate of new restrictions. While the most recent lockdowns in Europe are not as severe as those introduced earlier this year, they will still weigh on growth over the coming months. There has been less movement toward shuttering the US economy in response to what is now the third wave of the pandemic. This may be partly because the latest cluster of cases has been fairly localized, concentrated mainly in the central north of the country. So far at least, the heavily populated south and coastal states have been spared the brunt of the wave. However, if more states start seeing rising case counts, stricter restrictions could be introduced across most of the country. Fiscal Food Fight Meanwhile in Washington, both Republican and Democrat leaders conceded that there will be no stimulus deal before the election. House Speaker Nancy Pelosi said that Trump had “failed miserably” in his handling of the pandemic, the economy, and everything else. The President, for his part, claimed that “Nancy Pelosi is only interested in bailing out badly-run, crime-ridden Democrat cities and states,” adding that “After the election, we will get the best stimulus package you have ever seen.” Of course, whether Trump can fulfill his “best ever” pledge depends on the outcome of the election. As we discuss below, there is considerable uncertainty over how the political landscape in Washington will look after November 3rd. Nevertheless, most roads still lead to more stimulus. The Election Homestretch Chart 2Opinion Polls Favor The Democrats ...
Doubts About The Reflation Trade
Doubts About The Reflation Trade
Chart 3... As Do Betting Markets
Doubts About The Reflation Trade
Doubts About The Reflation Trade
As the US election campaign winds down, both opinion polls and betting markets suggest that Joe Biden will become the next president while the Democrats will regain control of the Senate (Chart 2 and Chart 3). That said, this is not the only possible outcome. As this handy applet from The Cook Political Report makes clear, small changes in the assumptions about either voter preferences or turnout can shift the results significantly. For example, Trump saw his approval among African Americans rise from 25% last week to around 40% this week according to Rasmussen’s daily tracking poll. Such a large move in this one particular poll undoubtedly overstates the true magnitude of the trend, but it is consistent with the analysis that Matt Gertken and BCA’s geopolitical team has done showing that Trump has reduced the Democrats’ lead among minority voters relative to 2016. If Trump can improve his vote share among black voters from the meager 8% he received in the 2016 election to 11% this time around, it would be enough to tip the entire race in his favor. The quant model developed by BCA’s Geopolitical Strategy service, which elevates recent economic data over polling numbers in its computations, gives Donald Trump a 51% probability of remaining president and an equivalent chance of the Republicans picking up the Senate (Chart 4). Subjectively, Matt thinks Trump has a 45% chance of winning. While lower than his quant model, this is still above the 39% probability that betting markets assign to a Trump victory (Chart 5). Chart 4BCA’s Quant Model Points To Trump Victory And Favors Republicans In The Senate
Doubts About The Reflation Trade
Doubts About The Reflation Trade
Chart 5Election Odds: BCA's Geopolitical Team Versus Betting Markets
Doubts About The Reflation Trade
Doubts About The Reflation Trade
What Would The Stock Market Prefer? From the equity perspective, stocks would likely rise if Trump won and the Democrats took over the Senate. If re-elected, President Trump would block any efforts to raise taxes or tighten business regulations. However, unlike a number of Republican senators, Trump is not averse to increasing government spending. Earlier this month, the President proposed a $1.8 trillion stimulus bill. Senate Republicans have offered only $500 million for pandemic relief. The stock market would welcome both easier fiscal policy and the implicit guarantee that taxes will not rise. The stock market would also be content with a Democratic sweep, provided it did not result in a blowout victory. A narrow Senate victory would still allow the Democrats to pass a fiscal stimulus bill through the creative use of the “reconciliation process.” However, it would curb the influence of the party’s more left-leaning members. Several Democratic senators have expressed reservations about scrapping the filibuster rule which requires a supermajority of 60 votes to pass most non-budget related legislation. If the filibuster rule is eliminated, it would make it easier to strengthen antitrust law, tighten labor and environmental standards, and raise the minimum wage, all of which could dampen corporate profits. Investors would likely deem a continuation of the existing political configuration in Washington – where Donald Trump remains president and the Republicans maintain a slim majority in the Senate – as neutral for stocks. On the one hand, such an outcome would take the prospects of tax hikes off the table. On the other hand, it could prolong the trade war and extend the stalemate over a stimulus bill. Lastly, stock market investors might frown upon a scenario involving a Biden victory and continued Republican control of the Senate. Of all the scenarios mentioned above, the prospects for a major stimulus package would be lowest for this configuration of political outcomes. This is because Republican senators would have even less incentive to accede to more spending if Joe Biden, rather than Donald Trump, were pressing for it. Still, even in this scenario, it is unlikely that the US will shift to fiscal austerity anytime soon. As Table 1 shows, 72% of voters support the broad outline of the Democrat’s stimulus proposal. Strikingly, even most Republican voters support it, at least when the question is posed in nonpartisan terms. This suggests that a Democratic House could still find a way to strike a stimulus deal with a Republican Senate, perhaps by agreeing to further cut taxes in exchange for more government spending. Table 1Strong Support For Stimulus
Doubts About The Reflation Trade
Doubts About The Reflation Trade
Investment Conclusions While governments have understandably tightened restrictions to control the latest surge in Covid cases, they are unlikely to fully revert to the extreme measures taken in March. Back then, there was considerable uncertainty over how fatal the virus was, with estimates for the mortality rate ranging from 0.5% to over 5%. The latest research suggests that the true number is near the bottom of that range, and perhaps even below it.1 Progress continues to be made on a vaccine. Close to 95% of professional forecasters surveyed by The Good Judgement Project expect a vaccine to be widely available within the next 12 months (Chart 6). Chart 6When Will A Vaccine Become Available?
Doubts About The Reflation Trade
Doubts About The Reflation Trade
Chart 7Non-US Equities Tend To Outperform Their US Peers When Global Growth Is Improving And The Dollar Is Weakening
Non-US Equities Tend To Outperform Their US Peers When Global Growth Is Improving And The Dollar Is Weakening
Non-US Equities Tend To Outperform Their US Peers When Global Growth Is Improving And The Dollar Is Weakening
The combination of a vaccine and further fiscal support against a backdrop of ultra-easy monetary policy should be enough to lift global equities by about 15% towards the end of 2021. While the near-term picture for stocks is murky, investors should remain overweight global equities over a one-to-two year horizon. As a countercyclical currency, the US dollar is poised to weaken next year. Typically, non-US stocks outperform when global growth is strengthening and the dollar is weakening (Chart 7). Value stocks also tend to do better in such macro environments (Chart 8). Once the latest wave of the pandemic crests, as it inevitably will, investors should look to shift their equity portfolios from stocks that benefited from lockdowns towards those that will benefit from reopenings. Chart 8 (I)... Ditto For Value Stocks Versus Growth Stocks
... Ditto For Value Stocks Versus Growth Stocks
... Ditto For Value Stocks Versus Growth Stocks
Chart 8 (II)... Ditto For Value Stocks Versus Growth Stocks
... Ditto For Value Stocks Versus Growth Stocks
... Ditto For Value Stocks Versus Growth Stocks
Peter Berezin Chief Global Strategist peterb@bcaresearch.com Footnotes 1 A recent systematic review of literature found that the Covid-19 infection fatality rate (IFR) stood at 0.7%. Similarly, in September, the Centers for Disease Control and Prevention (CDC) published age-specific IFRs in its Covid-19 Planning Scenarios. The population-weighted average of the CDC’s “best estimate” suggests a 0.7% IFR. Please see “COVID-19 Pandemic Planning Scenarios,” Centers for Disease Control and Prevention, Updated September 10, 2020; and Gideon Meyerowitz-Katz, and Lea Merone, “A systematic review and meta-analysis of published research data on COVID-19 infection fatality rates,” International Journal of Infectious Diseases, September 29, 2020. Global Investment Strategy View Matrix
Doubts About The Reflation Trade
Doubts About The Reflation Trade
Current MacroQuant Model Scores
Doubts About The Reflation Trade
Doubts About The Reflation Trade
Highlights Global risk assets have more downside in the near term. The US dollar is primed to rebound. Without major fiscal stimulus in the US, the upside in the greenback will be substantial. China’s business cycle recovery will continue but Chinese stocks and China-related plays are over-hyped and will experience a setback. For equity and credit investors, we recommend maintaining a neutral allocation to EM versus their DM counterparts. Feature Global risk assets have been in a twilight zone. On the one hand, there has been enormous uncertainty related to the US elections, the US fiscal stimulus and the impact of renewed social mobility restrictions on economic activity, especially in Europe. On the other hand, ultra-accommodative central banks, zero or negative interest rates on risk-free investments and the possibility of positive news on the COVID-19 vaccine front have until recently precluded a carnage in global risk assets. What will be the path going forward? We believe the risk-off period in global markets will continue in the near run, i.e., there will be a dusk before a sunrise. Hence, investors should maintain dry powder at the moment. Several negative outcomes have a non-trivial probability of occurring over the very near term. Chiefly these include a contested US presidential election or a Republican Senate under a Biden presidency acting as a constraint on large fiscal stimulus. Chart I-1The US Needs $1.5tn (7.4% Of GDP) Of Fiscal Stimulus In 2021 To Have A Neutral Fiscal Thrust
The US Needs $1.5bn (7.4% Of GDP) Of Fiscal Stimulus In 2021 To Have A Neutral Fiscal Thrust
The US Needs $1.5bn (7.4% Of GDP) Of Fiscal Stimulus In 2021 To Have A Neutral Fiscal Thrust
Needless to say, without a large fiscal stimulus package, the US is facing a fiscal cliff. According to the US Congressional Budget Office, the fiscal thrust will be negative 7.4% of GDP in 2021 if no further stimulus is enacted (Chart I-1). The fiscal thrust is the change in the cyclically-adjusted budget deficit. Even if the cyclically-adjusted budget deficit as a share of GDP remains the same, fiscal thrust will be zero. Hence, to achieve a positive fiscal thrust in the US, the fiscal stimulus must be greater than 7.4% of GDP or above $1.5 trillion. Even though Congress eventually approves a large fiscal package, there is a risk that the economy will slip in the interim. To emphasize, we do not mean there will be no fiscal stimulus. The point is that a large fiscal package is possible only if markets riot. With equity and credit markets still richly priced relative to their fundamentals, the carnage in global risk assets will likely continue. With equity and credit markets still richly priced relative to their fundamentals, the carnage in global risk assets will likely continue. Chart I-2The US: Lower Inflation Expectations, Higher Real Rates And A Stronger Dollar
The US: Lower Inflation Expectations, Higher Real Rates And A Stronger Dollar
The US: Lower Inflation Expectations, Higher Real Rates And A Stronger Dollar
In the absence of a large US fiscal package and amid falling oil prices, US break-even inflation expectations will drop and the TIPS (real) yields will bounce in the near term (Chart I-2). A rebound in TIPS (real) yields will induce a bounce in the US dollar (Chart I-2, bottom panel). Provided that the primary risks presently stem from DM rather than Chinese growth, we recommend maintaining a neutral allocation to EM within respective global equity and credit portfolios. Why not overweight EM versus DM? First, the rebound in the greenback will weigh on EM financial markets. Second, outside China, Korea and Taiwan, EM fundamentals are poor. Net-net, odds of EM out- and under-performance versus DM are, for now, balanced. China: Peak Stimulus, Equities And Commodities China’s business cycle recovery is intact. However, Chinese equities have become fully priced and are at risk of a setback (in absolute terms) along with global share prices. Notably, there are several elements that could trigger a meaningful setback in Chinese stocks. First, the money and credit impulses are about to peak. The top panel of Chart I-3 shows that changes in commercial banks’ excess reserves ratio lead the credit impulse by about six months. The drop in the excess reserves ratio since May foreshadows the top in the private credit impulse. Interbank rates – shown inverted in the bottom panel of Chart I-3 – point to an apex in the narrow money (M1) impulse. Authorities have been shrinking commercial banks’ excess reserves at the PBoC since May/June. Tightening liquidity conditions in the banking system have led to higher interbank rates as well as government and corporate bond yields. Higher borrowing costs will weigh on money and credit growth. Second, the loan approval index of the PBoC banking survey has rolled over (Chart I-4). This implies that bank loan origination will subside going forward. Chart I-3China: Money/Credit Impulses Are At An Apex
China: Money/Credit Impulses Are At An Apex
China: Money/Credit Impulses Are At An Apex
Chart I-4China: Loan Growth To Moderate
China: Loan Growth To Moderate
China: Loan Growth To Moderate
Finally, fiscal stimulus is also peaking. Chart I-5 shows that the issuance of local government bonds is set to dwindle in the coming months. A peak in stimulus does not herald an immediate end of the recovery in the business cycle. China’s combined credit and fiscal spending impulse leads the business cycle by about nine months (Chart I-6). Therefore, even as the credit and fiscal spending impulse reaches an apex, the Chinese mainland’s economic activity will stay firm in H1 2021. Consequently, corporate profits will continue to recover. Chart I-5China: Fiscal Stimulus Is Peaking
China: Fiscal Stimulus Is Peaking
China: Fiscal Stimulus Is Peaking
Chart I-6China: The Economy Will Continue Recovering
China: The Economy Will Continue Recovering
China: The Economy Will Continue Recovering
What do all these imply for share prices? In periods when borrowing costs rise along with accelerating profit growth/improving net EPS revisions, share prices could still advance (Chart I-7). Hence, peak stimulus is not a sufficient reason to turn negative on share prices. Chart I-7China: Share Prices (ex-TMT), EPS Expectations And Corporate Bond Yields
China: Share Prices (ex-TMT), EPS Expectations And Corporate Bond Yields
China: Share Prices (ex-TMT), EPS Expectations And Corporate Bond Yields
That said, there are some signs that the Chinese equity market is overbought and over-hyped, making it vulnerable: A major IPO often marks a top in an asset class. Chart I-8 illustrates that Goldman Sachs’ IPO in 1999 preceded the secular top in US equities, IPOs of KKR and Blackstone in 2007 took place before the US credit bubble and the LBO boom unraveled; and finally, Glencore, the largest commodity trading house, went public in 2011 at the very peak of the secular bull market in commodities. In this respect, will Ant Group’s upcoming IPO mark a major top in Chinese or new economy stocks? Time will tell. Chart I-9 illustrates that Chinese IPO booms were historically associated with equity market tops. The current surge in Chinese IPOs – in various jurisdictions including China, Hong Kong, and the US – is a symptom of an over-hyped market. Chart I-8A Major IPO Often Marks The Top in Respective Asset Classes
A Major IPO Often Marks The Top in Respective Asset Classes
A Major IPO Often Marks The Top in Respective Asset Classes
Chart I-9China: Booming IPOs = An Equity Market Top?
China: Booming IPOs = An Equity Market Top?
China: Booming IPOs = An Equity Market Top?
Finally, new economy stocks in both the US and China have risen by about 20-fold since January 2010. Both in terms of duration and magnitude, their rallies are identical to the bull market in the Nasdaq 100 index in the 1990s (Chart I-10). The striking similarity with those episodes as well as current euphoria among investors about FAANG and Chinese new economy stocks warrant caution. In regard to commodities, in recent months we have been arguing that China is entering a commodity destocking cycle following the major restocking cycle that occurred in April-August. As Chinese imports of key commodities temporarily diminish due to destocking, commodities prices will relapse. Importantly, investor sentiment and net long positions in some key commodities are very elevated, suggesting overbought conditions (Chart I-11). Chart I-10FAANG And Tencent Have Been Tracking The Trajectory Of Nasdaq 100 In The 1990s
FAANG And Tencent Have Been Tracking The Trajectory Of Nasdaq 100 In The 1990s
FAANG And Tencent Have Been Tracking The Trajectory Of Nasdaq 100 In The 1990s
Chart I-11Investors Are Very Bullish On Copper
Investors Are Very Bullish On Copper
Investors Are Very Bullish On Copper
Critically, global mining stocks have been dropping since early September and are signaling a relapse in industrial metals prices (Chart I-12). In brief, commodity prices and commodity plays remain vulnerable. Chart I-12Global Mining Stocks Point To A Relapse In Industrial Commodities Prices
Global Mining Stocks Point To A Relapse In Industrial Commodities Prices
Global Mining Stocks Point To A Relapse In Industrial Commodities Prices
Bottom Line: Marrying the positive outlook for China’s business cycle on the one hand with an impending potential correction in global stocks, the peak in Chinese stimulus and signs of Chinese equity investor euphoria, we conclude that the risk-reward profiles of Chinese stocks and China-related plays in absolute terms are unattractive. That said, we continue recommending overweighting Chinese stocks within an EM equity portfolio. From a cyclical perspective, Chinese corporate profits will outperform EM and DM corporate earnings because China has dealt with the pandemic much better than almost all other countries. An Update On Currencies And Local Fixed-Income We have been shorting a basket of EM currencies – BRL, CLP, ZAR, TRY, KRW and IDR – against an equally-weighted basket of the euro, CHF and JPY. This strategy remains intact. However, we believe the US dollar is primed to stage a major rebound, in general, and versus EM currencies, in particular. Therefore, US dollar-based investors should hedge their currency risk or short the same EM currency basket versus the greenback. In EM local fixed-income markets, we have been receiving 10-year swap rates but have not recommended owning cash domestic bonds because of currency risk. We continue to recommend investors receive 10-year swap rates in the following markets: Mexico, Colombia, Russia, China, India and Korea. We have also been recommending long positions in domestic bonds in certain frontier markets like Egypt, Ukraine, and Pakistan. The global risk-off phase will cause their currencies to relapse versus the US dollar, raising the possibility that local bond yields will rise. Therefore, investors who are long these markets should close these positions. Arthur Budaghyan Chief Emerging Markets Strategist arthurb@bcaresearch.com Equities Recommendations Currencies, Credit And Fixed-Income Recommendations
Your feedback is important to us. Please take our client survey today. Feature Feature ChartHouse Prices Have Decoupled From Rents Again (And It Didn't End Happily Last Time)
House Prices Have Decoupled From Rents Again (And It Didn't End Happily Last Time)
House Prices Have Decoupled From Rents Again (And It Didn't End Happily Last Time)
Real estate is the world’s most important asset class. It accounts for 60 percent of the $500 trillion of mainstream global assets. To put this into context, the $300 trillion worth of global real estate makes the $7 trillion worth of all the gold ever mined look like chicken feed. It even dwarfs the $90 trillion global economy by more than three to one. In recent years, the valuation of global real estate has decoupled from underlying rents, and has become critically dependent on ultra-low bond yields. If higher bond yields caused even a 10 percent decline in global real estate values, it would amount to a $30 trillion plunge in global wealth. Such a deflationary impulse, equal to one third of the world’s income, would make the pandemic’s economic shock feel like a waltz in the park. Hence, to anybody calling for significantly higher bond yields, we pose a simple question. How would the world economy cope with the massive deflationary impact on $300 trillion of global real estate? House Prices Have Decoupled From Rents The $300 trillion valuation of global real estate in 2020 is an 80 percent increase compared with 2010. Coincidentally, the value of the global stock market has also increased by 80 percent over the past decade. But the stock market’s $75 trillion capitalisation is small fry compared to the $300 trillion real estate market.1 Within the real estate market, residential real estate constitutes the lion’s share, accounting for around 80 percent by value. Commercial real estate accounts for a little over 10 percent, and agricultural and forestry real estate makes up the remainder. The valuation of global real estate has become critically dependent on ultra-low bond yields. It follows that the most important component of the real estate market is the homes that people live in. The overwhelming majority of these homes are owner-occupied. Making house prices the indicator that drives, as well as reflects, the fortunes of ordinary people. The 2010s was remarkable as the first decade in which there was a synchronised boom in housing markets around the world. In the previous decade’s global financial crisis, house prices had crashed in several major economies: most notably, the UK and the US. Yet the UK and US housing markets did not suffer long hangovers. In the 2010s, the party restarted, and got even wilder (Chart I-2). Chart I-2The UK And US Housing Markets Resumed Their Parties In The 2010s
The UK And US Housing Markets Resumed Their Parties In The 2010s
The UK And US Housing Markets Resumed Their Parties In The 2010s
Meanwhile, in Sweden, Canada, Australia, and China the global financial crisis barely interrupted their housing market parties, which continued seamlessly into the 2010s (Chart I-3). But perhaps most important of all, in the 2010s, the previous decade’s housing market wallflowers such as Germany and Japan started partying too (Chart I-4). What was behind this synchronised and broad boom in real estate values during the 2010s? The common denominator is the universal decline in bond yields. Chart I-3In Sweden, Canada, Australia, And China, The Parties Never Stopped
In Sweden, Canada, Australia, And China, The Parties Never Stopped
In Sweden, Canada, Australia, And China, The Parties Never Stopped
Chart I-4Germany And Japan Started Their Parties In The 2010s
Germany And Japan Started Their Parties In The 2010s
Germany And Japan Started Their Parties In The 2010s
As the global real estate firm Savills puts it: “Real estate has increased significantly in value, spurred on by the intervention of central banks and their suppression of bond yields. Now that yields have little room to shift further downward, the scope for capital growth becomes more limited and dependent on rental growth happening first” Empirically, there is a tight long-term connection between house prices and underlying rents (Feature Chart). For example, through the past forty years, US house prices have closely tracked rents, with only two significant deviations. The first deviation happened during the housing bubble of the early 2000s. When that bubble burst in 2007, house prices promptly crashed back to their established relationship with rents. The second deviation is happening now. Since 2012, US house prices have outperformed rents by 25 percent (Chart I-5). In Europe, German house prices have outperformed rents by 20 percent (Chart I-6). The concern is that this house price outperformance versus rents is justified only if bond yields remain ultra-low and rental growth remains robust. Chart I-5House Prices Have Outperformed Rents By 25 Percent In The US...
House Prices Have Outperformed Rents By 25 Percent In The US...
House Prices Have Outperformed Rents By 25 Percent In The US...
Chart I-6...And By 20 Percent In ##br##Germany
...And By 20 Percent In Germany
...And By 20 Percent In Germany
The Pandemic Is Depressing Housing Rents Unfortunately, the pandemic is putting pressure on housing rents. Rent inflation is driven by the security and growth of wages, which itself is inversely tied to the structural unemployment rate. When the number of permanently unemployed workers rises, rent inflation collapses. Indeed, in the aftermath of the global financial crisis, US rent inflation turned negative. Therefore, for the housing rent outlook, the key question is: what is the outlook for structural unemployment? (Chart I-7) Chart I-7Higher Structural Unemployment Depresses Rents
Higher Structural Unemployment Depresses Rents
Higher Structural Unemployment Depresses Rents
The biggest driver of the structural unemployment rate will be the pandemic. Unlike China, large liberal democracies like the UK cannot control the pandemic with a universal track and trace system, because not enough of the UK population will allow the government to track their every move. Hence, until an effective vaccine has protected most of the population, liberal democracies like the UK must go down the route of physical distancing and the use of face masks. When the number of permanently unemployed workers rises, rent inflation collapses. But as we explained in An Economy Without Mouths Or Noses Will Lose 10 Percent Of Jobs, physical distancing and facemasks restrict any economy activity that requires the use of your mouth and nose in proximity to others. These activities are concentrated in three labour-intensive sectors – hospitality, retail, and transport – which employ 25 percent of all workers. Hence, if physical distancing and facemasks force these labour-intensive sectors to operate at one third below full capacity, the economy will lose 8.3 percent of jobs. On less optimistic assumptions the economy could lose 10 percent of jobs. Will a vaccine be a gamechanger? Not immediately. While it will mark progress, it will certainly not ‘take us back to normal’. This is because the proportion of the population that is immunised is unlikely to be high enough, fast enough. First, note that: Immunisation rate = Vaccination efficacy rate * Vaccination rate Second, note that no vaccine is 100 percent effective; and that a significant minority of diehards will refuse to get vaccinated. Perhaps understandably so if the vaccine has been rushed out. Even if we optimistically assume that the first vaccine is 70 percent effective, and that 70 percent of the population gets vaccinated, then the resulting 49 percent immunisation rate will still leave most people as sitting ducks for the virus. Under less optimistic – and arguably more realistic – assumptions, the number of unprotected people will be even larger. This means that social and physical distancing will continue for much longer than many people realise. Moreover, some of the reduction in ‘social consumption’ and its associated jobs will become permanent. The result is that the structural unemployment rate will continue to head higher, until the economy fully adapts to the post-pandemic way of living, working, and interacting. For the foreseeable future, this will put further pressure on housing rents, and keep the housing market crucially dependent on ultra-low bond yields. Concluding Remarks The main purpose of this Special Report is to highlight that the $90 trillion global economy is dwarfed by the $300 trillion global real estate market, whose valuation is critically dependent on ultra-low bond yields. If we add in equities, corporate bonds, and emerging market debt, the valuation of so-called ‘risk-assets’ rises to over $450 trillion. Yet many people still put the cart before the horse. They say the economy will drive the asset markets. This year has proved them wrong. A deflationary impulse from the economy unleashed an inflationary impulse in the much larger asset markets, which then helped to stabilise the economy. Unfortunately, the reverse would also be true. An inflationary impulse from the economy would unleash a deflationary impulse in the much larger asset markets, which would then destabilise the economy. An inflationary impulse from the economy would unleash a deflationary impulse in the much larger asset markets. Of course, any government with its own fiat currency can generate inflation if it really desires. Just look at Argentina or Turkey. But why would an advanced economy like the US, the UK, or the euro area make such a reckless journey, when it is already in the best place, the place it took a lot of blood and sweat to reach – namely, the place known as price stability? Still, if the advanced economies do take the road to inflation, they should realise that the road isn’t straight. The deflationary impulse that would come from the collapse in $450 trillion of risk-assets means that the road to inflation goes via deflation. For investors, this means that the road to much higher bond yields, if ever taken, reverses on itself. The road to much higher bond yields goes via the lower bound. Fractal Trading System* This week’s recommended trade is a soft commodities pair-trade. Go long coffee versus corn. The specific contracts are Brazilian coffee New York traded and Corn number 2 yellow central Illinois. The profit target and symmetrical stop-loss is set at 12 percent. Chart I-8Coffee Vs. Corn
Coffee Vs. Corn
Coffee Vs. Corn
The rolling 1-year win ratio stands at 54 percent. When the fractal dimension approaches the lower limit after an investment has been in an established trend it is a potential trigger for a liquidity-triggered trend reversal. Therefore, open a countertrend position. The profit target is a one-third reversal of the preceding 13-week move. Apply a symmetrical stop-loss. Close the position at the profit target or stop-loss. Otherwise close the position after 13 weeks. * For more details please see the European Investment Strategy Special Report “Fractals, Liquidity & A Trading Model,” dated December 11, 2014, available at eis.bcaresearch.com. Dhaval Joshi Chief European Investment Strategist dhaval@bcaresearch.com Footnotes 1 $300 trillion is our conservative uplift to the $281 trillion assessment that Savills made in 2018. The 2020 valuation constitutes a 40 percent increase versus its 2015 valuation. Before 2015, Savills did not provide an aggregated valuation for global real estate. However, as a good proxy, the firm tells us that the capital values in the top 12 world cities rose by 30 percent in the first half of the 2010s. Please see Savills: 8 things to know about global real estate value, July 2018; What price the world? 28 January 2016; and 12 Cities, H1 2015. Fractal Trading System Cyclical Recommendations Structural Recommendations Closed Fractal Trades Trades Closed Trades Asset Performance Currency & Bond Equity Sector Country Equity Indicators Bond Yields Chart II-1Indicators To Watch - Bond Yields
Indicators To Watch - Bond Yields
Indicators To Watch - Bond Yields
Chart II-2Indicators To Watch - Bond Yields
Indicators To Watch - Bond Yields
Indicators To Watch - Bond Yields
Chart II-3Indicators To Watch - Bond Yields
Indicators To Watch - Bond Yields
Indicators To Watch - Bond Yields
Chart II-4Indicators To Watch - Bond Yields
Indicators To Watch - Bond Yields
Indicators To Watch - Bond Yields
Interest Rate Chart II-5Indicators To Watch - Interest Rate Expectations
Indicators To Watch - Interest Rate Expectations
Indicators To Watch - Interest Rate Expectations
Chart II-6Indicators To Watch - Interest Rate Expectations
Indicators To Watch - Interest Rate Expectations
Indicators To Watch - Interest Rate Expectations
Chart II-7Indicators To Watch - Interest Rate Expectations
Indicators To Watch - Interest Rate Expectations
Indicators To Watch - Interest Rate Expectations
Chart II-8Indicators To Watch - Interest Rate Expectations
Indicators To Watch - Interest Rate Expectations
Indicators To Watch - Interest Rate Expectations
Your feedback is important to us. Please take our client survey today. Highlights For now, there is little evidence that the pandemic has adversely affected the global economy’s long-run growth potential. Even if one counts those who will be unable to work due to long-term health complications from the virus, the pandemic will probably reduce the global labor force by only 0.1%-to-0.15%. Labor markets have healed more quickly over the past few months than after the Great Recession. In the US, the ratio of unemployed workers-to-job openings has recovered most of its lost ground. Thanks in part to generous government support for businesses and the broader economy, commercial bankruptcy filings remain near historic lows. Meanwhile, new US business formation has surged to record highs. The combination of a vaccine and a decline in rents in city centres should persuade some people who were thinking of fleeing to the suburbs to stay put. This will ensure that most urban commercial and residential real estate remains productively engaged. Judging from corporate surveys, capital spending on equipment and intellectual property should continue to rebound. While the pandemic has caused numerous economic dislocations, it has also opened the door to a variety of productivity-enhancing innovations. An open question is whether all the debt that governments have taken on to alleviate the economic damage from the pandemic could in and of itself cause damage down the road. As long as interest rates stay low, this is not a major risk. However, today’s high government debt levels could become a problem if the pool of global savings dries up. Investors should continue to overweight stocks for the time being, while shifting their equity exposure from “pandemic plays” to “reopening plays.” A more cautious stance towards stocks may be appropriate later this decade. The Pandemic’s Potentially Long Shadow In its latest World Economic Outlook, the IMF revised up its growth estimates for this year. Rather than contracting by 4.9%, as it expected in June, the Fund now sees the global economy shrinking by 4.4%. That said, the IMF’s estimates still leave global GDP in 2020 7.5% below where it projected it to be in January. Perhaps even more worrying, the IMF expects the global economy to suffer permanent damage from the pandemic (Chart 1 and Chart 2). It projects that real global GDP will be 5.3% lower in 2024 compared to what it expected last year. In the G7, real GDP is projected to be nearly 3% lower, with most of the shortfall resulting from a downward revision to the level of potential GDP (Chart 3). Chart 1Covid-19: The IMF Expects The Global Economy To Suffer Permanent Damage (Part I)
How Much Permanent Economic Damage Will The Pandemic Cause?
How Much Permanent Economic Damage Will The Pandemic Cause?
Chart 2Covid-19: The IMF Expects The Global Economy To Suffer Permanent Damage (Part II)
How Much Permanent Economic Damage Will The Pandemic Cause?
How Much Permanent Economic Damage Will The Pandemic Cause?
The Congressional Budget Office is no less gloomy in its forecast. The CBO expects US real GDP to be 3.7% lower in 2024 than it projected last August. By 2029, it sees US GDP as being 1.8% below what it had expected prior to the pandemic, almost entirely due to slower potential GDP growth (Chart 4). Chart 3G7 Real GDP Growth Projections Have Been Revised Sharply Lower Due To The Pandemic
How Much Permanent Economic Damage Will The Pandemic Cause?
How Much Permanent Economic Damage Will The Pandemic Cause?
Chart 4A Gloomy Forecast For The US Thanks To Covid-19
How Much Permanent Economic Damage Will The Pandemic Cause?
How Much Permanent Economic Damage Will The Pandemic Cause?
The worry that the pandemic will lead to a major permanent loss in output is understandable. That is precisely what happened after the Global Financial Crisis. Nevertheless, as we discuss below, there are good reasons to think that the damage will not be as pervasive as widely believed. The Drivers Of Potential GDP An economy’s potential output is a function of three variables: 1) the number of workers available; 2) the amount of capital those workers have at their disposal; and 3) the efficiency with which this labor and capital can be transformed into output, a concept economists call “total factor productivity.” Let us consider how the pandemic has affected all three variables. The Impact Of The Pandemic On The Labor Market At last count, the pandemic has killed over 1.1 million people worldwide, 222,000 in the US. While the human cost of the virus is immense, the economic cost has been mitigated by the fact that about four-fifths of fatalities have been among those over the age of 65 (Table 1). In the US, less than 7% of the labor force is older than 65. A reasonable estimate is that Covid deaths have reduced the US labor force by 55,000.1 Table 1Pandemic-Related Deaths Are Tilted Towards The Elderly, Who Are The Least Active Participants Of The Labor Force
How Much Permanent Economic Damage Will The Pandemic Cause?
How Much Permanent Economic Damage Will The Pandemic Cause?
Chart 5The Number Of New Cases Continues To Increase Globally
How Much Permanent Economic Damage Will The Pandemic Cause?
How Much Permanent Economic Damage Will The Pandemic Cause?
Granted, mortality is not the only way that the disease can impair one’s ability to work. As David Cutler and Larry Summers point out in a recent study, for every single person who dies from Covid-19, seven people will survive but not before manifesting severe or critical symptoms of the disease.2 Based on the experience from past coronavirus epidemics, Ahmed, Patel, Greenwood et al. estimate that about one-third of these survivors will suffer long-term health complications.3 If one assumes that half of these chronically ill survivors are unable to work, this would reduce the US labor force by an additional 65,000.4 Of course, the pandemic is not yet over. The number of new cases continues to rise in the US and globally (Chart 5). The only saving grace is that mortality and morbidity rates are lower than they were earlier this year. Nevertheless, many more people are likely to die or suffer debilitating long-term consequences before a vaccine becomes widely available. Using the US as an example, if the total number of people who end up dying or getting so sick that they are unable to work ends up being twice what it is so far, the pandemic will reduce the labor force by about 240,000. This is not a small number in absolute terms. However, it is less than 0.15% of the overall size of the US labor force, which stood at 164 million on the eve of the pandemic. The impact of the pandemic on the labor forces of other major economies such as Europe, China, and Japan will be even smaller. Labor Market Hysteresis People can drop out of the labor force even if they do not get sick. In fact, 4.4 million have left the US labor force since February, bringing the participation rate down from 63.4% to 61.4%. How great is the risk of “hysteresis,” a situation where the skills of laid-off workers atrophy so much that they become unwilling or unable to rejoin the labor force? At least so far, hysteresis has been limited. According to surveys conducted by the Bureau of Labor Statistics, most US workers who have dropped out of the labor force still want a job. The pandemic has made it more difficult for people to work even when they wanted to. During the spring, more than four times as many employees were absent from work due to childcare requirements than at the same time last year. Now that schools are reopening, it will be easier for parents to go back to work. Admittedly, not everyone will have a job to return to. While about a third of US unemployed workers are still on temporary layoff, the number of workers who have suffered permanent job losses has been steadily rising (Chart 6). The good news is that job openings have recovered most of their decline since the start of the year. Unlike in mid-2009, when there were 6.5 unemployed workers for every one job vacancy, today there are only two (Chart 7). Chart 6US: Permanent Job Losses Have Been Rising Steadily...
US: Permanent Job Losses Have Been Rising Steadily...
US: Permanent Job Losses Have Been Rising Steadily...
Chart 7...But Job Openings Have Recovered Most Of Their Decline Since The Start Of The Year
...But Job Openings Have Recovered Most Of Their Decline Since The Start Of The Year
...But Job Openings Have Recovered Most Of Their Decline Since The Start Of The Year
It is also worth noting that the vast majority of job losses during the pandemic has been among lower-income workers, especially in the retail and hospitality sectors. Most of these jobs do not require highly specialized sector-specific skills. Thus, as long as there is enough demand throughout the economy, unemployed workers will be able to find jobs in other industries. Wither The Capital Stock? The pandemic may end up reducing the value of the capital stock in two ways. First, it could render a portion of the existing capital stock unusable. Second, the pandemic could reduce the pace of new investment, leading to a smaller future capital stock than would otherwise have been the case. Let us explore both possibilities. On the first point, it is certainly true that the pandemic has left a lot of the capital stock idle, ranging from office buildings to shopping malls. However, this could turn out to be a temporary effect. Consider, for example, the case of China. After the pandemic began in Wuhan, China first shut down much of its domestic economy and then implemented an effective mass testing and contact tracing system. The strategy worked insofar as China is now nearly free of the virus. Today, few Chinese wear masks, the restaurants are full again, and domestic air travel is back to last year’s level. Even movie theatre revenue has rebounded. The rest of the world may not be able to replicate China’s success in combating the virus, but then again it won’t need to if an effective vaccine becomes available. Chart 8US Housing Is In A Good Place
US Housing Is In A Good Place
US Housing Is In A Good Place
Even if the pandemic ends up leading to deep and lasting changes in the way people live, work, and shop, the market mechanism will ensure that all but the least desirable parts of the capital stock remain productively employed. As first year economics students learn, if the supply curve is vertical and the demand curve shifts inward, the result will be lower prices rather than diminished output. By the same token, if more companies and workers decide to relocate to the suburbs, urban rents will fall until enough people decide that they are better off staying put. An economy’s productive capacity does not change just because rents go down. What falling demand for urban real estate and increased interest in working from home will do is encourage people to buy larger homes in suburban areas. We have already seen this play out this year. Despite flagging commercial real estate construction in the US, residential construction has boomed. Single-family housing starts were up 24% year-over-year in September. Building permits and home sales have reached new cycle highs. Homebuilder confidence hit a new record in October (Chart 8). The Service Sector Is Not Particularly Capital Intensive Most recessions take a greater toll on the goods-producing sectors of the economy than the service sector. The pandemic, in contrast, has mainly afflicted services. The service sector is the least capital-intensive sector of the economy. This is especially the case when it comes to spending on capital equipment and investment in intellectual property (Chart 9). Chart 9Capex-Intensive Industries Have Let Go Of Less Workers During The Pandemic
How Much Permanent Economic Damage Will The Pandemic Cause?
How Much Permanent Economic Damage Will The Pandemic Cause?
Chart 10Capex Intentions Have Bounced Back
Capex Intentions Have Bounced Back
Capex Intentions Have Bounced Back
As such, it is not surprising that investment in equipment and IP fell less during this recession than one would have expected based on the historic relationship between investment and GDP growth. According to the Atlanta Fed’s GDPNow model, investment in equipment and IP is set to increase by 23% in the third quarter. The snapback in the Fed’s capex intention surveys suggests that investment spending should continue to rise in the fourth quarter and into next year (Chart 10). Productivity And The Pandemic Just as the impact of the pandemic on the labor supply and the capital stock is likely to be limited, the same is true for the efficiency with which capital and labor is transformed into output. For every person whose productivity is hampered by having to work from home, there is another person who feels liberated from the need to spend an hour commuting to work only to attend a series of pointless meetings. In fact, it is quite possible that the pandemic will nudge society from various “low productivity” equilibria to “high productivity” equilibria. For example, greater use of video conferencing could negate the need to take redeye flights to attend business meetings in person. Remote learning could enhance educational opportunities. More widespread use of telemedicine could eliminate the need to waste time waiting in a doctor’s office. Who knows, the pandemic could even fulfill my life-long mission to replace the unhygienic handshake with the much more elegant Thai wai. Granted, disruptive shifts could produce unintended consequences. There is a fine line between creative destruction and uncreative obliteration. If the pandemic forces otherwise viable businesses to close, this could adversely affect resource allocation. Chart 11New Business Applications Have Surged To Record Highs
New Business Applications Have Surged To Record Highs
New Business Applications Have Surged To Record Highs
Chart 12Commercial Bankruptcy Filings Remain In Check
How Much Permanent Economic Damage Will The Pandemic Cause?
How Much Permanent Economic Damage Will The Pandemic Cause?
Fortunately, at least so far, this does not seem to be happening on a large scale. After dropping by 25%, the number of active US small businesses has rebounded to last year’s levels. New business applications have surged to record highs (Chart 11). According to the American Bankruptcy Institute, commercial bankruptcy filings remain near historic lows. While Bloomberg’s count of large-company bankruptcies did spike earlier this year, it has been coming down more recently (Chart 12). Fiscal Stimulus To The Rescue Chart 13Personal Income Jumped Early On In The Pandemic
Personal Income Jumped Early On In The Pandemic
Personal Income Jumped Early On In The Pandemic
How did so many households and businesses manage to avoid the financial suffering that usually goes along with deep recessions? The answer is that governments provided them with ample income support. In the US, real personal income rose by 11% in the first few months of the pandemic (Chart 13). Small businesses also benefited from the Paycheck Protection Program, which doled out low-cost loans to businesses which they will be able to convert into grants upon confirmation that the money was used to preserve jobs. Similar schemes, such as Germany’s Corona-Schutzschild, Canada’s Emergency Business Account program, and the UK’s Coronavirus Job Retention Scheme were launched elsewhere. The failure of the US Congress to pass a new stimulus bill could undermine the sanguine narrative presented above. Small businesses, in particular, are facing a one-two punch from the expiration of the Paycheck Protection Program and tighter bank lending standards. Ultimately, we think the US Congress will pass a new pandemic relief bill. However, the size of the bill could depend on the outcome of the election. In a blue sweep scenario, the Biden administration will push through a $2.5-to-$3.5 trillion stimulus package early next year, while laying the groundwork for a further 3% of GDP increase in government spending on infrastructure, health care, education, housing, and the environment. A fairly large stimulus bill could also emerge if President Trump manages to hang on to the White House, while the Democrats take control of the Senate. Unlike some Republican senators, Donald Trump is not averse to big increases in government spending. A continuation of the current political configuration in Washington would result in the smallest increase in spending. Nevertheless, some sort of deal is likely to emerge after the election. Even most Republican voters favor a large stimulus bill (Table 2). Table 2Strong Support For Stimulus
How Much Permanent Economic Damage Will The Pandemic Cause?
How Much Permanent Economic Damage Will The Pandemic Cause?
A Double-Edged Sword? Bountiful fiscal support has undoubtedly lessened the economic scarring from the pandemic. However, could the resulting increase in government debt lead to supply-side problems down the road? The answer depends on what happens to interest rates. As long as interest rates stay below the growth rate of the economy, governments will not need to raise taxes to pay for pandemic relief. In fact, in such a setting, the public debt-to-GDP ratio will return to its original level with absolutely no change in the structural budget deficit (Chart 14). GDP growth in most developed economies has exceeded government borrowing rates for much of the post-war era (Chart 15). Thus, a free lunch scenario where governments never have to pay back the additional debt they incurred for pandemic relief cannot be ruled out. That said, it would not be prudent to bank on such an outcome. If the excess private-sector savings that have kept down borrowing costs run out, interest rates could rise. In a world awash in debt, this could lead to major problems. Thus, while the structural damage to the global economy from the pandemic appears to be limited for now, that could change in the future. Chart 14A Fiscal Free Lunch When r Is Less Than g
How Much Permanent Economic Damage Will The Pandemic Cause?
How Much Permanent Economic Damage Will The Pandemic Cause?
Chart 15The Rate Of Economic Growth Has Usually Been Higher Than Interest Rates
How Much Permanent Economic Damage Will The Pandemic Cause?
How Much Permanent Economic Damage Will The Pandemic Cause?
Investors should continue to overweight equities for the time being. With a vaccine on the horizon, it makes sense to shift from favoring “pandemic plays” such as tech and health care stocks to favoring “reopening plays” such as deep cyclicals and banks. A more cautious stance towards stocks will be appropriate later this decade if, as flagged above, a stagflationary environment leads to higher interest rates and slower growth. Peter Berezin Chief Global Strategist peterb@bcaresearch.com Footnotes 1 To estimate the direct impact of Covid-19 on the labor force, we calculate the decline in the labor force by age cohorts using Covid-19 death statistics and labor participation rates. 2 David M. Cutler, and Lawrence H. Summers, “The COVID-19 Pandemic and the $16 Trillion Virus,” JAMA Network, October 12, 2020. 3 Hassaan Ahmed, Kajal Patel, Darren Greenwood, Stephen Halpin, Penny Lewthwaite, Abayomi Salawu, Lorna Eyre, Andrew Breen, Rory O’Connor, Anthony Jones, and Manoj Sivan. “Long-Term Clinical Outcomes In Survivors Of Coronavirus Outbreaks After Hospitalisation Or ICU Admission: A Systematic Review And Meta-Analysis Of Follow-Up Studies,” medRxiv, April 22, 2020. 4 Calculated as 0.5 x (decline in labor force due to Covid-19 deaths) x 7 x (1/3). Global Investment Strategy View Matrix
How Much Permanent Economic Damage Will The Pandemic Cause?
How Much Permanent Economic Damage Will The Pandemic Cause?
Current MacroQuant Model Scores
How Much Permanent Economic Damage Will The Pandemic Cause?
How Much Permanent Economic Damage Will The Pandemic Cause?
Global stock prices quickly recovered following their September shakeout. Hopes are rising that a Blue Wave is coming, which will cause a new swell of fiscal spending that will boost profits and patch over any weak spot in the economy. There are problems with…
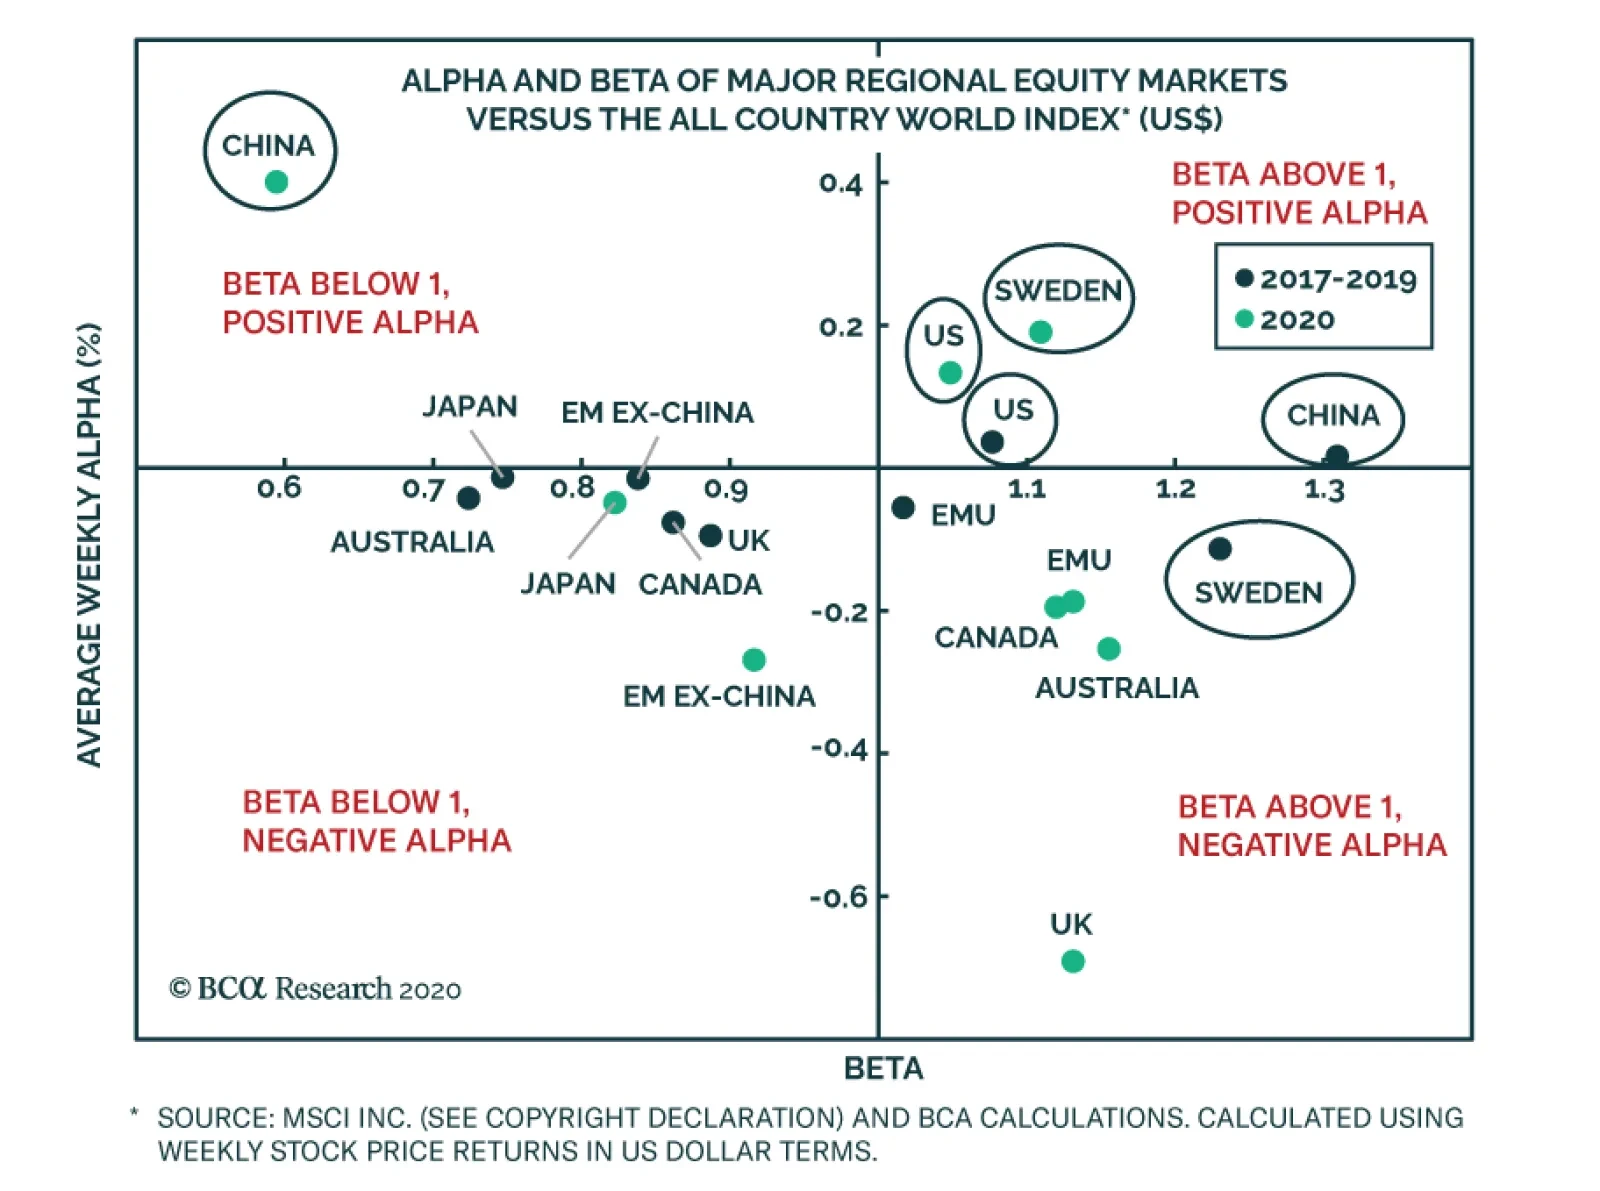
When evaluating how different regional equity markets have fared over a given period, examining returns relative to global stocks is clearly the simplest and most common method to judge performance. However, we find that it is also often helpful to break down…
In our monthly editorial meeting yesterday morning, BCA Research editors discussed the outlook for yields. We agreed that many cyclical forces point toward higher interest rates. The economy is proving surprisingly resilient, the weak dollar is reflationary…
Highlights The US saves too much to achieve full employment but not enough to close the current account deficit. According to the “Swan diagram,” a weaker dollar would move the US economy closer to “external” and “internal” balance. Structural forces are unlikely to have much effect on the value of the dollar over the next few years: The neutral rate of interest is higher in the US than in most other developed economies; the US still earns more on its overseas assets than it pays on its liabilities; and there is no meaningful competition to the dollar’s reserve currency status. Cyclical forces, in contrast, will become more dollar-bearish over the coming months: A vaccine would buoy the global economy next year; interest rate differentials have moved sharply against the dollar; and further fiscal stimulus should lift US inflation expectations. Stocks tend to outperform bonds when the dollar is weakening. Investors should remain overweight global equities on a 12-month horizon, favoring non-US stocks and cyclical sectors. A Clash Of Views? Today marked the last day of BCA’s Annual Investment Conference, held virtually this year in light of the pandemic. As in past years, it was a star-studded cavalcade of the who’s who in financial and policymaking circles. I always find it interesting when two of our speakers seemingly disagree on a critical issue. Such was the case with Larry Summers and Stephen Roach. Larry kicked off the proceedings with an update of his secular stagnation thesis. He argued that his thesis had gone from “a hypothesis that needed to be considered” to a “presumptively accurate analysis of the status quo.” In Larry’s mind, the core problem facing the US and most other economies is a surplus of savings. Excess savings results in a chronic shortfall of spending relative to an economy’s productive capacity. Faced with the challenge of maintaining adequate employment, central banks have been forced to cut rates to extraordinarily low levels. Perpetually easy monetary policy has periodically spawned destabilizing asset bubbles. Larry recommends that governments ease fiscal policy in order to take the burden off central banks. Later that morning, we heard from Stephen Roach. Stephen expects the real US trade-weighted dollar to weaken by 35% by the end of next year. What’s behind this bearish forecast? The answer, according to Stephen, is that the US economy suffers from a shortage of savings. Unable to generate enough domestic savings to cover its investment needs, the US has ended up running persistent current account deficits. How can the US be saving too much, as Larry Summers claims, while also saving too little, as Stephen Roach insists? The two views seem utterly unreconcilable. In fact, I think there is a way to reconcile them with something called the Swan diagram. The Swan Diagram True to the reputation of economics as the dismal science, the Swan diagram – named after Australian economist Trevor Swan – depicts four “zones of economic unhappiness” (Chart 1). Each zone represents a different way in which an economy can deviate from “internal balance” (full employment and stable inflation) and “external balance” (a current account balance that is neither in deficit nor in surplus). Chart 1The Swan Diagram And The Four Zones Of Unhappiness
Does The US Save Too Much Or Too Little?
Does The US Save Too Much Or Too Little?
The four zones are: 1) high unemployment and a current account deficit; 2) high unemployment and a current account surplus; 3) overheating and a current account deficit; and 4) overheating and a current account surplus. The horizontal axis of the Swan diagram depicts the budget deficit. A rightward movement along the horizontal axis corresponds to an easing of fiscal policy. The vertical axis depicts the real exchange rate. An upward movement along the vertical axis corresponds to a currency appreciation. The external balance schedule is downward sloping because an easing of fiscal policy raises aggregate demand (which boosts imports, resulting in a current account deficit). To restore the current account balance to its original level, the currency must weaken. A weaker currency will spur exports, while curbing imports. The internal balance schedule is upward sloping because an easing in fiscal policy must be offset by a stronger currency in order to keep the economy from overheating. The US presently finds itself in the top quadrant of the Swan diagram: It saves too much to achieve internal balance, but not enough to achieve external balance. From this perspective, both Larry Summers and Stephen Roach are correct. Unlike the US, the euro area, Japan, and China run current account surpluses. Rather than pursuing currency depreciation, the Swan diagram says that all three economies would be better off with more fiscal easing. What It Would Take To Eliminate The US Trade Deficit By how much would the real trade-weighted US dollar need to weaken to achieve external balance? According to the New York Fed, a 10% dollar depreciation raises export volumes by 3.5% after two years, while reducing import volumes by 1.6%.1 Given that exports and imports account for 12% and 15% of GDP, respectively, this implies that a 10% dollar depreciation would improve the trade balance by 0.12*0.035+0.15*0.016=0.7% of GDP. Considering that the trade deficit is around 3% of GDP, the dollar may need to weaken by 30%-to-50% to eliminate the trade deficit, a range which encompasses Stephen Roach’s projection for the dollar’s decline. Don’t Hold Your Breath In practice, we doubt that the dollar will decline anywhere close to that much. Despite a net international investment position of negative 67% of GDP, the US still generates substantially more income from its overseas assets than it pays to service its liabilities (Chart 2). This reflects the fact that US foreign liabilities are skewed towards low-yielding government bonds, while its assets largely consist of higher-yielding equities and foreign direct investment (Chart 3). Chart 2The US Generates More Income From Its Overseas Assets Than It Pays On Its Liabilities
The US Generates More Income From Its Overseas Assets Than It Pays On Its Liabilities
The US Generates More Income From Its Overseas Assets Than It Pays On Its Liabilities
Chart 3A Breakdown Of US Assets And Liabilities
Does The US Save Too Much Or Too Little?
Does The US Save Too Much Or Too Little?
Given that the Fed will keep rates on hold at least until end-2023, it is unlikely that US government interest payments will rise substantially in the next few years. Faster Growth Helps Explain America’s Chronic Current Account Deficit The neutral rate of interest is higher in the US than in most other developed economies. Economic theory suggests that global capital will flow towards countries with higher interest rates, producing current account deficits (Chart 4).2 Chart 4Interest Rates And Current Account Balances
Does The US Save Too Much Or Too Little?
Does The US Save Too Much Or Too Little?
The higher neutral rate in the US can be partly attributed to faster trend GDP growth. There are three reasons why faster growth will raise investment while lowering savings, thus leading to a current account deficit: Faster-growing economies require more investment spending to maintain an adequate capital stock. For example, if a country wants to maintain a capital stock-to-GDP ratio of 200% and is growing at 3% per year, it would need to invest (after depreciation) 6% of GDP. A country growing at 1% would need to invest only 2% of GDP. Governments may wish to run larger budget deficits in faster-growing economies in the belief that they will be able to outgrow their debt burdens. To the extent that faster growth may reflect productivity gains, households may choose to spend more and save less in anticipation of higher real incomes in the future. While trend growth is just one of several factors influencing the balance of payments, in general, the evidence does suggest that fast-growing developed economies such as the US and Australia have tended to run current account deficits, while slower-growing economies such as the euro area and Japan have generally run current account surpluses (Chart 5). Chart 5Fast-Growing Developed Economies Tend To Run Current Account Deficits, While Slower- Growing Economies Tend To Run Surpluses
Does The US Save Too Much Or Too Little?
Does The US Save Too Much Or Too Little?
The Dollar’s Reserve Currency Status Is Not In Any Jeopardy Even if many commentators do tend to overstate the importance of having a reserve currency, the dollar’s special status in the global financial system will still provide it with support. The US dollar’s share of global central bank reserves stood at 61.3% in the second quarter of 2020, only modestly lower than where it was a decade ago (Chart 6). While the euro area is not at risk of collapse, it remains an artificial political entity. China’s role in the global economy continues to increase. However, the absence of an open capital account limits the yuan’s appeal. Chart 6The US Dollar’s Share Of Global Central Bank Reserves Has Barely Fallen
Does The US Save Too Much Or Too Little?
Does The US Save Too Much Or Too Little?
Then there’s the dollar’s first mover advantage. During our conference, Marc Chandler likened the greenback to the QWERTY keyboard: It may not be perfect, but like it or not, it has become the default choice for typing. I like to equate the dollar’s role with that of the English language. When a Swede has a business meeting with another Swede, they will speak in Swedish. However, when a Swede has a business meeting with an Indonesian, chances are they will speak in English. By the same token, when a Swede wants to purchase Indonesian rupiah, the bank is unlikely to convert krona directly to rupiah since the probability is low that many people will just happen to be looking to exchange rupiah for krona at precisely the same time. Rather, the bank will first convert the krona to US dollars and then convert the dollars to rupiah. The dollar is the hub of the global financial system. Just like the pound remained the global currency long after the sun had set on the British Empire, King Dollar will endure for many years to come. Cyclical Forces Will Drive The Dollar Lower Chart 7The Dollar Is A Countercyclical Currency
The Dollar Is A Countercyclical Currency
The Dollar Is A Countercyclical Currency
The discussion above suggests that structural forces are unlikely to have much effect on the value of the dollar for the foreseeable future. Cyclical forces, in contrast, will become more dollar-bearish over the coming months. The US dollar is a countercyclical currency, meaning that it tends to move in the opposite direction of the global business cycle (Chart 7). According to the Good Judgment Project, there is a 43% chance that a Covid vaccine will be available by the first quarter of 2021, and a 91% chance it will be available by the end of the third quarter (Chart 8). A vaccine would supercharge global growth, causing the dollar to weaken. Chart 8When Will A Vaccine Become Available?
Does The US Save Too Much Or Too Little?
Does The US Save Too Much Or Too Little?
Interest rate differentials have moved considerably against the dollar – more so, in fact, than one would have expected based on the fairly modest depreciation that the greenback has experienced thus far (Chart 9). Chart 9A Relatively Muted Decline In The Dollar Given The Move In Real Yield Differentials
A Relatively Muted Decline In The Dollar Given The Move In Real Yield Differentials
A Relatively Muted Decline In The Dollar Given The Move In Real Yield Differentials
Chart 10Stocks Tend To Outperform Bonds When The Dollar Is Weakening... As Do Non-US Stocks Versus US
Stocks Tend To Outperform Bonds When The Dollar Is Weakening... As Do Non-US Stocks Versus US
Stocks Tend To Outperform Bonds When The Dollar Is Weakening... As Do Non-US Stocks Versus US
An open question is how additional fiscal support will affect the dollar and other financial assets. Equity investors have brushed off the dwindling prospects for a pandemic relief bill before the election on the assumption that a “blue sweep” will allow the Biden administration to enact even more stimulus than was possible under President Trump and a Republican senate. The dollar rallied in the weeks following Donald Trump’s victory. The dollar also surged in the early 1980s after Ronald Reagan lowered taxes and raised military spending. A key difference between now and then is that real interest rates rose during both of those two prior episodes. Today, the Fed is firmly on hold. This implies that real rates are unlikely to rise much, and could even fall if inflation expectations move up in response to easier fiscal policy. Stocks tend to outperform bonds when the dollar is weakening (Chart 10). In particular, stock markets outside the US often do well in a soft-dollar environment. Investors should remain overweight equities on a 12-month horizon, favoring non-US stocks and cyclical sectors. Peter Berezin Chief Global Strategist peterb@bcaresearch.com Footnotes 1 Mary Amiti, and Tyler Bodine-Smith, “The Effect of the Strong Dollar on U.S. Growth,” Liberty Street Economics, (July 17, 2015). 2 There are many different ways to measure the neutral rate. As depicted in Chart 4, capital flows tend to equalize the neutral rate across countries. This is another way of saying that the neutral rate would be higher in the US were it not for the fact that the US runs a current account deficit. Global Investment Strategy View Matrix
Does The US Save Too Much Or Too Little?
Does The US Save Too Much Or Too Little?
Current MacroQuant Model Scores
Does The US Save Too Much Or Too Little?
Does The US Save Too Much Or Too Little?
Chart Of The WeekInvestor Consensus Is Bearish On Dollar
Investor Consensus Is Bearish On Dollar
Investor Consensus Is Bearish On Dollar
Today we are releasing another issue from our series Charts That Matter. Going forward, this publication will become a regular monthly deliverable to our clients. This is a charts-only report with minimal wording. It presents the key charts, indicators, and relationships that we monitor at the time of publication. Needless to say, the importance of different indicators and factors varies over time. Thus, each issue of Charts That Matter will present different charts, indicators and relationships. Presently, global assets are experiencing a tug-of-war. On the one hand, equity and credit markets are overbought and have elevated valuations. On the other hand, expectations of a large US fiscal stimulus package are sustaining prospects of continued US and global economic recoveries. We have been expecting a pullback in risk assets before year-end due to a delay in significant US fiscal stimulus, potential volatility around the US elections as well as overbought conditions in risk assets. In addition, since April commodities prices have benefited from China’s growth recovery as well as inventory restocking (see Charts on page 11). Given that the latter is likely to be followed by a destocking phase, we believe resource prices are at a risk of experiencing a setback. This will weigh on commodity-producing emerging markets. The correction in September has been short circuited. It seems the prospects of an eventual large US fiscal stimulus package, even if it is next year, and the ongoing recovery in China (Charts on pages 8-9) are sustaining a bid under risk assets. Besides, cash on the sidelines has not been fully exhausted (Charts on page 6). Consistently, we illustrate on pages 3 that various US equity indexes are presently trying to break out and that the US equity market breadth has recently been strong. In contrast, EM equity breadth has been very weak (Chart on page 4). The latest rebound in the EM equity index has been again narrow, led by mega-cap new economy stocks in China, Korea and Taiwan. Provided such poor EM equity breadth in both absolute terms and relative to the US, we are reluctant to upgrade EM equities from neutral to overweight in a global equity portfolio. As to absolute performance, the Charts on pages 12-18 illustrate that many market-based indicators are flagging yellow or red lights for EM risk assets. Even though we turned structurally bearish on the US dollar in early July, we currently expect a tactical rebound in the greenback. Investor sentiment on the greenback is very depressed, which is positive for the US dollar from a contrarian perspective (Chart of the Week on page 1). In short, global financial markets are due to reset, which will not be long-lasting but will be meaningful and produce a better entry point. For now, we maintain a neutral allocation to EM stocks and credit markets within global equity and credit portfolios, respectively. In the currency space, we are short several EM currencies – BRL, CLP, ZAR, TRY, KRW and IDR – versus a basket of the euro, CHF and JPY. As to local rates, we are long duration – receiving 10-year swap rates in several countries – but are reluctant to take on currency risk at the moment. Arthur Budaghyan Chief Emerging Markets Strategist arthurb@bcaresearch.com US Equities Have Been Trading Well Various US equity indexes have broken out to new cyclical highs. This is a sign of a broad-based rally. Chart I-1US Equities Have Been Trading Well
US Equities Have Been Trading Well
US Equities Have Been Trading Well
Chart I-2US Equities Have Been Trading Well
US Equities Have Been Trading Well
US Equities Have Been Trading Well
Equity Market Breadth Is Strong In The US But Poor In EM The advance-decline line for the US equity market has rebounded from the neutral level of 0.5. On the contrary, the same measure for EM stocks remains below the 0.5 line, signaling poor breadth despite the rebound in the EM equity index. Chart I-3Equity Market Breadth Is Strong In The US But Poor In EM
Equity Market Breadth Is Strong In The US But Poor In EM
Equity Market Breadth Is Strong In The US But Poor In EM
The World Economy And Global Trade Are Reviving Economic data for September continue to register a sequential revival in business activity in most parts of the world. Chart I-4The World Economy And Global Trade Are Reviving
The World Economy And Global Trade Are Reviving
The World Economy And Global Trade Are Reviving
Chart I-5The World Economy And Global Trade Are Reviving
The World Economy And Global Trade Are Reviving
The World Economy And Global Trade Are Reviving
The US: Cash On The Sidelines Has Declined But Is Not Exhausted US institutional and money market funds presently amount to 8.5% of the value of the US equity market cap plus all US-dollar denominated bonds available to investors. The Fed and commercial banks hold $11 trillion of debt securities. This amount of securities has been withdrawn from the market and is not available to non-bank investors. Chart I-6The US: Cash On The Sidelines Has Declined But Is Not Exhausted
The US: Cash On The Sidelines Has Declined But Is Not Exhausted
The US: Cash On The Sidelines Has Declined But Is Not Exhausted
Chart I-7The US: Cash On The Sidelines Has Declined But Is Not Exhausted
The US: Cash On The Sidelines Has Declined But Is Not Exhausted
The US: Cash On The Sidelines Has Declined But Is Not Exhausted
A Delay In The US Fiscal Stimulus Package Is A Risk to The US Economy US fiscal transfers have produced a surge in household disposable income, which through consumer spending have contributed to the global recovery via a widening trade deficit. In the absence of large fiscal transfers to consumers, the opposite dynamics will prevail. Chart I-8A Delay In The US Fiscal Stimulus Package Is A Risk to The US Economy
A Delay In The US Fiscal Stimulus Package Is A Risk to The US Economy
A Delay In The US Fiscal Stimulus Package Is A Risk to The US Economy
Chart I-9A Delay In The US Fiscal Stimulus Package Is A Risk to The US Economy
A Delay In The US Fiscal Stimulus Package Is A Risk to The US Economy
A Delay In The US Fiscal Stimulus Package Is A Risk to The US Economy
The Business Cycle In China Is Recovering China’s domestic demand and production are recovering but labor market improvements are still timid. Chart I-10The Business Cycle In China Is Recovering
The Business Cycle In China Is Recovering
The Business Cycle In China Is Recovering
Chart I-11The Business Cycle In China Is Recovering
The Business Cycle In China Is Recovering
The Business Cycle In China Is Recovering
China: The Stimulus Is Working Its Way Into The Economy In China, the credit and fiscal stimulus leads the business cycle by about nine months. Thereby, China’s recovery will continue until the end of Q2 2021. Chart I-12China: The Stimulus Is Working Its Way Into The Economy
China: The Stimulus Is Working Its Way Into The Economy
China: The Stimulus Is Working Its Way Into The Economy
Chart I-13China: The Stimulus Is Working Its Way Into The Economy
China: The Stimulus Is Working Its Way Into The Economy
China: The Stimulus Is Working Its Way Into The Economy
China: Liquidity Tightening Has Not Yet Affected Money And Credit Growth The PBoC has withdrawn liquidity, pushing up the policy rate and bond yields. With a time lag, money and credit growth will eventually roll over. But for now, China is enjoying another period of credit splurge and the credit excesses are getting larger. Chart I-14China: Liquidity Tightening Has Not Yet Affected Money And Credit Growth
China: Liquidity Tightening Has Not Yet Affected Money And Credit Growth
China: Liquidity Tightening Has Not Yet Affected Money And Credit Growth
Chart I-15China: Liquidity Tightening Has Not Yet Affected Money And Credit Growth
China: Liquidity Tightening Has Not Yet Affected Money And Credit Growth
China: Liquidity Tightening Has Not Yet Affected Money And Credit Growth
China: From Commodities Restocking To Destocking? Chinese imports of many commodities have been super strong since April. However, they have substantially outpaced their final demand. This suggests there has been an inventory restocking phase. This will likely soon be followed by a period of destocking when Chinese imports of resources dwindle for several months. Chart I-16China: From Commodities Restocking To Destocking?
China: From Commodities Restocking To Destocking?
China: From Commodities Restocking To Destocking?
Chart I-17China: From Commodities Restocking To Destocking?
China: From Commodities Restocking To Destocking?
China: From Commodities Restocking To Destocking?
Red Flags For EM Currencies The rollover in platinum prices and pick-up in EM currency volatility (shown inverted on the bottom panel) point to a rebound in the US dollar and a relapse in EM exchange rates. Chart I-18Red Flags For EM Currencies
Red Flags For EM Currencies
Red Flags For EM Currencies
Yellow Flags For EM Equities The new cyclical high in EM share prices has not been confirmed by a new low in EM equity volatility (the latter shown inverted in the top panel). Moreover, our Risk-On/Safe-Haven Currency ratio has been trending lower since June, flagging risks to EM assets. Finally, global ex-TMT stocks are struggling to break above their June highs. Chart I-19Yellow Flags For EM Equities
Yellow Flags For EM Equities
Yellow Flags For EM Equities
EM Sovereign And Corporate Spreads, Currencies, Equities And Commodities Commodities prices and EM currencies drive EM sovereign and corporate spreads while EM corporate bond yields (shown inverted in the bottom panel) correlate with EM share prices. Chart I-20EM Sovereign And Corporate Spreads, Currencies, Equities And Commodities
EM Sovereign And Corporate Spreads, Currencies, Equities And Commodities
EM Sovereign And Corporate Spreads, Currencies, Equities And Commodities
Many Currencies Against The US Dollar Are At Critical Resistances If these currencies break out of these technical resistance levels, they will experience a lasting appreciation versus the US dollar. However, in our view, they will initially weaken before breaking out next year. Chart I-21Many Currencies Against The US Dollar Are At Critical Resistances
Many Currencies Against The US Dollar Are At Critical Resistances
Many Currencies Against The US Dollar Are At Critical Resistances
Chart I-22Many Currencies Against The US Dollar Are At Critical Resistances
Many Currencies Against The US Dollar Are At Critical Resistances
Many Currencies Against The US Dollar Are At Critical Resistances
Are Global Defensive Equity Sectors On A Cusp Of Outperformance? Many defensive equity sectors have reached or are close to their technical support lines. Their outperformance will likely occur during a risk-off period. Chart I-23Are Global Defensive Equity Sectors On A Cusp Of Outperformance?
Are Global Defensive Equity Sectors On A Cusp Of Outperformance?
Are Global Defensive Equity Sectors On A Cusp Of Outperformance?
Chart I-24Are Global Defensive Equity Sectors On A Cusp Of Outperformance?
Are Global Defensive Equity Sectors On A Cusp Of Outperformance?
Are Global Defensive Equity Sectors On A Cusp Of Outperformance?
These Markets Have Not Yet Entered A Bull Market These markets have rebounded to their technical resistance lines but have so far failed to break out. This gives us comfort to remain neutral on EM by expecting a pullback. Chart I-25These Markets Have Not Yet Entered A Bull Market
These Markets Have Not Yet Entered A Bull Market
These Markets Have Not Yet Entered A Bull Market
Chart I-26These Markets Have Not Yet Entered A Bull Market
These Markets Have Not Yet Entered A Bull Market
These Markets Have Not Yet Entered A Bull Market
Risk Measures Signal Modest Investor Complacency The SKEW index for the S&P 500 is low, entailing that investors are not hedging tail risks. The put-call ratio is not elevated despite many investors hedging against the US election uncertainty. Critically, the Nasdaq’s volatility is in a bull market. Chart I-27Risk Measures Signal Modest Investor Complacency
Risk Measures Signal Modest Investor Complacency
Risk Measures Signal Modest Investor Complacency
Chart I-28Risk Measures Signal Modest Investor Complacency
Risk Measures Signal Modest Investor Complacency
Risk Measures Signal Modest Investor Complacency
EM (ex-China, Korea And Taiwan): The Recovery Is Sluggish And Subdued Outside China, Korea and Taiwan, EM domestic demand recovery is very slow and tame. In these economies, the fiscal stimulus has been small, the banking system is unhealthy and the monetary transmission mechanism is broken, i.e. banks are failing to properly transmit monetary easing into the real economy. Chart I-29EM (ex-China, Korea And Taiwan): The Recovery Is Sluggish And Subdued
EM (ex-China, Korea And Taiwan): The Recovery Is Sluggish And Subdued
EM (ex-China, Korea And Taiwan): The Recovery Is Sluggish And Subdued
Chart I-30EM (ex-China, Korea And Taiwan): The Recovery Is Sluggish And Subdued
EM (ex-China, Korea And Taiwan): The Recovery Is Sluggish And Subdued
EM (ex-China, Korea And Taiwan): The Recovery Is Sluggish And Subdued
Footnotes Equities Recommendations Currencies, Credit And Fixed-Income Recommendations
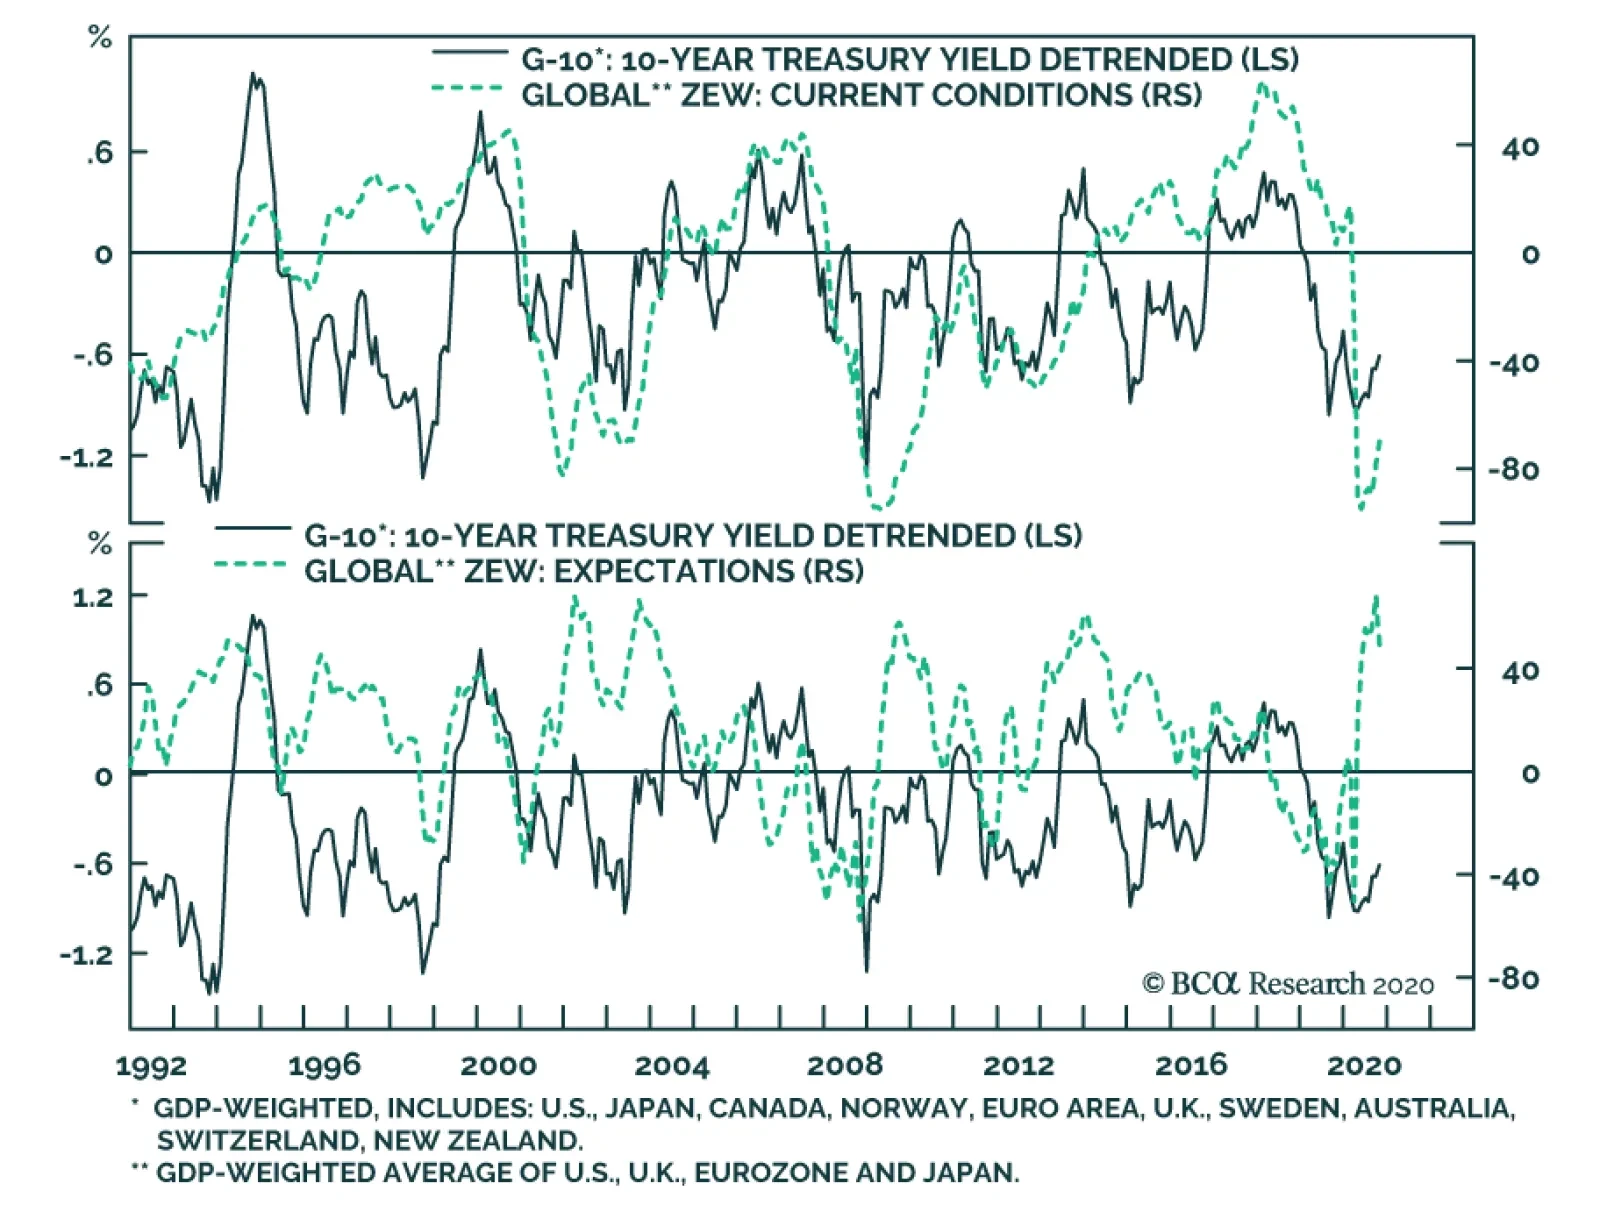
The German ZEW survey was a disappointment in October. While the Current Situation component improved a little bit in both Germany and the Eurozone, the Expectations component declined. This dichotomy was replicated in the UK, Japan and the US. As a result,…