Global

Highlights President Trump’s final actions and the US fiscal impasse pose non-trivial risks to the rally. Biden’s foreign policy cabinet picks have limited impact but are mildly positive for now. Biden’s multilateralism will eventually conflict with the need to get things done. Continuities with Trump foreign policy are underrated. The RCEP trade agreement is not a game changer but a pro-trade shift in the US would be. Europe is a clear winner of the US election but continental politics risk will pick up next year from today’s lows. Book profits on select risk-on trades, but go strategically long GBP-EUR. Feature Global financial markets are surging on a raft of good news. We are booking some gains as we expect the rally to be capped in the near term either by Trump’s final actions as president or by the US fiscal impasse. First, the good news. The US power transition is officially under way, reducing US policy uncertainty. The popular vote within the critical battleground states acted as a restraint on the Republican Party’s ability to dispute the results or appoint Republican electors to the Electoral College.1 Chart 1US And Global Policy Uncertainty Falling
US And Global Policy Uncertainty Falling
US And Global Policy Uncertainty Falling
President-Elect Joe Biden is preparing the US for a return to rule by experts. This will not prevent grand policy errors in the future but it will give confidence to the market today. Biden is nominating a slate of White House advisers and cabinet members who are traditional Democrats or left-leaning technocrats. For example, former Fed Chair Janet Yellen looks to serve as Treasury Secretary, longtime Biden and Barack Obama adviser Anthony Blinken as Secretary of State, and former Hillary Clinton and Obama staffer Jake Sullivan as national security adviser. Biden may nominate a few far-left officials (e.g. for the Labor Department) but the most important positions are quickly filling up with conventional faces, a boon for financial markets. Democrats are unlikely to win control of the Senate on January 5 but even if they do their single-vote majority will probably be too small to enable any radical cabinet picks – or radical legislation.2 The downside is that spending will be constrained and monetary and fiscal policy will remain uncoordinated, regardless of Yellen’s unique ability to work with Fed Chair Jay Powell. With Biden reportedly leaning on House Democrats to cut a COVID fiscal relief deal, there is a 50/50 chance that a $500-$750 billion bill passes in the “lame duck” session of Congress prior to Christmas. This would be a positive surprise. We are not counting on a deal until the first quarter next year. Hence US policy uncertainty will remain elevated. Meanwhile global policy uncertainty could spike again as long as President Trump remains in office and seeks to achieve policy objectives on the way out. Biden does not take office until January 20, but over a 12-month horizon we see a clear case for cyclical sectors and European stocks to outperform defensive sectors and American stocks as a result of Biden’s trade peace dividend, i.e. eschewing sweeping unilateral tariffs (Chart 1). Chart 2Vaccine On The Horizon
Keep The Rally At Arm's Length – (GeoRisk Update)
Keep The Rally At Arm's Length – (GeoRisk Update)
While COVID-19 spikes, consumer wariness, and partial lockdowns will weigh on fourth quarter economic activity, several vaccines are on the way. The latest wave of the outbreak is already rolling over in Europe, which bodes well for the United States (Chart 2). Again, the 12-month outlook is brighter than the near term. Over the long haul, investors also have reason to be optimistic about governance in the developed world. The takeaway from this year is that the US and UK, the two major developed markets that saw right-wing populist movements win big votes in 2016, and two governments whose handling of the pandemic was at best muddled, led the development of vaccines in record time to deal with an entirely novel coronavirus and global pandemic.3 The US constitutional system withstood a barrage of partisan assaults both from President Trump and his supporters and their opponents. The British constitutional system is handling Brexit. Most other developed markets also navigated the crisis reasonably well. Weaknesses were revealed, and there will be aftershocks, but the sky is not falling. Near term US policy uncertainty will remain elevated due to fiscal impasse. Bottom Line: The rise in global risk assets may overshoot on positive news, but the US fiscal impasse could undercut the rally, as could Trump’s parting actions over the next two months. Market Not Priced For Lame Duck Trump There is a fair chance of an American or Israeli surgical strike against Iran or its militant proxies to underscore the red line against nuclear weaponization. Financial markets are not prepared for a major incident of armed conflict. Neither Israeli nor UAE equities are priced for near-term risks to materialize. The same goes for UAE or Saudi credit default swaps (Chart 3). An even greater risk to financial markets comes from the Trump administration’s pending actions on China. Trump is highly likely to take punitive or disruptive actions against China. His major contribution to US foreign policy is the confrontation with China, which was also the origin of the coronavirus and hence his electoral defeat. Already since the election Trump has imposed sanctions on US investments in state-owned enterprises. China’s fiscal and quasi-fiscal stimulus is peaking at the moment. This provides some buffer for its economy and the global economy if Trump hikes tariffs or imposes sweeping sanctions. But there are signs of instability beneath the surface. Authorities have tightened interbank rates sharply and intervened to prevent asset bubbles. The country is seeing turmoil in the bond market as a result of these actions and ongoing economic restructuring (Chart 4). Chart 3Risk Of US Or Israeli Strike On Iran
Risk Of US Or Israeli Strike On Iran
Risk Of US Or Israeli Strike On Iran
Chart 4Chinese Stimulus And Bond Market Volatility
Chinese Stimulus And Bond Market Volatility
Chinese Stimulus And Bond Market Volatility
Once again the market is not prepared for another major shock in the US-China relationship. The People’s Bank has allowed the renminbi to appreciate drastically this year. This trend will reverse if President Trump punishes China. As China’s economic momentum wanes and a new US administration enters office, it would make sense to allow the currency to depreciate. After all, the Biden administration will expect the renminbi to appreciate just as all previous administrations have done, but the People’s Bank will not want the yuan to fall much below the ~6.2 level that prevailed just before the trade war started in early 2018 (Chart 5). Chart 5Renminbi Priced For Zero Trump Tariffs
Renminbi Priced For Zero Trump Tariffs
Renminbi Priced For Zero Trump Tariffs
Biden’s Foreign Policy: Continuities With Trump It is too soon to speak of the “Biden Doctrine.” Cabinet appointments will have limited impact relative to geopolitical fundamentals. Neither Biden nor Blinken have a consistent theme to their foreign policy decisions. Michèle Flournoy may or may not be nominated as Defense Secretary. What is clear is that Biden is in favor of establishment national security policymakers who want the US to work more closely with allies and international institutions. Starting in January, this shift will make US foreign policy somewhat more predictable. On Iran, Biden will seek to rejoin the 2015 nuclear deal prior to the June 18, 2021 Iranian presidential election, but he will also have reason to sustain the Arab-Israel rapprochement that the Trump administration initiated via the Abraham Accords. News reports indicate that Israeli Prime Minister Bibi Netanyahu met with Saudi crown prince Mohammad bin Salman along with US Secretary of State Mike Pompeo in a “secret” meeting on November 23. The Saudis could eventually normalize ties with Israel, but only once an Israeli-Palestinian settlement is reached. The Democrats have a long-running interest in negotiating such a settlement. Progress can be made as long as the Saudis and Israelis do not try utterly to sabotage Biden’s Iran deal. They would risk isolation from American support – an intolerable risk for both states. An American détente with Iran combined with normalized Arab-Israeli relations would create something resembling a balance in the region, which is what the Biden administration needs in order to maintain the “pivot to Asia” that will be its dominant foreign policy agenda. Biden’s pivot to Asia will start with a diplomatic “reset” with China so that strategic dialogue can resume and areas of cooperation can be identified. As Chart 5 above shows, the market is priced for Biden to reduce tariffs back to their September 2018 level (25% on $50 billion of imports and 10% on $200 billion). Anything is possible, since tariffs are an executive decision, but we would not bet on Biden sacrificing all of his leverage when the US-China strategic tensions are fundamentally rooted in the US’s loss of global standing and China’s rejection of the liberal world order. What is clear is an emerging contradiction that Biden will eventually have to resolve between multilateralism and getting things done. The Communist Party remains undeterred in its pursuit of economic self-sufficiency and state-backed technological and manufacturing dominance. This will fundamentally run afoul of US interests. If Biden relies on multilateral diplomacy to update and extend the Iranian nuclear deal, he will find it much more difficult to gain Russian and Chinese cooperation than Obama did. Russia’s interference in the 2016 election and Trump’s trade war have poisoned the well. If Biden does not give enough ground to get Russo-Chinese cooperation, then he will have to use unilateral American power (i.e. Trump’s maximum pressure policy) or just settle for rejoining the 2015 nuclear deal without any safeguards against ballistic missiles or militant proxies. The original deal expires in 2025. Chart 6Greater China Still Center Of Geopolitical Risk
Greater China Still Center Of Geopolitical Risk
Greater China Still Center Of Geopolitical Risk
The same goes for Biden’s handling of Trump’s China policy. Biden wants to revive the World Trade Organization. But if he adheres to the WTO then he will have to rescind all of Trump’s tariffs, since they have been declared illegal. This will reduce his leverage on unresolved structural disagreements. Biden wants to reach out to the allies on how to handle China. It is not clear how he will respond to the Trump administration’s outgoing scheme to create an alliance of liberal democracies that would arrange to purchase each other’s goods and possibly implement counter-tariffs in response to Chinese boycotts, such as the one placed on Australia today. Biden may not adopt the scheme. But the alternative would be to leave states to succumb to China’s political boycotts, thus failing to build an effective multilateral response to China’s aggressive foreign policy. China’s fourteenth five-year plan reveals that the Communist Party remains undeterred in its pursuit of economic self-sufficiency and state-backed technological and manufacturing dominance. This will fundamentally run afoul of US interests. Thus we expect the Biden administration to conduct a foreign policy that is tougher on China than the Obama administration, that retains most of the Trump tariffs and tech sanctions, and that more resolutely attempts to build a coalition to pressure China into adopting international liberal norms. This policy trajectory virtually ensures that Biden will have to adopt some of Trump’s policies. Chinese equities are not priced for this risk. The pronounced risk of a fourth Taiwan Strait crisis is just starting to be recognized (Chart 6). The risk to our view is a grand US-China re-engagement. This is possible, but we think the current trajectory of China will cause a new confrontation even if Biden is less hawkish than Trump. Bottom Line: Financial markets are underrating Chinese/Taiwanese political and geopolitical risks, both from Trump’s lame duck period and from Biden’s pivot to Asia. Did China Just Take Charge Of Global Trade? Several clients have written to ask us about the Regional Comprehensive Economic Partnership (RCEP), a large new free trade agreement (FTA) signed by China and its Asian trading partners. RCEP is not a game changer but it is marginally positive for the global economy. Moreover it has the potential to ignite a new round of trade agreements, for instance by provoking the US (and the UK) to join the Trans-Pacific Partnership. RCEP is a traditional free trade agreement that will cut tariffs by an average of 90% for its members. Membership includes China, Japan, South Korea, the Association of Southeast Asian Nations (ASEAN), Australia, and New Zealand. It has not been ratified and will take ten years to fully implement after ratification. Over the past 30 years, manufacturing-oriented East Asian nations have reflexively responded to global shocks and slowdowns by deepening their trade integration. RCEP shows that this trend remains intact. China is the only member of the pact that is seeing trade grow at the moment – the others are still seeing declines due to the global recession but are hoping to increase nominal growth by removing trade barriers (Chart 7). RCEP is also notable because it is China’s second multilateral trade deal (the first was the China-ASEAN FTA). Beijing normally prefers bilateral deals where its size gives it the advantage, but it is trying to demonstrate greater willingness to work multilaterally. President Xi Jinping has rhetorically positioned himself as an advocate of free trade and multilateralism on the global stage, despite his pursuit of import substitution and state industrial subsidies at home. As long as China continues expanding trade with others it will smooth the painful restructuring of its manufacturing sector and blunt some of the criticisms about mercantilism. Ironically it is Japan’s decision to join, rather than China’s, that makes RCEP distinct. Japan did not have an FTA with South Korea and it was the only member of RCEP that did not already have a free trade deal with China. (Japan also lacked a deal with New Zealand.) This decision is not new but reflects the paradigm shift in Japanese national policy that began after the global financial crisis of 2008. In 2011, Japan signed an FTA with India. Thereafter Abenomics supercharged international trade and investment policies as part of the “third arrow” of pro-growth structural reform, which Abe’s successor Yoshihide Suga is continuing. So why is RCEP not a game changer? Because all of these countries other than Japan already have FTAs with each other and their tariff rates are already quite low. Moreover there is nothing particularly advanced about RCEP. It is a traditional deal focused on trade in goods and does not really attempt anything groundbreaking with services, or to incorporate new industries, lay down standards for labor or environment, or remove non-tariff barriers. Contrast the Comprehensive and Progressive Trans-Pacific Partnership (CPTPP), the trade deal originated by the United States for Pacific Rim countries that attempts to do all these things, but was hobbled by the Trump administration’s decision to withdraw from it. The real significance of RCEP is that even as it shows continuity in Asian economic policy, with China at the center, it will also provoke new deal-making. Now that China, Japan, and South Korea are joining a single trade agreement, they will have a foundation on which to move forward with their long-delayed trilateral FTA. These developments will provoke the Biden administration into rejoining the CPTPP, which in turn would create a new higher standard type of trade bloc that has the potential to attract democracies into a high-standards bloc that excludes China. Biden will also revive the Transatlantic Trade and Investment Partnership (TTIP), the European counterpart to the Pacific deal. On the campaign trail, Biden said that he would “renegotiate” Trans-Pacific Partnership in order to rejoin it, a Trumpian formulation. This is feasible. After the US withdrawal, the various members of the Trans-Pacific Partnership modified the deal (dubbing it the CPTPP) to remove provisions that the US had insisted on and restore provisions that the US had demanded they remove. But they will gladly readmit the US now that Trump is gone, creating a trade bloc of comparable size to RCEP but with much more ambitious aims (Chart 8). The UK, South Korea, Thailand and others will be interested in joining. But China can only join if it embraces liberal reforms that are at odds with its new five-year plan, including reduced support for state-owned enterprises. Chart 7Weak Trade Prompts Asian Trade Deal
Weak Trade Prompts Asian Trade Deal
Weak Trade Prompts Asian Trade Deal
Chart 8Putting RCEP Into Perspective
Putting RCEP Into Perspective
Putting RCEP Into Perspective
The Republican Senate will be required to get approval for CPTPP, which is an obstacle, but Biden’s secret weapon is that the CPTPP has special appeal for Republicans precisely because it excludes China. Pro-trade moderates will find common cause with China hawks. As long as Trade Promotion Authority is renewed by the deadline on July 1, 2021, then the US can rejoin CPTPP on a simple majority vote. This is precisely how Republicans ratified Trump’s USMCA (the revised NAFTA). Trump also signed a trade deal with Japan, revealing that even under Trump’s leadership the US agreed to TPP-like deals with its biggest trading partners within the CPTPP (Canada, Mexico, Japan). More broadly, Trump’s experiment with protectionism has revealed that American attitudes toward global trade are not uniformly hostile. Polls show that Americans are generally pro-trade, and while they are skeptical that global trade creates jobs and higher wages, they are mostly skeptical of business-as-usual with China.4 Geopolitically, the US will not be able to stand idly by while China increases its sphere of influence in Asia. Therefore we should expect the Biden administration to pursue the CPTPP and other trade initiatives. The GOP Senate is the key constraint but it is not utterly prohibitive. Bottom Line: China and Asia continue to expand trade in the face of economic slowdown. The US Senate will be the key bellwether for US trade initiatives in 2021-22, but the geopolitical need to counter China will likely force the US to rejoin the CPTPP. Strategically we are long CPTPP equities – which includes some key RCEP members – as well as RCEP equities like South Korea. Chinese equities have already rallied a lot this year due to the country’s better handling of the pandemic and quicker economic recovery – they also face headwinds from US policy. Whereas emerging Asia equities ex-China, relative to all global equities, have plenty of catching up to do and will be beneficiaries of a global recovery in which both the US and China are courting them. Not Too Late To Go Long Pound Sterling The Brexit finale is approaching as the UK and EU enter the eleventh hour in their negotiation of a post-Brexit trade deal for the period after December 31, 2020. The market expects the UK, which is more dependent on EU trade than vice versa, to capitulate to an agreement that prevents a 3% tariff hike on all of its exports to the EU. This hike would occur if the UK-EU relationship reverted to WTO Most Favored Nation status. Boris Johnson promised in the Conservative Party manifesto to negotiate a trade deal and won a resounding single-party majority in December 2019. This gives him the room to marginalize hard Brexiteers and get a deal passed in parliament. The pound has rallied by 1.45% against the dollar since the beginning of the year and it is now rallying against the euro, moving off the “hard Brexit” lows (Chart 9), suggesting that the market is tentatively anticipating a trade deal. Chart 9UK-EU Trade Deal Expected, But GBP-EUR Offers Upside
UK-EU Trade Deal Expected, But GBP-EUR Offers Upside
UK-EU Trade Deal Expected, But GBP-EUR Offers Upside
Chart 9UK-EU Trade Deal Expected, But GBP-EUR Offers Upside
UK-EU Trade Deal Expected, But GBP-EUR Offers Upside
UK-EU Trade Deal Expected, But GBP-EUR Offers Upside
Failing to get a trade deal would require Johnson to break the EU withdrawal deal, since that deal requires a system of trade checks on the Irish Sea that introduces a barrier between Northern Ireland and the rest of the United Kingdom. Johnson has no incentive to stick to this deal if he does not have privileged access to the EU’s single market. But then a hard border of physical customs checks would arise on Northern Ireland’s border with the Republic of Ireland. This would not only aggravate relations with Ireland and the EU but would alienate the incoming American administration, which would view it as a violation of the US-brokered Good Friday Agreement (1998) and refuse to agree to a trade deal with the UK. Irish equities are not behaving as if a 3% tariff on all imports from the UK is about to take effect (Chart 10). Both GBP-USD and Irish equities have considerable downside if the deal falls through. The fact that the GBP-EUR appreciation is slight suggests less downside and more upside here. Subjectively we have argued there is a 35% chance that the UK will quit the EU “cold turkey” at the end of the year. The cost of more than $6 billion in foregone trade, which would grow each year, is not prohibitive. The economy is already subsisting on monetary and fiscal stimulus due to COVID-19. Boris Johnson does not face an election until 2024. The hardest limitation facing the UK is the relationship with Scotland. The hardest limitation facing the UK is the relationship with Scotland. Northern Ireland is not likely to leave anytime soon but 45% of Scots voted for independence in 2014. Support for independence meets resistance at 50% of the population (Chart 11), but an economic shock stemming from a failure to get a trade deal would push it above the limit (given that 62% of Scots never wanted to leave the EU in the first place). Chart 10Irish Equities Already Priced UK Trade Deal
Irish Equities Already Priced UK Trade Deal
Irish Equities Already Priced UK Trade Deal
Chart 11Scotland Drives UK Toward A Trade Deal
Scotland Drives UK Toward A Trade Deal
Scotland Drives UK Toward A Trade Deal
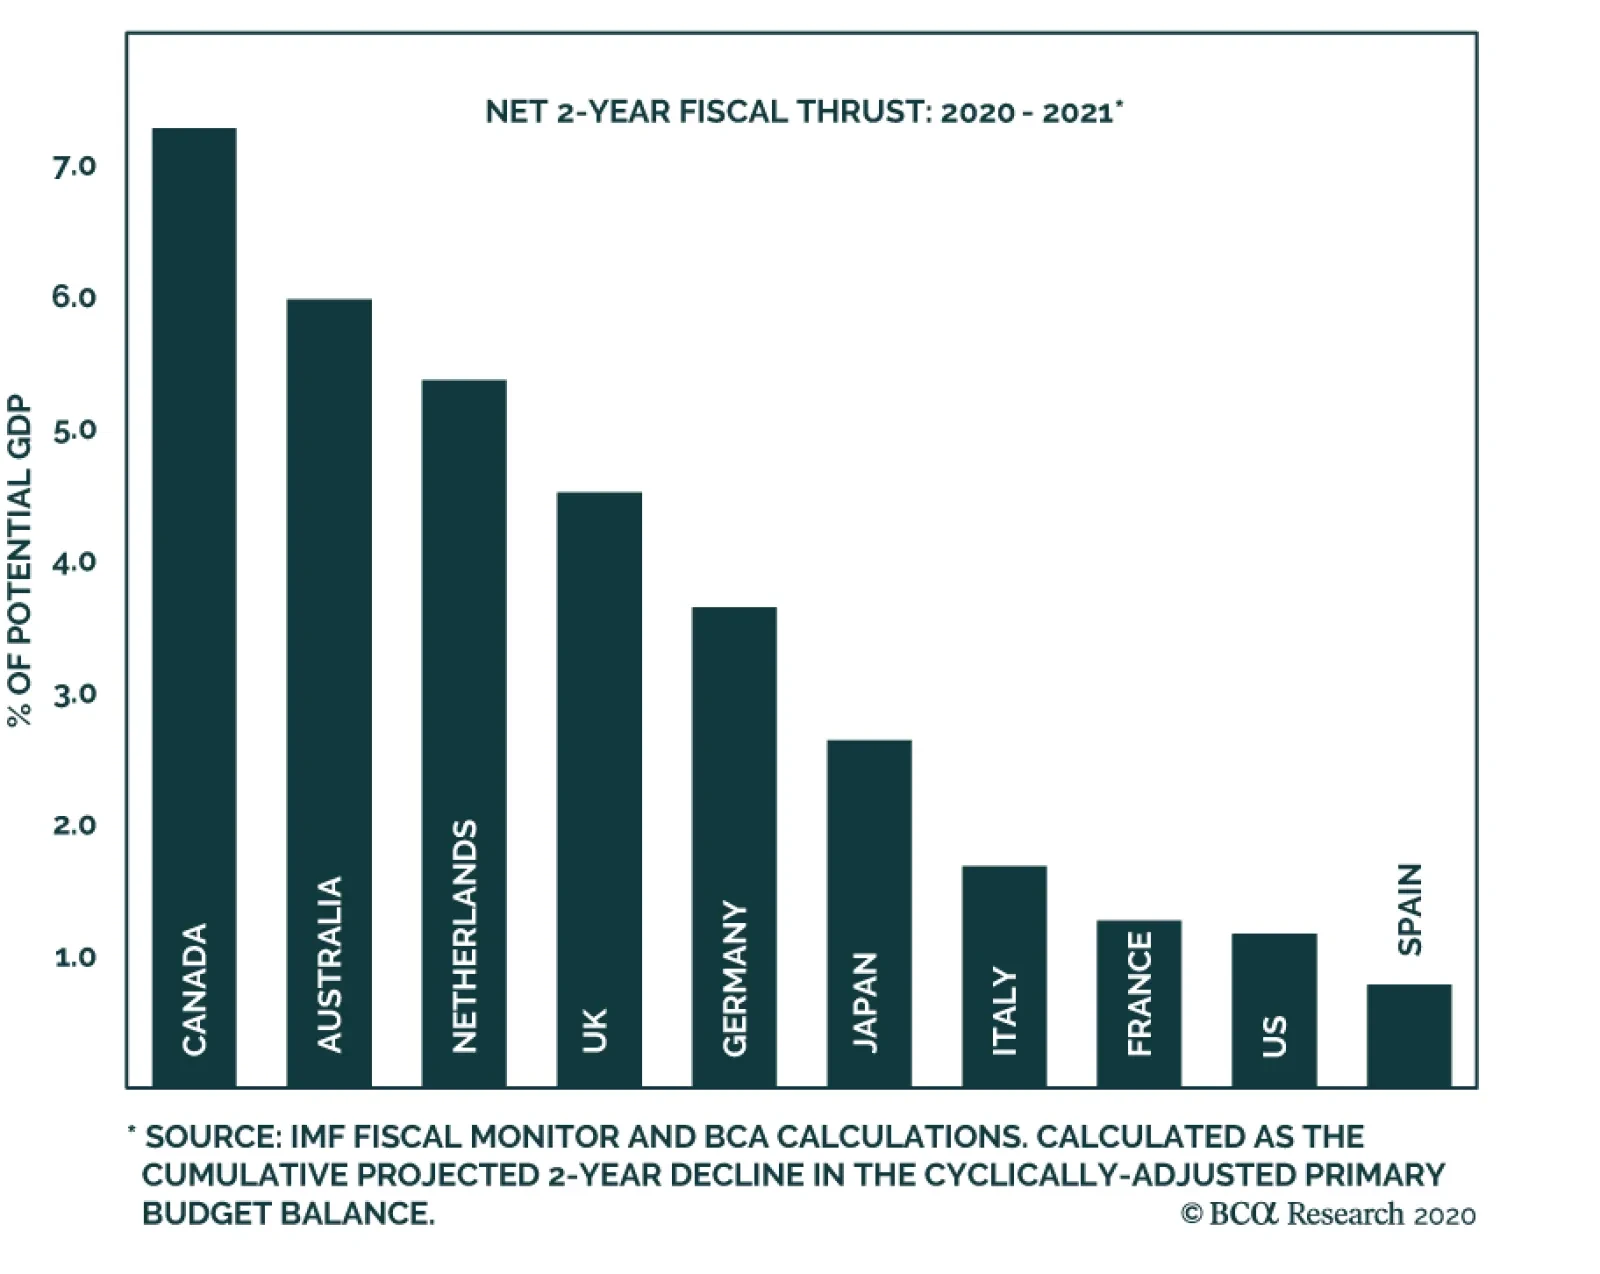
Johnson has the ability to conclude a deal, avoid an economic shock on top of COVID, keep the Scots in the union, and then set about overseeing his government’s mammoth economic recovery plan. His popularity is tenuous enough that the other pathway is not only more economically costly but also more likely to get him unseated and potentially to burden him with the legacy of being the last prime minister of a united kingdom. Bottom Line: It is not too late to go long GBP-EUR. A near-term global risk-off move would work against this trade but it is a strategic opportunity. Low EU Political Risk Will Pick Up In 2021 In our annual outlook for 2020 we highlighted how the EU was relatively politically stable while its geopolitical competitors – Russia, China, even the US – were far from stable. Today this is still the case – Europe’s political fundamentals are fine. But risks are rising due to partial COVID lockdowns, fiscal risks, and the approach of a series of important elections from now through 2022. A major problem for the global economy is the looming contraction in fiscal deficits in 2021 as economies step down from this year’s extraordinary fiscal stimulus measures. This downshift will be especially disruptive for the US, UK, and Italy due to the size of their stimulus packages, resulting in a fiscal drag of 5% of GDP if no additional measures are taken. But even Germany, France, and other EU members face at least a 2.5% of GDP contraction (Chart 12). Chart 12Europe's Fiscal Cliff Needs Attention
Europe's Fiscal Cliff Needs Attention
Europe's Fiscal Cliff Needs Attention
Chart 12Europe's Fiscal Cliff Needs Attention
Europe's Fiscal Cliff Needs Attention
Europe's Fiscal Cliff Needs Attention
Adding more fiscal support should be feasible in a world where the Fed and ECB are maintaining ultra-dovish monetary policy for the foreseeable future and the EU has agreed to allow mutualized debt issuances. Germany has embraced deficit spending in the wake of the austerity-laden 2010s, which brought significant populist challenges to the European political establishment. However, developed market economies are still highly indebted, a constraint on deficits, and those with political blockages could still have trouble passing large enough spending measures to remove the impending fiscal drag. The US faces gridlock in 2021 and therefore its fiscal cliff is a significant headwind to financial markets. One positive factor in providing fiscal support thus far is that, with the exception of Spain and the UK, European leaders and ruling coalitions have received a bounce in popular opinion this year (Chart 13). Chart 13EU Leaders’ Approval Bounced – Now What?
Keep The Rally At Arm's Length – (GeoRisk Update)
Keep The Rally At Arm's Length – (GeoRisk Update)
Mark Rutte and his People’s Party for Freedom and Democracy (VVD) have benefited more than other countries but the combined support for opposition parties is rising ahead of the March 17, 2021 general election (Chart 14, top panel). A leading anti-establishment candidate has dropped out of the race. Fiscal measures will depend on the election. Chart 14Will EU Elections Really Be A Cakewalk?
Will EU Elections Really Be A Cakewalk?
Will EU Elections Really Be A Cakewalk?
Chart 15European Risk To Rise On Looming Elections
European Risk To Rise On Looming Elections
European Risk To Rise On Looming Elections
The German and French governments have also seen a bounce in support but need to maintain it for a longer period, as they have elections due by October 24, 2021 and May 13, 2022 respectively. French President Emmanuel Macron can still summon majorities in the National Assembly, despite losing his single party majority, and has sidelined his structural reform agenda to boost the economy. Germany is also capable of passing new measures, and has time to do so before momentum wanes amid the contest to succeed Chancellor Angela Merkel. The leadership race in the ruling Christian Democratic Union will at least raise hawkish rhetoric (Chart 14, middle panels). But markets will be placated by the fact that popular opinion is not pro-austerity at present, and the alternative to the CDU is a fiscally profligate left-wing coalition consisting of the Greens, Social Democrats, and possibly the anti-establishment hard-left, Die Linke. Spain and Italy have the least stable governments, are the likeliest to see snap elections, and thus could surprise the market with fiscal risks. Both governments lack a strong mandate and rule over a divided political scene. Italy’s Prime Minister Giuseppe Conte has seen a swell of support but he is a fairly non-partisan character and his coalition has been flat in opinion polling. It is less popular than the combined right-wing opposition, which is striving for power ahead of the fairly consequential 2022 presidential election. In Spain, not only has popular approval dropped, but the Socialist Party and the left-wing Podemos run a minority government, meaning that there is potential for gridlock to increase fiscal risk (Chart 14, bottom panels). The market is pricing higher political risk for European countries amid the partial COVID lockdowns but this risk will likely remain elevated due to looming elections (Chart 15). The market is pricing higher political risk for European countries amid the partial COVID lockdowns but this risk will likely remain elevated due to looming elections. The silver lining is that Brussels, Berlin, and the wider political establishment have become fundamentally more accepting toward budget deficits during times of distress. The ECB and European Commission Recovery Fund provide a combined monetary and fiscal backstop. Negative interest rates on debt enable fiscal largesse with minimum implications for sustainability. And none of these elections raise systemic risks regarding EU and EMU membership, other than conceivably Italy. So while fiscal risk will become more relevant in 2021, it is not a problem while COVID is still raging, and there are better chances of maintaining a fiscally proactive policy than at any previous time over the past two decades. Bottom Line: European elections and a looming fiscal drag will keep EU political risk from collapsing after the latest round of lockdowns ease. Biden And Emerging Market Strongmen Most of the emerging market strongmen – Recep Erdogan, Vladimir Putin, Jair Bolsonaro – have increased their popular support this year, benefiting from national solidarity in the face of crisis. The exception is Narendra Modi, who is struggling (Chart 16). Still, Modi has a single-party majority and four years on the election clock, and is thus more stable than Bolsonaro, who fundamentally lacks a political base despite his bounce in polls, and Erdogan, whose increase in support will fade amid a host of domestic and international challenges ahead of the 2023 elections. The US election will have limited impact on these leaders. None of them have good relations with the Democratic Party and some were openly pro-Trump. But this is only marginally negative and may not have concrete ramifications. The key is that the Biden administration will be more conducive toward a global trade recovery, will relax restrictions on immigration, will favor US diversification away from China, and will put pressure on authoritarian regimes. Chart 16Strongman Popularity Boost Will Fade
Keep The Rally At Arm's Length – (GeoRisk Update)
Keep The Rally At Arm's Length – (GeoRisk Update)
Other things being equal, Biden is therefore positive for India, neutral for Brazil and Turkey, and negative for Russia. Our GeoRisk Indicators suggest that political risk has peaked for Brazil and Russia and equities could bounce back, but we think Russian political risk will surprise to the upside (Chart 17). Chart 17Political Risk Still High In Emerging Markets
Political Risk Still High In Emerging Markets
Political Risk Still High In Emerging Markets
In the case of Russia, the Biden administration will take a more confrontational approach than previous presidents, including Obama and Bush as well as Trump. However, it still needs to rejoin the Iran nuclear deal and extend the New START (Strategic Arms Reduction Treaty) with Russia through 2026, so the pro-democracy pressure campaign will have to be balanced with negotiations. Russia, for its part, is increasingly focused on the need for domestic stability, at least until Biden makes concrete steps with NATO that threaten Russian core interests. Bottom Line: Emerging market political risk is high, the vaccine will arrive more slowly, and the Biden administration will take a tougher approach toward authoritarian regimes. This creates an opportunity for India but a risk for Russia, and is neutral for Brazil and Turkey. Strategically we are constructive on EM equities but in the near 0-3 month time frame all bets are off. Investment Recommendations With clear near-term political and geopolitical risks, and extremely elevated equity prices and sentiment, we think it is a good time to book some profits. We are closing our long global equities relative to bonds trade for a gain of 27%. Chart 18Reinitiate Long Global Aerospace/Defense Stocks
Reinitiate Long Global Aerospace/Defense Stocks
Reinitiate Long Global Aerospace/Defense Stocks
We are closing our long investment grade corporate bonds relative to similarly dated Treasuries for a gain of 15%. We are closing our long China Play Index trade for a gain of 7% in recognition that China’s stimulus is nearing its peak while the Trump administration will take punitive measures in his final two months. We will also retain our long gold trade. Gridlock in the US government is not reflationary but gold is still attractive due to geopolitical risk. Strategically we recommend going long GBP-EUR. We also recommend reinitiating a strategic long position in defense stocks. Specifically, global aerospace and defense stocks relative to the broad market (Chart 18). We have been long defense stocks since 2016 but COVID decimated the trade. The coming vaccines promise to reboot the aerospace part of this trade while there was never any reason to doubt the strong basis for global defense spending amid geopolitical great power struggle. Matt Gertken Vice President Geopolitical Strategy mattg@bcaresearch.com We Read (And Liked) … Black Wave “What happened to us?” Black Wave seeks to answer the cardinal question facing both Middle Easterners and those looking into the Middle East from the outside.5 It takes us back four decades to events that shaped the region and walks us through time and space, politics, religion, history and culture, to where we stand – in the crosshairs of the very clash that started it all. Few are better equipped than author Kim Ghattas in doing so. A native of Beirut, she grew up amid the Lebanese civil war, living the events that created the post-1979 Middle Eastern reality. Later, she spent two decades covering the Middle East as a journalist for the BBC and Financial Times. A term first coined by Egyptian filmmaker Youssef Chahine, “black wave” characterizes the religious tide that swept Egypt in the 1990s from the Persian Gulf – one that Chahine saw as alien to Egyptians. Instead he argued that while Egyptians had always been very religious, they also had joie de vivre – enjoying art, music, talent, all taboos according to the Wahhabi interpretation of Islam. Iranians in the late 1970s were not much different from Egyptians in the 1990s. At the time, they were unified in their opposition to the Pahlavi dynasty for being too Western and corrupt. As an exile in the sacred Iraqi city of Najaf and later in the French village of Neauphle-le-Chateau, Ayatollah Ruhollah Khomeini’s speeches were capable of inspiring minds, galvanizing support, and gathering crowds. He was the right character, at the right time, but with the wrong ideas. Ideologically, Khomeini was an outsider in Najaf. The Iraqi clergy considered him too politically involved and his vision of wilayat al-faqih – a state based on Islamic jurisprudence – did not have widespread appeal. It was dismissed as outlandish by those around him who aimed to take advantage of his widespread appeal for their own gains, while hoping to limit Khomeini’s ideological influence on his audience. This proved to be a grave disregard for Iranians. 1979 was also a transformative year for Saudi Arabia. The young monarchy faced a national awakening as Juhayman al-Otaybi staged a siege on the Muslim world’s most sacred site, the Grand Mosque in Mecca. It was the first act of terrorism in opposition to Western influence – the birth of Saudi extremism – and was echoed in subsequent acts of violence in the kingdom, in 1995 and later in 2003. Fearing the spread of political Islam, the House of Saud responded by emphasizing Wahhabism, Riyadh’s homegrown Islamic movement, by empowering clerics and religious authorities. The quid pro quo was that the clerics supported the monarchy from both internal and external threats. The clash between the Iranian Revolution and Saudi Wahhabism in 1979 gave rise to the first sectarian killings. The 1987 Sunni-Shia clash in Pakistan marked the beginning of the modern day Sunni-Shia divide, spreading through Pakistan and eventually the Middle East to Lebanon, Iraq, and Syria. Today, as youth across the Middle East struggle in despair of the aftermath of these events, Ghattas sees hope. Protests ringing from Beirut to Baghdad call for a post sectarian political system. The Saudi monarchy is relaxing its puritanical grip, and a new generation brings newfound hope of rectifying past miscalculations. We ultimately agree with Ghattas’s optimism that these changes are hopeful indications that the people of the Middle East are ready to shift gears and move past the conflicts that have dominated the past four decades. However, there are other forces at play and the Saudi-Iranian rivalry is still a dominant feature of the region’s geopolitical landscape. True, Ghattas’s account not only highlights how deeply engrained the conflict is, but also that the early signs of tidal shifts can be easily missed. But we cannot ignore the specter of near-term risk facing the Middle East that continue to challenge its economic and political ascent. Thus, from an investment standpoint, we favor a more cautious approach and remain on the lookout for a better entry point once the near-term manifestation of these long-standing hurdles are overcome. Roukaya Ibrahim Editor/Strategist Geopolitical Strategy RoukayaI@bcaresearch.com Footnotes 1 The Supreme Court could still rule that Pennsylvania should have stuck with its November 3 deadline for ballots, but such a ruling would not change the outcome of the election. As with Florida following the disputed election in 2000, the various states’ electoral systems will likely be stronger as a result of this year’s polarized contest and narrow margins. 2 Biden could use the Vacancies Act or recess appointments to ram through his cabinet picks, but it would be controversial and at present he looks to be taking advantage of the Republican veto to nominate center-left figures that are more ideologically lined with his lane of the Democratic Party. 3 US-based Moderna developed one vaccine while US-based Pfizer and Germany-based BioNTech developed another. The Anglo-Swedish company AstraZeneca jointly developed its vaccine with Oxford University. Vaccine trials were administered across these countries and others, including South Africa, India, Brazil, and the entire global health care and pharmaceutical supply chain contributed. 4 See Pew Research. 5 Kim Ghattas, Black Wave: Saudi Arabia, Iran, and the Forty-Year Rivalry That Unraveled Culture, Religion, and Collective Memory in the Middle East (New York: Henry Holt, 2020), 377 pages. Section II: GeoRisk Indicators China
China: GeoRisk Indicator
China: GeoRisk Indicator
Russia
Russia: GeoRisk Indicator
Russia: GeoRisk Indicator
UK
UK: GeoRisk Indicator
UK: GeoRisk Indicator
Germany
Germany: GeoRisk Indicator
Germany: GeoRisk Indicator
France
France: GeoRisk Indicator
France: GeoRisk Indicator
Italy
Italy: GeoRisk Indicator
Italy: GeoRisk Indicator
Canada
Canada: GeoRisk Indicator
Canada: GeoRisk Indicator
Spain
Spain: GeoRisk Indicator
Spain: GeoRisk Indicator
Taiwan
Taiwan: GeoRisk Indicator
Taiwan: GeoRisk Indicator
Korea
Korea: GeoRisk Indicator
Korea: GeoRisk Indicator
Turkey
Turkey: GeoRisk Indicator
Turkey: GeoRisk Indicator
Brazil
Brazil: GeoRisk Indicator
Brazil: GeoRisk Indicator
Section III: Geopolitical Calendar
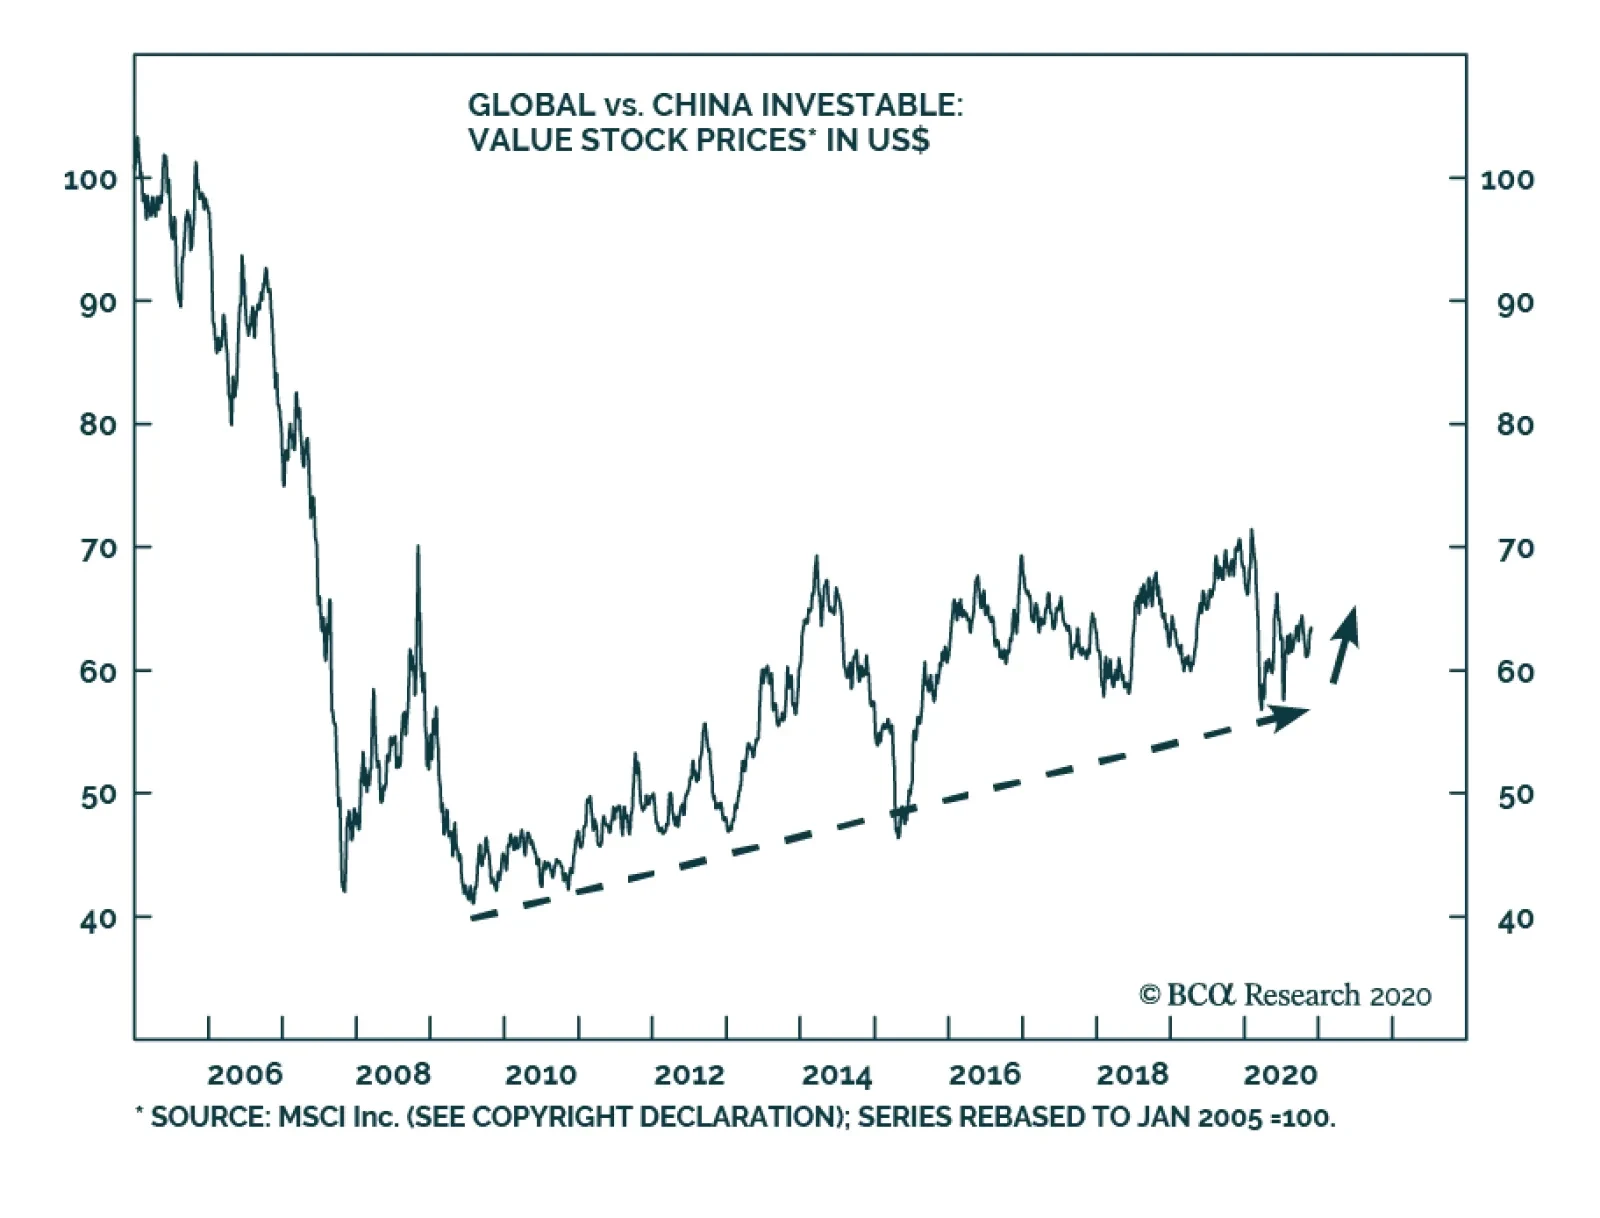
BCA Research's Emerging Markets Strategy service recommends going long global value / short Chinese value stocks. The upcoming anti-trust regulation for platform companies is a positive development for the entire Chinese economy in the long run. That said,…
In a previous Insight, we showed the 1-year rolling “alpha” for four MSCI global equity factor portfolios, and argued that an equity factor rotation is coming over the next 6-12 months. We calculated alpha using Jensen’s approach, which subtracts the…
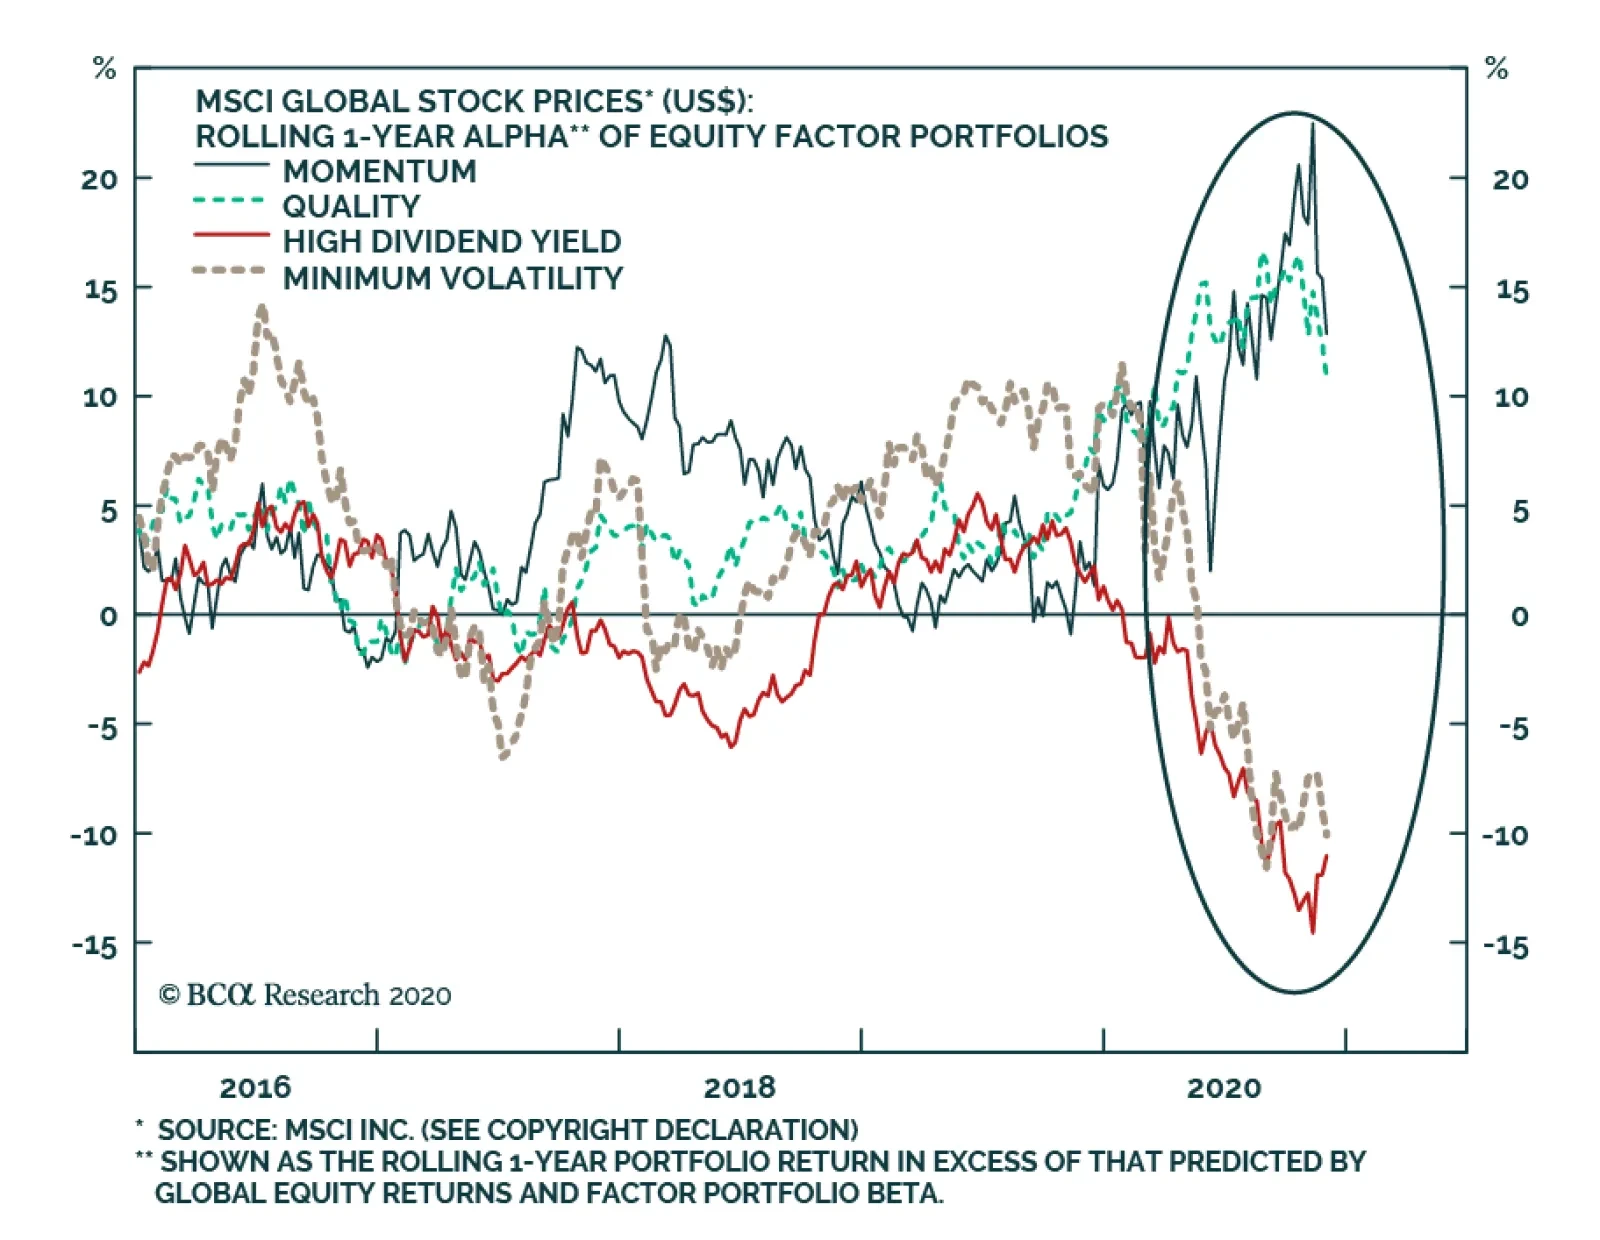
The COVID-19 pandemic has had a profound effect on the dimensions of the equity market. Investors witnessed the substantial underperformance of value vs. growth, cyclicals vs. defensives, and small vs. large caps earlier this year; the latter two trends have…
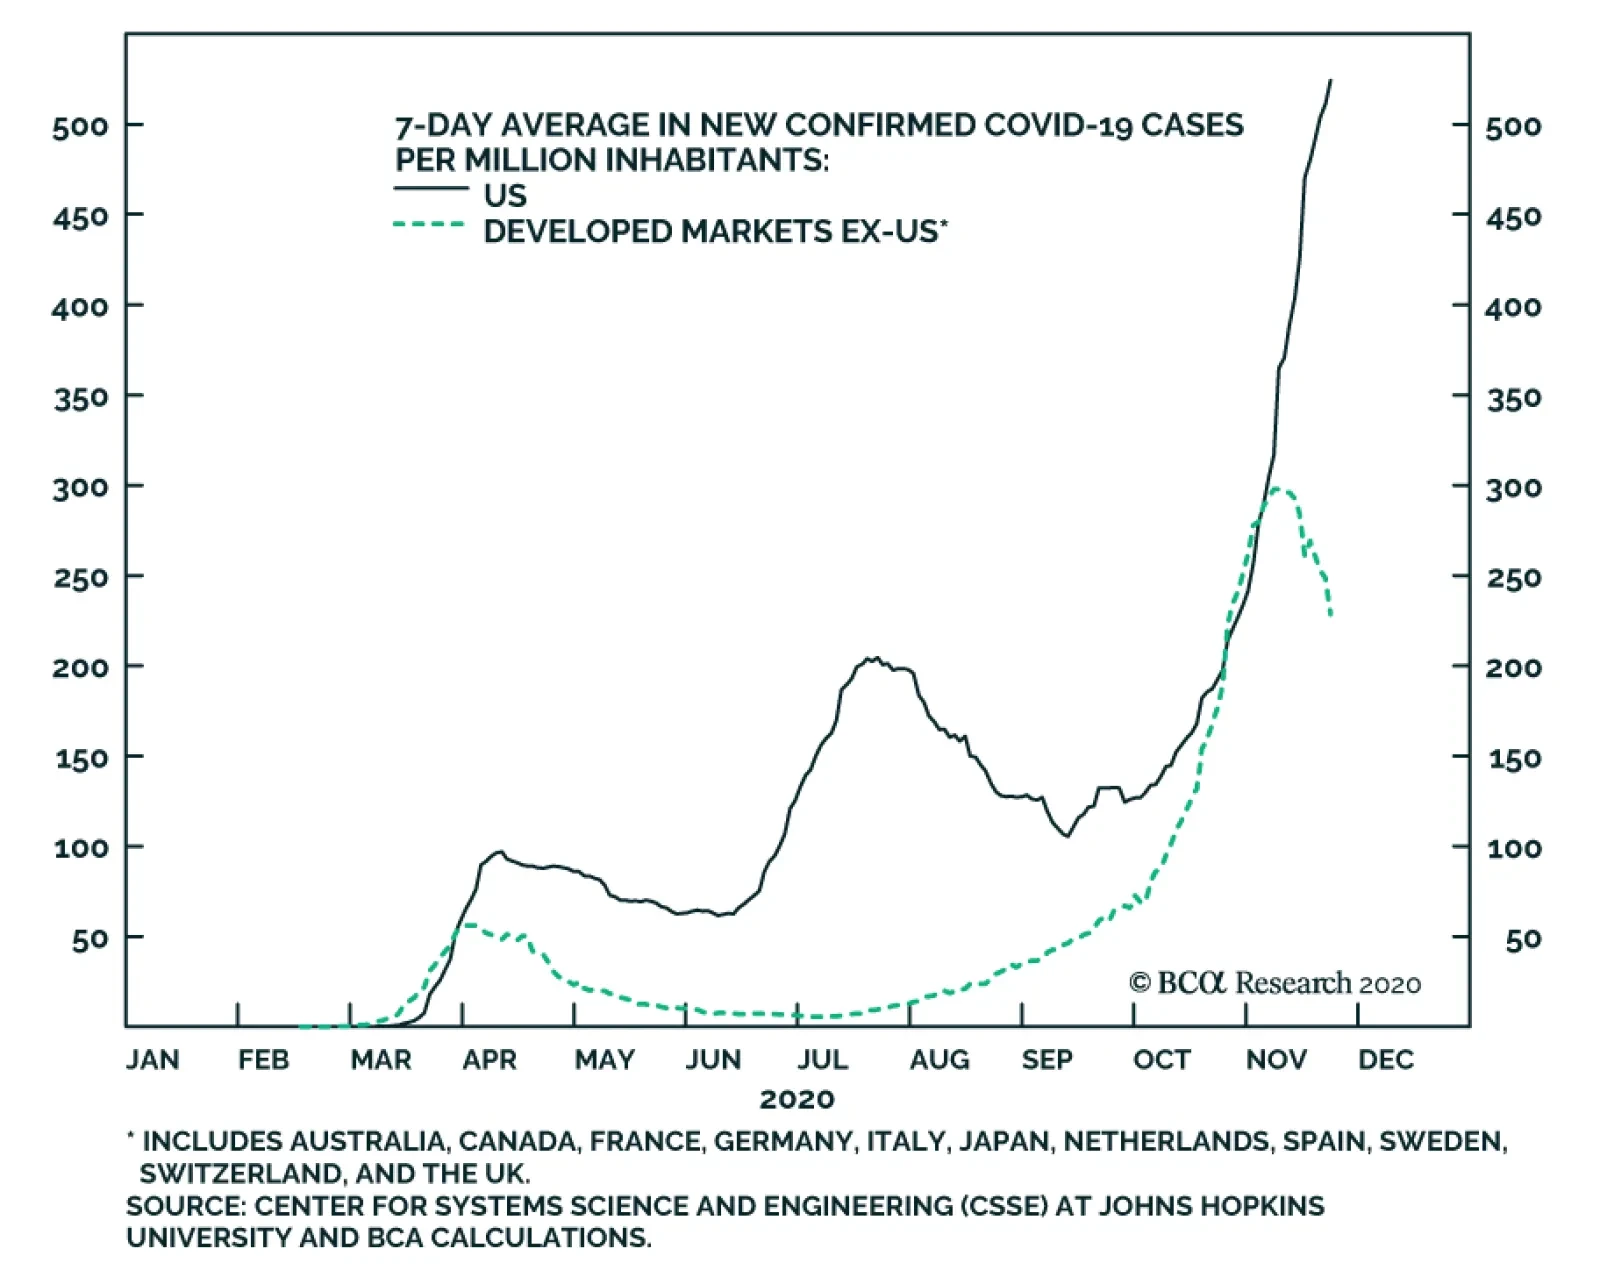
The chart above shows the 7-day average in new COVID-19 cases per capita for the US and developed markets ex-US. The chart illustrates both positive and negative news. On the positive side, lockdown measures outside of the US appear to be working, as the…
Fiscal policymakers around the world responded forcefully to the COVID-19 pandemic, which has enabled a (still fragile) global economic recovery to take hold. But investors are also wrestling with the fact that sizeable fiscal drag is projected to occur next…
We are publishing the November issue of Charts That Matter. The key message from the charts on the following pages is that investor sentiment on global growth is elevated and the reflation trade is a bit overstretched. As a result, risk assets and commodities prices will likely correct, and the US dollar will rebound. Investors should keep dry powder to buy EM assets at a better entry point. A trigger for a selloff could be one or a combination of the following: the lack of a large US fiscal stimulus package, falling activity in Europe, peak stimulus in China or the recent jitter in the Chinese onshore corporate bond market. CHART OF THE WEEKThe Global Stock-To-Bond Ratio Is At A Critical Juncture
The Global Stock-To-Bond Ratio Is At A Critical Juncture
The Global Stock-To-Bond Ratio Is At A Critical Juncture
US Equity Sentiment Is Elevated US equity sentiment is somewhat elevated and is consistent with a correction in share prices. Chart 1US Equity Sentiment Is Elevated
US Equity Sentiment Is Elevated
US Equity Sentiment Is Elevated
Chart 2US Equity Sentiment Is Elevated
US Equity Sentiment Is Elevated
US Equity Sentiment Is Elevated
Peak Growth Sentiment Investors are quite optimistic on global growth. A record large net long positions in copper corroborate a very bullish investor stance on China/EM growth. From a contrarian perspective, this heralds a correction in commodities prices and EM as well as a rebound in the US dollar. Chart 3Peak Growth Sentiment
Peak Growth Sentiment
Peak Growth Sentiment
Chart 4Peak Growth Sentiment
Peak Growth Sentiment
Peak Growth Sentiment
Defensive Versus Cyclical Equity Segments Defensive sectors/markets have been underperforming and are oversold. Their outperformance is likely in the near term. Chart 5Defensive Versus Cyclical Equity Segments
Defensive Versus Cyclical Equity Segments
Defensive Versus Cyclical Equity Segments
Chart 6Defensive Versus Cyclical Equity Segments
Defensive Versus Cyclical Equity Segments
Defensive Versus Cyclical Equity Segments
Near-Term Risks To Industrial Metal Prices The Baltic Dry index is falling and iron ore prices have relapsed. This is consistent with diminishing Chinese imports of iron ore. However, iron ore inventories in China are not excessive, so odds are it is a correction and not a bear market in iron ore prices. Chart 7Near-Term Risks To Industrial Metal Prices
Near-Term Risks To Industrial Metal Prices
Near-Term Risks To Industrial Metal Prices
Chart 8Near-Term Risks To Industrial Metal Prices
Near-Term Risks To Industrial Metal Prices
Near-Term Risks To Industrial Metal Prices
Chart 9Near-Term Risks To Industrial Metal Prices
Near-Term Risks To Industrial Metal Prices
Near-Term Risks To Industrial Metal Prices
Chinese Imports Of Commodities Are At Risk From Destocking Starting April-May, Chinese imports of copper and other commodities was running at very high rates, exceeding any reasonable estimates of final demand. This suggests China has been accumulating commodities. Even as final demand continues recovering, China might diminish imports of commodities weighing on their prices in the near term. Chart 10Chinese Imports Of Commodities Are At Risk From Destocking
Chinese Imports Of Commodities Are At Risk From Destocking
Chinese Imports Of Commodities Are At Risk From Destocking
Chart 11Chinese Imports Of Commodities Are At Risk From Destocking
Chinese Imports Of Commodities Are At Risk From Destocking
Chinese Imports Of Commodities Are At Risk From Destocking
Oil Prices, Energy Stocks And Glencore Share Price Oil prices and energy stocks are facing a technical resistance. Yet, the share price of the world’s largest global commodity trader – Glencore – seems to be breaking out. The coming weeks will reveal which way the commodities complex will trade. Our bias is that a near-term correction is overdue. The US dollar holds the key, please refer to the next page. Chart 12Oil Prices, Energy Stocks And Glencore Share Price
Oil Prices, Energy Stocks And Glencore Share Price
Oil Prices, Energy Stocks And Glencore Share Price
Chart 13Oil Prices, Energy Stocks And Glencore Share Price
Oil Prices, Energy Stocks And Glencore Share Price
Oil Prices, Energy Stocks And Glencore Share Price
Rising US Real Rates (TIPS Yields) Will Lead To A US Dollar Rebound US inflation expectations – which have risen sharply since March – are likely to retreat as the US Senate does not approve a large fiscal stimulus package. Falling US inflation expectations will translate into higher TIPS yields. The latter and very bearish sentiment/positioning on the US dollar will trigger a rebound in the greenback. Chart 14Rising US Real Rates (TIPS Yields) Will Lead To A US Dollar Rebound
Rising US Real Rates (TIPS Yields) Will Lead To A US Dollar Rebound
Rising US Real Rates (TIPS Yields) Will Lead To A US Dollar Rebound
Chart 15Rising US Real Rates (TIPS Yields) Will Lead To A US Dollar Rebound
Rising US Real Rates (TIPS Yields) Will Lead To A US Dollar Rebound
Rising US Real Rates (TIPS Yields) Will Lead To A US Dollar Rebound
Chart 16Rising US Real Rates (TIPS Yields) Will Lead To A US Dollar Rebound
Rising US Real Rates (TIPS Yields) Will Lead To A US Dollar Rebound
Rising US Real Rates (TIPS Yields) Will Lead To A US Dollar Rebound
US Elections And The US Dollar: Is 2020 The Opposite Of 2016? After the 2016 US elections, the US dollar rallied strongly for several weeks and then it sold off considerably. It seems the broad trade-weighted dollar is following a reverse pattern now. It was selling off before the 2020 US elections and has continued weakening afterwards. If the reverse of the 2016 pattern persists, it means the US dollar is about make a major bottom and stage a playable rebound. Chart 17US Elections And The US Dollar: Is 2020 The Opposite Of 2016?
US Elections And The US Dollar: Is 2020 The Opposite Of 2016?
US Elections And The US Dollar: Is 2020 The Opposite Of 2016?
Chart 18US Elections And The US Dollar: Is 2020 The Opposite Of 2016?
US Elections And The US Dollar: Is 2020 The Opposite Of 2016?
US Elections And The US Dollar: Is 2020 The Opposite Of 2016?
Chart 19US Elections And The US Dollar: Is 2020 The Opposite Of 2016?
US Elections And The US Dollar: Is 2020 The Opposite Of 2016?
US Elections And The US Dollar: Is 2020 The Opposite Of 2016?
More Reasons To Expect A US Dollar Rebound The periods when US share prices outperform their global peers in local currency terms often coincide with strength in the US dollar. Recently, this relationship has broken down. The greenback might soon recouple to the upside, re-establishing this relationship (Chart 21). Besides, the broad trade-weighted dollar is very oversold (Chart 22). Chart 20More Reasons To Expect A US Dollar Rebound
More Reasons To Expect A US Dollar Rebound
More Reasons To Expect A US Dollar Rebound
Chart 21More Reasons To Expect A US Dollar Rebound
More Reasons To Expect A US Dollar Rebound
More Reasons To Expect A US Dollar Rebound
Rising Real US Yields And Growth Stocks Rising US TIPS yields could create headwinds for growth stocks. FAANG and Tencent share prices have risen about 20-fold since January 2010 – as much as the Nasdaq 100 did in the 1990s before topping out. Chart 22Rising Real US Yields And Growth Stocks
Rising Real US Yields And Growth Stocks
Rising Real US Yields And Growth Stocks
Chart 23Rising Real US Yields And Growth Stocks
Rising Real US Yields And Growth Stocks
Rising Real US Yields And Growth Stocks
Drivers Of EM Corporate And Sovereign Credit Spreads EM corporate and sovereign credit spreads are driven by EM exchange rates and commodities prices. A potential US dollar rebound and a correction in commodities prices warrant near-term caution on EM credit markets. Chart 24Drivers Of EM Corporate And Sovereign Credit Spreads
Drivers Of EM Corporate And Sovereign Credit Spreads
Drivers Of EM Corporate And Sovereign Credit Spreads
Chart 25Drivers Of EM Corporate And Sovereign Credit Spreads
Drivers Of EM Corporate And Sovereign Credit Spreads
Drivers Of EM Corporate And Sovereign Credit Spreads
Messages From Indicators And Chart Patterns Various indicators and technical chart configurations send mixed signals. Our bias is to expect a correction in risk assets in the near term. Chart 26Messages From Indicators And Chart Patterns
Messages From Indicators And Chart Patterns
Messages From Indicators And Chart Patterns
Chart 27Messages From Indicators And Chart Patterns
Messages From Indicators And Chart Patterns
Messages From Indicators And Chart Patterns
Chart 28Messages From Indicators And Chart Patterns
Messages From Indicators And Chart Patterns
Messages From Indicators And Chart Patterns
Chart 29Messages From Indicators And Chart Patterns
Messages From Indicators And Chart Patterns
Messages From Indicators And Chart Patterns
Peak Stimulus In China Fiscal stimulus is running out. In addition, the PBoC has been tightening liquidity in the interbank market and interest rates have risen. Banks’ loan approvals have rolled over. All these point to a peak in the credit and fiscal impulse as well as money impulses in Q4 2020. Does it mean China’s economy is about to decelerate? – refer to the next page. Chart 30Peak Stimulus In China
Peak Stimulus In China
Peak Stimulus In China
Chart 31Peak Stimulus In China
Peak Stimulus In China
Peak Stimulus In China
Chart 32Peak Stimulus In China
Peak Stimulus In China
Peak Stimulus In China
China: Business Cycle Expansion To Continue In H1 2021 Our credit and fiscal spending impulse points to a continuous expansion in the Chinese economy for now. If the credit and fiscal impulse rolls over in Q4 2020, as shown in the previous page, the business cycle in China will peak around middle of 2021 given the nine-month time lag between this impulse and economic data. Chart 33China: Business Cycle Expansion To Continue in H1 2021
China: Business Cycle Expansion To Continue in H1 2021
China: Business Cycle Expansion To Continue in H1 2021
Chart 35China: Business Cycle Expansion To Continue in H1 2021
China: Business Cycle Expansion To Continue in H1 2021
China: Business Cycle Expansion To Continue in H1 2021
Chart 34China: Business Cycle Expansion To Continue in H1 2021
China: Business Cycle Expansion To Continue in H1 2021
China: Business Cycle Expansion To Continue in H1 2021
Stress In The Chinese Onshore Corporate Bond Market The recent defaults by several SOEs on their bond payments have led to a spike in corporate bond yields. However, there is no stable historical relationship between onshore corporate bond yields and the A-share market. Chart 36Stress In The Chinese Onshore Corporate Bond Market
Stress In The Chinese Onshore Corporate Bond Market
Stress In The Chinese Onshore Corporate Bond Market
Chart 37Stress In The Chinese Onshore Corporate Bond Market
Stress In The Chinese Onshore Corporate Bond Market
Stress In The Chinese Onshore Corporate Bond Market
Chart 38Stress In The Chinese Onshore Corporate Bond Market
Stress In The Chinese Onshore Corporate Bond Market
Stress In The Chinese Onshore Corporate Bond Market
China: Can Share Prices Rally Amid Rising Corporate Borrowing Costs? During periods of rising onshore corporate bond yields, the MSCI ex-TMT Investable equity index rallied if Chinese EPS expectations where improving. The latest rollover in EPS growth expectations amid rising corporate bond yields is a warning to share prices. Chart 39China: Can Share Prices Rally Amid Rising Corporate Borrowing Costs?
China: Can Share Prices Rally Amid Rising Corporate Borrowing Costs?
China: Can Share Prices Rally Amid Rising Corporate Borrowing Costs?
Chinese And EM Equity Relative Performance Versus Global Stocks China’s outperformance versus global stocks has been due to its TMT stocks (Alibaba, Tencent and Meituan). In turn, excluding Chinese stocks, EM ex-China has not really outperformed the global equity index. Chart 40Chinese And EM Equity Relative Performance Versus Global Stocks
Chinese And EM Equity Relative Performance Versus Global Stocks
Chinese And EM Equity Relative Performance Versus Global Stocks
Chart 41Chinese And EM Equity Relative Performance Versus Global Stocks
Chinese And EM Equity Relative Performance Versus Global Stocks
Chinese And EM Equity Relative Performance Versus Global Stocks
Various EM Equity Indexes Till very recent (before the announcement of progress in vaccines), EM small caps, the equal-weighted index, EM ex-TMT stocks and the EM index ex-China, Korea and Taiwan had been lackluster. Will the latest spike persist? It depends on the S&P500 and global risk asset performance. Chart 42Various EM Equity Indexes
Various EM Equity Indexes
Various EM Equity Indexes
Chart 43Various EM Equity Indexes
Various EM Equity Indexes
Various EM Equity Indexes
Chart 44Various EM Equity Indexes
Various EM Equity Indexes
Various EM Equity Indexes
Chart 45Various EM Equity Indexes
Various EM Equity Indexes
Various EM Equity Indexes
Emerging Asia And Overall EM Relative Equity Performance Versus Global Stocks Emerging Asia’s and overall EM relative performance versus global stocks is unlikely to break out now. We continue recommending a neutral allocation to EM equities in a global equity portfolio. Chart 46Emerging Asia And Overall EM Relative Equity Performance Versus Global Stocks
Emerging Asia And Overall EM Relative Equity Performance Versus Global Stocks
Emerging Asia And Overall EM Relative Equity Performance Versus Global Stocks
Chart 47Emerging Asia And Overall EM Relative Equity Performance Versus Global Stocks
Emerging Asia And Overall EM Relative Equity Performance Versus Global Stocks
Emerging Asia And Overall EM Relative Equity Performance Versus Global Stocks
Chart 48Emerging Asia And Overall EM Relative Equity Performance Versus Global Stocks
Emerging Asia And Overall EM Relative Equity Performance Versus Global Stocks
Emerging Asia And Overall EM Relative Equity Performance Versus Global Stocks
Chart 49Emerging Asia And Overall EM Relative Equity Performance Versus Global Stocks
Emerging Asia And Overall EM Relative Equity Performance Versus Global Stocks
Emerging Asia And Overall EM Relative Equity Performance Versus Global Stocks
Equities Recommendations Currencies, Credit And Fixed-Income Recommendations
Highlights The stock market’s 60 percent rally since mid-March is reaching a near-term valuation test. Sell stocks and wait on the side lines if the 10-year T-bond yield rises by 0.3 percent. Go aggressively overweight T-bonds on any modest rise in yields. New recommendation: Go overweight healthcare versus technology on a 6-12-month investment horizon. New recommendation: Go overweight Europe versus Emerging Markets on a 6-12-month investment horizon. Fractal trade: Fractal analysis supports the decision to go overweight healthcare versus technology. Feature Since early 2018, a rise in the long bond yield has sent shudders through the stock market on four occasions: February 2018, October 2018, April 2019, and January 2020. On all four occasions, the tipping point was the earnings yield premium on tech stocks versus the 10-year T-bond yield falling towards its lower limit of 2.5 percent (Chart of the Week). Chart of the WeekSell Stocks If The Bond Yield Rises By 0.3 Percent
Sell Stocks If The Bond Yield Rises By 0.3 Percent
Sell Stocks If The Bond Yield Rises By 0.3 Percent
Today, this all-important yield premium stands at 2.8 percent. Meaning that it would take the 10-year T-bond yield to rise by just 30 basis points to retest this four times tipping point. Alternatively, with the T-bond yield unchanged, the tipping point would be retested if tech stocks rallied by around 10 percent. The stock market’s 60 percent rally since mid-March is reaching a near-term valuation test. Crucially, this means that the stock market’s 60 percent rally since mid-March is reaching a near-term valuation test. We recommend selling stocks and waiting on the side lines if the earnings yield gap on tech stocks versus the T-bond yield approaches its lower limit of 2.5 percent – from any combination of moderately higher bond yields or higher stock prices over the coming weeks. Record Low Bond Yields Have Lifted The Stock Market To An All-Time High ‘A once-in-a-century global pandemic lifts the world stock market to an all-time high’ sounds like an obscene headline. Yet this is the correct narrative for 2020. Yes, the European stock market is still languishing 10 percent below its mid-February peak. But the much larger and tech-heavy US stock market stands 10 percent higher, taking the world market to around 5 percent higher (Chart I-2). How can the aggregate market stand at an all-time high when a terrible plague continues to ravage the global economy? The simple answer: because of record low bond yields. Chart I-2Record Low Bond Yields Have Lifted The Stock Market To An All-Time High
Record Low Bond Yields Have Lifted The Stock Market To An All-Time High
Record Low Bond Yields Have Lifted The Stock Market To An All-Time High
Back on February 27, we wrote: “for stock markets, the best inoculation against Covid-19 is ultra-low bond yields.” And so it proved. Though stock market profits are down by 15 percent this year, the multiple paid for those profits is up by 20 percent, resulting in a 5 percent uplift in the market price (Chart I-3). Chart I-3Valuations, Not Profits, Are Driving The Stock Market
Valuations, Not Profits, Are Driving The Stock Market
Valuations, Not Profits, Are Driving The Stock Market
Specifically, tech sector valuations have become hyper-sensitive to any change in the long bond yield (Chart I-4). Meaning that for those stock markets with a high weighting to tech stocks, the valuation boost from a decline in bond yields has more than countered the profit slump from the pandemic. In fact, the pivotal role of bond yields precedes the pandemic. For the past three years, a good motto for investors has been: don’t focus on profits, focus on valuations. Chart I-4Valuations, Not Profits, Are Driving The Tech Sector
Valuations, Not Profits, Are Driving The Tech Sector
Valuations, Not Profits, Are Driving The Tech Sector
The Biggest Threat To The Stock Market Is Higher Bond Yields Through 2018-19, stock market profits drifted sideways. Yet the stock market fell 30 percent, then rose 30 percent – because the multiple paid for the profits plunged in 2018 then surged in 2019. In 2020, as the pandemic devastated profits, a further surge in the multiple immunised the stock market against the ravages of Covid-19. The dramatic swing in multiples was driven by the dramatic swing in bond yields. This is hardly surprising given that the prospective return on equities is sensitive to the prospective return offered by competing long-duration bonds. But at ultra-low bond yields, this sensitivity becomes hyper-sensitivity. When bond yields approach their lower limit, bond prices approach their upper limit. This means that the scope for further price rises diminishes while the scope for price collapses increases. For proof, just look at Swiss 10-year bonds. Their prices can barely rise anymore! Yet they can fall precipitously (Chart I-5). In short, the lower that bond yields go, the riskier that bonds become as an investment. Chart I-5Swiss Bond Prices Can Barely Rise, But They Can Fall A Lot
Swiss Bond Prices Can Barely Rise, But They Can Fall A Lot
Swiss Bond Prices Can Barely Rise, But They Can Fall A Lot
As bonds become a riskier investment, the excess return on equities versus bonds, the equity risk premium (ERP), collapses towards zero. After all, if the riskiness of equities and bonds converges, then any risk premium must disappear. The result is that the prospective return (discount rate) required on equities declines exponentially, because both of its components – the bond yield plus the ERP – decline in tandem. Given that valuation is just the inverse of the discount rate, the valuation of equities rises exponentially when the bond yield declines to an ultra-low level. Conversely, the valuation of equities falls exponentially when the bond yield rises from an ultra-low level. The valuation of equities rises exponentially when the bond yield declines to an ultra-low level. Yet doesn’t a higher bond yield also imply a higher nominal growth rate for profits, which should be good for the stock market? Yes, but understand that the increase in the discount rate (nominal bond yield plus ERP) will be much larger than the increase in the profit growth rate. The result is a plunge in the stock market’s net present value. Once you grasp this exponential relationship, the penny suddenly drops. The pandemic has proved that the biggest structural threat to the stock market does not come from a negative growth shock like a once-in-a-century global plague. The pandemic has been good for the aggregate stock market because it has forced bond yields to decline to ultra-low levels. Instead, the biggest threat to the stock market is higher bond yields. Please note that this disagrees with the BCA house view – which does not preclude stocks from rising even if yields rise by 0.3 percent, if this takes place against the backdrop of better growth prospects. Sell Stocks If The Bond Yield Rises By 0.3 Percent As the first chart powerfully illustrates, higher bond yields sent shudders through the stock market on four occasions in the past three years. We are close to a similar near-term valuation test. Of course, given enough time, a gradual rise in earnings can lift the tech earnings yield gap versus the bond yield to well above its danger level of 2.5 percent. However, over shorter periods, it would require stock prices and/or bond yields to stop rising. Or indeed, to reverse. For equities, the upshot is that the 60 percent rally since mid-March is reaching near-term exhaustion. We recommend selling stocks and waiting on the side lines if the 10-year T-bond yield was to rise by another 30 bps. For bonds, the upshot is that all else being equal, 10-year bond yields can rise by no more than 30 basis points before sending shudders through the stock market. Which would then cause bond yields to give back their gains, as they did on each of the four previous occasions that higher bond yields spooked the stock market. On this basis, it is not worth underweighting bonds. The much smarter strategy is to go aggressively overweight T-bonds on any modest rise in yields. Within equity sectors, there are three arguments in favour of healthcare. First, while the tech sector earnings yield gap versus the T-bond yield is approaching its lower limit of 2.5 percent, the healthcare sector earnings yield gap stands at a very comfortable and attractive 4.1 percent, well above its recent lower limit of 2.0 percent (Chart I-6). Second, unlike tech, the healthcare sector rally is being driven by profits, not by a valuation uplift (Chart I-7). Third, fractal analysis confirms that the massive underperformance of healthcare versus technology is reaching technical exhaustion (see last section). Chart I-6Healthcare's Earnings Yield Premium Looks Very Attractive
Healthcare's Earnings Yield Premium Looks Very Attractive
Healthcare's Earnings Yield Premium Looks Very Attractive
Chart I-7Profits, Not Valuation, Are Driving The Healthcare Sector
Profits, Not Valuation, Are Driving The Healthcare Sector
Profits, Not Valuation, Are Driving The Healthcare Sector
Hence, today we are recommending that on a 6-12-month horizon, equity investors should go overweight healthcare versus technology. Go Overweight Europe Versus Emerging Markets Finally, sector strategy has huge implications for regional and country allocation. Given that the European stock market is overweight healthcare and emerging markets (EM) is overweight technology, the decision to overweight Europe versus EM is simply the decision to overweight healthcare versus technology. Nothing more, and nothing less (Chart I-8). Chart I-8Europe Versus EM = Healthcare Versus Tech
Europe Versus EM = Healthcare Versus Tech
Europe Versus EM = Healthcare Versus Tech
Hence, today we are also recommending that on a 6-12-month horizon, equity investors go overweight Europe versus emerging markets. Fractal Trading System* Supporting the fundamental arguments for healthcare versus tech in the main body of this report, the 130-day fractal structure of relative performance is extremely fragile. This implies that the massive underperformance of healthcare versus tech is at a potential inflection point. Accordingly, this week’s recommenced trade is to go long healthcare versus technology. Set the profit target and symmetrical stop-loss at 6 percent. In other trades, we are pleased to report that long financials versus basic resources achieved its 3.5 percent profit target, and short MSCI India versus MSCI Czech Republic achieved its 8 percent profit target. The rolling 1-year win ratio now stands at 54 percent. Chart I-9
World: Healthcare Vs. Technology
World: Healthcare Vs. Technology
When the fractal dimension approaches the lower limit after an investment has been in an established trend it is a potential trigger for a liquidity-triggered trend reversal. Therefore, open a countertrend position. The profit target is a one-third reversal of the preceding 13-week move. Apply a symmetrical stop-loss. Close the position at the profit target or stop-loss. Otherwise close the position after 13 weeks. * For more details please see the European Investment Strategy Special Report “Fractals, Liquidity & A Trading Model,” dated December 11, 2014, available at eis.bcaresearch.com. Dhaval Joshi Chief European Investment Strategist dhaval@bcaresearch.com Fractal Trading System Cyclical Recommendations Structural Recommendations Closed Fractal Trades Trades Closed Trades Asset Performance Currency & Bond Equity Sector Country Equity Indicators Bond Yields Chart II-1Indicators To Watch - Bond Yields
Indicators To Watch - Bond Yields
Indicators To Watch - Bond Yields
Chart II-2Indicators To Watch - Bond Yields
Indicators To Watch - Bond Yields
Indicators To Watch - Bond Yields
Chart II-3Indicators To Watch - Bond Yields
Indicators To Watch - Bond Yields
Indicators To Watch - Bond Yields
Chart II-4Indicators To Watch - Bond Yields
Indicators To Watch - Bond Yields
Indicators To Watch - Bond Yields
Interest Rate Chart II-5Indicators To Watch - Interest Rate Expectations
Indicators To Watch - Interest Rate Expectations
Indicators To Watch - Interest Rate Expectations
Chart II-6Indicators To Watch - Interest Rate Expectations
Indicators To Watch - Interest Rate Expectations
Indicators To Watch - Interest Rate Expectations
Chart II-7Indicators To Watch - Interest Rate Expectations
Indicators To Watch - Interest Rate Expectations
Indicators To Watch - Interest Rate Expectations
Chart II-8Indicators To Watch - Interest Rate Expectations
Indicators To Watch - Interest Rate Expectations
Indicators To Watch - Interest Rate Expectations
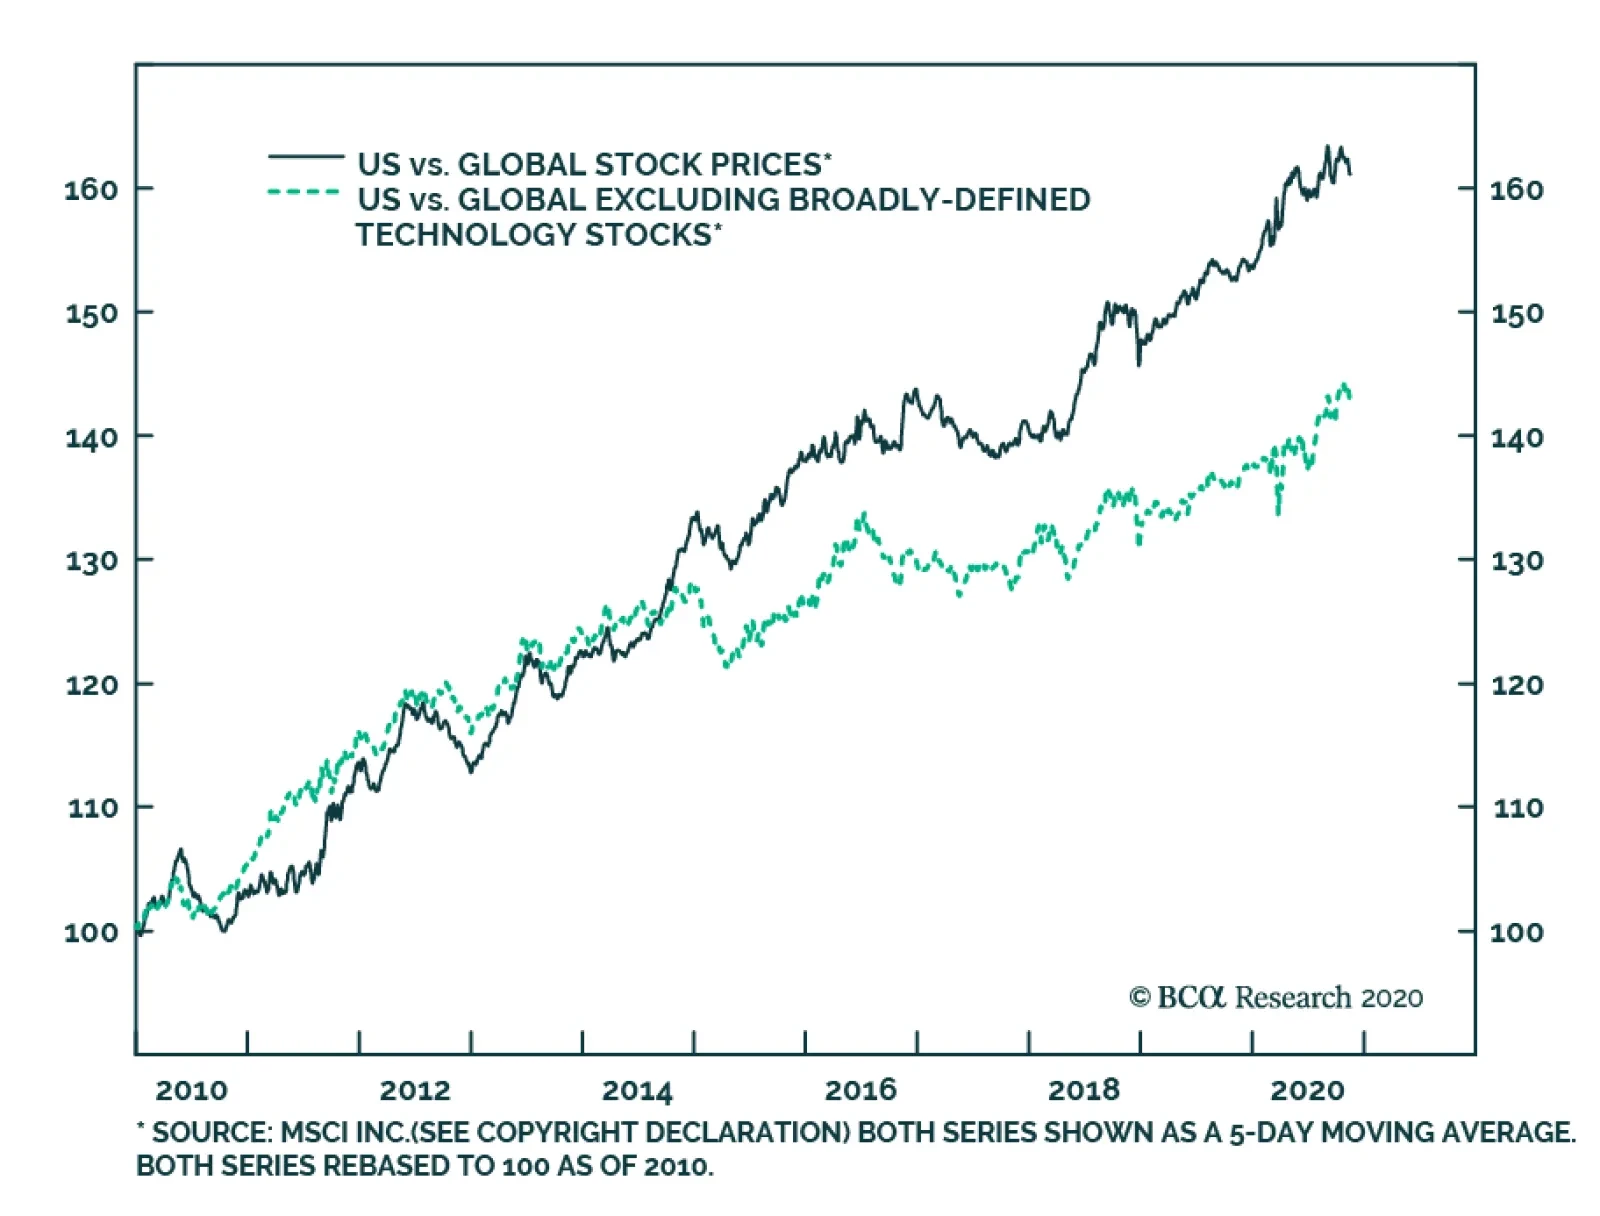
The chart above highlights the stellar outperformance of US equities over the past decade, as well as the effect of technology stocks in driving this performance. Both series in the chart are rebased to 100 as of the beginning of 2010, and the dotted line in…
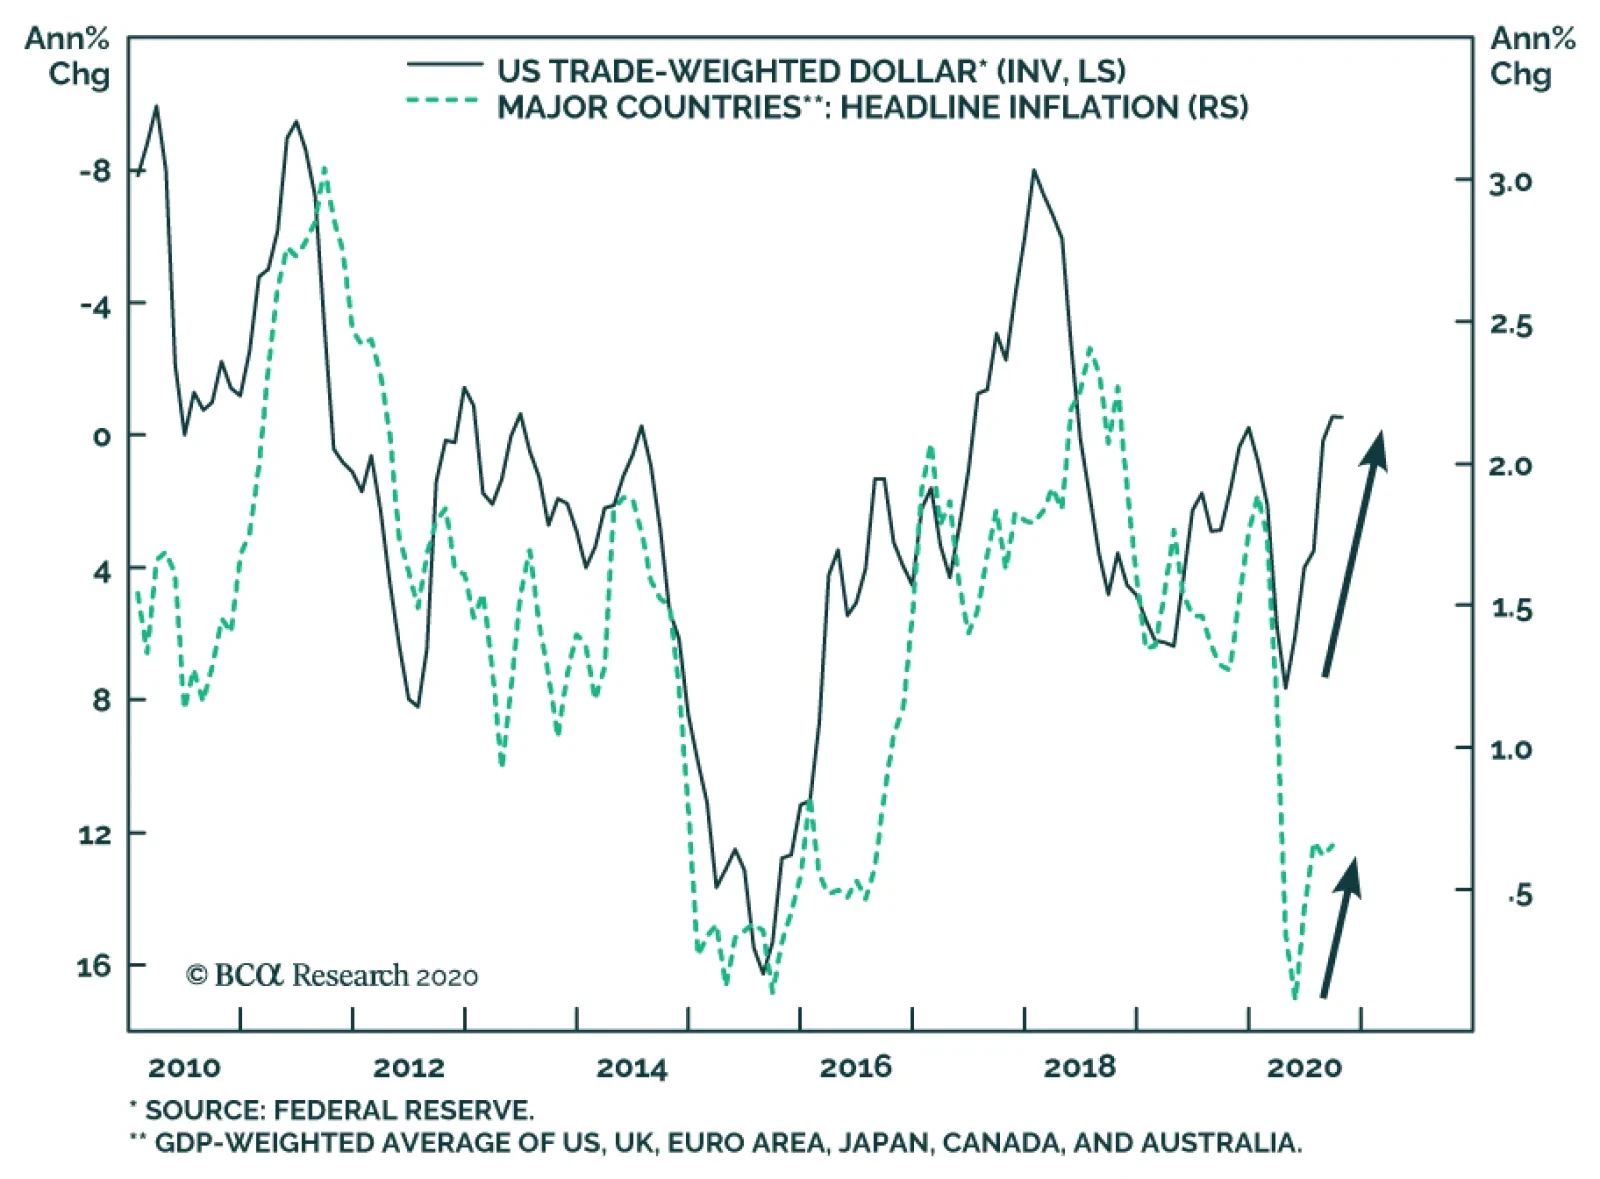
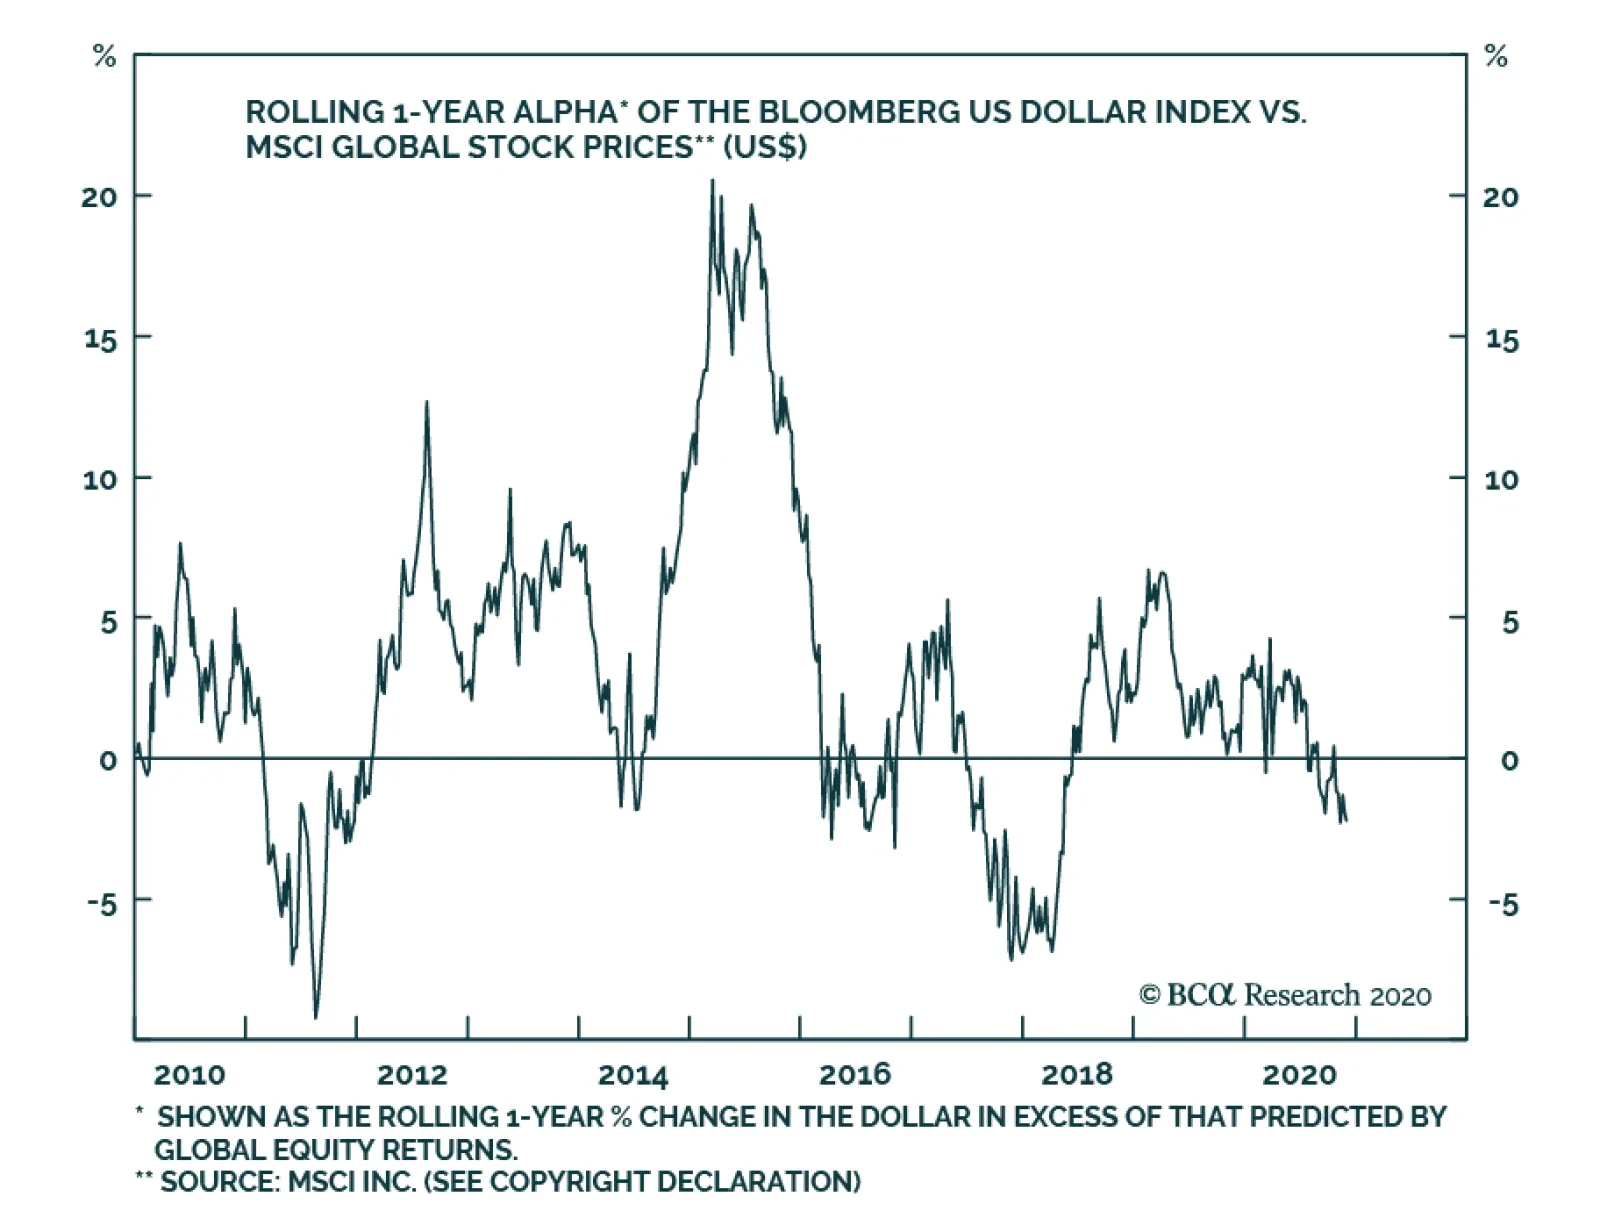
BCA Research's Global Fixed Income Strategy service recently highlighted that an increasing number of central banks have raised concerns about unwanted currency appreciation. On the surface, more US dollar weakness should be welcome by policymakers…