Equities

Executive Summary The recent pullback was all about a multiples contraction while strong earnings growth helped absorb the blow. With the multiple contraction phase complete, the S&P 500 performance is now all about earnings. Consensus still expects earnings to grow at 10% over the next 12 months, despite negative corporate guidance and a whole constellation of factors that present challenges to corporate profitability. We need to see downgrades or earnings will disappoint. Our brand-new model predicts that earnings growth will trend towards zero over the next three months. Earnings growth is a tug of war between rising input costs and corporate pricing power. There is a high likelihood of an earnings recession, even if an economic recession is unlikely over the next 12 months. Because growth is slowing not only in the US but also abroad. If an earnings recession does materialize, equities may have another leg down, perhaps another 5-8%. Earnings Growth Is A Tug Of War Between Rising Costs And Pricing Power
Is Earnings Recession In The Cards?
Is Earnings Recession In The Cards?
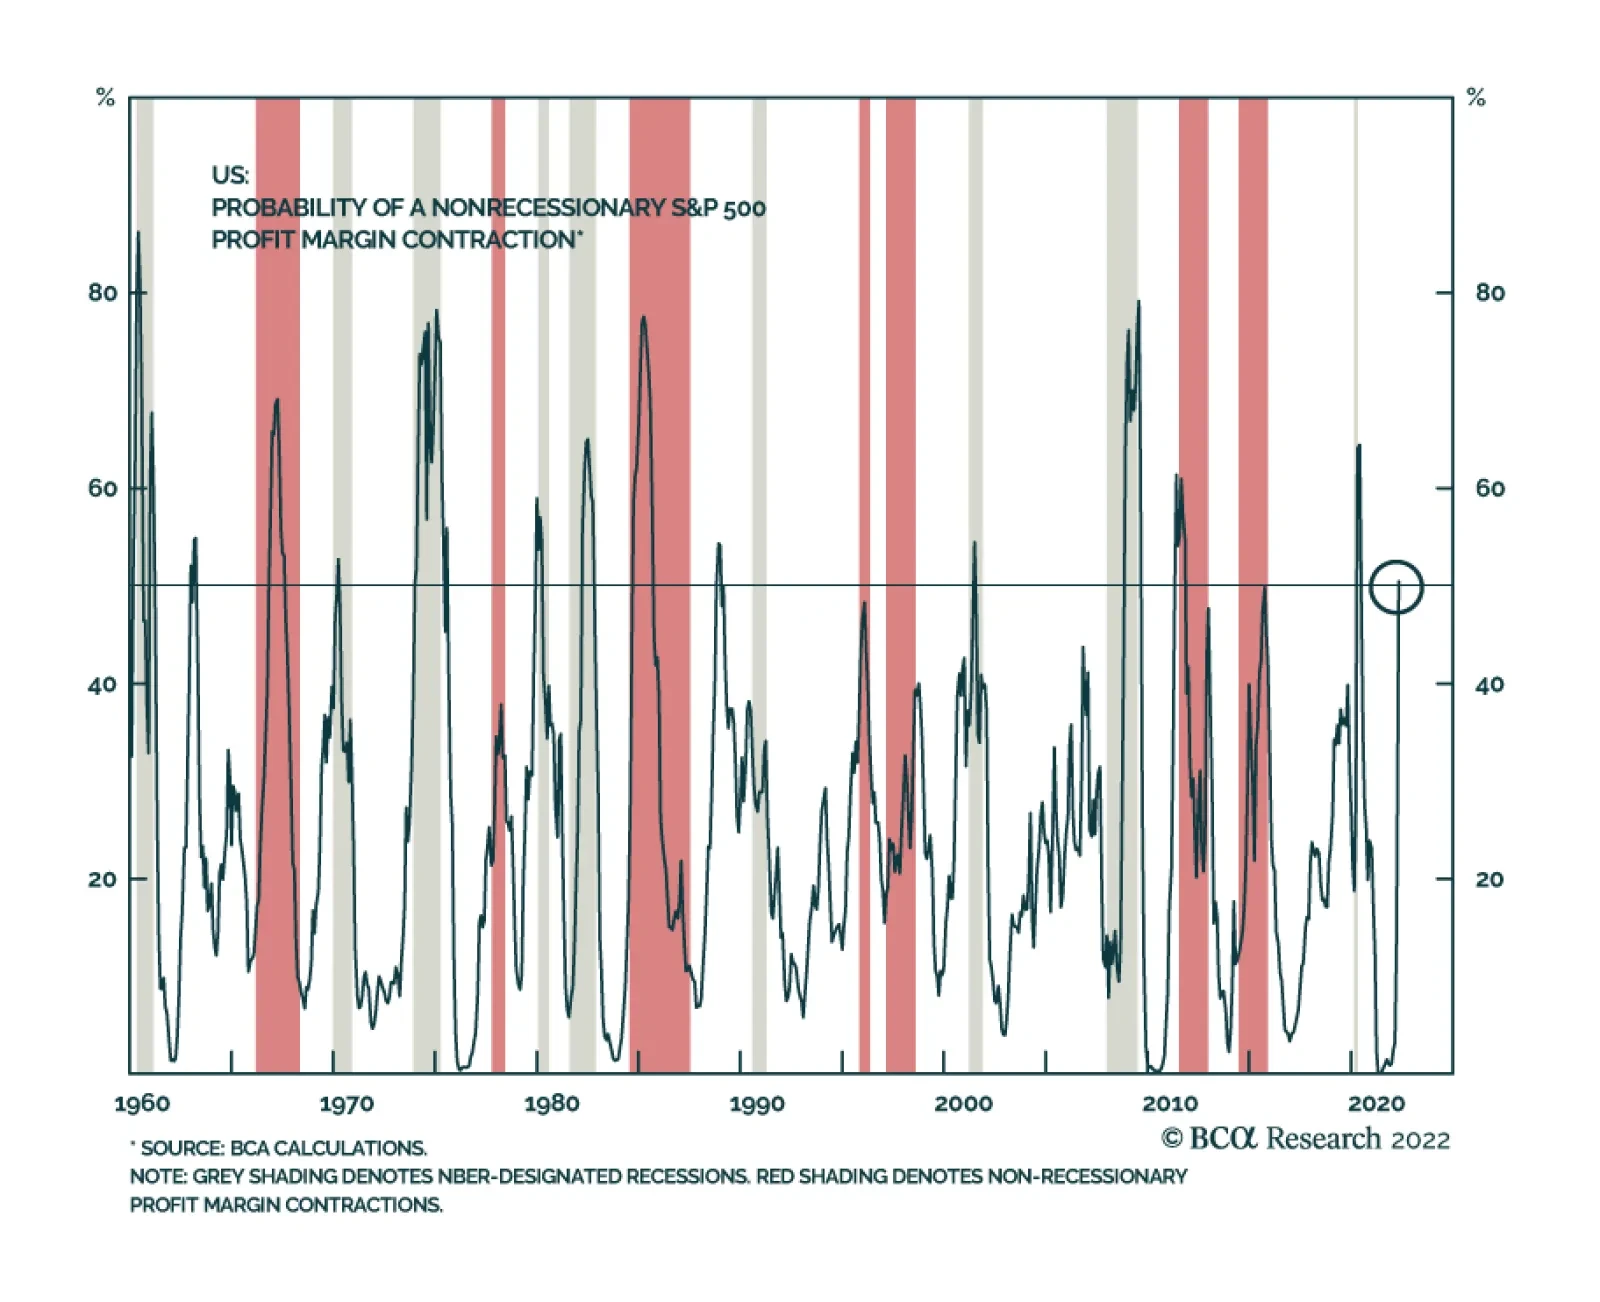
Bottom Line: We forecast that earnings growth will undershoot consensus expectations and an earnings recession is likely. Since the multiples contraction phase of the bear market is likely over, equities performance will be dictated by earnings growth. In the short run, we expect equities to be range-bound, with rallies and pullbacks alternating. In case of an earnings recession, equities may fall another 5-8%. Feature Related Report US Equity StrategyMarginally Worse Ever since the Fed started hiking interest rates back in March, investors started worrying about the recession. The BCA house view is that a recession is unlikely over the next 12 months. However, to us, of even greater concern is the likelihood of an earnings disappointment or even an outright earnings recession. We believe that earnings growth will slow dramatically. We wrote back in October 2021 report, “Marginally Worse”, that margins will contract at the beginning of the year – indeed, this prediction materialized during the Q1-2022 earnings season (Chart 1). Shrinking profit margins are likely to translate into flat to negative real earnings growth over the next 12 months. However, economic and earnings growth expectations remain elevated. As our readers may recall from the “Have We Hit Rock Bottom?” and “Fat and Flat” reports, we believe that for the markets to begin to heal, growth expectations need to come down and a negative outlook needs to get priced in. Chart 1Margins Are Contracting
Margins Are Contracting
Margins Are Contracting
In this week’s report, we take a close look at the S&P 500 earnings growth expectations and provide our own estimate based on a simple regression model. We will also discuss implications for the US equity market. Sneak Preview: We estimate that earnings growth will trend towards zero over the next three to six months, consistent with current trends in US economic growth, inflation, corporate pricing power, monetary conditions, and the strength of the USD. Sell-off Driven By Multiples Contraction, Not Earnings Growth This year’s sell-off has been triggered by fears of an aggressive Fed, tighter monetary policy, and rising rates. However, decomposition of the total return demonstrates that the pullback was all about multiples contraction, while strong earnings growth helped absorb the blow (Chart 2). A pertinent question is what happens to the market when earnings growth softens? One may wonder whether the bad news has already been priced in, as multiples tend to front-run growth. A case in point is strong market performance in 2020 on the back of multiples expansion in anticipation of a post-pandemic rebound in earnings growth (Chart 3). Chart 2Sell-off Was Driven By A Multiples Contraction
Is Earnings Recession In The Cards?
Is Earnings Recession In The Cards?
Chart 3Multiples Lead Earnings
Multiples Lead Earnings
Multiples Lead Earnings
With multiples down from 23x to 17x over the past two years, and the S&P 500 down by 19% from its January 2022 peak, arguably much of the upcoming earnings growth slowdown/contraction is priced in. Much but not all. The next chapter of the bear market will be driven by earnings growth. Earnings Growth Headwinds As we have pointed out on multiple occasions, it is confounding that, despite negative corporate guidance and a whole constellation of factors that present challenges to corporate profitability, earnings estimates for 2022 have been revised up (Chart 4) and stand at about 10% (Chart 5). However, at long last, upgrades are starting to moderate (Chart 6). We need to see downgrades. Chart 42022 Earnings Estimates Are Still Trending Up
2022 Earnings Estimates Are Still Trending Up
2022 Earnings Estimates Are Still Trending Up
Chart 5Earnings Are Expected To Grow At 10%
Earnings Are Expected To Grow At 10%
Earnings Are Expected To Grow At 10%
Chart 6Analysts Are No Longer Upgrading
Analysts Are No Longer Upgrading
Analysts Are No Longer Upgrading
Chart 7Slowing Global Growth Has An Adverse Effect On The US Earnings Growth
Slowing Global Growth Has An Adverse Effect On The US Earnings Growth
Slowing Global Growth Has An Adverse Effect On The US Earnings Growth
Since the beginning of 2022, there have been quite a few developments that will weigh on earnings growth: Slowing growth in the US and globally means sales growth is decelerating. This week, the World Bank downgraded global GDP growth from 4.1% to 2.9%. Global manufacturing PMI is also trending towards 50 (Chart 7). Consumer demand is weakening: Negative real wage growth saps consumers’ confidence and cuts into their purchasing power. Moreover, demand for goods is returning to the pre-pandemic trend, and retail sales, especially in real terms, are flagging (Chart 8). Demand for services remains strong, but the S&P 500 index is dominated by goods producers. Corporate pricing power is still strong but is showing signs of waning as many US consumers, distraught by the negative wage growth, are strapped for cash (Chart 9). Chart 8Retail Sales Are Contracting In Real Terms
Retail Sales Are Contracting In Real Terms
Retail Sales Are Contracting In Real Terms
Chart 9Corporate Pricing Power Is Waning
Corporate Pricing Power Is Waning
Corporate Pricing Power Is Waning
Prices of raw materials have soared and supply disruptions are exacerbated by lockdowns in China and the war in Ukraine. Companies’ COGS (Cost of Goods Sold) bills are skyrocketing. Nominal wage growth is 6% and is on the rise, affecting companies’ bottom lines. The dollar is strong: it has gained 15% since January 2021. This makes US goods more expensive and reduces companies’ earnings via the currency translation effect. These are the reasons why it is increasingly hard for companies to preserve margins and grow earnings – a commentary that we have heard repeatedly during earnings calls. According to Refinitiv, for Q2-2022, there have been 73 negative EPS preannouncements issued by S&P 500 corporations, compared to 42 positive EPS preannouncements (N/P=73/42=1.7). A year ago, in Q2-2021, the N/P ratio was 0.8, with more companies offering positive guidance. All of this points to weakening profitability. Refinitiv also estimates the earnings growth rate for the S&P 500 for Q2-2022 at 5.3%. If the energy sector is excluded, the growth rate declines to -1.9%. We believe growth will come to a halt or contract into the end of the year. We expect slower top-line growth and shrinking profit margins to translate into flat to negative real earnings growth over the next 12 months. Earnings Recessions Often Happen When The Economy Is Still Growing One may wonder if an earnings recession is even possible without an economic recession. In fact, that happened quite a lot in the past. Out of 27 earnings recessions since 1927, 11 did not coincide with economic recessions (Chart 10). Chart 10Earnings Recessions And Economic Recession Often Don't Coincide
Earnings Recessions And Economic Recession Often Don't Coincide
Earnings Recessions And Economic Recession Often Don't Coincide
The S&P 500 does not mirror the US economy, with the former dominated by larger companies, many of which are multinationals and more exposed to global demand and the USD than the broad economy. Also, services and consumer spending constitute roughly 70% of the US economy, while the index overrepresents manufacturing, technology, and goods-producing companies. With the S&P 500 being global in nature, quite a few earnings recessions were triggered by events abroad: The 2016 earnings recession was caused by the devaluation of the Chinese yuan; in 2012, one was triggered by a post-GFC double-dip recession in Europe; and the 1998 one was triggered by an Asian financial crisis. It is also often the case that a profit recession is a harbinger of economic recession. Both the 2000 dot-com crash and GFC economic recessions were preceded by earnings recessions, one starting in December 2000, and the other in August 2007. The 2019 earnings recession was brief and came hand in hand with widespread fears of the end of the business cycle. Hence, we believe that a confluence of factors both at home and abroad, as discussed above, makes an earning recession a high probability event. There is a high likelihood of an earnings recession, even if an economic recession is unlikely over the next 12 months, because of slowing growth not only in the US but also abroad. Modeling Earnings Growth Since we are distrustful of the consensus of 10% expected eps growth, we have built our own simple earnings growth forecast model to gauge what earnings growth rate we may expect over the next quarter. The model has five factors, each of which has fundamental relevance to earnings growth (Table 1): Table 1EPS Growth Forecast Model
Is Earnings Recession In The Cards?
Is Earnings Recession In The Cards?
ISM PMI is a gauge of US economic growth and a proxy for top-line growth. PPI stands for the change in input costs. Pricing Power is a BCA proprietary indicator and captures companies’ ability to pass costs onto their customers. HY Spreads indicate costs of borrowing and also the state of the economy (spreads tend to shoot up in a slowing economy). USD represents the ability of US multinationals to sell goods abroad. Roughly 35% of S&P 500 sales are outside the US. Each factor is calculated on a year-on-year percentage change basis, with a three-month lag to allow the effects of macroeconomic developments to get priced in. Adjusted R2 is 65%, which is a strong fit. All factors are statistically significant at the 1% level. The model forecasts that earnings growth will come down from 6% MoM as of April 2021 to 1.3% as of August 2022 (Chart 11). While this does not map directly to the “next 12 months” of eps growth, it does indicate that earnings growth is trending towards zero in nominal terms and will be outright negative in real terms. Further, while we are unable to predict earnings growth more than three months ahead, we do expect that it will reach zero and then shift into contraction territory into the balance of the year. Chart 11Model Predicts That Earnings Growth Will Be Flat
Is Earnings Recession In The Cards?
Is Earnings Recession In The Cards?
Looking closer at the key drivers of growth (Chart 12), we observe that there is a tug of war between pricing power and rising costs (PPI), with earnings growth falling as pricing power starts to give away ground. The other factors that have an adverse effect on earnings growth are slowing growth (ISM PMI), an appreciating dollar, and rising borrowing costs (HY spreads). Chart 12Earnings Growth Is A Tug Of War Between Rising Costs And Pricing Power
Is Earnings Recession In The Cards?
Is Earnings Recession In The Cards?
The model indicates that earnings growth is trending towards zero over the next three months. Price Target What does all of this mean for US equities? If the multiple contraction phase is complete, the S&P 500 performance is now all about earnings. If we expect earnings to grow only 0-3% in nominal terms, with the forward earnings multiple unchanged at roughly 18x, then the S&P 500 is likely to come down another couple of percentage points. If earnings contract 5%, the index may be down as much as 8%. If multiples contract another point to 17x and earnings contract by 5%, the market may be down as much as 15% (Table 2). Table 2The S&P 500 Target Scenario Analysis
Is Earnings Recession In The Cards?
Is Earnings Recession In The Cards?
For now, we are sticking with our “fat and flat” thesis expecting the S&P 500 performance to continue to trend down as rallies and pullbacks alternate. Earnings growth slowdown/shallow contraction is likely to result in another leg down of roughly 5-8%. Investment Implications Street forward earnings growth expectations are too high at 10% and need to be downgraded. There are multiple reasons why earnings growth will be underwhelming, ranging from slowing growth abroad to weaker demand for goods and rising wages at home. We anticipate that earnings growth will be flat to negative into the balance of the year. The multiple contraction phase of the bear market is over, and now equities performance will be dictated by earnings growth. If an earnings recession does materialize, equities may have another leg down, perhaps another 5-8%. Bottom Line We forecast that earnings growth will undershoot consensus expectations and that an earnings recession is likely. Since the multiple contraction phase of the bear market is likely over, equity performance will be dictated by earnings growth. In the short run, we expect equities to trend down, with rallies and pullbacks alternating. In the case of an earnings recession, equities may fall another 5-8%. Irene Tunkel Chief Strategist, US Equity Strategy irene.tunkel@bcaresearch.com Recommended Allocation Recommended Allocation: Addendum
Is Earnings Recession In The Cards?
Is Earnings Recession In The Cards?
Executive Summary ECB & Inflation: Whatever It Takes?
Pricey Industrials
Pricey Industrials
Inflation is the European Central Bank’s single focus. This single-mindedness heightens the risks to Euro Area growth, especially because wider peripheral spreads do not seem to worry the ECB yet. Italian spreads will widen further, which will contribute to weaker financials, especially in the periphery. The money market curve already prices in the path of the ECB; the upside in Bund yields is therefore capped. Cyclical assets, including stocks, are vulnerable to the confluence of weaker growth and tighter monetary policy. Industrials are fragile. Downgrade to neutral for now. German industrials will outperform Italian industrials. Bottom Line: The ECB will do whatever it takes to slow inflation, which will further hurt an already brittle European economy. This backdrop threatens European stocks and peripheral bonds. Downgrade industrials to neutral and go long German / short Italian industrials. Feature Last week, the European Central Bank’s Governing Council sided with the hawks. The doves have capitulated. This development creates mounting risks this summer for European assets, especially when global growth is slowing. Worryingly, the ECB has given speculators the green light to widen peripheral and credit spreads in the near term. Cyclical assets remain at risk. We are downgrading industrials and financials. Hawkish Chart 1Higher Inflation Forecast = Hawkish ECB
Don’t Fight The ECB
Don’t Fight The ECB
The ECB’s forward guidance proved more hawkish than anticipated by the market, as highlighted by the 16bps increase in the implied rate of the December 22 Euribor contract following the press conference. The ECB also refused to sooth investors’ nerves regarding fragmentation risk in the periphery. A large part of the ECB move was already anticipated. The ECB will lift its three interest rate benchmarks by 25bps at its July meeting. It also increased its headline inflation forecasts to 6.8% from 5.1% in 2022, to 3.5% from 2.1% in 2023, and most importantly, it raised its long-term HICP forecast to 2.1% from 1.9% (Chart 1). The ECB now expects medium-term inflation to be above its 2% target. The true hawkish shock came in response to the higher-than-target medium-term inflation forecast. By September, if the 2024 inflation forecast does not fall back below 2%, then a 50bps hike that month will be inevitable. The whole interest rate curve moved up in response to that guidance. The most concerning part of the statement was the lack of clarity about the fragmentation fighting tool. The ECB specified that it will re-invest the principal of its holdings under the APP and PEPP until 2024, at least. However, the program to prevent stress in peripheral bond markets was not revealed and was presented as an eventuality to be deployed only if market conditions deteriorate further. Investors may therefore assume that the ECB is still comfortable with Italian bond yields above 3.5% and high-yield spreads of 464bps (Chart 2). Ultimately, the ECB’s single-minded focus is inflation, even though it is mostly an imported shock. The ECB cares little for the effect of its actions on growth. It will therefore remain very hawkish until it sees enough evidence that the medium-term inflation outlook will fall back below 2%. Before the ECB can tabulate a decline in the inflation outlook, the following developments must take place: The economy must slow in order to extinguish domestic inflationary pressures. The labor market, to which President Christine Lagarde referred often in the press conference, must cool. Specifically, the very elevated number of vacancies must decline relative to the low number of unemployed persons (Chart 3). A weaker economy will cause this shift. Energy inflation must recede to choke secondary effects on prices. Chart 2Tight But Not Tight Enough For The Hawks
Tight But Not Tight Enough For The Hawks
Tight But Not Tight Enough For The Hawks
Chart 3The Labor Market Must Cool
The Labor Market Must Cool
The Labor Market Must Cool
The good news is that the decline in commodity inflation is already underway. Last week, we argued that if energy prices remain at their current levels, (or if Brent experiences the additional upside anticipated by BCA’s Commodity and Energy strategists), then energy inflation will decelerate significantly. Already, the inflationary impact of commodities is dissipating (Chart 4). European growth has not slowed enough to hurt the labor market, but it will decline further. Real disposable income is falling, and the manufacturing sector is decelerating globally. Moreover, European terms of trade are tumbling, which hurts the Euro Area’s growth outlook, especially compared to the US where the terms of trade are improving (Chart 5). Chart 4Dwindling Commodity Impulse
Dwindling Commodity Impulse
Dwindling Commodity Impulse
Chart 5Europe's Terms-of-Trade Problem
Europe's Terms-of-Trade Problem
Europe's Terms-of-Trade Problem
The European periphery, especially Italy, faces particularly acute problems. We argued two months ago that Italian yields of 4.5% would not cause a sovereign debt crisis if economic activity were strong. As we go to press, Italian yields stand at 3.7%, or higher than those in Canada and Australia. Yet, Italy suffers from poor demographic and productivity trends; its neutral rate of interest is lower than that of both Canada and Australia. Moreover, Canada and Australia today enjoy robust terms-of-trades. Meanwhile, Italy is among the European economies most hurt by surging energy prices. Consequently, a vicious circle of higher yields and lower growth is likely to develop. Chart 6The BTP-EUR/USD Valse
The BTP-EUR/USD Valse
The BTP-EUR/USD Valse
Italy’s economic problems imply that investors will continue to push Italian spreads higher until the ECB provides a clear signal of support for BTPs, which could happen after spreads reach 300bps over German 10-year yields. Italy’s weakness is a major handicap for the monetary union as well. The higher Italian spreads widen, the weaker the euro will be (Chart 6). However, a depreciating euro is inflationary, which invites higher rates for the Euro Area and tighter financial conditions. The great paradox is that, if the ECB were more pro-active about the fragmentation risk, it could fight inflation with less danger to the economy and thus, the Eurozone could achieve higher rates down the road. Weaknesses in global and European growth, risks of higher Italian and peripheral spreads, and an ECB solely focused on inflation will harm European risk assets further. Specifically, credit spreads will widen more and cyclical stocks will remain vulnerable. Within cyclical stocks, Italian and Spanish financials are the most exposed to the fragmentation threat in Euro Area bond markets. We have held an overweight recommendation on industrial equities. We maintain a positive long-term bias toward this sector, but a neutral stance is warranted in the near term. Finally, Bund yields have limited upside from here. The curve already anticipates 146bps of tightening by the end of this year and 241bps by June 2023. The ECB is unlikely to increase rates more than is anticipated, which caps German yields. Instead, the ECB is likely to undershoot the €STR curve pricing if it increases interest rates once a quarter after the September 50bps hike. Bottom Line: Don’t fight the ECB. The Governing Council is single-mindedly focused on fighting inflation. Growth must slow significantly to cool the labor market and allow the ECB to cut back its medium-term inflation forecast to 2%. Therefore, European assets will remain under stress in the coming months as global growth deteriorates. Italian and peripheral spreads are particularly vulnerable, which will also weigh on financials because of Spanish and Italian banks. Chart 7Pricey Industrials
Pricey Industrials
Pricey Industrials
Neutral On Industrials Industrials stocks have outperformed other cyclicals and have moved in line with the Euro Area broad market. However, relative forward EPS have not tracked prices; industrials are now expensive and vulnerable to shocks (Chart 7). The increase in the relative valuations of industrials reflects their robust pricing power. Normally, the economic weakness pinpointed by the Global Growth Expectations component from the ZEW Survey results in falling valuations for industrials, since it is a growth-sensitive sector (Chart 8). However, this year, the earnings multiples of industrials relative to the broad market have followed inflation higher (Chart 8, bottom panel). This paradox reflects the strong pricing power of the industrial sector, which allows these firms to pass on a greater share of their increasing input-costs and protect their profits (Chart 9). Chart 8Ignore Growth, Loving Inflation
Ignore Growth, Loving Inflation
Ignore Growth, Loving Inflation
Chart 9Pricing Power Is The Savior
Pricing Power Is The Savior
Pricing Power Is The Savior
The ability of industrials to weather a growth slowdown is diminishing: European inflation will peak in response to the decline in commodity inflation (see Chart 4, on page 4). Already, the waning inflation of metal prices is consistent with lower relative multiples for industrials (Chart 10) Last week, we argued that global PMIs have greater downside because of the tightening in global financial conditions. Weaker global manufacturing activity hurts the relative performance of industrials. Capex in advanced economies is likely to drop in the coming quarters. US capex intentions are rapidly slowing, which has hurt European industrials. European capex intentions have so far withstood this headwind; however, the outlook is worsening. European final domestic demand is weakening, and European inventories are growing rapidly (Chart 11). Capex is a form of derived demand; the challenges to European growth translate into downside for investment. Chart 10The Commodity Paradox
The Commodity Paradox
The Commodity Paradox
Chart 11The Inventory Buildup Threat
The Inventory Buildup Threat
The Inventory Buildup Threat
The Euro Area Composite Leading Economic Indicator is already contracting and will fall further. The ECB’s focus on inflation and its neglect of financial conditions will drag the LEI lower. Moreover, central banks across the world are also tightening policy, which will filter through to weaken global and Europe LEIs. A declining LEI hurts industrials (Chart 12). The relative performance of European industrials is positively correlated to that of US industrials (Chart 13). BCA’s Global Asset Allocation has recently downgraded industrials to neutral from overweight. Chart 12Weaker LEIs Spell Trouble
Weaker LEIs Spell Trouble
Weaker LEIs Spell Trouble
Chart 13Where the US Goes, So Does Europe
Where the US Goes, So Does Europe
Where the US Goes, So Does Europe
Despite these risks, we are reluctant to go underweight industrials because financials are more exposed to the ECB’s neglect of financial conditions. Moreover, the headwinds against the industrial complex are temporary, especially when it comes to China. Chinese authorities have greatly stimulated their economy, and Beijing is softening its stance on the tech sector. A loosening of the regulatory crackdown would revive animal spirits and credit demand. Moreover, the aerospace and defense industry, which is a large component of the industrial sector, still offers attractive prospects. Instead, we express our concerns for industrials via the following pair trade: Long German industrials / short Italian Industrials. This is a relative value trade. German industrials have underperformed their relative earnings, while Italian ones have moved significantly ahead of their earning power. Thus, German industrials are very cheap and oversold relative to their southern neighbors (Chart 14). Interestingly, this derating took place despite the widening in Italian government bond spreads, which normally explains this price ratio well (Chart 15). This disconnect presents a trading opportunity. Chart 14A Relative Value Trade
A Relative Value Trade
A Relative Value Trade
Chart 15An Unusual Disconnect
An Unusual Disconnect
An Unusual Disconnect
Chart 16German Industrials And Growth Expectations
German Industrials And Growth Expectations
German Industrials And Growth Expectations
While global growth has yet to bottom, the performance of German relative to Italian industrials fluctuates along growth expectations (Chart 16). Germany seats earlier in the global supply chain than Italy. The Global Growth Expectations component from the ZEW Survey is extremely depressed and approaching levels where a rebound would be imminent. German industrials suffer more from the energy crunch than Italian ones. They will therefore benefit more from the decline in energy inflation. Historically, German industrials outperform Italian ones when commodity prices rise, but this relationship normally reflects the strong global demand that often lifts natural resource prices (Chart 17). Today, commodities are skyrocketing because of supply constraints, not strong demand. Therefore, they are hurting rather than mimicking growth. This inversion in the relationship between the performance of German compared to Italian industrials and natural resources prices is particularly evident when looking at European energy prices (Chart 18). Consequently, once the constraint from commodities and global supply chains ebb, German industrials will outshine their Italian counterparts. Chart 17Commodities: From Friends To Foes
Commodities: From Friends To Foes
Commodities: From Friends To Foes
Chart 18Energy: From Friend To Foe
Energy: From Friend To Foe
Energy: From Friend To Foe
German industrials suffer when stagflation fears expand (Chart 19). The ECB’s focus on inflation will assuage the apprehension of entrenched inflation in Europe. The recent improvement in our European Stagflation Sentiment Proxy will continue to the advantage of German industrials. Additionally, a firm ECB stance will push European inflation expectations lower, which will help German industrials compared to their Italian competitors (Chart 20). Chart 19Stagflation Hurts Germany More
Stagflation Hurts Germany More
Stagflation Hurts Germany More
Chart 20The ECB"s Inflation Focus Helps German Industrials
The ECB"s Inflation Focus Helps German Industrials
The ECB"s Inflation Focus Helps German Industrials
German PMIs are improving relative to Italian ones. The trend in Germany’s industrial activity compared to that of Italy dictates the evolution of industrials relative performance between the two countries (Chart 21). The tightening in financial conditions in Italy due to both wider BTP spreads and their negative impact on the Italian banking sector will accentuate the outperformance of Germany’s manufacturing sector. German industrials are more sensitive than Italian ones to the gyrations of the Chinese economy. BCA’s Geopolitical Strategy service anticipates an improvement in China’s economy for the next 18 months or so in response to previous stimuli and the easing regulatory burden. The close link between the performance of German industrials relative to Italian ones and the yuan’s exchange rate indicates that a stabilizing Chinese economy will undo most of the valuation premium of Italian industrials (Chart 22). An improvement in China’s economy will also lift its marginal propensity to consume (which the spread between the growth rate of M1 and M2 approximates). A rebound in Chinese marginal propensity to consume will boost comparative rates of returns in favor of Germany (Chart 22, bottom panel). Chart 21Relative Growth Matters
Relative Growth Matters
Relative Growth Matters
Chart 22The China Factor
The China Factor
The China Factor
Bottom Line: Industrials have become expensive relative to the rest of the market, but they are still too exposed to the global economy’s downside risk. This tug-of-war warrants a downgrade to neutral for now. Going long German industrials / short Italian industrials is an attractive pair trade within the sector. German industrials are cheap and they will benefit from both the ECB’s policy tightening and the upcoming decline in European inflation. Mathieu Savary, Chief European Strategist Mathieu@bcaresearch.com Tactical Recommendations Cyclical Recommendations Structural Recommendations Closed Trades
Executive Summary Autocracy Hurts Productivity
Autocracy Hurts Productivity
Autocracy Hurts Productivity
Over the next six-to-18 months, the Xi Jinping administration will “let 100 flowers bloom” – i.e., relax a range of government policies to secure China’s economic recovery from the pandemic. The first signs of this policy are already apparent via monetary and fiscal easing and looser regulation of Big Tech. However, investors should treat any risk-on rally in Chinese stocks with skepticism over the long run. Political risk and policy uncertainty will remain high until after Xi consolidates power this fall. Xi is highly likely to remain in office but uncertainty over other personnel – and future national policy – will be substantial. Next year China’s policy trajectory will become clearer. But global investors should avoid mistaking temporary improvements for a change of Xi’s strategy or China’s grand strategy. Beijing is driven by instability and insecurity to challenge the US-led world order. The result will be continued economic divorce and potentially military conflicts in the coming decade. Russia’s reversion to autocracy led to falling productivity and poor equity returns. China is also reverting to autocratic government as a solution to its domestic challenges. Western investors should limit long-term exposure to China and prefer markets that benefit from China’s recovery, such as in Southeast Asia and Latin America.
Image
Bottom Line: The geopolitical risk premium in Chinese equities will stay high in 2022, fall in 2023, but then rise again as global investors learn that China in the Xi Jinping era is fundamentally unstable and insecure. Feature Chart 1Market Cheers China's Hints At Policy Easing
Market Cheers China's Hints At Policy Easing
Market Cheers China's Hints At Policy Easing
In 1957, after nearly a decade at the helm of the People’s Republic of China, Chairman Mao Zedong initiated the “Hundred Flowers Campaign.” The campaign allowed a degree of political freedom to try to encourage new ideas and debate among China’s intellectuals. The country’s innovative forces had suffered from decades of foreign invasion, civil war, and repression. Within three years, Mao reversed course, reimposed ideological discipline, and punished those who had criticized the party. It turned out that the new communist regime could not maintain political control while allowing liberalization in the social and economic spheres.1 This episode is useful to bear in mind in 2022 as General Secretary Xi Jinping restores autocratic government in China. In the coming year, Xi will ease a range of policies to promote economic growth and innovation. Already his administration is relaxing some regulatory pressure on Big Tech. Global financial markets are cheering this apparent policy improvement (Chart 1). In effect, Xi is preparing to let 100 flowers bloom. However, China’s economic trajectory remains gloomy over the long run – not least because the US and China lack a strategic basis for re-engagement. Chinese Leaders Fear Foreign Encroachments Mao’s predicament was not only one of ideology and historical circumstance. It was also one of China’s geopolitics. Chinese governments have always struggled to establish domestic control, extend that control over far-flung buffer territories, and impose limits on foreign encroachments. Mao reversed his brief attempt at liberalization because he could not feel secure in his person or his regime. In 1959, the Chinese economy remained backward. The state faced challenges in administration and in buffer spaces like Tibet and Taiwan. The American military loomed large, despite the stalemate and ceasefire on the Korean peninsula in 1952. Russia was turning against Stalinism, while Hungary was revolting against the Soviet Union. Mao feared that the free exchange of ideas would do more to undermine national unity than it would to promote industrialization and technological progress. The 100 flowers that bloomed – intellectuals criticizing government policy – revealed themselves to be insufficiently loyal. They could be culled, strengthening the regime. However, what followed was a failed economic program and nationwide famine. Fast forward to today, when circumstances have changed but the Chinese state faces the same geopolitical insecurities. Xi Jinping, like all Chinese rulers, is struggling to maintain domestic stability and territorial integrity while regulating foreign influence. Although the People’s Republic is not as vulnerable as it was in Mao’s time, it is increasingly vulnerable – namely, to a historic downshift in potential economic growth and a rise in international tensions (Chart 2). The Xi administration has repeatedly shown that it views the US alliance system, US-led global monetary and financial system, and western liberal ideology as threats that need to be counteracted. Chart 2China: Less Stable, Less Secure
China: Less Stable, Less Secure
China: Less Stable, Less Secure
In addition, Russia’s difficulties invading Ukraine suggest that China faces an enormous challenge in attempting to carve out its own sphere of influence without shattering its economic stability. Hence Beijing needs to slow the pace of confrontation with the West while pursuing the same strategic aims. Xi Stays, But Policy Uncertainty Still High In 2022 2022 is a critical political juncture for China. Xi was supposed to step down and hand the baton to a successor chosen by his predecessor Hu Jintao. Instead he has spent the past decade arranging to remain in power until at least 2032. He took a big stride toward this goal at the nineteenth national party congress in 2017, when he assumed the title of “core leader” of the Communist Party and removed term limits from its constitution. This year’s Omicron outbreak and abrupt economic slowdown have raised speculation about whether Xi’s position is secure. Some of this speculation is wild – but China is far less stable than it appears. Structurally, inequality is high, social mobility is low, and growth is slowing, forcing the new middle class to compromise its aspirations. Cyclically, unemployment is rising and the Misery Index is higher than it appears if one focuses on youth employment and fuel inflation (Chart 3). The risk of sociopolitical upheaval is underrated among global investors. Chart 3AStructurally China Is Vulnerable To Social Unrest
Will China Let 100 Flowers Bloom? Only Briefly.
Will China Let 100 Flowers Bloom? Only Briefly.
Chart 3BCyclically China Is Vulnerable To Social Unrest
Cyclically China Is Vulnerable To Social Unrest
Cyclically China Is Vulnerable To Social Unrest
Yet even assuming that social unrest and political dissent flare up, Xi is highly likely to clinch another five-to-ten years in power. Consider the following points: The top leaders control personnel decisions. The national party congress is often called an “election,” but that is a misnomer. The Communist Party’s top posts will be ratified, not elected. The Politburo and Politburo Standing Committee select the members of the Central Committee; the national party congress convenes to ratify these new members. The Central Committee then ratifies the line-up of the new Politburo and Politburo Standing Committee, which is orchestrated by Xi along with the existing Politburo Standing Committee (Diagram 1). Xi is the most important figure in deciding the new leadership. Diagram 1Mechanics Of The Chinese Communist Party’s National Congress
Will China Let 100 Flowers Bloom? Only Briefly.
Will China Let 100 Flowers Bloom? Only Briefly.
There is no history of surprise votes. The party congress ratifies approximately 90% of the candidates put forward. Outcomes closely conform to predictions of external analysts, meaning that the leadership selection is not a spontaneous, grassroots process but rather a mechanical, elite-driven process with minimal influence from low-level party members, not to mention the population at large.2 The party and state control the levers of power: The Communist Party has control over the military, state bureaucracy, and “commanding heights” of the economy. This includes domestic security forces, energy, communications, transportation, and the financial system. Whoever controls the Communist Party and central government exerts heavy influence over provincial governments and non-government institutions. The state bureaucracy is not in a position to oppose the party leadership. Xi has conducted a decade-long political purge (“anti-corruption campaign”). Upon coming to power in 2012, Xi initiated a neo-Maoist campaign to re-centralize power in his own person, in the Communist Party, and in the central government. He has purged foreign influence along with rivals in the party, state, military, business, civil society, and Big Tech. He personally controls the military, the police, the paramilitary forces, the intelligence and security agencies, and the top Communist Party organs. There may be opposition but it is not organized or capable. Chart 4China: Big Tech Gets Relief ... For Now
China: Big Tech Gets Relief ... For Now
China: Big Tech Gets Relief ... For Now
There are no serious alternatives to Xi’s leadership. Xi is widely recognized within China as the “core” of the fifth generation of Chinese leaders. The other leaders and their factions have been repressed. Xi imprisoned his top rivals, Bo Xilai and Zhou Yongkang, a decade ago. He has since neutralized their followers and the factions of previous leaders Hu Jintao and Jiang Zemin. Premier Li Keqiang has never exercised any influence and will retire at the end of this year. None of the ousted figures have reemerged to challenge Xi, but potential rivals have been imprisoned or disciplined, as have prominent figures that pose no direct political threat, such as tech entrepreneur Jack Ma (Chart 4). Additional high-level sackings are likely before the party congress. China’s reversion to autocracy grew from Communist Party elites, not Xi alone. China’s slowing potential GDP growth and changing economic model raise an existential threat to the Communist Party over the long run. The party recognized its potential loss of legitimacy back in 2012, the year Xi was slated to take the helm. The solution was to concentrate power in the center, promoting Maoist nostalgia and strongman rule. In essence, the party needed a new Mao; Xi was all too willing to play the part. Hence Xi’s current position does not rest on his personal maneuvers alone. The party has invested heavily in Xi and will continue to do so. Characteristics of the political elite underpin the autocratic shift. Statistics on the evolving character traits of Politburo members show the trend toward leaders that are more rural, more bureaucratic, and more ideologically orthodox, i.e. more nationalist and communist (Chart 5). This trend underpins the party’s behavior and Xi’s personal rule. Chart 5China: From Technocracy To Autocracy
Will China Let 100 Flowers Bloom? Only Briefly.
Will China Let 100 Flowers Bloom? Only Briefly.
Chart 6China: De-Industrialization Undermines Stability
China: De-Industrialization Undermines Stability
China: De-Industrialization Undermines Stability
Xi has guarded his left flank. By cornering the hard left of the political spectrum Xi has positioned himself as the champion of poor people, workers, farmers, soldiers, and common folk. This is the political base of the Communist Party, as opposed to the rich coastal elites and westernizing capitalists, who stand to suffer from Xi’s policies. Ultimately de-industrialization – e.g. the sharp decline in manufacturing and construction sectors (Chart 6) – poses a major challenge to this narrative. But social unrest will be repressed and will not overturn Xi or the regime anytime soon. Xi still retains political capital. After centuries of instability, Chinese households are averse to upheaval, civil war, and chaos. They support the current regime because it has stabilized China and made it prosperous. Of course, relative to the Hu Jintao era, Xi’s policies have produced slower growth and productivity and a tarnished international image (Chart 7). But they have not yet led to massive instability that would alienate the people in general. If Chinese citizens look abroad, they see that Xi has already outlasted US Presidents Obama and Trump, is likely to outlast Biden, and that US politics are in turmoil. The same goes for Europe, Japan, and Russia – Xi’s leadership does not suffer by comparison. Chart 7China’s Declining International Image
Will China Let 100 Flowers Bloom? Only Briefly.
Will China Let 100 Flowers Bloom? Only Briefly.
External actors are neither willing nor able to topple Xi. Any outside attempt to interfere with China’s leadership or political system would be unwarranted and would provoke an aggressive response. The US is internally divided and has not developed a consistent China policy. This year the Biden administration has its hands full with midterm elections, Russia, and Iran, where it must also accept the current leadership as a fact of life. It has no ability to prevent Xi’s power consolidation, though it will impose punitive economic measures. Japan and other US allies have an interest in undermining Xi’s administration, but they follow the US’s lead in foreign policy. They also lack influence over the political rotation within the Communist Party. The Europeans will keep their distance but will not try to antagonize China given their more pressing conflict with Russia. Russia needs China more than ever and will lend material support in the form of cheaper and more secure natural resources. North Korean and Iranian nuclear provocations will help Xi stay under the radar. There is no reason to expect a new leader to take over in China. The Xi administration’s strategy, revealed over the past ten years, will remain intact for another five-to-ten years at least. The real question at the party congress is whether Xi will be forced to name a successor or compromise with the opposing faction on the personnel of the Politburo and Politburo Standing Committee. But even that remains to be seen – and either way he will remain the paramount leader. Bottom Line: Xi Jinping has the political capability to cement another five-to-ten years in power. Opposing factions have been weakened over the past decade by Xi’s domestic political purge and clash with the United States. China is ripe for social unrest and political dissent but these will be repressed as China goes further down the path of autocracy. Foreign powers have little influence over the process. Policy Uncertainty Falls In 2023 … Only To Rise Again What will Xi Jinping do once he consolidates power? Xi’s administration has weighed heavily on China’s economy, foreign relations, and financial markets. The situation has worsened dramatically this year as the economy struggles with “A Trifecta Of Economic Woes” – namely a rampant pandemic, waning demand for exports, and a faltering housing market (Chart 8). In response the administration is now easing a range of policies to stabilize expectations and try to meet the 5.5% annual growth target. The money impulse, and potentially the credit impulse, is turning less negative, heralding an eventual upturn in industrial activity and import volumes in 2023. These measures will give a boost to Chinese and global growth, although stimulus measures are losing effectiveness over time (Chart 9). Chart 8China's Trifecta Of Economic Woes
China's Trifecta Of Economic Woes
China's Trifecta Of Economic Woes
Chart 9More Stimulus, But Less Effectiveness
More Stimulus, But Less Effectiveness
More Stimulus, But Less Effectiveness
This pro-growth policy pivot will continue through the year and into next year. After all, if Xi is going to stay in power, he does not want to bequeath himself a financial crisis or recession at the start of his third term. Still, investors should treat any rally in Chinese equity markets with skepticism. First, political risk and uncertainty will remain elevated until Xi completes his power grab, as China is highly susceptible to surprises and negative political incidents this year (Chart 10). For example, if social unrest emerges and is repressed, then the West will impose sanctions. If China increases its support of Russia, Iran, or North Korea, then the US will impose sanctions. Chart 10China: Policy Uncertainty And Geopolitical Risk To Stay High In 2022, Might Improve In 2023
China: Policy Uncertainty And Geopolitical Risk To Stay High In 2022, Might Improve In 2023
China: Policy Uncertainty And Geopolitical Risk To Stay High In 2022, Might Improve In 2023
Chart 11China Needs To Court Europe
China Needs To Court Europe
China Needs To Court Europe
The regime will be extremely vigilant and overreact to any threats this year, real or perceived. Political objectives will remain paramount, above the economy and financial markets, and that means new economic policy initiatives will not be reliable. Investors cannot be confident about the country’s policy direction until the leadership rotation is complete and new policy guidance is revealed, particularly in December 2022 and March 2023. Second, after consolidating power, investors should interpret Xi’s policy shift as “letting 100 flowers bloom,” i.e., a temporary relaxation that aims to reboot the economy but does not change the country’s long-term policy trajectory. Economic reopening is inevitable after the pandemic response is downgraded – which is a political determination. Xi will also be forced to reduce foreign tensions for the sake of the economy, particularly by courting Europe, which is three times larger than Russia as a market (Chart 11). However, China’s declining labor force and high debt levels prevent its periodic credit stimulus from generating as much economic output as in the past. And the administration will not ultimately pursue liberal structural reforms and a more open economy. That is the path toward foreign encroachment – and regime insecurity. The US’s sanctions on Russia have shown the consequences of deep dependency on the West. China will continue diversifying away from the US. And, as we will see, the US cannot provide credible promises that it will reduce tensions. US-China: Re-Engagement Will Fail The Biden administration is focused on fighting inflation ahead of the midterm elections. But its confrontation with Russia – and likely failure to freeze Iran’s nuclear program – increases rather than decreases oil supply constraints. Hence some administration officials and outside observers argue that the administration should pursue a strategic re-engagement with China.3 Theoretically a US-China détente would buy both countries time to deal with their domestic politics by providing some international stability. Improved US-China relations could also isolate Russia and hasten a resolution to the war in Ukraine, potentially reducing commodity price pressures. In essence, a US-China détente would reprise President Richard Nixon’s outreach to China in 1972, benefiting both countries at the expense of Russia.4 This kind of Kissinger 2.0 maneuver could happen but there are good reasons to think it will not, or if it does that it will fall apart in one or two years. In 1972, China had nowhere near the capacity to deny the US access to the Asia Pacific region, expel US influence from neighboring countries, reconquer Taiwan, or project power elsewhere. Today, China is increasingly gaining these abilities. In fact it is the only power in the world capable of rivaling the US in both economic and military terms over the long run (Chart 12). Secretary of State Antony Blinken recently outlined the Biden administration’s China policy and declared that China poses “the most serious long-term challenge” to the US despite Russian aggression.5 Chart 12US-China Competition Sows Distrust, Drives Economic Divorce
Will China Let 100 Flowers Bloom? Only Briefly.
Will China Let 100 Flowers Bloom? Only Briefly.
While another decade of US engagement with China would benefit the US economy, it would be far more beneficial to China. Crucially, it would be beneficial in a strategic sense, not just an economic one. It could provide just the room for maneuver that China needs – at this critical juncture in its development – to achieve technological and productivity breakthroughs and escape the middle-income trap. Another ten-year reprieve from direct American competition would set China up to challenge the US on the global stage. That would be far too high of a strategic price for America to pay for a ceasefire in Ukraine. Ukraine has limited strategic value for the US and it does not steer US grand strategy, which aims to prevent regional empires from taking shape. In fact Washington is deliberately escalating and prolonging the war in Ukraine to drain Russia’s resources. Ending the war would do Russia a strategic favor, while re-engaging with China would do China a strategic favor. So why would the defense and intelligence community advise the Biden administration to pursue Kissinger 2.0? Chart 13US Unlikely To Revoke Trump Tariffs
US Unlikely To Revoke Trump Tariffs
US Unlikely To Revoke Trump Tariffs
Biden could still pursue some degree of détente with China, namely by repealing President Trump’s trade tariffs, in order to relieve price pressures ahead of the midterm election. Yet even here the case is deeply flawed. Trump’s tariffs on China did not trigger the current inflationary bout. That was the combined Trump-Biden fiscal stimulus and Covid-era supply constraints. US import prices are rising faster from the rest of the world than they are from China (Chart 13). Tariff relief would not change China’s Zero Covid policy, which is the current driver of price spikes from China. And while lifting tariffs on China would not reduce inflation enough to attract voters, it would cost Biden some political credit among voters in swing states like Pennsylvania, and across the US, where China’s image has plummeted in the wake of Covid-19 (Chart 14). Chart 14US Political Consensus Remains Hawkish On China
Will China Let 100 Flowers Bloom? Only Briefly.
Will China Let 100 Flowers Bloom? Only Briefly.
If Biden did pursue détente, would China be able to reciprocate and offer trade concessions? Xi has the authority to do so but he is unlikely to make major trade concessions prior to the party congress. Economic self-sufficiency and resistance to American pressure have become pillars of his support. Promises will not ease inflation for US voters in November and Xi has no incentive to make binding concessions because the next US administration could intensify the trade war regardless. Bottom Line: The US has no long-term interest, and a limited short-term interest, in easing pressure on China’s economy. Continued US pressure, combined with China’s internal difficulties, will reinforce Xi Jinping’s shift toward nationalism and hawkish foreign policy. Hence there is little basis for a substantial US-China re-engagement that improves the global macroeconomic environment over the coming years. Investment Takeaways Chart 15Autocracy Hurts Productivity
Autocracy Hurts Productivity
Autocracy Hurts Productivity
Xi Jinping will clinch another five-to-ten years in power this fall. To stabilize the economy, he will “let 100 flowers bloom” and ease monetary, fiscal, regulatory, and social policy at home. He will also court the West, especially Europe, for the sake of economic growth. However, he will not go so far as to compromise his ultimate aims: self-sufficiency at home and a sphere of influence abroad. The result will be a relapse into conflict with the West within a year or two. Ultimately a closed Chinese economy in conflict with the West will result in lower productivity, a weaker currency, a high geopolitical risk premium, and low equity returns – just as it did for Russia (Chart 15). Any short-term improvement in China’s low equity multiples will ultimately be capped. Over the long run, western investors should hedge against Chinese geopolitical risk by preferring markets that benefit from China’s periodic stimulus yet do not suffer from the break-up of the US-China and EU-Russia economic relationships, such as key markets in Latin America and Southeast Asia (Charts 16 & 17). Chart 16China Stimulus Creates Opportunity For … Latin America
China Stimulus Creates Opportunity For ... Latin America
China Stimulus Creates Opportunity For ... Latin America
Chart 17China Stimulus Creates Opportunity For … Southeast Asia
China Stimulus Creates Opportunity For ... Southeast Asia
China Stimulus Creates Opportunity For ... Southeast Asia
Matt Gertken Chief Geopolitical Strategist mattg@bcaresearch.com Footnotes 1 Modern scholarship has shown that Mao intended to entrap the opposition through the 100 Flowers Campaign. For a harrowing account of this episode, see Jung Chang and Jon Halliday, Mao: The Unknown Story (New York: Anchor Books, 2006), pp. 409-17. 2 “At least 8% of CPC Central Committee nominees voted off,” Xinhua, October 24, 2017, english.www.gov.cn. 3 Christopher Condon, “Yellen Says Biden Team Is Looking To ‘Reconfigure’ China Tariffs,” June 8, 2022, www.bloomberg.com. 4 Niall Ferguson, “Dust Off That Dirty Word Détente And Engage With China,” Bloomberg, June 5, 2022, www.bloomberg.com. 5 See Antony J Blinken, Secretary of State, “The Administration’s Approach to the People’s Republic of China,” George Washington University, Washington D.C., May 26, 2022, state.gov. Additionally, see President Joe Biden’s third assertion of US willingness to defend Taiwan against China, in a joint press conference with Japan’s Prime Minister Kishida Fumio, “Remarks by President Biden and Prime Minister Kishida Fumio of Japan in Joint Press Conference,” Akasaka Palace, Tokyo, Japan, May 23, 2022, whitehouse.gov.
Earnings contractions and recessions typically go hand in hand. Nevertheless, there have been five instances since the 1960s in which there have been non-recessionary year-on-year negative EPS growth. In four of these occurrences, revenue growth remained…
Executive Summary Singapore stocks are at risk as an impending contraction in global trade will hurt this very open economy and its markets. The country’s foreign reserves are already shrinking as the balance of payments has slid into deficit. The Monetary Authority of Singapore’s (MAS) attempts to rein in inflation by pushing up the currency is also causing foreign reserves to contract, and local money supply to decelerate sharply. Inflationary pressures in Singapore are not entrenched and will soon subside. Wage growth is under control, and unit labor cost increases are subdued. Singapore’s export competitiveness remains robust; yet that does not preclude it from a period of shrinking exports over the next 6-12 months. Falling exports, shrinking foreign reserves, decelerating money supply and peaking inflation will dissuade MAS from pushing up the Singapore dollar much higher from current levels. Manufacturing Cycles Dictate The Performance Of Singapore Stocks
Manufacturing Cycles Dictate The Performance Of Singapore Stocks
Manufacturing Cycles Dictate The Performance Of Singapore Stocks
Recommendation Inception Date RETURN Downgrade Singapore stocks from overweight to neutral May 10, 2021 2.3% Bottom Line: Equity investors should reduce their exposure to Singapore stocks in EM and Asian portfolios by downgrading their allocation from overweight to neutral. Absolute return investors should wait for a better entry point. Feature Chart 1Singapore Stocks' Outperformance Is Set To Take A Breather
Singapore Stocks' Outperformance Is Set To Take A Breather
Singapore Stocks' Outperformance Is Set To Take A Breather
Like most global markets, Singapore stocks have sold off materially since early this year. Relative to EM and Asian counterparts, however, they have fared well – in line with our call back in May 2021 when we upgraded this bourse to overweight (Chart 1). The question is, given the changing macro backdrop − where a whiff of stagflation has permeated global investment landscapes – what should investors now do about this market? We believe that higher inflation in Singapore is a temporary phenomenon and will subside sooner rather than later. Contracting global trade, on the other hand, is a much more vital risk for this very open economy and its equity markets; and is a reason to downgrade this bourse. Indeed, Singapore stocks in absolute US dollar terms face more downside over the next several months. Relative to its EM and Asian counterparts also, this bourse’s outperformance is likely to take a breather. Asian and EM equity portfolios would therefore do well to downgrade this market by a notch from overweight to neutral in EM and Asian equity baskets. Absolute return investors should stay on the sidelines for now. Unfavorable Settings Contracting global trade and tightening liquidity will weigh on Singapore stocks in the months ahead. Global trade volumes will fall as developed countries’ demand for goods (ex-auto) shrinks following the pandemic-era binge. Chinese growth will also likely be struggling to recover. What this means is that both global manufacturing and exports are heading towards a contraction. As a very open economy where goods exports make up 115% of GDP (and services exports another 55%), manufacturing and exports of goods drive income for the entire Singaporean economy and influence its stock market cycles. Chart 2 shows how ebbs and flows in manufacturing new orders dictate Singapore’s equity market performances. Chart 2Manufacturing Cycles Dictate The Performance Of Singapore Stocks
Manufacturing Cycles Dictate The Performance Of Singapore Stocks
Manufacturing Cycles Dictate The Performance Of Singapore Stocks
The performances of financial and real estate stocks, which make up two-thirds of the MSCI Singapore index, are also highly dependent on business cycles − which in turn, are driven by swings in manufacturing and exports (Chart 3). One reason for that is, at 23% of GDP, manufacturing is the single largest sector in the economy. By comparison, finance and insurance make up 14% of the nation’s output, and real estate 3%. Any acceleration or deceleration in manufacturing activity therefore has a strong impact on the performance of tertiary sectors, including those of banking and real estate. In addition, MAS’ tightening is causing local money supply to decelerate (discussed in more detail later). Slower money growth is never bullish for stock prices (Chart 4). Chart 3Banks And Real Estate Stocks Also Move With Manufacturing And Exports
Banks And Real Estate Stocks Also Move With Manufacturing And Exports
Banks And Real Estate Stocks Also Move With Manufacturing And Exports
Chart 4Decelerating Money Supply Is A Bad Omen For Share Prices
Decelerating Money Supply Is A Bad Omen For Share Prices
Decelerating Money Supply Is A Bad Omen For Share Prices
In sum, given the changing global macro backdrop of slowing manufacturing and trade, and elevated US inflation, Singapore stocks have not yet found a sustainable bottom in absolute terms. Relative to their EM counterparts, Singapore’s outperformance could also take a breather. During periods of weakening global trade and manufacturing, Singapore stocks usually do poorly relative to their EM peers. The top panel of Chart 5 shows US manufacturing PMI new orders as decelerating rapidly. Periods of falling and/or sub-50 PMI prints usually herald Singapore stocks’ underperformance relative to EM, with a few months lag. Singapore’s own new export orders are also about to slip into contraction territory. If history is any guide, this too entails a period of underperformance of this bourse versus EM going forward (Chart 5, bottom panel). Is Inflation Genuine In Singapore? The short answer is no; there is little genuine inflation in Singapore. The country is not witnessing any wage-price spiral either, unlike in the US. What we see there instead is just a one-off surge in inflation. Average monthly wages in Singapore have accelerated in the past year but are not out of line when compared to the past 20 years (Chart 6, top panel). Chart 5Weakening Manufacturing Orders Foreshadow Singapore Equities' Underperformance
Weakening Manufacturing Orders Foreshadow Singapore Equities' Underperformance
Weakening Manufacturing Orders Foreshadow Singapore Equities' Underperformance
Chart 6Limited Wage Growth And Subdued Unit Labor Costs Will Rein In Inflationary Pressures
Limited Wage Growth And Subdued Unit Labor Costs Will Rein In Inflationary Pressures
Limited Wage Growth And Subdued Unit Labor Costs Will Rein In Inflationary Pressures
A controlled rise in wages has helped keep Singaporean firms’ unit labor costs (ULCs) in check. The middle panel of Chart 6 shows ULCs for the overall economy vis-à-vis the consumer price index. ULCs are much below pre-pandemic levels. This happens to be the case even in the service sector of the economy where productivity gains are much harder to achieve. In the goods producing sector, where productivity gains are relatively easier to achieve, ULCs have remained particularly low (Chart 6, bottom two panels). What this means is that firms are facing little wage-related cost pressures. They are, therefore, less likely to pass it on to customers via higher selling prices. That, in turn, will help cap inflationary pressures in the economy. Chart 7Sharply Slowing Money Growth Points To Peaking Inflation
Sharply Slowing Money Growth Points To Peaking Inflation
Sharply Slowing Money Growth Points To Peaking Inflation
In fact, much of the recent rise in headline and core consumer inflation in Singapore has had to do with the explosive money growth seen during the pandemic. Both narrow (M1) and broad money (M3) growth rates in Singapore accelerated in 2020 to levels not seen since the Global Financial Crisis of 2008-09. Inflation usually follows money growth with several months lag, and this time was no different. That said, both measures of money have since decelerated markedly this year. This will rein in inflationary pressures going forward (Chart 7). Looking forward, money supply itself will likely decelerate further in the months ahead. A critical reason for that is the manner in which the central bank (MAS) uses the currency to achieve its monetary policy objectives (i.e., to maintain price stability). When inflation rises, MAS typically guides the trade-weighted Singapore dollar to appreciate, in an attempt to rein in inflation. In so doing, MAS buys local currency and sells foreign currency. This reduces local liquidity and money supply. Chart 8 shows that MAS is indeed guiding the Singapore dollar up: the trade weighted currency has risen by over 3% in the past six months tracking inflation. Not surprisingly, money growth in Singapore has decelerated meaningfully. In time, that will help pull inflation lower. There was an external factor too. In the past couple of years, the country had witnessed a massive improvement in its balance of payments (BoP). It skyrocketed from a minus 3% of GDP in 2019 to a plus 27% in 2021. To prevent the currency from surging, the central bank had resorted to a rapid accumulation of foreign reserves. As MAS pumped local currency into the system while purchasing foreign currencies, local money supply boomed (Chart 9). Chart 8In Order To Check Inflation, The MAS Has Pushed The Singapore Dollar Up...
In Order To Check Inflation, The MAS Has Pushed The Singapore Dollar Up...
In Order To Check Inflation, The MAS Has Pushed The Singapore Dollar Up...
Chart 9...Causing Foreign Reserves To Drop, And Money Supply To Decelerate Materially
...Causing Foreign Reserves To Drop, And Money Supply To Decelerate Materially
...Causing Foreign Reserves To Drop, And Money Supply To Decelerate Materially
Chart 10The Trade Surplus Will Narrow, Putting More Pressure On The Balance Of Payments
The Trade Surplus Will Narrow, Putting More Pressure On The Balance Of Payments
The Trade Surplus Will Narrow, Putting More Pressure On The Balance Of Payments
But the tide has turned this year. The trade surplus has rolled over and will continue to shrink as global trade is set to weaken further this year as explained above. As such, Singapore’s current account surplus will also likely roll over. The capital account has already slipped back into massive deficits; so has the BoP (Chart 10). The upshot is that foreign reserves have begun to contract. This means MAS is now selling foreign reserves to buy back local currency. This is causing a deceleration in local money supply (Chart 9, above). In sum, the absence of meaningful wage pressures, a decelerating money supply, and a strengthening currency will help Singapore see its inflation ease sooner than in the US. Can Singapore Withstand A Stronger Currency? As discussed above, Singapore’s monetary policy entails tackling higher inflation by letting the Singapore dollar appreciate in nominal terms. But given the high inflation prints, an appreciating currency would mean that it gets even stronger in real terms (i.e., in inflation-adjusted terms). An expensive currency in real terms could erode competitiveness. So, the question is, can the Singapore economy withstand a stronger currency? The short answer is yes. Chart 11 shows that while the Singapore dollar has appreciated to new highs in nominal trade weighted terms, in real terms (ULC-based) it remains at around 15-year lows. As such, currency competitiveness should not be an issue anytime soon. Notably, real exchange rates calculated using ULCs are more representative of currency competitiveness than the use of consumer prices allows. The reason is that employee compensation is a major component of any company’s overall cost structure; and therefore, ULCs matter for a company much more directly than do consumer prices. The very low levels of the ULC-based real exchange rate indicates that the Singapore dollar is still very competitive. Indeed, Singapore’s export volumes have been on an upward trend relative to global exports (Chart 12). Chart 11The Singapore Dollar Remains A Highly Competitive Currency
The Singapore Dollar Remains A Highly Competitive Currency
The Singapore Dollar Remains A Highly Competitive Currency
Chart 12Singapore Is Grabbing Export Market Share From The Rest Of The World
Singapore Is Grabbing Export Market Share From The Rest Of The World
Singapore Is Grabbing Export Market Share From The Rest Of The World
Notably, Singapore continues to attract a very high amount of FDI. This will help raise productivity going forward, thereby keeping ULCs in check down the line. All that said, strong competitiveness (i.e., the ability to maintain global market share) does not preclude Singapore from experiencing a drop in its export revenues over the next 6-to-12 months. The reason is faltering goods demand in the US and Europe after a pandemic-era overconsumption. Falling exports, in turn, will lead to shrinking foreign reserves, decelerating money supply, and finally slowing growth and inflation. This will discourage MAS from pushing the Singapore dollar much higher from current levels. As Chart 11 showed, the Singaporean currency is already at an all-time high in trade-weighted terms. The rally in the trade-weighted Singapore dollar is therefore in late stages. Investment Recommendations Chart 13The Singapore Dollar's Outperformance Vesus Other Asian Currencies Is Late
The Singapore Dollar's Outperformance Vesus Other Asian Currencies Is Late
The Singapore Dollar's Outperformance Vesus Other Asian Currencies Is Late
Singapore stocks, with a P/E ratio of 21.5, have become relatively expensive vis-à-vis their EM (13.1) and Asian (14.1) counterparts. In terms of the price-to-book value ratio however, they are not expensive. Considering all, we recommend that investors reduce their exposure to Singapore stocks in EM and Asian equity portfolios by downgrading their allocation from overweight to neutral. Our overweight stance since May 10, 2021, has yielded a gain of 2.3% so far. Absolute return investors should wait for a better entry point. The depreciation of the Singapore dollar vis-à-vis the US dollar likely has some more room given the impending deterioration in global trade. But the latter will also soon check the appreciation of the Singapore dollar versus other Asian currencies − as MAS will be dissuaded from guiding the currency up in view of peaking domestic inflation and shrinking trade (Chart 13). Rajeeb Pramanik Senior EM Strategist rajeeb.pramanik@bcaresearch.com
Executive Summary The Efficient Market Hypothesis (EMH) is flawed. This Holy Grail of financial economics assumes that investors are a homogenous bunch with identical investment horizons, when the reality is that investors have a wide spectrum of time horizons. The alternative but less well-known Fractal Market Hypothesis (FMH) recognizes that investors with different time horizons interpret the same facts and information differently. The key conclusion of the FMH is that when the different investment horizons are all active in the market, the price reflects all available information, meaning that the market is efficient, liquid, and stable. But when the different investment horizons start to converge and coalesce, the market becomes inefficient, illiquid, and vulnerable to a trend reversal. Using the FMH over the past six months, 5 structured recommendations were closed in profit: Short ILS/GBP, Short Coffee versus Cocoa, Short World Basic Resources versus Market, Long EUR/CHF, and Short Semiconductors versus Tech. Against this, 3 structured recommendations were closed in loss: Short Nickel versus Silver, Long Polish Bonds versus US Bonds, and Short World Semiconductors versus Biotech. Within the 10 open trades, 3 are in healthy profit, 4 are flat, and 3 are in loss. The Efficient Market Hypothesis Does Not Describe The Truth; The Fractal Market Hypothesis Does
Fractal Trading Update - June 2022
Fractal Trading Update - June 2022
Bottom Line: As few investors are aware of the Fractal Market Hypothesis, it gives a competitive advantage to those that use it to identify potential trend reversals. Feature For nations and societies, disagreement and conflict are unhealthy. But for financial markets, the opposite is true – it is the lack of disagreement and conflict that is unhealthy. This is because the market needs disagreement to generate liquidity, the ability to trade quickly and in large volume without destabilizing the market price. If I want to buy a share, then somebody must sell me that share. It follows that I and the seller must disagree about the attractiveness of the share at the current price. Likewise, if I and like-minded individuals want to buy ten million shares, it follows that lots of market participants must disagree with us. If lots of market participants do not disagree with us, there will be insufficient liquidity to complete the transaction without a price change. And if too many people are engaged in groupthink, the price change could be extreme. Markets Become Inefficient When There Is Not Enough Disagreement How can there be major disagreement about the attractiveness of an investment when we all have access to the same facts and information? According to the Efficient Market Hypothesis (EMH) there cannot be, because asset prices always reflect all available information.1 Unfortunately, the Efficient Market Hypothesis is flawed. This Holy Grail of financial economics assumes that investors are a homogenous bunch with identical investment horizons, when the reality is that investors have a wide spectrum of time horizons – ranging from the milliseconds of momentum-driven high-frequency trading (HFT) to the decades of a value-driven pension fund. The market is efficient only when a wide spectrum of investment horizons is setting the price, signified by the market having a rich fractal structure. The alternative but less well-known Fractal Market Hypothesis (FMH) recognizes the reality of different time horizons. Crucially, the FMH acknowledges that investors with different time horizons interpret the same facts and information differently. In other words, they disagree (Box I-1). Box 1-1The Efficient Market Hypothesis Does Not Describe The Truth; The Fractal Market Hypothesis Does
Fractal Trading Update - June 2022
Fractal Trading Update - June 2022
For example, the momentum-based high frequency trader might interpret a sharp one-day sell-off as a sell signal, but the value-based pension fund might interpret the same information as a buying opportunity. This disagreement will create liquidity without requiring a big price adjustment. Thereby it also fosters market stability. The key conclusion of the Fractal Market Hypothesis is that when the different investment horizons are all active in the market, the price does reflect all available information, meaning that the market is efficient, liquid, and stable. But when the different investment horizons start to converge and coalesce, the market becomes inefficient, illiquid, and vulnerable to a trend reversal. Buy and sell orders will no longer match without a price change, possibly extreme. Can we measure the loss of efficiency in a specific investment, and thereby anticipate a potential trend reversal? The answer is yes, by monitoring its fractal dimension, using the expression in the Appendix. Although many readers may find the concept of a fractal dimension intimidating, the idea is simple and intuitive. It just measures the complexity – or information content – in an object or structure. Thereby, when an investment’s fractal dimension reaches its lower limit, it warns that the information content of longer-term investors is missing from the price. When the longer-term investors do ultimately re-enter the price setting process, the question is: will they endorse the recent trend because of some major change in the fundamentals – such as the start of the Russia/Ukraine war? Or will they reject it, as an unjustified deviation from a fundamental anchor. In most cases, it is the latter: a rejection and a trend reversal. As few investors are aware of the Fractal Market Hypothesis, it gives a competitive advantage to those that use it to identify potential trend reversals. Fractal Trading Update Using the Fractal Market Hypothesis over the past six months, 5 structured recommendations were closed in profit: Short ILS/GBP, Short Coffee versus Cocoa, Short World Basic Resources versus Market, Long EUR/CHF, and Short Semiconductors versus Tech. A fragile fractal structure warns of a crowded trade. One structured recommendation was closed flat: Short Personal Goods versus Consumer Services. Against this, 3 structured recommendations were closed in loss: Short Nickel versus Silver, Long Polish Bonds versus US Bonds, and Short World Semiconductors versus Biotech. Within the 10 open trades, 3 are in healthy profit, 4 are flat, and 3 are in loss. As for the unstructured recommendations, for which we do not define profit targets or expiry dates, we are pleased to report that out of 31 recommendations, only 2 failed to experience a countertrend reversal. Wins 1) November 18th: Short ILS/GBP Achieved its profit target of 4.2 percent. 2) November 25th: Short Coffee versus Cocoa (Chart I-1) Achieved almost half of its 30 percent profit target at expiry. Chart I-1Fractal Analysis Correctly Predicted A Reversal In Coffee Versus Cocoa
Fractal Analysis Correctly Predicted A Reversal In Coffee Versus Cocoa
Fractal Analysis Correctly Predicted A Reversal In Coffee Versus Cocoa
3) January 20th: Short World Semiconductors versus Tech (Chart I-2) Achieved its profit target of 6 percent. Chart I-2Fractal Analysis Correctly Predicted A Reversal In World Semiconductors Versus Technology
Fractal Analysis Correctly Predicted A Reversal In World Semiconductors Versus Technology
Fractal Analysis Correctly Predicted A Reversal In World Semiconductors Versus Technology
4) March 10th: Long EUR/CHF Achieved its profit target of 3.6 percent. 5) April 14th: Short World Basic Resources versus Market (Chart I-3) Achieved its profit target of 11.5 percent. Chart I-3Fractal Analysis Correctly Predicted A Reversal In World Basic Resources Versus Market
Fractal Analysis Correctly Predicted A Reversal In World Basic Resources Versus Market
Fractal Analysis Correctly Predicted A Reversal In World Basic Resources Versus Market
In addition, Short World Personal Goods versus Consumer Services which was opened on December 9th reached a high-water mark of 10.5 percent but expired flat. Losses 1) December 2nd: Short World Semiconductors versus Biotech Hit its stop loss of 9.5 percent. 2) January 13th: Long Poland versus US: 10-Year Government Bonds Reached a high-water mark of 3.7 percent, but then reversed to hit its stop loss of 8 percent. In the current geopolitical crisis, Poland has been a casualty due to its lengthy border with Ukraine. 3) February 3rd: Short Nickel versus Silver (Chart I-4) Hit its stop loss at 20 percent following an explosive short-squeeze rally in the Nickel price. Chart I-4Nickel's Short-Squeeze Rally Forced A Price Trend Prolongation
Nickel's Short-Squeeze Rally Forced A Price Trend Prolongation
Nickel's Short-Squeeze Rally Forced A Price Trend Prolongation
Open Trades 1) January 27th: Long MSCI Korea versus All-Country World (Chart I-5) Open, in profit, having reached a high-water mark of 6 percent (versus an 8 percent target). Chart I-5Fractal Analysis Correctly Predicted A Rebound In Korea Versus All-Country World
Fractal Analysis Correctly Predicted A Rebound In Korea Versus All-Country World
Fractal Analysis Correctly Predicted A Rebound In Korea Versus All-Country World
2) February 24th: Long US Biotech versus US Tech Open, in profit, having reached a high-water mark of 10.5 (versus a 17.5 percent target). 3) March 3rd: Short World Banks versus Consumer Services Reached a high-water mark of 7.3 percent (versus a 12 percent target), but then reversed and is in loss. 4) March 24th: Long 5-Year T-bond Open, in modest loss. 5) April 7th: Short World Non-Life Insurance versus Homebuilders (Chart I-6) Open, in profit having reached a high-water mark of 12.4 percent (versus a 14 percent target). Chart I-6Fractal Analysis Correctly Predicted A Reversal In World Non-Life Insurance Versus Homebuilders
Fractal Analysis Correctly Predicted A Reversal In World Non-Life Insurance Versus Homebuilders
Fractal Analysis Correctly Predicted A Reversal In World Non-Life Insurance Versus Homebuilders
6) April 7th: Long JPY/CHF Reached a high-water mark of 3.4 percent versus a 4 percent target, but then reversed into modest loss. This suggests that the trade needed a narrower profit target. 7) April 28th: Short High Dividend ETF versus US 10-Year T-bond Open, in modest loss, having reached a high-water mark of 2.9 percent (versus a 6 percent target). 8) May 19th: Short FTSE 100 versus STOXX Europe 600 Open, and flat. 9) June 2nd: Long JPY/USD (Chart I-7) Open, and flat. Chart I-7The Sell-Off In JPY/USD Has Reached A Potential Turning Point
The Sell-Off In JPY/USD Has Reached A Potential Turning Point
The Sell-Off In JPY/USD Has Reached A Potential Turning Point
10) June 2nd: Short Australia Basic Resources versus World Market (Chart I-8) Open, and flat. Chart I-8The Australian Basic Resources Sector Is Vulnerable To Reversal
The Australian Basic Resources Sector Is Vulnerable To Reversal
The Australian Basic Resources Sector Is Vulnerable To Reversal
Our full watchlist of 29 investments that are at, or approaching turning points, is available on our website: cpt.bcaresearch.com Appendix: Calculating The Fractal Dimension Of A Financial Market
Fractal Trading Update - June 2022
Fractal Trading Update - June 2022
Chart 1AUD/KRW Is Vulnerable To Reversal
AUD/KRW Is Vulnerable To Reversal
AUD/KRW Is Vulnerable To Reversal
Chart 2Canada Versus Japan Is Reversing
Canada Versus Japan Is Reversing
Canada Versus Japan Is Reversing
Chart 3Canada's TSX-60's Outperformance Might Be Over
Canada's TSX-60's Outperformance Might Be Over
Canada's TSX-60's Outperformance Might Be Over
Chart 4US Healthcare Providers Vs. Software At Risk of Reversal
US Healthcare Providers Vs. Software At Risk of Reversal
US Healthcare Providers Vs. Software At Risk of Reversal
Chart 5BRL/NZD At A Resistance Point
BRL/NZD At A Resistance Point
BRL/NZD At A Resistance Point
Chart 6Homebuilders Versus Healthcare Services Has Turned
Homebuilders Versus Healthcare Services Has Turned
Homebuilders Versus Healthcare Services Has Turned
Chart 7CNY/USD Has Reversed
CNY/USD Has Reversed
CNY/USD Has Reversed
Chart 8CAD/SEK Is Vulnerable To Reversal
CAD/SEK Reversal Has Started
CAD/SEK Reversal Has Started
Chart 9Financials Versus Industrials To Reverse
Financials Versus Industrials To Reverse
Financials Versus Industrials To Reverse
Chart 10The Outperformance Of Resources Versus Biotech Has Started To Reverse
The Outperformance Of Resources Versus Biotech Has Started To Reverse
The Outperformance Of Resources Versus Biotech Has Started To Reverse
Chart 11The Outperformance Of Resources Versus Healthcare Is Vulnerable To Reversal
The Outperformance Of Resources Versus Healthcare Is Vulnerable To Reversal
The Outperformance Of Resources Versus Healthcare Is Vulnerable To Reversal
Chart 12FTSE100 Outperformance Vs. Euro Stoxx 50 Is Reversing
FTSE100 Outperformance Vs. Euro Stoxx 50 Is Reversing
FTSE100 Outperformance Vs. Euro Stoxx 50 Is Reversing
Chart 13Netherlands Underperformance Vs. Switzerland Is Ending
Netherlands Underperformance Vs. Switzerland Has Been Exhausted
Netherlands Underperformance Vs. Switzerland Has Been Exhausted
Chart 14The Sell-Off In The 30-Year T-Bond Is Approaching Fractal Fragility
The Sell-Off In The 30-Year T-Bond Is Approaching Fractal Fragility
The Sell-Off In The 30-Year T-Bond Is Approaching Fractal Fragility
Chart 15The Sell-Off In The NASDAQ Is Approaching Fractal Fragility
The Sell-Off In The NASDAQ Is Approaching Fractal Fragility
The Sell-Off In The NASDAQ Is Approaching Fractal Fragility
Chart 16Food And Beverage Outperformance Exhausted
Food And Beverage Outperformance Has Been Exhausted
Food And Beverage Outperformance Has Been Exhausted
Chart 17The Strong Trend In The 18-Month-Out US Interest Rate Future Is Fragile
The Strong Trend In The 18-Month-Out US Interest Rate Future Is Fragile
The Strong Trend In The 18-Month-Out US Interest Rate Future Is Fragile
Chart 18The Strong Trend In The 3 Year T-Bond Is Fragile
The Strong Trend In The 3 Year T-Bond Is Fragile
The Strong Trend In The 3 Year T-Bond Is Fragile
Chart 19A Potential Switching Point From Tobacco Into Cannabis
A Potential Switching Point From Tobacco Into Cannabis
A Potential Switching Point From Tobacco Into Cannabis
Chart 20Biotech Is A Major Buy
Biotech Is A Major Buy
Biotech Is A Major Buy
Chart 21Norway's Outperformance Could End
Norway's Outperformance Could End
Norway's Outperformance Could End
Chart 22Cotton Versus Platinum Is Reversing
Cotton Versus Platinum Is Reversing
Cotton Versus Platinum Is Reversing
Chart 23Switzerland's Outperformance Vs. Germany Has Ended
Switzerland's Outperformance Vs. Germany Has Started To End
Switzerland's Outperformance Vs. Germany Has Started To End
Chart 24The Rally In USD/EUR Has Ended
The Rally In USD/EUR Has Ended
The Rally In USD/EUR Has Ended
Chart 25The Outperformance Of MSCI Hong Kong Versus China Is Vulnerable To Reversal
The Outperformance Of MSCI Hong Kong Versus China Is Vulnerable To Reversal
The Outperformance Of MSCI Hong Kong Versus China Is Vulnerable To Reversal
Chart 26A Potential New Entry Point Into Petcare
A Potential New Entry Point Into Petcare
A Potential New Entry Point Into Petcare
Chart 27Czech Outperformance Near Exhaustion
Czech Outperformance Near Exhaustion
Czech Outperformance Near Exhaustion
Chart 28US REITS Are Oversold Versus Utilities
US REITS Are Oversold Versus Utilities
US REITS Are Oversold Versus Utilities
Chart 29GBP/USD At A Turning Point
GBP/USD At A Turning Point
GBP/USD At A Turning Point
Dhaval Joshi Chief Strategist dhaval@bcaresearch.com Hadi Elzein Research Associate hadi.elzein@bcaresearch.com Footnotes 1 Strictly speaking, the EMH assumes there is some disagreement, but that this disagreement is random and follows a standard Gaussian (bell-curve) distribution. Therefore, the EMH assumes that a share price just follows a random walk until new (unpredictable) fundamental information arrives. Fractal Trades
Fractal Trading Update - June 2022
Fractal Trading Update - June 2022
6-Month Recommendations Structural Recommendations Closed Fractal Trades Indicators To Watch - Bond Yields Chart II-1Indicators To Watch - Bond Yields - Euro Area
Indicators To Watch - Bond Yields - Euro Area
Indicators To Watch - Bond Yields - Euro Area
Chart II-2Indicators To Watch - Bond Yields - Europe Ex Euro Area
Indicators To Watch - Bond Yields - Europe Ex Euro Area
Indicators To Watch - Bond Yields - Europe Ex Euro Area
Chart II-3Indicators To Watch - Bond Yields - Asia
Indicators To Watch - Bond Yields - Asia
Indicators To Watch - Bond Yields - Asia
Chart II-4Indicators To Watch - Bond Yields - Other Developed
Indicators To Watch - Bond Yields - Other Developed
Indicators To Watch - Bond Yields - Other Developed
Indicators To Watch - Interest Rate Expectations Chart II-5Indicators To Watch - Interest Rate Expectations
Indicators To Watch - Interest Rate Expectations
Indicators To Watch - Interest Rate Expectations
Chart II-6Indicators To Watch - Interest Rate Expectations
Indicators To Watch - Interest Rate Expectations
Indicators To Watch - Interest Rate Expectations
Chart II-7Indicators To Watch - Interest Rate Expectations
Indicators To Watch - Interest Rate Expectations
Indicators To Watch - Interest Rate Expectations
Chart II-8Indicators To Watch - Interest Rate Expectations
Indicators To Watch - Interest Rate Expectations
Indicators To Watch - Interest Rate Expectations
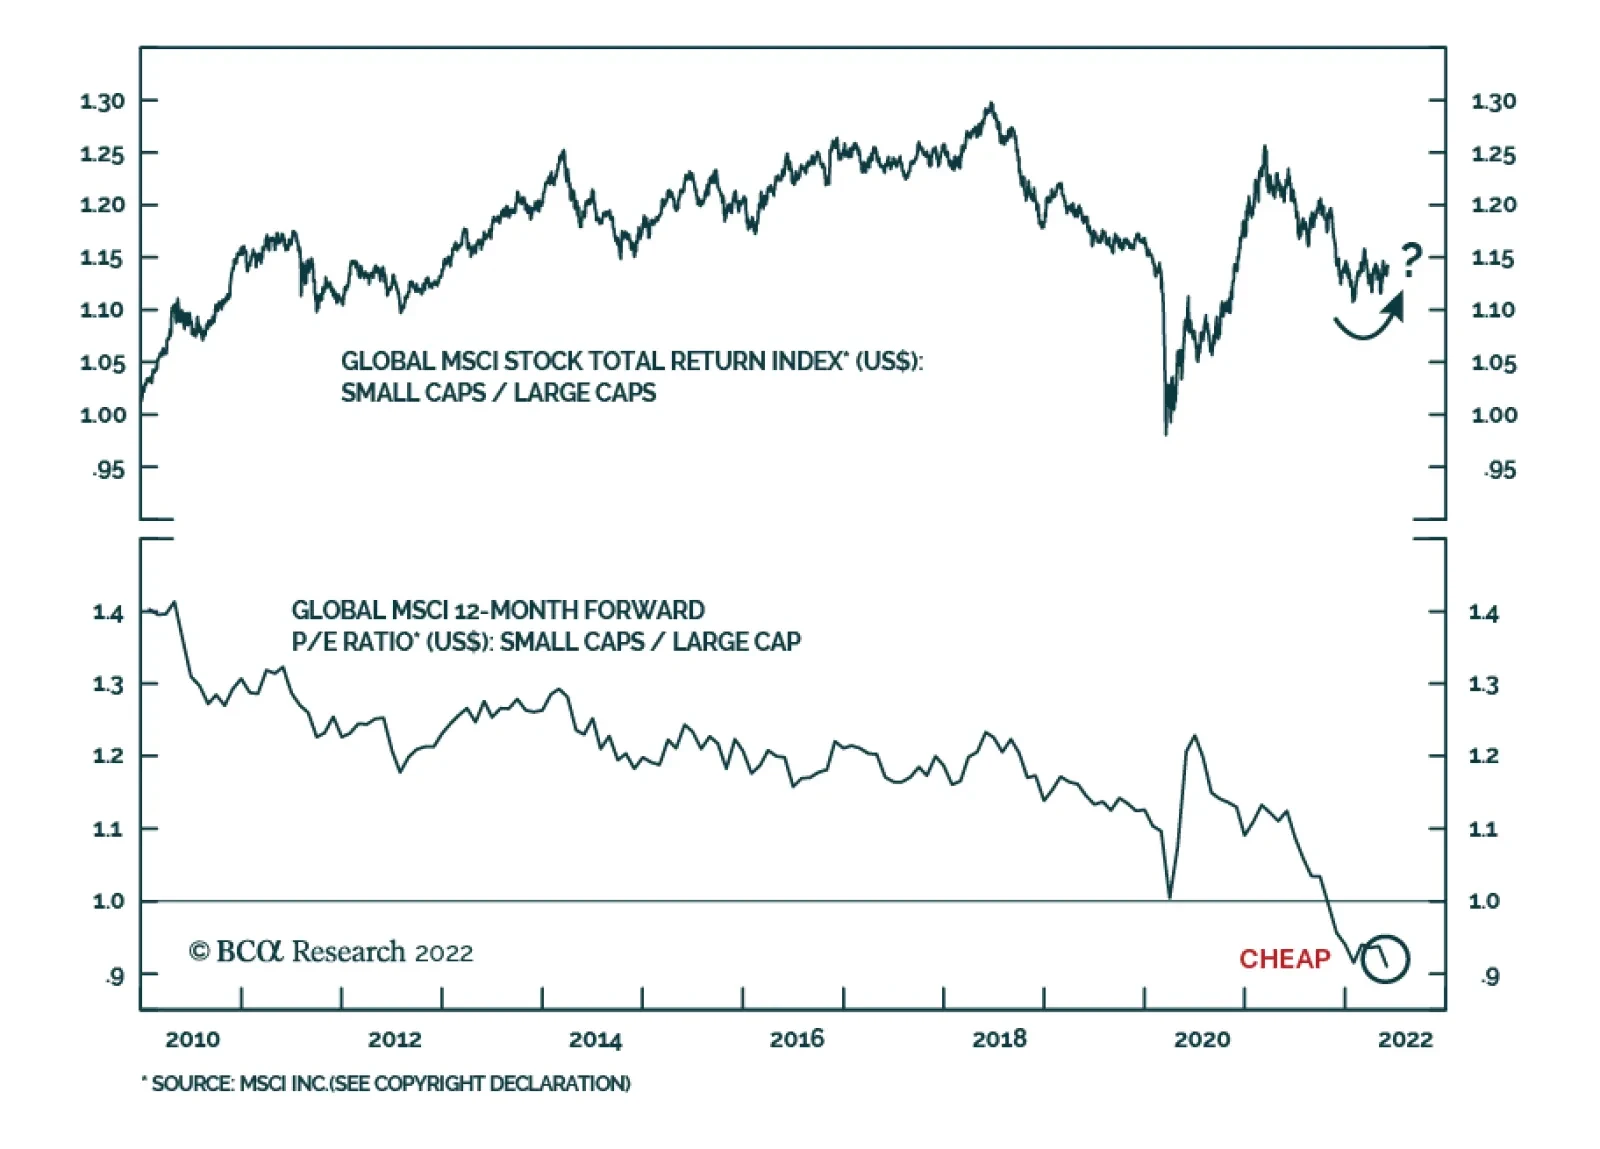
The relative performance of global small cap stocks vis-à-vis their large cap peers has recently stabilized. Both the small cap and large cap MSCI ACWI total return indices are down roughly 12% year-to-date in USD terms. Does this stabilization – which…
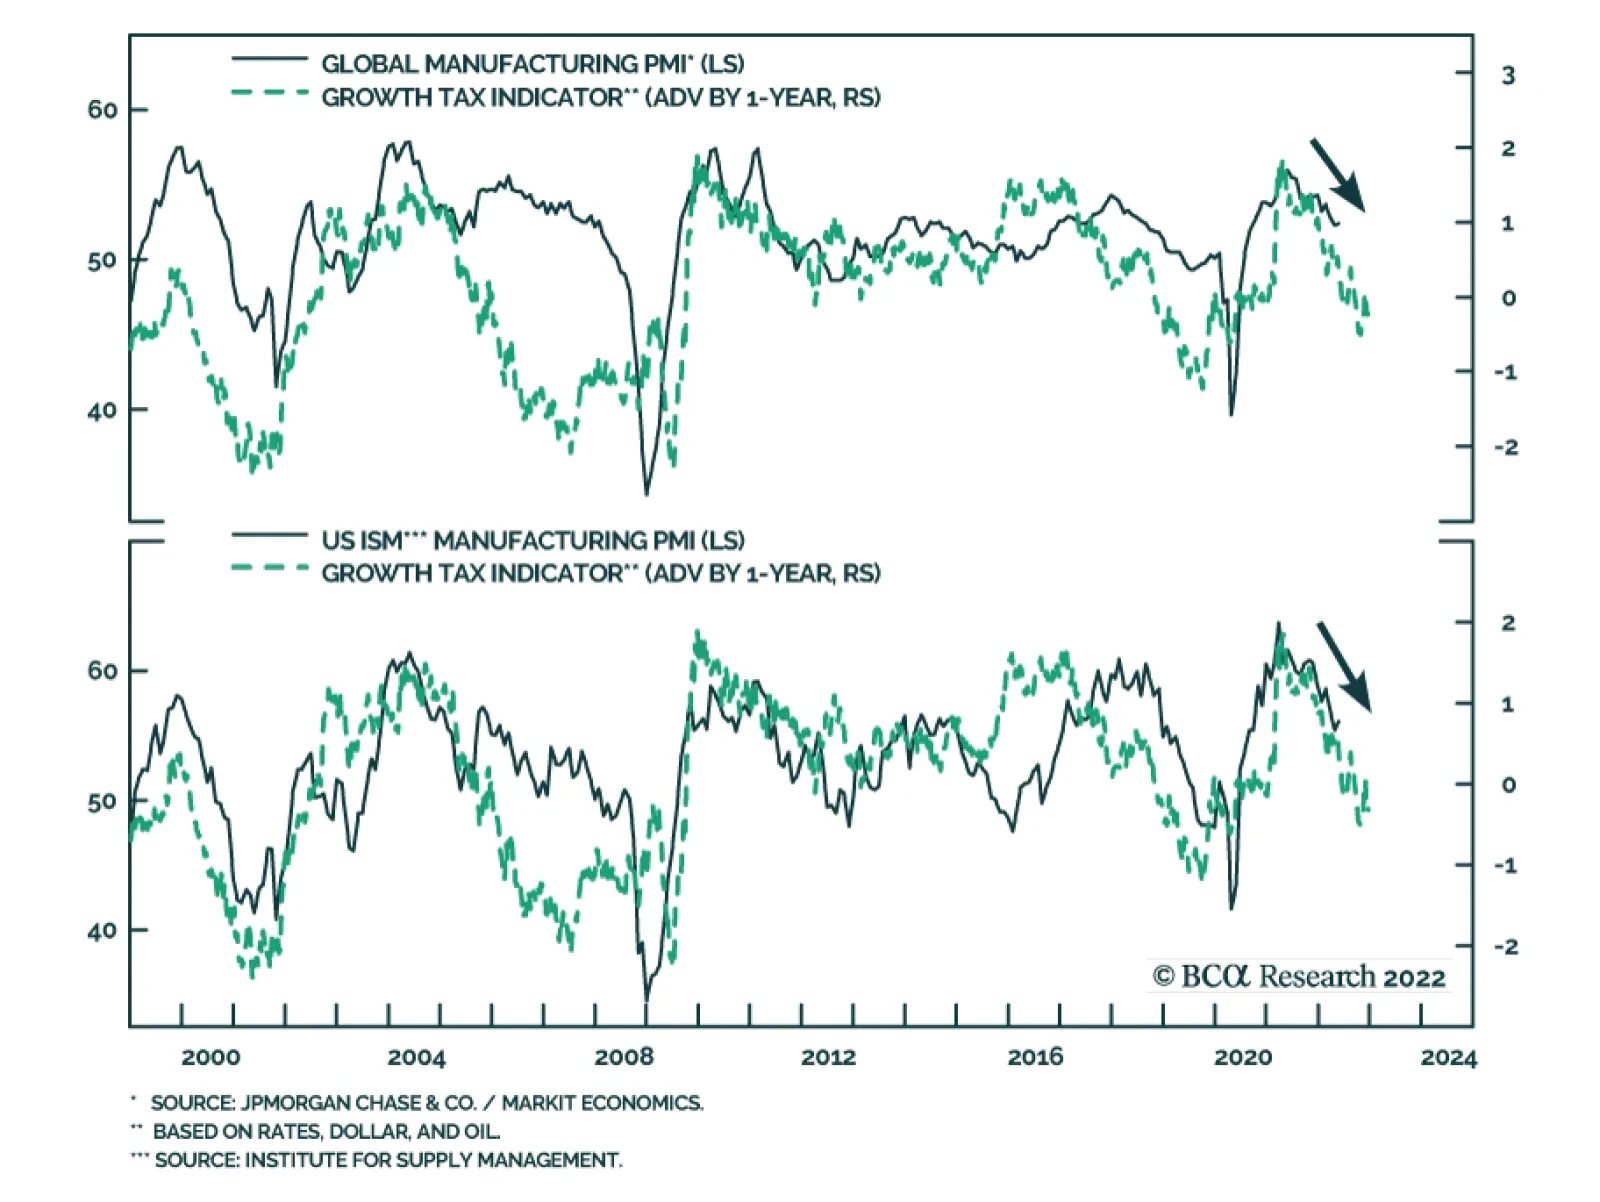
BCA Research’s Growth Tax Indicator continues to send a negative signal for the economic growth outlook. The indicator is constructed to reflect that rising Treasury yields, a flattening yield curve, elevated and increasing oil prices and a strong dollar are…
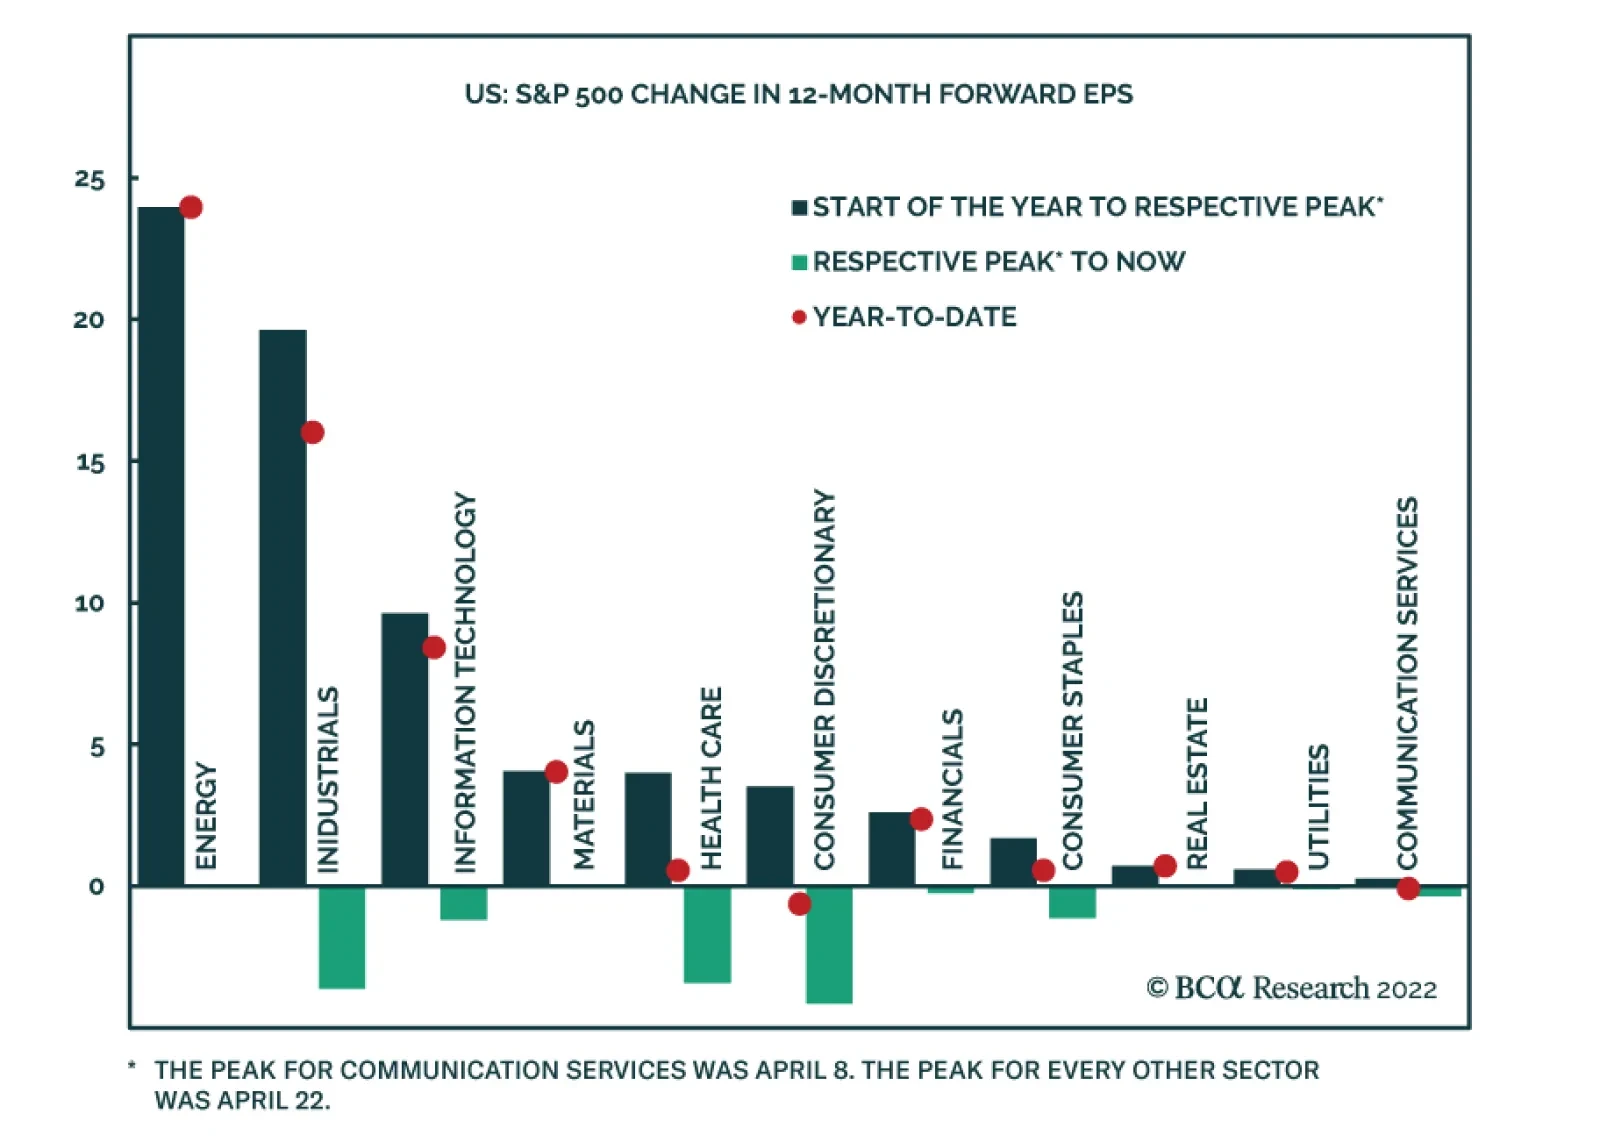
On S&P 500 EPS Downgrades
On…
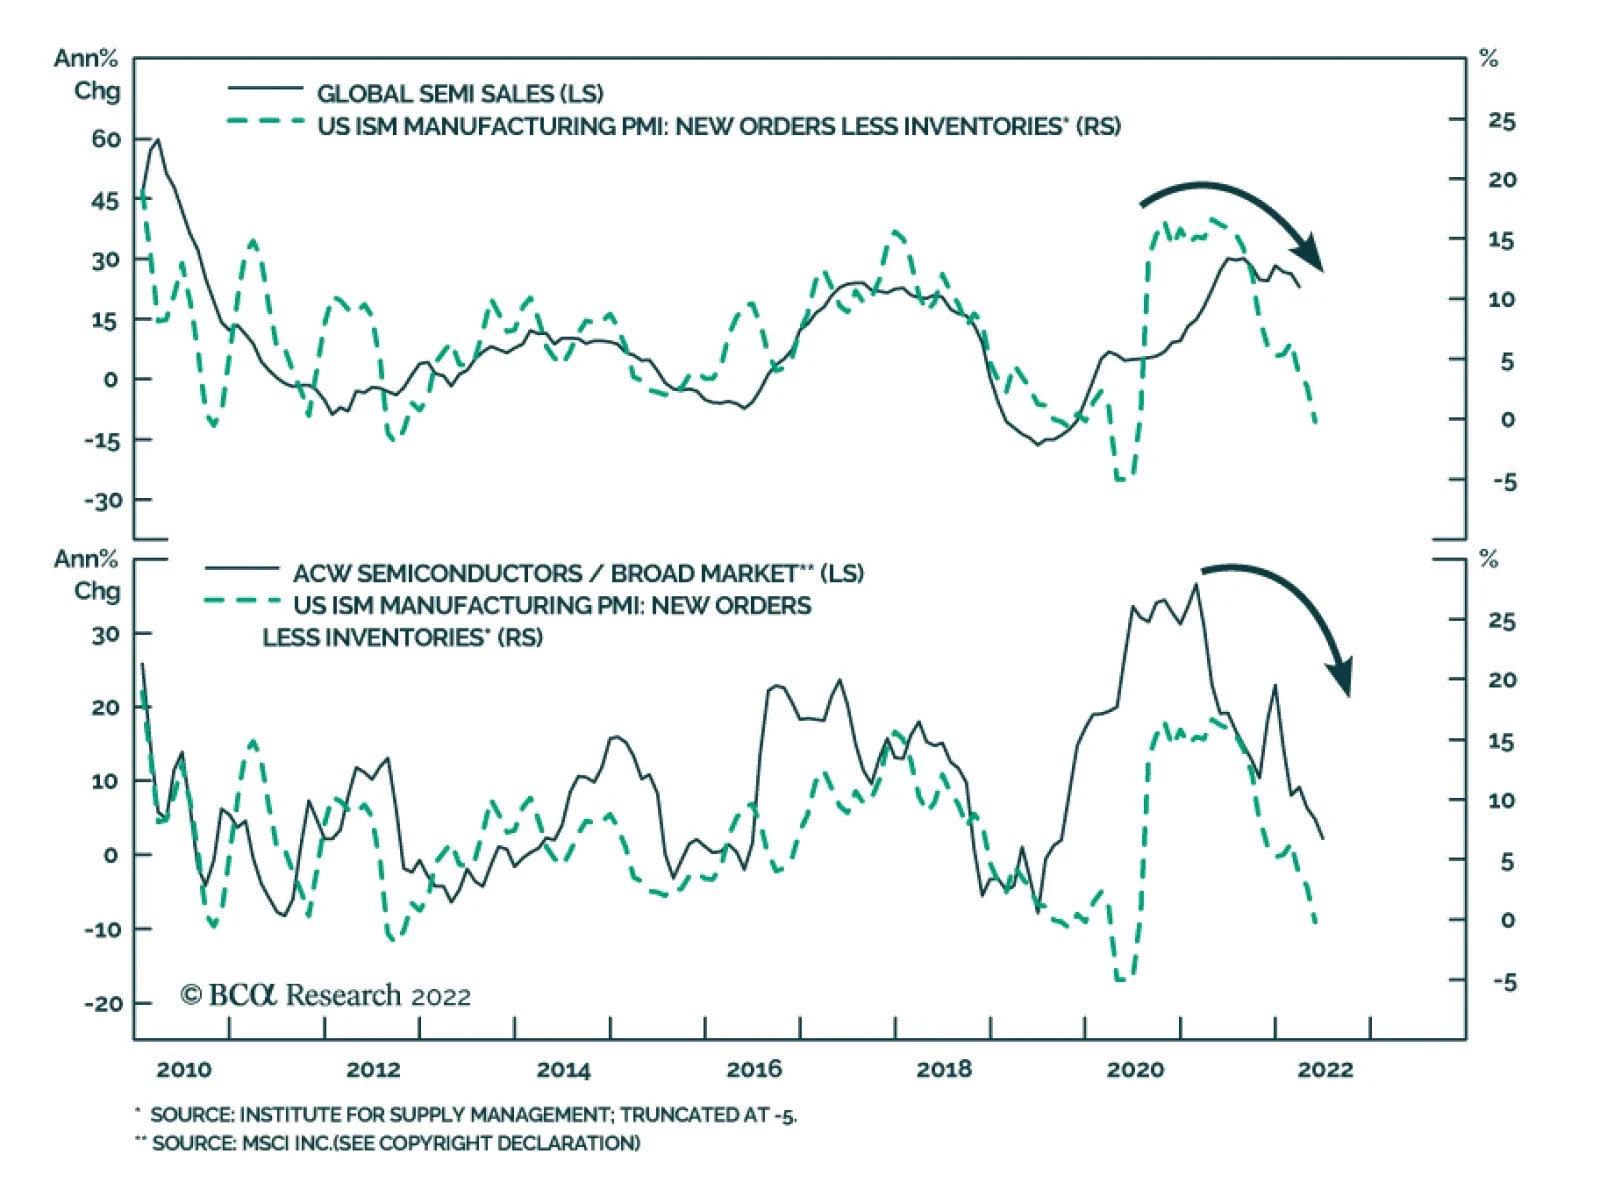
Global semiconductor stocks underperformed the broad market in the year-to-date equity selloff. However, over the past month they are up on both an absolute and relative basis. Have semiconductor stocks bottomed? The rollout of 5G networks, demand for…