Equities

Executive Summary Don’t Try Catching Falling Euros
Don"t Try Catching Falling Euros
Don"t Try Catching Falling Euros
The euro is inexorably moving toward parity. However, many positives could still save EUR/USD, a cheap currency that will benefit if the fears of a global recession recede and if European inflation peaks by the fall. Nonetheless, many fundamental risks still weigh on the euro, including the dollar’s momentum and the continuing ructions in the European energy market. Moreover, technical vulnerabilities are likely to amplify the potential weakness in the euro. There is greater than a 30% chance that EUR/USD will fall to 0.9 or below. As a result, it is preferable to stay on the sidelines and opt for a neutral stance on the EUR/USD. Selling EUR/JPY offers a more attractive reward-to-risk ratio than EUR/USD. The GBP remains under threat. Bottom Line: Don’t be a hero. At this juncture, the EUR/USD outlook remains particularly uncertain. While EUR/USD possesses ample upside over the coming 12 months, there is roughly a 1/3 chance that it will plunge to 0.9 by the winter. Investors should sell EUR/JPY instead. The euro’s race toward parity continues. From May 12 to July 1, EUR/USD attempted to form a triple bottom at 1.0375 that could have marked the end of this year’s decline. Alas, the euro did not hold that floor and now traders are inexorably pushing the common currency lower. The outlook for the euro is complex. At current levels, it is inexpensive and discounts many negative developments affecting both the global and European economies. However, the EUR/USD’s weakness is also a story of dollar strength, and the deteriorating global economic momentum remains the Greenback’s best friend, to the euro’s detriment. For now, we stick to our mantra of the past few months: don’t be a hero. The euro may soon bottom, but enough risks lie ahead that a move below 0.9 against the dollar should not be discarded. The risk-reward from bottom fishing is therefore poor. Instead, investors should sell EUR/JPY, for which downside remains ample. What We Like About The Euro… Despite the pervasive negativity engulfing the euro, there are plenty of positives that will soon help EUR/USD form a bottom. First, the euro is cheap on most metrics. The Purchasing Power Parity (PPP) model developed by BCA’s Foreign Exchange Strategists adjust for the different consumption baskets in the Eurozone and the US. It currently shows that EUR/USD trades 25% below fair value, its deepest discount since 2001. This degree of undervaluation is associated with a high probability of strong long-term returns for the euro (Chart 1). Based on interest rate parity and risk aversion, the euro also trades well below its fair value. Steep discounts are often followed by an imminent rebound in the currency (Chart 2). However, the euro hit a similar discount in January, but failed to rally because of the problems in the energy markets prompted by Russia’s invasion of Ukraine. Chart 1Strong Long-Term Returns based on PPP
Strong Long-Term Returns based on PPP
Strong Long-Term Returns based on PPP
Chart 2Oversold on Many Metrics
Oversold on Many Metrics
Oversold on Many Metrics
Second, the euro is oversold. Both BCA’s Intermediate-Term Technical Indicator and the Citi FX Euro PAIN Index are very depressed, which indicates pervasive negative sentiment toward the euro (Chart 2, bottom two panels). This kind of extremes in momentum are often followed by a euro rally. Chart 3Global Recession Fears Hurt EUR/USD
Global Recession Fears Hurt EUR/USD
Global Recession Fears Hurt EUR/USD
Third, global economic pessimism is widespread. EUR/USD is a pro-cyclical pair, which mostly reflects the counter-cyclicality of the dollar and the great liquidity of the euro. It is therefore not surprising that spikes in global recession concerns are associated with a weakening EUR/USD (Chart 3). The recent wave of depreciation happened contemporaneously with a spike in Google searches for the word “recession.” If these fears, which reached extreme levels, subside further in the months ahead, the euro may benefit greatly. Fourth, pessimism toward China may ease, which would lift the euro in the process. Last week, it was announced that Beijing is considering allowing local governments to sell RMB1.5 trillion of special government bonds in the second half of the year to fund infrastructure spending. The news caused a rebound in the AUD, Brazilian assets, and copper. Europe too would benefit from greater activity in China. Chart 4Chinese Salvation?
Chinese Salvation?
Chinese Salvation?
Chinese monetary conditions are also easing, which historically supports industrial activity in Europe relative to the US (Chart 4, top panel). The change in approach in the implementation of the zero-COVID policy is helping Chinese PMIs rebound, which will eventually translate into higher European shipments to China. Moreover, the rate of change of the performance of real estate stocks relative to the broad market has turned the corner, which may facilitate a stabilization of Chinese real estate transactions (Chart 4, second panel). Ultimately, the expanding excess reserves in the Chinese banking system point toward a stabilization of the performance of EUR/USD later this year (Chart 4, bottom panel). Fifth, our expectation that European inflation will peak by the autumn will prove the greatest help to the euro. The EUR/USD’s weakness over the past twelve months has coincided with a surge in European inflation surprises (Chart 5, top panel). This relationship reflects the negative impact on European real rates of both stronger realized and expected inflation (Chart 5, second panel). Investors understand that Europe’s inflation crisis is driven by a relative price shock in the energy market that greatly hurts economic activity in the Eurozone. Hence, even if they expect the ECB to increase interest rates, they believe policy rates will lag inflation because of Europe’s poor growth outlook. This is particularly true when compared to the US Fed. As a result, European real rates continue to lag far behind US ones and the European yield curve is steeper than that of the US, because traders foresee easier policy on the Eastern shores of the Atlantic (Chart 5, panel three and four). Chart 5Inflation Hurts the Euro
Inflation Hurts the Euro
Inflation Hurts the Euro
Chart 6Declining Inflation Expectations? Declining Inflation Expectations?
Declining Inflation Expectations? Declining Inflation Expectations?
Declining Inflation Expectations? Declining Inflation Expectations?
This situation is fluid and inflation expectations have begun to decrease. The recent easing in energy prices has contributed to a decline in long-term inflation expectations (Chart 6). We argued last week that the energy inflation is arithmetically set to decrease over the coming twelve months, which suggests further downside in inflation expectations is likely. Moreover, four of the five largest weights in the Eurozone HICP are running hot, but all are linked to commodity inflation, which confirms our bias that European inflation will soon peak (Chart 7). A top in both headline and core inflation will drag short- and long-term inflation expectations lower, which will help European real rates (Chart 8). Meanwhile, lower imported energy inflation will limit the damage to European economic activity, allowing the ECB to increase rates anyway. Chart 7Key HICP Components
Key HICP Components
Key HICP Components
Chart 8A durable Decline In Expected Inflation Depends On Realized Inflation
A durable Decline In Expected Inflation Depends On Realized Inflation
A durable Decline In Expected Inflation Depends On Realized Inflation
Chart 9Balance Of Payment Support
Balance Of Payment Support
Balance Of Payment Support
Bottom Line: The euro benefits from important tailwinds that suggest EUR/USD will be higher 12 to 18 months from now. It is cheap and oversold and the pervasive gloom among investors about the state of the global economy indicates that many negatives are already embedded in its pricing. Moreover, the Chinese economy could stabilize in the second half of 2022 and into 2023, which will hurt the dollar and boost the euro. Crucially, a peak in European inflation will allow European real rates to recover and curtail the handicap keeping EUR/USD under pressure, especially as the basic balance of payment remains in the euro’s favor (Chart 9). … And What We Don’t EUR/USD may benefit from some important tailwinds, but it is still burdened by massive handicaps. The first problem that will place downward pressure on the euro is that its weakness is not unique and that it reflects broad-based dollar strength (Chart 10). This is a problem for the euro because the dollar (and the yen) is the foremost momentum currency in the G10. Its strength begets further strength, and the momentum signal from moving average crossovers remains dollar-bullish. This headwind for the euro could even intensify in the coming months. JP Morgan EM FX Index is breaking down to new lows, which points to further tightening in EM financial conditions. Historically, tighter EM FCIs translate in both weaker Eurozone stock prices and a weaker EUR/USD, which reflects the closer link between the Euro Area and EM economies than between the US and EM (Chart 11). Chart 10The Dollar's Strength Is Broad-Based
The Dollar's Strength Is Broad-Based
The Dollar's Strength Is Broad-Based
Chart 11More Trouble In Store
More Trouble In Store
More Trouble In Store
This phenomenon is exacerbated by the underlying weakness in global economic activity. Arthur Budaghyan, BCA’s EM Chief Strategist, often reminds us that Asian exports remain soft. Additionally, the deterioration in US economic activity is likely to continue, as suggested by the weakness in the ISM new orders-to-inventories ratio and by the poor readings from the Regional Fed Surveys. Slowing US growth will generate a further decline in the business-sales-to-inventory ratio, which often coincides in a strong dollar and a weak euro. Chart 12Past Chinese Weaknesses Linger
Past Chinese Weaknesses Linger
Past Chinese Weaknesses Linger
The second problem for EUR/USD is that China’s economic outlook may be improving in the future, but, for now, the impact of the recent Chinese slowdown continues to hamper Europe. More specifically, the recent decline in Chinese import volumes is consistent with a euro-bearish backdrop for the remainder of this year (Chart 12, top panel). In fact, even if the CNY remains stable against the USD, this does not guarantee a positive outcome for the euro as the past weakness in Chinese import volumes is also consistent with a depreciating EUR/CNY (Chart 12, bottom panel) The third euro-negative force is the natural gas market. As we showed last week, Dutch natural gas prices must settle between EUR500-600/MWh this upcoming winter to have the same inflationary impact as they did over the past 18 months. This is unlikely to happen, even according to the direst forecasts of BCA’s Commodity and Energy strategists. However, there is a greater than 30% chance that Europe must ration electricity this winter, which would cause a violent output contraction. As a result, any fluctuation in natural gas flows in Europe will cause the market-based odds of a European recession to swing widely. Consequently, the negative correlation between EUR/USD and TTF prices observed over the past twelve months is likely to remain intact (Chart 13). Related Report European Investment StrategyQuestions From The Road The fourth issue hurting the euro is the US’s comparative isolation from the energy market’s travails. The US is a haven of relative economic stability today. Yes, its growth will slow further, but it is nonetheless set to outperform the Eurozone. The US is not under threat of rationing energy this winter. Moreover, the US terms of trades benefit from rising energy prices, unlike Europe (Chart 14). Furthermore, the US output gap is closing faster than that of in the Eurozone (Chart 14, bottom panel). As a result, the odds of dovish surprises by the ECB are much greater than those by the Fed. Chart 13Neutral Gas Is Still A Drag
Neutral Gas Is Still A Drag
Neutral Gas Is Still A Drag
Chart 14The US As A Haven Of Stability
The US As A Haven Of Stability
The US As A Haven Of Stability
The US’s relative resilience might also impact equity flows over the next few months in a euro-bearish fashion. US EPS have been stable relative to Euro Area ones, even in local currency terms. Interestingly, because relative EPS reflect broader economic forces, EUR/USD follows them (Chart 15). Thus, if the European economic outlook deteriorates further relative to that of the US, chances are high that Eurozone EPS estimates will be revised down relative to the US, which will coincide with a lower EUR/USD. In fact, the recent underperformance of Eurozone small-cap stocks (which are domestically focused) relative to European large-cap equities (which derive a greater proportion of their sales abroad) and US small-cap shares also confirms the worsening relative economic outlook between Europe and the US, and thus portend significant near-term risks to EUR/USD (Chart 16). Chart 15Follow Earnings Estimates
Follow Earnings Estimates
Follow Earnings Estimates
Chart 16Small Caps Indicate More EUR Selling
Small Caps Indicate More EUR Selling
Small Caps Indicate More EUR Selling
Chart 17An ECB Bungle Would Burden The Euro
An ECB Bungle Would Burden The Euro
An ECB Bungle Would Burden The Euro
The last major fundamental risk weighing on EUR/USD is the significant probability that the ECB will disappoint markets with respect to its anti-fragmentation tool to be announced in July. Investor expectations are lofty. However, internal divisions within the ECB Governing Council remain, and, most importantly, the ECB is hamstrung by previous ECJ and German Constitutional Court rulings on bond purchases. Thus, our base case remains that the development of an appropriate bond purchase program will be an iterative process resulting from a back-and-forth between market tensions and ECB responses. As a result, there are risks of further widening in Italian spreads as well as European corporate bond spreads. These developments would further hurt the euro (Chart 17). Chart 18Much Selling To Be Unleashed Sentiment Could Get More Negative
Much Selling To Be Unleashed Sentiment Could Get More Negative
Much Selling To Be Unleashed Sentiment Could Get More Negative
These fundamental problems with EUR/USD do not guarantee that the euro will punch below parity. After all, there are also plenty of positives with this currency. However, the risk of a violent selloff is elevated, at around 30%, because of underlying technical vulnerabilities. Global market liquidity has deteriorated in recent years, and this phenomenon is also impacting FX markets, resulting in sudden jumps being more frequent. Most crucially, the odds are high that automatic selling will be triggered if the euro tests parity, which would result in a cascading decline for a euro entering territory that has not been charted for the past 20 years. Specifically, speculators are marginally short the euro (Chart 18, top panel) and 1-month and 3-month risk reversals in the option markets are not yet at a capitulation point (Chart 18, bottom panel). Thus, if panic sets in, the euro could easily fall below 0.9, where the strongest supports lie. In essence, we worry that a sudden crash in the euro is becoming a growing threat. Bottom Line: The combination of the dollar’s momentum, the lagging impact of China’s economic woes, the risks to Europe’s energy supplies, the relative stability of the US economy, and the heightened chance that the ECB underdelivers with respect to its anti-fragmentation tool later next week all point to significant risks to the euro in the coming months. Moreover, the technical vulnerabilities present in the FX market suggest that, if further downside takes place, it will not only be large but also rapid. Investment Conclusions The dilemma between views and strategy is greatest with the euro today. There are many positives highlighted in this report that suggest that the euro has upside on a 12-month basis. However, the risks are abundant, and the potential downside in the coming six months not only carries a large probability, it is also likely to be pronounced if it takes place. As a result of this configuration, we fall back to the strategy we had adopted for European equities earlier this year: don’t be a hero. Even if the euro bottoms tomorrow, the risks are such that capital preservation remains paramount. Consequently, we recommend that investors stay on the sideline and maintain a neutral stance on EUR/USD. It is just as risky to try to bottom fish this pair as it is to chase it lower from current levels. Chart 19Sell EUR/JPY
Sell EUR/JPY
Sell EUR/JPY
Instead, we follow BCA’s Foreign Exchange Strategists recommendation to go short EUR/JPY as a bet with a lower risk-reward ratio. Global recession worries and weakening commodity inflation are likely to allow for greater downside in global yields, which often results in a lower EUR/JPY (Chart 19). Additionally, investors do not expect much out of the BoJ this year, but if recession risks intensify in Europe because of energy rationing this winter, there is room to curtail the interest rate pricing for the ECB embedded in the €STR curve. Furthermore, the JPY is the cheapest currency in the G10. Finally, investors wanting to build greater exposure to European currencies should do so via the Swiss franc. We argued three weeks ago that the CHF enjoys significant structural tailwinds because of the Swiss economy’s strong productivity. Additionally, the SNB is no longer intervening to limit the CHF upside, as demonstrated by the decline in its current deposits. Instead, a stronger Swiss franc is the most potent weapon in the SNB’s arsenal to combat inflation. Moreover, the CHF offers a hedge against both recession risks in the Eurozone and further widening in European spreads. Bottom Line: Don’t be a hero. EUR/USD’s outlook is uniquely uncertain now. While many factors point to positive returns on a 12-to-18 month basis, if the euro hits parity in response to the many clouds still hanging over Europe, technical factors could plunge this currency to EUR/USD 0.9 into a steep decline. Instead, the clearer call is to sell EUR/JPY. Investors who want to assume a European FX exposure today should do so through the Swiss franc, not the euro. A Few Words On The UK Last week, Prime Minister Boris Johnson resigned. The initial response of the pound was to rebound. This reaction should fade. BCA Geopolitical strategists argue that, even though the person sitting at 10 Downing Street is about to change, the fundamental problems with the UK remain the same. The Labour Party is ascending, but it will still have to deal with the Brexit aftermath, rising populism, and popular discontent across the country. The economy is still fragile and engulfed in an inflationary spiral. Meanwhile, the risks created by a looming Scottish independence referendum are much more significant than was the case in 2014. As a result, the pound is likely to remain under stress over the coming quarters. Mathieu Savary, Chief European Strategist Mathieu@bcaresearch.com Tactical Recommendations Cyclical Recommendations Structural Recommendations
Executive Summary Economic growth is decelerating and recession talk is unavoidable, but the data series the business cycle dating committee tracks suggest the expansion is still alive and kicking. Despite unacceptably high inflation readings and a wildly swinging near-term outlook, intermediate- and long-term inflation expectations have remained well anchored all year. Market-based measures have been remarkably well behaved and the preliminary reading from the University of Michigan consumer survey that spooked the Fed was revised down to a more comfortable level. The FOMC minutes for June left no doubt that the committee is prepared to accept a recession as the price of subduing inflation, but markets already discounted that in their June swoon. The swiftness with which financial conditions have tightened in response to the beginning of the Fed’s rate-hiking campaign is unprecedented. It may have the effect of reducing the lag between FOMC actions and economic impacts while front-loading the pain from the inevitable slowdown. It Won't Be Easy To Get Worse
It Won't Be Easy To Get Worse
It Won't Be Easy To Get Worse
Bottom Line: The domestic economic backdrop is challenging and international uncertainties could make things worse, but a severe recession and bear market are not inevitable. The consensus is underestimating the potential for upside surprises that could lead equities to outperform fixed income and cash over the next three-to-twelve months. Feature Feed a cold, starve a fever is a simple prescription with an obvious read-through for monetary policymakers. If growth is sluggish, a central bank can stimulate its economy by lowering interest rates to encourage consumption and investment. If the economy is overheating, it can raise interest rates to cool household and business spending and dial back activity to a more sustainable level. Related Report US Investment StrategyA Difference Of Opinion Things get hairy when it’s a sluggish economy that needs to be slowed. The specter of stagflation – stagnant growth and high inflation – has been haunting financial markets as consumer prices have increased by at least 7% year-over-year every month since December amidst a clear deceleration in growth. Economic activity contracted in the first quarter, in terms of real GDP, and the Atlanta Fed’s GDPNow model projects that it did so again in the second quarter. According to the definition every introductory economics student learns, two consecutive quarters of contraction make a recession. Financial markets are a forward discounting mechanism and stocks’ and bonds’ ugly first-half performances may have foreshadowed the expansion's demise. We suspect the immediate future might not be as bad as financial market performance would imply, though we acknowledge that the risks to our comparatively constructive view have risen. We do not think that everything is hunky-dory; as we’ve previously noted, inflation will likely ease to 4% of its own accord, but getting it back down to the 2% target will require the Fed to squash the economy. That will bring about the definitive end to the expansion and risk assets’ extended romp. Our best guess is that the policy day of reckoning will not become apparent until 2024 and that the S&P 500 can recover a meaningful amount of ground between now and next July. We therefore remain overweight equities over the twelve-month cyclical timeframe, in contrast to the neutral house view. Recession Already? Probably Not Chart 1The Expansion Looks Sound
The Expansion Looks Sound
The Expansion Looks Sound
Despite the Econ 101 rule of thumb, business cycles are defined by the National Bureau of Economic Research’s Business Cycle Dating Committee, not the ups and downs of real GDP. The committee considers a broad range of activity measures when determining economic peaks and troughs, with employment (Chart 1, top panel), income and consumption (Chart 1, second panel), industrial production (Chart 1, third panel) and real manufacturing and trade sales (Chart 1, bottom panel) drawing particular attention. Those series do not warn of a recession now, and neither does still-positive real final domestic demand growth (Chart 2), which backs inventory adjustments and net exports out of GDP to provide a better read on the domestic economy. Per its dual mandate, the Fed is charged with maintaining price stability and full employment. Now that inflation is unacceptably high and growth is slowing, several clients have remarked on the incompatibility of the individual mandates. The Fed can choose price stability and kill the economy, a la Volcker in the early eighties, or it can protect employment at the cost of inflation. We have limited faith in central bankers’ ability to fine-tune economic outcomes with the blunt tools at their disposal, but there is room for the labor market to cool without denting the economy too terribly. Chair Powell has cited the ratio of job openings to unemployed workers as a metric that’s well beyond full-employment levels and has mused that it might offer an avenue for the Fed to engineer a soft landing. It eased a bit in May, as per the JOLTS job openings data released last week, and the labor market would presumably remain robust if it fell to a level at or around 1 (Chart 3). Getting the ratio to settle in the desired range is easier said than done, of course, but if a meaningful share of the working-age Americans who remain AWOL come back to the work force, it will be possible for payrolls to continue to expand even as the unemployment rate rises to the Fed’s estimated long-run full employment level of 4.1%. Chart 2Real Final Domestic Demand Is Still Growing
Real Final Domestic Demand Is Still Growing
Real Final Domestic Demand Is Still Growing
Chart 3The Job Market Can Cool Without Shrinking
The Job Market Can Cool Without Shrinking
The Job Market Can Cool Without Shrinking
Inflation Expectations Remain Contained We view longer-run inflation expectations as an important driver of economic participants’ actions. If households, businesses and investors expect that inflation will not be an issue over the long run, they will not alter their behavior to protect themselves from it. If they begin to believe that high inflation will linger for an extended period, they will take actions that serve to entrench it. The evolution of long-run inflation expectations, then, can provide advance warning that a vicious circle in which high prices beget higher prices is brewing. They also offer insight into the course of monetary policy. Chair Powell regularly cites inflation expectations as an important driver of the Fed’s actions, and the prospect that inflation expectations could become unanchored would prompt Volcker-like moves that would surely throttle financial markets and the economy. Powell explicitly cited the 3.3% preliminary long-run inflation expectation reading from the University of Michigan consumer sentiment survey as a catalyst for the FOMC’s eleventh-hour decision to hike the fed funds rate by 75 basis points in June. The final reading was revised down to a less noteworthy 3.1%, but the episode showed that the Fed responds to any suggestion that inflation expectations are at risk of breaking out. We monitor the CPI swaps market, and the TIPS and nominal Treasury markets, to get a read on investors’ and businesses’ intermediate- and long-term inflation expectations. Despite wild swings in 2-year expectations, which made a run at 5% in late March before setting (Chart 4, top panel) or approaching (Chart 5, top panel) new 2022 lows last week, 3-to-5- and 6-to-10-year expectations have been remarkably well behaved. TIPS break-evens imply intermediate- (Chart 4, middle panel) and long-term (Chart 4, bottom panel) inflation expectations that are 20 basis points (bps) below the 2.3-2.5% range consistent with the Fed’s 2% inflation target. Intermediate- and long-term expectations derived from the CPI swaps curve sit about 30 bps higher, but their path has been similar, with the former making a new year-to-date low last week (Chart 5, middle panel) and the latter nearing one (Chart 5, middle panel). Chart 4Investors' Longer-Run Expectations Remain Well-Anchored, ...
Investors' Longer-Run Expectations Remain Well-Anchored, ...
Investors' Longer-Run Expectations Remain Well-Anchored, ...
Chart 5... And Businesses' Do, Too
... And Businesses' Do, Too
... And Businesses' Do, Too
The bottom line is that investors and the Fed should take some comfort from how well anchored inflation expectations have remained all year. They will not remain that way indefinitely if real-time inflation does not head convincingly lower soon, but apparently no longer-run damage has been done yet. For all the things that have turned out worse than expected this year, longer-run inflation expectations have been a meaningfully positive surprise. The Fed’s Next Moves Chart 6Act On The Rumor, Ignore The News
Act On The Rumor, Ignore The News
Act On The Rumor, Ignore The News
While watching Chair Powell’s press conference following the June FOMC meeting, we were struck by how doggedly he stuck to the theme that price stability was the committee’s foremost concern. In a performance that must have warmed the heart of anyone who’s ever worked as a behind-the-scenes aide, he unwaveringly hammered the primary talking point he’d been coached to hit. Last week’s release of the June meeting’s minutes revealed that he was speaking for the full committee when he emphasized that nothing could dissuade it from restoring inflation to its target level. Though FOMC members’ hawkish/dovish leanings occupy a broad spectrum, the minutes painted a picture of a committee unified by its concern about inflation. Although the minutes made it clear that the committee is willing to sacrifice growth to gain control over inflation, and media coverage trumpeted that theme, they didn’t tell us anything new. They may have been a bit outdated, now that the Michigan survey’s final inflation expectations turned out not to be a big deal, and subsequent price action in real and financial asset markets suggest inflation pressures are easing, but markets already discounted the consequences of the Fed’s hawkish pivot when the committee let it be known that it was considering a 75-bps hike. The S&P 500 fell 12% in just seven sessions, culminating in its year-to-date closing low the day after the meeting concluded, 23.5% below its all-time closing high set at the beginning of January (Chart 6, top panel). Treasuries had embarked on a wild ride ahead of the meeting, as well, with the 10-year yield rising 45 bps in three sessions to 3.49% on the first day of the two-day meeting before bottoming for the time being at 2.82% last week (Chart 6, bottom panel). The minutes underlined members’ understanding of the tradeoff involved in crushing inflation and their resolve to enter into it. “Most [participants] agreed that risks to inflation were skewed to the upside … [while assessing] that the risks to … growth were skewed to the downside.” Despite the stagflation risks, “[p]articipants concurred that the economic outlook warranted moving to a restrictive stance of policy, and they recognized the possibility that an even more restrictive stance could be appropriate if elevated inflation pressures were to persist.” We have no doubt that the Fed will induce a recession if it proceeds along the course it has charted, but that doesn’t mean that it will be a severe one, or that it will begin imminently, leaving room for equities and credit to rally in the interim. About That Monetary Policy Lag Chart 7It's Hard To Keep Missing A Progressively Lower Target
It's Hard To Keep Missing A Progressively Lower Target
It's Hard To Keep Missing A Progressively Lower Target
Our contention that risk assets have a path to rally over the next twelve months underpins our recommendation to overweight equities within a multi-asset portfolio over that timeframe. We are not saying that skies are blue and everything is great; we simply think that the gloom has gone too far and the equity selloff is overdone. As the saying goes, more money is made owning stocks from terrible to bad than it is from good to great. Judging by the economic surprise index, the bar for getting more terrible has been set pretty high (Chart 7). The unprecedentedly rapid tightening of financial conditions at the outset of a rate-hiking campaign also raises questions. It is widely assumed that Fed actions take around twelve months to filter their way through the economy. While the prime rate moves higher immediately after the FOMC meeting, rates impacting households can be slow to reset, and it typically takes some time to reverse spending and investing momentum. If households and businesses foresee an extended series of rate hikes, the first ones may be stimulative in the near term as they line up to deploy their consumption and investment capital while they can obtain it on relatively favorable terms. Chart 8No Lag This Time
No Lag This Time
No Lag This Time
Financial conditions do not typically become maximally tight until a couple of years after the Fed completes its rate hike campaigns (Chart 8). The swiftness with which financial conditions have tightened this time has us wondering if they have already reached peak tightness or are about to do so. If activity troughs around the time the financial conditions index peaks, is it possible that the worst of the downturn isn’t far away? The conditions that have attended this cycle are unique, and all we can say for sure is that Treasury yields, corporate bond spreads, equity indexes and the dollar have combined to tighten financial conditions to the tune of about two-and-a-half percentage points of real GDP1 solely on anticipation. Financial markets’ proactive moves may have been hasty. We are closely monitoring the ongoing flow of data to determine if it will vindicate or discredit our thesis, but we remain more open to positive surprises than the consensus. Doug Peta, CFA Chief US Investment Strategist dougp@bcaresearch.com Footnotes 1 Goldman Sachs’ Financial Conditions Index is calibrated such that a one-point move in the index is meant to be equivalent to a one-percentage-point move in real GDP.
Dear client, In lieu of July 18 publication, I will be hosting our quarterly webcast that I invite you to join. Our regular weekly publication will resume Monday, July 25. Kind Regards, Irene Tunkel Chief Strategist, US Equity Strategy Deploy Fresh Capital Into Growth At The Expense Of Value In early June, we closed our Growth/Value underweight by moving the ratio to benchmark allocation and crystallizing just under 9% in gains. At the time, we also wrote that we would upgrade Growth and downgrade Value once uncertainty about inflation and the Fed’s action recedes. Today, we believe that the time is ripe for making a move: We are upgrading Growth to overweight, and downgrade Value to underweight. The following are the reasons for a change in positioning: Chart 1Deploy Fresh Capital Into Growth At The Expense Of Value
Deploy Fresh Capital Into Growth At The Expense Of Value
Deploy Fresh Capital Into Growth At The Expense Of Value
Inflationary pressures will ease: There are early signs that inflation is about to turn - prices of energy and commodities are down 20% and 13% off their peaks respectively. A turn in inflation heralds a change in market leadership from Value to Quality and Growth (Chart 1). Chart 2
Deploy Fresh Capital Into Growth At The Expense Of Value
Deploy Fresh Capital Into Growth At The Expense Of Value
Economic growth is slowing: The market focus has shifted away from inflation and has turned towards worries about growth as is evident in the falling 10-year Treasury yield, which decreased from its peak at 3.5% to 3.0% over the past couple of weeks. The environment of slowing growth and falling rates is a tailwind for growth stocks. In a world where growth is becoming scarcer, companies that can deliver growth will shine. These are “growth” companies, i.e., large, stable companies with strong balance sheets that are able to generate positive cash flow and churn out strong earnings even under economic duress. Quality growth outperforms during slowdowns (Chart 2). Earnings Growth Expectations: Analysts expect earnings of Value to grow by over 10% over the next twelve months and Growth by 8.0%. While earnings growth expectations for value stocks appear more attractive, we believe that they will be downgraded. Value stocks are dominated by cyclicals (Chart 3), and as we wrote in the Tuesday's publication, this is the area of the market in which analysts have the least certainty in their estimates and downgrades are imminent. Growth is oversold relative to Value: The Growth/Value ratio is extremely oversold sitting at a level exceeded only during the dot-com crash and on par with the 1970-1980 inflationary era (Chart 4). Chart 3
Deploy Fresh Capital Into Growth At The Expense Of Value
Deploy Fresh Capital Into Growth At The Expense Of Value
Chart 4
Deploy Fresh Capital Into Growth At The Expense Of Value
Deploy Fresh Capital Into Growth At The Expense Of Value
Bottom Line: Slowing growth, impending turn in inflation, and attractive technicals are key reasons for our upgrade of Growth to overweight at the expense of Value.
While BCA Research’s Emerging Markets Strategy service is not entirely convinced that US tech stocks are a bubble waiting to burst, they view the odds of this happening as nontrivial. There are a lot of similarities between dynamics prevailing in US tech…
Emerging market equities have been outperforming their global peers over the past few months – marking a reversal in trend from their relative underperformance since February 2021. However, we doubt that this shift in leadership is sustainable. First, the…
Executive Summary Global risk assets are oversold, and investor sentiment is downbeat. In this context, a technical equity rebound cannot be ruled out. However, we do not think it will be the beginning of a major cyclical rally. The Fed and the stock market remain on a collision course. An equity rally and easing financial conditions would make the Fed even more resolute to continue hiking interest rates. There are many similarities between dynamics that prevailed in US tech stocks and in previous bubbles. While it is not our baseline view, the odds of a protracted bear market are nontrivial. Resource prices and commodity plays have more downside. The History Of Financial Bubbles: Is This Time Different?
On A Bull Case, Bubbles And Commodity Prices
On A Bull Case, Bubbles And Commodity Prices
Bottom Line: The decline in commodity prices and the relentless US dollar rally will ensure that EM currencies, bonds and stocks continue to sell off even if the US equity market rebounds in the near term. Feature Among the most frequently discussed topics in recent client calls are the upside and downside risks to our baseline view. We elaborate on these risks in this report. To recap, our baseline view is as follows: EM and DM stocks have another 15% downside in USD terms, the US dollar will continue overshooting and commodity prices will fall. Global yields are topping out, and the US yield curve will soon invert. Hence, defensive positioning for absolute-return investors is still warranted, and global equity and fixed-income portfolios should continue to underweight EM. The rationale is that US and EU demand for goods ex-autos, and hence global trade, is about to contract while the Fed is straightjacketed by high and broad-based inflation. China’s economy will be struggling to recover. In EM ex-China, domestic demand will relapse. Chart 1Will The S&P 500's Technical Support Hold?
Will The S&P 500's Technical Support Hold?
Will The S&P 500's Technical Support Hold?
If one believes that the US equity bull market that began in 2009 is still alive (i.e. the March 2020 selloff is a short-lived red herring), odds are that the S&P 500 drawdown is over. The reasoning is that the S&P 500 is already down 23% from its 2021 peak, on par with the selloffs that occurred in 2011, 2015-16 and 2018 (Chart 1). However, if one believes that the structural bull market is over, the magnitude of the current equity selloff is likely to exceed the ones in 2011, 2015-16 and 2018. Hence, a bearish stance is still warranted. As we argue below, after a 12-year bull run, the excesses in the US equity market in general, and US tech stocks in particular, have become extreme. There are many signs of a bubble, or at least of a major top. Even though we risk overstaying in our negative view, our bias is that the global equity market rout is not yet over. A Bullish Scenario A (hypothetical) bullish case would look something like this: Weakening global and US growth and falling commodity prices bring down US inflation and Treasury yields. As US bond yields drop further, the S&P 500 rallies given their negative correlation of the past 18 months or so. As US inflation declines rapidly, the Fed makes a dovish pivot, reinforcing the risk asset rally and reversing the US dollar’s uptrend. Finally, Chinese stimulus produces a robust business cycle recovery in China that propels commodity prices higher and lifts the rest of EM out of the abyss. Chart 2Keep An Eye On Rising US Trimmed-Mean Inflation
Keep An Eye On Rising US Trimmed-Mean Inflation
Keep An Eye On Rising US Trimmed-Mean Inflation
In our opinion, this scenario has no more than a 25% chance of playing out. Even if there are apparent signs of a US/global slowdown, elevated US core inflation and accelerating wages and unit labor costs would keep the Fed from dialing down its hawkishness Critically, even though US core PCE inflation has rolled over and will likely decline further, its trimmed-mean PCE inflation is rising (Chart 2). The latter means that inflation is broadening even as some volatile items like food, energy and used-auto prices deflate. As we have written extensively, wages and inflation are lagging variables. Despite the ongoing slowdown in the US economy, it will take many months before the underlying core inflation rate drops below 3%. We maintain that the Fed and the stock market remain on a collision course. An equity rally and easing financial conditions would make the Fed even more resolute to hike interest rates. The basis is that even if core inflation falls in the coming months, it would still be well above the Fed’s target of 2%. Notably, the Fed has recently communicated that its commitment to bring down inflation to 2% is unconditional. Chart 3The Anatomy Of The US Equity Bear Market In 2000-2002
The Anatomy Of The US Equity Bear Market In 2000-2002
The Anatomy Of The US Equity Bear Market In 2000-2002
This policy stance represents a major departure from the past several decades when the Fed was very sensitive to any tightening in financial conditions and often eased preemptively. In short, with inflation still well above its target, the Fed will, for now, err on the side of hawkishness if financial conditions ease. Importantly, US corporate profits will likely contract even if US real GDP does not shrink. As US corporate top-line growth slows and unit labor costs accelerate, profit margins will shrink. For example, the 2001-2002 recession was very mild – consumer spending did not contract at all, and housing boomed (Chart 3, top two panels). Yet, the S&P 500 operating earnings dropped by 30%, and the S&P 500 fell by 50% (Chart 3, bottom two panels). In brief, a devastating bear market does not necessarily require a hard landing. Concerning China, the recovery will likely be U-shaped rather than V-shaped with risks skewed to the downside. Finally, contracting global trade and falling commodity prices will continue, which are negative for EM currencies and assets. Notably, industry data from Taiwan’s manufacturing PMI suggest that the slowdown in the Asian and global economies is widespread. Taiwan’s substantial trade linkages with mainland China signify that the slowdown is not limited to the US and the EU but includes China too. Taiwanese PMI export orders of both semiconductor and basic material producers have plunged to 40 and 30, respectively (Chart 4). Barring a quick turnaround, global semiconductor and basic materials stocks have more downside. Even as US Treasury yields drop, the dollar will continue firming versus EM currencies, including those of Emerging Asian countries. In such a scenario, EM stocks and bonds will weaken further (Chart 5). Chart 4A Broad-Based Contraction In Global Trade Is In The Cards
A Broad-Based Contraction In Global Trade Is In The Cards
A Broad-Based Contraction In Global Trade Is In The Cards
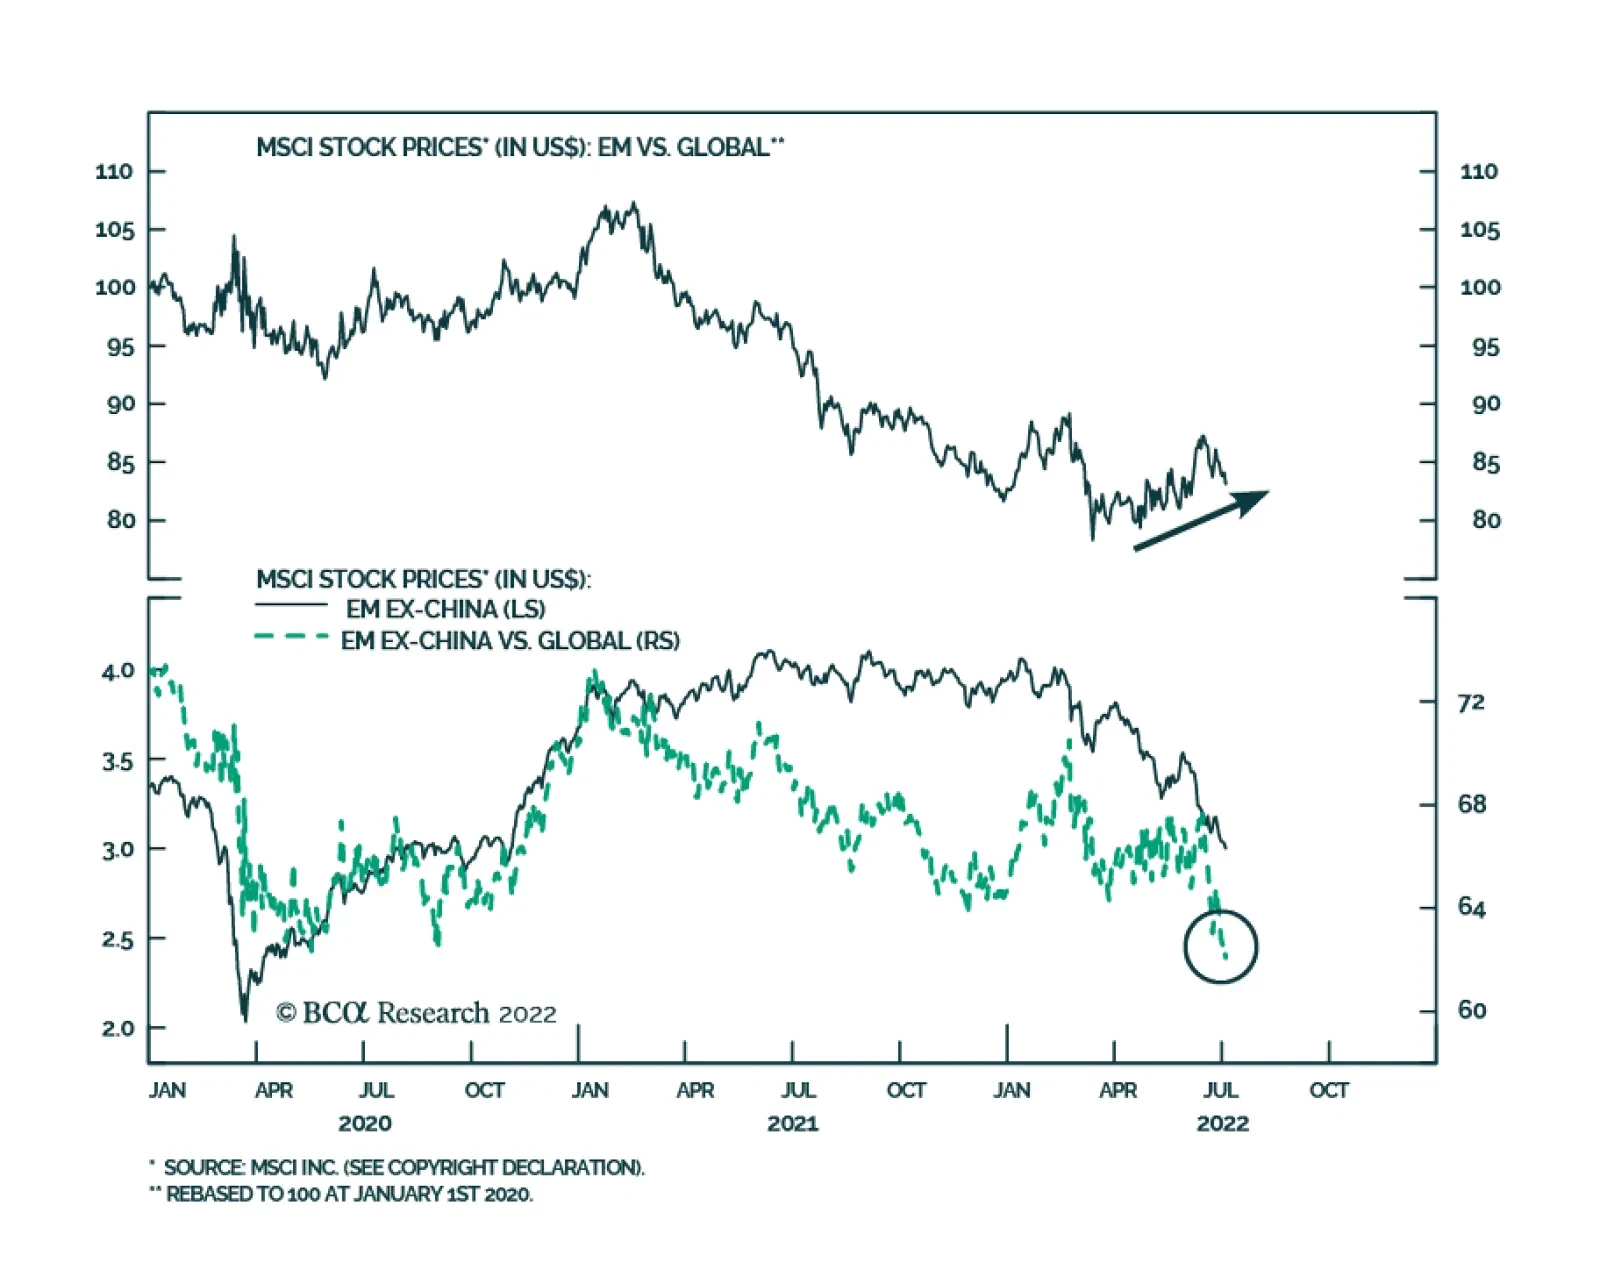
Chart 5A Free Fall In EM Ex-China Stocks And Currencies
A Free Fall In EM Ex-China Stocks And Currencies
A Free Fall In EM Ex-China Stocks And Currencies
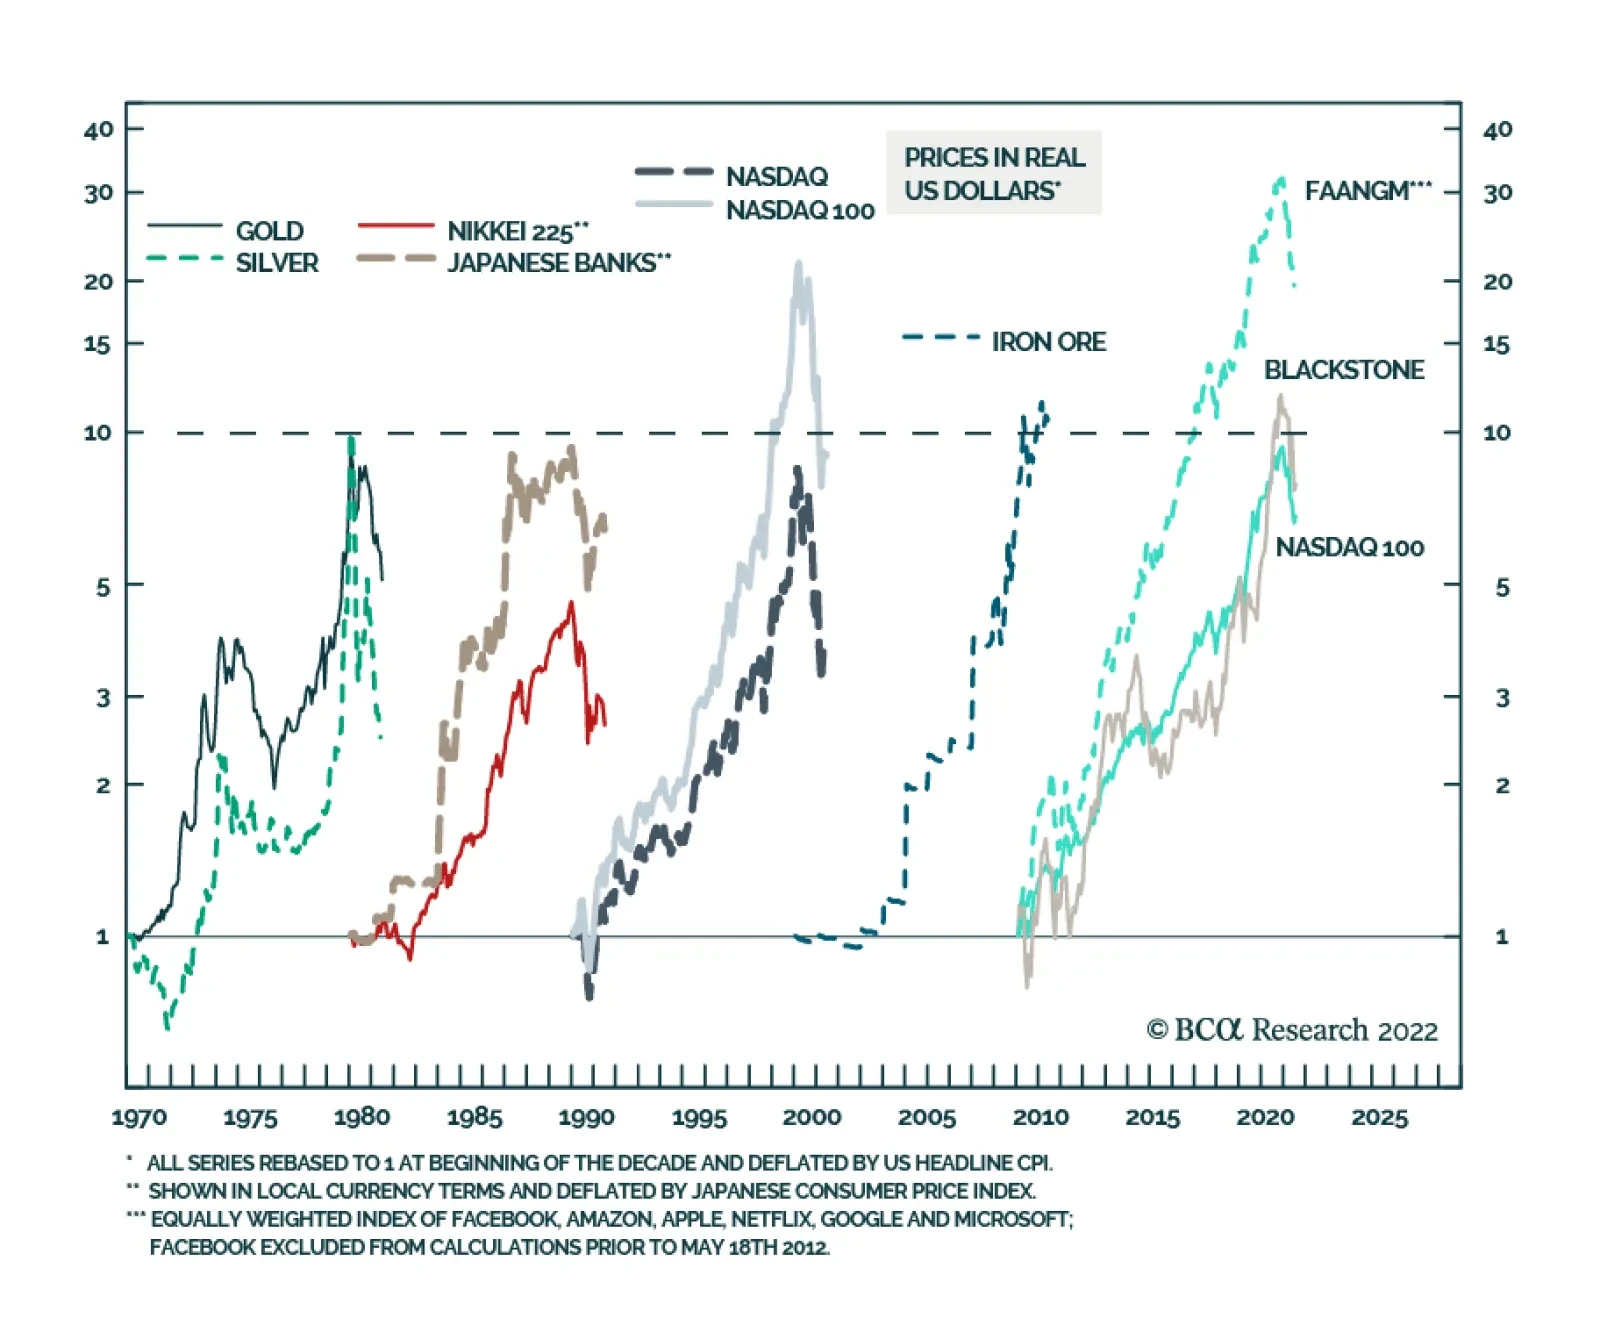
Bottom Line: The S&P 500 is oversold, and investor sentiment is downbeat. In this context, a technical equity rebound can occur at any moment. However, we do not think it will be the beginning of a major cyclical rally. A Bearish Case: Are US TMT Stocks A Bubble? What is a more bearish scenario than our baseline case? The bursting of bubbles or the unwinding of excesses would entail a more protracted and devastating bear market than the 15% drop in global share prices we currently expect. We can identify two major excesses in the global economy and financial system: In US TMT (Technology, Media & Entertainment and Internet & Catalog Retail) stocks and private equity In Chinese real estate. We have written extensively about property market excesses in China. Below we discuss the recent sharp selloff in commodities, which is partially linked to Chinese property construction. We also present the case for major excesses in US stocks. Chart 6 illustrates the history of bubbles of the past several decades: The Nifty-fifty (involving the 50 US large-cap stocks) bubble occurred in the 1960s and burst in the 1970s (not shown in the chart). The commodity bubble took place in the 1970s and burst in the 1980s. Japanese equity and property prices rose exponentially in the 1980s and deflated in the 1990s. The Nasdaq bubble occurred in the 1990s and was shattered in the early 2000s. Commodities/EM/China were the leaders of the 2000s, and they were devastated in the 2010s. We use iron ore in this chart because its price surged the most in the 2000s. FAANGM stocks, the Nasdaq 100 index and private equity were by far the biggest beneficiaries of the 2010s. No one can be certain about bubbles in real time because there are always superior fundamentals or persuasive stories that justify exponential price appreciation. That said, there are a lot of similarities between dynamics prevailing in US tech and private equity and in previous bubbles: In the past decade, FAANGM stocks, the Nasdaq 100 index and private equity companies registered gains comparable to the bubbles of the previous 60 years. Furthermore, as Chart 6 illustrates, the equal-weighted FAANGM index in inflation-adjusted terms rose 30-fold, much more than the bubbles of the previous decades. The Nasdaq 100 index and share prices of Blackstone, the largest private equity company, have risen by nearly 10-fold in real (inflation-adjusted terms) between 2010 and the end of 2021. Chart 6The History Of Financial Bubbles: Is This Time Different?
On A Bull Case, Bubbles And Commodity Prices
On A Bull Case, Bubbles And Commodity Prices
The final phase of bubbles is often characterized by growing retail investor participation. This is exactly what happened with US tech/new economy stocks. Chart 7US TMT Stocks: Exponential Growth Rarely Ends Well
US TMT Stocks: Exponential Growth Rarely Ends Well
US TMT Stocks: Exponential Growth Rarely Ends Well
Toward the end of the decade, not only retail but also institutional capital stampedes into the winners of the decade. This played out with US large-cap tech stocks as well as in private equity and private debt spaces. Inflows into private equity and private debt have been enormous. As a result of these inflows into US large-cap stocks, the market cap share of US TMT stocks as a percentage of total US market cap has surpassed 40%, its peak in 2000 (Chart 7). Bubbles often thrive during periods of low interest rates and crash when the cost of capital rises. This is exactly what has been happening in global financial markets since early 2019. The parameters of the overall US equity market were also excessive prior to this bear market. As of last year, the S&P 500 stock prices in real (inflation-adjusted) terms became as elevated relative to their long-term time trend as they were in the late 1960s and the late 1990s − the peaks of previous secular bull markets (Chart 8, top panel). Chart 8The S&P 500 and Operating Profits: A Long-Term Perspective
The S&P 500 and Operating Profits: A Long-Term Perspective
The S&P 500 and Operating Profits: A Long-Term Perspective
Chart 9Equity Issuance Marks Market Tops
Equity Issuance Marks Market Tops
Equity Issuance Marks Market Tops
The S&P 500’s operating earnings in real terms have surpassed two standard deviations above its time trend (Chart 8, bottom panel). Some sort of mean reversion to its long-term trend is in the cards. US corporate profits have benefited from fiscal/monetary stimulus, low labor costs and pricing power. All of these are now working against profits. Finally, new share issuance in the US mushroomed in 2021, another sign of a major top (Chart 9). Bottom Line: We are not entirely convinced that US TMT stocks are a bubble waiting to burst. Yet, the odds of this happening are nontrivial. This time might not be different. A Word On Commodities The selloff in the commodity space has been broad-based. Odds are that it will continue for the following reasons: A global business cycle downtrend is always bearish for commodity prices. In fact, oil prices are often lagging and are typically the last shoe to drop during global slowdowns. US sales of gasoline have started to contract. Besides, Saudi Arabia will likely increase its oil output and shipments following President Biden’s visit to the Kingdom next week. Chart 10Investors Have Been Long Commodity Futures
Investors Have Been Long Commodity Futures
Investors Have Been Long Commodity Futures
As we have argued in recent months, China’s demand for commodities was contracting and, in our opinion, the rally in resource prices over the past 12 months was supported by investment demand for commodities, i.e., financial inflows into the commodity space. Many portfolios have bought commodities as an inflation hedge. When a hedge becomes a consensus trade and crowded, it stops being a hedge. Chart 10 demonstrates that net long positions in 17 commodities have been very elevated. The speed at which liquidation is taking place corroborates our thesis that it is investors not producers or consumers who have been caught being long commodities. China’s business cycle recovery will be U-shaped at best. Domestic orders point to weaker import volumes in the months ahead (Chart 11, top panel). Corporate loan demand has plunged suggesting that liquidity provisions by the PBoC might fail to produce a meaningful recovery in credit growth (Chart 11, bottom panel). Finally, technicals bode ill for commodity prices. As Chart 12 illustrates, copper prices and global material stocks have probably formed medium-term tops, and risks are skewed to the downside. Chart 11China: The Economy Is Struggling To Gain Traction
China: The Economy Is Struggling To Gain Traction
China: The Economy Is Struggling To Gain Traction
Chart 12A Major Top In Commodity Prices?
A Major Top In Commodity Prices?
A Major Top In Commodity Prices?
Bottom Line: Commodity prices and their plays have more downside. Investment Strategy The decline in commodity prices and the relentless US dollar rally will ensure that EM currencies, bonds and stocks continue to sell off even if the US equity market rebounds in the near term driven by lower Treasury yields. Global equity and fixed-income portfolios should continue underweighting EM. We also continue to short the following currencies versus the USD: ZAR, COP, PEN, PLN, PHP and IDR; as well as HUF vs. CZK, and KRW vs. JPY. Arthur Budaghyan Chief Emerging Markets Strategist arthurb@bcaresearch.com Strategic Themes (18 Months And Beyond) Equities Cyclical Recommendations (6-18 Months) Cyclical Recommendations (6-18 Months)
Executive Summary Buying a home is now more expensive than renting in many parts of the world. In the US and UK, disappearing homebuyers combined with a flood of home-sellers will weigh on home prices over the next 6-12 months. Falling employment and falling house prices risk becoming a self-reinforcing negative feedback loop that turns a mild recession into a severe recession. To stop such a vicious cycle running out of control, policymakers will eventually bring down mortgage rates. For this reason, on a time horizon of 6-12 months, overweight bonds. A collapse in Chinese property development and construction activity will have negative long-term implications for commodities, emerging Asia, and developing countries that produce raw materials. Structurally underweight. On the other hand, stay structurally overweight the China 30-year government bond. Fractal trading watchlist: US Biotech versus Utilities. Buying A Home Is Now More Expensive Than Renting!
Buying A Home Is Now More Expensive Than Renting!
Buying A Home Is Now More Expensive Than Renting!
Bottom Line: The decade-long global housing boom is over. Feature For the first time since 2018, the number of Brits wanting to buy a home is less than the number of Brits wanting to sell their home. The balance of homebuyers versus homes for sale is the main driver of any housing market. When multiple homebuyers are competing for a home for sale, the subsequent bidding war puts upward pressure on house prices. But when, multiple homes for sale are competing for a homebuyer, the subsequent discounting war puts downward pressure on house prices. The balance of homebuyers versus homes for sale is the main driver of any housing market. This makes the number of homebuyers versus homes for sale the best leading indicator of house prices. The recent collapse of this leading indicator in the UK warns that UK house prices are likely to soften through the remainder of 2022 and into 2023 (Chart I-1). Chart I-1With Fewer UK Homebuyers Than UK Home-Sellers, UK House Prices Are Set To Drop
With Fewer UK Homebuyers Than UK Home-Sellers, UK House Prices Are Set To Drop
With Fewer UK Homebuyers Than UK Home-Sellers, UK House Prices Are Set To Drop
Homebuyers Are Disappearing While Home-Sellers Are Flooding The Market Disappearing homebuyers combined with a flood of home-sellers is also evident in the US. According to Realtor.com: “Weary US homebuyers face not only sky-high home prices but also rising mortgage rates, and that financial double whammy is hitting homebuyers hard: Compared with just a year ago, the cost of financing 80 percent of a typical home rose 57.6 percent, amounting to an extra $745 per month.” Compared with just a year ago, the cost of financing 80 percent of a typical US home rose 57.6 percent, amounting to an extra $745 per month. Unsurprisingly, US mortgage applications for home purchase have recently plunged by a third (Chart I-2) and homebuyer demand has declined by 16 percent since last June.1 Meanwhile, the inventory of homes actively for sale on a typical day in June has increased by 19 percent, the largest increase in the data history. Chart I-2With The Cost Of Financing A US Home Purchase Surging, Mortgage Applications Have Collapsed
With The Cost Of Financing A US Home Purchase Surging, Mortgage Applications Have Collapsed
With The Cost Of Financing A US Home Purchase Surging, Mortgage Applications Have Collapsed
The flood of new homes on the market means that the dwindling pool of homebuyers will have more negotiating leverage on the asking price (Chart I-3 and Chart I-4). This will balance the highly lopsided negotiating dynamics in the raging seller’s market of the past two years. The shape of things to come can be seen in Austin, Texas, which was one of the hottest markets during the early pandemic real estate frenzy. Chart I-3US Homebuyers Are Disappearing...
US Homebuyers Are Disappearing...
US Homebuyers Are Disappearing...
Chart I-4...While US Home-Sellers Are Flooding The Market
...While US Home-Sellers Are Flooding The Market
...While US Home-Sellers Are Flooding The Market
“Prices are definitely starting to go down again… last Friday, an Austin home was listed at $825,000. The next day, at the open house, no one came. A few months ago, there would have been 20 or more buyers showing up. The sellers didn’t want to test the market, so on Sunday, they dropped it to $790,000. It sold for $760,000.” Buying A Home Is Now More Expensive Than Renting The nub of the problem for homebuyers is that the mortgage rate is higher than the rental yield. In simple terms, buying a home is now more expensive than renting (Chart I-5). The housing bulls counter that the high mortgage rate will force rental yields to adjust upwards by rents going up, but this argument is flawed. Chart I-5Buying A Home Is Now More Expensive Than Renting!
Buying A Home Is Now More Expensive Than Renting!
Buying A Home Is Now More Expensive Than Renting!
The most important driver of rent inflation is the unemployment rate (inversely). Because, to put it bluntly, you need a steady job to pay the rent! Today, the Federal Reserve’s inflation problem, in a nutshell, is that rent inflation is too high even versus the tight jobs market (Chart I-6). Chart I-6The Fed Needs To Push Up Unemployment To Pull Down Rent Inflation
The Fed Needs To Push Up Unemployment To Pull Down Rent Inflation
The Fed Needs To Push Up Unemployment To Pull Down Rent Inflation
Although the Fed cannot say this explicitly, its mechanism to bring down inflation is to push up unemployment, and thereby to pull down rent inflation, which constitutes almost half of the core inflation basket. In this case, the rental yield (rent divided by house price) would adjust upwards by the denominator – house prices – going down. The most important driver of rent inflation is the unemployment rate (inversely). Yet the housing bulls also argue that the housing boom is the result of a structural undersupply of homes. They claim that as this structural undersupply persists, it will underpin house prices. But this ‘housing shortage’ narrative is another myth, which we can debunk with two simple observations. Through the past decade, home prices have risen simultaneously and exponentially everywhere in the world. Now ask yourself, is it plausible that there could be a structural undersupply of homes everywhere in the world at the precisely the same time? If this doesn’t debunk the housing shortage narrative, then try this second observation. Through the past decade, gross rents have tracked nominal GDP. Theory says that gross rents should track nominal GDP, because the quality of the housing stock improves broadly in line with GDP, and therefore so too should rents. If there really was a structural undersupply of housing, then gross rents would be structurally outperforming nominal GDP. But that hasn’t happened in any major economy (Chart I-7). Chart I-7Rents Have Tracked GDP, So There Is No 'Structural Undersupply' Of Homes
Rents Have Tracked GDP, So There Is No 'Structural Undersupply' Of Homes
Rents Have Tracked GDP, So There Is No 'Structural Undersupply' Of Homes
As an aside, if rents track GDP, then why do they constitute almost half of the core inflation basket? The answer is that the rents included in inflation are ‘hedonically adjusted’, meaning that are supposedly deflated for quality improvements – though there is always a niggling doubt whether the statisticians do this adjustment correctly! Pulling all of this together, the synchronized global housing boom of the past decade was not the result of a structural undersupply. Instead, it was the result of a valuation boom – meaning, plummeting rental yields, which in turn were the result of plummeting mortgage rates, which in turn were the result of plummeting bond yields. But now that mortgage rates are much higher than rental yields, this ‘virtuous’ cycle risks turning vicious. Falling employment and falling house prices risk becoming a self-reinforcing negative feedback loop that turns a mild recession into a severe recession. To stop such a vicious cycle running out of control, policymakers will eventually have no other choice than to bring down mortgage rates. For this reason, on a time horizon of 6-12 months, overweight bonds. But The Prize For The Biggest Housing Boom Goes To… China The housing booms in the UK, US and other Western economies, extreme as they are, are small fry compared to the housing boom in China. Chinese real estate, now worth $100 trillion, is by far the largest asset-class in the world. And Chinese rental yields, at around 1 percent, are well below the yield on cash. Begging the question, how can Chinese real estate valuations be in such stratospheric territory, with a yield even less than that on ‘risk-free’ cash? The simple answer is that investors have been led to believe that Chinese real estate is a risk-free investment! Without a social safety net and with limited places to park their money, Chinese savers have for years been encouraged to buy homes, in the widespread belief that property is the safest investment, whose price is only supposed to go up (Chart I-8). Chart I-8Chinese Real Estate Is Perceived To Be A 'Risk Free' Investment
Chinese Real Estate Is Perceived To Be A 'Risk Free' Investment
Chinese Real Estate Is Perceived To Be A 'Risk Free' Investment
With the bulk of Chinese households’ wealth in property acting as a perceived economic safety net, even a 10 percent decline in house prices would constitute a major shock to the household sector’s hopes and expectations of what property is. In turn, the ensuing ‘negative wealth effect’ would be catastrophic for household spending in the world’s second largest economy. Therefore, in contrast to the US housing debacle in 2008, the Chinese government will ensure that its property market adjustment does not come from a collapse in home prices. Rather, it will come from a collapse in property development and construction activity, combined with keeping interest rates structurally low. This will have negative long-term implications for commodities, emerging Asia, and developing countries that produce raw materials. Structurally underweight. On the other hand, Chinese bonds are an excellent investment for those investors who can accept the capital control risks. Stay structurally overweight the China 30-year government bond. Fractal Trading Watchlist Biotech and Utilities are both defensive sectors, based on the insensitivity of theirs profits to economic fluctuations. But whereas Biotech is ‘long duration’, Utilities is ‘shorter duration’. Over the coming months, as the economy falters and bond yields back down, long duration defensives, such as Biotech, are likely to be the winners. This is supported by the recent underperformance reaching the point of fractal fragility that has indicated previous major turning points (Chart I-9). The recommended trade is long US Biotech versus Utilities, setting a profit target and symmetrical stop-loss at 20 percent. This replaces our long US Biotech versus Tech position, which achieved its 17.5 percent profit target, and is now closed. Chart I-9Biotech Is Set To Be A Big Winner
Biotech Is Set To Be A Big Winner
Biotech Is Set To Be A Big Winner
Chart 1CNY/USD Has Reversed
CNY/USD Has Reversed
CNY/USD Has Reversed
Chart 2US REITS Are Oversold Versus Utilities
US REITS Are Oversold Versus Utilities
US REITS Are Oversold Versus Utilities
Chart 3CAD/SEK Reversal Has Started
CAD/SEK Reversal Has Started
CAD/SEK Reversal Has Started
Chart 4Financials Versus Industrials To Reverse
Financials Versus Industrials To Reverse
Financials Versus Industrials To Reverse
Chart 5The Outperformance Of Resources Versus Biotech Has Started To Reverse
The Outperformance Of Resources Versus Biotech Has Started To Reverse
The Outperformance Of Resources Versus Biotech Has Started To Reverse
Chart 6The Outperformance Of Resources Versus Healthcare Is Vulnerable To Reversal
The Outperformance Of Resources Versus Healthcare Is Vulnerable To Reversal
The Outperformance Of Resources Versus Healthcare Is Vulnerable To Reversal
Chart 7FTSE100 Outperformance Vs. Euro Stoxx 50 Is Reversing
FTSE100 Outperformance Vs. Euro Stoxx 50 Is Reversing
FTSE100 Outperformance Vs. Euro Stoxx 50 Is Reversing
Chart 8Netherlands Underperformance Vs. Switzerland Has Been Exhausted
Netherlands Underperformance Vs. Switzerland Has Been Exhausted
Netherlands Underperformance Vs. Switzerland Has Been Exhausted
Chart 9The Sell-Off In The 30-Year T-Bond Is Approaching Fractal Fragility
The Sell-Off In The 30-Year T-Bond Is Approaching Fractal Fragility
The Sell-Off In The 30-Year T-Bond Is Approaching Fractal Fragility
Chart 10The Sell-Off In The NASDAQ Is Approaching Fractal Fragility
The Sell-Off In The NASDAQ Is Approaching Fractal Fragility
The Sell-Off In The NASDAQ Is Approaching Fractal Fragility
Chart 11Food And Beverage Outperformance Has Been Exhausted
Food And Beverage Outperformance Has Been Exhausted
Food And Beverage Outperformance Has Been Exhausted
Chart 12AT REVERSAL
AT REVERSAL
AT REVERSAL
Chart 13AT REVERSAL
AT REVERSAL
AT REVERSAL
Chart 14The Strong Trend In The 18-Month-Out US Interest Rate Future Is Fragile
The Strong Trend In The 18-Month-Out US Interest Rate Future Is Fragile
The Strong Trend In The 18-Month-Out US Interest Rate Future Is Fragile
Chart 15The Strong Trend In The 3 Year T-Bond Is Fragile
The Strong Trend In The 3 Year T-Bond Is Fragile
The Strong Trend In The 3 Year T-Bond Is Fragile
Chart 16A Potential Switching Point From Tobacco Into Cannabis
A Potential Switching Point From Tobacco Into Cannabis
A Potential Switching Point From Tobacco Into Cannabis
Chart 17Biotech Is A Major Buy
Biotech Is A Major Buy
Biotech Is A Major Buy
Chart 18Norway's Outperformance Could End
Norway's Outperformance Could End
Norway's Outperformance Could End
Chart 19Cotton's Outperformance Is Vulnerable To Reversal
Cotton's Outperformance Is Vulnerable To Reversal
Cotton's Outperformance Is Vulnerable To Reversal
Chart 20Fractal Trading Watch List
Fractal Trading Watch List
Fractal Trading Watch List
Chart 21The Rally In USD/EUR Could End
The Rally In USD/EUR Could End
The Rally In USD/EUR Could End
Chart 22The Outperformance Of MSCI Hong Kong Versus China Is Vulnerable To Reversal
The Outperformance Of MSCI Hong Kong Versus China Is Vulnerable To Reversal
The Outperformance Of MSCI Hong Kong Versus China Is Vulnerable To Reversal
Chart 23A Potential New Entry Point Into Petcare
A Potential New Entry Point Into Petcare
A Potential New Entry Point Into Petcare
Chart 24GBP/USD At A Turning Point
GBP/USD At A Turning Point
GBP/USD At A Turning Point
Chart 25Fractal Trading Watch List
Fractal Trading Watch List
Fractal Trading Watch List
Chart 26Fractal Trading Watch List
Fractal Trading Watch List
Fractal Trading Watch List
Dhaval Joshi Chief Strategist dhaval@bcaresearch.com Footnotes 1 Realtor.com gauge homebuyer demand by so-called ‘pending listings’, the number of listings that are at various stages of the selling process that are not yet sold. Fractal Trading System Fractal Trades
The Global Housing Boom Is Over, As Buying Becomes More Expensive Than Renting
The Global Housing Boom Is Over, As Buying Becomes More Expensive Than Renting
The Global Housing Boom Is Over, As Buying Becomes More Expensive Than Renting
The Global Housing Boom Is Over, As Buying Becomes More Expensive Than Renting
6-12 Month Recommendations Structural Recommendations Closed Fractal Trades Indicators To Watch - Bond Yields Chart II-1Indicators To Watch - Bond Yields - Euro Area
Indicators To Watch - Bond Yields - Euro Area
Indicators To Watch - Bond Yields - Euro Area
Chart II-2Indicators To Watch - Bond Yields - Europe Ex Euro Area
Indicators To Watch - Bond Yields - Europe Ex Euro Area
Indicators To Watch - Bond Yields - Europe Ex Euro Area
Chart II-3Indicators To Watch - Bond Yields - Asia
Indicators To Watch - Bond Yields - Asia
Indicators To Watch - Bond Yields - Asia
Chart II-4Indicators To Watch - Bond Yields - Other Developed
Indicators To Watch - Bond Yields - Other Developed
Indicators To Watch - Bond Yields - Other Developed
Indicators To Watch - Interest Rate Expectations Chart II-5Indicators To Watch - Interest Rate Expectations
Indicators To Watch - Interest Rate Expectations
Indicators To Watch - Interest Rate Expectations
Chart II-6Indicators To Watch - Interest Rate Expectations
Indicators To Watch - Interest Rate Expectations
Indicators To Watch - Interest Rate Expectations
Chart II-7Indicators To Watch - Interest Rate Expectations
Indicators To Watch - Interest Rate Expectations
Indicators To Watch - Interest Rate Expectations
Chart II-8Indicators To Watch - Interest Rate Expectations
Indicators To Watch - Interest Rate Expectations
Indicators To Watch - Interest Rate Expectations
The S&P 500 has fallen by an additional 5% since the hotter-than-expected May CPI release, which prompted the Fed’s latest mega rate hike. This brings the year-to-date decline to 20% with the S&P 500 concluding its worst H1 since 1970. On the one…
Executive Summary Analysts Have Little Confidence In Their Forecasts
Analysts Have Little Confidence In Their Forecasts
Analysts Have Little Confidence In Their Forecasts
In the front section of the sector chart pack, we conduct cross-sectional comparisons. Profitability: Earnings expectations for the cyclical sectors are too high and will come down since analysts have little confidence in their forecasts. But despite their bullishness, analysts also expect margins of the most cyclical sectors to contract over the next 12 months. Balance sheet quality: Post-pandemic demand has resulted in a free cash flow windfall for companies in multiple sectors, which they used to repair their balance sheets. Tech, Materials, and Financials have improved the most. Valuations and technicals: Cyclical sectors appear inexpensive (both in absolute terms and relative to history) because multiples have contracted. Technicals signal that the market is oversold. Much of the bad news is priced in, but “new” bad news is likely on the way: We are still in the early stages of the monetary tightening cycle, there is talk about earnings and economic recessions, rates have not stabilized yet, and inflation has not peaked. Bottom Line: We continue to recommend that investors remain patient and pad the more defensive and quality allocations in their portfolios at the expense of cyclical sectors that are geared to a slowdown. Companies with strong and resilient earnings and quality balance sheets will be able to better weather the storm, if it arrives. This week we are sending you a Sector Chart Pack, which offers macro, fundamentals, valuations, technicals, and uses of cash charts for each sector. In the front section of this publication, we will focus on cross-sectional comparisons. As investors are starting to shift their attention away from worries about intransigent inflation toward concerns about slowing growth, they will seek out companies and sectors that offer the strongest and most resilient earnings growth, pristine balance sheets, and strong cash yield. In other words, companies that have the highest chance of surviving the downturn unscathed and of outperforming the market. Performance vs. Our Portfolio Positioning Chart 1Looking Under The Hood...
Taking Stock Of Sectors And Industry Groups
Taking Stock Of Sectors And Industry Groups
The S&P 500 is down roughly 20% off its January 2022 peak. However, 11 industry groups have performed even worse, with Automobiles and Components down as much as 39% off peak. The rest of this inglorious list is dominated by Consumer Cyclicals, Technology, and Financials (Chart 1). We were foreseeing headwinds, and have preempted some of the damage by shifting our portfolio positioning away from the most cyclical areas of the market: We underweighted Semiconductors back in January, observing that Semis are both highly economically sensitive and “growthy” and will be hit by a double whammy of slowing growth and rising rates. We have been underweight Hardware and Equipment since last summer, moving to this trade a bit too early. We downgraded Consumer Durables And Retailing in February, observing that demand for goods, pulled forward by the pandemic, is waning and consumption is shifting away from goods to services. More recently, we downgraded Media and Entertainment. The sector has fallen significantly, but we reasoned that if an economic downturn is indeed on the way, advertisement expense is one of the first that companies curtail when they are tightening their belts. Last week, we downgraded Travel to underweight: Even well-heeled consumers are starting to feel the pinch of surging prices. And while most will take that long-awaited post-COVID vacation, the outlook beyond summer is bleak with surging costs of fuel and labor. As for Autos, we were complacent in our thinking that car shortages will eventually translate into strong earnings growth. Despite the disappointing performance, the EV Revolution remains a long-term investment theme for us. Also having opened the position in June 2021, we are still in the green at +7% in relative terms. We have also upgraded our position in Staples to overweight on a premise that many Americans are reeling from surging prices of food, fuel, and shelter. Consumer Staples is the only likely beneficiary, and its pricing power is on the rise. Bottom Line: We have been able to contain some of the damage incurred by market rotation away from cyclicals. Profitability Earnings Growth Expectations As we have written extensively in the past (e.g., “Is Earnings Recession In The Cards”,) the analysts' earnings growth forecast for the S&P 500 of 10% is too high, especially considering the number of adverse events that have taken place since the beginning of the year, and the overall trajectory of monetary policy and economic growth. The analysts are yet again missing the turning point, just as they did back in 2008, and even in 2020. Chart 2Earnings Forecasts For Cyclicals Are Still Way Too High
Taking Stock Of Sectors And Industry Groups
Taking Stock Of Sectors And Industry Groups
We have noticed that the cyclical industries with the highest EPS growth forecasts, such as Consumer Services, Transportation, and Auto, are most prone to earnings disappointment. To be fair, EPS growth expectations for Consumer Services and Transportation are down from December when they stood at 550% and 143% respectively (Chart 2). Earnings Uncertainty So how certain are analysts about their projections? A short answer is – not particularly. We gauge earnings uncertainty by looking at the dispersion of analyst EPS expectations scaled by the magnitude of EPS. In a way, this is a measure of analyst consensus, with estimates clustered around a certain number indicating extreme certainty of forecasts. We notice that the advent of COVID-19 rendered panic among analysts with the rate of uncertainty surging. More recently, uncertainty has decreased but remains elevated by historical standards (Chart 3). Looking at earnings projections by industry group (Chart 4), we notice that earnings uncertainty is the highest in the cyclical pockets of the market where the highest EPS growth is still expected: Consumer Services, Transportation, and Retailing. Chart 3Analysts Have Little Confidence In Their Forecasts...
Analysts Have Little Confidence In Their Forecasts
Analysts Have Little Confidence In Their Forecasts
Chart 4... Especially For Cyclical Industry Groups
Taking Stock Of Sectors And Industry Groups
Taking Stock Of Sectors And Industry Groups
Implications? Analysts as a group have little confidence in cyclical sector growth, and downward revisions are imminent. Margins In the “Marginally Worse” and subsequent “Sector Margin Scorecard” reports in October, we called for margins to roll over as early as 2022. Curiously, despite their bullishness, analysts expect the margins of most cyclical sectors to contract over the next 12 months (Chart 5). Chart 5Despite Their Bullishness, Analysts Expect Margins To Contract
Taking Stock Of Sectors And Industry Groups
Taking Stock Of Sectors And Industry Groups
Chart 6Pricing Power Is Declining But There Are Exceptions
Taking Stock Of Sectors And Industry Groups
Taking Stock Of Sectors And Industry Groups
Pricing Power As we observed early on, one of the key reasons for margin contraction is a decline in companies’ pricing power, i.e., their ability to pass costs on to their customers (Chart 6). The Materials sector experienced the most significant decline in pricing power, likely a positive as this may be an early sign that inflation is abating. It is also important to note that three sectors – Consumer Staples, Utilities, and Tech–are still growing their pricing power. Consumer Staples and Utilities are necessities, demand for which is fairly inelastic, while Tech is offering services that are still in high demand, as they help improve productivity and substitute labor, which is in short supply, for capital, which is still abundant. Degree of Operating Leverage Chart 7Low Operating Leverage Helps In Case Of Downturn
Taking Stock Of Sectors And Industry Groups
Taking Stock Of Sectors And Industry Groups
If pricing power is waning, what else can come to the rescue? After all, with inflation in the high single digits, nominal sales growth is to remain robust. The crucial piece of the puzzle is the ability of companies to convert sales into profits, i.e., operating leverage (Chart 7). Companies with high fixed costs enjoy higher operating leverage, and a small increase in sales translates into significant earnings growth (and vice versa). However, in case of an outright sales contraction, we are better off holding industries and sectors with low operating leverage, such as Staples and Healthcare. Earnings Stability Chart 8Defensives Have The Most Resilient Earnings
Taking Stock Of Sectors And Industry Groups
Taking Stock Of Sectors And Industry Groups
What sectors have the most resilient earnings, that won’t let investors down in a downturn? To answer this question empirically, we looked at a historical variation in EPS-realized growth rates by sector1 (Chart 8). We found that Staples, Healthcare, and Technology have had the most stable earnings growth rates. However, the last 12 years or so, characterized by low yields and nearly non-existent inflation, were a boon for long-duration technology stocks – so our experiment may not be pure. Bottom Line: Earnings expectations for the cyclical sectors are too high and will come down as analysts have little confidence in their forecasts. Balance Sheet Quality Free Cash Flow Chart 9Post-pandemic Surge In Demand Resulted In Free Cash Flow Windfall...
Taking Stock Of Sectors And Industry Groups
Taking Stock Of Sectors And Industry Groups
Post-pandemic demand has resulted in a free cash flow windfall for companies in multiple sectors. Technology benefited from the transition to remote working. Energy and Materials have not been able to meet the “reopening” demand after years of underinvestment, which resulted in constrained supply, and soaring prices (Chart 9). Chart 10...Which Companies Used To Repair Their Balance Sheets
Taking Stock Of Sectors And Industry Groups
Taking Stock Of Sectors And Industry Groups
Interest Coverage The companies used this profits windfall to repair their balance sheets and reduce their levels of debt. As a result, the interest coverage ratio has picked up across the board (Chart 10). Bottom Line: Corporate balance sheets across most sectors look strong. Tech, Materials, and Financials have improved the most. Cash Yield Companies that pay dividends and buy back their stocks not only enhance the returns of their shareholders but also signal their confidence in future earnings and the strength of their balance sheets (Chart 11). That is one of the reasons income funds were strong performers over the past few months as investors were seeking out quality investments (Chart 12). Chart 11Cash Yield Has Not Been This Attractive In Years...
Taking Stock Of Sectors And Industry Groups
Taking Stock Of Sectors And Industry Groups
Chart 12High Dividend Yield Signals Corporate Confidence
Taking Stock Of Sectors And Industry Groups
Taking Stock Of Sectors And Industry Groups
Valuations A corollary to our conclusion that earnings estimates are hardly trustworthy, is that forward multiples are not a great valuation metric on the verge of an earnings contraction. Trailing multiples are a better measure of value at this point in the cycle. We sorted PE multiples by their Z-score to 10 years of history (Chart 13) and notice the most cyclical sectors are rather inexpensive, both in absolute terms and relative to history as markets are forward looking. Chart 13High Dividend Yield Signals Corporate Confidence
Taking Stock Of Sectors And Industry Groups
Taking Stock Of Sectors And Industry Groups
Technicals Chart 14US Equities Appear Oversold
Taking Stock Of Sectors And Industry Groups
Taking Stock Of Sectors And Industry Groups
And last, but not least: The US equity market is oversold, and most industry groups are several standard deviations below the neutral reading (Chart 14). Bottom Line: Technicals signal that the market is oversold. Yet, a sustainable rebound may still be months away. Investment Conclusion Is it finally time for bottom fishing? We believe that oversold conditions and sectors trading at 30-40 percent of their peak are “necessary but insufficient conditions.” For the equity market to rebound, all the bad news needs to be fully priced in – however, we are still in the early stages of the monetary tightening cycle, and there is talk about earnings and economic recessions, the severity of which is impossible to gauge at this point. Rates have not stabilized yet, and inflation has not peaked. Much of the bad news is priced in, but “new” bad news is likely on the way. Bottom Line We recommend that investors remain patient and pad the more defensive and quality allocations in their portfolios at the expense of cyclical sectors that are geared to a slowdown. Companies with strong and resilient earnings and quality balance sheets will be able to better weather the storm, if it arrives. Irene Tunkel Chief Strategist, US Equity Strategy irene.tunkel@bcaresearch.com S&P 500 Chart II-1Macroeconomic Backdrop
Macroeconomic Backdrop
Macroeconomic Backdrop
Chart II-2Profitability
Profitability
Profitability
Chart II-3Valuations And Technicals
Valuations And Technicals
Valuations And Technicals
Chart II-4Uses Of Cash
Uses Of Cash
Uses Of Cash
Communication Services Chart II-5Macroeconomic Backdrop
Macroeconomic Backdrop
Macroeconomic Backdrop
Chart II-6Profitability
Profitability
Profitability
Chart II-7Valuations And Technicals
Valuations And Technicals
Valuations And Technicals
Chart II-8Uses Of Cash
Uses Of Cash
Uses Of Cash
Consumer Discretionary Chart II-9Macroeconomic Backdrop
Macroeconomic Backdrop
Macroeconomic Backdrop
Chart II-10Profitability
Profitability
Profitability
Chart II-11Valuations And Technicals
Valuations And Technicals
Valuations And Technicals
Chart II-12Uses Of Cash
Uses Of Cash
Uses Of Cash
Consumer Staples Chart II-13Macroeconomic Backdrop
Macroeconomic Backdrop
Macroeconomic Backdrop
Chart II-14Profitability
Profitability
Profitability
Chart II-15Valuations And Technicals
Valuations And Technicals
Valuations And Technicals
Chart II-16Uses Of Cash
Uses Of Cash
Uses Of Cash
Energy Chart II-17Macroeconomic Backdrop
Macroeconomic Backdrop
Macroeconomic Backdrop
Chart II-18Profitability
Profitability
Profitability
Chart II-19Valuations And Technicals
Valuations And Technicals
Valuations And Technicals
Chart II-20Uses Of Cash
Uses Of Cash
Uses Of Cash
Financials Chart II-21Macroeconomic Backdrop
Macroeconomic Backdrop
Macroeconomic Backdrop
Chart II-22Profitability
Profitability
Profitability
Chart II-23Valuations And Technicals
Valuations And Technicals
Valuations And Technicals
Chart II-24Uses Of Cash
Uses Of Cash
Uses Of Cash
Health Care Chart II-25Sector vs Industry Groups
Sector vs Industry Groups
Sector vs Industry Groups
Chart II-26Profitability
Profitability
Profitability
Chart II-27Valuations And Technicals
Valuations And Technicals
Valuations And Technicals
Chart II-28Uses Of Cash
Uses Of Cash
Uses Of Cash
Industrials Chart II-29Macroeconomic Backdrop
Macroeconomic Backdrop
Macroeconomic Backdrop
Chart II-30Profitability
Profitability
Profitability
Chart II-31Valuations And Technicals
Valuations And Technicals
Valuations And Technicals
Chart II-32Uses Of Cash
Uses Of Cash
Uses Of Cash
Information Technology Chart II-33Macroeconomic Backdrop
Macroeconomic Backdrop
Macroeconomic Backdrop
Chart II-34Profitability
Profitability
Profitability
Chart II-35Valuations And Technicals
Valuations And Technicals
Valuations And Technicals
Chart II-36Uses Of Cash
Uses Of Cash
Uses Of Cash
Materials Chart II-37Macroeconomic Backdrop
Macroeconomic Backdrop
Macroeconomic Backdrop
Chart II-38Profitability
Profitability
Profitability
Chart II-39Valuations And Technicals
Valuations And Technicals
Valuations And Technicals
Chart II-40Uses Of Cash
Uses Of Cash
Uses Of Cash
Real Estate Chart II-41Macroeconomic Backdrop
Macroeconomic Backdrop
Macroeconomic Backdrop
Chart II-42Profitability
Profitability
Profitability
Chart II-43Valuations And Technicals
Valuations And Technicals
Valuations And Technicals
Chart II-44Uses Of Cash
Uses Of Cash
Uses Of Cash
Utilities Chart II-45Macroeconomic Backdrop
Macroeconomic Backdrop
Macroeconomic Backdrop
Chart II-46Profitability
Profitability
Profitability
Chart II-47Valuations And Technicals
Valuations And Technicals
Valuations And Technicals
Chart II-48Uses Of Cash
Uses Of Cash
Uses Of Cash
Table II-1Performance
Taking Stock Of Sectors And Industry Groups
Taking Stock Of Sectors And Industry Groups
Table II-2Valuations And Forward Earnings Growth
Taking Stock Of Sectors And Industry Groups
Taking Stock Of Sectors And Industry Groups
Footnotes 1 Scaled and inverted Recommended Allocation
Executive Summary China: GeoRisk Indicator
China: GeoRisk Indicator
China: GeoRisk Indicator
A new equilibrium between NATO, which now includes Sweden and Finland, and Russia needs to be reestablished before geopolitical risks in Europe subside. Russia aims to inflict a recession on the EU which will revive dormant geopolitical risks embedded in each country. Investors should ignore the apparent drop in China’s geopolitical risk as it could rise further until Xi Jinping consolidates power at the Party Congress this fall. Stay on the sideline on Brazilian, South African, Australian, and Canadian equities despite the commodity bull market, at least until China’s growth stabilizes. Korean risk will rise, albeit by less than Taiwanese risk. The US political cycle ensures that Biden may take further actions against adversaries in Europe, Middle East, and East Asia, putting a floor under global geopolitical risk. Tactical Recommendation Inception Date Return LONG GLOBAL AEROSPACE & DEFENSE / BROAD MARKET EQUITIES 2020-11-27 9.3% Bottom Line: Geopolitical risk will rise in the near term. Stay long gold and global defensive stocks. Feature This month we update our GeoRisk Indicators and make observations about the status of political risk for each territory, and where risks are underrated or overrated by global financial markets. Russia GeoRisk Indicator Our “Original” quantitative measure of Russian political risk – the Russian “geopolitical risk premium” shown in the dotted red line below – has fallen to new lows (Chart 1). One must keep in mind that this geopolitical premium is operating under the assumption of a “free market” but the Russian market in the past few months had been anything but free. The Russian government and central bank had been manipulating the ruble and preventing capital outflows. Hence, Russian assets and any indicator derived from it does not reflect its true risk premium, merely the resolve of its government in the geopolitical struggle. Chart 1Russia: GeoRisk Indicator
Russia: GeoRisk Indicator
Russia: GeoRisk Indicator
While the Russia Risk Premium accurately detected the build-up in tensions before the invasion of Ukraine this year, today it gives the misleading impression that Russian geopolitical risk is low. In reality the risk level remains high due to the lack of strategic stability between Russia and the West, particularly the United States, and particularly over the question of NATO enlargement. Our “Old” Russia GeoRisk Indicator remains elevated but has slightly fallen back. This measure failed to detect the rise in risk ahead of this year’s invasion of Ukraine. We predicted the war based on non-market variables, including qualitative analysis. As a result of the failure of our indicator, we devised a “New” Russia GeoRisk Indicator after this year’s invasion, shown as the green line below. This measure provides the most accurate reading. It is pushing the upper limits, which we truncated at 4, as it did during the invasion of Georgia in 2008 and initial invasion of Ukraine in 2014. Related Report Geopolitical StrategyThird Quarter Geopolitical Outlook: Thunder And Lightning Has Russian geopolitical risk peaked for Europe and the rest of the world? Not until a new strategic equilibrium is established between the US and Russia. That will require a ceasefire in Ukraine and a US-Russia understanding about the role of Finland and Sweden within NATO. However, Hungary is signaling that the EU should impose no further sanctions on Russia. Russia’s cutoff of natural gas exports to Europe will create economic hardship that will start driving change in European governments or policies. A full ban on Russian natural gas may not be implemented in the coming years due to lack of EU unanimity. Still, the EU cannot lift sanctions on Russia because that would enable economic recovery and hence military rehabilitation, which could enable new aggression. Also, Russia will not relinquish the territories it has taken from Ukraine even if President Putin exits the scene. No Russian leader will have the political capital to do that given the sacrifices that Russia has made. Bottom Line: Russia’s management of the ruble is distorting some of our risk indicators. Russia remains un-investable for western investors. Substantial sanction relief will not come until late in the decade, if at all. UK GeoRisk Indicator British political risk is rising, and it may surpass the peaks of the Brexit referendum period in 2016 now that Scotland is pursuing another independence referendum (Chart 2). Chart 2United Kingdom: GeoRisk Indicator
United Kingdom: GeoRisk Indicator
United Kingdom: GeoRisk Indicator
New elections are not due until January 25, 2025 and the ruling Conservative Party has every reason to avoid an election over the whole period so that inflation can come down and the economy can recover. But an early election is possible between now and 2025. Prime Minister Boris Johnson has become a liability to his party but he is still a more compelling leader than the alternatives. If Johnson is replaced, then the change of leadership will only temporarily boost the Tories’ public approval. It will ultimately compound the party’s difficulties by dividing the party without resolving the Scottish question. Regardless, the Tories face stiff headwinds in the coming referendum debate and election, having been in power since 2010 and having suffered a series of major shocks (Brexit, the pandemic, inflation). Bottom Line: The US dollar is not yet peaking against pound sterling, As from a global geopolitical perspective it can go further. Investors should stay cautious about the pound in the short term. But they should prefer the pound to eastern European currencies exposed to Russian instability. Germany GeoRisk Indicator German political risk spiked around the time of the 2021 election and has since subsided, including over the course of the Ukraine war (Chart 3). However, risk will rise again now that Germany has declared that it is under “economic attack” from Russia, which is cutting natural gas in retaliation to Germany’s oil embargo. Chart 3Germany: GeoRisk Indicator
Germany: GeoRisk Indicator
Germany: GeoRisk Indicator
This spike in strategic tensions should not be underrated. Germany is entering a new paradigm in which Russian aggression has caused a break with the past policy of Ostpolitik, or economic engagement. Germany will have to devote huge new resources to energy security and national defense and will have to guard against Russia for the foreseeable future. Domestic political risk will also rise as the economy weakens and industrial activity is rationed. Germany does not face a general election until October 26, 2025. Early elections are rare but cannot be ruled out over the next few years. The ruling coalition does not have a solid foundation. It only has a 57% majority in the Bundestag and consists of an ideological mix of parties (a “traffic light” coalition of Social Democrats, Greens, and Free Democrats). Still, Germany’s confrontation with Russia will keep the coalition in power for now. Bottom Line: From a geopolitical point of view, there is not yet a basis for the dollar to peak and roll over against the euro. That is not likely until there is a ceasefire in Ukraine and/or a new NATO-Russia understanding. France GeoRisk Indicator French political risks are lingering at fairly high levels in the wake of the general election and will only partially normalize given the likelihood of European recession and continued tensions around Russia (Chart 4). Chart 4France: GeoRisk Indicator
France: GeoRisk Indicator
France: GeoRisk Indicator
President Emmanuel Macron was re-elected, as expected, but his Renaissance party (previously En Marche) lost its majority and Macron will struggle to win over 39 deputies to gain a majority of 289 seats in the Assembly. He will, however, be able to draw from an overall right-wing ideological majority – especially the Republicans – when it comes to legislative compromises. The election produced some surprises. The right-wing, anti-establishment National Rally of Marine Le Pen, which usually performs poorly in legislative elections, won 89 seats. The left-wing alliance (NUPES) underperformed opinion polls and has not formed a unified bloc within the Assembly. Still, the left will be a powerful force as it will command 151 seats (the sum of the left-wing anti-establishment leader Jean-Luc Mélenchon’s La France Insoumise party and the Communists, Socialists, and Greens). Macron’s key reform – raising the average retirement age from 62 to 65 – will require an ad hoc majority in the Assembly. The Republicans, with 74 seats, can provide the necessary votes. But some members have already refused to side with Macron on this issue. Macron will most likely get support from the populist National Rally on immigration, including measures to make it harder to be naturalized or obtain long-term residence permits, and measures making it easier to expel migrants whose asylum applications have been refused. France will remain hawkish on immigration, but Macron will be able to rein in the populists. On energy and the environment, Macron may be able to cooperate with the Left on climate measures, but ultimately any cooperation will be constrained by the fact that Mélenchon opposes nuclear power. The Republicans and the National Rally will support Macron’s bid to shore up France’s nuclear energy sector. Popular opinion will hold up for France’s energy security in the face of Russian weaponization of natural gas. Macron and Mélenchon will clash on domestic security. Police violence has emerged as a major source of controversy since the Yellow Vest protests. Macron and the Right will protect the police establishment while the Left will favor reforms, notably the concept of “proximity police,” which would entail police officers patrolling in a small area to create stronger, more personal links between the police and the population; officers being under the control of the mayor and prefect; and ultimately most officers not carrying lethal weapons, and the ban of physically dangerous arrest techniques. Grievances over the police as well as racial inequality will likely erupt into significant social unrest in the coming years. As a second-term president without a single-party majority, Macron will increasingly focus on foreign policy. He will aim to become the premier European leader on the world stage. He will seek to revive France’s historic role as a leading diplomatic power and arbiter of Europe. He will strengthen France’s position in the EU and NATO, keep selling arms to the Middle East, and maintain a French military presence in the Sahel. Macron will favor Ukraine’s membership in the EU but also a ceasefire with Russia. He will face a difficult decision on whether to join Israeli and American military action against Iran should the latter reach nuclear breakout capacity and pursue weaponization. Bottom Line: The outperformance of French equities is stretched relative to EMU counterparts. But France will not underperform until the EU’s natural gas crisis begins to subside and a new equilibrium is established with Russia. Italy GeoRisk Indicator Italy is perhaps the weakest link in Europe both economically and strategically (Chart 5). Elections are due by June 2023 but could come earlier as the ruling coalition is showing strains. A change of government would likely compromise the EU’s attempt to maintain a unified front against Russia over the war in Ukraine. Chart 5Italy: GeoRisk Indicator
Italy: GeoRisk Indicator
Italy: GeoRisk Indicator
Before the war Italy received 40% of its natural gas from Russia and maintained pragmatic relations with the Putin administration. Now Russia is reducing flows to Italy by 50%, forcing the country into an energy crisis at a time when expected GDP growth had already been downgraded to 2.3% this year and 1.7% in 2023. Meanwhile Italian sovereign bond spreads over German bunds have risen by 64 basis points YTD as a result of the global inflation. The national unity coalition under Prime Minister Mario Draghi came together for two purposes. First, to distribute the EU’s pandemic recovery funds across the country, which amounted to 191.5 billion euros in grants and cheap loans for Italy, 27% of the EU’s total recovery fund and 12% of Italy’s GDP. Second, to elect an establishment politician in the Italian presidency to constrain future populist governments (i.e. re-electing President Sergio Mattarella). Now about 13% of the recovery funds have been distributed in 2021, the economy is slowing, Russia is cutting off energy, and elections are looming. The coalition is no longer stable. Coalition members will jockey for better positioning and pursue their separate interests. The anti-establishment Five Star Movement has already split, with leader Luigi di Maio walking out. Five Star’s popular support has fallen to 12%. The most popular party in the country is now the right-wing, anti-establishment Brothers of Italy, who receive 23% support in polling. Matteo Salvini, leader of the League, another right-wing populist party, has seen its public support fall to 15% and will be looking for opportunities. On the whole, far-right parties command 38% of popular voting intentions, while far-left parties command 17% and centrist parties command 39%. Italy’s elections will favor anti-incumbent parties, especially if the country falls into recession. These parties will be more pragmatic toward Russia and less inclined to expand the EU’s stringent sanctions regime. Implementing a ban on Russian natural gas by 2027 will become more difficult if Italy switches. Italy will be more inclined to push for a ceasefire. A substantial move toward ceasefire will improve investor sentiment, although, again, a durable new strategic equilibrium cannot be established until the US and Russia come to an understanding regarding Finland, Sweden, and NATO enlargement. Bottom Line: Investors should steer clear of Italian government debt and equities until after the next election. Spain GeoRisk Indicator Infighting and power struggles within the People’s Party (PP) have provided temporary relief for the ruling Socialist Worker’s Party (PSOE) and Spanish Prime Minister Pedro Sanchez. However, with Alberto Nunez Feijoo elected as the new leader of PP on April 2, the People’s Party quickly recovered from its setback. It not only retook the first place in the general election polling, but also scored a landslide victory in the Andalusia regional election. Andalusia is the most populous autonomous community in Spain, contributing 17% of the seats in the lower house. The Andalusian regional election was a test run for the parties before next year’s general election. Historically, Andalusia was PSOE’s biggest stronghold, but it was ousted by the center-right People’s Party-Citizens coalition in 2018. Since then, the People’s party has consolidated their presence and popularity in Andalusia. The snap election in June, weeks after Feijoo was elected as the new national party leader, expanded PP’s seats in the regional parliament. It now has an absolute majority in the regional parliament while the Socialists suffered its worst defeat. With the sweeping victory in Andalusia, the People’s Party is well positioned for next year’s general election. In addition, the ruling Socialist Worker’s Party continues to suffer from the stagflationary economic condition. In May, Spain recorded the second highest inflation figure in more than 30 years, slightly below its March number. Furthermore, the recent deadly Melilla incident which resulted in dozens of migrants’ death, also caused some minor setbacks within Sanchez’s ruling coalition. His far-left coalition partner joined the opposition parties in condemning Sanchez for being complacent toward the Moroccan police. The pressure is on the Socialists now, and political risk will rise in the coming months, till after the election (Chart 6). Chart 6Spain: GeoRisk Indicator
Spain: GeoRisk Indicator
Spain: GeoRisk Indicator
Bottom Line: Domestic political risk will remain elevated in this polarized country, as elections are due by December 2023 and could come sooner. Populism may return if Europe suffers a recession. Russia aims to inflict a recession on the EU which is negative for cyclical markets like Spain, but Spain benefits from Europe’s turn to liquefied natural gas and has little to fear from Russia. Investors should favor Spanish stocks relative to Italian stocks. Turkey GeoRisk Indicator Turkey faces extreme political and economic instability between now and the general election due by June 2023 (Chart 7). Chart 7Turkey: GeoRisk Indicator
Turkey: GeoRisk Indicator
Turkey: GeoRisk Indicator
Almost any country would see the incumbent ruling party thrown from power under Turkey’s conditions. The ruling Justice and Development Party has been in charge since 2002, the country’s economy has suffered over that period, and today inflation is running at 73% while unemployment stands at 11%. However, President Recep Tayyip Erdoğan is doing everything he can with his recently expanded presidential powers to stay in office. He is making amends with the Gulf Arab states and seeking their economic support. He is also warming relations with Israel, as Turkey seeks to diversify away from Russian gas and Israel/Egypt are potential suppliers. He is doubling down on military distractions across the Middle East and North Africa. And he waged a high-stakes negotiation with the West over Finnish and Swedish accession to NATO. Russian aggression poses a threat to Turkish national interests. Turkey ultimately agreed to Finnish and Swedish membership after a show of Erdoğan strong hands in negotiating with the West over their membership, to show his domestic audience that he is one of the big boys ahead of the election. A risk to this view is that Erdoğan stages military operations against Greek-controlled Cyprus. This would initiate a crisis within NATO and put Finnish and Swedish accession on hold for a longer period. Bottom Line: Investors should not attempt to bottom-feed Turkish lira or stocks and should sell any rallies ahead of the election. A decisive election that removes Erdoğan from power is the best case for Turkish assets, while a decisive Erdoğan victory is second best. Worse scenarios include indecisive outcomes, a contested or stolen election, a constitutional breakdown, or a military coup. China GeoRisk Indicator China’s geopolitical risk is falling and relative equity performance is picking up now that the government has begun easing monetary, fiscal, and regulatory policy to try to secure the economic recovery (Chart 8). Chart 8China: GeoRisk Indicator
China: GeoRisk Indicator
China: GeoRisk Indicator
Easing regulation on Big Tech has spurred a rebound in heavily sold Chinese tech shares, while the Politburo will likely signal a pro-growth turn in policy at its July economic meeting. The worst news of the country’s draconian “Covid Zero” policy is largely priced, while positive news regarding domestic vaccines, vaccine imports, or anti-viral drugs could surprise the market. However, none of these policy signals are reliable until Xi Jinping consolidates power at the twentieth national party congress sometime between September and November (likely October). Chinese stimulus could fail to pick up as much as the market hopes and policy signals could reverse or could continue to contradict themselves. After the party congress, we expect the Xi administration to intensify its efforts to stabilize the economy. The economic work conference in December will release a pro-growth communique. The March legislative session will provide more government support for the economy if needed. However, short-term measures to stabilize growth should not be mistaken for a major reacceleration, as China will continue to struggle with debt-deflation as households and corporations deleverage and the economic model transitions to a post-manufacturing model. Bottom Line: A Santa Claus rally in the fourth quarter, and/or a 2023 rally, is likely, both for offshore and onshore equities. But long-term investors, especially westerners, should steer clear of Chinese assets. China’s reversion to autocracy and confrontation with the United States will ultimately result in tariffs and sanctions and geopolitical crises and will keep risk premiums high. Taiwan GeoRisk Indicator Taiwan’s geopolitical risk has spiked as expected due to confrontation with China. Tensions will remain high through the Taiwanese midterm election on November 26, the Chinese party congress, and the US midterm (Chart 9). But China is not ready to stage a full-scale military conflict over Taiwan yet – that risk will grow over in the later 2020s and 2030s, depending on whether the US and China provide each other with adequate security assurances. Chart 9Taiwan: GeoRisk Indicator
Taiwan: GeoRisk Indicator
Taiwan: GeoRisk Indicator
Still, Taiwan is the epicenter of global geopolitical risk. China insists that it will be unified with the mainland eventually, by force if not persuasion. China’s potential growth is weakening so it is losing the ability to absorb Taiwan through economic attraction over time. Meanwhile the Taiwanese people do not want to be absorbed – they have developed their own identity and prefer the status quo (or independence) over unification. Taiwan does not have a mutual defense treaty with the United States and yet the US and Taiwan are trying to strengthen their economic and military bonds. This situation is both threatening to China and yet not threatening enough to force China to forswear the military option. At some point China could believe it must assert control over Taiwan before the US increases its military commitment. Meanwhile China, the US, Japan, South Korea, and Europe are all adopting policies to promote semiconductor manufacturing at home, and/or outside Taiwan, so that their industries are not over-reliant on Taiwan. That means Taiwan will lose its comparative advantage over time. Bottom Line: Structurally remain underweight Taiwanese equities. Korea GeoRisk Indicator The newly elected President Yoon reaffirmed the strong military tie between Korea and the US, when he hosted President Biden in Seoul in May. Both Presidents expressed interests in expanding cooperation into new areas like semiconductors, economic security, and stability in the Indo-Pacific region. The new administration is also finding ways to improve relations with Japan, which soured in the past few years over the issue of forced labor during the Japanese occupation of Korea. A way forward is yet to be found, but a new public-private council will be launched on July 4 to seek potential solutions before the supreme court ruling in August which could further damage bilateral ties. President Yoon’s various statements throughout the NATO summit in Madrid on wanting a better relationship with Japan and to resolve historical issues showed this administration’s willingness towards a warming of the relations between the two countries, a departure from the previous administration. On the sideline of the NATO summit, Yoon also engaged with European leaders, dealing Korean defense products, semiconductors, and nuclear technologies, with a receptive European audience eager to bolster their defense, secure supply chain, and diversify energy source. North Korea ramped up its missile tests this year as it tends to do during periods of political transitions in South Korea. It is also rumored to be preparing for another nuclear test. Provocations will continue as the North is responding to the hawkish orientation of the Yoon administration. Investors should expect a rise in geopolitical risk in the peninsular, but on a relative basis, due to its strong alliance network, Korean risk will be lower compared to Taiwan (Chart 10). Korea will benefit from a rebound in China in the near term, but in the long-term, it is a secure source of semiconductors and high-tech exports, as Greater China will be mired in long-term geopolitical instability. Chart 10Korea: GeoRisk Indicator
Korea: GeoRisk Indicator
Korea: GeoRisk Indicator
Bottom Line: Overweight South Korean equities relative to emerging markets as a play on Chinese stimulus. Overweight Korea versus Taiwan. Australia GeoRisk Indicator Australia’s Labor Party ultimately obtained a one-seat majority in the House of Representatives following the general election in May (77 seats where 76 are needed). It does not have a majority in the Senate, where it falls 13 seats short of the 39 it needs. It will rely on the Green Party (12 seats) and a few stragglers to piece together ad hoc coalitions to pass legislation. Hence Prime Minister Anthony Albanese’s domestic agenda will be heavily constrained. Pragmatic policies to boost the economy are likely but major tax hikes and energy sector overhauls are unlikely (Chart 11). Chart 11Australia: GeoRisk Indicator
Australia: GeoRisk Indicator
Australia: GeoRisk Indicator
Fortunately for Albanese, his government is taking power in the wake of the pandemic, inflation, and Chinese slowdown, so that there is a prospect for the macroeconomic context to improve over his term in office. This could give him a tailwind. But for now he is limited. Like President Biden in the US, Albanese can attempt to reduce tensions with China after Xi Jinping consolidates power. But also like Biden, he will not have a basis for broad and durable re-engagement, since China’s regional ambitions threaten Australian national security over the long run. Global commodity supply constraints give Australia leverage over China. Bottom Line: Stay neutral on Australian currency and equities until global and Chinese growth stabilize. Brazil GeoRisk Indicator It would take a bolt of lightning to prevent former President Lula da Silva from winning re-election in Brazil’s October 2 first round election. Lula is more in line with the median voter than sitting President Jair Bolsonaro. Bolsonaro’s term has been marred with external shocks, following on a decade of recession and malaise. Polls may tighten ahead of the election but Lula is heavily favored. While ideologically to the left, Lula is a known quantity to global investors (Chart 12). However, Bolsonaro may attempt to cling to power, straining the constitutional system and various institutions. A military coup is unlikely but incidents of insubordination cannot be ruled out. Once Lula is inaugurated, a market riot may be necessary to discipline his new administration and ensure that his policies do not stray too far into left-wing populism. Chart 12Brazil: GeoRisk Indicator
Brazil: GeoRisk Indicator
Brazil: GeoRisk Indicator
Brazil’s macroeconomic context is less favorable than it was when Lula first ruled. During the 2000s he rode the wave of Chinese industrialization and a global commodity boom. Today China is slipping into a balance sheet recession and the next wave of industrialization has not yet taken off. Brazil’s public debt dynamics discourage a structural overweight on Brazil within emerging markets. At least Brazil is geopolitically secure – far separated from the conflicts marring Russia, East Europe, China, and East Asia. It also has a decade of bad news behind it that is already priced. Bottom Line: Stay neutral Brazilian assets until global and Chinese growth stabilize and the crisis-prone election season is over. South Africa GeoRisk Indicator South Africa’s economy continues to face major headwinds amid persistent structural issues that have yet to be adequately addressed and resolved by policy makers. The latest bout of severe energy supply cuts by the state-run energy producer, Eskom, serve as a reminder to investors that South Africa’s economy is still dealing with a major issue of generating an uninterrupted supply of electricity. Each day that electricity supply is cut to businesses and households, the local economy stalls. Among other macroeconomic issues such as high unemployment and rising inflation, low-income households which are too the median voter, are facing increasing hardships. The political backdrop is geared toward further increases in political risk going forward (Chart 13). Chart 13South Africa: GeoRisk Indicator
South Africa: GeoRisk Indicator
South Africa: GeoRisk Indicator
Fiscal reform and austerity are underway but won’t last long enough to make a material difference in government finances. The 2024 election is not that far out and the ruling political party, the ANC, will look to quell growing economic pressures to shore up voter support and reinforce its voter base. Fiscal austerity will unwind. Meanwhile, the bull market in global metal prices stands to moderate on weakening global growth, which reduces a tailwind for the rand, South African equities relative to other emerging markets, and government coffers, reducing our reasons for slight optimism on South Africa until global growth stabilizes. Bottom Line: Shift to a neutral stance on South Africa until global and Chinese growth stabilize. Canada GeoRisk Indicator Canadian political risk has spiked since the pandemic (Chart 14). Populist politics can grow over time in Canada, especially if the property sector goes bust. However, the country is geopolitically secure and benefits from proximity to the US economy. Chart 14Canada: GeoRisk Indicator
Canada: GeoRisk Indicator
Canada: GeoRisk Indicator
Global commodity supply constraints create opportunities for Canada as governments around the world pursue fiscal programs directed at energy security, national defense, and supply chain resilience. Bottom Line: Stay neutral Canadian currency and equities. While Canada benefits from the high oil price and robust US economy, rising interest rates pose a threat to its high-debt model, while US growth faces disappointments due to Europe’s and China’s troubles. Matt Gertken Chief Geopolitical Strategist mattg@bcaresearch.com Yushu Ma Research Analyst yushu.ma@bcaresearch.com Jesse Anak Kuri Associate Editor jesse.kuri@bcaresearch.com Guy Russell Senior Analyst GuyR@bcaresearch.com Alice Brocheux Research Associate alice.brocheux@bcaresearch.com Strategic Themes Open Tactical Positions (0-6 Months) Open Cyclical Recommendations (6-18 Months) Regional Geopolitical Risk Matrix Section III: Geopolitical Calendar