Equities

Listen to a short summary of this report. Executive Summary The odds of a recession in the US are lower than widely perceived. The probability of a recession is higher in Europe, although this week’s partial resumption of gas flows through the Nord Stream 1 pipeline, along with increased use of coal-fired power plants, should soften the blow. Chinese growth should rebound in the second half of the year. However, the specter of future lockdowns, the shift in global spending away from manufactured goods towards services, and the weakening property sector will continue to weigh on activity. With the Twentieth Party Congress slated for later this year, it is increasingly likely that the authorities will open up a firehose of stimulus. Fading recession risks will buoy stocks in the near term. However, a brighter economic outlook also means that the Fed, and several other central banks, may see little need to cut policy rates in 2023, as the markets are currently discounting. The end result is that government bond yields will rise from current levels, implying that stock valuations will not return to last year’s levels even if a recession is averted. After Rapidly Raising Rates, Markets Expect Some DM Central Banks To Start Easing Next Year
The Downside Of A Soft Landing
The Downside Of A Soft Landing
Bottom Line: We recommend a modest overweight on global equities for now but would turn neutral if the S&P 500 were to rise above 4,050. Dear Client, I am delighted to announce that Ritika Mankar, CFA, has joined the Global Investment Strategy team. Ritika will be writing occasional special reports on a variety of topical issues. Next week, she will make the case that the US economy’s ability to spawn mega-sized companies may become increasingly compromised over the next decade. Best regards, Peter Berezin, Chief Global Strategist The Case for a Soft Landing in the US Chart 1Cyclicals Underperformed Defensives As Recession Risks Intensified
Cyclicals Underperformed Defensives As Recession Risks Intensified
Cyclicals Underperformed Defensives As Recession Risks Intensified
Over the last few months, investors have become concerned that the Fed and many other central banks will need to engineer a recession in order to bring inflation down to more comfortable levels. While these fears have abated over the past trading week, they still continue to dominate market action (Chart 1). We place the odds of a US recession at about 40%. This is arguably more optimistic than the consensus view. According to Bank of America, the majority of fund managers saw recession as likely in this month’s survey. Not surprisingly, investors consider recession to be a major risk for equities over the next 12 months (Chart 2). Chart 2Many Investors Now See Recession As Baked In The Cake
The Downside Of A Soft Landing
The Downside Of A Soft Landing
Even if a recession does occur, we have contended that it will likely be a mild one, perhaps so mild that it will be difficult to distinguish it from a soft landing. A number of things make a soft landing in the US more probable than in the past: Labor supply has scope to increase. The labor participation rate is still 1.2 percentage points below its pre-pandemic level, two-thirds of which is due to decreased participation among workers under the age of 55 (Chart 3). The share of workers holding multiple jobs is also below its pre-pandemic level (Chart 4). The number of multiple job holders has been rising briskly lately. That is one reason why job growth in the payroll survey – which double counts workers if they hold more than one job – has been stronger than job growth in the household survey. Increased labor supply would obviate the need for the Fed to take drastic actions to curtail labor demand in its effort to restore balance to the labor market. Chart 3Labor Supply Has Scope To Rise
Labor Supply Has Scope To Rise
Labor Supply Has Scope To Rise
Chart 4The Number Of Multiple Job Holders Is Still Below Pre-Pandemic Levels
The Number Of Multiple Job Holders Is Still Below Pre-Pandemic Levels
The Number Of Multiple Job Holders Is Still Below Pre-Pandemic Levels
A high level of job openings creates a moat around the labor market. There are almost two times as many job openings as there are unemployed workers in the US (Chart 5). Many firms are likely to pull job openings before they cut jobs in response to a slowing economy. A high level of job openings will also allow workers who lose their jobs to find employment more quickly than usual, thus limiting the rise in so-called frictional unemployment. It is worth noting that the job openings rate has declined from a record 7.3% in March to a still-high 6.9% in May, with no change in the unemployment rate over this period. Chart 5A High Level Of Job Openings Creates A Moat Around The Labor Market
A High Level Of Job Openings Creates A Moat Around The Labor Market
A High Level Of Job Openings Creates A Moat Around The Labor Market
A steep Phillips curve implies that only a modest increase in unemployment may be necessary to knock down inflation towards the Fed’s target. Just as was the case in the 1960s, the Phillips curve has proven to be kinked near full employment (Chart 6). Unlike in the late 1960s, however, when rising realized inflation caused long-term inflation expectations to reset higher, expectations have remained well anchored this time around (Chart 7). Chart 6The Phillips Curve Is Kinked At Very Low Levels Of Unemployment
The Downside Of A Soft Landing
The Downside Of A Soft Landing
Chart 7Long-Term Inflation Expectations Are Well Anchored
Long-Term Inflation Expectations Are Well Anchored
Long-Term Inflation Expectations Are Well Anchored
The unwinding of pandemic and war-related dislocations should push down inflation. A recent study by the San Francisco Fed estimates that about half of May’s PCE inflation print was the result of supply-side disturbances (Chart 8). While the ongoing war in Ukraine and the threat of another Covid wave in China will continue to unsettle global supply chains, these problems should fade over time. Falling inflation would allow real wages to start rising again. This would bolster confidence, making a soft landing more likely (Chart 9). Chart 8Supply Factors Explain Half Of The Increase In Prices Over The Past Year
The Downside Of A Soft Landing
The Downside Of A Soft Landing
Chart 9Positive Real Wage Growth Will Bolster Consumer Confidence
Positive Real Wage Growth Will Bolster Consumer Confidence
Positive Real Wage Growth Will Bolster Consumer Confidence
A lack of major financial imbalances makes the US economy more resilient to economic shocks. As a share of disposable income, US household debt is 34 percentage points below its 2008 peak (Chart 10). Relative to net worth, household debt is at multi-decade lows. About two-thirds of mortgages carry a FICO score above 760 compared to only one-third during the housing bubble (Chart 11). Non-mortgage consumer credit also remains in good shape, as my colleague Doug Peta elaborated in this week’s US Investment Strategy report. While corporate debt has risen over the past decade, the ratio of corporate debt-to-assets today is still below where it was during the 1990s. Moreover, thanks to stronger corporate profitability, the interest coverage ratio is near an all-time high (Chart 12). Chart 10AUS Household Debt Is Not Especially High Anymore (I)
US Household Debt Is Not Especially High Anymore (I)
US Household Debt Is Not Especially High Anymore (I)
Chart 10BUS Household Debt Is Not Especially High Anymore (II)
US Household Debt Is Not Especially High Anymore (II)
US Household Debt Is Not Especially High Anymore (II)
Chart 11FICO Scores For Residential Mortgages Have Improved Considerably Since The Pre-GFC Housing Bubble
The Downside Of A Soft Landing
The Downside Of A Soft Landing
Chart 12Corporate Balance Sheets Are In Decent Shape
Corporate Balance Sheets Are In Decent Shape
Corporate Balance Sheets Are In Decent Shape
Chart 13Tight Supply Limits The Downside Risks To Housing
Tight Supply Limits The Downside Risks To Housing
Tight Supply Limits The Downside Risks To Housing
Just like the US does not suffer from major financial imbalances, it does not suffer from any major economic imbalances either. The homeowner vacancy rate is near a record low, which should put a floor under residential investment (Chart 13). Outside of investment in intellectual property, which is not especially sensitive to the business cycle, nonresidential investment is still below pre-pandemic levels and not much above where it was as a share of GDP during the Great Recession (Chart 14). Spending on consumer durable goods has retraced four-fifths of its pandemic surge, with little ill-effect on aggregate employment (Chart 15). Chart 14Outside Of IP, Nonresidential Investment Is Still Low
Outside Of IP, Nonresidential Investment Is Still Low
Outside Of IP, Nonresidential Investment Is Still Low
Chart 15Spending On Durable Goods Has Been Normalizing Without Derailing The Economy
Spending On Durable Goods Has Been Normalizing Without Derailing The Economy
Spending On Durable Goods Has Been Normalizing Without Derailing The Economy
Europe: A Deep Freeze Will Likely Be Avoided Chart 16Russia Can Potentially Cause Significant Economic Damage In The EU If It Closes The Taps
The Downside Of A Soft Landing
The Downside Of A Soft Landing
The macroeconomic picture is less benign outside the US. Four years ago, German diplomats laughed off warnings that their country had become dangerously dependent on Russian energy. They are not laughing anymore. German industry, just like industry across much of Europe, is facing a major energy crunch. The IMF estimates that output losses associated with a full Russian gas shutoff over the next 12 months could amount to as much as 2.7% of GDP in the EU (Chart 16). In Central and Eastern Europe, output could shrink by 6%. Among the major economies, Germany and Italy are the most at risk. Fortunately, Europe is finally stepping up to the challenge. The highly ambitious REPowerEU plan seeks to displace two-thirds of Russian gas by the end of 2022. The plan does not include any additional energy that could be generated by increased usage of coal-fired power plants, a strategy that the European political establishment (including the German Green Party!) has only recently begun to champion. It is possible that EU leaders felt the need to generate a crisis mentality to justify the decision to burn more coal. Dire warnings about how Europe is prepared to ration gas also send a message to Russia that the EU is ready to suffer in order to thwart Putin’s despotic regime. Whether Europe actually follows through is a different story. It is worth noting that the Nord Stream 1 pipeline resumed operations this week after Germany received, over Ukrainian objections, a repaired turbine from Canada. The resumption of partial flows through the pipeline, along with increased fiscal support for households and firms, reduces the risks of a “deep freeze” recession in Europe. The unveiling of the ECB’s new Transmission Protection Instrument (TPI) this week should also help anchor sovereign credit spreads across the euro area. While the exact conditions under which the TPI will be engaged have yet to be fleshed out, we expect the terms to be fairly liberal, reflecting not only the lessons learned from last decade’s euro debt crisis, but also to serve as a powerful bulwark against Putin’s efforts to destabilize the EU economy. China: Government’s Growth Target Looks Increasingly Unrealistic Stronger growth in China would help European exporters (Chart 17). Chinese real GDP grew by just 0.4% in the second quarter from a year earlier as the economy was battered by Covid lockdowns. Activity should pick up in the second half of the year, but at this point, the government’s 5.5% growth target looks completely unachievable. The specter of future lockdowns, the shift in global spending away from manufactured goods towards services, and the weakening Chinese property sector are all weighing on the economy (Chart 18). Chart 17European Exporters Would Welcome A Stronger Chinese Economy
European Exporters Would Welcome A Stronger Chinese Economy
European Exporters Would Welcome A Stronger Chinese Economy
The authorities will likely seek to stimulate the economy by allowing local governments to bring forward $220 billion in bond issuance that had been originally slated for 2023. The problem is that land sales – the main source of local government revenue – have collapsed. Worried about the ability of local governments to service their obligations, both retail investors and banks have shied away from buying local government debt. Chart 18A Slowing Property Market And Covid Lockdowns Have Been Weighing On The Chinese Economy
A Slowing Property Market And Covid Lockdowns Have Been Weighing On The Chinese Economy
A Slowing Property Market And Covid Lockdowns Have Been Weighing On The Chinese Economy
Meanwhile, the inability of property developers to secure adequate financing to complete construction projects has left a growing number of home buyers in the lurch. In most cases, these properties were purchased off-the-plan. Understandably, home buyers have balked at the prospect of having to make mortgage payments on properties that they do not possess. With the Twentieth Party Congress slated for later this year, it is increasingly likely that the authorities will open up a firehose of stimulus, including increased assistance for property developers and banks, as well as income-support measures for households. While such measures will not address China’s myriad structural problems, they will help keep the economy afloat. Equity Valuations in a Soft-Landing Scenario A few weeks ago, the consensus view was that stocks would tumble in the second half of the year as the global economy fell into recession but would then rally in 2023 as central banks began lowering rates. We argued the opposite, namely that stocks would likely rebound in the second half of the year as the economy outperformed expectations but would then face renewed pressure in 2023 as it became clear that the Fed and several other central banks had no reason to cut rates (Chart 19). Chart 19After Rapidly Raising Rates, Markets Expect Some DM Central Banks To Start Easing Next Year
The Downside Of A Soft Landing
The Downside Of A Soft Landing
Chart 20Real Rates Have Jumped This Year
Real Rates Have Jumped This Year
Real Rates Have Jumped This Year
In a baseline scenario where a recession is averted, we argued that the S&P 500 could rise to 4,500 (60% odds). In contrast, we noted that the S&P 500 could fall to 3,500 in a mild recession scenario (30% odds) and to 2,900 in a deep recession scenario (10% odds). It is worth stressing that even at 4,500, the S&P 500 would still be 11% lower in real terms than it was on January 4th. At the stock market’s peak in January, the 10-year TIPS yield stood at -0.91%, while the 30-year TIPS yield stood at -0.27%. Today, they stand at 0.58% and 0.93%, respectively (Chart 20). If real rates do not return to their prior lows, it is unlikely that equity valuations will return to their prior highs. This limits the upside for stocks, even in a soft-landing scenario. The sharp rally in stocks over the past week has priced out some of this recession risk, moving equity valuations closer towards what we regard as fair value. As we noted last week, we will turn neutral on equities if the S&P 500 were to rise above 4,050. As we go to press, we are only 1.3% from that level. Peter Berezin Chief Global Strategist peterb@bcaresearch.com Follow me on LinkedIn & Twitter Global Investment Strategy View Matrix
The Downside Of A Soft Landing
The Downside Of A Soft Landing
Special Trade Recommendations Current MacroQuant Model Scores
The Downside Of A Soft Landing
The Downside Of A Soft Landing
Table 1
Q2-2022 Earnings Commentary
Q2-2022 Earnings Commentary
Q2-22 reporting season is of paramount importance for investors as it may help shape market expectations into the balance of the year. After all, the multiples compression stage of the bear market, driven by entrenched inflation and monetary tightening, is likely complete. Now all eyes are on the growth and the ability of the companies to navigate the economy that is being slowed down by the Fed. The following is a quick snapshot of the results and expectations: As of July 20th, 60 S&P 500 companies have reported. According to Refinitiv, the S&P 500 EPS is expected to grow at 5.9% this quarter based on the expectations and the early results (blended). Excluding the Energy sector, the blended growth rate drops to -3.5% (Table 1). The S&P 500 blended sales growth is expected to be 11.2%. Excluding Energy, the rate falls to -3.9% (Table 1). 24 of the 60 companies that have reported are in the Financials sector, making it the only sector with a “critical mass” of results (24 out 42 in the sector). So far, the Financials sector has delivered a sales surprise of 1.3%, and an earnings surprise of 4.2% with 75% of companies beating analyst earnings expectations. The caveat here is that the bar for the sector has been set low, with analysts expecting earnings to contract by 21.7%. Some initial thoughts: Sales growth expectations by far exceed earnings growth expectations, signaling margins compression, and exacerbating trends that have started in Q1-2022. We have anticipated 2022 margins compression in the “Marginally Worse” report back in October 2021. So far corporate results have been reassuring, with a high share of companies beating both sales and earnings expectations. However, it is too early to draw far-reaching conclusions. On a positive note, the largest US banks have reported that their Net Income Margins (NIM) have expanded and describe US consumers as “healthy”. However, there are some red flags and negative guidance: Most banks have increased non-performing loan reserves which reflect their concerns about slowing growth and deteriorating credit conditions. Companies are reporting the adverse effects of withdrawing from Russia – IBM. The largest technology companies have announced hiring slowdowns on the back of the weakening demand for their products and overall concerns about the economy – Apple, Google, Amazon Companies across the board are mentioning the negative effects of dollar appreciation on their earnings from abroad – Microsoft pre-announcement, Johnson & Johnson, Pepsico, IBM, Halliburton, Netflix Slowdown in demand for chips – Micron, Nvidia Forward guidance has also been concerning. Most companies talk about deteriorating economic conditions. Chart 1
CHART 1
CHART 1
Despite the negative commentary summarized above, so far earnings have been strong. Then why are we worried about corporate earnings? First, analysts are still forecasting earnings to grow at about a 10% rate over the next 12 months despite ubiquitous negative corporate guidance. As Chart 1 highlights, most of that EPS growth is expected to come in Q3-22, which implies that over the next several months at least some of the macro headwinds (slowing growth, the hawkish Fed, stubborn inflation, energy crisis, and rising wages) will dissipate. We don’t consider this to be a high probability outcome as we are now halfway through the quarter, and macroeconomic conditions are not improving. Moreover, analysts themselves have little confidence in their own forecasts as is evident in the elevated earnings uncertainty (Chart 2). In all likelihood, downgrades are on the way. Second, our earnings growth regression model indicates that earnings growth is slowing, and earnings recession is likely within six months or so (Chart 3). Chart 2
CHART 2
CHART 2
Image
Bottom Line: We continue to recommend that investors remain patient and prudent in the range-bound markets. Earnings growth is likely to deteriorate into the year end.
Executive Summary China: Can The Economy Recover Without Housing Revival
Can The Economy Recover Without Housing Revival
Can The Economy Recover Without Housing Revival
The rebound in China’s business activity in June reflects the release of pent-up demand from the economic reopening after lockdowns in April and May. China’s credit growth recovered meaningfully in June due to large local government (LG) bond issuance. Private sector sentiment and credit demand remain sluggish. Home sales relapsed in the first two weeks of July after a one-off improvement in June, corroborating that the housing market’s fundamentals remain gloomy. Despite posting strong growth in June, Chinese exports are facing strong headwinds from weakening external demand. A contraction in exports is very likely in the second half of this year. Chinese domestic demand remains weak. Renewed rolling lockdowns are likely in view of the escalating Covid-19 cases related to a more infectious Omicron subvariant. The RMB will probably continue to depreciate relative to the US dollar in the next few months. Bottom Line: Investors should maintain a neutral stance on Chinese onshore stocks and an underweight stance on investable stocks in a global equity portfolio. The risk-reward profile of Chinese onshore and offshore stocks in absolute terms is not yet attractive. Chart 1High-Frequancy(Daily) Economic Indicators
High-Frequancy(Daily) Economic Indicators
High-Frequancy(Daily) Economic Indicators
The recent recovery in economic activity in June mainly reflects the release of pent-up demand after reopening from lockdowns in April and May. Odds are that this rebound will fade. The relapse in house sales and slowdown in steel production during the first two weeks of July suggest that China’s economy is still struggling to gain traction (Chart 1). China’s business cycle recovery will be more U shaped rather than a repeat of the V-shaped resurgence experienced following the early 2020 lockdown. At that time, a quick and strong revival in the property market and exports shored up China’s recovery in 2H20. In contrast, the economy’s progress in the second half of this year will be dragged down by shrinking exports, weak consumption and depressed demand for housing. China’s recovery will be more U shaped than V shaped for the following reasons: New financing schemes for infrastructure investment recently announced by authorities will not lead to a surge in infrastructure investments in 2H22. The basis is that these new funding sources will largely offset a shortfall in local government (LG) revenues from this year’s land sales, as we discussed in last week’s report. Thus, there will be little new stimulus for infrastructure beyond what was already approved in the budget plan earlier this year. Rolling lockdowns will persist as long as China’s stringent dynamic zero-Covid policy remains in place. The recent flare-up of the more infectious Omicron BA.5 subvariant cases in a few cities raise the likelihood of more lockdowns. The number of cities under mobility restrictions or some form of lockdown climbed during the second week of July (Chart 2). These cities account for around 11% of China’s GDP. The rolling lockdowns will continue to disrupt the economy. Private sector sentiment remains in the doldrums. The willingness to spend or invest among households and enterprises remains very depressed (Chart 3). This will ensure that the multiplier effect of fiscal and credit stimulus will be small. Chart 2The Odds Of Renewed Lockdowns Are Rising
The Odds Of Renewed Lockdowns Are Rising
The Odds Of Renewed Lockdowns Are Rising
Chart 3Sluggish Sentiment Among Chinese Households And Enterprises
Sluggish Sentiment Among Chinese Households And Enterprises
Sluggish Sentiment Among Chinese Households And Enterprises
Chart 4China: Can The Economy Recover Without Housing Revival
Can The Economy Recover Without Housing Revival
Can The Economy Recover Without Housing Revival
Since 2008 there has been no recovery in the mainland economy without buoyant real estate construction and surging property prices (Chart 4). Chinese exports are set to contract as the demand for goods from US and European consumers continues to shrink. Bottom Line: In absolute terms, the risk-reward profile of Chinese stocks is not yet attractive. We continue to recommend that investors maintain a neutral stance on China’s onshore stocks and underweight allocation on Chinese investable stocks within a global equity portfolio. Qingyun Xu, CFA Associate Editor qingyunx@bcaresearch.com Peeling Off Credit Data Chart 5June's Credit Growth Was Largely Driven By LG Bond Issuance
June's Credit Growth Was Largely Driven By LG Bond Issuance
June's Credit Growth Was Largely Driven By LG Bond Issuance
June’s strong credit growth was again driven by large LG bond issuance (Chart 5, top panel). Consequently, the credit impulse – calculated as a 12-month change in the flow of total social financing (TSF) as a percentage of nominal GDP – is much more muted when LG bond issuance is excluded (Chart 5, bottom panel). Medium- to long-term corporate loan growth only ticked up in June, but short-term bill financing has dropped dramatically (Chart 6). While it is difficult to quantify, it is highly likely that the modest upturn in corporate credit flow was due to (1) corporates’ pent-up demand for financing after the spring lockdowns and (2) the PBoC’s moral suasion used to boost the banks’ credit origination. Meanwhile, a PBoC survey released on June 29-30, showed that loan demand for all types of industrial enterprises plunged sharply in Q2, suggesting that sentiment is very weak among corporates (Chart 7). Chart 6Corporate Loan Growth Improved In June...
Corporate Loan Growth Improved In June...
Corporate Loan Growth Improved In June...
Chart 7… But Corporate Loan Demand Remains Very Weak
... But Corporates Remain Low Demand Very Weak
... But Corporates Remain Low Demand Very Weak
Household loan demand, which is highly correlated with home sales, remains shaky too (Chart 8, top panel). Medium- to long-term consumer loans continued to plunge, and the annual change in household loan origination remains negative (Chart 8, bottom panel). Chart 8Household Loan Demand Is Still Depressed
Household Loan Demand Is Still Depressed
Household Loan Demand Is Still Depressed
Chart 9The Credit And Fiscal Impulse Will Be Moderate
The Credit And Fiscal Impulse Will Be Moderate
The Credit And Fiscal Impulse Will Be Moderate
Overall, our projections for the combined credit and fiscal spending impulse for the rest of this year suggest that the aggregate fiscal and credit impulse will be improving but will be smaller than in 2020, 2016, 2013 and 2009 (Chart 9). Property Market: A Vicious Cycle Unfolding Home sales relapsed in the first two weeks of July after a one-off rebound in June. The weakness was broad-based across all city tiers. This implies that June’s bounce was driven by pent-up demand after lockdowns and does not represent a sustained revival (Chart 10). Sentiment among home buyers remains downbeat. The percentage of households planning to buy homes slipped further according to the PBoC’s urban household survey released on June 29 (Chart 11, top panel). Moreover, the percentage of households expecting home prices to rise has dived to the lowest level since early 2015 according to the same survey (Chart 11, bottom panel). Chart 10No Snapback In Housing Sales
No Snapback In Housing Sales
No Snapback In Housing Sales
Chart 11Downbeat Sentiment Among Home Buyers
Downbeat Sentiment Among Home Buyers
Downbeat Sentiment Among Home Buyers
Chart 12Real Estate Developers' Deteriorating Funding Will Further Dampen Housing Construction
Real Estate Developers' Deteriorating Funding Will Further Dampen Housing Construction
Real Estate Developers' Deteriorating Funding Will Further Dampen Housing Construction
Property developers are caught in a vicious cycle. Financing has not strengthened because the “three red lines” policy remains in place, and developers’ borrowing from banks shows no signs of amelioration (Chart 12, top panel). Critically, the plunge in the sector’s financing is resulting in shrinking housing completions (Chart 12, bottom panel). As property developers are suffering from liquidity shortages, they are dragging on existing construction projects. The upshot is that many Chinese cities are seeing delays in the completion of new homes. The latter is depressing buyers’ sentiment, generating a reluctance to buy properties, and curtailing deposits and advances to developers. In recent years, deposits and advances accounted for 50% of property developers’ financing. Without a substantial improvement in their financing, developers will not be in a position to service their excessive debts and deliver houses they have presold in the recent years. The latter will undermine their financing, closing the vicious cycle. In short, real estate developers’ liquidity shortfalls are evolving into solvency problems. These will continue dampening construction activity. An Export Contraction Ahead China’s exports were robust in June as supply chain and logistic disruptions faded. This was corroborated by last month’s advance in suppliers’ delivery times and production subindexes of China’s official Purchasing Managers’ Index (PMI) (Chart 13). Chart 13Chinese Logistics And Backlog Orders Pressures Have Eased In June
Chinese Logistics And Backlog Orders Pressures Have Eased In June
Chinese Logistics And Backlog Orders Pressures Have Eased In June
Yet, China’s new exports orders remain in contractionary territory (Chart 14). Moreover, the softness of Shanghai’s export container freight index is also signaling weakness in China’s exports (Chart 15). Chart 14External Demand For Chinese Export Goods Will Be Dwindling
External Demand For Chinese Export Goods Will Be Dwindling
External Demand For Chinese Export Goods Will Be Dwindling
Chart 15Signs Of Moderation In China's Exports
Signs Of Moderation In China's Exports
Signs Of Moderation In China's Exports
The shift in consumer spending in developed economies from manufactured goods to services has created headwinds for Chinese exports. US and European consumption of goods (ex-autos) is set to decline below its long-term trend (Chart 16). Given that retail inventories in the US have skyrocketed well above their pre-pandemic trend, US demand for consumer goods and, hence, Chinese exports will dwindle significantly when US retailers start to destock (Chart 17). Falling real household disposable income in the US and Europe will also fortify the downward trend in demand for consumer goods that China is a major producer of. Therefore, we expect shrinking Asian and Chinese exports in the second half of this year. Chart 16Developed Economies’ Household Demand For Goods ex-Autos Will Shrink
Developed Economies' Household Demand For Goods ex-Autos Will Experience Mean Reversion
Developed Economies' Household Demand For Goods ex-Autos Will Experience Mean Reversion
Chart 17Well-Stocked Shelves In The US Bode Poorly For Chinese Exports
Well-Stocked Shelves In The US Bode Poorly For Chinese Export
Well-Stocked Shelves In The US Bode Poorly For Chinese Export
Very Sluggish Domestic Demand Both consumer spending and capital expenditure remain in the doldrums. Traditional infrastructure investments picked up strongly in June, while investments in the real estate sector weakened further (Chart 18). Contracting exports will weigh on investments in manufacturing. Even as infrastructure investment recovers modestly, the downtrend in manufacturing and property fixed-asset investments will cap China’s capital spending in 2H22. Capital spending in traditional infrastructure, real estate and manufacturing account for 24%, 19% and 31% of fixed-asset investment, respectively. Chart 18Shrinking Real Estate Investment Will Remain A Drag On Chinese Investment Growth In 2H
Shrinking Real Estate Investment Will Remain A Drag On Chinese Investment Growth In 2H
Shrinking Real Estate Investment Will Remain A Drag On Chinese Investment Growth In 2H
Chart 19Contracting Import Volume Reflects China's Sluggish Domestic Demand
Contracting Import Volume Reflects China's Sluggish Domestic Demand
Contracting Import Volume Reflects China's Sluggish Domestic Demand
Imports for domestic consumption (excluding imports for processing and re-exports) are a good proxy for domestic demand trajectory. In June, import volumes contracted deeply at 12% on a year-on-year basis, reflecting sluggish domestic demand (Chart 19). Worryingly, import volume contraction is widespread from key commodities to semiconductors and capital goods (Chart 20A and 20B). Chart 20ABroad-Based Contraction In Imports
Broad-Based Contraction In ... Chinese Imports Of Key Commodities Deteriorated In June
Broad-Based Contraction In ... Chinese Imports Of Key Commodities Deteriorated In June
Chart 20BBroad-Based Contraction In Imports
... Imports And key Imports Categories Chinese Domestic Demand Has Been Absent Over The Past 12 Months
... Imports And key Imports Categories Chinese Domestic Demand Has Been Absent Over The Past 12 Months
Chart 21Rising New Covid Cases In China Will Constrain Domestic Consumption Recovery
Rising New Covid Cases In China Will Constrain Domestic Consumption Recovery
Rising New Covid Cases In China Will Constrain Domestic Consumption Recovery
Moreover, the recent increase in Covid-19 cases and ensuing lockdowns in China will curb household consumption and the service sector’s activities in the next few months (Chart 21). Newly released labor market data show a mixed picture. The nationwide urban survey-based unemployment rate fell in June, but the unemployment rate among younger workers surged to the highest point since data collection began in 2018 (Chart 22, top panel). Reflecting weak employment conditions, new urban job creation in the first half of the year withered compared with the same period last year (Chart 22, bottom panel). Rapidly deteriorating income prospects are reinforcing households’ downbeat sentiment. A PBoC survey released on June 29 shows that confidence of future income in Q2 plummeted to its lowest level during the past two decades, while the preference for more saving deposits soared to the highest level since data collection began in 2002 (Chart 23). The latter entails that households’ consumption recovery will be gradual and halting, at best, in the second half of this year. Chart 22Skyrocketed Unemployment Rate Among Young Workers Is A Big Problem Of Chinese Labor Market
Skyrocketed Unemployment Rate Among Young Workers Is A Big Problem Of Chinese Labor Market
Skyrocketed Unemployment Rate Among Young Workers Is A Big Problem Of Chinese Labor Market
Chart 23Low Confidence In Future Income Contributes To Households' Unwillingness To Consume
low Confidence In Future Income Contributes To Households' Unwillingness To Consume
low Confidence In Future Income Contributes To Households' Unwillingness To Consume
The RMB Is Facing Downside Risks In The Near Term Chart 24RMB Is Still Vulnerable
RMB Is Still Vulnerable
RMB Is Still Vulnerable
The RMB has depreciated by about 6% against the US dollar since March, and we believe this trend will continue in the next few months. China’s interest rate differential versus the US dollar has fallen deeper into negative territory, and the gap may widen even more given that the inflation and monetary policy cycles in China and the US will continue to diverge (Chart 24, top panel). Thus, Chinese fixed-income market outflow pressures could endure this year (Chart 24, bottom panel). Moreover, as discussed in the section above, Chinese exports are set to shrink in the second half of the year. This will also weigh on the RMB. Notably, Chinese companies have started to increase their demand for USD. The net FX settlement rate by banks on behalf of clients has fallen below zero, albeit only marginally (Chart 25). This means more non-financial enterprises (such as exporters and investors) bought from than sold foreign currency to banks (Chart 25, bottom panel). Furthermore, foreign outflows from the onshore equity market have resumed and will likely be sustained, at least through the next few months (Chart 26). Foreign investors will likely flee from Chinese onshore stocks as global stocks continue selling off and China’s economic recovery disappoints in the second half of this year. Chart 25Contracting Exports Will Weigh On The RMB
Contracting Exports Will Weigh On The RMB
Contracting Exports Will Weigh On The RMB
Chart 26Onshore Equity Market Foreign Outflow Pressures Remain, At Least In The Near Term
Onshore Equity Market Foreign Outflow Pressures Remain, At Least In The Near Term
Onshore Equity Market Foreign Outflow Pressures Remain, At Least In The Near Term
Chinese Equity Market Technicals: Tell-Tale Signs Chart 27A-Shares Has Not Broken Above 200-Day Moving Average
A-Shares Has Not Broken Above 200-Day Moving Average
A-Shares Has Not Broken Above 200-Day Moving Average
The rebound in China’s onshore CSI 300 stock index had been obstructed at its 200-day moving average (Chart 27). A failure to break above this technical resistance would imply non-trivial downside – a retest of its recent lows, at least. The relative performance of the MSCI China All-Share Index – which includes all onshore- and offshore-listed stocks – versus the global equity index has petered off at its previous troughs (Chart 28). This is a tell-tale sign of a major relapse. Chart 28A Tell-Sign Of Major Downtrend
A Tell-Sign Of Major Downtrend
A Tell-Sign Of Major Downtrend
Chart 29Chinese Tech Stocks Still Appear Fragile
Chinese Tech Stocks Still Appear Fragile
Chinese Tech Stocks Still Appear Fragile
The Hang Seng Tech index – which tracks Chinese offshore tech stocks/platform companies – has also failed to break above its 200-day moving average (Chart 29). This entails that the bear market in these share prices might not be yet over. Chart 30Two Large-Cap Chinese Stocks
Two Large-Cap Chinese Stocks
Two Large-Cap Chinese Stocks
China’s two largest stocks (by market capitalization) – Tencent and Alibaba – may not be out of the woods: Alibaba has failed at its 200-day moving average (Chart 30, top panel). Tencent has failed to rebound at all (Chart 30, bottom panel). Odds are it will likely drop more. Table 1China Macro Data Summary
China’s Recovery: U Or V Shaped?
China’s Recovery: U Or V Shaped?
Table 2China Financial Market Performance Summary
China’s Recovery: U Or V Shaped?
China’s Recovery: U Or V Shaped?
Footnotes Strategic Themes Cyclical Recommendations
According to the latest Bank of America monthly fund manager survey, investors’ allocation to stocks collapsed to lows not seen since October 2008. Similarly, exposure to cash is now at the highest level since 2001 and a net 58% of respondents reported taking…
Valuations are largely responsible for the year-to-date equity selloff. Meanwhile, earnings estimates have remained relatively resilient even though global growth has slowed globally. Two factors explain this earnings puzzle. First, soaring energy…
The energy crisis remains a headwind to the eurozone economy, raising the possibility that Europe will need to ration electricity this winter. Indeed, the European Commission’s measure of consumer confidence slumped this year and is now broadly in line with…
Listen to a short summary of this report. Executive Summary The TIPS Market Foresees A Sharp Deceleration In Inflation
What If The TIPS Are Right?
What If The TIPS Are Right?
TIPS breakevens are pointing to a rapid decline in US inflation over the next two years. If the TIPS are right, the Fed will not need to raise rates faster than what is already discounted over the next six months. Falling inflation will allow real wages to start rising again. This will bolster consumer confidence, making a recession less likely. The surprising increase in analyst EPS estimates this year partly reflects the contribution of increased energy profits and the fact that earnings are expressed in nominal terms while economic growth is usually expressed in real terms. Nevertheless, even a mild recession would probably knock down operating earnings by 15%-to-20%. While a recession in the US is not our base case, it is for Europe. A European recession is likely to be short-lived with the initial shock from lower Russian gas flows counterbalanced by income-support measures and ramped-up spending on energy infrastructure and defense. We are setting a limit order to buy EUR/USD at 0.981. Bottom Line: Stocks lack an immediate macro driver to move higher, but that driver should come in the form of lower inflation prints starting as early as next month. Investors should maintain a modest overweight to global equities. That said, barring any material developments, we would turn neutral on stocks if the S&P 500 were to rise above 4,050. US CPI Surprises to the Upside… Again Investors hoping for some relief on the inflation front were disappointed once again this week. The US headline CPI rose 1.32% month-over-month in June, above the consensus of 1.1%. Core inflation increased to 0.71%, surpassing consensus estimates of 0.5%. The key question is how much of June’s report is “water under the bridge” and how much is a harbinger of things to come. Since the CPI data for June was collected, oil prices have dropped to below $100/bbl. Nationwide gasoline prices have fallen for four straight weeks, with the futures market pointing to further declines in the months ahead. Agriculture and metals prices have swooned. Used car prices are heading south. Wage growth has slowed to about 4% from around 6.5% in the second half of last year. The rate of change in the Zillow rent index has rolled over, albeit from high levels (Chart 1). The Zumper National Rent index is sending a similar message as the Zillow data. All this suggests that inflation may be peaking. The TIPS market certainly agrees. It is discounting a rapid decline in US inflation over the next few years. This week’s inflation report did little to change that fact (Chart 2). Chart 1Some Signs That Inflation Has Peaked
Some Signs That Inflation Has Peaked
Some Signs That Inflation Has Peaked
Chart 2Investors Expect Inflation To Fall Rapidly Over The Next Few Years
What If The TIPS Are Right?
What If The TIPS Are Right?
TIPS Still Siding with Team Transitory If the TIPS market is right, this would have two important implications. First, the Fed would not need to raise rates more quickly over the next six months than the OIS curve is currently discounting (although it probably would not need to cut rates in 2023 either, given our higher-than-consensus view of where the US neutral rate lies) (Chart 3). The second implication is that real wages, which have declined over the past year, will start rising again as inflation heads lower. Falling real wages have sapped consumer confidence. As real wage growth turns positive, confidence will improve, helping to bolster consumer spending (Chart 4). To the extent that consumption accounts for nearly 70% of the US economy – and other components of GDP such as investment generally take their cues from consumer spending – this would significantly raise the odds of a soft landing. Chart 3The Fed Is Signaling That It Will Raise Rates To Almost 4% In 2023
The Fed Is Signaling That It Will Raise Rates To Almost 4% In 2023
The Fed Is Signaling That It Will Raise Rates To Almost 4% In 2023
Chart 4Positive Real Wage Growth Will Provide A Boost To Consumer Confidence
Positive Real Wage Growth Will Provide A Boost To Consumer Confidence
Positive Real Wage Growth Will Provide A Boost To Consumer Confidence
Chart 5Long-Term Inflation Expectations Remain Well Anchored
Long-Term Inflation Expectations Remain Well Anchored
Long-Term Inflation Expectations Remain Well Anchored
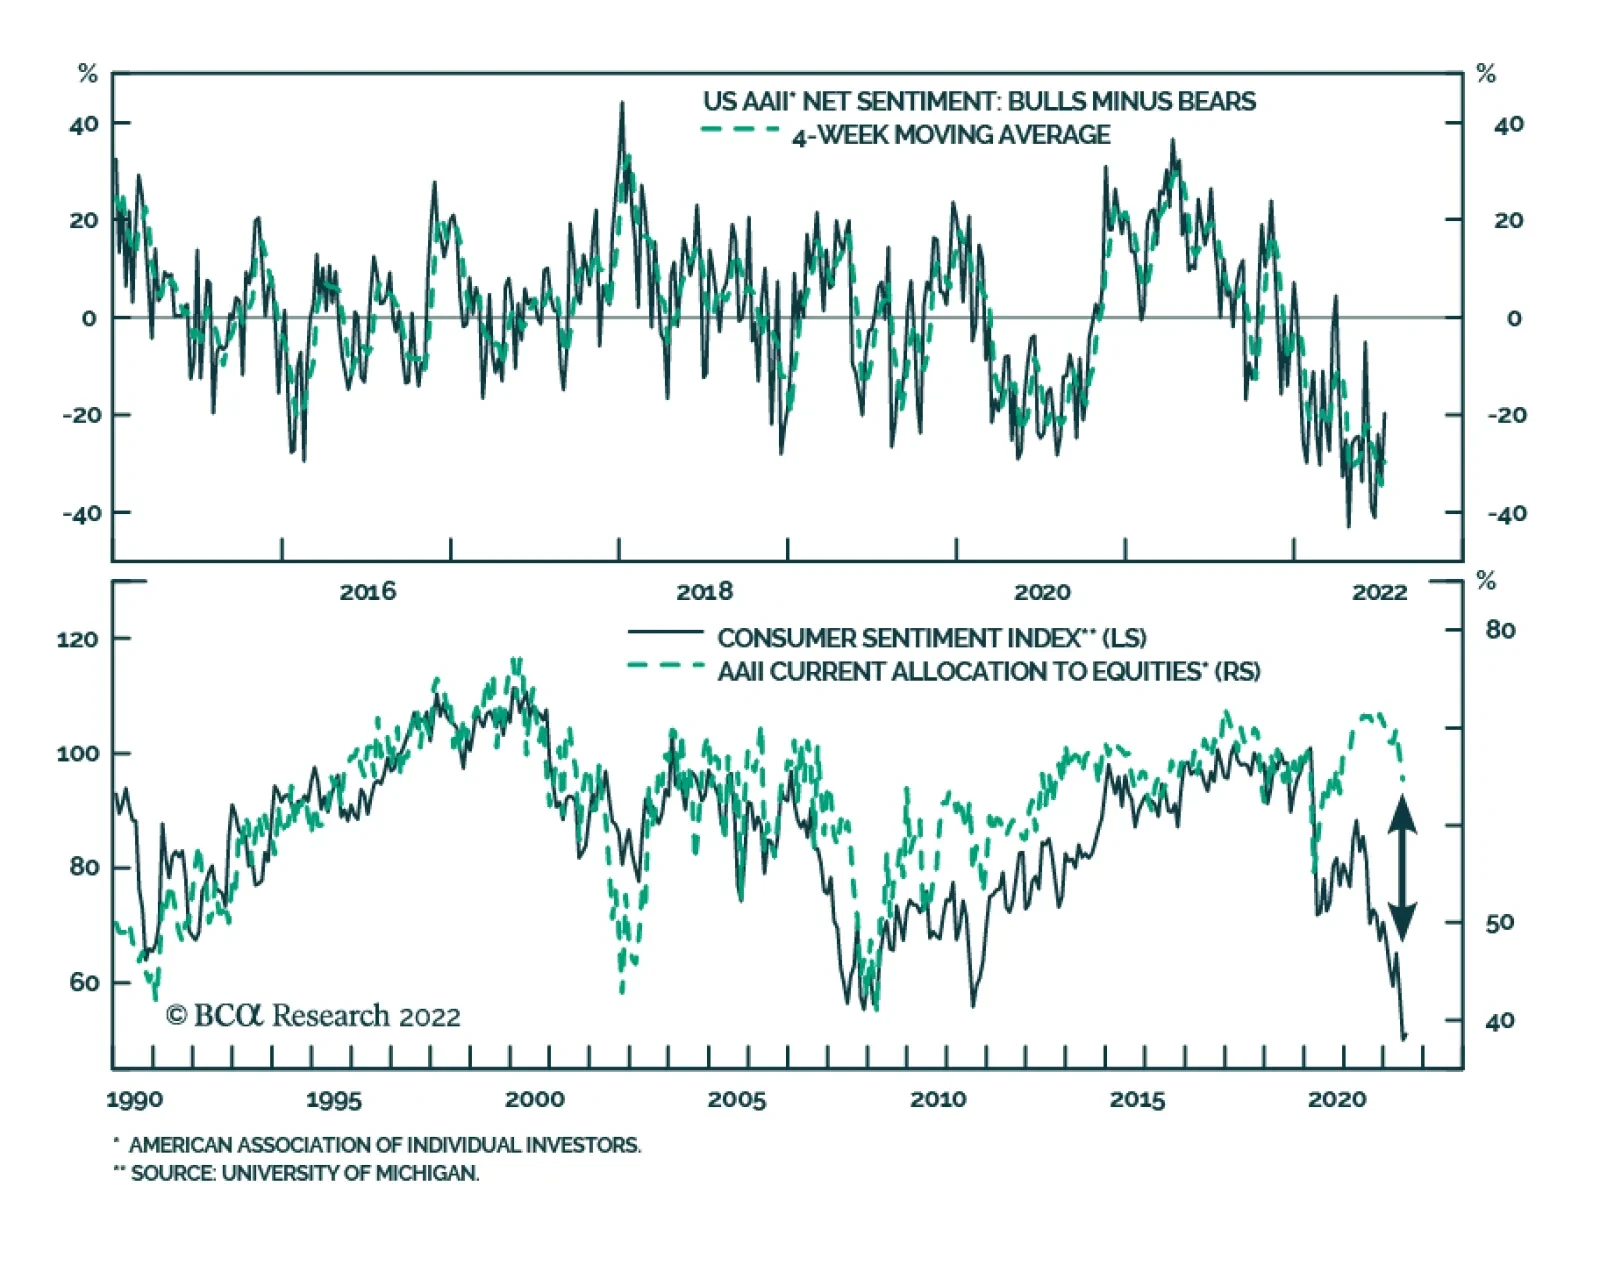
Of course, the TIPS market could be wrong. Bond traders do not set prices and wages. Businesses and workers, interacting with each other, ultimately determine the direction of inflation. Yet, the view of the TIPS market is broadly in sync with the view of most households and businesses. Expected inflation 5-to-10 years out in the University of Michigan survey has risen since the pandemic began, but at about 3%, it is close to where it was for most of the period between 1995 and 2015 (Chart 5). As we pointed out in our recently published Third Quarter Strategy Outlook, and as I discussed in last week’s webcast, the fact that long-term inflation expectations are well anchored implies that the sacrifice ratio – the amount of output that must be forgone to bring down inflation by a given amount — may be quite low. This also raises the odds of a soft landing. Investors Now See Recession as the Base Case Our relatively sanguine view of the US economy leaves us in the minority camp. According to recent polling, more than 70% of US adults expect the economy to be in recession by year-end. Within the investment community, nearly half of retail traders and three-quarters of high-level asset allocators expect a recession within the next 12 months (Chart 6). Chart 6Many Investors Now See Recession As Baked In The Cake
What If The TIPS Are Right?
What If The TIPS Are Right?
Reflecting the downbeat mood among investors, bears exceeded bulls by 20 points in the most recent weekly poll by the American Association of Individual Investors (Chart 7). A record low percentage of respondents in the New York Fed’s Survey of Consumer Expectations believes stocks will rise over the next year (Chart 8). Chart 7Bears Exceed The Bulls By A Wide Margin
Bears Exceed The Bulls By A Wide Margin
Bears Exceed The Bulls By A Wide Margin
Chart 8Households Are Pessimistic On Stocks
Households Are Pessimistic On Stocks
Households Are Pessimistic On Stocks
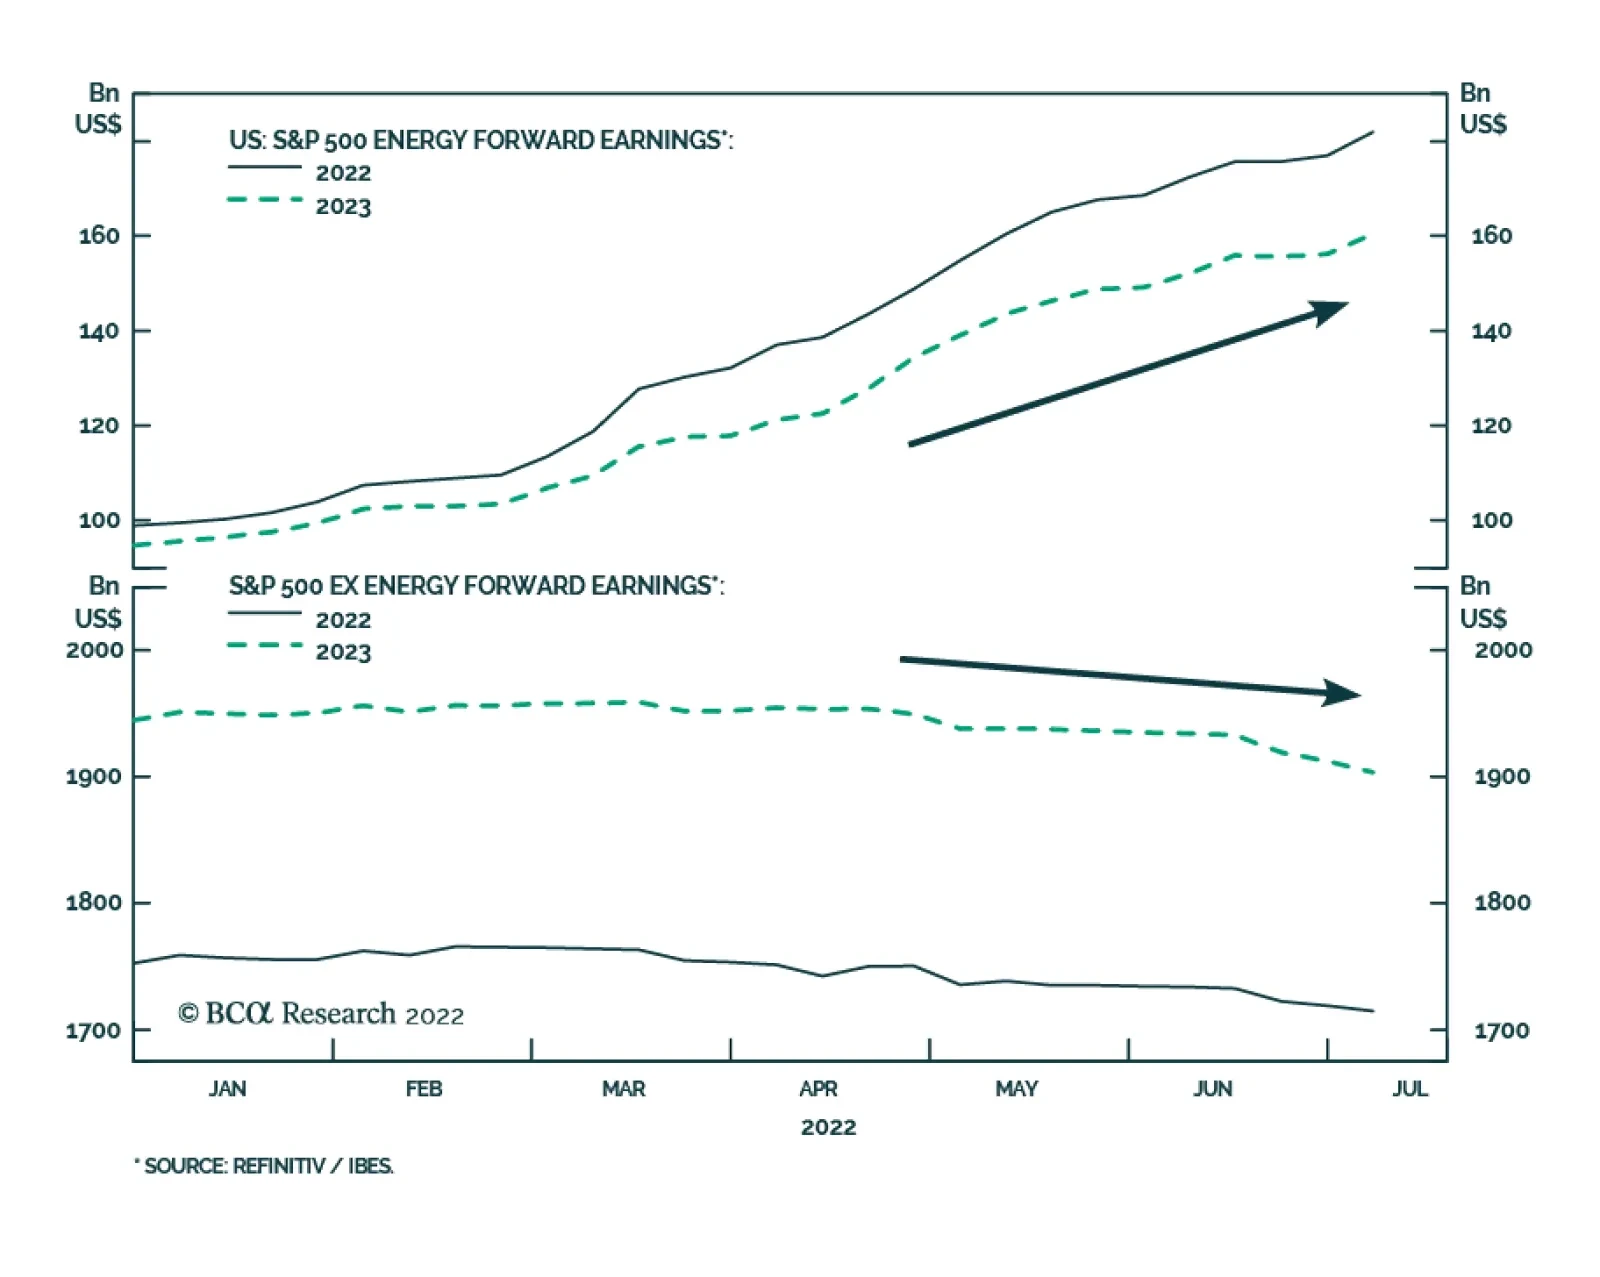
Resilient Earnings Estimates Admittedly, while sentiment on the economy and the stock market has soured, analyst earnings estimates have yet to decline significantly. In fact, in both the US and the euro area, EPS estimates for 2022 and 2023 are higher today than they were at the start of the year (Chart 9). What’s going on? Part of the explanation reflects the sectoral composition of earnings. In the US, earnings estimates for 2022 are up 2.4% so far this year. Outside of the energy sector, however, 2022 earnings estimates are down 2.2% year-to-date and down 2.9% from their peak in February (Chart 10). Chart 9US And European EPS Estimates Are Up Year-To-Date
US And European EPS Estimates Are Up Year-To-Date
US And European EPS Estimates Are Up Year-To-Date
Another explanation centers on the fact that earnings estimates are expressed in nominal terms while GDP growth is usually expressed in real terms. When inflation is elevated, the difference between real and nominal variables can be important. For example, while US real GDP contracted by 1.6% in Q1, nominal GDP rose by 6.6%. Gross Domestic Income (GDI), which conceptually should equal GDP but can differ due to measurement issues, rose by 1.8% in real terms and by a whopping 10.2% in nominal terms in Q1. Chart 10Soaring Energy Prices Have Boosted Earnings Estimates
Soaring Energy Prices Have Boosted Earnings Estimates
Soaring Energy Prices Have Boosted Earnings Estimates
How Much Bad News Has Been Discounted? Historically, stocks have peaked at approximately the same time as forward earnings estimates have reached their apex. This time around, stocks have swooned well in advance of any cut to earnings estimates (Chart 11). At the time of writing, the S&P 500 was down 25% in real terms from its peak on January 3. Chart 11Unlike In Past Cycles, Stocks Peaked Well Before Earnings
What If The TIPS Are Right?
What If The TIPS Are Right?
This suggests that investors have already discounted some earnings cuts, even if analysts have yet to pencil them in. Consistent with this observation, two-thirds of investors in a recent Bloomberg poll agreed that analysts were “behind the curve” in responding to the deteriorating macro backdrop (Chart 12). Chart 12Most Investors Expect Analyst Earnings Estimates To Come Down
What If The TIPS Are Right?
What If The TIPS Are Right?
Nevertheless, it is likely that stocks would fall further if the economy were to enter a recession. Even in mild recessions, operating profits have fallen by about 15%-to-20% (Chart 13). That is probably a more severe outcome than the market is currently discounting. Chart 13Even A Mild Recession Could Significantly Knock Down Earnings Estimates
Even A Mild Recession Could Significantly Knock Down Earnings Estimates
Even A Mild Recession Could Significantly Knock Down Earnings Estimates
Subjectively, we would expect the S&P 500 to drop to 3,500 over the next 12 months in a mild recession scenario where growth falls into negative territory for a few quarters (30% odds) and to 2,900 in a deep recession scenario where the unemployment rate rises by more than four percentage points from current levels (10% odds). On the flipside, we would expect the S&P 500 to rebound to 4,500 in a scenario where a recession is completely averted (60% odds). A probability-weighted average of these three scenarios produces an expected total return of 8.3% (Table 1). This is enough to warrant a modest overweight to stocks, but just barely. Barring any material developments, we would turn neutral on stocks if the S&P 500 were to rise above 4,050. Table 1A Scenario Analysis For The S&P 500
What If The TIPS Are Right?
What If The TIPS Are Right?
What’s the Right Framework for Thinking About a European Recession? Whereas we would assign 40% odds to a recession in the US over the next 12 months, we would put the odds of a recession in Europe at around 60%. With a recession in Europe looking increasingly probable, a key question is what the nature of this recession would be. The pandemic may provide a useful framework for answering that question. Just as the pandemic represented an external shock to the global economy, the disruption to energy supplies, stemming from Russia’s invasion of Ukraine, represents an external shock to the European economy. In the initial phase of the pandemic, economic activity in developed economies collapsed as millions of workers were forced to isolate at home. Over the following months, however, the proliferation of work-from-home practices, the easing of lockdown measures, and ample fiscal support permitted growth to recover. Eventually, vaccines became available, which allowed for a further shift to normal life. Just as it took about two years for vaccines to become widely deployed, it will take time for Europe to wean itself off its dependence on Russian natural gas. Earlier this year, the IEA reckoned that the EU could displace more than a third of Russian gas imports within a year. The more ambitious REPowerEU plan foresees two-thirds of Russian gas being displaced by the end of 2022. In the meantime, some Russian gas will be necessary. Canada’s decision over Ukrainian objections to return a repaired turbine to Germany for use in the Nord Stream 1 gas pipeline suggests that a full cutoff of Russian gas flows is unlikely. Chart 14The Euro Is 26% Undervalued Against The Dollar Based On PPP
The Euro Is 26% Undervalued Against The Dollar Based On PPP
The Euro Is 26% Undervalued Against The Dollar Based On PPP
During the pandemic, governments wasted little time in passing legislation to ease the burden on households and businesses. The European energy crunch will elicit a similar response. Back when I worked at the IMF, a common mantra in designing lending programs was that one should “finance temporary shocks but adjust to permanent ones.” The current situation Europe is a textbook example for the merits of providing income support to the private sector, financed by temporarily larger public deficits. The ECB’s soon-to-be-launched “anti-fragmentation” program will allow the central bank to buy the government debt of Italy and other at-risk sovereign borrowers without the need for a formal European Stability Mechanism (ESM) program, provided that the long-term debt profile of the borrowers remains sustainable. Get Ready to Buy the Euro All this suggests that Europe could see a fairly brisk rebound after the energy crunch abates. If the euro area recovers quickly, the euro – which is now about as undervalued against the dollar as anytime in its history (Chart 14) – will soar. With that in mind, we are setting a limit order to buy EUR/USD at 0.981. Peter Berezin Chief Global Strategist peterb@bcaresearch.com Follow me on LinkedIn & Twitter Global Investment Strategy View Matrix
What If The TIPS Are Right?
What If The TIPS Are Right?
Special Trade Recommendations Current MacroQuant Model Scores
What If The TIPS Are Right?
What If The TIPS Are Right?
Executive Summary China's Unemployment
Questions From The Road
Questions From The Road
Over the past week we have been visiting clients along the US west coast. In this report we hit some of the highlights from the most important and frequently asked questions. Xi Jinping is seizing absolute power just as the country’s decades-long property boom turns to bust. He will stimulate the economy but Chinese stimulus is less effective than it used to be. The US and Israel are underscoring their red line against Iranian nuclear weaponization. If Iran does not freeze its nuclear program, the Middle East will begin to unravel again. The UK’s domestic instability is returning, with Scotland threatening to leave the union. Brexit, the pandemic, and inflation make a Scottish referendum a more serious risk than in the past. Shinzo Abe’s assassination makes him a martyr for a vision of Japan as a “normal country” – i.e. one that is not pacifist but capable of defending itself. Japan’s rearmament, like Germany’s, points to the decline of the WWII peace settlement and the return of great power competition. Bottom Line: Investors need a new global balance to be achieved through US diplomacy with Russia, China, and Iran. That is not forthcoming, as the chief nations face instability at home and a stagflationary global economy. Feature The world is becoming less stable as stagflation combines with great power competition. Global uncertainty is through the roof. From a macroeconomic perspective, investors need to know whether central banks can whip inflation without triggering a recession. From a geopolitical perspective, investors need to know whether Russia’s conflict with the West will expand, whether US-China and US-Iran tensions will escalate in a damaging way, and whether domestic political rotations in the US and China this fall will lead to more stable and productive economies. China: What Will Happen At The Communist Party Reshuffle? General Secretary Xi Jinping will cement another five-to-10 years in power while promoting members of his faction into key positions on the Politburo and Politburo Standing Committee. By December Xi will roll out a pro-growth strategy for 2023 and the government will signal that it will start relaxing Covid-19 restrictions. But China’s structural problems ensure that this good news for global growth will only have a fleeting effect. China’s governance is shifting from single-party rule to single-person rule. It is also shifting from commercially focused decentralization to national security focused centralization. Xi has concentrated power in himself, in the party, and in Beijing at the expense of political opponents, the private economy, and outlying regions like Hong Kong, the South China Sea, and Xinjiang. The subordination of Taiwan is the next major project, ensuring that China will ally with Russia and that the US and China cannot repair or deepen their economic partnership. Related Report Geopolitical StrategyWill China Let 100 Flowers Bloom? Only Briefly. Xi and the Communist Party began centralizing political power and economic control shortly after the Great Recession. At that time it became clear that a painful transition away from export manufacturing and close relations with the United States was necessary. The transition would jeopardize China’s long-term economic, social, political, and geopolitical stability. The Communist Party believed it needed to revive strongman leadership (autocracy) rather than pursuing greater liberalization that would ultimately increase the odds of political revolution (democratization). The Xi administration has struggled to manage the country’s vast debt bubble, given that total debt standing has surged to 287% of GDP. The global pandemic forced the government to launch another large stimulus package, which it then attempted to contain. Corporate and household deleveraging ensued. The property and infrastructure boom of the past three decades has stalled, as the regime has imposed liquidity and capital requirements on banks and property developers to try to avoid a financial crisis. Regulatory tightening occurred in other sectors to try to steer investment into government-approved sectors and reduce the odds of technological advancement fanning social dissent. China’s draconian “zero Covid” policy sought to limit the disease’s toll, improve China’s economic self-reliance, and eliminate the threat of social protest during the year of the twentieth party congress. But it also slammed the brakes on growth. China is highly vulnerable to social instability for both structural and cyclical reasons. Chinese social unrest was our number one “Black Swan” for this year and it is now starting to take shape in the form of angry mortgage owners across the country refusing to make mortgage payments on houses that were pre-purchased but not yet built and delivered (Chart 1). Chart 1China: Mortgage Payment Boycott
Questions From The Road
Questions From The Road
The mortgage payment boycott is important because it is stemming from the outstanding economic and financial imbalance – the property sector – and because it is a form of cross-regional social organization, which the Communist Party will disapprove. There are other social protests emerging, including low-level bank runs, which must be monitored very closely. Local authorities will act quickly to stop the spread of the mortgage boycott. But unhappy homeowners will be a persistent problem due to the decline of the property sector and industry. China’s property sector looks uncomfortably like the American property sector ahead of the 2006-08 bust. Prices for existing homes are falling while new house prices are on the verge of falling (Chart 2). While mortgages only make up 15% of bank assets, and household debt is only 62% of GDP, households are no longer taking on new debt (Chart 3). Chart 2China's Falling Property Prices
China's Falling Property Prices
China's Falling Property Prices
Chart 3China's Property Crisis
China's Property Crisis
China's Property Crisis
Chart 4China's Unemployment
China's Unemployment
China's Unemployment
Most likely China’s property sector is entering the bust phase that we have long expected – if not, then the reason will be a rapid and aggressive move by authorities to expand monetary and fiscal stimulus and loosen economic restrictions. That process of broad-based easing – “letting 100 flowers bloom” – will not fully get under way until after the party congress, say in December. Unemployment is rising across China as the economy slows, another point of comparison with the United States ahead of the 2008 property collapse (Chart 4). Unemployment is a manipulated statistic so real conditions are likely worse. There is no more important indicator. China’s government will be forced to ease policy, creating a positive impact on global growth in 2023, but the impact will be fleeting. Bottom Line: The underlying debt-deflationary context will prevail before long in China, weighing on global growth and inflation expectations on a cyclical basis. Middle East: Why Did Biden Go And What Will He Get? President Biden traveled to Israel and now Saudi Arabia because he wants Saudi Arabia and the Gulf Arab members of OPEC to increase oil production to reduce gasoline prices at the pump for Americans ahead of the midterm elections (Chart 5). Chart 5Biden Goes To Israel And Saudi Arabia
Biden Goes To Israel And Saudi Arabia
Biden Goes To Israel And Saudi Arabia
True, fears of recession are already weighing on prices, but Biden embarked on this mission before the growth slowdown was fully appreciated and he is not going to lightly abandon the anti-inflation fight before the midterm election. Biden also went because one of his top foreign policy priorities – the renegotiation of the 2015 nuclear deal with Iran – is falling apart. The Iranians do not want to freeze their nuclear program because they want regime survival and security. While Biden is offering a return to the 2015 deal, the conditions that produced the deal are no longer applicable: Russia and China are not cooperating with the US and EU to isolate Iran. Russia is courting Iran, oil prices are high and sanction enforcement is weak (unlike 2015). The Iranians now know, after the Trump administration, that they cannot trust the Americans to give credible security guarantees that will last across parties and administrations. The war in Ukraine also underscores the weakness of diplomatic security guarantees as opposed to a nuclear deterrent. Hence the joint US and Israeli declaration that Iran will never be allowed to obtain nuclear weapons. The good news is that this kind of joint statement is precisely what needed to occur – the underscoring of the red line – to try to change Ayatollah Ali Khamenei’s calculus regarding his drive to achieve nuclear breakout. In 2015 Khamenei gave diplomacy a chance to try to improve the economy, stave off social unrest, prepare the way for his eventual leadership succession process, and secure the Islamic Republic. The bad news is that Khamenei probably cannot make the same decision this time, as the hawkish faction now runs his government, the Americans are unreliable, and Russia and China are offering an alternative strategic orientation. The Saudis will pump more oil if necessary to save the global business cycle but not at the beck and call of a US president. The drop in oil prices reduces their urgency. The Americans can reassure the Saudis and Israel as long as the deal with Iran is not going forward. That looks to be the case. But then the US and Israel will have to undertake joint actions to underline their threat to Iran – and Iran will have to threaten to stage attacks across the region so as to deter any attack. Bottom Line: If a US-Iran deal does not materialize at the last minute, Middle Eastern instability will revive and a new source of oil supply constraint will plague the global economy. We continue to believe a US-Iran deal is unlikely, with only 40% odds of happening. Europe: Will Russia Turn Back On The Natural Gas? Russia’s objective in cutting off European natural gas is to inflict a recession on Europe. It wants a better bargaining position on strategic matters. Therefore we assume Russia will continue to squeeze supplies from now through the winter, when European demand rises and Russian leverage will peak. If Russia allows some flow to return, then it will be part of the negotiating process and will not preclude another cutoff before winter. It is possible that Russia is merely giving Europe a warning and will revert back to supplying natural gas. The problem is that Russia’s purpose is to achieve a strategic victory in Ukraine and in negotiations over NATO’s role in the Nordic countries. Russia has not achieved these goals, so natural gas cutoff will likely continue. Russia also hopes that by utilizing its energy leverage – while it still has it – it will bring forward the economic pain of Europe’s transition away from reliance on Russian energy. In that case European countries will experience recession and households will begin to change their view of the situation. European governments will be more likely to change their policies, to become more pragmatic and less confrontational toward Russia. Or European governments will be voted out of power and do the same thing. Other states could join Hungary in saying that Europe should never impose a full natural gas embargo on Russia. Russia would be able to salvage some of its energy trade with Europe over the long run, despite the war in Ukraine and the inevitable European energy diversification. In recent months we highlighted Italy as the weakest link in the European chain and the country most likely to see such a shift in policy occur. Italy’s national unity coalition had lost its reason for being, while the combination of rising bond yields and natural gas prices weighed on the economy. The Italian bond spread over German bunds has long served as our indicator of European political stress – and it is spiking now, forcing the European Central Bank to rush to plan an anti-fragmentation strategy that would theoretically enable it to tighten monetary policy while preventing an Italian debt crisis (Chart 6). The European Union remains unlikely to break up – Russian aggression was always one of our chief arguments for why the EU would stick together. But Italy will undergo a recession and an election (due by June 2023 but that could easily happen this fall), likely producing a new government that is more pragmatic with regard to Russia so as to reduce the energy strain. Chart 6Italy's Crisis Points To EU Divisions On Russia
Italy's Crisis Points To EU Divisions On Russia
Italy's Crisis Points To EU Divisions On Russia
Italy’s political turmoil shows that European states are feeling the energy crisis and will begin to shift policies to reduce the burden on households. Households will lose their appetite for conflict with Russia on behalf of Ukrainians, especially if Russia begins offering a ceasefire after completing its conquest of the Donetsk area. If Russia expands its invasion, then Europe will expand sanctions and the risk of further strategic instability will go up. But most likely Russia will seek to quit while it is ahead and twist Europe’s arm into foisting a ceasefire onto Ukraine. Bottom Line: A change of government in Italy will increase the odds that the EU will engage in diplomacy with Russia in the coming year, if Russia offers, so as to reach a new understanding, restore natural gas flows, and salvage the economy. This would leave NATO enlargement unresolved but a shift in favor of a ceasefire in Ukraine in 2023 would be less negative for European assets and the euro. UK: Who Will Replace Boris Johnson? Last week UK Prime Minister Boris Johnson fell from power and now the Conservative Party is engaging in a leadership competition to replace him. We gave up on Johnson after he survived his no-confidence vote and yet it became clear that he could not recover in popular opinion. The inflation outburst destroyed his premiership and wiped away whatever support he had gained from executing Brexit. In fact it reinforced the faction that believed Brexit was the wrong decision. Going forward the UK will be consumed with domestic political turmoil as the cost of stagflation mounts, and geopolitical turmoil as Scotland attempts to hold a second independence referendum, possibly by October 2023. Global investors should focus primarily on Scotland’s attempt to secede, since the breakup of the United Kingdom would be a momentous historical event and a huge negative shock for pound sterling. While only 44.7% of Scots voted for independence in 2014, now they have witnessed Brexit, Covid-19, and stagflation, producing tailwinds for the Scots nationalist vote (Chart 7). Chart 7Forget Bojo's Exit, Watch Scotland
Questions From The Road
Questions From The Road
There are still major limitations on Scotland exiting, since its national capabilities are limited, it would need to join the European Union, and Spain and possibly others will threaten to veto its membership in the European Union for fear of feeding their own secessionist movements. But any new referendum – including one done without the approval of Westminster – should be taken very seriously by investors. Bottom Line: Johnson’s removal will only marginally improve the Tories’ ability to manage the rebellion brewing in the north. A snap election that brings the Labour Party back into power would have a greater chance of keeping Scotland in the union, although it is not clear that such a snap election will happen in time to affect any Scottish decision. The UK faces economic and political turmoil between now and any referendum and investors should steer clear of the pound. (Though we still favor GBP over eastern European currencies). Britain will remain aggressive toward Russia but its ability to affect the Russian dynamic will fall, leaving the US and EU to decide the fate of Russian relations. Japan: What Is The Significance Of Shinzo Abe’s Assassination? Former Japanese Prime Minister Shinzo Abe was assassinated by a lone fanatic with a handmade gun. The significance of the incident is that Abe will become a martyr for a certain vision of Japan – his vision of Japan, which is that Japan can become a “normal country” that moves beyond the shackles of the guilt of its imperial aggression in World War II. A normal country is one that is economically stable and militarily capable of defending itself – not a pacifist country mired in debt-deflation. Abe stood for domestic reflation and a proactive foreign policy, along with the normalization of the Japanese Self-Defense Forces (JSDF). True, economic policy can become less dovish if necessary to deal with inflation. Some changes at the Bank of Japan may usher in a less dovish shift in monetary policy in particular. But monetary policy cannot become outright hawkish like it was before Abe. And Abe’s fiscal policy was never as loose as it was made out to be, given that he executed several hikes to the consumption tax. Japan’s structural demographic decline and large debt burden will continue to weigh on economic activity whenever real rates and the yen rise. The government will be forced to reflate using monetary and fiscal policy whenever deflation threatens to return. Debt monetization will remain an option for future Japanese governments, even if it is restrained during times of high inflation. Chart 8Shinzo Abe's Legacy
Questions From The Road
Questions From The Road
This is not only because Japanese households will become depressed if deflation is left unchecked but also because economic growth must be maintained in order to sustain the nation’s new and growing national defense budgets. Japan’s growing need for self defense stems from China’s strategic rise, Russia’s aggression, and North Korea’s nuclearization, plus uncertainty about the future of American foreign policy. These trends will not change anytime soon. Indeed the Liberal Democratic Party’s popularity has increased under Abe’s successor, Prime Minister Fumio Kishida, who will largely sustain Abe’s vision. The Diet still has a supermajority in favor of constitutional revision so as to enshrine the self-defense forces (Chart 8). And the de facto policy of rearmament continues even without formal revision. Bottom Line: Any Japanese leader who attempts to promote a hawkish BoJ, and a dovish JSDF, will fail sooner rather than later. The revolving door of prime ministers will accelerate. As Japan’s longest-serving prime minister, Shinzo Abe opened up the reliable pathway, which is that of a dovish BoJ and a hawkish foreign policy. This is important for the world, as well as Japan, because a more hawkish Japan will increase China’s fears of strategic containment. The frozen conflicts in Asia will continue to thaw, perpetuating the secular rise in geopolitical risk. We remain long JPY-KRW, since the BoJ may adjust in the short term and Chinese stimulus is still compromised, but that trade is on downgrade watch. Investment Takeaways Russia’s energy cutoff is aimed at pushing Europe into recession so as to force policy changes or government changes in Europe that will improve Russia’s position at the negotiating table over Ukraine, NATO, and other strategic disputes. Hence Russia is unlikely to increase the natural gas flow until it believes it has achieved its strategic aims and multiple veto players in the EU will prevent the EU from ever implementing a full-blown natural gas embargo. Chinese stimulus cannot be fully effective until it relaxes Covid-19 restrictions, likely beginning in December or next year when Xi Jinping uses his renewed political capital to try to stabilize the economy. However, China’s government powers alone are insufficient to prevent the debt-deflationary tendency of the property bust. The Middle East faces rising geopolitical tensions that will take markets by surprise with additional energy supply constraints. The implication is continued oil volatility given that global growth is faltering. Once global demand stabilizes, the Middle East’s turmoil will add to existing oil supply constraints to create new price pressures. The odds are not very high of the Federal Reserve achieving a “soft landing” in the context of a global energy shock and a stagflationary Europe and China. Matt Gertken Chief Geopolitical Strategist mattg@bcaresearch.com Strategic Themes Open Tactical Positions (0-6 Months) Open Cyclical Recommendations (6-18 Months) Regional Geopolitical Risk Matrix "Batting Average": Geopolitical Strategy Trades () Section II: Special (EDIT this Header) Section III: Geopolitical Calendar
In lieu of next week’s report, I will host the monthly Counterpoint Webcast on Monday, July 25. Please mark the date in your calendar, and I do hope you can join. Executive Summary Central banks face a ‘Sophie’s choice’. Inflation at 2 percent, or full employment? If they choose inflation at 2 percent, they will have to take the economy into recession. To take the economy into recession, bond yields and energy prices do not need to move any higher. They just need to stay where they are. The stock market has not yet discounted a recession. With stocks and bonds having become equally ‘cheaper’ this year, but stocks now vulnerable to substantial downgrades to their profits, stocks are likely to underperform bonds over the coming 6-12 months. In the event of recession followed by plunging inflation, a valuation uplift for bonds will also underpin stock prices and limit further downside in absolute terms. The biggest loser will be commodities. On a 6-12 month horizon, the optimal asset allocation is: overweight bonds, neutral stocks, underweight commodities. Fractal trading watchlist: Ethereum. The Bear Market Is A Valuation Bear Market. Profits Are Not Discounting A Recession… Yet
Stocks Caught Between Scylla And Charybdis
Stocks Caught Between Scylla And Charybdis
Bottom Line: On a 6-12 month horizon, overweight bonds, neutral stocks, underweight commodities. Feature The Greek mythological sea monsters, Scylla and Charybdis, sat on opposite sides of the narrow Strait of Messina, with one monster likened to a shoal of rocks, the other to a vortex. Avoiding the rocks meant getting too close to the vortex, and avoiding the vortex meant getting too close to the rocks. In today’s stock market, if Scylla is the monster of high bond yields, then Charybdis is the monster of falling profits. Whether the stock market can safely navigate these twin monsters without further damage depends on a sequence of questions. In today’s stock market, if Scylla is the monster of high bond yields, then Charybdis is the monster of falling profits. If the market can escape high bond yields, can it also escape falling profits? The answer to this depends on a second question. Can central banks guide inflation back to 2 percent without taking the economy into recession? The answer to this depends on a third question. Is 2 percent inflation still consistent with full employment? Central Banks Face A ‘Sophie’s Choice’ – Low Inflation, Or Full Employment? In the US, the main transmission mechanism from employment to inflation is through so-called ‘rent of shelter’. Because, to put it bluntly, you need a steady job to pay the rent. And rent comprises 41 percent of the core inflation basket. For the past couple of decades, the Fed could have its cake and eat it: full employment and inflation running close to 2 percent. This was because full employment was consistent with rent of shelter inflation running at 3.5 percent, which itself was consistent with core inflation running at 2 percent. The Fed faces a ‘Sophie’s choice’. Inflation at 2 percent, or full employment? If it chooses inflation at 2 percent, then the Fed will have to take the economy into recession. But recently, there has been a phase-shift between the employment market and rent of shelter inflation. The current state of full employment equates to rent of shelter inflation running not at 3.5 percent, but at 5.5 percent (Chart I-1). Chart I-1Central Banks Face A 'Sophie's Choice' - Low Inflation, Or Full Employment?
Central Banks Face A 'Sophie's Choice' - Low Inflation, Or Full Employment?
Central Banks Face A 'Sophie's Choice' - Low Inflation, Or Full Employment?
Hence, the Fed faces a ‘Sophie’s choice’. Inflation at 2 percent, or full employment? If it chooses inflation at 2 percent, the unemployment rate will have to rise by 2 percent. Meaning, the Fed will have to take the economy into recession. The Economy Tries The ‘Cold Pressor Test’ To take the economy into recession, bond yields and energy prices do not need to move any higher – they just need to stay where they are. This is because the damage from elevated bond yields and energy prices doesn’t come just from their level. It comes from their level multiplied by the length of time that they stay elevated. Try putting your hand in a bucket of ice water. For the first few seconds, or even tens of seconds, you will not feel any discomfort. After a few minutes though, the pain becomes excruciating. This so-called ‘cold pressor test’ tells us that your discomfort results not just from the temperature level of the ice water, but equally from the length of time that you keep your hand in it. Likewise, a short-lived spike in the mortgage rate or in the price of natural gas, or a short-lived collapse in your stock market wealth will not cause any discomfort. But the longer the mortgage rate stays elevated, and more and more people are buying or refinancing a home at a much higher rate, the greater becomes the economic pain. In the same vein, most Europeans will not notice the sky-high prices of natural gas in the summer when the heating is off. But come the cold of October and November, many people will have to choose literally between physical or economic pain. Some commentators counter that the “war chest of savings” accumulated during the pandemic will buffer households against higher mortgage rates and energy prices. We strongly disagree. The savings accumulated during the pandemic just added to, and became indistinguishable from, other wealth. Yet now, in case you hadn’t noticed, wealth has been pummelled. In case you hadn’t noticed, wealth has been pummelled. The impact of wealth on spending is a huge topic which we will expand upon in a future report. In a nutshell, most spending comes from income and income proxies. Wealth generates income, but it also generates an income proxy via capital gain. So, to the extent that wealth can drive spending growth, the biggest contributor comes from the change in capital gain, also known as the ‘wealth impulse’. Unfortunately, the wealth impulse is now in deeply negative territory (Chart I-2). Chart I-2The Wealth Impulse Is In Deeply Negative Territory
The Wealth Impulse Is In Deeply Negative Territory
The Wealth Impulse Is In Deeply Negative Territory
The Stock Market Has Not Yet Discounted A Recession Coming back to the stock market, does the 2022 bear market mean that it has already discounted a recession? No, this year’s bear market is entirely due to a collapse in valuations. Since the start of the year, US profit expectations have held up. If the bear market were front running profit downgrades, then it would be underperforming its valuation component, but it is not. The counterargument is that analysts are notoriously slow to downgrade their profit estimates. Isn’t the bear market the ‘real-time’ stock market ‘front running’ big downgrades to these profit estimates? Again, no. If the market were front running profit downgrades, then it would be underperforming its valuation component, but it is not (Chart I-3). Chart I-3The Bear Market Is A Valuation Bear Market. Profits Are Not Discounting A Recession...Yet
The Bear Market Is A Valuation Bear Market. Profits Are Not Discounting A Recession...Yet
The Bear Market Is A Valuation Bear Market. Profits Are Not Discounting A Recession...Yet
The bear market in the S&P 500 has near-perfectly tracked the bear market in its valuation component, the 30-year T-bond price. The valuation component of the S&P 500 is the 30-year T-bond price because the duration of the S&P 500 equals the duration of the 30-year T-bond. Several clients have asked how to prove that the duration of the S&P 500 equals that of the 30-year T-bond. We can do it either a difficult theoretical way, or an easy empirical way. The difficult theoretical way is to take the projected cashflows, and calculate the weighted average time to those cashflows, where the weights are the discounted values of those cashflows. The much easier empirical way is to show that the S&P 500 tracks its profits multiplied by the 30-year T-bond price more faithfully than if we use a shorter maturity bond, such as the 10-year T-bond (Chart I-4 and Chart I-5) Chart I-4The S&P 500 Tracks Profits Multiplied By The 30-Year T-Bond Price More Faithfully...
The S&P 500 Tracks Profits Multiplied By The 30-Year T-Bond Price More Faithfully...
The S&P 500 Tracks Profits Multiplied By The 30-Year T-Bond Price More Faithfully...
Chart I-5...Than Profits Multiplied By The 10-Year T-Bond Price
...Than Profits Multiplied By The 10-Year T-Bond Price
...Than Profits Multiplied By The 10-Year T-Bond Price
One important upshot is that any valuation comparison of the S&P 500 with a bond other than the 30-year T-bond is a fundamental error of duration mismatch. Most strategists compare the S&P 500 with the 10-year T-bond because it is convenient. But the duration mismatch makes this ‘apples versus oranges’ valuation comparison one of the most common mistakes in finance. Overweight Bonds, Neutral Stocks, Underweight Commodities All of this is important to answer a crucial question about stock market valuations. With the stock market 20 percent down this year when expected profits have held up, it might appear that stocks have become much cheaper. The truth is more nuanced. Relative to expected profits over the next 12 months the US stock market is indeed much cheaper (Chart I-6). The caveat is that these expected profits are vulnerable to substantial downgrades in the event of a recession. Chart I-6The US Stock Market Is Cheaper Versus Expected Profits, But These Profits Are Too Optimistic
The US Stock Market Is Cheaper Versus Expected Profits, But These Profits Are Too Optimistic
The US Stock Market Is Cheaper Versus Expected Profits, But These Profits Are Too Optimistic
Chart I-7The US Stock Market Is Not Cheaper Versus The 30-Year T-Bond
The US Stock Market Is Not Cheaper Versus The 30-Year T-Bond
The US Stock Market Is Not Cheaper Versus The 30-Year T-Bond
But relative to the equal duration 30-year T-bond, the US stock market is not cheaper. Since, the start of the year, the uplift in the stock market’s (forward earnings) yield is precisely the same as the that on the 30-year T-bond yield (Chart I-7). Relative to the equal duration 30-year T-bond, the US stock market has not become cheaper. With stocks and bonds having become equally ‘cheaper’ this year, but stocks now vulnerable to substantial downgrades to their profits, stocks are likely to underperform bonds over the coming 6-12 months. The good news is that a valuation uplift for bonds will also underpin stock prices, and limit further downside in absolute terms. Unfortunately, the same cannot be said for commodities, whose real prices are still close to the upper end of their 40-year trading range (Chart I-8) Chart I-8The Real Price Of Metals Is Still At The Upper End Of Its 40-Year Trading Range
The Real Price Of Metals Is Still At The Upper End Of Its 40-Year Trading Range
The Real Price Of Metals Is Still At The Upper End Of Its 40-Year Trading Range
In the event of recession followed by plunging inflation, the biggest winner will be bonds and the biggest loser will be commodities. Therefore, on a 6-12 horizon, the optimal asset allocation is: Overweight bonds. Neutral stocks. Underweight commodities. Fractal Trading Watchlist This week we are adding Ethereum to our watchlist, as its 130-day fractal structure is approaching the capitulation point that signalled previous major trend reversals in 2018 (a bottom) and 2021 (a top). The full watchlist of 27 investments that are approaching, or at, potential trend reversals is available on our website: cpt.bcaresearch.com Fractal Trading Watchlist: New Additions Chart I-9Fractal Trading Watch List
Fractal Trading Watch List
Fractal Trading Watch List
Chart 1CNY/USD At A Potential Turning Point
CNY/USD At A Potential Turning Point
CNY/USD At A Potential Turning Point
Chart 2US REITS Are Oversold Versus Utilities
US REITS Are Oversold Versus Utilities
US REITS Are Oversold Versus Utilities
Chart 3CAD/SEK Is Vulnerable To Reversal
CAD/SEK Is Vulnerable To Reversal
CAD/SEK Is Vulnerable To Reversal
Chart 4Financials Versus Industrials Has Reversed
Financials Versus Industrials Has Reversed
Financials Versus Industrials Has Reversed
Chart 5The Outperformance Of Resources Versus Biotech Has Ended
The Outperformance Of Resources Versus Biotech Has Ended
The Outperformance Of Resources Versus Biotech Has Ended
Chart 6The Outperformance Of Resources Versus Healthcare Has Ended
The Outperformance Of Resources Versus Healthcare Has Ended
The Outperformance Of Resources Versus Healthcare Has Ended
Chart 7FTSE100 Outperformance Vs. Euro Stoxx 50 Is Vulnerable To Reversal
FTSE100 Outperformance Vs. Euro Stoxx 50 Is Vulnerable To Reversal
FTSE100 Outperformance Vs. Euro Stoxx 50 Is Vulnerable To Reversal
Chart 8Netherlands' Underperformance Vs. Switzerland Is Ending
Netherlands' Underperformance Vs. Switzerland Is Ending
Netherlands' Underperformance Vs. Switzerland Is Ending
Chart 9The Sell-Off In The 30-Year T-Bond At Fractal Fragility
The Sell-Off In The 30-Year T-Bond At Fractal Fragility
The Sell-Off In The 30-Year T-Bond At Fractal Fragility
Chart 10The Sell-Off In The NASDAQ Is Approaching Fractal Fragility
The Sell-Off In The NASDAQ Is Approaching Fractal Fragility
The Sell-Off In The NASDAQ Is Approaching Fractal Fragility
Chart 11Food And Beverage Outperformance Is Exhausted
Food And Beverage Outperformance Is Exhausted
Food And Beverage Outperformance Is Exhausted
Chart 12German Telecom Outperformance Vulnerable To Reversal
German Telecom Outperformance Vulnerable To Reversal
German Telecom Outperformance Vulnerable To Reversal
Chart 13Japanese Telecom Outperformance Vulnerable To Reversal
Japanese Telecom Outperformance Vulnerable To Reversal
Japanese Telecom Outperformance Vulnerable To Reversal
Chart 14ETH Is Approaching A Possible Capitulation
ETH Is Approaching A Possible Capitulation
ETH Is Approaching A Possible Capitulation
Chart 15The Strong Trend In The 18-Month-Out US Interest Rate Future Has Ended
The Strong Trend In The 18-Month-Out US Interest Rate Future Has Ended
The Strong Trend In The 18-Month-Out US Interest Rate Future Has Ended
Chart 16The Strong Downtrend In The 3 Year T-Bond Has Ended
The Strong Downtrend In The 3 Year T-Bond Has Ended
The Strong Downtrend In The 3 Year T-Bond Has Ended
Chart 17A Potential Switching Point From Tobacco Into Cannabis
A Potential Switching Point From Tobacco Into Cannabis
A Potential Switching Point From Tobacco Into Cannabis
Chart 18Biotech Is A Major Buy
Biotech Is A Major Buy
Biotech Is A Major Buy
Chart 19Norway's Outperformance Has Ended
Norway's Outperformance Has Ended
Norway's Outperformance Has Ended
Chart 20Cotton Versus Platinum Has Reversed
Cotton Versus Platinum Has Reversed
Cotton Versus Platinum Has Reversed
Chart 21Switzerland's Outperformance Vs. Germany Has Ended
Switzerland's Outperformance Vs. Germany Has Ended
Switzerland's Outperformance Vs. Germany Has Ended
Chart 22USD/EUR Is Vulnerable To Reversal
USD/EUR Is Vulnerable To Reversal
USD/EUR Is Vulnerable To Reversal
Chart 23The Outperformance Of MSCI Hong Kong Versus China Has Ended
The Outperformance Of MSCI Hong Kong Versus China Has Ended
The Outperformance Of MSCI Hong Kong Versus China Has Ended
Chart 24A Potential New Entry Point Into Petcare
A Potential New Entry Point Into Petcare
A Potential New Entry Point Into Petcare
Chart 25GBP/USD At A Potential Turning Point
GBP/USD At A Potential Turning Point
GBP/USD At A Potential Turning Point
Chart 26US Utilities Outperformance Vulnerable To Reversal
US Utilities Outperformance Vulnerable To Reversal
US Utilities Outperformance Vulnerable To Reversal
Chart 27The Outperformance Of Oil Versus Banks Is Exhausted
The Outperformance Of Oil Versus Banks Is Exhausted
The Outperformance Of Oil Versus Banks Is Exhausted
Dhaval Joshi Chief Strategist dhaval@bcaresearch.com Fractal Trading System Fractal Trades
Stocks Caught Between Scylla And Charybdis
Stocks Caught Between Scylla And Charybdis
Stocks Caught Between Scylla And Charybdis
Stocks Caught Between Scylla And Charybdis
6-12 Month Recommendations Structural Recommendations Closed Fractal Trades Indicators To Watch - Bond Yields Chart II-1Indicators To Watch - Bond Yields - Euro Area
Indicators To Watch - Bond Yields - Euro Area
Indicators To Watch - Bond Yields - Euro Area
Chart II-2Indicators To Watch - Bond Yields - Europe Ex Euro Area
Indicators To Watch - Bond Yields - Europe Ex Euro Area
Indicators To Watch - Bond Yields - Europe Ex Euro Area
Chart II-3Indicators To Watch - Bond Yields - Asia
Indicators To Watch - Bond Yields - Asia
Indicators To Watch - Bond Yields - Asia
Chart II-4Indicators To Watch - Bond Yields - Other Developed
Indicators To Watch - Bond Yields - Other Developed
Indicators To Watch - Bond Yields - Other Developed
Indicators To Watch - Interest Rate Expectations Chart II-5Indicators To Watch - Interest Rate Expectations
Indicators To Watch - Interest Rate Expectations
Indicators To Watch - Interest Rate Expectations
Chart II-6Indicators To Watch - Interest Rate Expectations
Indicators To Watch - Interest Rate Expectations
Indicators To Watch - Interest Rate Expectations
Chart II-7Indicators To Watch - Interest Rate Expectations
Indicators To Watch - Interest Rate Expectations
Indicators To Watch - Interest Rate Expectations
Chart II-8Indicators To Watch - Interest Rate Expectations
Indicators To Watch - Interest Rate Expectations
Indicators To Watch - Interest Rate Expectations
Executive Summary No Funding For Property Developers, No Land Sales
No Funding For Property Developers, No Land Sales
No Funding For Property Developers, No Land Sales
Beijing’s plan to bring forward RMB 2.6 trillion of financing for infrastructure expenditures in H2 2022 is a considerable stimulus. However, this new funding will not result in new investments. Rather, it will, by and large, offset the drop in local government (LG) revenues from land sales this year. In short, there is little new stimulus for infrastructure beyond what has been approved in the budget plan earlier this year. Not only is the credit and fiscal impulse smaller in this cycle than in the previous ones, but also the multiplier effect will be lower. This will hinder the recovery in domestic demand. After the one-off rebound in economic activity following the lockdowns in April and May of this year, China’s business cycle recovery will be more U shaped rather than V shaped. Bottom Line: For absolute-return investors neither A-shares nor investable stocks offer an attractive risk-reward profile. Within a global equity portfolio, we continue to recommend a neutral allocation to China’s A-shares and an underweight allocation to Chinese investable stocks. Relative to the EM equity benchmark, investors should continue to overweight A-shares and remain neutral on investable stocks. Maintain the long A-shares / short offshore investable Chinese stocks position. Alleged plans of an additional RMB 1.5 trillion local government (LG) special bond issuance in H2 2022 have prompted investors to speculate about whether this stimulus initiative is sufficient to produce a considerable acceleration in infrastructure investment. This stimulus would be added to RMB 800 billion and 300 billion of policy bank funding for infrastructure that the government approved earlier in Q2 this year. Hence, the combined new infrastructure financing made available by Beijing is RMB 2.6 trillion. Below, we elaborate on how this RMB 2.6 trillion of additional infrastructure financing will be largely offset by a drop in LG revenues from land sales. In short, the stimulus will preclude downside in infrastructure investment rather than herald a major acceleration. In addition, the economic recovery still faces substantial headwinds from other segments of the economy. We believe that, approached as a whole, China’s business cycle recovery will be more U shaped than V shaped. Quantifying Infrastructure Stimulus The degree of new financing for infrastructure is considerable. This RMB 2.6 trillion in new financing in H2 2022 is equal to 7% of planned 2022 LG aggregate expenditures, 6% of planned 2022 aggregate total central and local government spending including budgetary and managed funds, 14% of fixed-asset investment (FAI) in traditional infrastructure, and 2% of GDP. The composition of general government spending is presented in Table 1. Table 1Structure And Composition Of Government Spending In China
Making Sense Of China’s New Stimulus
Making Sense Of China’s New Stimulus
However, a caveat is in order: this new funding will not result in new investments. Rather, it will, by and large, offset the drop in LG revenues from land sales. The primary source of financing infrastructure investment is LG managed funds. LG managed funds budgets, however, are under severe stress because of the plunge in revenues from land sales. Notably, proceeds from land sales account for 23% of aggregate LG expenditures (Chart 1). Land sales have contracted by about 30% in the January-June period of this year, and there is little hope that they will pick up in H2 2022. The reason is that property developers’ financing is down by 30% and is unlikely to recover soon (Chart 2). Chart 1Land Sales Are Critical For LG Expenditures
Land Sales Are Critical For LG Expenditures
Land Sales Are Critical For LG Expenditures
Chart 2No Funding For Property Developers, No Land Sales
No Funding For Property Developers, No Land Sales
No Funding For Property Developers, No Land Sales
Chart 3Property Developers Are Facing Debt Deflation
Property Developers Are Facing Debt Deflation
Property Developers Are Facing Debt Deflation
As we have argued in our past reports, property developers carry a substantial inventory of real estate assets funded by a massive debt build-up (Chart 3, top panel). With housing prices beginning to deflate, property developers are about to face debt deflation – falling asset prices and a high debt burden (Chart 3, bottom panel). Thereby, they have little appetite or capacity to expand their assets and leverage. Assuming land sales for the full year will decline by 30%, this drop would lead to an RMB 2.52 trillion reduction in LGs managed fund revenues in 2022 (Table 2). Hence, the new RMB 2.6 trillion infrastructure financing will be used to offset the RMB 2.5 trillion shortfall in LG managed funds budgets because of the plunge in land transfer proceeds. Table 2China: New Stimulus For Infrastructure in H2 2022
Making Sense Of China’s New Stimulus
Making Sense Of China’s New Stimulus
On the whole, there will be very little new funding available to boost infrastructure spending beyond what has been approved by the 2022 National People’s Congress (NPC) earlier this year. Chart 4The Credit And Fiscal Impulse Will Be Moderate
The Credit And Fiscal Impulse Will Be Moderate
The Credit And Fiscal Impulse Will Be Moderate
Hence, for this full year, there is no change to the aggregate fiscal spending impulse that incorporates central and local government budgetary spending as well as managed funds’ expenditures (Chart 4, top panel). The two scenarios for the non-government credit impulse are shown in the middle panel of Chart 4. The optimistic scenario assumes non-government credit will accelerate to 9.5% from 8.7%, and the pessimistic scenario is based on no acceleration in non-government credit growth. Finally, the bottom panel of Chart 4 illustrates the projections for the combined credit and fiscal spending impulse for the remainder of this year. Although the aggregate fiscal and credit impulse is non-trivial, it is smaller than those in 2020, 2016, 2013, and 2009. Bottom Line: The government has announced RMB 1.1 trillion in infrastructure funding and will likely raise the LG special bond quota by RMB 1.5 trillion. Yet, this RMB 2.6 trillion financing will only offset the shortfall in infrastructure financing from plunging land transfer revenue. In brief, there is little new stimulus for infrastructure beyond what has been approved in the budget plan from early this year. Economic Headwinds Chart 5China's Reopening Rebound
China's Reopening Rebound
China's Reopening Rebound
Economic activity in China has rebounded following the reopening of the economy. Chart 5 illustrates that high-frequency data, such as car sales, house sales, commercial truck cargo, and steel production have all recently improved. We expect the one-off renormalization of economic activity following the lockdowns in April and May to give way to more subdued growth. The reason is that the mainland economy is facing several major headwinds: The real estate market is unlikely to recover meaningfully given the “three red lines” policy has not been eased, and many of property market excesses have not been purged. Hence, the question remains whether the Chinese economy can stage a robust recovery without the participation of the property market. We doubt it can because of the vital role that real estate has played in the economy in the past 20 years as the result of its large share in GDP and its impact on consumer and business sentiment. Since 2008, there has been no business cycle recovery in China without the property market firing on all cylinders (Chart 6). Chart 6All Economic Recoveries Were Accompanied By A Revival In The Property Market
All Economic Recoveries Were Accompanied By A Revival In The Property Market
All Economic Recoveries Were Accompanied By A Revival In The Property Market
Chart 7China: The Willingness To Spend And Invest Is Very Low
China: The Willingness To Spend And Invest Is Very Low
China: The Willingness To Spend And Invest Is Very Low
Rolling lockdowns will likely persist. This will weigh on household and private business confidence. Diminishing confidence will undermine the willingness to spend, invest, and hire. Our marginal propensity to spend indicators for households & enterprises remain very depressed (Chart 7). Low propensity to spend entails that the multiplier effect of fiscal and credit stimulus will be lower in this cycle than in the previous ones. Not only is the credit and fiscal impulse smaller than in the previous cycles but also the multiplier will be lower. This will hinder the recovery in domestic demand. Finally, Chinese exports are set to contract in H2 2022 because of shrinking demand for consumer goods (ex-autos) in the US and Europe as well as mainstream EM. Bottom Line: After the one-off rebound in economic activity following the lockdowns in April and May, the business cycle recovery will be more U shaped rather than V shaped. Investment Conclusions For absolute-return investors, neither A-shares nor investable stocks offer an attractive risk-reward profile. Within the A-share market, our strongest conviction is to overweight interest rate-sensitive sectors like consumer staples, utilities, and healthcare. Consumer discretionary stocks should also be a slight overweight now. We continue to recommend a neutral allocation to Chinese A-shares and an underweight allocation to investable stocks within a global equity portfolio. Relative to the EM equity benchmark, investors should continue to overweight A-shares and remain neutral on investable Chinese stocks. Maintain the long A-shares / short offshore investable stocks position. The yuan, like all other emerging Asian currencies, is still facing near-term downside risk versus the US dollar. Chinese onshore government bond yields will likely drop further. Arthur Budaghyan Chief Emerging Markets Strategist arthurb@bcaresearch.com Strategic Themes Cyclical Recommendations