Equities

Executive Summary Unit Labor Costs, Not Oil Prices, Are The Key To US Core Inflation
Unit Labor Costs, Not Oil Prices, Are The Key To US Core Inflation
Unit Labor Costs, Not Oil Prices, Are The Key To US Core Inflation
Inflation is not about oil, food or used car prices. Looking at prices of individual components of a consumer basket is akin to missing the forest for the trees. Despite the latest drop in US headline inflation, various core CPI measures continue trending up and registered considerable month-on-month rises in July. Wages and, more specifically, unit labor costs are the true measure of genuine and persistent inflation. US wage growth is very elevated, and the pace of unit labor cost gains has surged to a 40-year high. The conditions for sustainable and persistent disinflation in the US are not yet present. US inflation will prove to be much stickier and more entrenched than many market participants presently believe. The recovery in China will be U- rather than V-shaped, with risks tilted to the downside. The mainland’s property market breakdown is structural, not cyclical. Excesses are very large, and problems are snowballing, rendering the enacted policy stimulus insufficient. Bottom Line: US core inflation lingering above 4% and easing financial conditions will compel the Fed to continue hiking rates. This will cap global risk asset prices and put a floor under the US dollar. We continue to recommend an underweight allocation to EM in global equity and credit portfolios. Consistently, we are also reluctant to chase EM currencies higher. Feature The bullish macro narrative circulating in the investment community is that conditions for a cyclical rally in global risk assets have fallen into place. Specifically: US inflation will drop sharply as US growth has crested and commodity prices have plunged; The Fed is nearing the end of a tightening cycle; China has stimulated sufficiently, and its economy is about to recover, which will boost economic conditions among its trading partners in general and EM in particular. These assumptions along with the fact that the S&P 500 index has found support at a 3-year moving average – a proven line of defense – suggest that US share prices have likely bottomed (Chart 1). Are we witnessing déjà vu of the 2011, 2016, 2018 and 2020 market bottoms? Chart 1Déjà Vu? Is 2022 Like The 2011, 2016 And 2018 Bottoms In The S&P 500?
Déjà Vu? Is 2022 Like The 2011, 2016 And 2018 Bottoms In The S&P 500?
Déjà Vu? Is 2022 Like The 2011, 2016 And 2018 Bottoms In The S&P 500?
We have reservations about all of the above fundamental conjectures. We elaborate on these reservations in this report. On the whole, we contend that the current environment is different, and the roadmaps of all post-2009 equity market bottoms are not necessarily currently applicable. BCA’s Emerging Markets Strategy team believes that (1) US consumer price inflation is much more entrenched and will prove stickier than is commonly believed; and (2) the Chinese property market’s breakdown is structural, not cyclical; hence, the recovery will not gain traction easily. Is This The End Of The US Inflation Problem? Not Quite This week’s US inflation data confirmed that headline CPI inflation has probably peaked: prices in several categories plunged. However, inflation is not about oil, food or used car prices. Chart 2 reveals that historically there have been several episodes whereby core inflation remains elevated despite plunging oil prices. Chart 2US Core Inflation Does Not Always Follow Oil Prices
US Core Inflation Does Not Always Follow Oil Prices
US Core Inflation Does Not Always Follow Oil Prices
Looking at price dynamics among the individual components of the CPI basket is akin to missing the forest for the trees. Inflation is a very inert and persistent phenomenon. Underlying inflation does not change its direction often and/or quickly. That is why we believe that it is premature to celebrate the end of the US inflation problem. A few observations on this matter: Despite the drop in US headline inflation, various core CPI measures − like trimmed-mean CPI, median CPI and core sticky CPI − all continue trending up and registered substantial month-on-month rises in July (Chart 3). The range of core inflation based on these annual and month-month annualized rates is between 4-7%. In brief, the rate of genuine/sticky inflation is well above the Fed’s 2% target. Given its unconditional commitment to bringing inflation down to 2%, the Fed will continue hiking interest rates ceteris paribus. Chart 3US Core CPI Measures Are Still Very High
US Core CPI Measures Are Still Very High
US Core CPI Measures Are Still Very High
Chart 4US Wages Growth Has Been Surging
US Wages Growth Has Been Surging
US Wages Growth Has Been Surging
We continue to emphasize that wages and, more specifically, unit labor costs are the true measures of persistent and genuine inflation. We have written at length about why wages and unit labor costs are more important to inflation than oil or food prices. US wage growth is very elevated and is accelerating (Chart 4). Unit labor costs, calculated as hourly wages divided by productivity, have also been surging to a 40-year high (Chart 5, top panel). Chart 5Unit Labor Costs, Not Oil Prices, Are The Key To US Core Inflation
Unit Labor Costs, Not Oil Prices, Are The Key To US Core Inflation
Unit Labor Costs, Not Oil Prices, Are The Key To US Core Inflation
The reason for this very strong wage growth and swelling unit labor costs is the very tight labor market. The bottom panel of Chart 5 demonstrates that labor demand is still outpacing labor supply by a wide margin. Hence, wage inflation will not subside until the unemployment rate rises meaningfully. Bottom Line: Conditions for sustainable and persistent disinflation in the US are not yet present. Inflation will prove to be much stickier and more entrenched than many market participants presently believe. Core inflation lingering above 4% and easing financial conditions will compel the Fed to continue hiking rates. This will cap risk asset prices and put a floor under the US dollar. China: Is This Time Different? If one believes that China’s current business cycle is similar to all previous ones seen since 2009, odds are that a buying opportunity in China-related financial markets is at hand. Chart 6 illustrates that the credit and fiscal spending impulse leads the business cycle by about nine months. Given that this impulse bottomed late last year, a trough in the Chinese business cycle is due. Chart 6Is A Recovery In China's Business Cycle Imminent?
Is A Recovery In China's Business Cycle Imminent?
Is A Recovery In China's Business Cycle Imminent?
It is always risky to suggest that this time is different. Nevertheless, at the risk of being wrong, we contend that a combination of (1) property markets woes, (2) an impending export contraction, and (3) the dynamic zero-COVID policy will reduce the multiplier effect of current stimulus measures. Hence, a meaningful recovery in economic activity will likely fail to materialize in the coming months. The challenges facing the mainland property market are now well known. Yet, excesses are very large, and problems are snowballing, making policy stimulus insufficient. In particular: Authorities are contemplating bailout funds for property developers in the range of RMB 300-400 billion to enable them to complete housing that has been pre-sold. This is not sufficient financing for overall property construction. Table 1How Large Are Property Developers Bailout Funds?
Déjà Vu?
Déjà Vu?
Table 1 illustrates that these amounts are equal to just 3-4% of annual fixed-asset investment in real estate excluding land purchases, 1.5-2% of total financing of developers, and 3-4% of the advance payments that property developers received for pre-sold housing in 2021. Property developers will not be receiving any cash upon the completion and delivery of presold housing units because they were paid in advance. Hence, without liquidating their other assets, homebuilders cannot repay the bailout financing. Consequently, only state financing can work here because, from the viewpoint of providers of this financing, this scheme de-facto means throwing good money after bad. The property industry in China is extremely fragmented. This makes bailouts difficult to organize and execute. There are officially about 100,000 property developers in China. The overwhelming majority of them are not state-owned companies. Plus, the two largest property developers, Evergrande (before defaulting) and Country Garden, had only 3.8% and 3.3% of market share respectively in 2020. The failure of homebuilders to complete and deliver pre-sold housing units could unleash a death spiral for them. In recent years, 90% of housing units have been pre-sold, i.e., buyers made advance payments/prepayments, often taking out mortgages (Chart 7, top panel). Witnessing the inability of developers to deliver on presold units, a rising number of people may decide to wait to buy. The largest source of developers’ financing – advance payments for pre-sold housing units – might very well dry up. This source has accounted for 50% of real estate developers’ total financing in recent years (Chart 7, bottom panel). In brief, a vicious cycle is possible. The lack of financing for homebuilders bodes ill for construction activity (Chart 8). Chart 7China: Housing Presales And Pre-Payments Are Critical To Developers
China: Housing Presales And Pre-Payments Are Critical To Developers
China: Housing Presales And Pre-Payments Are Critical To Developers
Chart 8Lack Of Homebuilder Financing = Shrinking Construction Activity
Lack Of Homebuilder Financing = Shrinking Construction Activity
Lack Of Homebuilder Financing = Shrinking Construction Activity
Chart 9Chinese Property Developers Are Extremely Leveraged
Chinese Property Developers Are Extremely Leveraged
Chinese Property Developers Are Extremely Leveraged
Besides, property developers are very leveraged with an assets-to-equity ratio close to nine (Chart 9). They have grown accustomed to borrowing heavily to accumulate real estate assets. They have been starting but not completing construction (Chart 10, top panel). We have been referring to this phenomenon as the biggest carry trade in the world. The bottom panel of Chart 10 shows two different measures of residential floor space inventories held by property developers. One measure subtracts completed floor space from started floor space, and another one deducts sold floor space from started floor space. On both measures, residential inventories are enormous. In theory, they could raise funds by selling their real estate assets. However, if they all try to sell simultaneously, there will not be enough buyers, and asset prices will plunge, which could lead to a full-blown debt deflation spiral. The last time the real estate market was similarly distressed in 2014-15, the central bank launched the Pledged Supplementary Lending (PSL) facility. This was effectively a QE program to monetize housing. This was the reason why housing recovered strongly in 2016-2017. There is currently no such program up for discussion. On the whole, odds are that the current property market breakdown is structural, not cyclical. Financial markets – the prices of stocks and USD bonds of property developers – convey a similar message and continue to plunge (Chart 11). Chart 10Excessive Property Inventories
Excessive Property Inventories
Excessive Property Inventories
Chart 11No Green Light From Property Stocks And Corporate Bond Prices
No Green Light From Property Stocks And Corporate Bond Prices
No Green Light From Property Stocks And Corporate Bond Prices
Chart 12There Has Been No Recovery In China Without A Revival in Real Estate
There Has Been No Recovery In China Without A Revival in Real Estate
There Has Been No Recovery In China Without A Revival in Real Estate
Without an improvement in the housing market, a meaningful business cycle recovery is unlikely in China. Chart 12 illustrates that all recoveries in the Chinese broader economy since 2009 occurred alongside a revival in property sales. The importance of the property market goes beyond its size. Rising property prices lift household and business confidence, boosting aggregate spending and investment. The sluggish housing market and falling house prices will impair consumer and business confidence. This, along with uncertainty related to the dynamic zero-COVID policy, will dent consumer spending and private investments. Finally, the upcoming contraction in Chinese exports will dampen national income growth. Taken together, the multiplier effect of stimulus in the upcoming months will be lower than it has been in previous periods of stimulus. There are two areas that will see meaningful improvement in the coming months: infrastructure spending and autos. BCA’s China Investment Strategy service discussed the outlook for auto sales in a recent report. Chart 13Green Shoots In China's Infrastructure Investment
Green Shoots In China's Infrastructure Investment
Green Shoots In China's Infrastructure Investment
On the infrastructure front, there has been mixed evidence of an improvement in activity. The top and middle panels of Chart 13 demonstrate that Komatsu machinery’s operational hours and the number of approved infrastructure projects might be bottoming. However, the installation of high-power electricity lines has fallen to a 15-year low (Chart 13, bottom panel). As we elaborated in last month’s report, the new financing/stimulus for infrastructure development will not result in new investments. Rather, it will by and large offset the drop in local government (LG) revenues from land sales this year. In short, there is little new stimulus for infrastructure beyond what was approved in the budget plan earlier this year. Bottom Line: The recovery in China will be U- rather than V-shaped, with risks tilted to the downside. Investment Recommendations Our bias is that the rebound in global risk assets could last for a few more weeks. The basis is that investor positioning in risk assets was very light when this rebound began. Plus, falling oil prices could reinforce the idea among investors that US inflation is no longer a problem. Looking beyond the next several weeks, the outlook for global and EM risk assets is dismal. Markets will realize that the Fed cannot halt its tightening with core inflation well above 4-5%. Hawkish Fed policy and contracting global trade will boost the US dollar and weigh on cyclical assets. We continue to recommend an underweight allocation to EM in global equity and credit portfolios. Consistently, we are also reluctant to chase EM currencies higher. EM local bonds offer value, as we have argued over the past couple of months, but for now we prefer to focus on yield curve flattening trades. We continue betting on yield curve flattening/inversion in Mexico and Colombia and are long Brazilian 10-year domestic bonds while hedging the currency risk. In addition, we recommend investors continue receiving 10-year swap rates in China and Malaysia. Arthur Budaghyan Chief Emerging Markets Strategist arthurb@bcaresearch.com Strategic Themes (18 Months And Beyond) Equities Cyclical Recommendations (6-18 Months) Cyclical Recommendations (6-18 Months)
S&P 500 Chart 1Macroeconomic Backdrop
Macroeconomic Backdrop
Macroeconomic Backdrop
Chart 2Profitability
Profitability
Profitability
Chart 3Valuations And Technicals
Valuations And Technicals
Valuations And Technicals
Chart 4Uses Of Cash
Uses Of Cash
Uses Of Cash
Cyclicals Vs Defensives Chart 5Macroeconomic Backdrop
Macroeconomic Backdrop
Macroeconomic Backdrop
Chart 6Profitability
Profitability
Profitability
Chart 7Valuation And Technicals
Valuation And Technicals
Valuation And Technicals
Chart 8Uses Of Cash
Uses Of Cash
Uses Of Cash
Growth Vs Value Chart 9Macroeconomic Backdrop
Macroeconomic Backdrop
Macroeconomic Backdrop
Chart 10Profitability
Profitability
Profitability
Chart 11Valuations And Technicals
Valuations And Technicals
Valuations And Technicals
Chart 12Uses Of Cash
Uses Of Cash
Uses Of Cash
Small Vs Large Chart 13Macroeconomic Backdrop
Macroeconomic Backdrop
Macroeconomic Backdrop
Chart 14Profitability
Profitability
Profitability
Chart 15Valuations and Technicals
Valuations and Technicals
Valuations and Technicals
Chart 16Uses Of Cash
Uses Of Cash
Uses Of Cash
Table 1Performance
Chartbook: Style Chart Pack
Chartbook: Style Chart Pack
Table 2Valuations And Forward Earnings Growth
Chartbook: Style Chart Pack
Chartbook: Style Chart Pack
Recommended Allocation
Executive Summary The constructive economic view that has us at odds with the consensus rests on three premises: excess pandemic savings will allow consumption to grow at trend, despite inflation; inflation will soon peak, moving to around 4% by year end; and inflation expectations will remain well anchored, keeping the Fed from moving immediately to stifle the economy. Our consumption thesis remains intact. Real consumption has kept pace despite falling real incomes, thanks to a steady, modest drawdown of excess savings. Though our calls for an inflation peak have been consistently premature, recent data suggest that inflation pressures are abating. Gasoline prices have been falling for seven weeks; the fever has broken in ISM survey price measures; and the labor market, notwithstanding July's potent employment report, is becoming less tight. Longer-run inflation expectations have resisted becoming unmoored despite soaring measured inflation and a breakout does not appear to be imminent. A Mighty Savings Cushion
A Mighty Savings Cushion
A Mighty Savings Cushion
Bottom Line: We continue to expect the economy will be surprisingly resilient, allowing equities to rally further before the Fed squashes the expansion. We doubt the rally will persist very far into 2023, however, so we are reducing equities to equal weight over a twelve-month timeframe. Feature We will be holding our quarterly webcast next Monday, August 15th at 9:00 a.m. Eastern time in lieu of publishing a Weekly Report. Please join us with your questions to make it a fully interactive event. We will resume our regular publication schedule on the 22nd. Last week, an investor we were meeting for the first time asked us how anyone could have published on a weekly basis this year. “Things are so uncertain and they’re moving so fast, how do you keep up? What have you been writing about?” At long last, we felt seen. Feeding the weekly beast is not easy under the best of circumstances and investors know that this year has been far from ideal. Related Report US Investment StrategyThe High Bar For Getting Worse Once the warm glow of unexpected empathy receded, we replied that we’ve been doing our best to anticipate how the key macro issues will impact financial markets over our cyclical 3-to-12-month timeframe, paying particular attention to consumers, inflation and the Fed. The outlook for consumption has been our primary focus from a growth perspective; we’ve been trying to assess how representative the key drivers of inflation are and how persistent they’ll be; and we’ve continuously monitored longer-run inflation expectations to determine if inflation has gotten far enough into economic agents’ heads to become self-reinforcing and compel the Fed to dislodge it, no matter the near-term economic cost. We review what we see on all three fronts in today’s report, and how events are unfolding relative to our expectations. The direction remains especially uncertain, but our theses remain intact, and we are sticking with our constructive outlook on risk assets and the economy for the rest of the year. We are pulling in our horns on our twelve-month optimism, however, in line with the BCA house view and the dawning realization that twelve months of equity outperformance is overly ambitious. We continue to believe the recession will arrive too late for the gloomy consensus of investors judged by their quarterly performance, forcing them back into risk assets, but the rebound may not persist beyond the FOMC’s first 2023 meeting at the beginning of February. The Consumer’s Staying Power Since CARES Act transfer payments began driving a surge in personal savings, we have viewed them as dry powder to support consumption once households regained the freedom to spend as they see fit. When the payments stopped flowing and the pandemic continued to delay a return to normal, that view came under some fire. We are of the mind that households merely deferred much of the services demand they would otherwise have slaked in 2020 and 2021; others argue that consumption deferred is consumption destroyed, as households will be reluctant to spend windfall transfers that they’d mentally sorted as savings. While it will take a while for data to confirm either thesis, we are encouraged by what we’ve seen so far. The savings rate has declined considerably so far in 2022, supporting the view that households would be willing to reach into their savings to maintain trend consumption (Chart 1). It dipped to 5.2% in the second quarter from 5.6% in the first quarter, well below February 2020’s 8.3% pre-pandemic level and 2011 to 2019’s 7.4% quarterly mean (Chart 2). Based on the series’ stability over the previous nine years, 2020’s and 2021’s forced savings rates amounted to 11- and 6-sigma post-crisis events and this year’s approximately -2.5-sigma drawdown suggests the pendulum has further to swing in the direction of dissaving. We disagree with knee-jerk conclusions that spending in excess of income is unsustainable – it’s plenty sustainable for households who socked away a mountain of savings over the previous eight quarters while bars, restaurants, stadiums, concert venues and resorts were idled. Chart 1Right On Target
Right On Target
Right On Target
Chart 22020 And 2021 Savings Were Enormous
2020 And 2021 Savings Were Enormous
2020 And 2021 Savings Were Enormous
The estimates of excess savings that we’ve been calculating every month since the summer of 2020 peaked just above $2.3 trillion last August and remained around that level before embarking on a steady decline in the first half to reach our current estimate above $2 trillion (Chart 3, bottom panel). Quoting that figure has been nagging at us lately, however, as one of the two assumptions we used to calculate households’ no-pandemic savings baseline – annualized disposable income growth of 4% – took 2% annual inflation as given, a condition that no longer applies after a twelve-month stretch in which year-over-year CPI inflation has averaged 7.1%. Chart 3Nominal Excess Savings
Taking Stock
Taking Stock
To determine how much households' purchasing power has eroded, we deflated our monthly excess savings estimates to a level equating to 2% annualized inflation (Chart 4, top panel). The adjustment knocked $450 billion off our current estimate, trimming it to $1.6 trillion (Chart 4, bottom panel). Perhaps more importantly for the outlook, our adjustment doubled the year-to-date burn rate to $500 billion. We have always worked with the (deliberately conservative) assumption that households would spend half of their excess savings; if inflation doesn’t decelerate soon, their cushion may not last very far beyond the end of the year. Chart 4Adjusted Excess Savings
Taking Stock
Taking Stock
Bottom Line: Households have been willing to dip into savings to maintain trend consumption so far this year, in line with our hypothesis. We expect they will continue to do so, and the savings rate will remain around 5% or fall even lower, but inflation has eaten up some of their dry powder. Will Inflation Ever Peak? Shredding widely shared expectations that inflation would peak sometime in the first half, the year-over-year increase in headline CPI has kept climbing, all the way to 9% in June. July should finally provide some relief, as the average national retail gasoline price has fallen for seven consecutive weeks and ended July 13% below its June 30 level (Chart 5). Last week’s ISM manufacturing and services PMIs also suggested that inflation has begun to ease its grip somewhat, with the manufacturing input prices series plunging by nearly 20 points to its two-decade mean (Chart 6, top panel) and the services prices component cooling by 8 points, though it remains quite high (Chart 6, bottom panel). Chart 5Four Bucks A Gallon Is High, But Not Unfamiliar
Four Bucks A Gallon Is High, But Not Unfamiliar
Four Bucks A Gallon Is High, But Not Unfamiliar
Chart 6The Fever May Have Broken ...
The Fever May Have Broken ...
The Fever May Have Broken ...
Chart 7... Though The Job Market Is Still Quite Hot
... Though The Job Market Is Still Quite Hot
... Though The Job Market Is Still Quite Hot
The tight-as-a-drum labor market has been a fertile source of inflation worries, but there are signs that it is becoming less tight. Job openings remain 40% above their pre-COVID high but declined by 600,000 in June and are 10% off of March’s all-time peak (Chart 7). Elevated quits reveal that it's still easy to get a job, but the net share of small businesses in the NFIB survey planning to hire in the next three months is down 40% from its peak last summer (Chart 8). The July employment report challenged the under-the-radar indicators’ implication that the labor market is cooling, as net payroll expansion reaccelerated along with average hourly earnings growth (Chart 9). We are confident that net payroll growth will slow but compensation clearly has the cyclical wind at its back, and it is not certain that labor’s structural headwind will largely offset it, as per our thesis. Chart 8Hiring Intentions Are Back To More Normal Levels ...
Hiring Intentions Are Back To More Normal Levels ...
Hiring Intentions Are Back To More Normal Levels ...
Chart 9... But Wage Growth Remains Elevated
... But Wage Growth Remains Elevated
... But Wage Growth Remains Elevated
Inflation Expectations Longer-run inflation expectations are a critical piece of the puzzle because they are the pathway for rising inflation to become self-reinforcing. If they expect persistently higher inflation, workers will negotiate more fiercely for larger compensation increases to stay ahead of it; businesses will push more vigorously to pass on their increased costs to preserve profit margins; lenders and bond investors will demand higher interest rates to protect their real returns; and consumers will seek to buy more now to get the most from their dwindling purchasing power, exacerbating supply-demand imbalances and keeping the heat on near-term inflation readings. We are therefore closely watching inflation expectations. Market-based measures like TIPS break-evens and CPI swaps shed some light on investor and business expectations, while the monthly University of Michigan consumer sentiment survey offers insight into households’ views. Market-based measures remain well-anchored: intermediate-term expectations as implied by TIPS break-evens are just nosing above the top of the Fed’s preferred 2.3-2.5% range (Chart 10, middle panel) while long-term expectations remain below it, as they have for most of the year (Chart 10, bottom panel). Intermediate- and long-term expectations derived from CPI swaps remain 20 to 30 basis points higher but are in the same position relative to their year-to-date path (Chart 11, bottom two panels). Chart 10Market-Based Inflation Expectations ...
Market-Based Inflation Expectations ...
Market-Based Inflation Expectations ...
Chart 11... Are Not Problematic
... Are Not Problematic
... Are Not Problematic
Chart 12Just Say No (To Bottleneck Prices)
Just Say No (To Bottleneck Prices)
Just Say No (To Bottleneck Prices)
The Michigan survey doesn’t betray any pressing long-run concerns. The preliminary 3.3% June reading hinting at a breakout turned out to be a false alarm, as June’s final figure was 3.1% and July’s was 2.9%. Survey respondents continue to shun big-ticket purchases because they expect prices will fall from their current levels (Chart 12). 2-year TIPS and swaps price in an optimistic near-term outlook that is likely to be disappointed, as we think inflation will prove to be sticky around the 4% level, and that disappointment could bleed into higher longer-run expectations. While expectations are not problematic now, investors will need to watch them carefully going forward. Investment Implications It was policy, monetary and fiscal, that inspired our bullish turn in 2020 once we digested the COVID shock. We thought the macro backdrop would come down to policymakers versus the virus and our money was on the former. We remained bullish across 2021 on the idea that monetary and fiscal support would remain in place well after they ceased to be necessary. Mindful that there is no such thing as a free lunch, we expected that the emergency pandemic measures would ultimately have the effect of overstimulating demand, but we entered 2022 thinking that equities and credit would enjoy one more year of sizable excess returns over Treasuries and cash before the overstimulation manifested itself. Overweighting (underweighting) equities in a multi-asset portfolio is our default position when monetary policy is easy (tight), though we will override that default when appropriate. We have no appetite for overriding it once it becomes clear that market expectations for 2023 rate cuts are going to be disappointed and tight policy is just around the bend. Given our view that inflation will linger around 4% after easing smartly over the rest of this year, we expect that the Fed will impose restrictive monetary policy settings by the second half of 2023 in its quest to drive inflation back down to its 2% target. Markets’ overly rosy Fed expectations look sure to be disappointed and they could face a reckoning after the FOMC’s January 31-February 1 meeting. Chart 13Consolidation Now, 10%+ By The End Of The Year
Consolidation Now, 10%+ By The End Of The Year
Consolidation Now, 10%+ By The End Of The Year
That meeting could herald an inflection for risk assets’ relative performance and we are therefore joining our colleagues in adopting a neutral 12-month view on equities. We continue to differ from the BCA consensus, however, in expecting a meaningful equity rally before year end. While we expect technical resistance at 4,200 will restrain the S&P 500 in the immediate term (Chart 13), we think it will find its way back into the mid-to-high 4,000s before the Fed signals that it will take the funds rate to 4% or above, dashing hopes for a February peak around 3.5%. We still want to overweight equities in multi-asset portfolios, but only until year-end or 4,500 to 4,600, whichever comes first. Doug Peta, CFA Chief US Investment Strategist dougp@bcaresearch.com
Executive Summary The US economy is experiencing a period of stagflation: booming nominal economic growth amid a lack of volume expansion. Very strong nominal growth (due to high inflation), a tight labor market, and more evidence of a wage-price spiral will cause the Fed to err on the side of hawkishness. Global trade volumes will contract and commodity prices will drop further. The former is bearish for Emerging Asian financial markets and the latter is negative for Latin American markets. Equities are currently rallying from very oversold levels and the rebound could continue in the coming weeks. However, if we are correct about our outlook on US inflation, Fed policy and global trade, then risk assets will resume their decline and the US dollar will rally. Strong Nominal, Weak Real Growth = Stagflation
Strong Nominal, Weak Real Growth = Stagflation
Strong Nominal, Weak Real Growth = Stagflation
Bottom Line: Stay defensive and continue underweighting EM in global equity and credit portfolios. The greenback will resume its uptrend sooner rather than later. This will depress EM share prices and fixed-income markets. Financial markets interpreted Fed chairman Powell’s comments in last Wednesday’s (July 27) FOMC press conference as a dovish pivot, catalyzing a sharp rebound in the S&P500. Is the bear market over? Should investors buy risk assets, including EM ones? Chart 1No Strong Rebound In EM Share Prices
No Strong Rebound In EM Share Prices
No Strong Rebound In EM Share Prices
We are hesitant to declare an end to the bear market and to recommend higher exposure to EM risk assets and currencies. In fact, the rebound in EM stocks has been feeble (Chart 1, top panel). As a result, the relative performance of EM equities versus their DM peers has fallen back to its lows of earlier this year (Chart 1, bottom panel). Overall, we reiterate what we wrote two weeks ago “…our macro themes of Fed tightening amid slowing global growth, the US dollar overshooting, and China’s disappointing recovery remain intact. These factors still warrant a defensive investment strategy, despite a possible near-term rebound in the S&P 500. EMs will lag and underperform in this rebound.” Can The Fed Afford To Pivot? With entrenched and persistent inflation in the US running well above the Fed’s target, the Fed cannot afford to – and will not – pivot for now. A simple rollover in inflation that reflects falling commodity and goods prices will not be sufficient for the Fed to make a policy U-turn and cut rates by 50 basis points next year (as fixed-income markets expect). We have been arguing that the US is already experiencing broad-based genuine inflation and has developed a wage-price spiral. Chart 2US Wage Growth Is At Its Fastest Rate In 40 years
US Wage Growth Is At Its Fastest Rate In 40 years
US Wage Growth Is At Its Fastest Rate In 40 years
US wage growth has surged to a 40-year high of 5.7% (Chart 2). Even though the labor market is set to soften on the margin, its tightness will keep wage growth elevated. Importantly, real wages have fallen significantly, and employees will be demanding higher wages to offset lost purchasing power. US companies have been raising their prices at the fastest rate in decades. Prices charged by non-farm businesses rose at an annual rate of 8-9% in Q2, the highest in the past 40 years (Chart 3). Chart 3US Companies Are Raising Their Prices At Their Fastest Rate In 40 years
US Companies Are Raising Their Prices At Their Fastest Rate In 40 years
US Companies Are Raising Their Prices At Their Fastest Rate In 40 years
Chart 4Strong Nominal, Weak Real Growth = Stagflation
Strong Nominal, Weak Real Growth = Stagflation
Strong Nominal, Weak Real Growth = Stagflation
Even though volumes have stagnated, corporate profits have been holding up because companies have been able to raise prices. Final sales to domestic purchasers in real terms registered zero growth in Q2 from Q1(Chart 4). This entails that the US economy is currency experiencing stagflation. Given that companies are able to raise prices (generating strong nominal sales) and are facing very tight labor market conditions, they might be willing to raise wages further. In brief, a wage-price spiral is unfolding in the US. US core inflation is running well above the Fed’s 2% target. The average of seven core PCE and CPI measures – our “super core” gauge of consumer price inflation − stands at 5.5% (Chart 5). Although falling commodity and goods prices (Chart 6) could cap the upside in core inflation, they are unlikely to bring it down below 4%. Hence, core inflation will remain well above the Fed’s target of 2%. This will lead the Fed to keep tightening monetary policy. Chart 5US Super Core Inflation Is At 5.5% and Rising
US Super Core Inflation Is At 5.5% and Rising
US Super Core Inflation Is At 5.5% and Rising
Chart 6US Import Prices From Asia Will Fall
US Import Prices From Asia Will Fall
US Import Prices From Asia Will Fall
Finally, in our opinion, financial markets are underappreciating how entrenched and persistent US inflation has become and are overlooking the unfolding wage-price spiral. The latest easing in US financial conditions will cause the Fed to refocus on inflation rather than growth. That is why we maintain our theme that the Fed and US equity markets remain on a collision course. We are open to the idea that the Fed could ultimately pivot earlier than required and eventually cut rates. However, odds are that the Fed has not yet pivoted and will ramp up its hawkishness in the coming months. The bar for the Fed to turn dovish is currently much higher than at any other time in the past 35 years, as inflation is much more entrenched and higher today. In our view, Powell would not like to be remembered as the chairman under whose watch inflation became enduring. He would prefer to be remembered as Paul Volcker, and not as Arthur Burns. Under the latter’s watch in the 1970s, the US experienced a devastating era of high and persistent inflation. Global equities, credit markets and US Treasurys were very oversold a few weeks ago. That is why even a minor hint from the Fed of a possible end to the hiking cycle produced such a strong rebound in stocks and fixed-income markets. This rally could persist in the coming weeks. However, if we are correct about the outlook on US inflation, Fed policy and global trade (see the section below), then risk assets will resume their decline and the US dollar will rally. Bottom Line: The US economy is experiencing a period of stagflation: booming nominal economic growth amid a lack of volume expansion. Very strong nominal growth (due to high inflation) a tight labor market, and more evidence of a wage-price spiral will cause the Fed to err on the side of hawkishness. As a result, the current rally in risk assets is unsustainable. Global Manufacturing / Trade Contraction Global manufacturing and trade are entering a period of contraction: According to manufacturing PMI data for July, Taiwanese new export orders for overall manufacturing and the semiconductor industry have plunged to 37 and 34, respectively (Chart 7). Meanwhile, their customer inventories have surged to a 10-year high (Chart 8). Taiwan is a major supplier of semiconductors and other inputs to many industries around the world. Hence, these data suggest that industrial companies globally have stopped ordering chips and other inputs. This development is a sign of broad-based industrial weakness. Therefore, we believe that global trade volumes are set to shrink in H2 this year. Chart 7Taiwan: Overall And Semiconductor New Orders Have Plunged...
Taiwan: Overall And Semiconductor New Orders Have Plunged...
Taiwan: Overall And Semiconductor New Orders Have Plunged...
Chart 8...And Customer Inventories Have Surged
...And Customer Inventories Have Surged
...And Customer Inventories Have Surged
A similar situation is unfolding in the Korean semiconductor sector. The DRAM DXI index (revenue proxy) is falling, and DRAM and NAND spot prices are deflating (Chart 9). Notably, Korea’s overall export sector is also reeling. Business confidence among Korean exporters is plunging – this includes the latest datapoint from August (Chart 10, top panel). The nation’s export volume growth is already close to zero and export value growth is only holding up because of higher prices (Chart 10, bottom panel). Chart 9Korea: Semiconductor Prices Are Deflating
Korea: Semiconductor Prices Are Deflating
Korea: Semiconductor Prices Are Deflating
Chart 10Downside Risks For Korean Exports
Downside Risks For Korean Exports
Downside Risks For Korean Exports
Chart 11US Goods Imports Are Set To Contract
US Goods Imports Are Set To Contract
US Goods Imports Are Set To Contract
US import volumes are set to shrink in the coming months. This will deepen the global trade slump. Chart 11 illustrates that US consumption of goods-ex autos has been contracting and retail inventory of goods ex-autos has skyrocketed. Together, these developments foreshadow a major contraction in US imports and global trade volumes. Commodity prices are heading south. Chinese commodity consumption will remain in the doldrums, and US/EU demand for commodities will weaken as global manufacturing contracts. The sanctions imposed on Russia initially led buyers to increase their precautionary and speculative purchases of various commodities, creating a tailwind for prices earlier this year. However, these precautionary and speculative purchases have since been halted or reversed, causing commodity prices to plunge. We made the case for falling oil prices in our July 21 report, and BCA’s China Investment Strategy’s Special Report on copper from July 27 concludes that copper prices will decline further. Chart 12China: Has The Post-Reopening Bounce Ran Its Course?
China: Has The Post-Reopening Bounce Ran Its Course?
China: Has The Post-Reopening Bounce Ran Its Course?
Finally, the Chinese manufacturing PMI rolled over in July following the rebound in May and June. New orders, backlog orders and import subcomponents have relapsed anew (Chart 12). The Chinese economy is facing considerable headwinds from the property market, rolling lockdowns resulting from the dynamic zero-COVID policy and a contraction in exports. As we argued in our July 13 report, policy stimulus has so far been insufficient. Bottom Line: Global trade volumes will contract and commodity prices will drop further. The former is bearish for Emerging Asian financial markets and the latter is negative for Latin American markets. Investment Strategy Although the rebound in global risk assets could persist for several weeks, their risk-reward profile is not attractive. Stay defensive and continue underweighting EM in global equity and credit portfolios. The Fed’s hawkish bias as well as contracting global trade are bullish for the US dollar. As a result, the greenback will resume its uptrend sooner rather than later. This will cap the upside in EM stocks and fixed-income markets. We continue to short the following currencies versus the USD: ZAR, COP, PEN, PLN, PHP, and IDR. In addition, we recommend shorting HUF vs. CZK, KRW vs. JPY, and BRL vs. MXN. Although we find good value in many EM local yields, we do not yet recommend buying them aggressively. The basis is our view on EM currencies versus the US dollar. For now, we prefer to bet on flattening yield curves. Our current favorite markets for flatteners are Mexico and Colombia. Arthur Budaghyan Chief Emerging Markets Strategist arthurb@bcaresearch.com Strategic Themes (18 Months And Beyond) Equities Cyclical Recommendations (6-18 Months) Cyclical Recommendations (6-18 Months)
Counterpoint’s August schedule: Next week, I am travelling to see clients in Australia, New Zealand, and Singapore, so we will send you a report on China’s 20th National Party Congress written by our Chief Geopolitical Strategist, Matt Gertken. Given that the outlook for the $100 trillion Chinese real estate market is crucial for the global economy and markets, Matt’s insights will be very interesting. Then on August 18, I will host the monthly Counterpoint webcast, which I hope you can join. We will then take a week’s summer holiday and return with a report on September 1. Executive Summary In the topsy-turvy recession of 2022, real wages have collapsed. This means profits have stayed resilient and firms have not laid off workers. Making this recession a ‘cost of living crisis’ rather than a ‘jobs crisis’. If inflation comes down slowly, then the ‘cost of living crisis’ will persist. But if inflation comes down quickly while wage inflation remains sticky, firms will lay off workers to protect their profits, turning the ‘cost of living crisis’ into a ‘jobs crisis’. Either way, this will keep a choke on consumer spending, and particularly the spending on goods, which is likely to remain in recession. Meanwhile, until mortgage rates move meaningfully lower, housing investment will also remain in recession. The double choke on growth means that the bear market in the 30-year T-bond is likely over. This suggests that the bear market in stock market valuations is also over, but that ‘cyclical value’ is now vulnerable to profit downgrades. Hence, equity investors should stick with ‘defensive growth’, specifically healthcare and biotech. Fractal trading watchlist: GBP/USD and Hungarian versus Polish bonds. In The 2008 Recession, Real Wage Rates ##br##Went Up So Employment Went Down…
In The 2008 Recession, Real Wage Rates Went Up So Employment Went Down...
In The 2008 Recession, Real Wage Rates Went Up So Employment Went Down...
…But In The 2022 Recession, Real Wage Rates##br##Went Down So Employment Went Up!
...But In The 2022 Recession, Real Wage Rates Went Down So Employment Went Up!
...But In The 2022 Recession, Real Wage Rates Went Down So Employment Went Up!
Bottom Line: The bear market in the 30-year T-bond and stock market valuations is likely over, but equity investors should stick with ‘defensive growth’, specifically healthcare and biotech. Feature The US economy has just contracted for two consecutive quarters, meeting the rule-of-thumb definition of a recession. Other major economies are likely to follow. Yet many economists and strategists are in denial. This cannot be a ‘proper’ recession, they say, because the economy remains at full employment. But the recession-deniers are wrong. It is a recession, albeit it is a ‘topsy-turvy’ recession in which employment remains high (so far) because real wage rates have collapsed, circumventing the need for lay-offs. This contrasts with a typical recession when real wage rates remain high, forcing the need for lay-offs.1 The Topsy-Turvy Recession Of 2022 When do firms lay off workers? The answer is, when they need to protect their profits. Profits are nothing more than revenues minus costs, and in a typical recession revenues slow much faster than the firms’ biggest cost, the wage bill. In this event, the only way that firms can protect their profits is to lay off workers. Chart I-1 confirms that every time that nominal sales have shrunk relative to wage rates, the unemployment rate has gone up. Without exception. Chart I-1Unemployment Goes Up Whenever Firms' Wage Rates Rise Faster Than Their Revenues...
Unemployment Goes Up Whenever Firms' Wage Rates Rise Faster Than Their Revenues...
Unemployment Goes Up Whenever Firms' Wage Rates Rise Faster Than Their Revenues...
But what happens during a recession in which nominal sales do not shrink relative to wage rates? In this event, profits stay resilient, so firms do not need to lay off workers. Welcome to the topsy-turvy recession of 2022! In the topsy-turvy recession of 2022, there has been much greater inflation in consumer prices and nominal sales than in nominal wage rates (Chart I-2). The result is that real wage rates have collapsed, profits have stayed resilient, and firms have not needed to lay off workers… so far. Chart I-2...But In The 2022 Recession, Wage Rates Have Risen Slower Than Revenues, So Unemployment Hasn't Gone Up
...But In The 2022 Recession, Wage Rates Have Risen Slower Than Revenues, So Unemployment Hasn't Gone Up
...But In The 2022 Recession, Wage Rates Have Risen Slower Than Revenues, So Unemployment Hasn't Gone Up
In a typical recession, the pain falls on the minority of workers who lose their jobs, as well as on profits. Paradoxically, for the majority that keep their jobs, real wages go up. This is because sticky wage inflation tends to hold up more than collapsing price inflation. For example, in the 2008 recession, the real wage rate surged by 4 percent (Chart I-3), and in the 2020 recession it rose by 2 percent. Chart I-3In The 2008 Recession, Real Wage Rates Went Up So Employment Went Down...
In The 2008 Recession, Real Wage Rates Went Up So Employment Went Down...
In The 2008 Recession, Real Wage Rates Went Up So Employment Went Down...
Yet in the 2022 recession, the real wage rate has shrunk by 4 percent, meaning that the pain of the recession has fallen on all of us (Chart I-4). In one sense therefore, this recession is ‘fairer’ because ‘we’re all in it together’. This is confirmed by the current malaise being characterised not as a ‘jobs crisis’, but as a ‘cost of living crisis’. In another sense though, the recession is unfair because the pain has not been shared by corporate profits, which have remained resilient… so far. Chart I-4...But In The 2022 Recession, Real Wage Rates Went Down So Employment Went Up!
...But In The 2022 Recession, Real Wage Rates Went Down So Employment Went Up!
...But In The 2022 Recession, Real Wage Rates Went Down So Employment Went Up!
The crucial question is, what happens next? Using the US as our template, wage rates are growing at 5-6 percent, and this growth rate is typically stickier than sales growth. Assuming inflation drifts lower, nominal sales growth will also drift lower from its current 7 percent clip, meaning that it could soon dip below sticky wage growth. Once the growth in firms’ revenues has dipped below that in nominal wage rates, profits will finally keel over. To repeat, profits are nothing more than revenues minus costs, where the biggest cost is the wage bill (Chart I-5).2 Chart I-5Profits Are Nothing More Than Revenues Minus Costs
Profits Are Nothing More Than Revenues Minus Costs
Profits Are Nothing More Than Revenues Minus Costs
At this point, the downturn will become more conventional. To protect profits, firms will be forced to lay off workers who will bear the pain of the downturn alongside falling profits. Meanwhile, with inflation easing, real wage growth for the majority that keep their jobs will turn positive. But to repeat, this is the typical pattern in a recession. Accelerating real wage rates are entirely consistent with a contracting economy as we witnessed in both 2008 and 2020. As Two Huge Imbalances Correct, Demand Will Be Pegged Back All of this assumes that real demand will remain under pressure, so the question is what is pegging back real demand? The answer is: corrections in two huge imbalances in the global economy. A breakdown of the -1.3 percent contraction in the US economy reveals these two corrections:3 Spending on goods, which contributed -1.2 percent Housing investment, which contributed -0.7 percent. These corrections are not over. As we presciently explained back in February in A Massive Economic Imbalance, Staring Us In The Face: “The pandemic overspend on goods constitutes one of the greatest imbalances in economic history. An overspend on goods is corrected by a subsequent underspend; but an underspend on services is not corrected by a subsequent overspend. The pandemic overspend on goods constitutes one of the greatest imbalances in economic history. This unfortunate asymmetry means that the recent overspend on goods at the expense of services makes the economy vulnerable to a recession. And the risk is exacerbated by central banks’ intentions to hike rates in response to inflation” (Chart I-6). Chart I-6The Pandemic Overspend On Goods Constitutes One Of The Greatest Imbalances In Economic History
The Pandemic Overspend On Goods Constitutes One Of The Greatest Imbalances In Economic History
The Pandemic Overspend On Goods Constitutes One Of The Greatest Imbalances In Economic History
Then, in The Global Housing Boom Is Over, As Buying Becomes More Expensive Than Renting, we identified a second major imbalance that is starting to correct. Specifically, the global housing boom of the past decade, which has doubled the worth of global real estate to $370 trillion, was predicated on ultra-low mortgage rates that made buying a home more attractive than renting. But in many parts of the world now, buying a home has become more expensive than renting (Chart I-7). Disappearing US and European homebuyers combined with a flood of home-sellers will weigh on home prices and housing investment – at least until policymakers are forced to bring down mortgage rates (Chart I-8 and Chart I-9). Chart I-7Buying A Home Has Become More Expensive Than Renting!
Buying A Home Has Become More Expensive Than Renting!
Buying A Home Has Become More Expensive Than Renting!
Chart I-8Homebuyers Have Disappeared...
Homebuyers Have Disappeared...
Homebuyers Have Disappeared...
Chart I-9...While Home-Sellers Are Flooding The Market
...While Home-Sellers Are Flooding The Market
...While Home-Sellers Are Flooding The Market
Meanwhile, as Chinese policymakers try and gently let the air out of the $100 trillion Chinese real estate market, a collapse in Chinese property development and construction activity will have negative long-term implications for commodities, emerging Asia, and developing countries that produce raw materials. More Investment Conclusions In addition to the long-term investment conclusions just described, we can draw some shorter-term conclusions: If inflation comes down slowly, then the current ‘cost of living crisis’, which is pummelling everyone’s real incomes, will persist. But if inflation comes down quickly while wage inflation remains sticky, firms will be forced to lay off workers to protect their profits, turning the ‘cost of living crisis’ into a ‘jobs crisis’. Either way, this will keep a choke on consumer spending, and particularly the spending on goods, which is likely to remain in recession. Meanwhile, until mortgage rates move meaningfully lower, housing investment will also remain in recession. Equityinvestors should stick with ‘defensive growth’, specifically healthcare and biotech. This double choke on growth is likely to keep a lid on ultra-long bond yields, even if central banks need to hike short-term rates more than expected to slay inflation. Our proprietary fractal analysis confirms that the sell-off in the 30-year T-bond is likely over (Chart I-10). Chart I-10The Bear Market In The 30-Year T-Bond Is Likely Over
The Bear Market In The 30-Year T-Bond Is Likely Over
The Bear Market In The 30-Year T-Bond Is Likely Over
For the stock market, this suggests that the valuation bear market is now over, but that ‘cyclical value’ sectors are now vulnerable to profit downgrades. Hence, equity investors should stick with ‘defensive growth’, specifically healthcare and biotech. Fractal Trading Watchlist This week we noticed that the sudden 20 percent collapse of Hungarian versus Polish 10-year bonds, has reached the point of short-term fractal fragility that suggests an imminent rebound. Hence, we are adding this to our watchlist. Go long GBP/USD. But our trade is GBP/USD. UK political risk is diminishing, the BoE is likely to be as, or more, hawkish than the Fed, and the 260-day fractal structure of GBP/USD is at the point of fragility that has signalled major turning points in 2014, 15, 16, 18 and 21 (Chart I-11). Accordingly the recommendation is long GBP/USD, setting the profit target and symmetrical stop-loss at 5 percent. Chart I-11Go Long GBP/USD
Go Long GBP/USD Go Long GBP/USD
Go Long GBP/USD Go Long GBP/USD
Expect Hungarian Bonds To Rebound
Expect Hungarian Bonds To Rebound
Expect Hungarian Bonds To Rebound
Chart 1CNY/USD At A Potential Turning Point
CNY/USD At A Potential Turning Point
CNY/USD At A Potential Turning Point
Chart 2Expect Hungarian Bonds To Rebound
Expect Hungarian Bonds To Rebound
Expect Hungarian Bonds To Rebound
Chart 3Copper's Selloff Has Hit Short-Term Resistance
Copper's Selloff Has Hit Short-Term Resistance
Copper's Selloff Has Hit Short-Term Resistance
Chart 4US REITS Are Oversold Versus Utilities
US REITS Are Oversold Versus Utilities
US REITS Are Oversold Versus Utilities
Chart 5CAD/SEK Is Reversing
CAD/SEK Is Reversing
CAD/SEK Is Reversing
Chart 6Financials Versus Industrials Has Reversed
Financials Versus Industrials Has Reversed
Financials Versus Industrials Has Reversed
Chart 7The Outperformance Of Resources Versus Biotech Has Ended
The Outperformance Of Resources Versus Biotech Has Ended
The Outperformance Of Resources Versus Biotech Has Ended
Chart 8The Outperformance Of Resources Versus Healthcare Has Ended
The Outperformance Of Resources Versus Healthcare Has Ended
The Outperformance Of Resources Versus Healthcare Has Ended
Chart 9FTSE100 Outperformance Vs. Euro Stoxx 50 Is Vulnerable To Reversal
FTSE100 Outperformance Vs. Euro Stoxx 50 Is Vulnerable To Reversal
FTSE100 Outperformance Vs. Euro Stoxx 50 Is Vulnerable To Reversal
Chart 10Netherlands' Underperformance Vs. Switzerland Has Ended
Netherlands' Underperformance Vs. Switzerland Has Ended
Netherlands' Underperformance Vs. Switzerland Has Ended
Chart 11The Sell-Off In The 30-Year T-Bond At Fractal Fragility
The Sell-Off In The 30-Year T-Bond At Fractal Fragility
The Sell-Off In The 30-Year T-Bond At Fractal Fragility
Chart 12The Sell-Off In The NASDAQ Is Approaching Fractal Fragility
The Sell-Off In The NASDAQ Is Approaching Fractal Fragility
The Sell-Off In The NASDAQ Is Approaching Fractal Fragility
Chart 13Food And Beverage Outperformance Is Exhausted
Food And Beverage Outperformance Is Exhausted
Food And Beverage Outperformance Is Exhausted
Chart 14German Telecom Outperformance Has Started To Reverse
German Telecom Outperformance Has Started To Reverse
German Telecom Outperformance Has Started To Reverse
Chart 15Japanese Telecom Outperformance Vulnerable To Reversal
Japanese Telecom Outperformance Vulnerable To Reversal
Japanese Telecom Outperformance Vulnerable To Reversal
Chart 16ETH Is Approaching A Possible Capitulation
ETH Is Approaching A Possible Capitulation
ETH Is Approaching A Possible Capitulation
Chart 17The Strong Trend In The 18-Month-Out US Interest Rate Future Has Ended
The Strong Trend In The 18-Month-Out US Interest Rate Future Has Ended
The Strong Trend In The 18-Month-Out US Interest Rate Future Has Ended
Chart 18The Strong Downtrend In The 3 Year T-Bond Has Ended
The Strong Downtrend In The 3 Year T-Bond Has Ended
The Strong Downtrend In The 3 Year T-Bond Has Ended
Chart 19A Potential Switching Point From Tobacco Into Cannabis
A Potential Switching Point From Tobacco Into Cannabis
A Potential Switching Point From Tobacco Into Cannabis
Chart 20Biotech Is A Major Buy
Biotech Is A Major Buy
Biotech Is A Major Buy
Chart 21Norway's Outperformance Has Ended
Norway's Outperformance Has Ended
Norway's Outperformance Has Ended
Chart 22Cotton Versus Platinum Has Reversed
Cotton Versus Platinum Has Reversed
Cotton Versus Platinum Has Reversed
Chart 23Switzerland's Outperformance Vs. Germany Is Exhausted
Switzerland's Outperformance Vs. Germany Is Exhausted
Switzerland's Outperformance Vs. Germany Is Exhausted
Chart 24USD/EUR Is Vulnerable To Reversal
USD/EUR Is Vulnerable To Reversal
USD/EUR Is Vulnerable To Reversal
Chart 25The Outperformance Of MSCI Hong Kong Versus China Has Ended
The Outperformance Of MSCI Hong Kong Versus China Has Ended
The Outperformance Of MSCI Hong Kong Versus China Has Ended
Chart 26A Potential New Entry Point Into Petcare
A Potential New Entry Point Into Petcare
A Potential New Entry Point Into Petcare
Chart 27US Utilities Outperformance Vulnerable To Reversal
US Utilities Outperformance Vulnerable To Reversal
US Utilities Outperformance Vulnerable To Reversal
Chart 28The Outperformance Of Oil Versus Banks Is Exhausted
The Outperformance Of Oil Versus Banks Is Exhausted
The Outperformance Of Oil Versus Banks Is Exhausted
Dhaval Joshi Chief Strategist dhaval@bcaresearch.com Footnotes 1 The best measure of wage rates is the employment cost index (ECI) because it includes all forms of compensation including benefits and bonuses. 2 In fact, stock market profits are even more cyclical because, as well as wages, there are other sticky deductions from revenues such as interest and taxes. 3 All expressed as annualised rates. Fractal Trading System Fractal Trades
Welcome To The Topsy-Turvy Recession Of 2022!
Welcome To The Topsy-Turvy Recession Of 2022!
Welcome To The Topsy-Turvy Recession Of 2022!
Welcome To The Topsy-Turvy Recession Of 2022!
6-12 Month Recommendations Structural Recommendations Closed Fractal Trades Indicators To Watch - Bond Yields Chart II-1Indicators To Watch - Bond Yields - Euro Area
Indicators To Watch - Bond Yields - Euro Area
Indicators To Watch - Bond Yields - Euro Area
Chart II-2Indicators To Watch - Bond Yields - Europe Ex Euro Area
Indicators To Watch - Bond Yields - Europe Ex Euro Area
Indicators To Watch - Bond Yields - Europe Ex Euro Area
Chart II-3Indicators To Watch - Bond Yields - Asia
Indicators To Watch - Bond Yields - Asia
Indicators To Watch - Bond Yields - Asia
Chart II-4Indicators To Watch - Bond Yields - Other Developed
Indicators To Watch - Bond Yields - Other Developed
Indicators To Watch - Bond Yields - Other Developed
Indicators To Watch - Interest Rate Expectations Chart II-5Indicators To Watch - Interest Rate Expectations
Indicators To Watch - Interest Rate Expectations
Indicators To Watch - Interest Rate Expectations
Chart II-6Indicators To Watch - Interest Rate Expectations
Indicators To Watch - Interest Rate Expectations
Indicators To Watch - Interest Rate Expectations
Chart II-7Indicators To Watch - Interest Rate Expectations
Indicators To Watch - Interest Rate Expectations
Indicators To Watch - Interest Rate Expectations
Chart II-8Indicators To Watch - Interest Rate Expectations
Indicators To Watch - Interest Rate Expectations
Indicators To Watch - Interest Rate Expectations
Executive Summary Biden Taps China-Bashing Consensus
Biden's Midterm Tactics Bear Fruit… But There's A Snake
Biden's Midterm Tactics Bear Fruit… But There's A Snake
House Speaker Nancy Pelosi’s visit to Taiwan reflects one of our emerging views in 2022: the Biden administration’s willingness to take foreign policy risks ahead of the midterm elections. Biden’s foreign policy will continue to be reactive and focused on domestic politics through the midterms. Hence global policy uncertainty and geopolitical risk will remain elevated at least until November 8. Biden is seeing progress on his legislative agenda. Congress is passing a bill to compete with China while the Democrats are increasingly likely to pass a second reconciliation bill, both as predicted. These developments support our view that President Biden’s approval rating will stabilize and election races will tighten, keeping domestic US policy uncertainty elevated through November. These trends pose a risk to our view that Republicans will take the Senate, but the prevailing macroeconomic and geopolitical environment is still negative for the ruling Democratic Party. We expect legislative gridlock and frozen US fiscal policy in 2023-24. Close Recommendation (Tactical) Initiation Date Return Long Refinitiv Renewables Vs. S&P 500 Mar 30, 2022 25.4% Long Biotech Vs. Pharmaceuticals Jul 8, 2022 -3.3% Bottom Line: While US and global uncertainty remain high, we will stay long US dollar, long large caps over small caps, and long US Treasuries versus TIPS. But these are tactical trades and are watching closely to see if macroeconomic and geopolitical factors improve later this year. Feature President Biden’s average monthly job approval rating hit its lowest point, 38.5%, in July 2022. However, Biden’s anti-inflation campaign and midterm election tactics are starting to bear fruit: gasoline prices have fallen from a peak of $5 per gallon to $4.2 today, the Democratic Congress is securing some last-minute legislative wins, and women voters are mobilizing to preserve abortion access. These developments mean that the Democratic Party’s electoral prospects will improve marginally between now and the midterm election, causing Senate and congressional races to tighten – as we have expected. US policy uncertainty will increase. Investors will see a rising risk that Democrats will keep control of the Senate – and conceivably even the House – and hence retain unified control of the executive and legislative branches. This “Blue Sweep” risk will challenge the market consensus, which overwhelmingly (and still correctly) expects congressional gridlock in 2023-24. A continued blue sweep would mean larger tax hikes and social spending, while gridlock would neutralize fiscal policy for the next two years. Investors should fade this inflationary blue sweep risk and continue to plan for disinflationary gridlock. First, our quantitative election models still predict that Democrats will lose control of both House and Senate (Appendix). Second, Biden’s midterm tactics face very significant limitations, particularly emanating from geopolitics – the snake in this report’s title. Pelosi’s Trip To Taiwan Raises Near-Term Market Risks One of Biden’s election tactics is our third key view for 2022: reactive foreign policy. Initially we viewed this reactiveness as “risk-averse” but in May we began to argue that Biden could take risky bets given his collapsing approval ratings. Either way, Biden is using foreign policy as a means of improving his party’s domestic political fortunes. In particular, he is willing to take big risks with China, Russia, Iran, and terrorist groups like Al Qaeda. The template is the 1962 congressional election, when President John F. Kennedy largely defied the midterm election curse by taking a tough stance against Russia in the Cuban Missile Crisis (Chart 1). If Biden achieves a foreign policy victory, then Democrats will benefit. If he instigates a crisis, voters will rally around his administration out of patriotism. Nancy Pelosi’s visit to Taipei is the prominent example of this key view. The trip required full support from the US executive branch and military and was not only the swan song of a single politician. It was one element of the Biden administration’s decision to maintain the Trump administration’s hawkish China policy. Thus while Congress passes the $52 billion Chips and Science Act to enhance US competitiveness in technology and semiconductor manufacturing, Biden is also contemplating tightening export controls on computer chip equipment that China needs to upgrade its industry.1 Biden is reacting to a bipartisan and popular consensus holding that the US needs to take concrete measures to challenge China and protect American industry (Chart 2). This is different from the old norm of rhetorical China-bashing during midterms. Chart 1Biden Provokes Foreign Rivals
Biden's Midterm Tactics Bear Fruit… But There's A Snake
Biden's Midterm Tactics Bear Fruit… But There's A Snake
Chart 2Biden Taps China-Bashing Consensus
Biden's Midterm Tactics Bear Fruit… But There's A Snake
Biden's Midterm Tactics Bear Fruit… But There's A Snake
Reactive US foreign policy will continue through November and possibly beyond – including but not limited to China. The US chose to sell long-range weapons to Ukraine and provide intelligence targeting Russian forces, prompting Russia to declare that the US is now “directly” involved in the Ukraine conflict. The US decision to eradicate Al Qaeda leader Ayman Al-Zawahiri also reflects this foreign policy trend. Reactive foreign policy will increase the near-term risk of new negative geopolitical surprises for markets. Note that the 1962 Cuban Missile Crisis analogy is inverted when it comes to the Taiwan Strait. China is willing to take much greater risks than the US in its sphere of influence. The same goes for Russia in Ukraine. If US policy backfires then it may assist the Democrats in the election – but not if Biden suffers a humiliation or if the US economy suffers as a result. Chart 3US Import Prices Will Stay High From Greater China
US Import Prices Will Stay High From Greater China
US Import Prices Will Stay High From Greater China
US import prices will continue to rise from Greater China (Chart 3), undermining Biden’s anti-inflation agenda. Supply kinks in the semiconductor industry will become relevant again whenever demand rebounds (Chart 4). Global energy prices will also remain high as a result of the EU’s oil embargo and Russia’s continued tightening of European natural gas supplies. Chart 4New Semiconductor Kinks Will Appear When Demand Recovers
New Semiconductor Kinks Will Appear When Demand Recovers
New Semiconductor Kinks Will Appear When Demand Recovers
OPEC has decided only to increase oil production by 100,000 barrels per day, despite Biden’s visit to Saudi Arabia cap in hand. We argued that the Saudis would give a token but would largely focus on weakening global demand rather than pumping substantially more oil to help Biden and the Democrats in the election. The Saudis know that Biden is still attempting to negotiate a nuclear deal with Iran that would free up Iranian exports. So the Saudis are not giving much relief, and if Biden fails on Iran, oil supply disruptions will increase. Bottom Line: Price pressures will intensify as a result of the US-China and US-Russia standoffs – and probably also the US-Iran standoff. Hawkish foreign policy is not conducive to reducing inflationary ills. Global policy uncertainty and geopolitical risk will remain high throughout the midterm election season, causing continued volatility for US equities. Abortion Boosts Democratic Election Odds Earlier this year we highlighted that the Supreme Court’s overturning of the 1972 Roe v. Wade decision would lead to a significant mobilization of women voters in favor of the Democratic Party ahead of the midterm election. The first major electoral test since the court’s ruling, a popular referendum in the state of Kansas, produced a surprising result on August 2 that confirms and strengthens this thesis. Kansas is a deeply religious and conservative state where President Trump defeated President Biden by a 15% margin in 2020. The referendum was held during the primary election season, when electoral turnout skews heavily toward conservatives and the elderly. Yet Kansans voted by an 18% margin (59% versus 41%) not to amend the constitution, i.e. not to empower the legislature to tighten regulations on abortion. Voter turnout is not yet reported but likely far higher than in recent non-presidential primary elections. Kansans voted in the direction of nationwide opinion polling on whether abortion should be accessible in cases where the mother’s health is endangered. They did not vote in accordance with more expansive defenses of abortion, which are less popular (Chart 5). If the red state of Kansas votes this way then other states will see an even more substantial effect, at least when abortion is on the ballot. Chart 5Abortion Will Mitigate Democrats’ Losses
Biden's Midterm Tactics Bear Fruit… But There's A Snake
Biden's Midterm Tactics Bear Fruit… But There's A Snake
The question is how much of this Roe v. Wade effect will carry over to the general congressional elections. The referendum focused exclusively on abortion. Voters did not vote on party lines. Voters never like it when governments try to take away rights or privileges that have previously been granted. But in November the election will center on other topics, including inflation and the economy. And midterm elections almost always penalize the incumbent party. Our quantitative election models imply that Democrats will lose 22 seats in the House and two seats in the Senate, yielding Congress to the Republicans next year (Appendix). Still, women’s turnout presents a risk to our models. Women’s support for the Democratic Party has not improved markedly since the Supreme Court ruling, as we have shown in recent reports (Chart 6). But the polling could pick up again. Women’s turnout could be a significant tailwind in a year of headwinds for the Democrats. Bottom Line: Democrats’ electoral prospects have improved, as we anticipated earlier this year (Chart 7). This trend will continue as a result of the mobilization of women. Republicans are still highly likely to take Congress but our conviction on the Senate is much lower than it is on the House. Chart 6Biden’s And Democrats’ Approval Among Women
Biden's Midterm Tactics Bear Fruit… But There's A Snake
Biden's Midterm Tactics Bear Fruit… But There's A Snake
Chart 7Democrats’ Odds Will Improve On Margin
Biden's Midterm Tactics Bear Fruit… But There's A Snake
Biden's Midterm Tactics Bear Fruit… But There's A Snake
Reconciliation Bill: Still 65% Chance Of Passing Ultimately Democrats’ electoral performance will depend on inflation, the economy, and cyclical dynamics. If inflation falls over the course of the next three months, then Democrats will have a much better chance of stemming midterm losses. That is why President Biden rebranded his slimmed down “Build Back Better” reconciliation bill as the “Inflation Reduction Act.” We maintain our 65% odds that the bill will pass, as we have done all year. There is still at least a 35% chance that Senator Kyrsten Sinema of Arizona could defect from the Democrats, given that she opposed any new tax hikes and the reconciliation bill will impose a 15% minimum tax on corporations. A single absence or defection would topple the budget reconciliation process, which enables Democrats to pass the bill on a simple majority vote. We have always argued that Sinema would ultimately fall in line rather than betraying her party at the last minute before the election. This is even more likely given that moderate-in-chief, Senator Joe Manchin of West Virginia, negotiated and now champions the bill. But some other surprise could still erase the Democrats’ single-seat majority, so we stick with 65% odds. Most notably the bill will succeed because it actually reduces the budget deficit – by an estimated $300 billion over a decade (Table 1). Deficit reduction was the original purpose of lowering the number of votes required to pass a bill under the budget reconciliation process. Now Democrats are using savings generated from new government caps on pharmaceuticals (a popular measure) to fund health and climate subsidies. Given deficit reduction, it is conceivable that a moderate Republican could even vote for the bill. Table 1Democrats’ Inflation Reduction Act (Budget Reconciliation)
Biden's Midterm Tactics Bear Fruit… But There's A Snake
Biden's Midterm Tactics Bear Fruit… But There's A Snake
Bottom Line: Democrats are more likely than ever to pass their fiscal 2022 reconciliation bill by the September 30 deadline. The bill will cap some drug prices and reduce the deficit marginally, so it can be packaged as an anti-inflation bill, giving Democrats a legislative win ahead of the midterm. However, its anti-inflationary impact will ultimately be negligible as $300 billion in savings hardly effects the long-term rising trajectory of US budget deficits relative to output. The bill will add to voters’ discretionary income and spur the renewable energy industry. And if it helps the Democrats retain power, then it enables further spending and tax hikes down the road, which would prove inflationary. The reconciliation bill, annual appropriations, and the China competition bill were the remaining bills that we argued would narrowly pass before the US Congress became gridlocked again. So far this view is on track. Investment Takeaways Companies that paid a high effective corporate tax rate before President Trump’s tax cuts have benefited relative to those that paid a low effective rate. They stood to suffer most if Trump’s tax cuts were repealed. But Democrats were forced to discard their attempt to raise the overall corporate tax rate last year. Instead the minimum corporate rate will rise to 15%, hitting those that paid the lowest effective rate, such as Big Tech companies, relative to high-tax rate sectors such as energy (Chart 8, top panel). Tactically energy may still underperform tech but cyclically energy could outperform and the reconciliation bill would feed into that trend. Similarly, companies that faced high foreign tax risk, because they made good income abroad but paid low foreign tax rates, stand to suffer most from the imposition of a minimum corporate tax rate (Chart 8, bottom panel). Again, Big Tech stands to suffer, although it has already priced a lot of bad news and may not perform poorly in the near term. Chart 8Market Responds To Minimum Corporate Tax
Market Responds To Minimum Corporate Tax
Market Responds To Minimum Corporate Tax
Chart 9Market Responds To New Climate Subsidies
Market Responds To New Climate Subsidies
Market Responds To New Climate Subsidies
Renewable energy stocks have rallied sharply on the news of the Democrats’ reconciliation bill getting back on track (Chart 9). We are booking a 25.4% gain on this tactical trade and will move to the sidelines for now, although renewable energy remains a secular investment theme. Health stocks, particularly pharmaceuticals, have taken a hit from the new legislation as we expected. However, biotech has not outperformed pharmaceuticals as we expected, so we will close this tactical trade for a loss of 3.3%. The reconciliation bill will cap drug prices for only the most popular generic drugs and does not pose as much of a threat to biotech companies (Chart 10). Biotech should perform well tactically as long bond yields decline – they are also historically undervalued, as noted by Dhaval Joshi of our Counterpoint strategy service. So we will stick to long Biotech versus the broad market. US semiconductors remain in a long bull market and will be in heavy demand once global and US economic activity stabilize. They are also likely to outperform competitors in Greater China that face a high and persistent geopolitical risk premium (Chart 11). Chart 10Market Responds To Drug Price Caps
Market Responds To Drug Price Caps
Market Responds To Drug Price Caps
Chart 11Market Responds To China Competition Bill
Market Responds To China Competition Bill
Market Responds To China Competition Bill
Tactically we prefer bonds to stocks, US equities to global equities, defensive sectors to cyclicals, large caps to small caps, and growth stocks to value stocks (Chart 12). The US is entering a technical recession, Europe is entering recession, China’s economy is weak, and geopolitical tensions are at extreme highs over Ukraine, Taiwan, and Iran. The US is facing an increasingly uncertain midterm election. These trends prevent us from adding risk in our portfolio in the short term. However, much bad news is priced and we are on the lookout for positive economic surprises and successful diplomatic initiatives to change the investment outlook for 2023. If the US and China recommit to the status quo in the Taiwan Strait, if Russia moves toward ceasefire talks in Ukraine, if the US and Iran rejoin the 2015 nuclear deal, then we will take a much more optimistic attitude. Some political and geopolitical risks could begin to recede in the fourth quarter – although that remains to be seen. And even then, geopolitical risk is rising on a secular basis. Chart 12Tactically Recession And Geopolitics Will Weigh On Risk Assets
Tactically Recession And Geopolitics Will Weigh On Risk Assets
Tactically Recession And Geopolitics Will Weigh On Risk Assets
Matt Gertken Senior Vice President Chief US Political Strategist mattg@bcaresearch.com Footnotes 1 Alexandra Alper and Karen Freifeld, “U.S. considers crackdown on memory chip makers in China,” Reuters, August 1, 2022, reuters.com. Strategic View Open Tactical Positions (0-6 Months) Open Cyclical Recommendations (6-18 Months) Table A2Political Risk Matrix
Biden's Midterm Tactics Bear Fruit… But There's A Snake
Biden's Midterm Tactics Bear Fruit… But There's A Snake
Table A3US Political Capital Index
Biden's Midterm Tactics Bear Fruit… But There's A Snake
Biden's Midterm Tactics Bear Fruit… But There's A Snake
Chart A1Presidential Election Model
Third Quarter US Political Outlook: Last Ditch Effort
Third Quarter US Political Outlook: Last Ditch Effort
Chart A2Senate Election Model
Third Quarter US Political Outlook: Last Ditch Effort
Third Quarter US Political Outlook: Last Ditch Effort
Table A4House Election Model
Biden's Midterm Tactics Bear Fruit… But There's A Snake
Biden's Midterm Tactics Bear Fruit… But There's A Snake
Table A5APolitical Capital: White House And Congress
Biden's Midterm Tactics Bear Fruit… But There's A Snake
Biden's Midterm Tactics Bear Fruit… But There's A Snake
Table A5BPolitical Capital: Household And Business Sentiment
Biden's Midterm Tactics Bear Fruit… But There's A Snake
Biden's Midterm Tactics Bear Fruit… But There's A Snake
Table A5CPolitical Capital: The Economy And Markets
Biden's Midterm Tactics Bear Fruit… But There's A Snake
Biden's Midterm Tactics Bear Fruit… But There's A Snake
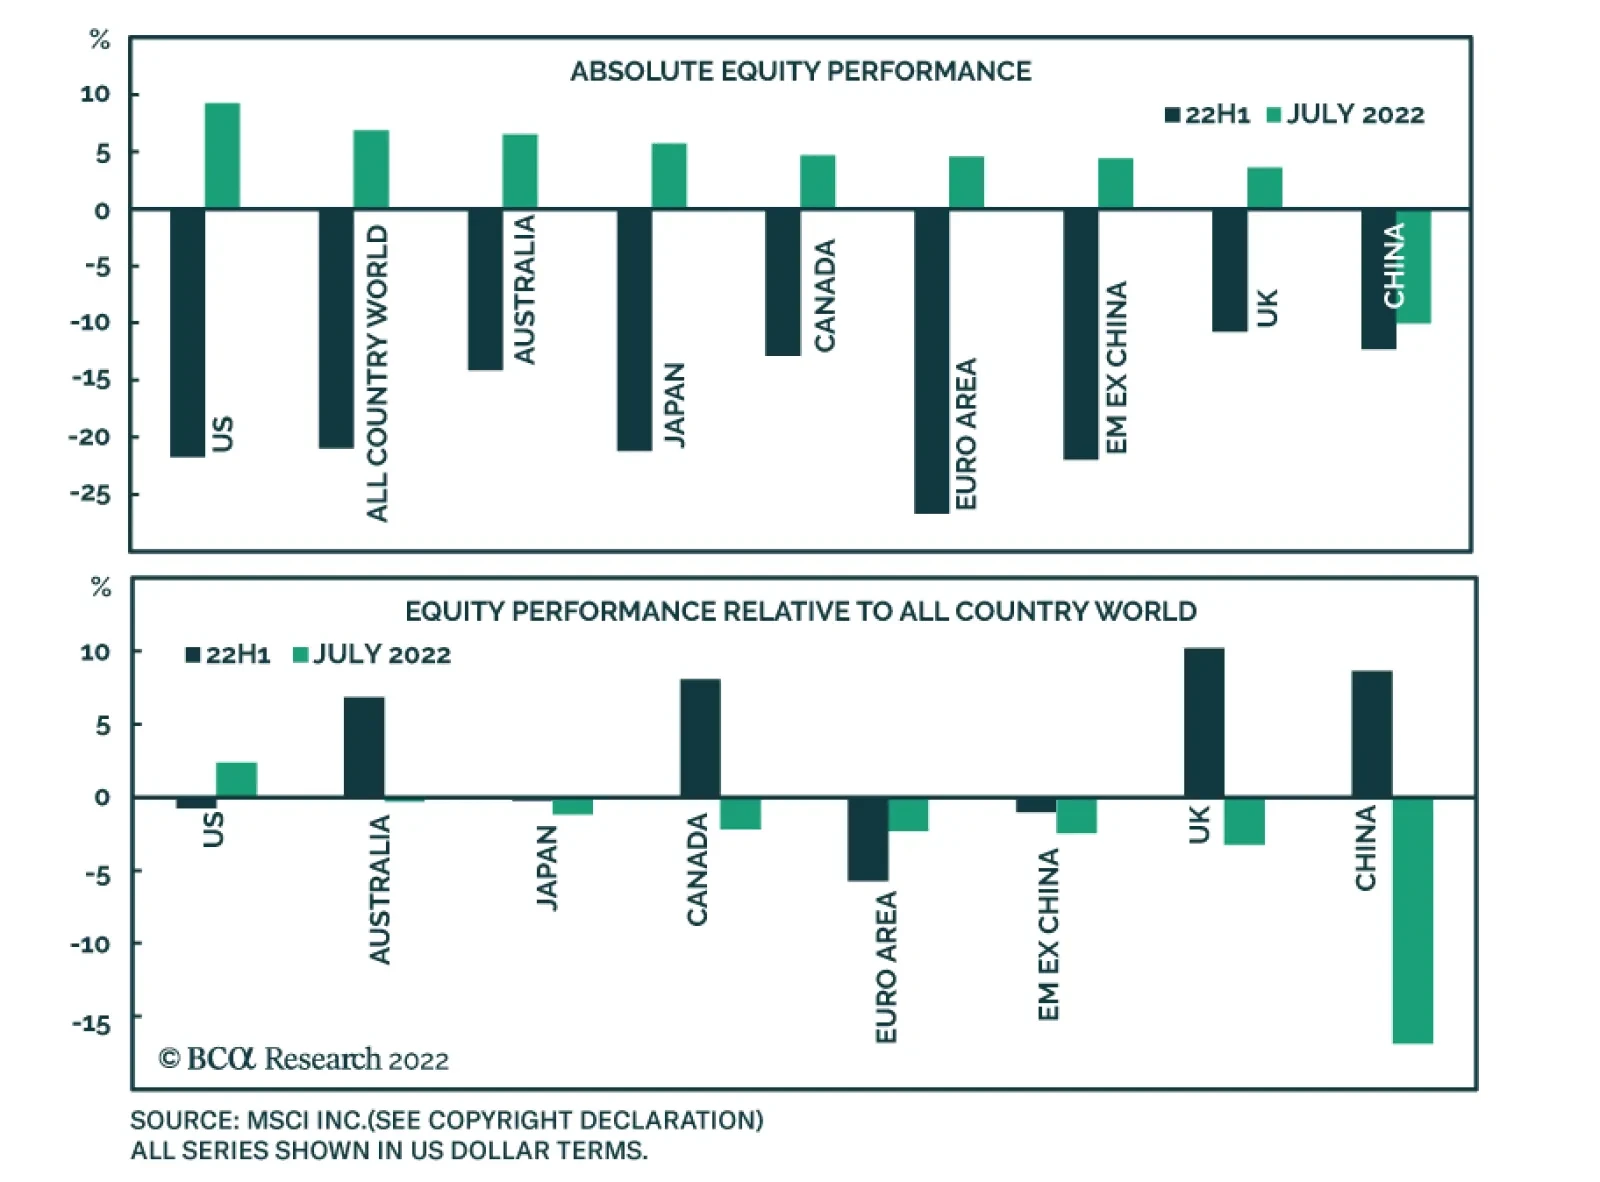
Earlier this week, we highlighted that with the exception of Chinese stocks, all major global equity indices advanced in July. Falling bond yields created a tailwind for global stocks. Bond market dynamics partially explain relative equity performance…
Listen to a short summary of this report. Executive Summary Investors Are Pricing In A Much More Aggressive Tightening Cycle Than At The Start Of The Year
Investors Are Pricing In A Much More Aggressive Tightening Cycle Than At The Start Of The Year
Investors Are Pricing In A Much More Aggressive Tightening Cycle Than At The Start Of The Year
Following last week’s sharp post-FOMC rally, we shifted our 12-month equity recommendation from overweight to neutral. We expect stock prices to rise further during the remainder of the year as US recession risks abate, but then to give up most of their gains early next year as it becomes clear that the Fed has no intention of cutting rates and may even need to raise rates. We have more conviction that US growth will hold up over the next 12 months than we do that inflation will fall as fast as the Fed expects or the breakevens imply. These varying degrees of conviction stem from the same reason: The neutral rate of interest in the US is higher than widely believed. A high neutral rate implies that it may take significant monetary tightening to slow the economy. That reduces the risk of a recession in the near term, but it raises the risk that inflation will remain elevated. A recession is now our base case for the euro area. However, we expect the European economy to bounce back early next year, as gas supplies increase and fiscal policy turns more stimulative. The euro has significant upside over the long haul. Bottom Line: Stocks will continue to recover over the coming months before facing renewed pressure early next year. We are retaining our tactical (3-month) overweight on global equities but are shifting our 12-month recommendation to neutral. Taking Some Chips Off the Table Following last week’s sharp post-FOMC rally, we shifted our cyclical 12-month equity recommendation from overweight to neutral. This note lays out the key considerations in a Q&A format. Q: Have any of your underlying views about the economy changed recently or has the market simply moved towards pricing in your benign outlook? A: Mainly the latter. While we continue to see a higher-than-normal risk of a US recession over the next 12 months, our baseline (60% odds) remains no recession. Q: Many would say that we are in a recession already. A: While two consecutive quarters of negative growth does not officially constitute a recession, it is correct to say that every time real GDP has contracted for two quarters in a row, the NBER has ultimately deemed that episode a recession (Chart 1). Chart 1In The Past, Two Consecutive Quarters Of Negative Growth Have Always Coincided With A Recession
In The Past, Two Consecutive Quarters Of Negative Growth Have Always Coincided With A Recession
In The Past, Two Consecutive Quarters Of Negative Growth Have Always Coincided With A Recession
That said, one should keep two things in mind. First, preliminary GDP estimates are subject to significant revisions. According to our calculations, there is a 35% chance that real GDP growth in Q2 will ultimately be revised into positive territory (Chart 2). Even Q1 may eventually show positive growth. Real Gross Domestic Income (GDI), which conceptually should equal GDP, rose by 1.8% in Q1. Chart 2After Further Revisions, It Is Possible That GDP Growth Ends Up Being Positive In Q2 2022
Shifting Into Neutral: A Q&A
Shifting Into Neutral: A Q&A
Second, every single US recession has seen an increase in the unemployment rate (Chart 3). So far, that has not happened, and there is good reason to think it will not happen for some time: There are 1.8 job openings per unemployed worker (Chart 4). For the foreseeable future, most people who lose their jobs will be able to walk across the street to find a new one. Chart 3Recessions And Spikes In The Unemployment Rate Go Hand-In-Hand
Recessions And Spikes In The Unemployment Rate Go Hand-In-Hand
Recessions And Spikes In The Unemployment Rate Go Hand-In-Hand
Chart 4A High Level Of Job Openings Creates A Moat Around The Labor Market
A High Level Of Job Openings Creates A Moat Around The Labor Market
A High Level Of Job Openings Creates A Moat Around The Labor Market
Chart 5Spending On Durable Goods Has Been Normalizing Without Derailing The Economy
Spending On Durable Goods Has Been Normalizing Without Derailing The Economy
Spending On Durable Goods Has Been Normalizing Without Derailing The Economy
Q: Aren’t other measures of economic activity such as the ISM, consumer confidence, and homebuilder sentiment all signaling that a major slowdown is in progress? A: They are but we should take them with a grain of salt. The composition of consumer spending is shifting from goods to services. This is weighing on manufacturing output. As Chart 5 shows, goods spending has already retraced two-thirds of its pandemic surge, with no ill effects on the labor market. Consumer confidence tends to closely track real wages (Chart 6). Despite an extraordinarily tight labor market, real wages have been shrinking all year. As supply-chain bottlenecks abate, inflation will fall, allowing real wages to rise. This will bolster consumer confidence and spending. Falling gasoline prices will also boost disposable incomes. Prices at the pump have fallen for seven straight weeks and the futures market is pointing to further declines in the months ahead (Chart 7). Chart 6Falling Inflation Will Boost Real Wages And Consumer Confidence
Falling Inflation Will Boost Real Wages And Consumer Confidence
Falling Inflation Will Boost Real Wages And Consumer Confidence
Chart 7The Futures Market Points To Further Declines In Gasoline Prices
The Futures Market Points To Further Declines In Gasoline Prices
The Futures Market Points To Further Declines In Gasoline Prices
It is also critical to remember that the Fed is trying to slow the economy by tightening monetary policy. At the start of the year, investors expected the Fed funds rate to be 0.9% in early 2023. Today, they expect it to be 3.4% (Chart 8). Chart 8Investors Are Pricing In A Much More Aggressive Tightening Cycle Than At The Start Of The Year
Investors Are Pricing In A Much More Aggressive Tightening Cycle Than At The Start Of The Year
Investors Are Pricing In A Much More Aggressive Tightening Cycle Than At The Start Of The Year
Chart 9Housing Activity Should Recover Now That Mortgage Rates Have Stabilized
Housing Activity Should Recover Now That Mortgage Rates Have Stabilized
Housing Activity Should Recover Now That Mortgage Rates Have Stabilized
Rising rate expectations curb aggregate demand. This temporarily leads to lower growth. However, once rate expectations stabilize – and demand resets to a lower level – growth will tend to return to trend. The 6-month mortgage yield impulse has already turned up. This suggests that housing and other interest-rate sensitive parts of the economy will begin to recover by the end of the year (Chart 9). Admittedly, if the unemployment rate rises in response to lower aggregate demand, this could set off a vicious circle where higher unemployment leads to less spending, leading to even higher unemployment. However, as noted above, given that the current starting point is one where labor demand already exceeds labor supply by a wide margin, the odds of a such a labor market doom loop are much lower than during past downturns. Q: Does the question of whether we officially enter a recession or not really matter that much? A: It is a matter of degree. As Chart 10 shows, macroeconomic factors are by far the most important determinant of equity returns over medium-term horizons of about 12 months. As a rule of thumb, bear markets almost always coincide with recessions (Chart 11). Chart 10Macro Forces Are An Important Driver Of Equity Returns On Cyclical Horizons
Macro Forces Are An Important Driver Of Equity Returns On Cyclical Horizons (I)
Macro Forces Are An Important Driver Of Equity Returns On Cyclical Horizons (I)
Chart 11Equity Bear Markets And Recessions Go Hand-In-Hand
Equity Bear Markets And Recessions Go Hand-In-Hand
Equity Bear Markets And Recessions Go Hand-In-Hand
Chart 12Soaring Energy Prices Have Boosted Earnings Estimates This Year
Soaring Energy Prices Have Boosted Earnings Estimates This Year
Soaring Energy Prices Have Boosted Earnings Estimates This Year
Q: Are you surprised that earnings estimates have not come down faster this year as economic risks have intensified? A: Most analysts have not baked in a recession in their forecasts, so from that perspective, if our baseline scenario of no recession does not pan out, earnings estimates will almost certainly come down (Chart 12). That said, the bar for major downward earnings revisions is quite high. This is partly because we think that if a recession does occur, it is likely to be a mild one. It is also because earnings are reported in nominal terms. In contrast to real GDP, nominal GDP grew by 6.6% in Q1 and 7.8% in Q2. Q: Let’s turn to interest rates. Why do you think the Fed will not cut rates next year as markets are discounting? A: It all boils down to the neutral rate of interest. In past reports, we made the case that the neutral rate in the US is higher than widely believed. The fact that job vacancies are so plentiful provides strong evidence in favor of our thesis. If the neutral rate were low, the labor market would not have overheated. But it did, implying that monetary policy must have been exceptionally accommodative. The good news for investors is that a high neutral rate implies that the Fed is unlikely to induce a recession by raising rates in accordance with its dot plot. That reduces the risk of a recession in the near term. The bad news is that a high neutral rate will essentially preclude the Fed from cutting rates next year. The economy will simply be too strong for that. Worse still, if the Fed is too slow in bringing rates to neutral, inflation – which is likely to fall over the coming months as supply-chain pressures ease – could reaccelerate at some point next year. That could force the Fed to start hiking rates again. Chart 13Real Yields Have Scope To Rise Further
Real Yields Have Scope To Rise Further
Real Yields Have Scope To Rise Further
Q: What is your estimate for the neutral rate in the US? A: In the past, we have written that the neutral rate in the US is around 3.5%-to-4%. However, I must admit, I’m not a big fan of this formulation. Real rates matter more for economic growth than nominal rates, and long-term rates matter more than short-term rates. Thus, a better question is what level of real long-term bond yields is consistent with stable inflation and full employment. Based on research we have published in the past, my best bet is that the neutral long-term real bond yield is between 1.5%-and-2%. That is substantially above the 10-year TIPS yield (0.27%) and the 30-year TIPS yield (0.79%) (Chart 13). Given that the yield curve is inverted, the Fed may have to raise policy rates well above 4% in order to drag up the long end of the curve. It is a bit like how oil traders say you need to lift spot crude prices in order to push up long-term futures prices when the oil curve is backwardated. Chart 14Investors Expect Inflation To Fall Rapidly Over The Next Few Years
Shifting Into Neutral: A Q&A
Shifting Into Neutral: A Q&A
Q: So presumably then, you would favor a short duration position in fixed-income portfolios? A: Yes, if the whole yield curve shifts higher, you will lose a lot less money in short-term bonds than in long-term bonds. Relatedly, we would overweight TIPS versus nominal bonds. The TIPS market is pricing in a very rapid decline in inflation over the next few years (Chart 14). The widely followed 5-year, 5-year forward TIPS inflation breakeven rate is trading at 2.28%, toward the bottom end of the Fed’s comfort zone of 2.3%-to-2.5%.1 Q: What about credit? A: US high-yield bonds are pricing in a default rate of 6.1% over the next 12 months. This is up from an expected default rate of 3.8% at the start of the year and is significantly higher than the trailing 12-month default rate of 1.4%. In a typical recession, high-yield default rates rise above 8% (Chart 15). Thus, spreads would probably increase if the US entered a recession. That said, it is important to keep in mind that many corporate borrowers took advantage of very low long-term yields over the past few years to extend the maturity of their debt. Only 7% of US high-yield debt, and less than 1% of investment-grade debt, held in corporate credit ETFs matures in less than two years. This suggests that the default cycle, if it were to occur, would be less intense and more elongated than previous ones. Chart 15High-Yield Bonds Are Pricing In Higher Default Rates
High-Yield Bonds Are Pricing In Higher Default Rates
High-Yield Bonds Are Pricing In Higher Default Rates
On balance, we recommend a modest overweight to high-yield bonds within fixed-income portfolios. Chart 16High Energy Prices Are Weighing On The European Economy
High Energy Prices Are Weighing On The European Economy
High Energy Prices Are Weighing On The European Economy
Q: Let’s turn to non-US markets. The dollar has strengthened a lot against the euro this year as the economic climate in Europe has soured. Can Europe avoid a recession? A: Probably not. European natural gas prices are back near record highs and business surveys increasingly point to recession (Chart 16). That said, the nature of Europe’s recession could turn out to be quite different from what many expect. There are a few useful parallels between the predicament Europe finds itself in now and what the global economy experienced early on during the pandemic. Just like the Novel coronavirus, as it was called back then, represented an external shock to the global economy, the partial cut-off in Russian energy flows represents an external shock to the European economy. Policymakers in advanced economies responded to the pandemic by showering their economies with various income-support measures. European governments will react similarly to the energy crunch. In fact, the political incentive to respond generously is even greater this time around because the last thing European leaders want is for Putin to succeed in his efforts to destabilize the region. For its part, the ECB will set an extremely low bar for buying Italian bonds and the debt of other vulnerable economies. Just like the world eventually deployed vaccines, Europe is taking steps to inoculate itself from its dangerous addiction to Russian energy. The official REPowerEU plan seeks to displace two-thirds of Russian natural gas imports by the end of the year. While some aspects of the plan are probably too optimistic, others may not be optimistic enough. For example, the plan does not envision increased energy production from coal-fired plants, which is something that even the German Green Party has now signed on to. The euro is trading near parity to the dollar because investors expect growth in the common-currency bloc to remain depressed for an extended period of time. If investors start to price in a more forceful recovery, the euro will rally. Q: China’s economy remains in the doldrums. Could that undermine your sanguine view on the global economy? A: China’s PMI data disappointed in July, as anxiety over the zero-Covid policy and a sagging property market continued to weigh on activity (Chart 17). We do not expect any change to the zero-Covid policy until the conclusion of the Twentieth Party Congress later this year. After that, the government is likely to ease restrictions, which will help to reignite growth. Chart 17The Zero-Covid Policy And Slumping Property Market Are Weighing On Chinese Economic Activity
The Zero-Covid Policy And Slumping Property Market Are Weighing On Chinese Economic Activity
The Zero-Covid Policy And Slumping Property Market Are Weighing On Chinese Economic Activity
Chart 18China Faces A Structural Decline In The Demand For Housing
China Faces A Structural Decline In The Demand For Housing
China Faces A Structural Decline In The Demand For Housing
The property market has probably entered a secular downturn (Chart 18). If a weakening property market were to cause a banking crisis, similar to what happened in the US and parts of Europe in 2008, this would destabilize the global economy. However, we doubt that this will happen given the control the government has over the banking system. In contrast, a soft landing for the Chinese real estate market might turn out to be a welcome development for the global economy, as less Chinese property investment would keep a lid on commodity prices, thus helping to ease inflationary pressures. Peter Berezin Chief Global Strategist peterb@bcaresearch.com Follow me on LinkedIn & Twitter Footnotes 1 The Federal Reserve targets an average inflation rate of 2% for the Personal Consumption Expenditures (PCE) index. The TIPS breakeven is based on the CPI index. Due to compositional differences between the two indices, CPI inflation has historically averaged 30-to-50 basis points higher than PCE inflation. This is why the Fed effectively targets a CPI inflation rate of 2.3%-to-2.5%. View Matrix
Image
Special Trade Recommendations Current MacroQuant Model Scores
Shifting Into Neutral: A Q&A
Shifting Into Neutral: A Q&A
Executive Summary Biden Can Take Risks Ahead Of Midterms
The Fourth Taiwan Strait Crisis
The Fourth Taiwan Strait Crisis
News reports suggest House Speaker Nancy Pelosi will travel to Taiwan and meet with Taiwanese President Tsai Ing-wen in the coming days. China has promised military counter-measures if she visits. Structural factors suggest US-China tensions over Taiwan could explode: China’s reversion to autocracy and hawkish foreign policy, Taiwan’s assertion of autonomy, and the US’s political instability and foreign policy reactiveness. Cyclical factors also suggest that tensions could escalate: China’s instability in the wake of Covid-19, the ramifications of Russia’s invasion of Ukraine, the budding Russo-Chinese alliance, the Biden administration’s domestic political vulnerability, and the Xi administration’s domestic political vulnerability. In particular, Xi cannot back down. A diplomatic crisis or military showdown is likely in the short run but not yet a full-scale war. Taiwan is harder to invade than Ukraine, the US is not attempting a radical boost to Taiwan’s military, Taiwan is not moving toward formal independence, and the Chinese economy is not yet collapsing beyond all hope. However, over the long run we fear that a Taiwan war is more likely than not. Tactically investors should prefer government bonds to equities, US equities to global, defensive sectors to cyclicals, and safe havens to risky assets. Investors should short Chinese and Taiwanese currencies and assets. Tactical Recommendation Inception Date Return LONG US SEMICONDUCTOR & SEMI EQUIPMENT / TAIWAN EQUITIES 2022-06-23 14.6% LONG KOREA/ SHORT TAIWAN EQUITIES 2020-03-27 -23.5% Bottom Line: Tactically investors should buy safe-haven assets and await a resolution of the US-China confrontation over Taiwan, which could cause a dramatic escalation in strategic tensions. Feature A fourth Taiwan Strait crisis is likely upon us. Speaker of the US House of Representatives Nancy Pelosi will visit Taiwan during her travel around Asia Pacific this week, according to the Wall Street Journal on August 1. Chinese President Xi Jinping warned US President Joe Biden in a phone conversation on July 28 that “those who play with fire will eventually get burned,” referring specifically to US relations with Taiwan. Chinese foreign ministry officials have threatened “forceful” countermeasures if Pelosi visits the island, explicitly saying that the People’s Liberation Army would respond in some way. There is still some uncertainty over whether Pelosi will go. She delayed the trip in April. Rumors emerged over July that she would resume but President Joe Biden suggested on July 20 that US military officials opposed the trip, believed the timing to be inappropriate. Taiwan was not mentioned in Pelosi’s official itinerary published on July 31, which includes Singapore, Japan, South Korea, and Malaysia. But the Wall Street Journal report has been corroborated by US and Taiwanese officials. Assuming Pelosi goes, China will respond with some military show of force. The US may pretend that one hand (the White House, the Department of Defense) does not know what the other hand is doing (the House of Representatives). But China will not be convinced. There are three major reasons that we have predicted a fourth Taiwan Strait crisis: 1. China’s reversion to autocracy and foreign policy hawkishness: After the Great Recession, China was forced into a painful downshift in potential economic growth, stemming from a contracting labor force, excessive debt, and changes in the international economy (Chart 1). As economic growth has slowed, China has pursued political centralization, economic mercantilism, military modernization, and foreign policy assertiveness, offering nationalism as a distraction from the disappointments of the new middle class. While China may not be ready to launch a full-scale invasion of Taiwan, it is willing to do so if the Communist Party regime’s survival is at stake. Chart 1China's Slowdown Leads To Hawkishness
China's Slowdown Leads To Hawkishness
China's Slowdown Leads To Hawkishness
2. Taiwan’s reassertion of autonomy: Taiwanese people began to sour on mainland China with the Great Recession and increasingly developed an independent identity (Chart 2). China’s growing economic influence, combined with Xi Jinping’s re-centralization of power across Greater China, provoked a backlash in Taiwan beginning in 2013 that culminated in the nominally pro-independence Democratic Progressive Party gaining full control of the island in 2016. The US-China trade war, China’s imposition of control over critical buffer spaces (including the South China Sea and Hong Kong), and US export controls on advanced technologies thrust Taiwan into the middle of a strategic confrontation. While Taiwan is not seeking war or formal political independence, it is seeking closer ties with the US and democratic allies to protect against Beijing’s encroachment. 3. US political instability and foreign policy reaction: The Great Recession brought the US’s latent political instability from a simmer to a boil. The Washington establishment withdrew from the war on terrorism only to face discontent at home and strategic competition from China and Russia. China intensified its acquisition of US technology while North Korea obtained a nuclear arsenal under China’s watch. A surge in populism led the US to initiate a trade war against China and to impose restrictions on critical technologies to slow China’s modernization. While the US political factions bickered over domestic policy, they both tapped into a popular consensus on economic nationalism and hawkishness toward China (Chart 3). While the US is struggling to curb Russia and Iran, its greatest long-term challenge stems from China and it is increasingly focused on containing China’s economy and strategic ambitions. Chart 2Taiwanese Souring On China
The Fourth Taiwan Strait Crisis
The Fourth Taiwan Strait Crisis
Chart 3US Hawkish Consensus On China
The Fourth Taiwan Strait Crisis
The Fourth Taiwan Strait Crisis
In addition, there are important cyclical reasons why investors should take very seriously the risk of a major geopolitical crisis emanating from Taiwan in the short run: The Covid-19 pandemic intensified US (and global) distrust of China and accelerated the divorce of the US and Chinese economies. It also threw the Chinese economy into a downward spin, threatening Xi Jinping’s personal security and the Communist Party’s regime security. Hypo-globalization reduces critical economic constraints on military conflict. The Ukraine war highlighted the willingness of ambitious strongman regimes to go to war to prevent neighboring countries from allying with the United States. Taiwan is critical to Chinese security just as Ukraine is critical to Russian. Taiwan, like Ukraine, lacks a mutual defense treaty with the US and yet is attempting to create a de facto treaty through political, economic, and military cooperation – a scenario that will incentivize Chinese military action if it ever believes the US will take irrevocable steps to increase its commitment to defend Taiwan. At the same time, the US will try to deter China more effectively, since its deterrence failed in the case of Ukraine, which entails upgrading the Taiwanese relationship. Hence China will feel threatened and accuse the US of altering the status quo. Russo-Chinese alliance prevents US-China reengagement. Russia threw itself into China’s arms by cutting off natural gas to Europe. China cannot reject Russia’s overture because it needs Russia’s alliance to break through American strategic containment in the coming years. China needs Russia’s natural resources and its cooperation in gaining economic access to Central Asia and the Middle East. The US cannot pursue strategic détente with China if China is allying with Russia, since a Russo-Chinese alliance poses an unprecedented threat to American global influence and security (Chart 4). The Democratic Party is desperate to mitigate looming election losses. President Biden’s approval rating has fallen to 39%, while headline inflation hits 9% and the economy slips into a technical recession. The Republican Party is lined up for a victory in the midterm elections, yet Democrats view the populist Republicans as an existential threat. Hence Biden and Democratic leaders like Pelosi are willing to take significant risks to salvage the election, including provoking foreign rivals. The administration is contemplating tougher export controls on China’s access to semiconductor manufacturing equipment and Congress is passing bipartisan legislation to make the US more competitive against China. Any major confrontation abroad would generate a patriotic rally among voters, as did the Cuban Missile Crisis in 1962, which saved the Democrats from heavy losses in the midterms that year (Chart 5). China’s domestic politics support a foreign confrontation. As Xi attempts to cement another five-to-ten years in power at the twentieth national party congress this fall, the pandemic restrictions, political repression, property bust, and economic slowdown ensure that he has little good news to celebrate at home. He could benefit from taking an aggressive stance against the imperialist Americans over Taiwan – and he cannot afford to back down or lose face. Ultimately China’s regime legitimacy is at stake in Taiwan so it is willing to take greater risks than the United States. Chart 4US Cannot Engage With Russo-Chinese Behemoth
US Cannot Engage With Russo-Chinese Behemoth
US Cannot Engage With Russo-Chinese Behemoth
Chart 5Biden Can Take Risks Ahead Of Midterms
The Fourth Taiwan Strait Crisis
The Fourth Taiwan Strait Crisis
All of the above demonstrates that investors should not be complacent but should take risk off the table until the Pelosi trip blows over. A major diplomatic or geopolitical crisis will occur if Pelosi indeed visits Taiwan, for China will be required to react to uphold the credibility of its warnings, and Beijing will have a national and political interest in overreacting rather than underreacting. The Americans will then have a national and political interest in preserving their own credibility. This dynamic could lead to a major escalation in strategic tensions. Could a crisis lead to full-scale war? Yes it could but most likely it will not – at least not yet. Here are some important limitations, which investors should monitor closely. If these are reduced or overcome, then a larger conflict becomes more probable: Taiwan is harder to invade than Ukraine. Taiwan is an island and islands that are politically unified can only be subdued with enormous cost of blood and treasure even by the most powerful armies. Taiwan is critical to the global economy, unlike Ukraine. While it lacks defense treaties, it has stronger strategic partnerships than Ukraine did. The Chinese military has not fought an expeditionary war since Vietnam in 1979. The US sent aircraft carriers to the Taiwan Strait in each of the previous three crises since the 1950s, signaling that it is willing to defend Taiwan, and currently has at least two aircraft carriers in Asia Pacific (Map 1). China needs to be prepared for potential American and Japanese intervention if it is to attack Taiwan, which requires an advanced triad of nuclear arms. Map 1US Aircraft Carriers Suggest Taiwan Risk Is Substantial
The Fourth Taiwan Strait Crisis
The Fourth Taiwan Strait Crisis
The US is not sending any game-changing offensive weapon systems. Instead the US is sending a mere politician. China opposes anything resembling state-to-state relations but Taiwan’s defensive capability would not be improved. Hence China would not be forced to take aggressive military action. Instead China is attempting to set a very low bar for intervening in US-Taiwan political relations. Beijing can intervene in a way that enforces the new line but remains beneath the threshold of war. Going forward, US arms sales to Taiwan will be a much riskier affair and the delivery of a weapons system could trigger conflict (Chart 6). Chinese economy is not (yet) beyond help. China still has authoritarian powers to manipulate the domestic economy, suggesting that policy makers will intervene to slow down the property bust and stimulate activity. After Xi Jinping consolidates power, we expect a pro-growth strategy to be unveiled that will lead to a stabilization of growth in 2023. This is necessary for Xi to maintain domestic stability, which is existential to the regime and its long-term security. If stimulus and interventions fail utterly and China collapses into a full-blown financial crisis, then China will lose the ability to improve its security over the long run and the risk of conflict with foreign powers will rise. But as long as China’s economy is not collapsing, China maintains the prospect of building its influence and power over time and conquering Taiwan through absorption rather than extremely risky armed conflict (Chart 7). Chart 6US Arms Sales Could Trigger A Real Conflict
US Arms Sales Could Trigger A Real Conflict
US Arms Sales Could Trigger A Real Conflict
Chart 7More Economic Stimulus Is Coming
More Economic Stimulus Is Coming
More Economic Stimulus Is Coming
Taiwan is not moving toward formal independence. The Tsai Ing-wen administration is nominally in favor of independence but has chosen rhetorical sleight of hand over any formal change to Taiwan’s status. Taiwanese people support the status quo knowing that they will live in a war zone if they declare independence. The long-term problem stems from the fact that a clear majority opposes unification with the mainland (Chart 8). Taiwan and the US face elections in 2022 and 2024. If the Kuomintang stages a comeback in Taiwanese politics, or the Democrats win reelection in 2024, then China still has the ability to pursue its aims through diplomacy. Whereas if the Democratic Progressive Party remains in full control of Taiwan, and the Republicans regain the White House, Beijing may conclude that little can be gained through diplomacy. Especially if these US and Taiwanese parties proceed to press their interests aggressively. Chart 8Taiwanese Not Declaring Independence
The Fourth Taiwan Strait Crisis
The Fourth Taiwan Strait Crisis
Hence the most likely outcome if Pelosi visits Taiwan is a US-China geopolitical crisis of some sort but not a full-scale war. A crisis short of war could establish a new set of red lines over Taiwan that could govern the US-China relationship in the medium term with reduced uncertainty. But it would bring very bad news in the short run and lead to a permanent deterioration in US-China relations and global stability over the long run, which markets must price first. Bottom Line: Tactically investors should prefer government bonds to equities, US equities to global, defensive sectors to cyclicals, and safe havens to risky assets. Stay short Chinese and Taiwanese currencies and assets. While semiconductor stocks stand at risk, investors should favor US semiconductor companies over Chinese and Taiwanese (Chart 9). Chart 9Investors Should Seek Safe Havens
Investors Should Seek Safe Havens
Investors Should Seek Safe Havens
Matt Gertken Chief Geopolitical Strategist mattg@bcaresearch.com Strategic Themes Open Tactical Positions (0-6 Months) Open Cyclical Recommendations (6-18 Months) Regional Geopolitical Risk Matrix
Dear client, There will be no regular bulletin from the European Investment Strategy team next week to allow us to take some time off. We will return to our regular publishing schedule on August 15, 2022. Kind regards, The European Investment Strategy team Executive Summary Global Headwinds For Europe
Global Headwinds For Europe
Global Headwinds For Europe
Ahead of our summer break, we review our EIS main themes for the remainder of the year. We expect European growth to be poor in the latter half of 2022, but a recession toward the new year will be shallow. European inflation is set to crest in the fall. While the ECB will only modestly underwhelm the current €STR curve pricing, the TPI will be activated. European equities have entered a bottoming process, but cyclicals will continue to underperform defensive equities in the short-term. European investment grade credit is more attractive than local equities and US investment grade debt. The euro is also in a bottoming process, but near-term downside risk remains considerable. Bottom Line: European stocks are in the process of forming a bottom; yet, the economic softness will prevent cyclical shares from outperforming their defensive counterparts. Additionally, European IG debt offers more attractive risk-adjusted returns than equities in the near-term. Finally, the euro still faces potent front-loaded headwinds, despite a seductive long-term outlook. The month of August is starting, which often corresponds to a period of lower volumes on the markets, since a large percentage of the financial industry goes on vacation for the summer. This year, those vacations are even more merited than usual, as the first seven months of the year have been particularly tumultuous. Chart 1Deteriorating European Growth
Deteriorating European Growth
Deteriorating European Growth
So far, the European economy has experienced a rare set of consecutive shocks. First, inflation has jumped to its highest level since the euro was introduced 23 years ago. This inflationary shock, however, does not reflect booming demand, as it is accompanied by a sharp economic growth slowdown and thus has a strong connotation of stagflation. PMIs have fallen below the 50 boom/bust line and the growth expectations component of the Ifo survey is now firmly at recessionary levels (Chart 1). Ultimately, what Europe faces is an inward shift in the supply curve caused by a sudden curtailment of energy flows from Russia. Chart 2A Tough First Half of 2022
A Tough First Half of 2022
A Tough First Half of 2022
Second, and largely because of this inflationary shock, the policy backdrop is in upheaval. On July 21, 2022, the ECB increased interest rates for the first time in eleven years and delivered its first 50 bps hike in more than two decades. At last, negative interest rates are not the determinant feature of Eurozone rates. Yet, despite the end of this longstanding policy distortion, the euro cannot catch a break and has tested parity. Meanwhile, German yields hit 1.9% in June, inflicting a YTD loss of 13% on their holders, and Italian spreads have blown up, raising the specter of financial fragmentation in Europe (Chart 2). Third, the environment has also been rough for equity investors. The pan-European Euro STOXX and the Eurozone Euro STOXX 50 have entered into bear markets, falling 23% and 24% respectively from their January 5 peak to their trough on July 5, 2022 (Chart 2, bottom panel). At this juncture, we will review our main themes for the remainder of the year, which also gives us an opportunity to align our recommendations with our core views. Key Views For The Remainder Of The Year We continue to expect European growth in the latter half of the year to be weak, probably around 0%. Too many hurdles are mounting. We continue to witness signs that global growth is deteriorating. The slowdown in manufacturing activity is not a phenomenon unique to Europe. Global inventories are rising in the manufacturing and retail sectors, which is likely to reduce global industrial production in the coming quarters. As a result, global trade and European exports are set to weaken further (Chart 3). Moreover, the global credit impulse is contracting rapidly in response to tightening monetary conditions. This, too, will weigh on global trade, and thus, on export-oriented nations like Europe. Chart 3Global Headwinds For Europe
Global Headwinds For Europe
Global Headwinds For Europe
Chart 4Households Aren't Alright
Households Aren't Alright
Households Aren't Alright
Inside Europe, the household sector’s malaise is deepening further, as highlighted by crashing consumer confidence (Chart 4). This degeneration reflects the hit to real income caused by elevated inflation, but it has been compounded by rising borrowing costs and falling financial asset prices. Chart 5Running Out Of Gas
Running Out Of Gas
Running Out Of Gas
Meanwhile, the risks from the energy market remain most salient and could even force a contraction in output somewhere between Q4 2022 and Q1 2023. Russian natural gas flows are minimal and are unlikely to rebound enough to allow for the hoped-for build-up in natural gas inventories by the winter (Chart 5). As a result, to keep the lights on, European countries will have to rely on a combination of coal power and energy cuts. Nonetheless, BCA’s commodity and energy strategists estimate that the 14GW of coal-fired generation capacity announced so far and the 15% cut in demand pushed by the European Commission will allow Europe to limp along this winter and avoid the nightmare scenarios delineated by the Bundesbank four months ago. Ultimately, we expect European economic activity to rebound rapidly in the second quarter of 2023. European governments will not sit idly by when their economies are suffering from a major drag caused by a conflict. Households and the sectors that will be most affected by energy rationing (industrials, such as chemicals and cement) will receive help. Thus, fiscal policy will remain accommodative. Moreover, any production curtailed during the winter will be postponed, which means that activity will likely rebound sharply once the weather warms up. On the inflation front, we continue to see a peak in inflation in the coming months. Commodity inflation is peaking and supply-side constraints are ebbing, which will lessen overall inflation (Chart 6). Additionally, the current weakening demand in Europe, tighter financial conditions, and slowing money supply growth are all consistent with a slowdown in inflation (Chart 7). Chart 6Weaker Commodity Inflation
Weaker Commodity Inflation
Weaker Commodity Inflation
Chart 7Domestic Conditions Becoming Disinflationary
Domestic Conditions Becoming Disinflationary
Domestic Conditions Becoming Disinflationary
Regarding monetary policy, the ECB wants to hike — and hike it will. Our base case scenario calls for a 50bps hike in September, but risks are skewed to the downside because of the weakening economic activity. We also expect two 25bps interest rate increases in October and December, which is somewhat under the €STR curve pricing, but only marginally so (Chart 8). However, we do expect the Transmission Protection Instrument (TPI) to be activated in the fall to facilitate higher policy rates because of the vast difference in r-star between Germany and the periphery. Chart 8A Tad To High
A Tad To High
A Tad To High
For government bonds, since we foresee a small dovish surprise by the ECB as well as lower inflation, we anticipate slightly more downside for German Bund yields for the rest of the year. Italian government bonds remain risky in the near-term as market participants test the ECB’s resolve regarding the TPI and Italian politics remain in a state of flux. However, the eventual ECB purchases render them an attractive bet in medium- to long-term portfolios. Despite the slowdown in activity, European equities have already entered a bottoming process. They are cheap and their multiples are already consistent with deep stagflation fears (Chart 9, top panel). Moreover, earnings revisions are already contracting (Chart 9, bottom panel). The collapse in the euro, however, is providing a potent counterweight to economic weaknesses and is allowing European firms to beat analyst expectations. This positive view on the aggregate stock level does not translate yet into an overweight stance on cyclical equities versus defensive ones. Lower inflation and potentially lower global yields help defensive stocks, not cyclical ones. Meanwhile, the Chinese economy continues to struggle with the impact of Beijing’s zero-COVID policy and the disarray in the housing market. These forces suggest that European cyclicals could suffer further underperformance in the coming months (Chart 10), especially if European activity and global trade remain under stress. Additionally, the risks caused by the energy market will continue to warrant a discount in European cyclical equities. Chart 9The Bottoming Process For Stock Has Begun
The Bottoming Process For Stock Has Begun
The Bottoming Process For Stock Has Begun
Chart 10Cyclicals Are Still Handicapped
Cyclicals Are Still Handicapped
Cyclicals Are Still Handicapped
Chart 11IG Prices In A Recession Already
IG Prices In A Recession Already
IG Prices In A Recession Already
European credit, especially investment-grade corporate, offers more appealing risk-adjusted returns than equities. Valuations in the IG space are clearly discounting a severe recession, with the 12-month breakeven spreads in their 80th historical percentile (Chart 11). Meanwhile, the combination of shallower than-once-feared recession with continued fiscal support and further ECB buying will help spreads narrow. As a result, we continue to favor IG to increase risk exposure in Europe. We also favor European IG debt over their US counterparts, especially on a USD hedge basis. The euro remains at a complex juncture. As we wrote three weeks ago, EUR/USD is increasingly attractive for long-term holders. It is cheap and a turnaround in growth next year will help this pro-cyclical currency. However, in the near-term, the euro must cope with the negative impact of China’s growth weakness, Europe’s more pronounced recession risk relative to the US, and the evolving threat of a severe energy crunch. As a result, we continue to see a very fat left tail in EUR/USD in the near-term and prefer the CHF to other European currencies as a vehicle to garner exposure to Europe. Bottom Line: European growth will remain challenged in the near-term, but a severe recession will be avoided. With inflation also peaking this fall, European stocks are in the process of forming a bottom; yet, economic softness will prevent cyclical shares from outperforming their defensive counterparts. Additionally, European IG debt offers more attractive risk-adjusted returns than equities in the near-term. Finally, the euro still faces potent front-loaded headwinds, despite a seductive long-term outlook. Consequently, investors should favor the CHF to gain exposure to European currencies. House Cleaning We take this opportunity to restate our view for the remainder of the year, and to clean up our recommendation and focus on those most aligned with the aforementioned views. The trades from our rotation framework are not impacted, as they are not linked to our key views. Tactical Trades We keep the following tactical trades on the books: Neutral stance on cyclicals relative to defensives: This trade is aligned with our worries that weak global growth will continue to hurt the performance of cyclical equities. Long German / short Italian industrials: This is an uncorrelated trade that benefits from the extreme valuation discount of German industrials relative to their southern counterparts. Moreover, the German economy is faring better than that of Italy, while German financial and monetary conditions are looser than those in Italy. Long Swiss equities / short Eurozone defensives: This is another uncorrelated trade. Swiss stocks are pricey and defensive. However, they are less exposed to the energy rationing this winter than their Eurozone counterparts. Moreover, this position is an implicit bet on a weaker EUR/CHF. Long / short basket based on Combined Mechanical Valuation Indicator: This is another uncorrelated trade, based strictly on the most extreme signals from our CMVI methodology. It is a risk averse approach that focuses on buying assets discounting the worst outcome and buying those pricing in some excessively optimistic scenarios. Short European tech firms / long European healthcare shares: This is a defensive trade that seeks to avoid taking a directional bet on the performance of high duration stocks relative to the market. It corresponds to our worry about cyclicals relative to defensives Combined Mechanical Valuation Indicator Top 20: This position is similar to our country-selected CMVI trade, but here, it picks the most extreme signals in terms of valuation among 2,000+ sectoral trades across nine European countries. Short European consumer discretionary / long telecom services: This is another defensive trade that is supported by valuations and that benefits from the negative impact on real household income of inflation. It will also gain if energy prices additionally increase and further hurt discretionary spending. Overweight Spanish and Italian bonds: This position has now become a cyclical bet. Italian and Spanish bonds could suffer some additional near-term volatility; however, the upcoming activation of the ECB’s TPI will cause these spreads to widen, offering investors the opportunity to enjoy a much higher yield than Bunds and capital gains as well. Long Eurozone Investment Grade corporate: We are moving this position to become a cyclical trade. It is a direct bet on our positive stance on European IG corporates. Sell EUR/JPY: This trade is a play on the near-term downside risk to the euro. Cyclical Trades: We keep the following cyclical trades on the books: Underweight French consumer discretionary stocks relative to the French equity benchmark: The overbought and expensive status of the entire French stock benchmark comes from the consumer discretionary sector. These stocks are treated as growth stocks; however, the decline in global consumer confidence is historically associated with a vanishing premium for this sector. Long Swedish Industrials / short Eurozone and US industrials: This is a sector neutral trade that avoids overexposure to cyclicals. Instead, it takes advantage of the fact that Swedish industrials have a higher return on assets and profit margins than that of their competitors in the Eurozone and the US. Moreover, the SEK is particularly cheap, which boosts the competitiveness of Swedish industrial equities. Favor Eurozone aerospace & defense stocks relative to the benchmark: Defense stocks are our favorite sector at the moment. They benefit from both European re-armament and from the need for power projection in a multipolar world. Favor Eurozone aerospace & defense stocks relative to industrials: Industrials are likely to see their valuation premium diminish once inflation recedes. They currently trade as an inflation hedge because of their comparatively robust pricing power. Meanwhile, defense equities benefit from the structural tailwind described above. Favor Spanish over Italian equities: Spain’s competitiveness has improved considerably relative to the rest of the Eurozone, notably relative to Italy. Importantly, Spain’s political risk is currently lower than that of Italy. Underweight German Bunds within European fixed-income portfolios: This trade is similar to our overweight stance on Italian and Spanish bonds. Overweight Gilts within European fixed-income portfolios: The British economy is weak, which constraints the ability of the BoE to push up rates as much as what is priced into the SONIA curve. Short EUR/SEK: This trade is being move to a structural position. The Swedish economy is more cyclical than that of Europe, but Sweden is less at risk than the Eurozone from Russia’s energy curtailments. Moreover, Swedish returns on assets are superior to those of the Euro Area, which is positive for the currency on a long-term basis. Mathieu Savary, Chief European Strategist Mathieu@bcaresearch.com Tactical Recommendations Cyclical Recommendations Structural Recommendations