Elections

Highlights So What? Our best and worst calls of 2018 cast light on our methodology and 2019 forecasts. Why? Our clients took us to task for violating our own methodology on the Iranian oil sanctions. Sticking to our guns would have paid off with long Russian equities versus EM. We correctly called China’s domestic policy, the U.S.-China trade war, Europe, the U.S. midterms, and relative winners in emerging markets. Feature It has been a tradition for BCA’s Geopolitical Strategy, since our launch in 2012, to highlight our best and worst forecasts of the year.1 This will also be the final publication of the year, provided that there is no global conflagration worthy of a missive between now and January 9, when we return to our regular publication schedule. We wish all of our clients a great Holiday Season. And especially all the very best in 2019: lots of happiness, health, and hefty returns. Good luck and good hunting. The Worst Calls Of 2018 A forecasting mistake is wasted if one learns nothing from the error. This is why we take our mistakes seriously and why we always begin the report card with our zingers. Our overall performance in 2018 was … one of our best. The successes below will testify to this. However, we made three notable errors. A Schizophrenic Russia View Our worst call of the year was to panic and close our long Russian equities relative to emerging markets trade in the face of headline geopolitical risks. In early March, we posited that Russia was a “buy” relative to the broad EM equity index due to a combination of cheap valuations, strong macro fundamentals, orthodox policy, and an end to large-scale geopolitical adventurism. This call ultimately proved to be correct (Chart 1). Chart 1Russian Stocks Outperformed In The End
Russian Stocks Outperformed In The End
Russian Stocks Outperformed In The End
What went wrong? The main risk to our view, that the U.S. Congress would pursue an anti-Russia agenda regardless of any Russian sympathies in the Trump White House, materialized in the wake of the poisoning of former Russian military intelligence officer Sergei Skripal with a Novichok nerve agent in the United Kingdom. As fate would have it, the incident occurred just before our bullish report went to clients! The ensuing international uproar and sanctions caused a selloff. Our bullish thesis did not rest exclusively on geopolitics, but a thaw in West-Russia relations did form the main pillar of the view. Our Russia Geopolitical Risk Index, which had served us well in the past, was pricing as low of a level of geopolitical risk as one could hope for in the post-Crimea environment (Chart 2). Naturally the measure jumped into action following the Skripal incident. Chart 2Geopolitical Risk Was Low Prior To Skripal
Geopolitical Risk Was Low Prior To Skripal
Geopolitical Risk Was Low Prior To Skripal
The timing of our call was therefore off, but we should have stuck with the overall view. The U.S. imposed preliminary sanctions that lacked teeth. While Washington accepted the U.K.’s assessment that Moscow was behind the poisoning, the weakness of the sanctions also signaled that the U.S. did not consider the incident worthy of a tougher position. There are now two parallel sanction processes under way. The first round of sanctions announced in August gave Russia 90 days to comply and adopt “remedial measures” regarding the use of chemical and biological weapons. On November 9, the U.S. State Department noted that Russia had not complied with the deadline. The U.S. is now expected to impose a second round of sanctions that will include at least three of six punitive actions: Opposition to development aid and assistance by international financial institutions (think the IMF and the World Bank); Downgrading diplomatic relations; Additional restrictions on exports to Russia (high-tech exports have already been barred by the first round of sanctions); Restrictions on imports from Russia; A ban on landing rights in the U.S. for Russian state-owned airlines; Prohibiting U.S. banks from purchasing Russian government debt. While the White House was expected to have such sanctions ready to go on the November 9 deadline, it has dragged its feet for almost two months now. This suggests that President Trump continues to hold out for improved relations with President Putin. A visit by President Putin to Washington remains possible in Q1 2019. As such, we would expect the White House to adopt some mix of the first five items on the above list, hardly a crushing response from Moscow’s perspective. The U.S. Congress, however, has a parallel process in the form of the Defending American Security from Kremlin Aggression Act of 2018 (DASKAA). Introduced in August by Senator Lindsey Graham, a Russia hawk, the legislation would put restrictions on Americans buying Russian sovereign debt and curb investments in Russian energy projects. The bill also includes secondary sanctions on investing in the Russian oil sector, which would potentially ensnare European energy companies collaborating with Russia in the energy sector. There was some expectation that Congress would take up the bill ahead of the midterm election, but nothing came of it. Even with the latest incident – the seizing of two Ukrainian naval vessels in the Kerch Strait – we have yet to see action. While we expect the U.S. to do something eventually, the White House approach is likely to be tepid while the congressional approach may be too draconian to pass into law. And with Democrats about to take over the House, and likely demand even tougher sanctions against Russia, the ultimate legislation may be too bold for President Trump to sign into legislation. The point is that Russia has acted antagonistically towards the West in 2018, but in small enough increments that the response has been tepid. Given the paucity of Russian financial and trade links with the U.S., Washington’s sanctions would only bite if they included the dreaded “secondary sanction” implications for third party sovereigns and firms – particularly European, which do have a lot of business in Russia. This is highly unlikely without major Russian aggression. We cannot completely ignore the potential for such aggression in 2019, especially with President Putin’s popularity in the doldrums (Chart 3) and a contentious Ukrainian election due for March 31. However, we outlined the constraints against Russia in 2014, amidst the Ukrainian crisis, and we do not think that these constraints have been reduced (they may have only grown since then). Chart 3Non-Negligible Risk Of Russian Aggression
Non-Negligible Risk Of Russian Aggression
Non-Negligible Risk Of Russian Aggression
Regardless of the big picture for 2019, we could have faded the risks in 2018 and stuck to the fundamentals. Russia is up 17.2% against EM year-to-date. The lesson here, therefore, is to find re-entry points into a well-founded view despite market volatility. Chart 1 shows that Russian equities climbed the proverbial “wall of worry” relative to EM in 2018. Doubting Jair Bolsonaro Our list of mistakes keeps us in the EM universe where we underestimated Jair Bolsonaro’s chances of winning the presidency in Brazil. The answer to the question we posed in the title of our September report – “Brazil: Can The Election Change Anything?” – was a definitive “yes.” Since the publication of that report, BRL/USD is up 2.9% and Brazilian equities are up 18.5% relative to EM (Chart 4). Chart 4Bolsonaro Rally Losing Its Luster Already
Bolsonaro Rally Losing Its Luster Already
Bolsonaro Rally Losing Its Luster Already
To our credit, the question of Bolsonaro’s electoral chances elicited passionate and pointed internal debate. But our clients did not see the internal struggle, just the incorrect external output! A bad call is a bad call, no matter how it is assembled on the intellectual assembly line. That said, we still think that our report is valuable. It sets out the constraints facing Bolsonaro in 2019. He has to convince the left-leaning median voter that meaningful pension reform is needed; bully a fractured Congress into painful structural reforms; and overcome an unforgiving macro context of tepid Chinese stimulus and a strong USD. If the Bolsonaro administration wastes the good will of the investment community over the next six months, we expect the market’s punishment to be swift and painful. In fact, Chart 4 notes that the initial Bolsonaro rally has already lost most of its shine. Brazilian assets are still up since the election, but the gentle slope could become a steep fall if Bolsonaro stumbles. The market is priced for political perfection. To be clear, we are not bearish on Bolsonaro. We believe that, relative to EM, he will be a positive for Brazil. However, the market is currently betting that he will win by two touchdowns, whereas we think he will squeak by with a last-second field goal. The difference between the two forecasts is compelling and we have expressed it by being long MXN/BRL.2 Not Sticking To Our Method In The Case Of Iran Throughout late-2017 and 2018 we pointed out that President Trump’s successful application of “maximum pressure” against North Korea could become a market-relevant risk if he were emboldened to try the same strategy against Iran. For much of the year, this view was prescient. As investors realized the seriousness of President Trump’s strategy, a geopolitical risk premium began to seep into oil prices, as illustrated in Chart 5 by the red bar.
Chart 5
Every time we spoke to clients or published reports on this topic, we highlighted just how dangerous a “maximum pressure” strategy would be in the case of Iran. We stressed that Iran could wreak havoc across Iraq and other parts of the Middle East and even drive up oil prices to the point of causing a “geopolitical recession in 2019.” In other words, we stressed the extraordinary constraints that President Trump would face. To their credit many of our clients called us out on the inconsistency: our market call was über bullish oil prices, while our methodology emphasized constraints over preferences. We were constantly fielding questions such as: Why would President Trump face down such overwhelming constraints? We did not have a very good answer to this question other than that he was ideologically committed to overturning the Iranian nuclear deal. In essence, we doubted President Trump’s own ideological flexibility and realism. That was a mistake and we tip our hat to the White House for recognizing the complex constraints arrayed against it. President Trump realized by October how dangerous those constraints were and began floating the idea of sanction waivers, causing the geopolitical risk premium to drain from the market (Chart 6). To our credit, we highlighted sanction waivers as a key risk to our view and thus took profit on our bullish energy call early. Chart 6Sanction Waivers Caused A Collapse In Oil Prices
Sanction Waivers Caused A Collapse In Oil Prices
Sanction Waivers Caused A Collapse In Oil Prices
That said, our clients have taken the argument further, pointing out that if we were wrong on Trump’s ideological flexibility with Iran, we may be making the same mistake when it comes to China. However, there is a critical difference. Americans are more concerned about conflict with North Korea than with Iran (Chart 7), while China is the major concern about trade (Chart 8).
Chart 7
Chart 8
Second, railing against the Iran deal did not get President Trump elected, whereas his protectionist rhetoric – specifically regarding China – did (Chart 9). Getting anything less than the mother-of-all-deals with Beijing will draw down Trump’s political capital ahead of 2020 and open him to accusations of being “weak” and “surrendering to China.” These are accusations that the country’s other set of protectionists – the Democrats – will wantonly employ against him in the next general election. Chart 9Protectionism, Not Iran, Helped Trump Get Elected
Protectionism, Not Iran, Helped Trump Get Elected
Protectionism, Not Iran, Helped Trump Get Elected
Ultimately, if we have to be wrong, we are at least satisfied that our method stood firm in the face of our own fallibility. We are doubly glad to see our clients using our own method against our views. This is precisely what we wanted to accomplish when we began BCA’s Geopolitical Strategy in March 2012: to revolutionize finance by raising the sophistication with which it approaches geopolitics. That was a lofty goal, but we do not pretend to hold the monopoly on our constraint-based methodology. In the end, our market calls did not suffer due to our error. We closed our long EM energy-producer equities / EM equities for a gain of 4.67% and our long Brent / short S&P 500 for a gain of 6.01%. However, our latter call, shorting the S&P 500 in September, was based on several reasons, including concerns regarding FAANG stocks, overstretched valuations, and an escalation of the trade war. Had we paired our S&P 500 short with a better long, we would have added far more value to our clients. It is that lost opportunity that has kept us up at night throughout this quarter. We essentially timed the S&P 500 correction, but paired it with a wayward long. The Best Calls Of 2018 BCA’s Geopolitical Strategy had a strong year. We are not going to list all of our calls here, but only those most relevant to our clients. Our best 2018 forecast originally appeared in 2017, when in April of that year we predicted that “Political Risks Are Understated In 2018.” Our reasoning was bang on: U.S. fiscal policy would turn strongly stimulative (the tax cuts would pass and Trump would be a big spender) and thus cause the Fed to turn hawkish and the USD to rally, tightening global monetary policy; Trump’s trade war would re-emerge in 2018; China would reboot its structural reform efforts by focusing on containing leverage, thus tightening global “fiscal” policy. In the same report we also predicted that Italian elections in 2018 would reignite Euro Area breakup risks, but that Italian policymakers would ultimately be found to be bluffing, as has been our long-running assertion. Throughout 2018, our team largely maintained and curated the forecasts expressed in that early 2017 report. We start the list of the best calls with the one call that was by far the most important for global assets in 2018: economic policy in China. The Chinese Would Over-Tighten, Then Under-Stimulate Getting Chinese policy right required us, first, to predict that policy would bring negative economic surprises this year, and second, once policy began to ease, to convince clients and colleagues that “this time would be different” and the stimulus would not be very stimulating. In other words, this time, China would not panic and reach for the credit lever of the post-2008 years (Chart 10), but would maintain its relatively tight economic, financial, environmental, and macro-prudential oversight, while easing only on the margin. Chart 10No Massive Credit Stimulus In 2018
No Massive Credit Stimulus In 2018
No Massive Credit Stimulus In 2018
This is precisely what occurred. BCA Foreign Exchange Strategy’s “China Play Index,” which is designed to capture any reflation out of Beijing, collapsed in 2018 and has hardly ticked up since the policy easing announced in July (Chart 11). Chart 11Weak Reflation Signal From China
Weak Reflation Signal From China
Weak Reflation Signal From China
Our view was based on an understanding of Chinese politics that we can confidently say has been unique: From March 2017, we highlighted the importance of the 2017 October Party Congress, arguing that President Xi Jinping would consolidate his power and redouble his attempts to “reform” the economy by reining in dangerous imbalances. We explicitly characterized the containment of leverage as the most market-relevant reform to focus on. We stringently ignored the ideological debate about the nature of reform in China, focusing instead on the major policy changes afoot. We identified very early on how the rising odds of a U.S.-China conflict would embolden Chinese leadership to double-down on painful structural reforms. Will China maintain this disciplined approach in 2019? That is yet to be seen. But we are arming ourselves and clients with critical ways to identify when and whether Beijing’s policy easing transforms into a full-blown “stimulus overshoot”: First, we need to see a clear upturn in shadow financing to believe that the Xi administration has given up on preventing excess debt. Assuming that such a shift occurs, and that overall credit improves, it will enable us to turn bullish on global growth and global risk assets on a cyclical, i.e., not merely tactical, horizon (Chart 12). Chart 12A Shadow Lending Surge Would Mean A Big Policy Shift
A Shadow Lending Surge Would Mean A Big Policy Shift
A Shadow Lending Surge Would Mean A Big Policy Shift
Second, our qualitative checklist will need to see a lot more “checks” in order to change our mind. Short of an extraordinary surge in bank and shadow bank credit, there needs to be a splurge in central and especially local government spending (Table 1). The mid-year spike in local governments’ new bond issuance in 2018 was fleeting and fell far short of the surge that initiated the large-scale stimulus of 2015. Frontloading these bonds in 2019 will depend on timing and magnitude. Table 1A Credit Splurge, Or Government Spending Splurge, Is Necessary For Stimulus To Overshoot
BCA Geopolitical Strategy 2018 Report Card
BCA Geopolitical Strategy 2018 Report Card
Third, we would need to see President Xi Jinping make a shift in rhetoric away from the “Three Battles” of financial risk, pollution, and poverty. Having identified systemic financial risk as the first of the three ills, Xi needs to make a dramatic reversal of this three-year action plan if he is to clear the way for another credit blowout. Trade War Would Reignite In 2018 It paid off to stick with our trade war alarmism in 2018. We correctly forecast that the U.S. and China would collide over trade and that their initial trade agreement – on May 20 – was insubstantial and would not last. In the event it lasted three days. Our one setback on the trade front was to doubt the two sides would agree to a trade truce at the G20. However, by assigning a subjective 40% probability, we correctly noted the fair odds of a truce. We also insisted that any truce would be temporary, which ended up being the case. We may yet be vindicated if the March 1 deadline produces no sustainable deal, as we forecast in last week’s Strategic Outlook. That said, correct geopolitical calls do not butter our bread at BCA. Rather, we are paid to make market calls. To that end, we would point out that we correctly assessed the market-relevance of the trade conflict, fading S&P 500 risks and focusing on the effect on global risk assets. Will this continue into 2019? We think so. We do not see trade conflict as the originator of ongoing market turbulence (Chart 13) and would expect the U.S. to outperform global equities again over the course of 2019 (Chart 14). This view may appear wrong in Q1, as the market digests the Fed backing off from hawkish rhetoric, the ongoing trade negotiations, and the likely seasonal uptick in Chinese credit data in the beginning of the calendar year. Chart 13Yields, Not Trade War, Drove Stocks
Yields, Not Trade War, Drove Stocks
Yields, Not Trade War, Drove Stocks
Chart 14U.S. Stocks Will Resume Outperformance
U.S. Stocks Will Resume Outperformance
U.S. Stocks Will Resume Outperformance
However, any stabilization in equity markets would likely serve to ease financial conditions in the U.S., where economic and inflation conditions remain firmly in tightening territory (Chart 15). As such, the Fed pause is likely to last no more than a quarter, maybe two at best, leading to renewed carnage in global risk assets if our view on Chinese policy stimulus – tepid – remains valid through the course of 2019. Chart 15If Financial Conditions Ease, Tightening Will Be Back On
If Financial Conditions Ease, Tightening Will Be Back On
If Financial Conditions Ease, Tightening Will Be Back On
Europe (All Of It… Again) In 2017, our forecasting track record for Europe was stellar. This continued in 2018, with no major setbacks: Populism in Italy: Our long-held view has been that Europe’s chief remaining risks lay in Italian populists coming to power. We predicted in 2016 that this would eventually happen and that they would then be proven to be bluffing. This is essentially what happened in 2018. Matteo Salvini’s Lega is surging in the polls because its leader has realized that a combination of hard anti-immigrant policy and the softest-of-soft Euroskepticism is a winning combination. We believe that investors can live with this combination. Our only major fault in forecasting European politics and assets this year was to close our bearish Italy call too early: we booked our long Spanish / short Italian 10-year government bond trade for a small loss in August, before the spread between the two Mediterranean countries blew out to record levels. That missed opportunity could have also made it on our “worst calls” list as well.
Chart 16
Pluralism in Europe: To get the call on Italy right, we had to dabble in some theoretical work. In a somewhat academic report, we showed that political concentration was on the decline in the developed world (Chart 16), but especially in Europe (Chart 17). Put simply, lower political concentration suggests that a duopoly between the traditional center-left and center-right parties is breaking down. Contrary to the conventional wisdom, we argued that Europe’s parliamentary systems would enable centrist parties to adopt elements of the populist agenda, particularly on immigration, without compromising the overall stability of European institutions. As such, political pluralism, or low political concentration, is positive for markets.
Chart 17
Immigration crisis is over: For centrist parties to be able to successfully adopt populist immigration policy, they needed a pause in the immigration crisis. This was empirically verifiable in 2018 (Chart 18). Chart 18European Migration Crisis Is Over
European Migration Crisis Is Over
European Migration Crisis Is Over
Merkel’s time has run out: Since early 2017, we had cautioned clients that Angela Merkel’s demise was afoot, but that it would be an opportunity, rather than a risk, when it came. It finally happened in 2018 and it was not a market moving event. The main question for 2019 is whether German policymakers, and Europe as a whole, will use the infusion of fresh blood in Berlin to reaccelerate crucial reforms ahead of the next global recession. Brexit: Since early 2016, we have been right on Brexit. More specifically, we were corrent in cautioning investors that, were Brexit to occur, “the biggest loser would be the Conservative Party, not the EU.” As with the previous two Conservative Party prime ministers, it appears that the question of the U.K.’s relationship with the EU has completely drained any political capital out of Prime Minister Theresa May’s reign. We suspect that the only factor propping up the Tories in the polls is that Jeremy Corbyn is the leader of Her Majesty’s Most Loyal Opposition. We have also argued that soft Brexit would ultimately prove to be “illogical” and that “Bregret” would begin to seep in, as it now most clearly has. We parlayed these rising geopolitical risks and uncertainties by shorting cable in the first half of the year for a 6.21% gain. Malaysia Over Turkey And India Over Brazil Not all was lost for our EM calls this year. We played Malaysia against Turkey in the currency markets for a 17.44% gain, largely thanks to massively divergent governance and structural reform trajectories after Malaysia’s opposition won power for the first time in the country’s history. Second, we initiated a long Indian / short Brazilian equity view in March that returned 27.54% by August. This was a similar play on divergent structural reforms, but it was also a way to hedge our alarmist view on trade. Given India’s isolation from global trade and insular financial markets, we identified India as one of the EM markets that would remain aloof of protectionist risks. We could have closed the trade earlier for greater gain, but did not time the exit properly. Midterm Election: A Major Democratic Victory Our midterm election forecast was correct: Democrats won a substantial victory. Even our initial call on the Senate, that Democrats had a surprisingly large probability of picking up seats, proved to be correct, with Republicans eking out just two gains in a year when Democrats were defending 10 seats in states that Trump carried in 2016. What about our all-important call that the election would have no impact on the markets? That is more difficult to assess, given that the S&P 500 has in fact collapsed in the lead-up to and aftermath of the election. However, we see little connection between the election outcome and the stock market’s performance. Neither do our colleagues or clients, who have largely stopped asking about the Democrats’ policy designs. In 2019, domestic politics may play a role in the markets. Impeachment risk is low, but, if it rears its head, it could prompt President Trump to seek relevance abroad, as his predecessors have done when they lost control of domestic policy. In addition, the Democratic Party’s sweeping House victory may suggest a political pendulum swing to the left in the 2020 presidential election. We will discuss both risks as part of our annual Five Black Swans report in early 2019. U.S. domestic politics was a collection of Red Herrings during much of President Obama’s presidency, and has produced strong tailwinds under President Trump (tax cuts in particular). This may change in 2019, with considerable risk to investors, and asset prices, ahead. Marko Papic, Senior Vice President Chief Geopolitical Strategist marko@bcaresearch.com Matt Gertken, Vice President Geopolitical Strategy mattg@bcaresearch.com Roukaya Ibrahim, Editor/Strategist roukayai@bcaresearch.com Ekaterina Shtrevensky, Research Analyst ekaterinas@bcaresearch.com Footnotes 1 For our 2019 Outlook, please see BCA Geopolitical Strategy Strategic Outlook, “2019 Key Views: Balanced On A Knife’s Edge,” dated December 14, 2018, available at gps.bcaresearch.com. For our past Strategic Outlooks, please visit gps.bcaresearch.com. 2 In part we like this cross because we also think that Mexico’s newly elected president, Andrés Manuel López Obrador, is priced to lose by two touchdowns, whereas he may merely lose by a last-second field goal.
Highlights The Reserve Bank of Australia (RBA) may consider a rate hike in 2019 if additional tightening of labor markets leads to higher wage inflation, which would help lift core inflation back to the midpoint of the RBA’s 2-3% target band. Reflation in China could also embolden the RBA to tighten monetary policy – though the odds of a more aggressive stimulus package will decline as long as China’s overall economy remains stable and the U.S. maintains its tariff ceasefire. The Labor Party is favored to win the federal election, which is most likely to occur in May. This is a low-conviction view, as polls are tight and economic improvement will help the ruling Liberal-National Coalition. Feature 2018 has been a challenging year for global financial markets, as investors have had to deal with greater economic uncertainty, less dovish central banks and more volatile asset prices. One country that has bucked the trend to some degree is Australia. The nation has famously avoided a recession since 1991 and last saw a tightening of monetary policy in 2010. While the recession streak is unlikely to be broken in 2019, there are growing risks that the era of interest rate tranquility will soon end. In this Special Report, jointly published with our colleagues at BCA Geopolitical Strategy, we update our views on Australia for 2019 – a year when the investment backdrop has the potential to become far more interesting, and volatile, due to election year uncertainty and a potential shift to a more hawkish bias for monetary policy. The Bond Outlook: What To Watch To Turn Bearish BCA Global Fixed Income Strategy has maintained an overweight stance on Australian government bonds since the end of 2017. That high-conviction view stemmed from our expectation that the Reserve Bank of Australia (RBA) would keep policy rates on hold for longer due to sluggish economic growth and underwhelming inflation. This recommendation has performed well, with Australian government bonds returning 2.4% (currency-hedged into U.S. dollars) in 2018 year-to-date, beating the Bloomberg Barclays Global Treasury index by 190bps. The benchmark 10-year Australian government is now yielding 36bps below the equivalent 10-year U.S. Treasury yield, the tightest spread since 1980 (Chart 1). Chart 1Australian Bonds Have Outperformed
Australian Bonds Have Outperformed
Australian Bonds Have Outperformed
Looking ahead, we still have a positive opinion on Australian debt relative to its global peers over the next six months. The RBA is unlikely to make any adjustments to the Cash Rate - which remains at a highly-accommodative level of 1.5% - without seeing some signs of accelerating inflation in both the Q4 2018 and Q1 2019 CPI reports. This is especially true given the political uncertainty with another federal election due by May 18,1 which could change the outlook for fiscal policy (as we discuss later in this report) and impact the RBA’s economic projections. In our view, the RBA will only be able to seriously consider an interest rate hike, warranting a downgrade of our recommended overweight stance, if all three of the following conditions occur: Australia’s underemployment rate falls below 8% China’s economy shows convincing evidence of reacceleration, especially in commodity-intensive industries like construction Core CPI inflation rises back to at least the midpoint of the RBA’s 2-3% target band We will now discuss each of these in turn. Underemployment Australia is a fairly open economy with a large export sector, but consumer spending is still the largest share of GDP (60%) so it matters most for growth. On that front, real consumption has grown in a narrow and uninspiring range between 2-3% over the past five years. Anemic wages and disposable incomes have been the problem, with the growth of both (in nominal terms) struggling to grow faster than low realized inflation, which now sits below the RBA’s inflation target range of 2-3% (Chart 2). Households have been forced to deploy a greater share of that modest income growth just to maintain spending, with the savings rate plunging from 8% at the end of 2014 to 1% this year and consumer debt piling up. Chart 2An Income-Fueled Pickup In Consumer Spending
An Income-Fueled Pickup In Consumer Spending
An Income-Fueled Pickup In Consumer Spending
The dynamics may be changing in a more positive direction, however. Growth rates of nominal wage (+2.3%) and disposable income (+3.1%) have accelerated this year to a pace faster than inflation. With real incomes perking up, the year-over-year growth rate of real consumer spending growth accelerated to 3% in Q3/2018, driving real GDP growth to similar levels. A sustained pickup in wage growth is necessary before the RBA would even contemplate a rate hike. For that to occur, there must be decisive evidence of a tightening Australian labor market and increased resource utilization. While the headline unemployment rate of 5.0% is below the OECD’s estimate of the full employment NAIRU for Australia (5.3%), broader measures of labor market slack are still at elevated levels. Specifically, the “underemployment” rate, which includes workers who are working fewer hours than they would like or at jobs below their skill levels, is still at an elevated 8.3% (Chart 3). That is down from the peak of just below 9% seen in early 2017, but well above the 2012 trough near 7% (when wage growth was close to 4%). Chart 3UNDERemployment Rate Matters More For Australian Wages
UNDERemployment Rate Matters More For Australian Wages
UNDERemployment Rate Matters More For Australian Wages
Australian wage growth tends to correlate more with the underemployment rate than the traditional unemployment rate (middle panel). This suggests that the recent blip higher in wage growth could be the beginning of a new trend, given that it has occurred alongside the recent drop in underemployment. Already, underemployment is back below the levels that prevailed when the RBA did its last interest rate cut back in 2016 (bottom panel). A further dip lower in the underemployment rate to below the 8% threshold would likely confirm that wage growth has more upside. That outcome would give the RBA greater confidence that consumer spending will gain more strength even with a low savings rate, and that CPI inflation will return back into the target range – both outcomes that would justify some removal of the RBA’s highly stimulative monetary accommodation. China Stimulus The main connection from China’s economy to Australia is through Chinese demand for Australian exports. There is also an indirect, but very important, link between Chinese demand boosting industrial commodity prices. The latter boosts Australian growth through positive terms-of-trade effects and increased capital spending in commodity-related sectors like mining. Iron ore is the most important of those commodities, representing 18% of total Australian goods exports, with 85% of those iron ore exports going to China. Australian export growth has decelerated during 2018 from the very robust 15% year-over-year pace to a still solid 10% rate. This has mirrored the trends seen in many other economies, where exports have slowed alongside diminished demand from China. If Chinese authorities change their current policy trajectory, and embrace more aggressive fiscal and credit stimulus, then they will reaccelerate the country’s flagging demand, which should benefit Australian exporters. If the increase in spending occurs in commodity-intensive parts of China’s economy, like construction, then Australia can also benefit from a terms-of-trade impact if commodity prices rise. However, BCA’s Geopolitical Strategy and China Investment Strategy remain skeptical that China will launch a major economic stimulus package along the lines of what occurred in 2015-16. That surge not only boosted Chinese GDP and import demand but also triggered a boost to global industrial commodity prices that benefitted many commodity exporters, including Australia. In recent months, there has been a pickup in overall Chinese import growth, as well as some acceleration of higher frequency growth indicators like the Li Keqiang index (Chart 4). Australian exports to China have not picked up though, and Chinese iron ore imports are contracting. Part of that is due to the elevated levels of Chinese iron ore inventories. More likely, there is little demand for additional iron ore given China’s reform agenda and the struggles of its construction sector (which accounts for roughly 35% of Chinese steel demand). Chart 4China Stimulus Not Helping Australia...Yet?
China Stimulus Not Helping Australia...Yet?
China Stimulus Not Helping Australia...Yet?
Our colleagues at BCA China Investment Strategy2 have noted that both weakening sales and tighter funding sources for real estate developers point to declining growth in property starts and construction. This will be negative for construction-related commodity markets and construction-related machinery. This is coming at a time when the Chinese government is trying specifically to address over-indebted industries like construction. As for the U.S.-China trade truce, a permanent de-escalation of tensions – which has not yet occurred – could provide a boost to Australian export demand, as with other export-focused countries. But the negative impact of bilateral U.S.-China tariffs on the global economy is much smaller than that of China’s attempt to limit indebtedness. Moreover, a trade truce will remove China’s primary incentive to adopt more aggressive stimulus. Nevertheless, from the RBA’s perspective, any boost to China’s construction-related activity would have a big impact on Australia’s economy and would strengthen the case for a rate hike in 2019. Core Inflation Australia’s headline CPI inflation has struggled to hit even the bottom end of the RBA’s 2-3% target band since 2015, reaching only 1.9% in Q3 of this year (Chart 5). The story is even worse for inflation excluding food and energy, with core CPI inflation now only at 1.2% after having drifted lower in two consecutive quarters. Both market-based and survey-based measures of inflation expectations are also hovering near 2%. Chart 5Australian Inflation Well Below RBA Target
Australian Inflation Well Below RBA Target
Australian Inflation Well Below RBA Target
When breaking down the CPI into tradeables (i.e. more globally-focused) and non-tradeables (i.e. more domestically-focused), the two types of inflation have not been accelerating at the same time since the 2009-11 period. Since then, faster tradeables inflation has occurred alongside slowing non-tradeables inflation, and vice versa. While volatility on the tradeables side should be expected given the correlation to swings in commodity prices and the Australian dollar, the weakness in non-tradeables is more directly related to the spare capacity in the domestic economy. Therefore, if wage growth continues to pick up as the labor market tightens, then non-tradeables inflation should follow suit and boost Australian CPI inflation back towards the RBA target range. The implication for the RBA is that a move in core CPI inflation back towards 2.5% (the midpoint of the RBA band), occurring after an acceleration in wage growth as described above, would give the central bank confidence that a higher Cash Rate is required. Bottom Line: The RBA has kept interest rates on hold for over two years, but may consider a rate hike in 2019 if additional tightening of labor markets leads to higher wage inflation, which would help lift core inflation back to the midpoint of the RBA’s 2-3% target band. A more aggressive fiscal and monetary stimulus package in China, while not our base case, would also embolden the RBA to tighten monetary policy. Risks From Australian Banks? Throughout 2018, the Australian financial industry has had to endure the slings and arrows of a government inquiry into its questionable business practices and misconduct. Revelations of bribery, fraud, the charging of fees for no service and from the accounts of deceased people, as well as board-level deception of regulators, have roiled Australia's financial sector since the explosive inquiry began in February. The final report of the Australian Financial Services Royal Commission will be published in February, but the impact is already being felt throughout the industry. Bank CEOs have been publically shamed, while other senior financial sector executives have been forced from their jobs. The chairman of National Australia Bank stated before the inquiry that customers’ trust in lenders had been “pretty well eroded to zero”, and that it could take as long as a decade to successfully overhaul the culture within the banks. The biggest impacts from the Commission will come through hits to banks’ earnings and funding costs, as well as the potential impact on lending standards for new loans. Australian banks will be less profitable because of fines, customer refunds, setting aside provisions for potential misconduct penalties and the government wanting increased competition. If banks also choose to be more conservative with the marking of loans, then higher loan-loss provisions could be an additional drag on bank earnings. Already, Australian bank stocks have severely underperformed the overall domestic market, and there has been some slowing of domestic credit growth (Chart 6). There are also signs of bank funding stresses from contracting bank deposit growth (second panel) and wider offshore funding costs like relatively elevated LIBOR-OIS spreads (bottom panel). Considering how heavily Australian banks rely on offshore funding, any squeeze in those markets could severely influence the availability of credit within the Australian economy. Chart 6Australian Banks Under Some Stress...
Australian Banks Under Some Stress...
Australian Banks Under Some Stress...
Looking ahead, if banks do tighten up their lending standards in response to the criticism and findings of the Commission, that will be from a starting point of very accommodative levels. In other words, getting a loan will likely still be “easy”, rather than “incredibly easy”. The reason is that Australian bank balance sheets remain in excellent condition. Credit crunches begin when banks are undercapitalized and are forced to retrench new loan activity as losses on existing loans pile up. That is not the case in Australia, where the major banks have Tier 1 capital ratios in the 10-12% range and non-performing loans are a tiny share of total lending. In our view, a true credit crunch would likely only occur after the Australian housing bubble bursts and the economy enters a severe downturn. That outcome would most likely be triggered by monetary policy tightening via multiple RBA rate hikes. Importantly, some of the steam has already been taken out of Australian house prices thanks to changes in regulations on new lending (Chart 7), potentially reducing some of the immediate risks to growth from a sharp plunge in home values. Chart 7...But No Credit Crunch Expected
...But No Credit Crunch Expected
...But No Credit Crunch Expected
Bottom Line: In 2019, the Australian government and its key financial regulators will have to work together to enforce responsible lending without triggering a catastrophic property market unwind. RBA policymakers are less likely to hike rates given their desire to maintain financial stability in the aftermath of the Commission – or at least until the inflation story forces their hand, as outlined in this report. The Federal Election: Polling Slightly Favors Labor Scandals in the financial sector are of utmost importance to the other major factor that could make 2019 a year of significant change in Australia: the federal election that looms most likely in the spring. Parliament is balanced on a knife’s edge, with the Australian Liberal Party’s loss of former Prime Minister Malcolm Turnbull’s parliamentary seat in a Sydney by-election on October 20. The ruling Liberal-National Coalition no longer has a majority and must rely on independent MPs to survive any no-confidence vote. This precarious situation suggests that the election could come even sooner than May and that the slightest twist in the campaign could deliver at least a small majority to either of the top two parties. Indeed, at this early stage, a high-conviction view on the election outcome is not warranted. After all, the 2016 election was decided in the Coalition’s favor only after a shift in opinion in the final month! Chart 8Labor Party Narrowly Leads All-Party Opinion Polls
A Year Of Change In Australia?
A Year Of Change In Australia?
Nevertheless, with all due caveats, our baseline case is for a Labor majority in 2019, however slim it may be.3 Labor is slightly ahead of the Coalition in the primary opinion polling, which includes all parties (Chart 8). In two-party preference polling, Labor has gradually widened its general lead since the July 2016 election and now holds a 10% advantage in the federal polls – albeit only a 6% lead when a moving average is taken (Chart 9). Labor is also winning or tied in every major state. Chart 9Labor Has Large Lead In Two-Party Preference Polls
A Year Of Change In Australia?
A Year Of Change In Australia?
The dramatic shift in polling since August is significant because that is when the knives came out and the Coalition ousted Turnbull in favor of the current Prime Minister Scott Morrison. The purpose of this move was to give the party a facelift ahead of the election. It is true that public opinion views Morrison as the preferred prime minister to Labor’s Bill Shorten. Shorten has a negative net approval rating and has never been viewed as an inspiring politician, while Morrison is just barely net positive. This perception works against Labor’s lead in the party polling – which is very competitive anyway – and suggests the election will be close. Critically, the Liberal-National Coalition’s polling as a whole has not benefited from the change in leadership. And in fact the data does not support the two major Australian parties’ abiding belief that a leadership coup will boost their popularity: Australia has seen four of these coups since 2010, two from Labor and two from the Coalition, and the party in question lost an average of 8% of the popular vote and 14 seats in parliament in the succeeding election (Table 1). Table 1Intra-Party Coups Don’t Win Votes
A Year Of Change In Australia?
A Year Of Change In Australia?
Turnbull’s ouster also calls attention to another detrimental factor for the Coalition: the challenge on the right flank from minor and anti-establishment parties. Pauline Hanson’s One Nation has a relatively low support rate both historically and in today’s race, currently at 8%, but anti-establishment feeling may have forced the Coalition into an error. Judging by the party’s weak polling since August, the negative response to Turnbull’s ouster has been more detrimental than the nomination of Morrison, an immigration hardliner and social conservative, has been beneficial. Meanwhile, Labor’s momentum has been corroborated by a string of surprise victories in by-elections and a sweeping win in the Victoria state elections on November 24. In the latter case, the party not only defended its hold on government, as one might expect in this progressive state, but exceeded expectations to win 56 seats out of 88 in the lower House, while the Coalition lost nearly half of its seats, falling from 37 to 21. Still, Labor’s lead is by no means decisive. In the average of the various primary polls its edge over the Coalition is within the margin of error. Moreover, the Coalition holds more “safe” (uncompetitive) seats than Labor.4 The bottom line is that a small swing in either party’s favor can produce a thin majority. The Coalition’s best case is the economy. But as concerns about unemployment and job creation recede, voters will make other demands. The top issues in recent polling are the cost of living, health care, housing affordability, and wages. Some polls also emphasize social mobility and climate change and renewable energy. Will Shorten’s Labor Party be able to capture the median voter? It is highly significant that the party has taken a rightward turn on immigration and taxes even as it holds out a more left-wing agenda on health, education, regulation, and social benefits. Immigration has played a major role in Australian politics and Labor is currently positioned near the political center – in other words, if Morrison hardens his line to guard against populists, he risks over-hardening and moving away from the median voter (Chart 10). Shorten has proposed a large bipartisan task force to determine the proper limits to immigration and how to deal with congestion and infrastructure pressures. Shorten’s platform also calls attention to abuse of temporary visas by foreign workers. Chart 10Labor Is Not Too Soft On Immigration
A Year Of Change In Australia?
A Year Of Change In Australia?
On taxes, Shorten has attempted to separate small and big companies, again in a bid for the political center. When Prime Minister Morrison sought to establish his anti-tax credentials (Chart 11), Shorten met him halfway and proposed relief for middle class families and small and medium-sized enterprises. Yet he doubled down on higher taxes for multinational corporations and high-income earners. Chart 11Liberal-National Coalition Cutting Corporate Tax Rates
A Year Of Change In Australia?
A Year Of Change In Australia?
Critically, the latter redistributive stances are more in line with the median voter than the Liberal Party’s more conservative, supply-side, tax cut agenda. All of Australia’s parties, including the increasingly popular “minority parties,” have a more favorable attitude toward redistribution than the Coalition, which is the outlier (Chart 12). Indeed, the National Party is closer in line with the others than the Liberals, highlighting the divisions within the Coalition that have been jeopardizing votes. As for tax cuts on middle income earners and small businesses, Labor’s acceptance of them speaks to voter concerns about living costs, jobs, and wages. Chart 12The Coalition Is Out Of Synch On Taxes
A Year Of Change In Australia?
A Year Of Change In Australia?
Labor is also closer to the median voter on the aforementioned financial sector scandals. The Coalition stands to suffer because it has developed a reputation for being too cozy with the banks (Chart 13). This is one of the biggest perceived differences between the two major parties – in addition to the negative perception of intra-Coalition betrayal – and it is possibly one of the most salient issues in the election. This presents a serious danger for the Coalition. Chart 13Banks: The Coalition’s Ball And Chain
A Year Of Change In Australia?
A Year Of Change In Australia?
What would a Labor government bring? The market will be jittery about Shorten’s attempts to increase tax revenue, which threatens a non-negligible tightening of fiscal policy. Shorten wants to raise taxes on high income earners; remove or lower deductions and discounts (such as on capital gains); crack down on tax evasion; and tighten control over a range of tax practices specific to Australia (limiting “negative gearing” and cutting cash refunds for “franking credits”). He is also taking a tough position on banks and the energy sector. At the same time, it is clear from Labor’s proposals in 2016 (Chart 14) that there will be a hefty amount of new spending coming down the pike if a Labor government is formed – primarily on education, health, infrastructure and job training. The tax cuts that Shorten does support will go to those with a higher propensity to consume, as well as to SMEs that are responsible for job creation. Chart 14Labor’s Spending Plans Unlikely To Change Much
A Year Of Change In Australia?
A Year Of Change In Australia?
Ultimately, Australia’s recent history, taken in consideration with the global business cycle, does not suggest that the Labor Party is all that much more fiscally profligate than the Coalition – but the current budget balance does suggest that there is substantial room to increase deficits, which is convenient for a government that is predisposed to give voters more services (Chart 15). Hence fiscal easing is the path of least resistance - one that could make the RBA even more comfortable in raising interest rates if the conditions laid out earlier in this report come to pass. Chart 15Australia's Next Government Will Have Room To Spend!
Australia's Next Government Will Have Room To Spend!
Australia's Next Government Will Have Room To Spend!
Bottom Line: The Australian Labor Party is slightly favored to win the next Australian election. This is a low-conviction call given the tight competition in public opinion polling and other mixed indicators. Broadly speaking, Labor’s shift to the political center on immigration and some tax issues makes the party more electable relative to the Coalition; meanwhile its promise of more government services fits with voter demands. We do not accept the narrative that Shorten’s Labor Party will engage in substantial fiscal tightening. The path of least resistance is for tax cuts as well as revenue collection, and for greater government spending. On the other hand, if the Coalition capitalizes on the incumbent advantage and stays in power, larger tax cuts will be in store. Hence we expect Australia to see marginally larger-than-expected budget deficits and fiscal thrust as the one reliable takeaway of next year’s election. Fixed Income Investment Implications We continue to recommend an overweight stance on Australian government bonds in currency-hedged global bond portfolios. While we have laid out the conditions that would make us change that view in this report, it is still too soon to position for such a move. Our RBA Monitor, which measures the cyclical pressures on the central bank to change monetary policy settings, is modestly below the zero line (Chart 16). This indicates a need for easier policy, although the indicator is starting to rise driven by the inflation components in the Monitor (bottom panel). In terms of market pricing, there are only 15bps of rate hikes over the next year discounted in the Australian Overnight Index Swap (OIS) curve, so markets are exposed to any shift to a more hawkish bias by the RBA as 2019 progresses. Chart 16Our RBA Monitor Starting To Turn Less Dovish
Our RBA Monitor Starting To Turn Less Dovish
Our RBA Monitor Starting To Turn Less Dovish
Looking purely at Australian government bond yields, the forward curves are priced for very little change in yields over the next year (Chart 17). This suggests that outright duration trades in Australia look uninteresting from a carry perspective of betting against the forwards. We continue to prefer Australian bonds on a relative basis to global developed market peers until there is more decisive evidence pointing to convergence of Australian growth and inflation to the other major economies (bottom panel). Chart 17Stay Overweight Australian Government Bonds
Stay Overweight Australian Government Bonds
Stay Overweight Australian Government Bonds
Over the past year, Global Fixed Income Strategy has recommended tactical trades in Australian money market futures to fade the pricing of RBA hikes that we did not expect to materialize. Specifically, we entered a long position in December 2018 Australian 90-Day Bank Bill futures on October 17, 2017, then switched to a long October 2019 90-Day Bank Bill futures position on May 29, 2017. The latter contract is now trading at implied interest rate levels just above the RBA’s 1.5% Cash Rate (Chart 18), suggesting that there is no more value in this trade. Chart 18Taking Profits On Our Long Bank Bill Futures Trade
Taking Profits On Our Long Bank Bill Futures Trade
Taking Profits On Our Long Bank Bill Futures Trade
We therefore take a profit of 21bps on the Bank Bill futures trade, while awaiting evidence from the “RBA Hike Checklist” introduced in this report before considering trades that will benefit from a more hawkish central bank. Robert Robis, CFA, Senior Vice President Global Fixed Income Strategy rrobis@bcaresearch.com Matt Gertken, Vice President Geopolitical Strategy mattg@bcaresearch.com Ray Park, CFA, Research Analyst ray@bcaresearch.com Footnotes 1 Technically the House of Representatives election could occur as late as November 2, while the half Senate election is due May 18, but the norm is to hold the election simultaneously. The 2016 election was a “double dissolution” involving the election of the entire Senate and House of Representatives. 2 Please see BCA China Investment Strategy Special Report, “China’s Property Market: Where Will It Go From Here?” dated September 13, 2018, available at cis.bcareserach.com. 3 We would slightly favor Labor leading a slim majority in the Senate as well as in the House. In the Senate, the half of the seats that are up for grabs are evenly split and the polling at this early stage favors Labor over the Coalition. The poor performance of the Greens, in recent polling and in the Victoria state election, suggests a positive development for Labor on the margin, whereas One Nation, whose polls are improving, poses a threat to the Coalition. 4 Labor is fighting for 15 “marginal” (hotly contested) seats and 28 “fairly safe” seats, while the Coalition is only fighting for 12 marginal seats and 14 fairly safe seats.
Highlights So What? The Trump administration is focusing on re-election in 2020, which could push the recession call into 2021. Why? The midterms were investment-relevant, just not in the way most of our clients thought. We are downgrading our alarmism on Iran; Trump is aware of his constraints. But investor optimism regarding the trade war may be overdone. China has contained its capital outflows, which suggests Beijing will be comfortable with more CNY/USD downside. A new GPS mega-theme: Bifurcated Capitalism! Watch carefully for any upcoming trade action on semiconductors. Feature There is no better feeling than hearing from our clients that we got a call wrong because we misjudged the constraints of the Trump administration by focusing too much on its preferences. Why? Because it means that clients are keeping us honest by employing our most important method: constraints over preferences. This is one of the takeaways from a quarter filled with meetings with our clients in the Midwest, Toronto, Amsterdam, Rotterdam, The Hague, Frankfurt, Berlin, Auckland, Melbourne, Sydney, Dubai, Abu Dhabi, and sunny Marbella, Spain! In this report, we discuss several pieces of insight from our clients. Midterms Are Investment Relevant Generally speaking, few of our clients agreed with our assessment that the midterm elections were not investment-relevant. The further away from the U.S. we traveled, the greater the sense among investors that equity markets influence U.S. politics: both the upcoming takeover of the House of Representatives by the Democratic Party and the odds of trade war intensification. We strongly disagree with this assessment. Both periods of equity market turbulence this year were preceded by a rising U.S. 10-year yield, not any particularly damning trade war chatter (Chart 1). In fact, the intensification of the trade war this summer occurred amidst a fairly buoyant S&P 500! Meanwhile, the odds of a Democratic takeover of the House were priced in well before the October equity decline began. Chart 1Yields, Not Trade, Matter For Stocks
Yields, Not Trade, Matter For Stocks
Yields, Not Trade, Matter For Stocks
Generally speaking, even midterms that produce gridlock have led to a relief rally (Chart 2). This time could be the same, especially because the likely next Speaker of the House, Nancy Pelosi, has signalled that the main policy goal for 2019 would be infrastructure spending. In her "victory" speech following the election, Pelosi mentioned infrastructure numerous times (impeachment, zero times). Chart 2Stocks Are Indifferent To Midterm Results
Stocks Are Indifferent To Midterm Results
Stocks Are Indifferent To Midterm Results
Democratic Representative Peter DeFazio, likely head of the House of Representatives committee overseeing transportation, has already signalled that he will ask for "real money, real investment."1 DeFazio has previously proposed a $500bn infrastructure plan, backed by issuance of 30-year Treasuries and raising fuel taxes. He has rejected the February 2017 Trump proposal, which largely relied on raising private money for the job. Would President Trump go with such a plan? Maybe. In early 2018, he stunned lawmakers by saying that he supported hiking the federal gasoline tax by 25 cents a gallon (the federal 18.4 cent-a-gallon gasoline tax has not been hiked since 1993). He has since confirmed that "everything is on the table" to achieve an infrastructure deal. Several clients from around the world pointed out that both Democrats and President Trump have an incentive to make a deal. President Trump wants to avoid the deeply negative fiscal thrust awaiting him in 2020 (Chart 3). Given the House takeover by the Democrats, it is tough to imagine that new tax cuts are the means for Trump to avoid the "stimulus cliff." As such, another round of stimulative fiscal spending may be the only way for him to avoid a late-2020 recession (although the latter is currently the BCA House View). Chart 3Can Trump And Pelosi Reverse...
Can Trump And Pelosi Reverse...
Can Trump And Pelosi Reverse...
Democrats, on the other hand, have an incentive to ditch "Resistance" and embrace policy-making. Yes, hastening the recession in 2020 would be the Machiavellian play, but President Trump would be able to blame Democrats for the downturn - since they will necessarily have had to participate in planning an infrastructure bill only to sink it. They also learned the lesson from the January 2018 government shutdown, which backfired at the polls and forced Senate Democrats to come to an agreement quickly on a two-year stimulative budget deal. What about the GOP fiscal conservatives? They don't necessarily need to come on board. The House is held by Democrats. And the Democrats in the Senate would only need 15-18 GOP Senators to support a profligate infrastructure plan. Given that infrastructure is popular, that the president will be pushing it, and that the GOP-controlled Senate agreed with the budget bill in January, we think that even more Republican Senators can go along with an infrastructure plan. Another big takeaway from the midterms is that the GOP suffered deep losses in the Midwest. President Trump's party lost ten out of twelve races in the region (Table 1). The two most representative contests were the loss of Republican Wisconsin Governor and one-time rising presidential star Scott Walker, and the victory of the left-wing and über-protectionist Democratic Senator Sherrod Brown of Ohio. Table 1Massive Republican Losses Across The Midwest
Insights From The Road - Constraints And Investing
Insights From The Road - Constraints And Investing
Senator Brown won his contest comfortably by 6.4% in a state that Trump carried by 8.13%. The appeal of Brown to the very blue-collar voters that Trump himself won is obvious. On trade, there is no daylight between the left-wing Brown and President Trump. Meanwhile, Walker, an establishment Republican who built his reputation on busting public-sector unions, could not replicate Trump's success in Wisconsin. Several of our clients suggested that the GOP performance in the Midwest was poor because of the aggressive trade rhetoric. But that makes little sense. Republicans did not run Trump-style populists in the Midwest, to their obvious detriment. Democrats have always claimed to be for "fair trade" rather than "free trade." And we know, empirically, that Trump saw a key swing of turnout in 2016 in these states, largely thanks to his protectionist rhetoric (Chart 4). Chart 4Trump Owes The Midwest The Presidency
Trump Owes The Midwest The Presidency
Trump Owes The Midwest The Presidency
President Trump cannot take Michigan, Pennsylvania, and Wisconsin lightly. His performance in 2016 was extraordinary, but also tight. The Democrats will win these states if Trump does not grow voter turnout and support, according to demographic projections - and they lost them by less than a percentage point of white voters (Map 1). As such, we think that Democrats will talk tough on trade and try to reclaim their union and blue-collar voters, while President Trump has to double down on an aggressive trade posture towards China. Map 1Can 'White Hype' Work In 2020? Trump's Margins Are Small
Insights From The Road - Constraints And Investing
Insights From The Road - Constraints And Investing
The midterms are investment relevant after all, but not in the way some might think. The Democratic takeover of the House, and the resultant gridlock, will potentially avert the "stimulus cliff" in 2020. This ought to support short-term inflation expectations and thus allow the Fed to stay-the-course. For markets, this could be unsettling given the correlation between yields and downturns in 2018. For the dollar, this should be supportive. The odds of an infrastructure deal are good, above 50%, with the key risk being a Democratic House focused on impeaching Trump. Such a bill would augur even higher levels of fiscal spending through 2020, possibly prolonging the business cycle, and setting up an even wider budget deficit when the next recession hits (Chart 5). Chart 5Pro-Cyclical Policy Has To Continue
Pro-Cyclical Policy Has To Continue
Pro-Cyclical Policy Has To Continue
Meanwhile, the shellacking in the Midwest ought to embolden the president to go even harder against China on trade. Rather than the upcoming Xi-Trump meeting in Buenos Aires, the key bellwether of this thesis is whether Trump signals afterwards that he will implement the tariff rate hike on January 1, 2019 (and whether he announces a third round of tariffs). Bottom Line: Go long building products and construction material stocks. Stay short China-exposed S&P 500 companies. The 10-year yield may end the year even closer to 3.5% when the market realizes that the odds of an infrastructure deal are higher than previously thought. The political path of least resistance in the U.S. continues to point towards greater profligacy. Trump Is Aware Of His Constraints In The Middle East Throughout 2018, we have flagged U.S.-Iran tensions as the risk for 2019. In early October, we went long Brent / short S&P 500 as a hedge against this risk, a trade that we closed for a 6% gain last week. During our meetings with clients this quarter, however, several astute observers pointed out that in our own analyses we have stressed the geopolitical and political constraints to President Trump. First, we have argued that the original 2015 nuclear deal signed by President Obama had a deep geopolitical logic, allowing the U.S. to pivot to Asia and stare down China by geopolitically deleveraging the U.S. from the Middle East. If President Trump undermined the détente with Iran, he would be opening up a two-front conflict with both China and Iran, diluting his administration's focus and capabilities. Second, we noted that a rise in oil prices could precipitate an early recession and push up gasoline prices in 2019, a probable death knell for any president's re-election prospects. Our clients were right to ask: Why would President Trump face down these constraints, given the high cost that he would incur? We did not have a very good answer to this question. It is difficult to understand President Trump's preferences for raising tensions against Iran beyond the fact that he promised to do so in his campaign, appears to want to undermine all of President Obama's policies, and turned to Iran hawks to head his foreign policy. Are these preferences worth the risk of a recession in 2019? Or worth the risk of triggering yet another military conflict in the Middle East over a country that only 7% of Americans consider is the 'greatest enemy' (Chart 6)? Chart 6Americans Don't Perceive Iran As 'The Greatest Enemy'
Insights From The Road - Constraints And Investing
Insights From The Road - Constraints And Investing
Given that the administration has offered exemptions to the oil embargo to eight key importers, it now appears that President Trump is well aware of his geopolitical and domestic constraints. The combined imports of Iranian oil by these eight states is ~1.4mm b/d. While we do not have the detail of the volumes that will be allowed under the waivers, it is likely that these Iranian sales will recover some of the ~1mm b/d of exports lost already (Chart 7). Chart 7Waivers Will Restore Iranian Exports For 180 Days
Insights From The Road - Constraints And Investing
Insights From The Road - Constraints And Investing
What does this mean for investors? On one hand, it means that the risk of oil prices spiking north of $100 per barrel have substantively decreased. On the other hand, however, it also means that the Trump administration agrees with BCA's Commodity & Energy Strategy view that oil markets remain tight and that OPEC 2.0's spare capacity may be a constraint to future production increases. Bottom Line: The risks of an oil-price-shock-induced 2019 recession have fallen. However, oil prices may yet surge in 2019 to the $85-95 level (Brent) on the back of supply risks in Venezuela and Iran, especially if Saudi Arabia and Russia prove unable to expand production much beyond their current levels. Most of our clients in the Middle East shared the skepticism of our commodity strategists that Saudi Arabia would be able to increase production much higher than current levels in 2019. However, the view was not unanimous. Risks Of Saudi Arabia Going Rogue Have Declined Clients in the Middle East were convinced that the murder of journalist Jamal Khashoggi would have no impact on Saudi oil production decisions. However, the insight from the region is that the incident has probably ended the "blank cheque" that the Trump administration initially gave Riyadh on foreign policy. For global investors, this may not have a major impact. But it may have been at least part of the administration's reasoning behind giving embargo exemptions to such a large number of economies. The incident has likely forced Saudi Arabia to adjust its calculus on three issues: Qatar: The Saudi-Qatari split never made much sense in the first place. It was initially endorsed by President Trump, who may not have understood the strategic value of Qatar to the United States. Defense Secretary James Mattis almost immediately responded by reaffirming the U.S. commitment to the Persian Gulf country which hosts one of the most strategic U.S. air bases in the world. Yemen: The U.S. has now openly called on Saudi Arabia to end its military operations in Yemen. We would expect Riyadh to acquiesce to the request. Iran: With the U.S. giving major importers of Iranian oil exemptions, the message is twofold. First, the U.S. cares about its domestic economic stability. Second, the U.S. does not care about Saudi domestic economic stability. Our commodity strategists believe that Saudi fiscal breakeven oil price is around $85. As such, the U.S. decision to slow-roll the sanctions against Iran will be received with chagrin in Riyadh, especially as the latter will now have to shoulder both lower oil prices and the American request for higher output. Could Saudi Arabia break with the U.S.? Not a chance. The U.S. is the Saudis' security guarantor. As such, it is up to Saudi Arabia to acquiesce to American foreign policy goals, not the other way around. While we think that President Trump ultimately succumbed to geopolitical and political constraints when he decided to take the "phoney war" approach to Iran, he may have been nudged in that direction by Khashoggi's tragic murder. Bottom Line: A major risk for investors in 2019 was that the Trump administration would treat Saudi preferences for a major confrontation with Iran as its own interests. Such a strategy would have destabilized the global oil markets and potentially have unwound the 2015 U.S.-Iran détente that has allowed the U.S. to focus on China. However, the death of Khashoggi has marginally hurt President Trump domestically - given that it makes him look soft on Saudi Arabia, an unpopular stance in the U.S. Moreover, the administration has come to grips with the risks of a dire oil shock should Iran retaliate. The shift in U.S. policy vis-à-vis Saudi Arabia will therefore refocus the Trump administration on its own priorities, not that of its ally in the Middle East. Trade War Is All About CNY/USD In The Short Term... Clients in Australia and New Zealand are the most sophisticated Western investors when it comes to China. The level of macro understanding of the Chinese economy and the markets in these two countries is unparalleled (outside of China itself, of course). We therefore always appreciate the insights we pick up from our clients Down Under. And they are convinced that the massive capital outflow from China has clearly ceased. The flow of Chinese capital into Auckland, Melbourne, and Sydney real estate has definitely slowed, and anecdotal evidence appears to be showing up in the price data (Chart 8). Separately, this intel has been confirmed by clients from British Columbia and California. Chart 8Pacific Rim Home Prices Rolling Over
Pacific Rim Home Prices Rolling Over
Pacific Rim Home Prices Rolling Over
The reality is that China has successfully closed its capital account. How else can we explain that a 4.7% CNY/USD depreciation in 2015 precipitated a $483 billion outflow of forex reserves, whereas a 10.1% depreciation this year has not had a major impact (Chart 9)? Chart 9On Balance, China Is Experiencing Modest Outflows
Insights From The Road - Constraints And Investing
Insights From The Road - Constraints And Investing
To be fair, forex reserves declined by $34bn in October, but that is still a far cry from the panic in 2015. Our other indicators suggest that the impact on capital seepage is muted this time around, largely due to the official crackdown on various forms of capital outflows: Quarterly data (Chart 10) reflecting the change in foreign exchange reserves minus the sum of the current account balance and FDI, indicate that while net inflows have remained negative, they are still a far cry from 2015 levels. Chart 10Far Cry From 2016 Crisis
Far Cry From 2016 Crisis
Far Cry From 2016 Crisis
Import data (Chart 11) no longer show the massive deviation between Chinese national statistics and IMF figures. Imports from Hong Kong (Chart 12), specifically, are now down to normal levels, with the fake invoicing problem having quieted down for now. Chart 11No More Confusion Regarding Imports
No More Confusion Regarding Imports
No More Confusion Regarding Imports
Chart 12Fake Invoicing Has Been Curbed
Fake Invoicing Has Been Curbed
Fake Invoicing Has Been Curbed
Growth rate of foreign reserves (Chart 13) is not clearly contracting yet, and has been positive this year. Chart 13Severe FX Reserve Drawdown Has Ended
Severe FX Reserve Drawdown Has Ended
Severe FX Reserve Drawdown Has Ended
Chinese foreign borrowing (Chart 14) is down from stratospheric levels, which limits the volume of potential outflows. Chart 14China's Foreign Lending Has Eased
China's Foreign Lending Has Eased
China's Foreign Lending Has Eased
And the orgy of M&A and investment deals in the U.S. (Chart 15) has ended. Chart 15M&A Deals Have Eased
Insights From The Road - Constraints And Investing
Insights From The Road - Constraints And Investing
Bottom Line: Anecdotal and official data suggest that capital outflows are in check despite their recent uptick. This could embolden Chinese leaders to continue using CNY/USD depreciation as their primary weapon against President Trump's tariffs, especially if the global backdrop is not collapsing. An increase of the 10% tariff rate to 25% on January 1 could, therefore, precipitate further weakness in the CNY/USD. The announcement of a third round of tariffs covering the remainder of Chinese imports could do the same. This would be negative for global risk assets, particularly EM equities and currencies. ... In the Long Term, Bifurcated Capitalism Our annual pilgrimage to Oceania included our traditional meeting with The Smartest Man In Oceania The Bloke From Down Under.2 He shares our belief that the long-term result of the broader Sino-American geopolitical conflict will be a form of Bifurcated Capitalism. His exact words were that "countries may soon have to choose between being in the Amazon or Alibaba camp," a great real-world implication of our mega-theme. Australian and New Zealand clients are particularly sensitive to the idea that the world may soon be split into spheres of influence because both countries are so high-beta to China, while obviously retaining their membership card in the West. Our suspicion is that both will be fine as they export mainly a high-grade and diversified range of commodities to China. Short of war, it is unlikely that the U.S. will one day demand that New Zealand stop its dairy exports to China, or that Australia stop iron ore and LNG exports. Countries exporting semiconductors to China, on the other hand, could face a choice between enforcing a future embargo or incurring the wrath of their closest military ally. The Bloke From Down Under has pointed out that, given China's dependency on semiconductor technology, a U.S. embargo of this critical tech could be comparable to the U.S. oil embargo against Japan that precipitated the latter's attack on Pearl Harbor. Chart 16China Accounts For 60% Of Global Semiconductor Demand
Insights From The Road - Constraints And Investing
Insights From The Road - Constraints And Investing
The global semiconductor market reached $354 billion in 2016, with China accounting for 60% of total consumption (Chart 16). Despite the country's insatiable appetite for semiconductors, no Chinese firm is among the world's top 20 makers. This is why Beijing's "Made in China 2025" plan has focused so much on semiconductor capability (Chart 17). The goal is for China to become self-sufficient in semiconductors, gaining 35% share of the global design market. Chart 17China's High-Tech Protectionism
Insights From The Road - Constraints And Investing
Insights From The Road - Constraints And Investing
A key feature of Bifurcated Capitalism will be impairment of investment in high-tech that has dual-use applications in military. Semiconductors obviously make that list. Another key feature would be investment restrictions in such high-tech sectors, particularly the kind of investments and M&A deals that China has been looking for in the U.S. this decade. Further, clients in California are very concerned about the U.S.'s proposed export controls, which would cut off access to China and wreak havoc on the industry. The Trump administration has already signalled that it will restrict Chinese inbound investment. Congress passed, with a large bipartisan majority, an expanded review system, the Foreign Investment Risk Review Modernization Act (FIRRMA). The law has expanded the purview of the Committee on Foreign Investment in the United States (CFIUS), a secretive interagency panel nominally under control of the Treasury Department that can block inbound investment on national security grounds. CFIUS, at its core, has always been an entity focused on China. While the Treasury Department initially signalled it would take as much as 18 months to adopt the new FIRRMA rules, Secretary Mnuchin has accelerated the process. The procedure now will expand review from only large-stake takeovers to joint ventures and smaller investments by foreigners, particularly in technology deemed critical for national security reasons. This oversight began on November 10 and will allow CFIUS to block foreigners from taking a stake in a business making sensitive technology even if it gives the foreign investors merely a board seat. Countries of "special concern" will inherently receive heightened scrutiny, and a country's history of compliance with U.S. law, as well as cybersecurity and American citizens' privacy, will be considerations. A new interagency process led by the Commerce Department will focus on refurbishing export controls so as to protect "emerging and foundational technologies." Such impediments to capital flows are likely to become endemic and expand beyond the U.S. We may be seeing the first steps in the Bifurcated Capitalism concept that one day comes to dominate the global economy. Entire countries and sectors may become off-limits to Western investors and vice-versa for Chinese market participants. At the very least, companies whose revenue growth is currently slated to come from expansion in overseas markets may see those expectations falter. At its most pessimistic, however, Bifurcated Capitalism may precipitate geopolitical conflict if it denies China or the U.S. critical technology or commodities. Marko Papic, Senior Vice President Chief Geopolitical Strategist marko@bcaresearch.com 1 Please see David Shepardson, "Democrats to push for big infrastructure bill with 'real money' in 2019," Reuters, dated November 7, 2018, available at reuters.com. 2 At the time of publication, the said investor was unable to secure the permission of his wife for the "The Smartest Man" moniker. Geopolitical Calendar
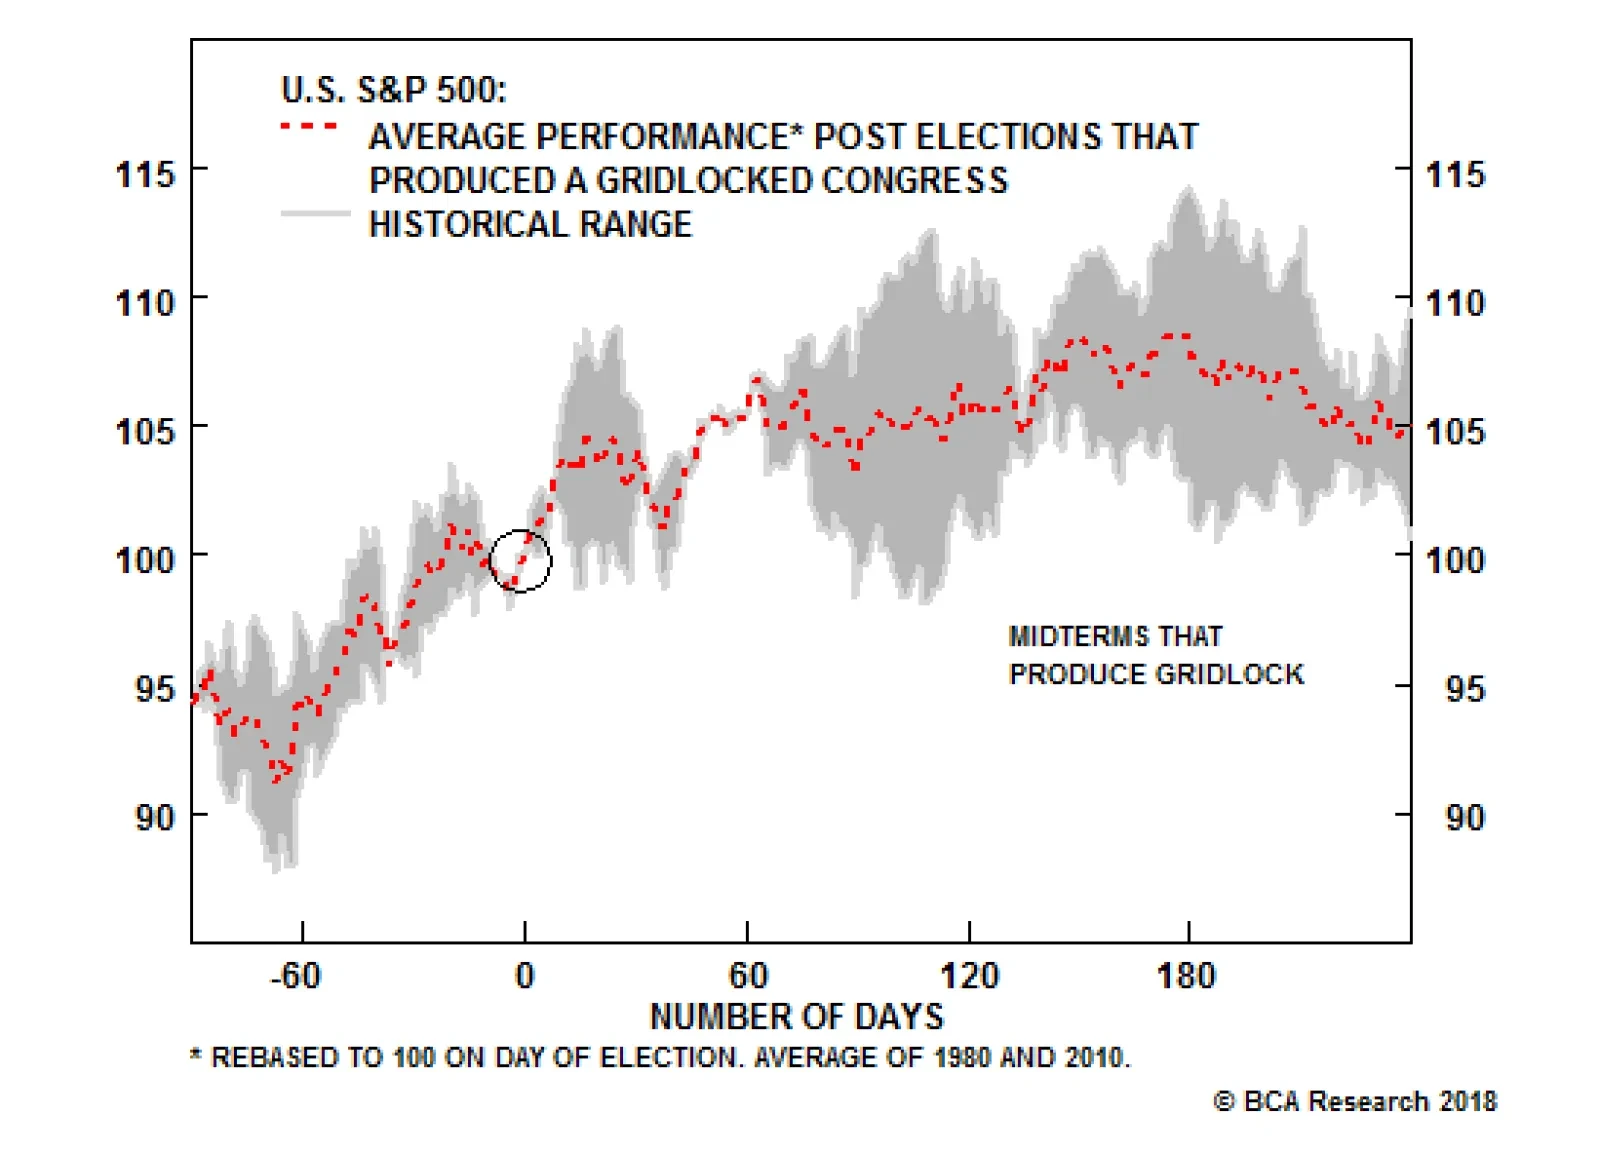
The Democrats will not be able to pass any tax hikes with a Republican president and Senate able to veto them. The only legislative areas that could see compromise between the two parties over 2018-20 would be infrastructure – or conceivably health care. A…
Highlights So What? Donald Trump's reelection depends on the timing of the next recession. Why? The midterm elections will not determine Trump's reelection chances. Rather, the timing of the next recession will. BCA's House View expects it by 2020. Otherwise, President Trump is favored to win. Trump may be downgrading "maximum pressure" on Iran, reducing the risk of a 2019 recession. Trade war with China, gridlock, and budget deficits are the most investment-relevant outcomes of U.S. politics in 2018-20. Feature The preliminary results of the U.S. midterm elections are in, with the Democrats gaining the House and failing to gain the Senate, as expected. Our view remains that the implications for investors are minimal. The policy status quo is now locked in - a gridlocked government is unlikely to produce a major change in economic policy over the next two years. While the election is to some extent a rebuke to Trump, this report argues that he remains the favored candidate for the 2020 presidential election - unless a recession occurs. A Preliminary Look At The Midterms First, the preliminary takeaways from the midterms, as the results come in: The Democrats took the House of Representatives, with a preliminary net gain of 27 seats, resulting in a 51%-plus majority, and this is projected to rise to 34 seats as we go to press Wednesday morning. This is above the average for midterm election gains by the opposition party, especially given that Republicans have held the advantage in electoral districting. Performance in the Midwest, other swing states, and suburban areas poses a threat to Trump and Republicans in 2020. Republicans held the Senate, with a net gain of at least two seats, for a 51%-plus majority. Democrats were defending 10 seats in states that Trump won in 2016. While Democrats did well in the Midwest, these candidates had the advantage of incumbency. On the state level, the Democrats gained a net seven governorships, two of them in key Midwestern states. The gubernatorial races were partly cyclical, as the Republicans had hit a historic high-water mark in governors' seats and were bound to fall back a bit. However, the Democratic victory in Michigan and Wisconsin, key Midwestern Trump states, is a very positive sign for the Democrats, since they were not incumbents in either state and had to unseat incumbent Governor Scott Walker in Wisconsin. (Their victory in Maine could also help them in the electoral college in 2020.) The governors' races also suggest that moderate Democrats are more appealing to voters than activist Democrats. Candidate Andrew Gillum's loss in Florida is a disappointment for the progressive wing of the Democratic Party.1 With the House alone, Democrats will not be able to push major legislation through. In the current partisan environment it will be nigh-impossible to reach the 60 votes needed to end debate in the Senate ("cloture"), and even then House Democrats will face a presidential veto. They will not be able to repeal Trump's tax cuts, re-regulate the economy, abandon the trade wars, resurrect Obamacare, or revive the 2015 Iranian nuclear deal. Like the Republicans after 2010, they will be trapped in the position of controlling only one half of one of the three constitutional branches. The most they can do is hold hearings and bring forth witnesses in an attempt to tarnish Trump's 2020 reelection chances. They may eventually bring impeachment articles against him, but without two-thirds of the Senate they cannot remove him from office (unless the GOP grassroots abandons him, giving senators permission to do so). U.S. equities generally move upward after midterm elections - including midterms that produce gridlock (Chart 1A & Chart 1B). However, the October selloff could drag into November. More worryingly, as Chart 1B shows, the post-election rally tends to peter out only six months after a gridlock midterm, unlike midterms that reinforce the ruling party. Chart 1AMidterm U.S. Elections Tend To Be Bullish...
Midterm U.S. Elections Tend To Be Bullish...
Midterm U.S. Elections Tend To Be Bullish...
Chart 1B... But Markets Lose Steam Six Months Post-Gridlock
... But Markets Lose Steam Six Months Post-Gridlock
... But Markets Lose Steam Six Months Post-Gridlock
However, the 2018 midterms could be mildly positive for the markets, as they do not portend any major new policies or uncertainty. Trump's proposed additional tax cuts would have threatened higher inflation and more Fed rate hikes, whereas House Democrats will not be able to raise taxes or cut spending alone. Bipartisan entitlement reform seems unlikely in 2018-20 given the acrimony of the two parties and structural factors such as inequality and populism. An outstanding question is health care, which Republicans left unresolved after failing to repeal Obamacare, and which exit polls show was a driving factor behind Democratic victories. Separately, as an additional marginal positive for risk assets, the Trump administration has reportedly granted eight waivers to countries that import Iranian oil. We have signaled that Trump's "maximum pressure" doctrine poses a key risk for markets due to the danger of an Iran-induced oil price shock. A shift toward more lax enforcement reduces the tail-risk of a recession in 2019 (Chart 2). Of course, the waivers will expire in 180 days and may be a mere ploy to ensure smooth markets ahead of the midterm election, so the jury is still out on this issue. Chart 2Rapid Increases In Oil Prices Tend To Precede Recessions
The 2020 U.S. Election: A "Way Too Soon" Forecast
The 2020 U.S. Election: A "Way Too Soon" Forecast
This brings us to the main focus of this report: what do the midterms suggest about the 2020 election? Bottom Line: The midterm elections have produced a gridlocked Congress. Trump can continue with his foreign policy, most of his trade policy, his deregulatory decrees, and his appointment of court judges with limited interference from House Democrats. The only thing the Democrats can prevent him from doing is cutting taxes further. He tends to agree with Democrats on the need for more spending! While the U.S. market could rally on the back of this result, we do not see U.S. politics being a critical catalyst for markets going forward. On balance, a gridlocked result brings less uncertainty than would otherwise be the case, which is positive for markets in the short term. The Midterms And The 2020 Election There is a weak relationship at best between an opposition party's gains in the midterms and its performance in the presidential election two years later. Given that the president's party almost always loses the midterms - and yet that incumbent presidents tend to be reelected - the midterm has little diagnostic value for the presidential vote, as can be seen in recent elections (Chart 3A & Chart 3B). Chart 3AMidterm Has Little Predictive Power For Presidential Popular Vote ...
The 2020 U.S. Election: A "Way Too Soon" Forecast
The 2020 U.S. Election: A "Way Too Soon" Forecast
Chart 3B... Nor For Presidential Electoral College Vote
The 2020 U.S. Election: A "Way Too Soon" Forecast
The 2020 U.S. Election: A "Way Too Soon" Forecast
Nevertheless, historian Allan Lichtman has shown that since 1860, a midterm loss is marginally negative for a president's reelection chances.2 And for Republicans in recent years, losses in midterm elections are very weakly correlated with Republican losses of seats in the electoral college two years later (Chart 4). Chart 4Republican Midterm Loss Could Foreshadow Electoral College Losses
The 2020 U.S. Election: A "Way Too Soon" Forecast
The 2020 U.S. Election: A "Way Too Soon" Forecast
Still, this midterm election does not give any reason to believe that Trump's reelection chances have been damaged any more than Ronald Reagan's were after 1982, or Bill Clinton's after 1994, or Barack Obama's after 2010. All three of these presidents went on to a second term. A midterm loss simply does not stack the odds against reelection. Why are midterm elections of limited consequence for the president? They are fundamentally different from presidential elections. For instance, "the buck stops here" applies to the president alone, whereas in the midterms voters often seek to keep the president in check by voting against his party in Congress.3 Despite the consensus media narrative, the president is not that unpopular. Trump's approval rating today is about the same as that of Clinton and Obama at this stage in their first term (Chart 5). This week's midterm was not a wave of "resistance" to Trump so much as a run-of-the-mill midterm in which the president's party lost seats. Its outcome should not be overstated. Bottom Line: There is not much correlation between midterms and presidential elections. The best historians view it as a marginal negative for the incumbent. This result is not a mortal wound for Trump. Chart 5President Trump Is Hardly Losing The Popularity Contest
The 2020 U.S. Election: A "Way Too Soon" Forecast
The 2020 U.S. Election: A "Way Too Soon" Forecast
2020: The Recession Call Is The Election Call The incumbent party has lost the White House every single time that a recession occurred during the campaign proper (Chart 6).4 The incumbent party has lost 50%-60% of the time if recession occurred in the calendar year before the election or in the first half of the election year. Chart 6A 2020 Recession Is Trump's Biggest Threat
A 2020 Recession Is Trump's Biggest Threat
A 2020 Recession Is Trump's Biggest Threat
This is a problem for President Trump because the current economic expansion is long in the tooth. In July 2019, it will become the longest running economic expansion in U.S. history, following the 1991-2001 expansion. The 2020 election will occur sixteen months after the record is broken, which means that averting a recession over this entire period will be remarkable. BCA's House View holds that 2020 is the most likely year for a recession to occur. The economy is at full employment, inflation is trending upwards, and the Fed's interest rate hikes will become restrictive sometime in 2019. The yield curve could invert in the second half of 2019 - and inversion tends to precede recession by anywhere from 5-to-16 months (Table 1). No wonder Trump has called the Fed his "biggest threat."5 Table 1Inverted Yield Curve Is An Ominous Sign
The 2020 U.S. Election: A "Way Too Soon" Forecast
The 2020 U.S. Election: A "Way Too Soon" Forecast
The risks to this 2020 recession call are probably skewed toward 2021 instead of 2019. The still-positive U.S. fiscal thrust in 2019 and possibly 2020 and the Trump administration's newly flexible approach to Iran sanctions, if maintained, reduce the tail-risk of a recession in 2019. If there is not a recession by 2020, Trump is the favored candidate to win. First, incumbents win 69% of all U.S. presidential elections. Second, incumbents win 80% of the time when the economy is not in recession, and 76% of the time when real annual per capita GDP growth over the course of the term exceeds the average of the previous two terms, which will likely be the case in 2020 unless there is a recession (Chart 7). Chart 7Relative Economic Performance Could Give Trump Firepower
Relative Economic Performance Could Give Trump Firepower
Relative Economic Performance Could Give Trump Firepower
The above probabilities are drawn from the aforementioned Professor Allan Lichtman, at American University in Washington D.C., who has accurately predicted the outcome of every presidential election since 1984 (except the disputed 2000 election). Lichtman views presidential elections as a referendum on the party that controls the White House. He presents "13 Keys to the Presidency," which are true or false statements based on historically derived indicators of presidential performance. If six or more of the 13 keys are false, the incumbent will lose. On our own reading of Lichtman's keys, Trump is currently lined up to lose a maximum of four keys - two shy of the six needed to unseat him (Table 2). This is a generous reading for the Democrats: Trump's party has lost seats in the midterm election relative to 2014; his term has seen sustained social unrest; he is tainted by major scandal; and he is lacking in charisma. Yet on a stricter reading Trump only has one key against him (the midterm). Table 2Lichtman's Thirteen Keys To The White House*
The 2020 U.S. Election: A "Way Too Soon" Forecast
The 2020 U.S. Election: A "Way Too Soon" Forecast
What would it take to push Trump over the edge? Aside from a recession (which would trigger one or both of the economic keys against him), he would need to see two-to-four of the following factors take shape: a serious foreign policy or military failure, a charismatic Democratic opponent in 2020, a significant challenge to his nomination within the Republican Party, or a robust third party candidacy emerge. In our view, none of these developments are on the horizon yet, though they are probable enough. For instance, it is easy to see Trump's audacious foreign policy on China, Iran, and North Korea leading to a failure that counts against him. Thus, as things currently stand, Trump is the candidate to beat as long as the economy holds up. What about impeachment and removal from office prior to 2020? As long as Trump remains popular among Republican voters he will prevent the Senate from turning against him (Chart 8). What could cause public opinion to change? Clear, irrefutable, accessible, "smoking gun" evidence of personal wrongdoing that affected Trump's campaigns or duties in office. Nixon was not brought down until the Watergate tapes became public - and that required a Supreme Court order. Only then did Republican opinion turn against him and expose him to impeachment and removal - prompting him to resign. Chart 8Trump Cannot Be Removed From Office
The 2020 U.S. Election: A "Way Too Soon" Forecast
The 2020 U.S. Election: A "Way Too Soon" Forecast
All that being said, Trump tends to trail his likeliest 2020 adversaries in one-on-one opinion polling. Given our recession call, we would not dispute online betting markets giving Trump a less-than-50% chance of reelection at present (Chart 9). The Democratic selection process has hardly begun: e.g. Joe Biden could have health problems, and Michelle Obama, Oprah Winfrey, or other surprise candidates could decide to run. The world will be a different place in 2020. Bottom Line: The recession call is the election call. If BCA is right about a recession by 2020, then Trump will lose. If we are wrong, then Trump is favored to win. Chart 9A Strong Opponent Has Yet To Emerge
The 2020 U.S. Election: A "Way Too Soon" Forecast
The 2020 U.S. Election: A "Way Too Soon" Forecast
Is It Even Possible For Trump To Win Again? Election Scenarios Is it demographically possible for Trump to win? Yes. In 2016 BCA dubbed Trump's electoral strategy "White Hype," based on his apparent attempt to increase the support and turnout of white voters, primarily in "Rust Belt" battleground states. While Republican policy wonks might have envisioned a "big tent" Republican Party for the future, demographic trends in 2016 suggested that this strategy was premature. Indeed, drawing from a major demographic study by the Center for American Progress and other Washington think tanks,6 we found that a big increase in white turnout and support was the only 2016 election scenario in which a victory in both the popular vote and electoral college vote was possible. In other words, while "Minority Outreach" have worked as a GOP strategy in the future, Donald Trump's team was mathematically correct in realizing that only White Hype would work in the actual election at hand. This strategy did not win Trump the popular vote, but it did secure him the requisite electoral college seats, notably from the formerly blue of Wisconsin, Michigan, and Pennsylvania. Comparing the 2016 results with our pre-election projections confirms this point: Trump won the very swing states where he increased white GOP support and lost the swing states where he did not. Pennsylvania is the notable exception, but he won there by increasing white turnout instead of white GOP support.7 Can Trump do this again? Yes, but not easily. Map 1 depicts the 2016 election results with red and blue states, plus the percentage swing in white party support that would have been necessary to turn the state to the opposite party (white support for the GOP is the independent variable). In Michigan, a 0.3% shift in the white vote away from Republicans would have deprived Trump of victory; in Wisconsin and Pennsylvania, a 0.8% shift would have done the same; in Florida, a 1.5% change would have done so. Map 1The 'White Hype' Strategy Narrowly Worked In 2016
The 2020 U.S. Election: A "Way Too Soon" Forecast
The 2020 U.S. Election: A "Way Too Soon" Forecast
Critically, the country's demographics have changed significantly since 2016 - to Trump's detriment. The white eligible voting population in swing states will have fallen sharply from 81% of the population to 76% of the population by 2020 (Chart 10). Chart 10Demographic Shift Does Not Favor Trump
The 2020 U.S. Election: A "Way Too Soon" Forecast
The 2020 U.S. Election: A "Way Too Soon" Forecast
Thus, to determine whether Trump still has a pathway to victory, we looked at eight scenarios, drawing on the updated Center for American Progress study. The assumptions behind the scenarios in Table 3 are as follows: Status Quo - This replicates the 2016 result and projects it forward with 2020 demographics. 2016 Sans Third Party - Replicates the 2016 result but normalizes the third party vote, which was elevated that year. Minority Revolt - In this scenario, Hispanics, Asians, and other minorities turn out in large numbers to support Democrats, even with white non-college educated voters supporting Republicans at a decent rate. The Kanye West Strategy - Trump performs a miracle and generates a swing of minority voters in favor of Republicans. Blue Collar Democrats - White non-college-educated support returns to 2012 norms, meaning back to Democrats. Romney's Ghost - White college-educated support returns to 2012 levels. White Hype - White non-college-educated support swings to Republicans. Obama versus Trump - White college-educated voters ally with minorities in opposition to a surge in white non-college-educated voters for Republicans. Table 3Assumptions For Key Electoral Scenarios In 2020
The 2020 U.S. Election: A "Way Too Soon" Forecast
The 2020 U.S. Election: A "Way Too Soon" Forecast
The results show that Trump's best chance at remaining in the White House is still White Hype, as it is still the only scenario in which Trump can statistically win a victory in the popular vote (Chart 11). Another pathway to victory is the "2016 Sans Third Party" scenario. But this scenario still calls for White Hype, since a third party challenger is out of his hands (Chart 12).8 Chart 11'White Hype' May Be Only Way To Secure Both Popular And Electoral College Vote...
The 2020 U.S. Election: A "Way Too Soon" Forecast
The 2020 U.S. Election: A "Way Too Soon" Forecast
Chart 12... Although Moving To The Center Could Still Yield Electoral College Vote
The 2020 U.S. Election: A "Way Too Soon" Forecast
The 2020 U.S. Election: A "Way Too Soon" Forecast
However, the data show that Trump cannot win merely by replicating his white turnout and support from 2016, due to demographic changes wiping away the thin margins in key swing states. He needs some additional increases in support. These increases will ultimately have to be culled from his record in office - which reinforces the all-important question of the timing of recession, but also raises the question of whether Trump will move to the center to woo the median voter. In the "Kanye West" and "Romney's Ghost" scenarios, Trump wins the electoral college by broadening his appeal to minorities and college-educated white voters. This may sound far-fetched, but President Clinton reinvented himself after the "Republican Revolution" of 1994 by compromising with Republicans in Congress. The slim margins in the Midwest suggest that the probability of Trump shifting to the middle is not as low as one might think. Especially if there is no recession. Independents remain the largest voting block - and they have not lost much steam, if any, since 2016. Moreover, the number of independents who lean Republican is in an uptrend (Chart 13). Without a recession, or a failure on Lichtman's keys, Trump will likely broaden his base. Chart 13Trump Shows Promise Among Independents
Trump Shows Promise Among Independents
Trump Shows Promise Among Independents
Bottom Line: Trump needs to increase white turnout and GOP support beyond 2016 levels in order to win 2020. Demographics will not allow a simple repeat of his 2016 performance. However, he may be able to generate the requisite turnout and support by moving to the center, courting college-educated whites and even minorities. His success will depend on his record in office. Investment Implications What are the implications of the above findings for 2018-20 and beyond? The Rust Belt states of Michigan, Pennsylvania, and Wisconsin will become pseudo-apocalyptic battlegrounds in 2020. The Democrats must aim to take back all three to win the White House, as they cannot win with just two alone.9 They are likely to focus on these states because they are erstwhile blue states and the vote margin is so slim that the slightest factors could shift the balance - meaning that Democrats could win here without a general pro-Democratic shift in opinion that hurts Trump in other key swing states such as Florida, North Carolina, or Arizona. The "Blue Collar Democrat" scenario, for instance, merely requires that white non-college-educated voters return to their 2012 level of support for Democrats. Joe Biden is the logical candidate, health permitting, as he is from Pennsylvania and was literally on the ballot in 2012! Moreover, these states are the easiest to flip to the Democratic side via the woman vote. In Michigan, a 0.5% swing of women to the Democrats would have turned the state blue again; in Pennsylvania that number is 1.6% and in Wisconsin it is 1.7% (Table 4). These are the lowest of any state. Women from the Midwest or with a base in the Midwest - such as Michelle Obama or Oprah Winfrey - would also be logical candidates. Table 4Women Voters May Hold The Balance
The 2020 U.S. Election: A "Way Too Soon" Forecast
The 2020 U.S. Election: A "Way Too Soon" Forecast
The Democrats could also pursue a separate or complementary strategy by courting African American turnout and support, especially in Florida, Georgia, and North Carolina. But it is more difficult to flip these states than the Midwestern ones. With the Rust Belt as the fulcrum of his electoral strategy and reelection, Trump has a major incentive to maintain economic nationalism over the coming two years. Trump may be more pragmatic in the use of tariffs, and will certainly engage in talks with China and others, but he ultimately must remain "tough" on trade. He has fewer constraints in pursuing trade war with China than with Europe. For the same Rust Belt reason, the Democrats, if they get into the Oval Office, will not be overly kind to the "butchers of Beijing," as President Clinton called the Chinese leadership in the 1992 presidential campaign (after the 1989 Tiananmen Square incident). Hence we are structurally bearish U.S.-China relations and related assets. Interestingly, if Trump moves to the middle, and tones down "white nationalism" in pursuit of college-educated whites and minorities, then he would have an incentive to dampen the flames of social division ahead of 2020. The key is that in an environment without recession, Trump has the option of courting voters on the basis of his economic and policy performance alone. Whereas if he is seen fanning social divisions, it could backfire, as Democrats could benefit from a sense of national crisis and instability in a presidential election. Either way, culture wars, controversial rhetoric, identity politics, unrest, and violence will continue in the United States as the fringes of the political spectrum use identity politics and wedge issues to rile up voters.The question is how the leading parties and their candidates handle it. What about after 2020? Are there any conclusions that can be drawn regardless of which party controls the White House? The two biggest policy certainties are that fiscal spending will go up and that generational conflict will rise. On fiscal spending, Trump was a game changer by removing fiscal hawkishness from the Republican agenda. Democrats are not proposing fiscal responsibility either. The most likely areas of bipartisan legislation in 2018-20 are health care and infrastructure - returning House Speaker Nancy Pelosi mentioned infrastructure several times in her election-night speech - which would add to the deficit. The deficit is already set to widen sharply, judging by the fact that it has been widening at a time when unemployment is falling. This aberration has only occurred during the economic boom of the 1950s and the inflation and subsequent stagflation beginning in the late 1960s (Chart 14). The current outlook implies a return of the stagflationary scenario. In the late 1960s, the World War I generation was retiring, lifting the dependent-to-worker ratio and increasing consumption relative to savings. Today, as Peter Berezin of BCA's Global Investment Strategy has shown, the Baby Boomers are retiring with a similar impact. Chart 14The Deficit Is Blowing Out Even Without A Recession
The Deficit Is Blowing Out Even Without A Recession
The Deficit Is Blowing Out Even Without A Recession
Trump made an appeal to elderly voters in the midterms by warning that unfettered immigration and Democratic entitlement expansions would take away from existing senior benefits. By contrast, Democrats will argue that Republicans want to cut benefits for all to pay for tax cuts for the rich, and will try to activate Millennial voters on a range of progressive issues that antagonize older voters. The result is that policy debates will focus more on generational differences. Mammoth budget deficits - not to mention trade war - will be good for inflation, good for gold, and a headwind for U.S. government bonds and the USD as long as the environment is not recessionary. The greatest policy uncertainties are health care and immigration. These are the two major outstanding policy issues that Republicans and Democrats will vie over in 2018 and beyond. While President Trump could achieve something with the Democrats on either of these issues with some painful compromises, it is too soon to have a high conviction on the outcome. But assuming that over the coming years some immigration restrictions come into play and that some kind of public health care option becomes more widely available, there are two more reasons to expect inflation to trend upward on a secular basis. Also on a secular basis, defense stocks stand to benefit from geopolitical multipolarity, especially U.S.-China antagonism. Tech stocks stand to suffer due to the trade war and an increasingly bipartisan consensus that this sector needs to be regulated. Matt Gertken, Vice President Geopolitical Strategy mattg@bcaresearch.com Marko Papic, Senior Vice President Chief Geopolitical Strategist marko@bcaresearch.com 1 Furthermore, victories on the state level, if built upon in the 2020 election, could give the Democrats an advantage in gerrymandering, i.e. electoral redistricting, which is an important political process in the United States. 2 Please see Allan J. Lichtman, Predicting The Next President: The Keys To The White House 2016 (New York: Rowman and Littlefield, 2016). 3 Please see Joseph Bafumi, Robert S. Erikson, and Christopher Wlezien, "Balancing, Generic Polls and Midterm Congressional Elections," The Journal of Politics 72:3 (2010), pp. 705-19. 4 Please see footnote 2 above. 5 Please see Sylvan Lane, “Trump says Fed is his ‘biggest threat,’ blasting own appointees,” The Hill, October 16, 2018, available at thehill.com. 6 Please see Rob Griffin, Ruy Teixeira, and William H. Frey, "America's Electoral Future: Demographic Shifts and the Future of the Trump Coalition," Center for American Progress, dated April 14, 2018, available at www.americanprogress.org. 7 In several cases, he did not have to lift white support by as much as we projected because minority support for the Democrats dropped off after Obama left the stage. 8 Interestingly, however, this scenario would result in an electoral college tie! Since the House would then vote on a state delegation basis, it would likely hand Trump the victory (and Pence would also win the Senate). 9 However, if they win Pennsylvania plus one electoral vote in Maine, they can win the electoral college with either Michigan or Wisconsin.
Highlights So What? Chancellor Angela Merkel's decision to step down as party chairperson is positive for European political evolution and thus not a risk to the market. Why? The Christian Democratic Union (CDU) is unlikely to turn Euroskeptic, the median German voter is not. Europhile Green Party is surging, throwing shade at the narrative that Germans are souring on Europe. New elections are unlikely in the next 12 months, neither main centrist party would benefit. Chancellor Merkel's stabilizing role in the Euro Area crisis is overstated. Infusion of new blood is precisely what Germany, and Europe, needs. Also... 2019 will be a big year for Europe with multiple decisions to be taken on governance reforms. New leadership in Berlin is exactly what the doctor ordered. Feature German Chancellor Angela Merkel's Christian Democratic Union (CDU) suffered a deep loss in the Hesse election on October 28. Germany's main centrist parties - the center-right CDU and center-left Social Democratic Party (SPD) - suffered deep losses in Hesse, mirroring the results in Bavaria from October 14 (Chart 1). The results have prompted Angela Merkel to confirm that she will not stand for re-election as chair of the CDU at the Hamburg party convention and that she will not seek any political posts after her current term as chancellor ends in 2021. Chart 1Winners And Losers In Bavaria And Hesse
Merkel's Done. Now What?
Merkel's Done. Now What?
In this Client Note, we examine what Chancellor Merkel's decision means for Germany and Europe. Are Euroskeptics Taking Over Germany? The most important question for global investors is whether Merkel's fall from grace is related to a growing trend of populism in Europe. In part, yes. However, Merkel's problem is deeper. Merkel-fatigue in Germany has deeper roots than her decision on immigration in 2015. Polling suggests that Merkel recovered from that crisis and reached a 70% approval rating in mid-2017, only to see a precipitous decline since (Chart 2). Chart 2Merkel's Political Capital Is Spent
Merkel's Political Capital Is Spent
Merkel's Political Capital Is Spent
That said, German Euroskeptic sentiment is not on the rise (Chart 3). In fact, Germans support the currency union at one of the highest clips in Europe. Furthermore, Germans continue to "feel" European (Chart 4). Chart 3Germans Are Europhile...
Germans Are Europhile...
Germans Are Europhile...
Chart 4...And Feel Quite European
...And Feel Quite European
...And Feel Quite European
In the last two Lander elections in Bavaria and Hesse, the right-wing, Euroskeptic party Alternative for Germany (AfD) underperformed its national polling. Its support in opinion polls, at 16%, appears to be limited by the number of Germans who identify as Euroskeptic, similarly around 14%. In fact, it was the Green Party that surprised in both Bavaria and Hesse, gaining 8.9% and 8.7% respectively. Bottom Line: The short answer is no, Germany is not being taken over by Euroskeptics. True, the 2015 migration crisis has given the AfD a tailwind, allowing it to become entrenched in the political system. Yet just as impressive is the rise of the Europhile Green party (Chart 5). Chart 5Grand Coalition Parties Would Be Crazy To Call A New Election
Grand Coalition Parties Would Be Crazy To Call A New Election
Grand Coalition Parties Would Be Crazy To Call A New Election
OK, But Will The CDU Move To The Right? The previous question was purposely hyperbolic. The more nuanced question is whether the CDU will swing to the right in the face of AfD's rise? The answer depends on the issue. The two key issues are immigration and EU integration. On immigration, it is simply good politics for Germany's center-right party to steal from the AfD platform. The only downside of adopting a right-leaning immigrant policy is that it will make forming coalitions with the surging Green Party more difficult. It was immigration policy that ultimately prevented the so-called Jamaica Coalition - the CDU, the Green Party, and the pro-business and mildly Euroskeptic Free Democratic Party (FDP) - from becoming a fully-fledged ruling coalition in November 2017. This forced Merkel to re-establish the uninspiring Grand Coalition with the SPD.1 On European integration, it is possible that the CDU will adopt more Euroskeptic rhetoric, but such a move could backfire. First, data suggests that Germans continue to support the euro at a high clip. Second, AfD has already captured the "hard Euroskeptic" voters, whereas FDP has captured "soft Euroskeptics." It is unclear if the CDU has any chance of getting any of those voters back by crowding the "Euroskeptic corner." In fact, data from Bavaria and Hesse indicate that the CDU has been losing voters equally to the Green Party and the AfD. From the perspective of the Median Voter Theory, the CDU has a clear path forward. By remaining Europhile and pro-EU, it can ensure that it does not abandon the 83% of Germans who continue to support the currency union. The German median voter clearly does not want to abandon European institutions. But by ditching Merkel's liberal, pro-immigrant policy, the CDU can ensure that it withstands the AfD's attack on its right flank. Bottom Line: Germany's main center-right party has the luxury of picking its battles with the right-wing AfD. We suspect that the CDU will adopt some of the AfD's anti-immigrant rhetoric and policy, but retain its centrism on other issues. Who Will Replace Merkel As The Head Of The CDU? After months of speculation, Chancellor Merkel has confirmed that she will not pursue the CDU chairmanship at the upcoming December 7-8 party conference in Hamburg. Instead, Germany's ruling party will select a new chairperson, one who will be groomed as Merkel's successor for the 2021 election. The process for selecting the CDU chairperson is largely closed and dominated by party elites. The Federal Executive Board of the CDU - which is made up of the chairperson and 39 other members - sits down with the CDU parliamentary faction to approve the candidates, ensuring that a rogue candidate cannot stage a surprise in the delegate vote. It is highly likely that Merkel will be able to hand-pick a successor. Table 1 is our attempt to collate the likeliest candidates to replace Merkel as the head of the CDU. The list includes only one Euroskeptic candidate - former party whip Friedrich Merz who has not sat in the Bundestag since 2009 - and quite a few outright Europhiles. Merkel's preferred candidate is Annegret Kramp-Karrenbauer - often referred to by German media by her acronym AKK - a centrist who is to the left of Merkel on economic policy, EU matters, and social issues. Table 1Potential Merkel Successors
Merkel's Done. Now What?
Merkel's Done. Now What?
Given the short period of time between now and the Hamburg conference, it is highly unlikely that a surprise candidate - such as the Euroskeptic Merz - will emerge victorious. Merkel, for instance, spent months grooming the party rank-and-file prior to her nomination. Bottom Line: Merkel's successor is likely to be hand-picked. Will Merkel Survive Until 2021? Merkel's chances of staying in power until the end of the current government's term will increase if her favored successor - Kramp-Karrenbauer - emerges victorious in December. A win for an outsider, or someone highly critical of Merkel (such as Jens Spahn, who has disagreed with Merkel on immigration), might hasten Merkel's demise. How would such an outcome play out? If Merkel resigns, the Bundestag would have to elect a new chancellor with a simple majority. Given that the CDU currently governs in a coalition with the SPD, the latter party would have to support the election of a new chancellor. Kramp-Karrenbauer would be acceptable to the SPD, but one of the more contentious candidates may not. A new election would require the chancellor - Merkel or her successor - to lose a confidence vote that he or she has called. However, this is a controversial matter constitutionally as the government must claim that it has reached a legislative impasse on a particular issue. (Chancellor Gerhard Schroder argued in 2005 that his economic agenda was stalled.) The other question is why would either of the ruling parties want new elections at this point? Both centrist parties are tanking in the polls, as both Bavarian and Hesse elections signal and as overall polling indicates (see Chart 5). As such, we suspect that a new election will not take place over the next 12 months, at the very least. Bottom Line: Early elections are not easy to arrange and neither of the two ruling parties want one at the moment. Merkel has at least one more year in power. Investment Implications: Does Any Of This Matter? Chancellor Merkel has lost all of her political capital: that much is clear. As such, her decision to begin the process of finding a successor is a positive development, one that political leaders rarely take willingly. Given the election of a Europhile Emanuel Macron in France in 2017, Berlin needs to find a comparable partner that can carry on reforms. Otherwise, Germany risks wasting the window of opportunity afforded by the Macron presidency to make critical changes to Euro Area governance. On the agenda over the next year or two are several important issues. First, the European Stability Mechanism (ESM) is supposed to be granted new powers, evolving it into a kind of European replacement for the IMF. Some argue - including the ESM's leadership - that this expanded role will necessitate a greater injection of capital, for which obviously Berlin must be on board. Second, the stalled Banking Union project requires Berlin's intimate involvement. A deposit insurance union would go a long way toward stabilizing the Euro Area amid future financial crises. Under Merkel, Berlin has been reticent to greenlight such developments. Third, Berlin must agree with EU peers on several important positions after the European Parliament elections in May 2019. These will include staffing the European Commission. According to press reports this summer, Merkel was focused on ensuring that the next president of the European Commission would be a German. To get her way, Chancellor Merkel supposedly indicated that she would not fight to get a German to replace Mario Draghi, whose term at the ECB is set to expire in October 2019. A change at the top in Berlin, particularly if a Euroskeptic takes over the CDU, may signal a reversal of this strategy. That said, what Berlin wants is not necessarily what Berlin will get, no matter who is in charge. Finally, there is the philosophical question of whether Merkel has been a factor of stability for Europe over the past decade. We believe the answer is no. Not for any normative reason but rather because she has been an intently domestic chancellor. Investors have been overstating Merkel's role as the "anchor" of Euro Area stability. She has, in fact, dithered multiple times throughout the crisis. In 2011, for example, Merkel delayed the decision on whether to set up a permanent Euro Area fiscal backstop mechanism due to the upcoming Lander elections in Rhineland-Palatinate and Baden Württemberg. Such delays and hesitations have cost Europe considerable momentum throughout the crisis and since. As such, we believe that Chancellor Merkel's decision presents considerable upside for European politics and limited downside. Infusion of new blood in Berlin is the only way for Europe to restart the stalled governance reforms. However, much will depend on whether the CDU takes a significant turn towards a "softer Euroskeptic" position or maintains its traditional pro-European outlook. Marko Papic, Senior Vice President Chief Geopolitical Strategist marko@bcaresearch.com 1 The name references the colors of the three parties (black for CDU, green for the Green Party, and yellow for the FDP).
Highlights So What? The odds of the Democrats taking the Senate have fallen. Meanwhile China's policy easing will benefit China itself, or consumer goods exporters, more so than other EMs. Why? China is the fulcrum of global macro at the moment - only a sharp spike in credit growth will signal a total capitulation by President Xi Jinping. We are lowering the odds of a Democratic takeover of the House from 70% to 65%, while in the Senate the odds fall from 50% to 40%. Generational warfare is one of our new long-run investment themes - it will help define the 2020 election. Feature Amidst the market correction last week, it was easy for investors to take their eyes off the ball: Chinese policy. Chart 1U.S. Is In Rude Health...
U.S. Is In Rude Health...
U.S. Is In Rude Health...
The ongoing macro environment is one of policy divergence, with the U.S. economy in "rude health," (Chart 1) - to quote BCA's Chief U.S. Strategist Doug Peta - while Chinese growth disappointed under the pressure of macroprudential structural reforms (Chart 2). The dueling policies have converged to produce epic tailwinds for the U.S. dollar (Chart 3) and correspondingly headwinds for global risk assets. Chart 2...But China Still Struggling
...But China Still Struggling
...But China Still Struggling
Chart 3Epic Tailwinds For The Dollar
Epic Tailwinds For The Dollar
Epic Tailwinds For The Dollar
Amidst this backdrop, investors have finally come to terms with the first portion of our thesis: the Fed will respond to robust U.S. growth. Merely weeks ago, markets doubted that the Fed had the temerity to raise interest rates beyond a single hike in 2019. Today, despite President Trump's rhetoric, there is no doubt which way the Fed will guide interest rates next year (Chart 4). Chart 4The Fed Will Keep Hiking
The Fed Will Keep Hiking
The Fed Will Keep Hiking
A surge in expectations for hawkish Fed policy beyond 2018 should be detrimental for global risk assets. A determined Fed, racing to meet the rising U.S. neutral rate, may tighten global monetary policy too much given that the global neutral rate is likely lower. That view would support remaining overweight U.S. assets and underweight EM well into 2019. Chart 5Signs That China Is Stimulating
Signs That China Is Stimulating
Signs That China Is Stimulating
China is the fulcrum upon which this view will balance. Beijing continues to signal policy easing. BCA Foreign Exchange Strategy's "China Play Index" has perked up, suggesting that global assets are sniffing out the bottoming of restrictive policy (Chart 5). Our own checklist, which would falsify our thesis that Chinese policymakers will avoid a stimulus "overshoot," is starting to see some movement (Table 1). Table 1Will China's Policy Easing Produce A Stimulus Overshoot?
The U.S. Midterms And China's Stimulus
The U.S. Midterms And China's Stimulus
If China ramps up stimulus to keep pace with U.S. growth - itself a product of pro-cyclical fiscal stimulus - global risk assets may rally significantly. Our recommendation that investors buy the China Play Index as a portfolio hedge to our bearish view of global risk assets has only returned 0.7% since August 8. China: Credit Data Holds The Key Is it time to ditch the safety of U.S. stocks and embrace ROW? Chart 6What Will September Credit Data Bring?
What Will September Credit Data Bring?
What Will September Credit Data Bring?
No, at least not yet. It is true that China is clearly shifting towards stimulus. As we go to press, the credit data for September has not yet appeared, but a sharp reversal in credit growth will be necessary to convince global markets that Xi Jinping has fully abandoned his efforts to impose more discipline on China's banks, shadow banks, local governments, and local government financing vehicles (Chart 6). It will be crucial to watch for a reversal in non-bank credit growth, which would suggest that Xi is capitulating on shadow banking, which would then imply a larger reflationary push overall (Chart 7). Chart 7Shadow Bank Crackdown To Lighten Up?
Shadow Bank Crackdown To Lighten Up?
Shadow Bank Crackdown To Lighten Up?
The monetary policy setting is currently as easy as in 2016, although there has been no substantive change since July and People's Bank of China chief Yi Gang has signaled that while more can be done, his policy remains "prudent and neutral" (Chart 8). So far this year there have been four cuts to banks' required reserve ratios - it will take additional cuts to signify policy easing beyond expectations as of July (Chart 9). Easier monetary policy implies additional currency depreciation, which could have a reflationary effect. Chart 8Lending Rates Will Decline Substantially If Repo Rates Don't Rise
Lending Rates Will Decline Substantially If Repo Rates Don't Rise
Lending Rates Will Decline Substantially If Repo Rates Don't Rise
Chart 9RRR Cuts Can Continue
RRR Cuts Can Continue
RRR Cuts Can Continue
Local government brand new bond issuance is catching up to the previous two years', despite a late start. We expect this indicator to be abnormally strong in the closing months of the year, making for an overall increase year-on-year (Chart 10). Local governments are responding to the central government's encouragement to borrow and spend more. Chart 10Local Governments Borrowing More
The U.S. Midterms And China's Stimulus
The U.S. Midterms And China's Stimulus
Further, global trade war concerns may abate in the coming months. There is still no guarantee that U.S. President Donald Trump will meet his Chinese counterpart Xi Jinping at the G20 leaders' summit in Argentina at the end of November. Both sides are expected to bring negotiating teams to this meeting if it goes forward. While no formal talks have taken place since August 23, Treasury Secretary Steven Mnuchin did meet with China's central bank Governor Yi Gang on the sidelines of the World Bank Annual Meeting in Bali, Indonesia. They discussed China's foreign exchange policy and the potential meeting between Trump and Xi. Our structural view is that the Sino-American tensions are hurtling towards a modern version of a Cold War. However, that structural view can have cyclical deviations. A pause in U.S.-China acrimony - though not a reversion to status quo ante - could manifest by the end of the year. Chart 11U.S. Is Winning The Trade War...
U.S. Is Winning The Trade War...
U.S. Is Winning The Trade War...
Trade policy uncertainty has greatly favored U.S. assets relative to global, both in terms of equities (Chart 11) and the U.S. dollar (Chart 12). Even a temporary truce, if combined with further Chinese stimulus, could reverse the trend. Chart 12...And So Is The U.S. Dollar
...And So Is The U.S. Dollar
...And So Is The U.S. Dollar
As such, we can see a temporary pullback in our central thesis of policy divergence, one that benefits global risk assets in the immediate term. However, we caution investors from believing that a structural shift is in place that favors EM and high-beta assets. Put simply, we doubt that China will stimulate as aggressively as it did in 2016, 2012, or 2009 (Chart 13). There is just too much political capital already sunk into macroprudential reforms. Beijing policymakers are therefore sending mixed signals, both looking to stabilize growth rates and contain leverage. Chart 13Expect A Weaker Jolt This Time
Expect A Weaker Jolt This Time
Expect A Weaker Jolt This Time
Several clients have pointed out that the pace and intensity of stimulus is not important. Even a modest turn in Chinese policy will be a strong catalyst for global risk assets at the moment given that the context of 2018-2019 is much more favorable than 2015-2016. In other words, the world is not facing a global manufacturing recession precipitated by a historic decline in commodity prices as it was in 2015. Today, the world needs a lot less from China to spark a cyclical recovery. We are not so sure. First, the big difference between 2015-2016 and today is not the health of the global economy but the health of the U.S. economy and the fact that the Fed is much further along in its tightening cycle. In 2016, the Fed took a 12-month vacation after hiking rates in December 2015, as the amount of slack in the U.S. economy was much larger (Chart 14). Today, the market has begun to price in expectations of further rate hikes in 2019. Chart 14Output Gap Is Closed
Output Gap Is Closed
Output Gap Is Closed
Second, China's foreign exchange policy could still prove globally deflationary. China faces an exogenous risk today - the trade war - that it did not face in 2015-16. At that time the currency fell amidst financial turmoil, capital outflows, and policy devaluation. But it bottomed in late 2016 after the PBoC defended it robustly, the government imposed strict capital controls, and stimulus stabilized growth. Today the CNY has come under downward pressure again from slower growth, easing monetary policy, and manipulation to retaliate against U.S. tariffs. Despite capital controls, the one year swap-rate differential between China and the U.S. appears to be leading CNY/USD further downward (Chart 15). Given that China's current policy easing is heavily reliant on monetary easing, CNY/USD has more downside. Chart 15Interest Rate Differentials And CNY-USD: A Tight Link
Interest Rate Differentials And CNY-USD: A Tight Link
Interest Rate Differentials And CNY-USD: A Tight Link
Chinese currency trajectory is therefore an important gauge for global investors. Downside beyond the psychological barrier of 6.9-7.0 CNY/USD will at some point have a deflationary rather than reflationary global impact. The PBoC may hold the line and prevent further depreciation, in which case any additional stimulus measures will reinforce this line. But if China adopts more aggressive fiscal and credit stimulus and yet the currency still depreciates due to the U.S. conflict, then China's import demand will not rise by as much as the stimulus would imply. Domestic sentiment will worsen, causing capital outflow pressure to rise, and EM currencies and global growth expectations will suffer. As such, we prefer to play Chinese stimulus through exposure to Chinese equities (ex-tech) relative to other EM equities. Chinese stimulus, we argue, will stay in China, rather than rescue global risk assets. Within EM ex-China, we generally prefer equity indices that are exposed to the Chinese consumer over those exposed to resource-oriented "old China." A key point about China's current policy easing is the use of tax cuts more so than credit-fueled infrastructure construction: the goal of the reform agenda is to boost the consumption share of the economy. As such, we have been recommending that clients overweight South Korea and Malaysia relative to EM benchmarks. Bottom Line: Chinese policy is the fulcrum upon which global policy divergence will turn. If Chinese stimulus overshoots, investors should expand beyond the safety of U.S. assets and spring for global risk assets. At the moment, our view is that Chinese stimulus will not cause global economies to re-converge. Instead, it will benefit Chinese equities relative to other EM plays, and EM markets that export consumer goods to China. Overall, however, we remain cautious on global risk assets. Midterm Update: Did Trump Declare A Generational War? Chart 16GOP Improves In Key Senate Races
The U.S. Midterms And China's Stimulus
The U.S. Midterms And China's Stimulus
The Democratic Party's midterm election strategy of opposing Supreme Court Justice Brett Kavanaugh's nomination has failed to work in key Senate races, where President Trump has rallied his base in reaction to the contentious nomination hearings. Polls now indicate that several Republican Senate candidates are in the lead, including the three that we are watching most closely: Tennessee, Arizona, and Nevada (Chart 16). Our own Senate model, which has been generous to Democrats, now sees Arizona, Tennessee, and Missouri as likely going to the Republican Party (Chart 17). Nevada is still projected to flip to the Democratic Party, but the GOP retains the current 51-49 Senate makeup. Chart 17Our Model Suggests Senate Race Will Be A Wash
The U.S. Midterms And China's Stimulus
The U.S. Midterms And China's Stimulus
Political betting markets have sniffed out the shift in Senate polls, with the probability of the GOP maintaining control of the Senate now soaring to above 80%. However, the odds of retaining the House have actually reversed after initial gains in October (Chart 18). Why? Chart 18Republican Odds Surge For Senate
Republican Odds Surge For Senate
Republican Odds Surge For Senate
First, because President Trump remains unpopular despite the surge of support for GOP Senate candidates in some states (Chart 19). Second, the generic ballot continues to give Democrats a robust lead of 7.3% (Chart 20). The lead has narrowed from a high of 9.5% in early September, but does not suggest that Republicans will benefit in the House as much as in the Senate. Chart 19Trump Still Has Popularity Deficit
Trump Still Has Popularity Deficit
Trump Still Has Popularity Deficit
Chart 20Democrats' Robust Lead In Generic Polls
Democrats' Robust Lead In Generic Polls
Democrats' Robust Lead In Generic Polls
Third, Justice Kavanaugh is now sitting on the Supreme Court! Had his nomination been stalled or outright rejected, the anger of the GOP base would have been more sustainable and broad-based going into the voting booth. The paradox for President Trump is that by winning the Supreme Court battle, the shot of adrenaline to the GOP base has been expended. Nonetheless, the fight itself shows yet again that anger works as an election strategy. After all, as counterintuitive as it may seem, there is no evidence that economic performance helps win midterm elections. Our research actually suggests that there is a mildly negative correlation between economic performance and congressional election performance (Chart 21). Voters only vote with their stomachs when they are hungry. Chart 21Strong Economy Won't Save The GOP In The House Of Representatives
The U.S. Midterms And China's Stimulus
The U.S. Midterms And China's Stimulus
Midterm voters tend to be motivated by non-economic issues. With the Supreme Court settled in favor of the GOP base, the question arises: Is Trump out of ways to motivate his base with anger? Maybe not (there is still a Wall to be built!), but it may be too late to rally the GOP base sufficiently by November 6. The House appears to be lost, especially if GOP polling momentum stalls at its current level. However, the two parties have given us a glimpse into their strategies for 2020 - outrage versus outrage. President Trump, in an op-ed for USA Today, blasted the Democratic Party as a party of "open border socialism" that seeks to "model America's economy after Venezuela."1 Specifically, he cited plans by the Democratic Party to reform healthcare in such a way as to transfer the benefits that seniors currently enjoy under Medicare to the rest of the population, ending Medicare benefits in the process. The veracity of President Trump's claims is beyond the scope of this report - and has been covered extensively by the media. What is important is that President Trump may have revealed his strategy for 2020: Generational Warfare. Chart 22Here Comes Generational Warfare
Here Comes Generational Warfare
Here Comes Generational Warfare
Investors caught glimpses of this strategy in 2016, when Vermont Senator Bernie Sanders appealed directly to Millennial voters in his surprisingly robust battle against Secretary Hillary Clinton. For Democrats, appealing to Millennials is a no brainer. First, they are the largest voting bloc in the country (Chart 22). Their numbers relative to Baby Boomers will necessarily grow. Chart 23Beware The Crisis Of Expectations
Beware The Crisis Of Expectations
Beware The Crisis Of Expectations
Second, the share of 30-year-olds earning more than their parents at a similar age has fallen by nearly half (Chart 23). Despite the poor economic situation of today's youth, government spending continues to accrue mainly to the elderly (Chart 24). Chart 24Get Grandma!
The U.S. Midterms And China's Stimulus
The U.S. Midterms And China's Stimulus
The problem for Democrats is that the more they appeal to the youth, the more likely that President Trump's charges of socialism will ring true. After all, the 18-29 age cohort has more favorable views of socialism than capitalism (Chart 25). Yes, even in America! Chart 25Uh-Oh...
The U.S. Midterms And China's Stimulus
The U.S. Midterms And China's Stimulus
Where does this leave investors? First, American politics is no longer merely ideologically polarized. In 2020, we expect generational polarization to emerge as a major theme. Second, the kind of Generational Warfare practised by President Trump leaves no room for cuts to public services. Trump is not opposing Democratic "open border socialism" with traditional, centrist, Republican calls for entitlement reform. Instead, he is casting himself as a champion and defender of Baby Boomer entitlements, which, as Chart 24 clearly illustrates, leave spending on the youth in the dust. The point is that President Trump is not preaching fiscal conservativism. There is no room for entitlement reform in the new GOP. Generational Warfare will simply seek to prevent Democrats from shifting more benefits to the non-Baby Boomer share of the population by preserving the already unsustainable Baby Boomer entitlements. BCA Research's House View sees 2020 as the likeliest date for the next U.S. recession. At the end of 2020, The Congressional Budget Office projects that the U.S. budget deficit will be around 5% (Chart 26). Given that the last four recessions raised the U.S. budget deficit by an average of 5% of GDP, it is safe to say that the U.S. budget deficit may rise to 2010 levels after the next downturn. Chart 26U.S. Deficits Will Be Extremely Large For A Non-Recessionary Period
U.S. Deficits Will Be Extremely Large For A Non-Recessionary Period
U.S. Deficits Will Be Extremely Large For A Non-Recessionary Period
Given President Trump's and the Democratic Party's focus on Generational Warfare, it is unlikely that entitlement reform will occur proactively either before or after the next recession. This suggests that bond yields could rise significantly after the next downturn. Bottom Line: Our baseline odds for the midterm recession are due for an adjustment. We are lowering the odds of a Democratic House takeover to 65% (from 70%) and of a Senate takeover to 40% (from 50%). President Trump's USA Today op-ed signals a turn towards Generational Warfare. Neither the GOP nor the Democratic Party are interested in entitlement reform. The former, under Trump, seeks to preserve the already unsustainable Baby Boomer benefits, while the latter seeks to expand them to the rest of the population. The 2020 election may be fought along the lines of who is more profligate toward their base. Marko Papic, Senior Vice President Chief Geopolitical Strategist marko@bcaresearch.com Matt Gertken, Vice President Geopolitical Strategy mattg@bcaresearch.com 1 Please see "Donald Trump: Democrats Medicare for All plan will demolish promises to seniors," published by USA Today, dated October 12, 2018.
Jair Bolsonaro, an ex-army captain and a right-leaning, law-and-order candidate has won a surprising victory in the first round of the Brazilian presidential election (Chart I-1). Bolsonaro came within striking distance of 50%, but did not cross that threshold, which means that the second round will go ahead on October 28. Given that he only needs another 4% to gain a majority of votes, his victory in the second round is now the most likely outcome by far. Importantly, the results of the congressional election similarly saw a swing to the right in both legislative houses. Chart I-1Bolsonaro Outperformed In The First Round
Brazil: A Regime Shift? (Special Report)
Brazil: A Regime Shift? (Special Report)
What are the prospects for pro-market structural reforms amid this apparent regime shift in Brazilian politics? How should investors be positioned over the coming months? In the short term, a Bolsonaro presidency will boost business and market sentiment. This is mainly due to the right-leaning balance of parties in Congress and hence Bolsonaro's ability to form a majority coalition. This should lead to an outperformance of Brazilian assets relative to EM on expectations of reforms being passed and implemented. BCA's Emerging Markets Strategy service recommends upgrading Brazil to an overweight within EM equity, credit, and local fixed-income portfolios. However, in the longer term, we expect that Bolsonaro's presidency will still be constrained on social security reforms. It is still not clear if Brazil's median voter is demanding the kind of policies touted by Bolsonaro's economic advisors. Given Bolsonaro's populism, he may not be willing to expend his political capital on painful and unpopular reforms. In light of this, investors with a 2-5 year horizon should be wary of increasing their absolute exposure to Brazilian assets. Private investors looking for long-term exposure to Brazil should be especially concerned about Bolsonaro's anti-democratic, pro-military inclinations. A New Political Regime... Bolsonaro outperformed expectations in the first round by winning 46% of the popular vote, soundly beating his main rival Fernando Haddad of the left-wing Worker's Party. Polls over the past few weeks had seen him pegged at around 30%. Yet, Sunday night's results showed Bolsonaro beating all pollsters' expectations and nearly gaining the victory in the first round. Table I-1First Round Turnout Was Low In Contrast To Pass Elections
Brazil: A Regime Shift? (Special Report)
Brazil: A Regime Shift? (Special Report)
Notably, and in contrast to previous elections, overall turnout for the first round was low, standing at just 79% (Table I-1). This played into Bolsonaro's hands. Even though there will be strategic voting in the second round - and our expectation is that most left-leaning voters will switch to Haddad, the remaining left-wing candidate - Haddad's chances look slim. He needs a mass wave of Lula supporters to turn out for the vote. The fact that they did not in the first round bodes ill for him. Thus, Bolsonaro stands at strong odds of becoming Brazil's next president. Attention will turn to the mandate that Bolsonaro will receive over the next four years. In our view, the factors below will be key: Short-term constraints have fallen off: The surprising surge in right-leaning parties at the congressional level suggests that President Bolsonaro will have no immediate legislative constraints to his agenda. He will be free to pursue his policy preferences relatively unimpeded. Chart I-2Chamber Of Deputies Results
Brazil: A Regime Shift? (Special Report)
Brazil: A Regime Shift? (Special Report)
This is due to both legislative houses shifting towards the right, giving Bolsonaro a mandate to form a majority right-wing government for the first time since 1998 (Chart I-2). So far, 63% of seats in the lower house have gone to center-right and right-wing parties (according to our back-of-the-envelope calculation). If all of these parties joined into a coalition it would represent a historically strong mandate. Markets will surely interpret this as a positive development. However, not all of these parties will necessarily join Bolsonaro. Moreover, reforms requiring a constitutional amendment, such as the all-important reform of Brazil's unsustainable pension system, would require a supermajority of 308 out of 513 seats (60%) in the lower house. Historically, this has proven difficult, and it will be especially tricky for a president with no executive experience, little legislative record, and who denounces the use of pork-barrel spending.1 Otherwise, Congress can ultimately be cajoled into following Bolsonaro. As such, for the first time since Lula's first election (2002 to 2006), the Brazilian president is well-positioned to pursue his agenda. Bolsonaro will likely initiate some easy supply-side policies like cutting corporate taxes and red tape for businesses. Besides, business sentiment could surge due to the emergence of a business-friendly government. Hence, Bolsonaro has some short-term, easy "boosters" before the long-term challenges resurface. Long-term constraints uncertain: Despite the above, the pace of reforms will be slow given that Bolsonaro is, in the end, a populist who will want to maintain power above all. We continue to doubt Bolsonaro's willingness and ability to pursue social security reforms. We suspect that the vast majority of his voters chose to cast their ballot due to his law-and-order agenda that included a focus on battling crime and corruption. His economic advisor, Paulo Guedes, spent more time touting his reformist credentials in foreign financial publications than on the campaign trail. As such, it is difficult to conclude that Bolsonaro actually has a strong mandate for painful pension reforms. Polls ahead of the election suggest that only 4% of the public wants pension reforms (Chart I-3). Chart I-3Brazil's Population Is Not Open To Fiscal Austerity
Brazil: A Regime Shift? (Special Report)
Brazil: A Regime Shift? (Special Report)
Chart I-4The J-Curve Of Structural Reform
Brazil: A Regime Shift? (Special Report)
Brazil: A Regime Shift? (Special Report)
That said, we are open-minded and willing to be proved wrong. If Bolsonaro supports very dramatic reforms in his first 12 months in office, when his political capital is strongest, he could pull through despite the likely opposition from the median voter. As our J-Curve Of Structural Reform suggests, Bolsonaro can survive the "danger zone" if he pushes ahead with painful reforms right away (Chart I-4). He will start with sufficient political capital to do so. For long-term investors, the chief question is this: Is Bolsonaro a Brazilian Ronald Reagan or merely a Brazilian Rodrigo Duterte? Judging from everything he himself - not his advisors - has said in the past and on the campaign trail, we would bet on the latter. ...But The Same Economic Problems Brazil is getting a new government, but the macro economic challenges remain the same. Namely, ballooning public debt, still high interest rates and an unsustainable pension system (Chart I-5). As discussed above, it is not evident that Bolsonaro will strive to enact major cuts in the social security system that would be very unpopular. Apart from pensions and privatization, other choices to tackle the unsustainable public debt dynamics include reducing interest rates and boosting nominal growth (Chart I-6). Bolsonaro's economic team has repeatedly discussed the need to reduce high interest rates. Chart I-5Much Needed Pension Reform!
Much Needed Pension Reform!
Much Needed Pension Reform!
Chart I-6Brazil's Macro Distortions
Brazil's Macro Distortions
Brazil's Macro Distortions
Chart I-7The Real Is Still At Risk Of Depreciation
The Real Is Still At Risk Of Depreciation
The Real Is Still At Risk Of Depreciation
Rapid and large interest rate cuts by the central bank will help to service the public debt given that 96% of public debt is in local currency. Yet, lower interest rates could put pressure on the currency to depreciate - the interest rate differential between Brazil and the U.S. is at all-time lows (Chart I-7). Meanwhile, a weaker currency is needed to increase nominal growth. Notably, extremely low inflation and weak nominal growth have worsened the nation's public debt dynamics in recent years. Overall, lower policy rates and currency devaluation are required to reflate Brazil out of a public debt trap. If the exchange rate stabilizes in the short run as foreign investors come back to Brazil, the central bank will reduce interest rates considerably. Lower borrowing costs in combination with a sharp rise in business confidence and existing pent-up investment demand will propel capital spending, employment and overall growth. In short, these are necessary conditions for Brazilian markets to outperform their EM peers, i.e., for relative outperformance. As to absolute performance, it also depends on the outlook for global markets. In a complete global risk-off mode (the odds of which are considerable at the moment) - in which EM currencies and risk assets continue rioting and U.S. share prices drop - it will be difficult for Brazilian risk assets to rally meaningfully. That said, they will still outperform their EM peers. In the long run, pursuing policies of lower-than-needed interest rates and, hence, of chronic currency depreciation appears to be more palatable to Bolsonaro's populist credentials than difficult structural reforms. Therefore, investors who look to commit long-term capital to Brazil should mind the exchange rate. Populist policies favoring nominal growth in the long run lead to chronic currency depreciation. Bottom Line: Bolsonaro's election and his initial policies will be cheered by markets and will help Brazilian markets to outperform their EM peers for now. However, Bolsonaro is a populist and in the long term will choose economic policies that favor high nominal growth and, thereby, warrant chronic currency depreciation. Investment Recommendations Chart I-8Overweight Brazilian Assets Relative To EM
Overweight Brazilian Assets Relative To EM
Overweight Brazilian Assets Relative To EM
In terms of market recommendations, we have the following: For EM dedicated portfolios, we recommend upgrading Brazil to overweight within the equity, credit, and local currency bonds universes (Chart I-8). BCA's Emerging Market Strategy service is taking a 14% profit on its structural short BRL versus USD position. Also, we are closing the short BRLMXN and short BRLARS trades with a 12% gain and a 5.7% loss, respectively. We also recommend closing the short Brazilian bank stocks trade initiated on May 16, 2018, as its return is now flat due to the recent rebound over the past few days. Absolute performance of Brazilian risk assets is contingent on global financial markets sentiment and at the moment odds of global risk off are considerable. This could cap the rally in Brazilian risk assets for now. Long-term investors should realize that timing Brazilian markets in general, and the exchange rate in particular, will be critical to protect gains. We believe that the path of least resistance for Bolsonaro and his team will be to depreciate the currency and engender nominal GDP growth in order to inflate away the country's public debt. This is a smart strategy for which they have a political mandate. But it will be a death-knell for foreign investors with major positions in the country. Andrija Vesic, Research Analyst andrijav@bcaresearch.com Arthur Budaghyan, Senior Vice President Emerging Markets Strategy arthurb@bcaresearch.com Marko Papic, Senior Vice President Chief Geopolitical Strategist marko@bcaresearch.com Matt Gertken, Vice President Geopolitical Strategy mattg@bcaresearch.com Footnotes 1 In late 1998, for instance, even President Cardoso's own PSDB party deprived him of the votes needed to seal a painstakingly negotiated deal with the IMF, which led to a loss of confidence among creditors and a sharp devaluation of the real in January 1999.
Highlights So What? Go long Brent / short S&P 500. The risk of a recession in 2019 is underappreciated. Why? The likelihood is increasing of a geopolitically-induced supply-side shock that pushes crude prices above $100 per barrel in the coming 6-12 months. Oil supply disruptions in Iran, Iraq, and Venezuela represent the primary source of risk. Historically, the combination of Fed rates hike and an oil price spike has preceded 8 out of the last 9 recessions. Also... A recession in 2019, ahead of the 2020 election, would set the stage for a confrontation between Trump and the Fed, adding fuel to market volatility. Feature Geopolitical tensions are brewing from the Strait of Hormuz to the Strait of Malacca. As we go to press, news is breaking that a Chinese naval vessel almost collided with the USS Decatur as the latter conducted "freedom of navigation" operations within 12 nautical miles of Gaven and Johnson reefs in the Spratly Islands. Given the trade tensions between China and the U.S., this alleged maneuver by the Chinese vessel suggests that Beijing is not backing off from a confrontation. Our view remains that Sino-American trade tensions can get a lot worse before they get better. The latest incident, which builds on a series of negative gestures recently in the South China Sea, suggests that both sides are combining longstanding geopolitical tensions with the trade war. This will likely encourage brinkmanship and further degrade U.S.-China relations. Yet China-U.S. tensions are not the only concern for investors in 2019. Another crisis is brewing in the Middle East, with the potential to significantly increase oil prices over the next 12 months. U.S. households may have to deal with a double-whammy next year: higher costs of imported goods as the U.S.-China trade war rages on and a significant increase in gasoline prices. In this report, we discuss this dire outlook. The Folly Of Recession Forecasting In mid-2017, BCA Research published two reports, one titled "Beware The 2019 Trump Recession" and another titled "The Timing Of The Next Recession."1 Both argued that if the Federal Reserve kept raising rates in line with the FOMC dots, then monetary policy would move into restrictive territory by early 2019 and increase the likelihood of recession thereafter. We subsequently adjusted the timing of our recession forecast to 2020 or beyond, based on a more positive assessment of the U.S. economy. In this report, we explore a risk to the BCA House View on the timing of the next recession. As BCA's long-time Chief Economist Martin Barnes has said, predicting recessions is a mug's game. There have been eight recessions in the past 60 years (excluding the brief 1980-81 downturn) and the Fed failed to forecast all of them (Table 1). Table 1Fed Economic Forecasts Versus Outcomes
2019: The Geopolitical Recession?
2019: The Geopolitical Recession?
The Atlanta Fed produces a recession indicator index which is designed to highlight the odds of recession based on trends in recent GDP data. At the moment, the indicator is at a historically sanguine 2.4%. Unfortunately, low readings are not a reliable cause for optimism. The 1974-75, 1981-82, and 2007-09 recessions were all severe and the Atlanta Fed's recession indicator had a low reading of 10%, 1.6%, and 7.7%, respectively - just as the recession was about to begin (Chart 1). Chart 1The Market Is Not Expecting A Recession
The Market Is Not Expecting A Recession
The Market Is Not Expecting A Recession
The 1974-75 recession is instructive, given the numerous parallels with the current environment: Energy Geopolitics: The 1973 oil crisis caused a massive spike in crude prices. This point is especially pertinent since the 1973 oil embargo is widely viewed as an important contributor to the 1974-75 recession. Real short rates had risen and the yield curve had inverted long before oil prices spiked, so recession was almost inevitable even without the oil price move. But the oil spike made the recession much deeper than otherwise. Protectionism: President Nixon imposed a 10% across-the-board tariff on all imports into the U.S. in 1971 to try to force trade partners to devalue the U.S. dollar. Dislocation: Competition from newly industrialized countries - Japan and the East Asian tigers in particular - laid waste to the steel industry in the developed world. Polarization: President Nixon polarized the nation with both his policies and behavior, leading to his resignation in 1974. Given the exogenous and geopolitical nature of oil supply shocks, today's recession indicators are missing a critical potential headwind to the economy. A geopolitically induced oil-price shock could create more pain than the economy is able to handle. Why An Oil Price Shock? America's renewed foray into the politics of the Middle East will unravel the tenuous equilibrium that was just recently established between Iran and its regional rivals. The U.S.-Iran détente that produced the signing of the 2015 Joint Comprehensive Plan of Action (JCPA) created conditions for a precarious balance of power between Israel and Saudi Arabia on one side, and Iran and its allies on the other side. This equilibrium led to a meaningful change in Tehran's behavior, particularly on the following fronts: The Strait of Hormuz: Tehran ceased to rhetorically threaten the Strait as soon as negotiations began with the U.S. (Chart 2). Since then, Iran's capabilities to threaten the Strait have grown, while the West's anti-mine capabilities remain unchanged.2 Iraq: Iran directly participated in the anti-U.S. insurgency in Iraq. Tehran changed tack after 2013 and cooperated closely with the U.S. in the fight against the Islamic State. In 2014, Iran acquiesced to the removal of the deeply sectarian, and pro-Iranian, Prime Minister Nouri al-Maliki. Bahrain and the Saudi Eastern Province: Iran's material and rhetorical support was instrumental in the Shia uprisings in Bahrain and Saudi Arabia's Eastern Province in 2011 (Map 1). Saudi Arabia had to resort to military force to quell both. Since the détente with the U.S. in 2015, Iranian support for Shia uprisings in these critical areas of the Persian Gulf has stopped. Chart 2Geopolitical Crises And Global Peak Supply Losses
2019: The Geopolitical Recession?
2019: The Geopolitical Recession?
Map 1Saudi Arabia's Eastern Province Is A Crucial Piece Of Real Estate
2019: The Geopolitical Recession?
2019: The Geopolitical Recession?
Put simply, the 2015 nuclear deal traded American acquiescence toward Iranian nuclear development in exchange for Iran's cooperation on a number of strategically vital regional issues. By unraveling that détente, President Trump is upending the balance of power in the Middle East and increasing the probability that Iran retaliates. Since penning our latest net assessment of the U.S.-Iran tensions in May, Iran has already retaliated.3 Our checklist for "kinetic" conflict has now risen from zero to at least 15%, if not higher (Table 2). We expect the probability to rise once the U.S. starts implementing the oil embargo in November. This will dovetail our Iran-U.S. decision tree, which sets the subjective probability of kinetic action by the U.S. against Iran at a baseline of 20% (Diagram 1). Table 2Will The U.S. Attack Iran?
2019: The Geopolitical Recession?
2019: The Geopolitical Recession?
Diagram 1Iran-U.S. Tensions Decision Tree
2019: The Geopolitical Recession?
2019: The Geopolitical Recession?
Bottom Line: The premier geopolitical risk to investors in 2019 is that President Trump's maximum pressure tactic on Iran spills over into Iraq, causing a loss of supply from the world's fifth-largest crude producer.4 We expect the U.S. oil embargo against Iran to remove between 1 million and 1.5 million barrels per day from the market. In addition, the loss of Iraqi production due to sabotage could be anywhere between 500,000 and 3.5 million barrels per day. Added to this total is the potential loss of Venezuelan exports due to the deteriorating situation there. When our commodity team combines all of these factors, they generate a worst-case scenario where the price of crude rises to $110 per barrel in 2019 or higher (Chart 3). And this scenario assumes that EMs do not reinstitute energy subsidies (and therefore their consumption falls faster than if they do reinstitute them). Chart 3Worst-Case Scenario Propels Oil Price Toward 0/Barrel
Worst-Case Scenario Propels Oil Price Toward $110/Barrel
Worst-Case Scenario Propels Oil Price Toward $110/Barrel
The Ayatollah Recession We believe that the midterm election is a dud from an investment perspective, no matter the outcome. However, the election does matter as a hurdle that, once cleared, will allow President Trump to renew his "maximum pressure" tactic against China, Iran, and perhaps domestic tech corporations.5 Iran is a critical risk in this strategy. If President Trump applies maximum pressure on Iran, then a reduction in crude exports from Iran, Iranian retaliation in Iraq, and the simultaneous loss of Venezuelan supplies could combine to increase the likelihood of U.S. recession in 2019. Readers might recall that no sitting president has gotten re-elected during a recession. Why would Trump pursue a policy that risks his re-election chances in 2020? Surely he would deviate from his maximum pressure tactic if faced with the prospect of a recession. However, it is folly to assume that policymakers are perfectly rational, or fully informed. American presidents are some of the most unconstrained policymakers in the world, given both the hard power of the United States and the constitutional lack of constraints on the president when it comes to national security. Trump may believe, for instance, that the 660 million barrels of crude in America's Strategic Petroleum Reserve can offset the impact of sanctions against Iran.6 Or he may believe that he can force OPEC to supply enough oil to offset the Iranian losses. The problem for President Trump is that Iran is not led by idiots. Iranian policymakers understand that the best way to reduce American pressure is to induce an oil price spike in the summer of 2019 that hurts President Trump's re-election chances, forcing him to back off. As such, sabotaging Iraqi oil exports, which mainly transit through the port of Basra - a city highly vulnerable to Shia-on-Shia violence that is already a risk to the country's stability - would be an obvious target. An oil price spike would serve as a negotiating tool against the U.S., and the additional revenue would help replace what Iran loses due to the embargo. Tehran and Washington will therefore play a game of chicken throughout 2019, and there is a fair probability that neither side will swerve. President Trump may be making the same mistake as many predecessors have made, assuming that the Iranian regime is teetering at a precipice and that a mere nudge will force the leadership to negotiate. Oil price shocks and recessions have a historical connection. In a recent report, our commodity strategists highlighted that a spike in oil prices preceded 10 out of the past 11 recessions in the U.S. since 1945 (Table 3). Admittedly, not all spikes were followed by recession. The combination of an oil price spike and Fed rate hikes has produced a recession 8 out of 9 times.7 If oil prices rose to $100 per barrel in the coming 6-12 months, there will be several negative macro consequences. In particular, gasoline prices will rise back toward $4 per gallon (Chart 4). Retail gasoline prices have already increased by more than 50% since they bottomed in February 2016. So how much more upside can the U.S. private sector take? Table 3History Of Oil Supply Shocks
2019: The Geopolitical Recession?
2019: The Geopolitical Recession?
Chart 4A Source Of Pressure For Consumers
A Source Of Pressure For Consumers
A Source Of Pressure For Consumers
The Household Sector Consumer confidence is currently near all-time highs, which tends to signal that the path of least resistance is flat or down (Chart 5). Household gasoline consumption has already declined in response to higher oil prices since the middle of 2017. Given that gasoline demand is relatively inelastic, consumers may already be near their minimum consumption level. Chart 5Nearing All-Time Highs
Nearing All-Time Highs
Nearing All-Time Highs
Instead, households will experience a decline in their disposable income. This will come on the back of both higher gasoline prices and an increase in the prices of other goods and services, as the oil spike spills across sectors. U.S. households - and most likely those in other markets - are stretched to the limit already. A recent Fed survey found that 40% of U.S. households do not have the funds needed to meet an unexpected $400 cost in any given month.8 Such an unexpected expense would require them to either sell possessions, borrow, or cut back on other purchases. Chart 6Most Americans Cannot Cut Saving To Spend
Most Americans Cannot Cut Saving To Spend
Most Americans Cannot Cut Saving To Spend
Left with few other options, households would react to their lower disposable income by reducing demand for other goods and services. This dent in consumer spending would bring down aggregate demand, leading to slower employment growth and even less income and spending. Households could save less to maintain their current purchasing levels, given the recent rise in the savings rate (Chart 6). But this is unlikely. Although the household savings rate has increased in recent years, we have previously argued that a material part of the increase was driven by small business-owner profits. These owners have much higher levels of income than the median consumer. For Americans living paycheck-to-paycheck, it would be difficult to reduce a savings rate that is already close to, or below, zero. Higher oil prices will also hurt growth in Europe and Japan, economies that are already struggling to gain economic momentum after grappling with a weaker growth impulse from China. In addition, EM economies that took the opportunity to reform their oil subsidies amid lower oil prices post-2014 will have to grapple with a much larger shock to consumers than usual. The Corporate Sector In theory, what consumers lose from rising oil prices, producers of crude can gain in stronger revenue. This is especially important in the U.S. as domestic energy production has increased significantly over the past 10 years. Nonetheless, the oil and gas extraction sector accounts for just 1.1% of GDP and 0.1% of total employment. The marginal propensity to spend out of every dollar of income is lower for producers than consumers. Moreover, if consumer confidence fell and consumer spending weakened, non-energy capex would decline as businesses reassessed household demand and held off from making investment decisions. Small business confidence is at record highs, and as with consumer confidence, vulnerable to downward revisions (Chart 7). Chart 7Dizzying Heights
Dizzying Heights
Dizzying Heights
Chart 8Only One Way To Go (Down)
Only One Way To Go (Down)
Only One Way To Go (Down)
Profit margins remain at a highly elevated level and also have only one way to go (Chart 8). If high oil prices should combine with rising borrowing costs and upward pressure on wages (which could develop in this macro environment) the result would be a triple hit to margins (Chart 9). Of course, rising wages would give consumers some offset to higher oil prices, so the question will be the net effect of all variables. And if the dollar bull market continues, as our FX team believes it will, the combination of higher oil prices and a strong USD would hurt U.S. companies with international exposure. The debt load held by the U.S. corporate sector would turn this bad dream into a nightmare. Many American companies have spent the past 10 years increasing leverage to buy back equity (Chart 10). Companies with high debt would need to revise down their profit expectations, with potentially devastating consequences. Elevated debt levels also increase the likelihood of financial market stress if bond investors get worried and spreads begin to widen significantly. Chart 9Rising Pressures On Earnings?
Rising Cost Pressures On Earnings
Rising Cost Pressures On Earnings
Chart 10Large Corporate Debts
Large Corporate Debts
Large Corporate Debts
According to all measures, U.S. stocks are at or near their all-time valuation peaks. Investors have also priced in a significant amount of optimism for profit growth (Chart 11). These expectations would be subject to quick revision if our oil shock scenario plays out. In other words, investor expectations for profit margins are not sufficiently factoring the triple hit of higher oil prices, higher interest rates, and higher wages. Chart 11The Market Has High Hopes
The Market Has High Hopes
The Market Has High Hopes
An additional geopolitical risk on the horizon for 2019 is the creeping "stroke of pen" risk from potential regulation of technology enterprises. This is unrelated to an oil price spike (other than that it would be an effect of U.S. policy) but could nonetheless combine with rising energy prices to sour investors' mood.9 Bottom Line: An oil price spike above $100 would produce negative consequences for the U.S. household and corporate sectors. Given the supply-side nature of the price shock, it would not be accompanied by the usual decline in USD, and could therefore hurt the foreign profits of U.S. corporations as well. If investors must also deal with mounting regulatory pressures on FAANG stocks, they could face a perfect storm. Given the high probability of such an oil price shock, why isn't a 2019 recession BCA's House View, rather than merely a risk to it? Because it is difficult to say how high oil prices need to rise to cause a recession. For example, 1973 both marked a permanent move up in oil prices and saw oil prices triple. In 2019 terms, that would mean an oil price above $200, a far less probable scenario than $100-$110. Nevertheless, the combination of elevated oil prices and the price impact on consumer goods of the U.S.-China trade war could combine to create a nightmare scenario for consumers. But it is impossible to gauge the level of both required to push the U.S. into a recession. Second, there are many ways in which today's macro environment is different from that in 1974. In the 1970s the inventory cycle was a key factor in the business cycle, with excesses building up ahead of recessions, forcing output cutbacks as demand weakened. That is no longer the case in today's world of just-in-time inventory management. Also, inflation was a much bigger problem back then, requiring tougher Fed action. On the other hand, debt burdens were much lower. Investment Implications To be clear, none of the usual recession indicators that BCA Research uses are flashing red at this time. The point of this analysis is to illustrate a credible, exogenous scenario that cannot be revealed through the usual data-driven recession forecasting methods. What happens if a recession does occur ahead of the 2020 election? How would President Trump react to a recession induced by his foreign policy adventurism in the Middle East? By doing what every other president would do: finding someone else to blame. In this case, we would put high odds on the Federal Reserve becoming the target of President Trump's fury. Ahead of 2020, the Fed and its independence may very well become an election issue.10 This could spell serious trouble for the Fed, which is at a massive disadvantage when it comes to explaining to voters why central bank independence is so important. The Fed had great difficulty managing public opinion regarding its extraordinary measures to combat the Great Recession - its attempts at public outreach largely failed. Compare the number of Trump's Twitter followers to that of the Fed's (Chart 12). Chart 12The Fed's PR Abilities Are Limited
2019: The Geopolitical Recession?
2019: The Geopolitical Recession?
Though most of our clients and colleagues will probably disagree, we do not see central bank independence as a static quality. It was bestowed upon central banks by politicians following widespread inflation fears throughout the 1970s and 1980s, although in the U.S. the current tradition goes back to the 1951 Treasury Accord that restored the independence of the Fed. Our colleague Martin Barnes penned a report on the politicization of monetary policy in 2013.11 His conclusion is that political meddling in monetary affairs is less pernicious than economic performance. The Fed will incur Trump's ire, in other words, but it will be its failure to generate economic growth that causes a break in independence. We are not so sure. The next recession is likely to be a mild one for Main Street given the lack of real economic bubbles. But given the slow recovery in real wages over the past decade and the general angst of the populace towards governing elites, even a mild recession that merely reminds voters of 2008-2009 could produce deep anxiety and significant public reactions. Further, the idea of "independent," non-politically accountable institutions is going out of style. President Trump - and other policymakers in the developed world - have specifically targeted the "so-called experts" and "institutions." President Trump has attacked America's foreign policy architecture, NATO, the WTO, and a slew of supposedly outdated norms and practices for being "out of touch" with the electorate. This policy has served him well thus far. If our nightmare scenario of an oil price-induced recession plays out, the immediate implication for investors will be a sharp downturn in risk assets. As such, we are recommending that investors hedge their portfolios with a long Brent / short S&P 500 trade. Alternatively we would recommend going long U.S. energy / short technology stocks. A longer-term, and perhaps even more pernicious implication, would be the end of the era of central bank independence and a full politicization of the economy. Laissez-faire capitalist system would give way to dirigisme. In the process, the U.S. dollar and Treasuries would be doomed. Jim Mylonas, Global Strategist Daily Insights & BCA Academy jim@bcaresearch.com Marko Papic, Senior Vice President Chief Geopolitical Strategist marko@bcaresearch.com 1 Please see BCA Research Special Report, "Beware The 2019 Trump Recession," dated March 7, 2017, and Global Investment Strategy Weekly Report, "The Timing Of The Next Recession," dated June 16, 2017, available at gis.bcaresearch.com. 2 Please see BCA Research Geopolitical Strategy and Commodity & Energy Strategy Special Report, "U.S., OPEC Talk Oil Prices Down; Gulf Tensions Could Become Kinetic," dated July 19, 2018, available at gps.bcaresearch.com. 3 Please see BCA Research Geopolitical Strategy Special Report, "Why Conflict With Iran Is A Big Deal - And Why Iraq Is The Prize," dated May 30, 2018, available at gps.bcaresearch.com. 4 Please see BCA Geopolitical Strategy Weekly Report, "Fade The Midterms, Not Iraq Or Brexit," dated September 12, 2018 and "Iraq: The Fulcrum Of Middle East Geopolitics And Global Oil Supply," dated September 5, 2018, available at gps.bcaresearch.com. 5 Please see BCA Research Geopolitical Strategy Weekly Report, "A Story Told Through Charts: The U.S. Midterm Election," dated September 19, 2018, available at gps.bcaresearch.com. 6 The Strategic Petroleum Reserve currently covers 100 days of net crude imports, or 200 days of net petroleum imports, and can be tapped for reasons of political timing as well as international emergencies. 7 Please see BCA Commodity & Energy Strategy Weekly Report, "Oil-Supply Shock, Rising U.S. Rates Favor Gold As A Portfolio Hedge," dated September 13, 2018, available at bcaresearch.com. 8 Please see the U.S. Federal Reserve, "Report on the Economic Well-Being of U.S. Households in 2017," May 2018, available at federalreserve.gov. 9 Please see BCA Geopolitical Strategy and U.S. Equity Strategy Special Report, "Is The Stock Rally Long In The FAANG?" dated August 1, 2018, available at gps.bcaresearch.com. 10 Please see BCA Daily Insights, "Politics And Monetary Policy," dated August 22, 2018, and "The Battle Of The Press Conferences: Trump Versus Powell," dated September 27, 2018, available at dailyinsights.bcaresearch.com. 11 Please see BCA Special Report, "The Politicization Of Monetary Policy: Should We Care?" dated April 15, 2013, available at bca.bcaresearch.com. Geopolitical Calendar