Elections

Highlights So What? Geopolitical risks are not about to ease. Why? Fiscal policy becomes less accommodative next year unless politicians act. Financial conditions give President Trump room to expand his tariff onslaught. Our Iran view is confirmed by rapid escalation of tensions – war risk is high. The odds of a no-deal Brexit have risen. Feature The AUD-JPY cross and copper-to-gold ratio – two market indicators that flag global growth and risk-on sentiment – are hovering over critical points at which a further breakdown would catalyze a renewed flight to quality (Chart 1). Chart 1Risk-On Indicators Breaking Down?
Risk-On Indicators Breaking Down?
Risk-On Indicators Breaking Down?
Global sentiment remains depressed amid a rash of negative economic surprises and bonds continue to rally despite a more dovish outlook from the Fed (Chart 2). Chart 2Global Sentiment Remains Depressed
Global Sentiment Remains Depressed
Global Sentiment Remains Depressed
The cavalry is on the way: European Central Bank President Mario Draghi oversaw a dramatic easing of monetary policy on June 18, driving the Italian-German sovereign bond spread down to levels not seen since before the populist election outcome of March 2018 (Chart 2, bottom panel). The Federal Reserve adjusted its policy rate projections to countenance an interest rate cut in the not-too-distant future. More needs to be done, however, to sustain the optimism that has propelled the S&P 500 and global equities upward since the volatility catalyzed by President Donald Trump’s announcement of a tariff rate hike on May 6. Political and geopolitical risks are higher, not lower, since that time as market-negative scenarios are playing out with U.S. policy, Iran, and Brexit, while we take a dim view of the end-game of the U.S.-China negotiations despite recent improvements. Fiscal And Trade Uncertainties This year’s growth wobbles have occurred in the context of expansive fiscal policy in the developed markets. Next year, however, the fiscal thrust (the change in the cyclically adjusted budget balance) is projected to decline in the U.S. and Japan and nearly to do so in Europe (Chart 3). We expect President Trump and the House Democrats to raise spending caps (or at least keep spending at current levels) and thus prevent the budget deficit from contracting in FY2020 – this is their only substantial point of agreement. But this at best neutralizes what would otherwise be a negative fiscal backdrop. Meanwhile it is not at all clear that Brussels will relax its scrutiny of member states seeking to cut taxes and boost spending, such as Italy. Japanese Prime Minister Abe Shinzo would need to arrange for the Diet to pass a new law to avoid the consumption tax hike from 8% to 10% on October 1. He can pull this off, especially if the U.S. trade war escalates – or if he decides to turn next month’s upper house election into a general election and needs to boost his popularity. But as things currently stand in law, the world’s third biggest economy will face a deep fiscal pullback next year (Chart 3, bottom panel). In short, DM fiscal policy will not really become contractionary in 2020, but this is a view and not yet a reality (Chart 4). Chart 3Fiscal Pullback Likely Next Year
Fiscal Pullback Likely Next Year
Fiscal Pullback Likely Next Year
Chart 4Only The U.S. Is Profligate
Only The U.S. Is Profligate
Only The U.S. Is Profligate
Meanwhile China’s stimulus is still in question – in fact it remains the major macro question this year. The efficacy of China’s stimulus is declining ... An escalating trade war will bring greater stimulus but also greater transmission problems. Since February we have argued that the Xi administration has shifted to sweeping fiscal-and-credit stimulus in the face of the unprecedented external threat posed by the Trump administration (Charts 5A and 5B). We expect China’s credit growth to continue its upturn in June and in H2. Ultimately, we think the whole package will be comparable to 2015-16 – and anything even close to that will prolong the global economic expansion. We do not see a massive 2008-style stimulus occurring unless relations with the U.S. completely collapse and a global recession occurs. Chart 5AStimulus Amid The Trade War
Stimulus Amid The Trade War
Stimulus Amid The Trade War
Chart 5
The catch – as we have shown – is that the efficacy of China’s stimulus is declining over time because of over-indebtedness and bearish sentiment in China’s private sector. These tepid animal spirits stem from epochal changes: Xi’s reassertion of communism and America’s withdrawal of strategic support for China’s rise. An escalating trade war will bring greater stimulus but also greater transmission problems. The magnitude of the tariffs that President Trump is threatening to impose on China, Mexico, the EU, and Japan is mind-boggling. We illustrate this with a simple simulation of duties collected as a share of total imports under different scenarios (Chart 6).
Chart 6
China and Mexico are fundamentally different from the EU and Japan and hence the threat of tariffs will continue to weigh on markets for Trump’s time in office – China because of a national security consensus and Mexico because of the Trump administration’s existential emphasis on curbing illegal immigration. But we still put the risk of auto tariffs (or other punitive measures) on Europe at 45% if Trump seals a China deal. The odds are lower for Japan but it is still at risk. Global supply chains are shifting – a new source of costs and uncertainty for companies – as a slew of recent news has highlighted. Already 40% of companies surveyed by the American Chamber of Commerce in China say they are relocating to Southeast Asia, Mexico, and elsewhere (Chart 7). If the G20 is a flop – or results in nothing more than a pause in tariffs for another three-month dialogue – relocations will gain steam, forcing companies’ bottom lines to take a hit.
Chart 7
Even in the best case, in which the Trump-Xi summit produces a joint statement outlining a “deal in principle” accompanied by a rollback of the May 10 tariff hike, uncertainty will persist due to President Trump’s unpredictability, China’s incentive to wait until after the U.S. election, and Trump’s incentive to corner the “China hawk” platform prior to the election. We maintain that, by November 2020, there is a roughly 70% chance of further escalation. At least the U.S.-China conflict is nominally improving. The same cannot be said for other geopolitical risks discussed below: the U.S. and Iran are flirting with war; the U.S. presidential election is injecting a steady trickle of market-negative news; the chances of a no-deal Brexit are rising; and Trump may turn on Europe at a moment when it lacks leadership. This list assumes that Russia takes advantage of American distraction by improving domestic policy rather than launching into a new foreign adventure – say in Ukraine or Kaliningrad. If there is any doubt as to whether political risk can outweigh more accommodative monetary policy, remember that President Trump actually can remove Chairman Jerome Powell. Legally he is only allowed to do so “for cause” as opposed to “at will.” But the meaning of this term is a debate that would go to the Supreme Court in the event of a controversial decision. Meanwhile the stock market would dive. Now, this is precisely why Trump will not try. But the implication, as with Congress and the border wall, is that Trump is constrained on domestic policy and hence tariffs are his most effective tool to try to achieve policy victories. With an ebullient stock market and a Fed that is adjusting its position, Trump can try to kill two birds with one stone: wring concessions from trade partners while forcing the FOMC to keep responding to rising external risks. Bottom Line: Central banks are riding to the rescue, but there is only so much they can do if global leaders are tightening budgets and imposing barriers on immigration and trade. We remain tactically cautious. Oh Man, Oh Man, Oman Iran has swiftly responded to the Trump administration’s imposition of “maximum pressure” on oil exports. The shooting down of an American drone that Tehran claims violated its airspace on June 20 is the latest in a spate of incidents, including a Houthi first-ever cruise missile attack on Abha airport in Saudi Arabia. Two separate attacks on tankers near the Strait of Hormuz (Map 1) demonstrate that Iran is threatening to play its most devastating card in the renewed conflict with the U.S.
Chart
Chart 8
Hormuz ushers through a substantial share of global oil demand and liquefied natural gas demand (Chart 8). The amount of spare pipeline capacity that the Gulf Arab states could activate in the event of a disruption is merely 3.9 million barrels per day, or 6 million if questionable pipelines like the outdated Iraqi pipeline in Saudi Arabia prove functional (Table 1). Table 1No Sufficient Alternatives To Hormuz
Escalation ... Everywhere
Escalation ... Everywhere
A conflict with Iran could cause the biggest oil shock of all time. Even if this spare capacity were immediately utilized, a conflict could cause the biggest oil shock of all time – considerably bigger than that of the Iranian Revolution (Chart 9).
Chart 9
We have shown in the past that Iran has the military capability of interrupting the flow of traffic in Hormuz for anywhere from 10 days to four months. A preemptive strike by Iran would be most effective, whereas a preemptive American attack would include targets to reduce Iran’s ability to retaliate via Hormuz. The impact on oil prices ranges from significant to devastating. Needless to say, blocking the Strait of Hormuz would initiate a war so Iran is attempting to achieve diplomatic goals with the threats themselves – it will only block the strait as a last resort, say if it is convinced that the U.S. is about to attack anyway. As the experience of President Jimmy Carter shows, Americans may rally around the flag during a crisis but they will also kick a president out of office for higher prices and an economic slowdown. President Trump cannot be unaware of this precedent. The intention of his Iran policy is to negotiate a “better deal” than the 2015 one – a deal that includes Iran’s regional power projection and ballistic missile capabilities as well as its nuclear program. The problem is that Trump has already been forced to deploy a range of forces to the region, including additional troops (albeit so far symbolic at 2,500) (Chart 10). He is also sending Special Representative for Iran, Brian Hook, to the region to rally support among Gulf Cooperation Council. The week after Hook will court Britain, Germany, and France, three of the signatories of the 2015 deal. Trump ran on a campaign of eschewing gratuitous wars in the Middle East – a popular stance among war-weary Americans (Chart 11) – but there is a substantial risk that he could get entangled in the region. First, he is adopting a more aggressive foreign policy to attempt to compensate for the lack of payoff in public opinion from the strong economy. Second, Iran is not shrinking from the fight, which could draw him deeper into conflict. Third, there is always a high risk of miscalculation when nations engage in such brinkmanship. Chart 10Is The 'Pivot To Asia' About To Reverse?
Is The 'Pivot To Asia' About To Reverse?
Is The 'Pivot To Asia' About To Reverse?
Chart 11
The Iranian response has been, first, to reject negotiations. When Trump sent a letter to Rouhani via Japanese Prime Minister Abe Shinzo, Abe was rebuffed – and one of the tankers attacked near Oman was a Japanese flagged vessel, the Kokuka Courageous. This is a posture, not a permanent position, as the Iranian release of an American prisoner demonstrates. But the posture can and will be maintained in the near term – with escalation as the result. Second, Iran is increasing its own leverage in any future negotiation by demonstrating that it can sow instability across the region and bring the global economy grinding to a halt. Iran cannot assume that Trump means what he says about avoiding war but must focus on the United States’ actions and capabilities. Cutting off all oil exports is a recipe for extreme stress within the Iranian regime – it is an existential threat. Therefore, the Iranians have signaled that the cost of a total cutoff will be a war that will cause a global oil price shock. The Iranian leaders are also announcing that they are edging closer to walking away from the 2015 nuclear pact (Table 2). If so, they could quickly approach “breakout” capacity in the uranium enrichment – meaning that they could enrich to 20% and then in short order enrich to 90% and amass enough of this fuel to make a nuclear device one year thereafter. The Trump administration has reportedly reiterated that this one-year limit is the U.S. government’s “red line,” just as the Obama administration had done. Table 2Iran Threatens To Walk Away From 2015 Nuclear Deal
Escalation ... Everywhere
Escalation ... Everywhere
This Iranian threat is a direct reaction to Trump’s decision in May not to renew the oil sanction waivers. Previously the Iranians had sought to preserve the 2015 deal, along with the Europeans, in order to wait out Trump’s first term. These developments push us to the brink of war. Iran is retaliating with both military force and a nuclear restart. This comes very close to meeting our conditions for an American (and Israeli) retaliation that is military in nature. Diagram 1 is an update of our decision tree that we have published since last year when Trump reneged on the 2015 deal. The window to de-escalate is closing rapidly. The Appendix provides a checklist for air strikes and/or the closure of Hormuz. Diagram 1Iran-U.S. Tensions Decision Tree
Escalation ... Everywhere
Escalation ... Everywhere
At very least we expect to see the U.S. attempt to create a large international fleet to assert freedom of navigation in the Persian Gulf and Strait of Hormuz. While Iran may lay low during a large show of force, it will later want to demonstrate that it has not been cowed. And it has the capacity to retaliate elsewhere, including in Iraq, an area we have highlighted as a major geopolitical risk to oil supply. The U.S. government has already reacted to recent threats there from Iranian proxies by pulling non-essential personnel. Iran has several incentives to test the limits of conflict if the U.S. insists on the oil embargo. First, tactically, it seeks to deter President Trump, take advantage of American war-weariness, drive a wedge between the U.S. and Europe, and force a relaxation of the sanctions. This would also demonstrate to the region that Iran has greater resolve than the United States of America. This goal has not been achieved by the recent spate of actions, so there is likely more conflict to come. Second, President Hassan Rouhani’s government is also likely to maintain a belligerent posture – at least in the near term – to compensate for its loss of face upon the American betrayal of the 2015 nuclear deal. Rouhani negotiated the deal against the warnings of hardline revolutionaries. The 2020 majlis elections make this an important political goal for his more reform-oriented faction. Negotiations with Trump can only occur if Rouhani has resoundingly demonstrated his superiority in the clash of wills. Structurally, Iran faces tremendous regime pressures in the coming years and decades because of its large youth population, struggling economy, and impending power transition from the 80 year-old Supreme Leader Ali Khamanei. A patriotic war against America and its allies – while not desirable – is a risk that Khamenei can take, as an air war is less likely to trigger regime change than it is to galvanize a new generation in support of the Islamic revolution. For oil markets the outcome is volatility in the near term – reflecting the contrary winds of trade war and global growth fears with rising supply risks. Because we expect more Chinese stimulus, both as the trade talks extend and especially if they collapse, we ultimately share BCA’s Commodity & Energy Strategy view that the path of least resistance for oil prices is higher on a cyclical horizon, as demand exceeds supply (Chart 12). We remain long EM energy producers relative to EM ex-China. Chart 12Crude Oil Supply-Demand Balance Should Send Prices Higher
Crude Oil Supply-Demand Balance Should Send Prices Higher
Crude Oil Supply-Demand Balance Should Send Prices Higher
Bottom Line: The risk of military conflict has risen materially. This also drastically elevates the risk of a supply shock in oil prices that would kill global demand. The U.S. Election Adds To Geopolitical Risk The 2020 U.S. election poses another political risk for the rising equity market. The Democratic Party’s first debate will be held on June 26-27. The leftward shift in the party will be on full display, portending a possible 180-degree reversal in U.S. policy if the Democrats should win the election, with the prospect of a rollback of Trump’s tax cuts and deregulation of health, finance, and energy. The uncertainty and negative impact on animal spirits will be modest if current trends persist through the debates. Former Vice President Joe Biden remains the frontrunner despite having naturally lost the bump to his polling support after announcing his official candidacy (Chart 13). Biden is a known quantity and a centrist, especially compared to the farther left candidates ranked second and third in popular support– Vermont Senator Bernie Sanders and Massachusetts Senator Elizabeth Warren.
Chart 13
Chart 14
Biden is not only beating Sanders in South Carolina, which underscores the fact that he is competitive in the South and hence has a broader path to the White House, but also in New Hampshire, where the Vermont native should be ahead (Chart 14). These states hold the early primaries and caucuses and if Biden maintains his large lead then he will start to appear inevitable very early in the primary campaign next year. Hence a poor showing in the debate on June 27 is a major risk to Biden – he should be expected to be eschew the limelight and play the long game. Elizabeth Warren, by contrast, has the most to gain as she appears on the first night and does not share a stage with the other heavy hitters. If she or other progressive candidates outperform then the market will be spooked. The market could begin to trade off the polls. All of these candidates are beating Trump in current head-to-head polling – Biden is even ahead in Texas (Chart 15). This means that any weakness from Biden does not necessarily offer the promise of a Trump victory and policy continuity.
Chart 15
The Democrats also have a powerful demographic tailwind. The just-released projections from the U.S. Census Bureau reveal how Trump’s narrow margins of victory in the swing states in 2016 are in serious jeopardy in 2020 as a result of demographics if he does not improve his polling among the general public (Chart 16).
Chart 16
We still give Trump the benefit of the doubt as the incumbent president amid an expanding economy, but it is essential to recognize that his popular approval rating is reminiscent of a president during recession – i.e. one who is about to lose the White House for his party (Chart 17).
Chart 17
Even if there is not a recession, an increase in unemployment is likely to cost him the election – and even a further decrease in unemployment cannot guarantee victory (Chart 18). This is why we see Trump making a bid to become a foreign policy president and seek reelection on the basis that it is unwise to change leaders amid an international crisis.
Chart 18
We still give Trump the benefit of the doubt ... but his popular approval rating is reminiscent of a president during recession. The race for the U.S. senate is extremely important for the policy setting from 2021. If Republicans maintain control, they will be able to block sweeping Democratic legislation – which is particularly relevant if a progressive candidate should win the White House. However, if Democrats can muster enough votes to remove a sitting president with a strong economy – including a strong economy in the key senate swing races (Chart 19) – then they will likely win over the senate as well. Chart 19Hard To Win The Senate In 2020 While Key States Prosper
Hard To Win The Senate In 2020 While Key States Prosper
Hard To Win The Senate In 2020 While Key States Prosper
Bottom Line: The 2020 election poses a double risk to the bull market. First, the Democratic primary campaign threatens sharp policy discontinuity, especially if and when developments cause Biden to drop in the polls (dealing a blow to centrism or the political establishment). Second, Trump’s vulnerability makes him more likely to act aggressive on the international stage, whether on trade, immigration, or national security, reinforcing the risks outlined above with regard to China, Iran, Mexico, and even Europe. Rising Odds Of A No-Deal Brexit Former Mayor of London and former foreign secretary Boris Johnson looks increasingly likely to seal the Conservative Party leadership contest in the United Kingdom. It is not yet a done deal, but the shift within the party in favor of accepting a “no deal” exit is clear. None of the remaining candidates is willing to forgo that option. The newest development advances us along our decision tree in Diagram 2, altering the conditional probabilities for this year’s events. We expect the next prime minister to try to push a deal substantially similar to outgoing Prime Minister Theresa May before attempting any kamikaze run as the October 31 deadline approaches. The attempt to leverage the EU’s economic weakness will not produce a fundamental renegotiation of the exit deal, but some element of diplomatic accommodation is possible as the EU seeks to maintain overall stability and a smooth exit if that is what the U.K. is determined to accomplish. Diagram 2Brexit Decision Tree
Escalation ... Everywhere
Escalation ... Everywhere
Hence the prospect of passing a deal substantially similar to outgoing Prime Minister Theresa May’s deal is about 30%, roughly equal to the chance of a delay (28%). These options are believable as the new leader will have precious little time between taking the reins and Brexit day. The EU can accept a delay because it ultimately has an interest in keeping the U.K. bound into the union. Public opinion polling is not conducive to the new prime minister seeking a new election unless the change of face creates a massive shift in support for the Conservatives, both by swallowing the Brexit Party and outpacing Labour. If the purpose is to deliver Brexit, then the risk of a repeat of the June 2017 snap election would seem excessive. Nevertheless, the Tories’ working majority in parliament is vanishingly small, at five MPs, so a shift in polling could change the thinking on this front. The pursuit of a no-deal exit would create a backlash in parliament that we reckon has a 21% chance of ending in a no-confidence motion and new election. Bottom Line: The odds of a crash Brexit have moved up from 14% to 21% as a result of the leadership contest. The threat that the U.K. will crash out of the EU is not merely a negotiating ploy, although it will be a last resort even for the new hard-Brexit prime minister. Public opinion is against a no-deal Brexit, as is the majority of parliament, but the risk to the U.K. and EU economies will loom large over global risk assets in the coming months. Investment Conclusions Political and geopolitical risks to the late-cycle expansion are rising, not falling. U.S. foreign policy remains the dominant risk but U.S. domestic policy pre-2020 is an aggravating factor. Easing financial conditions give President Trump more ammunition to use tariffs and sanctions. Meanwhile our view that this summer will feature “fire and fury” between the U.S. and Iran has been confirmed by the tanker attacks in Oman. Tensions will likely escalate from here. Ultimately, we believe Trump is more likely to back off from the Iran conflict than the China conflict. This is part of our long-term theme that the U.S. really is pivoting to China and geopolitical risk will rotate from the Middle East to East Asia. But as highlighted above, the risk of entanglement is very high due to Trump’s approach and Iran’s incentives to raise the stakes. Oil prices will not resume their upward drift until Chinese stimulus is reconfirmed – and even then they will continue to be volatile. We remain cautious and are maintaining our safe-haven tactical trades of long gold and long JPY/USD. Matt Gertken, Vice President Geopolitical Strategist mattg@bcaresearch.com Appendix
Image
Highlights The odds of universal health care legislation being enacted in the U.S. by 2022 are about 10%-15%. Former Vice President Joe Biden is the most likely Democratic candidate in 2020, but the alternative is most likely a progressive candidate seeking universal health care. Trump is slightly favored to win in 2020, but a Trump loss is likely to translate into full Democratic control of the U.S. government, making ambitious legislation more likely to pass Congress. An overweight portfolio allocation in the S&P health care index is a sensible and defensive move. Fear selling in health care stocks could easily return but would create an exploitable trading opportunity at this late stage of the cycle. We are executing the upgrade of the S&P health care index via an upgrade of the S&P health care equipment index, which has seen a material valuation de-rating at the same time as profits are expanding, to overweight. Feature Will The Democrats Win? Can They Pass Universal Health Care? “Medicare for All,” or government-led universal health care in the United States, is less likely to become the law of the land by 2022 than the market expects. We put the probability at around 10%-15%. Here’s why. The industry faces only two certainties: Americans are getting older and the federal government is increasing its involvement. The former is a secular driver for health care demand. The latter is an inference drawn from the fact that the Republican Party failed to repeal the Affordable Care Act, or Obamacare, even when it had full control of government. It is very unlikely that the Republicans will get another chance at repeal. It is also very unlikely that the public will tolerate the current status quo forever. The result is that the U.S. will eventually end up with a restored Obamacare or an altogether new system with a greater government role. The Republican failure to repeal was not idiosyncratic – it was not based on the fact that the late Senator John McCain, who cast the decisive vote on July 27, 2017, had been diagnosed with brain cancer earlier that year. Rather, it was structural – the repeal failed because (1) it is always extremely difficult to remove an entitlement once it has been given to voters and (2) a slim majority of Americans approved of Obamacare – and still do (Chart 1).
Chart 1
Republicans went on to dismantle aspects of Obamacare, including the problematic “individual mandate.” But they did so without replacing it. The result was a severe electoral defeat in the 2018 midterm elections, despite a huge drop in the unemployment rate (Chart 2) – which matters directly in a country where 49% get their health insurance through their employer. Health care was the single most important issue driving people to vote against the ruling party in November 2018, judging by both pre-election polls and exit polls (Charts 3 & 4). Chart 2Low Unemployment Has Not Solved Health Care Woes
Low Unemployment Has Not Solved Health Care Woes
Low Unemployment Has Not Solved Health Care Woes
Chart 3
Chart 4
The need for reform is manifest. It is widely known that the U.S. spends more than other countries on health care (Chart 5) and yet achieves worse results: preventable mortality is higher than in other countries that spend less (Chart 6). Democrats have tried to overhaul the system since 1993. Even President Trump is seeking to cap prescription drug prices and maintain the Obamacare requirement that health care insurers accept customers with “pre-existing conditions.”
Chart 5
Chart 6
Uncertainty has risen since the Republicans’ midterm defeat, which increases, or is seen as increasing, the odds of a Democratic victory in 2020. Such a victory would mark the third time in 12 years that American policy would witness a 180-degree reversal – and it would have a major impact on the health sector (Chart 7). Chart 7The Sector's Response To Major Political Events
The Sector's Response To Major Political Events
The Sector's Response To Major Political Events
In truth Trump is still favored to win in 2020, on the back of the incumbent advantage – as long as the economy holds up. But with a chronically weak approval rating, and narrow 2016 margins of victory and the aforementioned midterm losses in key swing states, his odds of reelection are probably not much better than 55%. Meanwhile the Democrats are swinging to the left and may not settle simply for restoring Obamacare. Left-wing or “progressive” candidates for the Democratic nomination are polling in line with traditional center-left candidates (Chart 8), which is highly unusual (even compared with the 2007-08 race). Candidates are crowding onto the democratic socialist bandwagon in the wake of Bernie Sanders’s formidable challenge to Hillary Clinton and her subsequent loss to Trump.
Chart 8
Could a progressive candidate win the nomination? Certainly. Former Vice President Joe Biden leads the pack at this early stage in the nomination process. He would seek to restore and build upon Obamacare. The second-ranked candidate is Sanders, whose initial proposal to create Medicare for All has transformed the national debate. Following Sanders are Senators Kamala Harris, who co-sponsored the latest version of the bill with Sanders, and Elizabeth Warren, an outspoken progressive who is also in favor of universal health care (Chart 9).
Chart 9
Sanders does have a path to winning the nomination, as the leading progressive candidate at a time when the party is becoming more progressive. He performs better than Biden in head-to-head polls against Trump in the key battleground states (Chart 10). Strategic voters will have trouble convincing fellow Democrats that they should not vote for him because he is unelectable: he has a clear electoral path to the White House via Michigan, Pennsylvania, and Wisconsin, where he performed well in 2016 and polls well today. If Sanders has a chance, then Medicare for All has a chance.
Chart 10
Because it is extremely difficult to unseat an incumbent president, a victory over Trump in 2020 is only likely to occur if there is a surge in voter turnout and Democratic Party support among (1) blue-collar workers who abandoned the Democrats for Trump in 2016, or (2) young voters, women, or minorities. Any such surge would also enable the Democrats to defend their senate seats while picking up Arizona, Colorado, and Maine, which are statewide elections that will be affected by the headline presidential race. And if the Democrats win 50 seats, they would get a majority in the senate, as the vice president would break any tie. With a majority, Senate Democrats could use the “nuclear option” to bypass the filibuster and drive through their priority legislation.1 This would set a new precedent with far-reaching consequences. But recent majority leaders have already begun eroding the filibuster and there is no hard constraint preventing a ruling party from removing it entirely. It is perfectly possible, and all the more likely if the nation sweeps a progressive candidate to power in a wave of enthusiasm for dramatic changes like universal health care. In other words, any victory against Trump is likely to entail full Democratic control of government. In this scenario, Democrats would have a very good chance of passing a major piece of legislation. Hence, if a progressive wins the nomination, and makes Medicare for All the policy priority, there is at least a 50/50 chance it will pass, probably more like 60%. The catch is that a progressive may not win the nomination. There is not decisive evidence that Americans really want Medicare for All. First, Americans tend to view their own health costs as “reasonable” (Chart 11). They are not, as a whole, clamoring for a single-payer system.
Chart 11
Second, while Americans say they support Medicare for All, that support evaporates when they learn about the various policies that it would necessitate, such as eliminating private health insurance and raising taxes (Chart 12).
Chart 12
Third, most Democrats are closer to Biden’s position than Sanders’s – they want to fix Obamacare rather than revolutionize the system (Chart 13).
Chart 13
Fourth, Colorado tried to pass its own version of Medicare for All on the state level in 2016. The bill’s advocates were handed a 79% defeat by voters. Colorado is a swing state so it is not an irrelevant experiment. Fifth, independents are not shifting to the left in a way that would validate the sharp leftward shift within the Democratic Party (Chart 14). Nominating Sanders or another progressive is more likely to lead to a loss in the general election than it is to ensure that universal health care gets passed. Chart 14Independents Not Swinging Dramatically To The Left
Independents Not Swinging Dramatically To The Left
Independents Not Swinging Dramatically To The Left
A simple back-of-the-envelope exercise suggests that odds of universal health care by 2022 are about 10%-15%. Nevertheless, we attempt a conservative, back-of-the-envelope method for estimating the probability of passage. It runs like this: There is a 50% chance a progressive wins the Democratic nomination. We assume that if Biden wins it is because Democratic voters prefer a restitution of Obamacare. There is a 45% chance that Trump loses the presidential election. We assume that for the Democrats to unseat an incumbent is difficult enough that they will also win the Senate. Under these circumstances, there is a 50%-60% chance that universal health care legislation passes – even though it will be very difficult to get it over the line. (Note that the ACA passed very narrowly at a time when the Democrats had a huge tailwind due to voters’ disenchantment after the global financial crisis). With these assumptions, the conditional probability of passage is around 13.5% (0.5 x 0.45 x 0.6 = 0.135) These odds can be moderated by boosting Trump to a 69% chance of reelection (the historical average for sitting presidents), which brings down the odds of ultimate passage to 9%. Note, however, that the bond market is pricing a 27% probability of a recession 12 months from now (Chart 15). If there is a recession, then President Trump is virtually assured to lose reelection and the Democratic victor will have a strong tailwind of public support. This will increase the chance that universal health care passes to 80%. (We still assume in this case that Biden would stick with Obamacare as he would not be committed to Medicare for All and it is not an economic stimulus package). The conditional probability would become 0.5 x 0.27 x 0.8 = 11%. Chart 15Probability Of Recession Is Rising NY Fed's Yield Curve Model Suggests That The Probability Of A Recession Is Still Quite Low
Probability Of Recession Is Rising NY Fed's Yield Curve Model Suggests That The Probability Of A Recession Is Still Quite Low
Probability Of Recession Is Rising NY Fed's Yield Curve Model Suggests That The Probability Of A Recession Is Still Quite Low
In other words, whether we upgrade Trump’s chances of winning or we upgrade the chances of a recession that kicks him out of office, the odds are roughly the same at 9%-11%. And they could be a bit higher at 14%. Medicare for All has a chance of becoming law, although it is not all that great. Bottom Line: With fairly conservative assumptions the odds range from 10%-15%. that the U.S. could legislate a sweeping overhaul of the health care system and new social entitlement by 2022. This is a serious risk to the industry. Health care equities have recovered the losses suffered since Sanders’s latest push for Medicare for All, which means that it is not pricing in a high probability of passage at present. Additional policy-related selloffs are likely between now and the spring of 2020, if and when the odds increase of Sanders (or another progressive) winning the Democratic nomination. Buy Into Health Care Weakness Regardless of the likelihood of passage, the faintest hint of the winds of change has brought about significant price changes in the relevant equities. In the lead up to the 2016 U.S. presidential election, Hillary Clinton, a health care reformer (though importantly NOT a Medicare for All advocate) was polling well ahead of Donald Trump. Health care stocks underperformed the broad market in anticipation of potential reforms resulting from a Clinton win (Chart 16). Two years after Donald Trump’s election, both S&P health care equipment and S&P managed health care have significantly outperformed with the effect most dramatic in the former. Chart 17 shows the reverse picture: a “blue wave” in the 2018 midterm elections was swiftly followed by the zenith for health care stocks as the market digested the implications of a Democratic House and the resulting higher probability of a similar sweep in 2020 in the Senate and executive branch. Chart 16Election Fear Creates Buying Opportunities...
Election Fear Creates Buying Opportunities...
Election Fear Creates Buying Opportunities...
Chart 17...And History Appears To Be Repeating Itself
...And History Appears To Be Repeating Itself
...And History Appears To Be Repeating Itself
Furthermore, our prior research shows that S&P health care has been the top performer in the last equity market surge to take place between the peak of the ISM manufacturing composite index and the beginning of the subsequent recession.2 This research was confirmed in a report last month analyzing sector returns after a Fed loosening cycle begins. The S&P health care index has historically outperformed from six months before a rate cut all the way to two years after easing policy.3#fn_3 As a reminder, the market has now priced in two rate cuts over the next year. We recommend an overweight position for the broad S&P 500 health care index as well as for health care equipment. BCA’s U.S. Equity Strategy has already moved to an overweight recommendation on the S&P managed health care index, a move that has netted our portfolio 12.4% of alpha. Today U.S. Equity Strategy is raising our recommendations on both the S&P health care equipment and, more importantly, the broad S&P health care index from neutral to overweight. Further, considering U.S. Equity Strategy’s recent portfolio changes, namely moving the S&P materials index to neutral, this upgrade of S&P health care to overweight moves our cyclicals vs. defensives style preference from overweight cyclicals to neutral. This move to the sidelines on the cyclical/defensive portfolio bent has netted modest gains of 2% since its October 2, 2017 inception. Equipping The World’s Hospitals Our upgrade of S&P health care equipment to overweight is not contingent upon earnings outperformance. Rather, it is a combination of overwrought investors having created a buying opportunity, combined with health care’s historic outperformance at the end of the business cycle. Nevertheless, an examination of the sector’s macro environment is revealing. The health care equipment index has recently completed an inventory clear-out cycle, as evidenced both by a slingshot rebound in the shipments-to-inventories ratio (second panel, Chart 18) and a recovery in industry pricing power (bottom panel, Chart 18). This is remarkable in the context of the deceleration in equipment fixed-investment growth that the industry has faced since reaching decade-highs in 2017 (third panel, Chart 18). The upshot is that steady pricing and resilient volume growth should deliver positive top-line growth. The margin picture has also dramatically improved: industrial production has been surging for the past year while hours worked have remained tepid (second and third panels, Chart 19). The combination has driven our productivity proxy to a multi-year high where it has recently diverged from the relative stock price (bottom panel, Chart 19). Chart 18Inventories Have Cleared
Inventories Have Cleared
Inventories Have Cleared
Chart 19Productivity Is Soaring
Productivity Is Soaring
Productivity Is Soaring
This underpins our thesis that health care stocks in general and health care equipment stocks in particular have recently suffered based on fear, not fundamentals, amidst a stable domestic demand environment and rosy profit picture. The export channel is at least as important to the S&P health care equipment index as the domestic demand environment. In fact, roughly 60% of sector revenues are generated outside the United States. The news on this front is encouraging. Europe, the other key market for domestically-manufactured health care equipment, has lately seen a pickup in new orders and coupled with the loss of momentum in the trade-weighted U.S. dollar signal that future export growth will remain upbeat (trade-weighted U.S. dollar shown inverted and advanced, bottom panel, Chart 20). The global PMI has historically led exports. While this series has turned down, it has been diverging from export growth for the past year. We believe this is a function of the early stages of a secular trend in health care equipment: the expansion of the EM safety net with health care at its core. The same demographic trend that has been driving the explosion of health care spending in the DM for the last 20 years is rapidly impacting the EM, namely an aging population. The UN projects that the share of the population aged 65 and older in the EMs will rise from roughly 7% this year to 16% in 2060, while population growth slows to below the replacement rate, a tectonic shift in the demographic landscape (Chart 21). Meanwhile, according to IMF data, EM health care spending is approximately 5% of GDP. By contrast, the DMs stand in excess of 14%. Chart 20The Export Valve Is Wide Open
The Export Valve Is Wide Open
The Export Valve Is Wide Open
Chart 21
A catch-up phase looms, driven by both demographics and an overall global harmonization of standard of care, resulting in a secular outperformance of internationally geared health care equipment manufacturers’ earnings. This bodes well for U.S. health care equipment providers who are the technology leaders and often the only source for equipping hospitals/clinics around the globe. Notwithstanding the bright outlook, fear selling in the S&P health care equipment index has driven a reversal in the two-year valuation rerating that the index has undergone (bottom panel, Chart 22). With the valuation retreating back to its historical range, our main concern that the index is too expensive has eroded. Further, the valuation decline is coming at a time when forward earnings growth has come out of hiding and is now slated to materially outgrow the broad market (middle panel, Chart 22). Chart 22Valuations Have Returned To Earth
Valuations Have Returned To Earth
Valuations Have Returned To Earth
Bottom Line: Something has to give in this equation and macro tailwinds suggest that a valuation re-rating phase looms. Accordingly, we are moving to an overweight recommendation on the S&P health care equipment index. This move pushes our S&P health care index to an above benchmark allocation and also moves our cyclical vs. defensive preference back to neutral. The ticker symbols for the stocks in the S&P health care equipment index are: BLBG: S5HCEP – ABT, MDT, DHR, BDX, SYK, ISRG, BSX, BAX, EW, ZBH, IDXX, RMD, TFX, HOLX, ABMD, VAR. BCA’s Geopolitical Strategy echoes the tenor of these recommendations and is going long the S&P 500 health care index and the health care equipment index versus the broad market. A Word On Pharma Between 1980 and 2000, pharma earnings expanded at a record clip, taking sector share prices into the stratosphere (top panel, Chart 23). Since the zenith in the early 2000’s, margins have been continually under pressure as R&D costs have outpaced volume gains (second panel, Chart 23). However, earnings growth has continued mostly uninterrupted as the industry has raised drug prices. Since 2015, however, price increases have flat lined and now they move at the same pace as overall inflation, though the current convoluted system keeps pricing mostly opaque (bottom panel, Chart 23). We think this is the new normal. The thesis of this report revolves upon a blue vs. red probability outcome. However, as noted, both parties seem united in the fight against high drug costs and Republicans under President Trump are not averse to government intervention to drive down prices. As such, we expect the pharma pricing headwinds to remain a secular trend, driven by outrage from both sides of the aisle and even universal coverage is not enough to bear the pressure. Accordingly, we reiterate our underweight recommendation. Chart 23Pharma Remains Underweight
Pharma Remains Underweight
Pharma Remains Underweight
Conclusion Universal health care will be negative for the U.S. budget deficit but positive for economic growth. As for the macroeconomic impact of universal health care, it is complex to assess because much would depend on the extent of any reduction in private health-related sectors. Almost certainly, the U.S. would adopt a parallel system where private health care remains available, but there inevitably would be some job losses in the insurance sector. And drug companies would face downward pressure on pricing. On the other hand, the marked increase in government spending would be stimulative. And we do not see future American administrations exercising a heretofore unknown fiscal discipline once such a new entitlement is established. Many families would enjoy a reduction in health care costs. Overall, it should be positive for economic growth. Matt Gertken, Vice President Geopolitical Strategy mattg@bcaresearch.com Chris Bowes, Associate Editor U.S. Equity Strategy ChrisB@bcaresearch.com Anastasios Avgeriou, U.S. Equity Strategist anastasios@bcaresearch.com Footnotes 1 The filibuster is a means of prolonging debate and obstructing a vote. It can be defeated if 60/100 senators vote to move to end debate (“cloture”). It effectively ensures that the three-fifths majority is the standard majority needed to pass legislation in the senate. However, it is possible for the senate majority leader, backed with a simple majority, to alter the senate rules and remove the filibuster, so legislation can be passed with a simple majority. But it would be an aggressive move and a historic precedent. 2 Please see BCA U.S. Equity Strategy Weekly Report, “Portfolio Positioning For A Late Cycle Surge” dated May 22, 2018, available at uses.bcaresearch.com. 3 Please see BCA U.S. Equity Strategy Weekly Report, “Sector Performance And Fed Loosening Cycles: A Historical Roadmap” dated May 6, 2019, available at uses.bcaresearch.com. Current Recommendations
Highlights Currency markets continue to fight a tug of war between weak incoming data but easier financial conditions. Our thesis remains that the path of least resistance for the dollar is down, but the rising specter of global market volatility suggests it could catapult to new highs before ultimately reversing. Most of our pro-cyclical trades have been put offside in this environment of rising volatility. Maintain tight stops until more evidence emerges that global growth has bottomed. Large net short positioning in the Swiss franc and yen, together with cheap valuations, make them attractive from a contrarian standpoint. Hold on to CHF/NZD positions recommended on April 26. Feature Our thesis remains that global growth is in a volatile bottoming process. However, incoming data pretty much across the globe has been very weak, with the latest specter of a global trade war suggesting that economic softness could linger for longer than we originally anticipated. Given the shifting market dynamics, it is important to revisit our thesis on how to be positioned in currency markets. We do so this week via the lens of the Australian dollar, one of the market’s favorite short positions. Future reports will focus on additional global growth barometers, and when to time the shift towards a more pro-cyclical stance. Positive Divergences Chart I-1Global Growth Barometers Flashing Amber
Global Growth Barometers Flashing Amber
Global Growth Barometers Flashing Amber
On the surface, most data points appear negative for the Aussie dollar. Typical reflation indicators such as commodity prices, emerging market currencies, and industrial share prices are breaking down after a nascent upturn earlier this year. One of our favorite indicators on whether or not easing liquidity conditions will lead to higher growth are the CRB Raw Industrials index-to-gold, copper-to-gold, and oil-to-gold ratios. It is disconcerting that these indicators have moved decidedly lower together with U.S. bond yields, another global growth barometer (Chart I-1). On a similar note, currencies in emerging Asia that sit closer to the epicenter of Chinese stimulus are breaking down. This suggests that so far, policy stimulus in China has not been sufficient to lift global growth, and/or the transmission mechanism towards higher growth is not working. Not surprisingly, the Australian dollar has been breaking down at a rapid pace, putting our long AUD/USD position offside. We will respect our stop-loss at 0.68 if breached, but a few indicators suggest the bearish view on the Australian dollar is very late: Chart I-2Australian Stocks Hitting New Highs
Australian Stocks Hitting New Highs
Australian Stocks Hitting New Highs
Election Results: The recent general election outcome was a big surprise to the market, and has eased risks to both the country’s banks and housing market. The center-left Labour party, which moved further to the left in this electoral cycle, was defeated by a substantial margin. This has a few important implications. First, “negative gearing” – the practice of using investment properties that are generating losses to offset one’s income tax bill – will remain in place. This was a big overhang on the housing market, which likely exacerbated the downturn in Aussie house prices. Second, the capital gains tax exemption from selling properties will probably not be reduced from 50% to 25%, as previously pledged. Finally, the Liberal-National coalition government will maintain the policy of reimbursing investors for corporate taxes paid by the underlying company. This keeps the incentive for retirees to own high dividend-yielding equities such as those of Australian banks. Australian equities hit a new cyclical high following the election results. This suggests the return on capital for Aussie companies may have inched higher following the more pro-market leadership shift (Chart I-2). At low levels of interest rates, fiscal policy is much more potent than monetary policy. Interest Rates: The latest Reserve Bank Of Australia (RBA) minutes suggest that rate cuts are back on the agenda. But the question is, with the markets pricing in two rate cuts by the end of this year, does it still pay to be short the Aussie dollar on widening interest rate differentials? More importantly, fiscal policy is set to become decisively loose this year. The new government is slated to introduce income tax cuts as early as July. This is skewed towards lower-income households, meaning the fiscal multiplier may be larger than what the Australian economy is normally accustomed to. Meanwhile, infrastructure spending will remain high, which will be very stimulative for growth in the short term. At low levels of interest rates, fiscal policy is much more potent than monetary policy, and the RBA will be loath to cut rates more than is currently expected by the market, at a time when consumer indebtedness remains quite high, and policy rates are already close to rock-bottom levels. The key for the RBA will be the job market, which at the moment remains a pillar of support for the Aussie economy. Job growth is accelerating, and labor force participation is hitting fresh highs (Chart I-3). So long as these trends continue, the RBA can afford to remain on the sidelines for a while longer. Meanwhile, while Aussie rates continue to drift downward, it has not been particularly profitable to buy U.S. Treasurys on a hedged basis (Chart I-4). Chart I-3Australia Employment Remains Robust
Australia Employment Remains Robust
Australia Employment Remains Robust
Chart I-4It is Expensive To Short The Aussie
It is Expensive To Short The Aussie
It is Expensive To Short The Aussie
Housing Market: For more than two decades, the Australian dollar has tended to be mostly driven by external conditions, especially the commodity cycle. But for the first time in several years, domestic factors have joined in to exert powerful downward pressure on the currency. The Australian Prudential Regulation Authority (APRA) has been on a mission to surgically deflate the overvalued housing market, while engineering a soft landing in the economy. Initially, their macro-prudential measures worked like a charm, as owner-occupied housing activity remained resilient relative to “investment-style” housing. What has become apparent now is that the soft landing intended by the authorities has rapidly morphed into a housing crash (Chart I-5). This is negative for consumption, both via the wealth effect and as well as for the outlook for residential construction activity. Chart I-5Could Australian Housing Bottom Soon?
Could Australian Housing Bottom Soon?
Could Australian Housing Bottom Soon?
The good news is that policy is supposed to become supportive for Aussie homebuyers at the margin, with the government slated to introduce new initiatives to help first-time homebuyers. Should labor market improvements continue, it will also help household income levels. Over the past few decades, house prices in Australia have generally staged V-shaped recoveries when at this level of contraction. Betting on at least some stabilization going forward seems reasonable. Commodity Prices: One bright spot for the Aussie dollar has been rising terms of trade. Admittedly, most measures of Chinese (and global) growth remain weak. However, there have been notable improvements in recent months that suggest economic velocity may be picking up: Production of electricity and steel, all inputs into the overall manufacturing value chain, are inflecting higher. Intuitively, these tend to lead overall industrial production. If these advance any further, they will begin to exceed GDP growth, indicating a renewed mini-cycle (Chart I-6). Production of electricity and steel, all inputs into the overall manufacturing value chain, are inflecting higher. In recent months, both steel and iron ore prices have been soaring. Many commentators have attributed these increases to supply bottlenecks and/or seasonal demand. However, it is evident from both the manufacturing data and the trend in prices that demand is also playing a role. Meanwhile, Beijing’s clear environmental push has lifted the share of liquefied natural gas in Australia’s export mix (Chart I-7). Given that the reduction – if not the outright elimination – of pollution is a long-term strategic goal in China, this will be a multi-year tailwind. As the market becomes more liberalized and long-term contracts are revised to reflect higher spot prices, the Aussie dollar will get a boost. Chart I-6Some Green Shoots From China
Some Green Shoots From China
Some Green Shoots From China
Chart I-7Australian LNG Will Buffet Terms Of Trade
Australian LNG Will Buffet Terms Of Trade
Australian LNG Will Buffet Terms Of Trade
Valuation: In terms of currency performance, a lot of the bad news already appears priced in to the Australian dollar, which is down 15% from its 2018 peak, and 38% from its 2011 peak. Meanwhile, Australian dollar short positions appeared to have already hit a nadir. This suggests outright short AUD bets are at risk from either upside surprises in global growth or simply the forces of mean reversion (Chart I-8). One of our favorite metrics for the Australian dollar’s fair value is its real effective exchange rate relative to its terms of trade. On this basis, the Aussie dollar is cheap by about 10% (Chart I-9). Chart I-8Short AUD: ##br##A Consensus Trade
Short AUD: A Consensus Trade
Short AUD: A Consensus Trade
Chart I-9AUD Is Attractive From A Terms Of Trade Perspective
AUD Is Attractive From A Terms Of Trade Perspective
AUD Is Attractive From A Terms Of Trade Perspective
China Credit Cycle: We have discussed at length how a revival in the Chinese credit cycle will help global and Australian growth. On the real estate front, residential property sales remain soft, but evidence from tier-1 and even tier-2 cities is signaling that this may be behind us, given robust sales. Over the longer term, the ebb and flow of property sales have usually been in sync across city tiers. A revival in the property market will support construction activity and investment. Chart I-10How Long Will The Weakness In China Last?
How Long Will The Weakness In China Last?
How Long Will The Weakness In China Last?
House prices have been rising to the tune of 10%-15% year-on-year, and may be sniffing an eventual pick-up in property volumes. Finally, Chinese retail sales including those of durable goods remain very weak. Car sales are deflating at the fastest pace in over two decades. But the latest VAT cut by the government is being passed through to consumers, with an increasing number of car manufacturers cutting retail prices. This should help retail sales (Chart I-10). Other Global Growth Barometers Investors looking for more clarity on the global growth picture from the April and May data prints remain in a quandary. And the preliminary European PMI numbers this morning offered no glimmers of hope. That said, the most volatile components of euro area growth tend to be investment and net exports. Should they both pick up on the back of stronger external demand, GDP could easily gravitate towards 1.5%-2%, pinning it well above potential. The German PMI is currently among the weakest in the euro zone. But forward-looking indicators suggest we may be on the cusp of a V-shaped bottom over the next month or so (Chart I-11). Chart I-11German Manufacturing Might Be At The Cusp Of A V-Shaped Recovery
German Manufacturing Might Be At The Cusp Of A V-Shaped Recovery
German Manufacturing Might Be At The Cusp Of A V-Shaped Recovery
The broad message is that global growth is in the midst of volatile bottoming process. However, before evidence of this fully unfolds, markets are likely to be swayed by the ebbs and flows of higher-frequency data. We recommend maintaining a pro-cyclical bias at the margin, but having tight stop losses as well as positions in both the Swiss franc and yen as insurance. Housekeeping Our buy-limit order on the British pound was triggered at 1.30 on March 29th. As we argued at the time, the pound was sitting exactly where it was after the 2016 referendum results, but the odds of a hard Brexit had significantly fallen. Since then, policy-induced volatility has led to a significant depreciation in the pound, with our position at risk of being stopped out at our 1.25 stop-loss this week. Given the rising specter of political volatility, we will respect our stop-loss if breached at 1.25. On the domestic front, economic surprises in the U.K. relative to both the U.S. and euro area continue to soar. The reality is that the pound and U.K. gilt yields should be much higher – solely on the basis of hard incoming data. Employment growth has been holding up very well, wages are inflecting higher, and the average U.K. consumer appears in decent shape (Chart I-12). The CPI data this week confirm that the domestic environment is hardly deflationary. That said, given the rising specter of political volatility, we will respect our stop-loss if breached at 1.25. Chart I-12Hold GBP/USD, But Stand Aside At 1.25
Hold GBP/USD, But Stand Aside At 1.25
Hold GBP/USD, But Stand Aside At 1.25
Chester Ntonifor, Foreign Exchange Strategist chestern@bcaresearch.com Currencies U.S. Dollar Chart II-1USD Technicals 1
USD Technicals 1
USD Technicals 1
Chart II-2USD Technicals 2
USD Technicals 2
USD Technicals 2
Recent data in the U.S. have been soft: The Michigan consumer sentiment index jumped to 102.4 in May. However, the Chicago Fed national activity index fell to -0.45 in April. The Redbook index increased by 5.4% year-on-year in May. Existing home sales contracted by 0.4% month-on-month to 5.2 million in April. Moreover, new home sales fell by 6.9% month-on-month in April. The Markit composite index fell to 50.9 in April. The manufacturing and services PMI fell to 50.6 and 50.9 respectively. Importantly, this a just a nudge above the 50 boom/bust level. DXY index initially increased by 0.3%, then plunged on the weak PMI data, returning flat this week. The FOMC minutes released on Wednesday reiterated that the recent drop in core inflation is mostly transitory, and that no strong evidence exists for a rate change in either direction. With the forward market already pricing an 82% probability of a rate cut this year, any hawkish shift by the Fed will be a surprise. However, this will not necessarily be bullish for the dollar, if accompanied by a global growth bottom. We remain of the view that the path of least resistance for the dollar is down. Report Links: President Trump And The Dollar - May 9, 2019 Take Out Some Insurance - May 3, 2019 Currency Complacency Amid A Global Dovish Shift - April 26, 2019 The Euro Chart II-3EUR Technicals 1
EUR Technicals 1
EUR Technicals 1
Chart II-4EUR Technicals 2
EUR Technicals 2
EUR Technicals 2
Recent data in the euro area have been mixed: Headline consumer price inflation was unchanged at 1.7% year-on-year in April, while core inflation increased to 1.3%. The current account balance narrowed to a surplus of 24.7 billion euros in March. However, this was above expectations. German GDP was unchanged at 0.6% year-on-year in Q1. The euro area Markit composite PMI was flat at 51.6 compared to the last reading of 51.5. Below the surface, both the manufacturing and services PMIs fell to 47.7 and 52.5, respectively. German composite PMI was held up at 52.4 by the services component that came in at 55. However, the manufacturing component fell to 44.3. German IFO current assessment dropped to 100.6 in May, and the business climate dropped to 97.9. In France, the Markit composite PMI came in at 51.3. The manufacturing and services PMIs both increased, to 50.6 and 51.7 respectively. This was the one bright spot in euro area data. EUR/USD has been flat this week, with recent data being on the softer side. The PMI data remain subdued, in particular. Meanwhile, political uncertainties continue to weigh on investors’ sentiment. Report Links: Take Out Some Insurance - May 3, 2019 Reading The Tea Leaves From China - April 12, 2019 Into A Transition Phase - March 8, 2019 The Japanese Yen Chart II-5JPY Technicals 1
JPY Technicals 1
JPY Technicals 1
Chart II-6JPY Technicals 2
JPY Technicals 2
JPY Technicals 2
Recent data in Japan have been mixed: Q1 annualized GDP grew by 2.1% quarter-on-quarter, well above estimates. Industrial production fell by 4.3% year-on-year in March, but was higher than the previous reading of -4.6% in February. Capacity utilization fell by 0.4% month-on-month in March. Exports contracted by 2.4% year-on-year in April, while imports increased by 6.4% year-on-year. The total trade balance thus narrowed from ¥528 billion to ¥64 billion. Notably, the exports to China fell by 6.3%, while exports to the U.S. increased by 9.6%. Machinery orders fell by 0.7% year-on-year in March. Nikkei manufacturing PMI fell below 50, coming in at 49.6 in May. USD/JPY fell by 0.5% this week. Yutaka Harada, a dovish member of the BoJ, warned during a news conference that by hiking the consumption tax rate at this critical juncture, Japan could risk sliding into a recession. With core CPI far from its 2% target, more monetary easing is probably exactly what the doctor ordered. Report Links: Beware Of Diminishing Marginal Returns - April 19, 2019 Tug OF War, With Gold As Umpire - March 29, 2019 A Trader’s Guide To The Yen - March 15, 2019 British Pound Chart II-7GBP Technicals 1
GBP Technicals 1
GBP Technicals 1
Chart II-8GBP Technicals 2
GBP Technicals 2
GBP Technicals 2
Recent data in the U.K. have been firm: The Rightmove house price index increased by 0.1% year-on-year in May. The orders component of the CBI industrial trends survey decreased to -10 in May. Retail sales increased by 3% year-on-year in April. Producer prices and input prices increased by 2.1% and 3.8%, year-on-year respectively in April. Headline inflation and core inflation increased by 2.1% and 1.8% year-on-year in April, both below expectations. GBP/USD decreased by 0.6% this week. Teresa May offered MPs a vote on a second referendum on Brexit, which considers a tighter customs union with the EU. The ongoing Brexit chaos has increased volatility in the pound. Report Links: Take Out Some Insurance - May 3, 2019 Not Out Of The Woods Yet - April 5, 2019 A Trader’s Guide To The Yen - March 15, 2019 Australian Dollar Chart II-9AUD Technicals 1
AUD Technicals 1
AUD Technicals 1
Chart II-10AUD Technicals 2
AUD Technicals 2
AUD Technicals 2
Recent data in Australia have been mostly negative: ANZ Roy Morgan weekly consumer confidence index increased to 117.2 this week. Westpac leading index fell by 0.1% month-on-month in April. Completed construction work fell by 1.9% in Q1. AUD/USD fell by 0.3% this week. During this week’s federal election, the coalition government led by Prime Minister Scott Morrison won. Besides the political development, the RBA governor Philip Lowe gave a speech on Monday, highlighting external shocks to Australian economy. He also expressed the positive outlook for Australian economy in the second half of 2019 and 2020, supported by the ongoing capex in infrastructure and resources sectors, together with strong population growth. More importantly, he mentioned that the RBA would consider the case for lower interest rates, which is a dovish shift from previous speeches. We are long AUD/USD with a tight stop at 0.68. Report Links: Beware Of Diminishing Marginal Returns - April 19, 2019 Not Out Of The Woods Yet - April 5, 2019 Into A Transition Phase - March 8, 2019 New Zealand Dollar Chart II-11NZD Technicals 1
NZD Technicals 1
NZD Technicals 1
Chart II-12NZD Technicals 2
NZD Technicals 2
NZD Technicals 2
Recent data in New Zealand have been mixed: Credit card spending growth missed expectations, coming in at 4.5% year-on-year in April. Retail sales increased by 0.7% quarter-on-quarter in Q1. Retail sales excluding autos increased by 0.7% quarter-on-quarter in Q1. NZD/USD fell by 0.3% this week. NZD/USD is currently trading at a 7-month low around 0.65. A bleak external picture is worrisome for the kiwi. We continue to favor the AUD/NZD cross, from a strategic standpoint. Report Links: Not Out Of The Woods Yet - April 5, 2019 Balance Of Payments Across The G10 - February 15, 2019 A Simple Attractiveness Ranking For Currencies - February 8, 2019 Canadian Dollar Chart II-13CAD Technicals 1
CAD Technicals 1
CAD Technicals 1
Chart II-14CAD Technicals 2
CAD Technicals 2
CAD Technicals 2
Recent data in Canada have been solid: Retail sales increased by 1.1% month-on-month in March. In particular, retail sales excluding autos increased by 1.7% month-on-month, well above estimates. USD/CAD appreciated by 0.3% this week. The better-than-expected retail sales data in March sparked a small rally in the loonie. However, the rally proved to be short-lived following softer oil prices. Positive data surprises in Canada will have to be sustained for the loonie to find some measure of support. Report Links: Currency Complacency Amid A Global Dovish Shift - April 26, 2019 A Shifting Landscape For Petrocurrencies - March 22, 2019 Into A Transition Phase - March 8, 2019 Swiss Franc Chart II-15CHF Technicals 1
CHF Technicals 1
CHF Technicals 1
Chart II-16CHF Technicals 2
CHF Technicals 2
CHF Technicals 2
Recent data in the Switzerland have been positive: Money supply (M3) growth was unchanged at 3.5% year-on-year in April. Industrial production increased by 4.3% year-on-year in Q1, albeit lower than the last reading of 5.1%. USD/CHF fell by 0.8% this week. As we argued in last week’s research note, the increasing global market volatility has reignited interest in the Swiss franc. We continue to recommend the franc as an insurance policy amid rising geopolitical risk. Report Links: What To Do About The Swiss Franc? - May 17, 2019 Beware Of Diminishing Marginal Returns - April 19, 2019 Balance Of Payments Across The G10 - February 15, 2019 Norwegian Krone Chart II-17NOK Technicals 1
NOK Technicals 1
NOK Technicals 1
Chart II-18NOK Technicals 2
NOK Technicals 2
NOK Technicals 2
There was little data out of Norway this week: The unemployment rate came in at 3.5% in March, well below consensus of 3.7% and the previous reading of 3.8%. USD/NOK fell by 0.4% this week. Rising geopolitical risks will be supportive of the oil market and put a floor under the krone. Aside from the U.S.-Iran tensions, the world faces the prospect of the loss of Venezuelan production, and significant outages in Libya, which are all bullish. Meanwhile, Norway remains one of few G10 countries that can hike interest rates in the near term. Report Links: Currency Complacency Amid A Global Dovish Shift - April 26, 2019 A Shifting Landscape For Petrocurrencies - March 22, 2019 Balance Of Payments Across The G10 - February 15, 2019 Swedish Krona Chart II-19SEK Technicals 1
SEK Technicals 1
SEK Technicals 1
Chart II-20SEK Technicals 2
SEK Technicals 2
SEK Technicals 2
Recent data in Sweden have been positive: Capacity utilization increased by 0.5% in Q1. Moreover, the unemployment rate fell to 6.2% in April. This was well below expectations of 6.8% and the previous month’s reading of 7.1%. USD/SEK fell by 0.3% this week. While we favor both the NOK and SEK against the U.S. dollar, near-term factors are more bullish for the krone. Our long NOK/SEK position is currently 4.38% in the money. Stick with it. Report Links: Balance Of Payments Across The G10 - February 15, 2019 A Simple Attractiveness Ranking For Currencies - February 8, 2019 Global Liquidity Trends Support The Dollar, But... - January 25, 2019 Trades & Forecasts Forecast Summary Core Portfolio Tactical Trades Closed Trades
Highlights So What? Markets remain complacent about U.S.-China trade. Why? The U.S. has escalated the trade war by threatening sanctions on key Chinese tech firms. Chinese President Xi Jinping is preparing his domestic audience for protracted struggle. U.S. domestic politics do not prohibit, and likely encourage, a tough stance on China. Farmers are not a constraint on Trump — economic growth is. Go long spot gold and JPY-USD. Feature Markets remain complacent. Chart 1 suggests that while the combination of unilateral trade tariffs and spiking U.S. 10-year Treasury yields was enough to sink the S&P 500 in 2018, the former alone cannot do so today. Chart 1Tariffs Alone Not Enough To Sink Equities? Wrong.
Tariffs Alone Not Enough To Sink Equities? Wrong.
Tariffs Alone Not Enough To Sink Equities? Wrong.
Specifically, the increase in the Section 301 tariff rate from 10% to 25% on $200 billion worth of Chinese imports and the threat of a new 25% tariff on the remaining $300 billion worth of Chinese imports in just a month’s time has only led to a 3% pullback in equities since May 3. That was the last trading day prior to President Donald Trump’s infamous tweet about hiking the tariff. Unlike the trade war escalation in October through November of last year, the Federal Reserve is no longer hiking rates, China’s economic indicators have bottomed, and U.S. equity investors have now fully imbibed the “Art of the Deal.” The consensus holds that the escalation of trade tensions with China is contained within the context of Trump’s well-known routine of inflicting pain and then compromising. We would wager that the bond market is right and equities are wrong. Equities will converge to the downside, unless the market receives a concrete positive catalyst that improves the near-term outlook for U.S.-China relations and hence global trade. The problem is that for equities such a catalyst could happen at any time in the form of additional Chinese stimulus. Therefore, higher volatility is the only guaranteed outcome. The sudden onslaught of U.S. pressure makes it harder for Chinese President Xi Jinping to offer structural concessions to his American counterpart without looking weak. It was easier to do so when the threat of tariffs was under wraps, as was the case between December 1 and May 5. This new obstacle informed our decision to close out our long China equities and long copper trades and downgrade our end-June trade deal probability from 50% to 40%. But the escalation of tensions makes stimulus more likely to surprise to the upside, which will at least partially offset the negative hit to global sentiment and the trade outlook. Waiting For A Positive Political Intervention Three negative geopolitical catalysts loom in plain sight, while investors are still waiting on a positive catalyst. The negatives: China has not yet announced retaliation to the U.S. Commerce Department’s blacklisting of Huawei and a handful of other Chinese tech firms; the U.S. could implement the blacklist within three months, increasing the risk of a broader “tech blockade” against China; and the U.S. authorities are prepared to extend tariffs to all Chinese goods in one month. Meanwhile there are no high-level talks currently scheduled between the principal Chinese and American negotiators as we go to press. This could change quickly. But if negotiating teams do not hold substantive meetings with positive reports afterwards, then investors cannot be sure that Presidents Donald Trump and Xi Jinping will speak to each other, let alone finalize a substantive trade deal, at the G20 in Japan on June 28-29. The macro backdrop is hardly encouraging: global export volumes are contracting and the dollar’s fall may be arrested amid a huge spike in global policy uncertainty. Any rebound in the greenback will pile additional pressure onto trade flows, at least until the market sees a substantial increase in Chinese stimulus (Chart 2). Furthermore, it is concerning that President Trump, a businessman president and champion of American manufacturing, is raising tariffs at a time when lending and factory activity are already slowing in the politically vital Midwestern states (Chart 3). The implication is that he is unfazed by economic risks and therefore less predictable. He is pursuing long-term national foreign policy objectives at the expense of everything else. This may be patriotic but it will be painful for global equity investors. Chart 2Trump Unfazed By Deteriorating Global Economy
Trump Unfazed By Deteriorating Global Economy
Trump Unfazed By Deteriorating Global Economy
Chart 3Economic Activity Is Already Slowing
Economic Activity Is Already Slowing
Economic Activity Is Already Slowing
Chart 4Markets Blasé About Looming Risks
Markets Blasé About Looming Risks
Markets Blasé About Looming Risks
It is not only the S&P 500 that is failing to register the dangerous combination of weak global trade and escalating U.S.-China strategic conflict. Our colleague Anastasios Avgeriou of the BCA U.S. Equity Strategy points out that the “Ted spread,” the premium charged on interbank lending over the risk-free rate, is as docile as the safe-haven Japanese yen (Chart 4). President Xi Jinping, however, is not so blasé. He took a trip to Jiangxi province on May 20 to declare that China is embarking on a “new Long March.” This is a reference to the legendary strategic withdrawal executed by the early Chinese Communist Party in its civil war against the nationalists in 1934-35. It was an 8,000-mile slog across the rugged terrain of western and central China, peppered with battles against warlords and nationalists, in which nearly nine-tenths of the communist troops never made it. It is a historical event of immense propagandistic power used to celebrate the CPC’s resilience and ultimate triumph over corrupt and capitalist forces backed by imperialist Western powers. Most importantly, the Long March culminated in Mao Zedong’s consolidation of power over the party and ultimately the nation. In short, President Xi just told President Trump to “bring it on,” as he apparently believes that a conflict with the U.S. will strengthen his rule. The S&P 500 and the “Ted spread” are failing to register the dangerous combination of weak global trade and escalating U.S.-China strategic conflict. Trump, meanwhile, operates on a much shorter time horizon. He is coming closer to impeachment, as House Speaker Nancy Pelosi sharpens her rhetoric and negotiations over a bipartisan infrastructure bill collapse. Impeachment will fail and in the process will most likely help Trump’s reelection chances. But gridlock at home means that one of our top five “Black Swan” risks for 2019 is now being activated: Trump is at risk of becoming a lame duck and is therefore looking for conflicts abroad as a way of stirring up support at home. Bottom Line: The bad news in the trade war is all-too-apparent while good news is elusive. Yet key “risk off” indicators have hardly responded. We recommend going long JPY-USD on a cyclical basis on the expectation that the market will continue to have indigestion until a positive catalyst emerges in the trade talks. Trump’s Trade War Calculus
Chart 5
The trade war is focused on China more so than other states – and Trump likely has the public backing for such a conflict. President Trump delayed any Section 232 tariffs on auto and auto parts imports this month as the China trade war escalated (Chart 5). This confirms our reasoning that the nearly 50/50 risk of tariffs on car imports from Europe and Japan (recently upgraded from 35%) is contingent on first wrapping up a China deal. Another signal that Trump is conscientious not to saddle the equity market with too many trade wars is the decision finally to exempt Canada and Mexico from Section 232 aluminum and steel tariffs (Chart 6). It is now possible for Canada to ratify the deal before parliament dissolves in late June and for the U.S. and Mexico to follow. American ratification will involve twists and turns as the Democrats raise challenges but their obstructionism is ultimately fruitless as it will not hurt Trump’s approval ratings and labor unions largely support the new deal. Meanwhile a major hurdle relating to Mexican labor standards has already been met. These are positive developments for these markets and yet they call attention to a critical point about the Trump administration’s trade strategy: Trump has not shown much willingness to compromise his trade demands with allies in order to secure their cooperation in pressuring China. The threat of car tariffs is still looming over Europe (and even Japan and South Korea). In fact, a united front among these players would have made it much harder for China to resist structural changes (Chart 7). Chart 6Canada And Mexico Are Off The Hook
Canada And Mexico Are Off The Hook
Canada And Mexico Are Off The Hook
Chart 7A 'Coalition Of The Willing' Would Be More Effective
A 'Coalition Of The Willing' Would Be More Effective
A 'Coalition Of The Willing' Would Be More Effective
Nevertheless, we have long held that China, not NAFTA or Europe, would be the focus of Trump’s ire because there is much greater consensus within the U.S. political establishment on the need for a more muscular approach to China grievances, and hence fewer constraints on Trump. This view has now come full circle, at least for the time being. Bear in mind that while Republicans and even Democrats have a favorable view of international trade, in keeping with an improving economy (Chart 8), the U.S. as a whole is more skeptical of free trade than most other countries (Chart 9). The economy is insulated and globalization has operated unchecked for several decades, generating resentment.
Chart 8
Chart 9
Chart 10
This is especially relevant with China. Americans have an unfavorable view of China’s trade practices and China in general (Charts 10 and 11). This perception is getting worse as the great power competition heats up. Even a majority or near-majority of Democrats view China’s cyber-attacks, ownership of U.S. debt, environmental policies, and economic competition as causes of real concern (Chart 12). This means Trump is closer to the median voter when he is tough on China.
Chart 11
Chart 12
The result is a lower chance of a “weak deal,” i.e. a short-term deal to reduce the trade deficit primarily through Chinese purchases of commodities, since this will be a political liability for Trump. He may be forced into such a deal if the market revolts (say 35% odds). But otherwise he will hold out for something better, which Xi Jinping may be unwilling to give. China, not NAFTA or Europe, is the focus of Trump’s ire. This is why we rank “no deal” at 50%, more likely than any kind of deal (40%), though there is some chance of an extension of talks beyond the June G20 (10%). Bottom Line: The delay of auto tariffs and progress in replacing NAFTA suggest that the Trump administration is cognizant of the negative market impact of its trade wars and the need to focus on China. However, the risks to Europe and Japan are not yet removed. And any Chinese concessions will be weaker than might otherwise have been possible had Trump created a “coalition of the willing” to prosecute China’s violations of global trading norms. A weak deal makes it more likely that strategic conflict is the result. Trump Beats Bernie Beats Biden? Or Vice Versa? U.S. domestic politics are also pushing Trump in the direction of conflict with China. The American voter’s distrust of China explains why former Vice President Joe Biden, and leading contender for the Democratic Party nomination in 2020, recently caught flak from both sides of the aisle for being soft on China. At a campaign stop in Iowa on May 1, Biden said, “China is going to eat our lunch? Come on, man … They’re not competition for us.” He has made similarly dovish comments in the recent past. It makes sense, then, that Trump is trying to link “Sleepy Joe” (as he calls Biden) with weakness on China and trade. Biden, who is still enjoying a very sizable bump to his polling a month after formally announcing his candidacy (Chart 13), is a direct threat to Trump’s electoral strategy of maximizing white blue-collar turnout and support, particularly in the Midwestern swing states. Biden was on the ticket when President Barack Obama won these states in 2008 and 2012. He is a native son of Pennsylvania. And he appeals to the same voters as a plain-talking everyman.
Chart 13
Both Biden and Democratic Socialist Bernie Sanders of Vermont are beating Trump in the very early head-to-head polling for the 2020 presidential race. In fact, Sanders has a bigger lead over Trump than Biden in many of these polls (Chart 14).
Chart 14
Yet Sanders has a narrower path to victory in the general election – he is heavily dependent on the Rustbelt, where he could either win based on repeating the 2016 results in a new demographic context (the “Status Quo” scenario in Chart 15), or by winning back the blue-collar voters who abandoned the Democrats for Trump in 2016 (the “Blue Collar Democrats” scenario). Sanders performed well in these states in the Democratic primary in 2016, whereas he struggled in the South.
Chart 15
Chart 16Democrats Swung Too Far Left For Many Independents
Democrats Swung Too Far Left For Many Independents
Democrats Swung Too Far Left For Many Independents
Biden, on the other hand, is capable of winning not only in these two scenarios, but also by rebuilding the Obama coalition. He has a better bid to win over the black community due to his close association with Obama and his command of Democratic Party machinery, plus potentially his choice of running mate (the “Obama vs. Trump” scenario). By this means Biden, unlike Sanders, can compete against Trump in the Sun Belt and South in addition to the Midwest. Therefore, it is all the more imperative for Trump to try to corner Biden and frame the debate about Biden early. Trump may also be betting that despite the head-to-head polling, Sanders is too far left for the median voter. While the Democratic Party swings sharply to the left, the median voter remains more centrist, judging by the fact that independent voters (who make up half the electorate now) only slightly favor Democrats over Republicans, a trend that is only slightly rising (Chart 16). Biden’s polling is strong enough that he holds out the prospect of winning the Democratic nomination relatively smoothly, without deepening the ideological split in the party too much. Whereas Trump would benefit in the general election if Democrats suffered an internal split over a bloody primary season in which Bernie Sanders clawed his way to the nomination. The hit to American farmers is probably not a significant political constraint on President Trump waging his trade war. The upshot is that Trump is vulnerable in U.S. politics and will attempt to take action to strengthen his position. Meanwhile if Biden’s position on trade changes then we will know that he reads the Midwestern voter the same way Trump does – as a protectionist. Bottom Line: Trump’s eagerness to attack Biden reveals the specific threat that Biden poses to Trump’s electoral strategy as well as Trump’s calculus that a belligerent position on China is a vote-getter in the key Midwestern swing states. We expect Biden to become more hawkish on China, which will emphasize the long-term nature of the U.S.-China struggle and confirm the median voter’s appetite for hawkish policy. American Farmers Unlikely To Alter The 2020 Playing Field
Chart 17
Chart 18
Yet can Trump’s political base withstand the trade war? And can he possibly win the swing states if the trade war is escalating and damaging pocketbooks? There are many stories about farmers in the Midwest and other purple states who are deeply alarmed at Trump’s trade policies, prompting questions about whether he could be unseated there. American farmers have been among the hardest hit in the trade war. China was a major market for U.S. agricultural exports prior to the conflict (Chart 17). Since then U.S. agriculture has struggled, as exports to China have declined by more than 50% y/y in 2018 (Chart 18). Agricultural commodity prices are down ~10% since a year ago, with soybeans – the poster child of the conflict – trading at 10 year lows. Net farm incomes – a broad measure of profits – were on a downward trend prior to the trade war (Chart 19). While the USDA estimates that overall U.S. farm income will increase by 8.1% y/y this year, this follows a nearly 18% y/y decline in 2018 to reach the lowest level since 2002 (Chart 20). The recent escalation of the trade war will weigh on these incomes.
Chart 19
Chart 20
A common narrative in the financial media is that this hit to American farmers is a significant political constraint on President Trump in waging his trade war. He could be forced to accept a watered-down deal with China to preserve this voting bloc’s support ahead of November 2020, the thinking goes. Possibly, but probably not because of farmers abandoning the Republican Party en masse. First of all, rural counties and small towns continued supporting the Republican Party in the 2018 midterms, at a time when the initial negative impact of the trade war was front-page news (Chart 21). Second, some of the key farm states are unlikely to be key swing states in the election. Take soybeans, for example. Prior to the trade war, nearly 60% of U.S. soybean exports, and more than a third of U.S. soybeans, ended up in China. Illinois is the top producer, followed by Iowa and Minnesota. Last year soybean production in these three states accounted for 15%, 13%, and 8% of total U.S. production, respectively. As such, agriculture and livestock products exports to China in 1Q2019 are down 76% y/y in Illinois and 97% y/y in Minnesota. However, Trump won Iowa by nearly 150 thousand votes, a 9.4% margin, and there are not enough farmers in the state to overturn that margin. The negative impact on soybeans could prevent Trump from picking up Minnesota, where he lost by only 1.5% of the vote. But Minnesota is unlikely to cost him the White House in 2020. The picture is different in the key swing states of Michigan, Pennsylvania, and Wisconsin. Farming accounts for only ~1% of jobs in Michigan, Ohio, and Pennsylvania – and 2.3% of jobs in Wisconsin – and thus farmers represent a small share of the voting bloc in these states (Chart 22). But Trump won Michigan by a mere 0.23% of the vote, Pennsylvania by 0.72%, and Wisconsin by 0.77%. If one-fifth of farmers in these states switched their vote, Trump’s 2016 margin of victory would vanish.
Chart 21
Chart 22
Of course, manufacturers are a much larger voting bloc (Chart 23). And rural voters are unlikely to shift to the Democrats on such a large scale. Moreover, ag exports from these states have generally held up (Chart 24), the majority of their exports are destined for North America rather than China. The benefit from the recent thaw in North American trade relations will outweigh the loss of China as a market (Chart 25).
Chart 23
Chart 24
The Trump administration is also producing an aid package worth at least $15 billion to shield farmers at least partially from the trade war impact.1 This compares to an estimated $12 billion loss in net farm income in 2018.
Chart 25
Chart 26
Ultimately, Trump is much more threatened by other voting groups in these states. Young voters, women, minorities, suburbanites, and college-educated white voters all pose a threat to his thin margins if they turn out to vote and/or increase their support for the Democratic Party in 2020. A surge in Millennials, for instance, played the chief role in unseating Republican Governor Scott Walker in Wisconsin in 2018 (Chart 26). While midterm elections differ fundamentally from presidential elections, the Republicans lost 10 out of 12 significant elections in the Midwest during the midterms (Table 1). Table 1Republicans Lost Almost All Significant Midwest Elections In The Midterm
Is Trump Ready For The New Long March?
Is Trump Ready For The New Long March?
It is true that the winning Democratic candidates in the six major statewide races in Michigan, Pennsylvania, and Wisconsin all had voters who believed Trump’s trade policies were more likely to “hurt” the local economy than help it, according to exit polls (Chart 27). At the same time, a majority of voters believed that the trade policies either “helped” the local economy or “had no impact,” as opposed to hurting it. And Democrats are somewhat divided on this issue. Health care, not the economy, was the primary concern of voters. Moreover, health care, not the economy, was the primary concern of voters, especially Democratic voters (Chart 28). Republicans cared more about the economy and tended to support Trump’s trade policies.
Chart 27
Chart 28
In sum, unless the trade war causes a general economic slowdown that changes voter priorities, Trump’s chief threat in 2020 comes from urban and suburban voters angry over his attempt to dismantle the Affordable Care Act, rather than from farmers suffering from the trade war. The large bloc of manufacturing workers in the Midwestern battleground states helps to explain why Trump is willing to wage a trade war at such a critical time: loyal rural counties bear the brunt of the economic pain yet a tough-on-China policy could bring out swing voters from the manufacturing sector in suburbs and cities. Bottom Line: Trump could very well lose agriculture-heavy swing states in 2020, but it would not be because of losing his base among rural voters. Rather, it would be a result of a broader economic slowdown – or a superior showing of key demographic groups in favor of Democrats for other reasons like health care. The large bloc of manufacturing voters relative to Trump’s margins of victory helps to explain his aggressive posture on the trade war. Investment Conclusions Go long JPY-USD on a cyclical, 12-month horizon in the context of escalating trade war, complacent markets, and yet the prospect of additional Chinese stimulus improving global growth. This trade should be reinforced by the specific hurdles facing Japan over the next three to 18 months. While we would not be surprised if a trade agreement with the U.S. is concluded quickly, even ahead of any U.S.-China deal, nevertheless Japan faces upper house elections, a potential consumption tax hike, and preparations for a contentious constitutional revision and popular referendum on the cyclical horizon. On the expectation of greater Chinese stimulus, we are maintaining our long China Play Index call, which is up 2.2%. As a hedge against both geopolitical risk and the impact of Chinese stimulus over the cyclical horizon, go long spot gold. Matt Gertken, Vice President Geopolitical Strategy mattg@bcaresearch.com Roukaya Ibrahim, Editor/Strategist Geopolitical Strategy RoukayaI@bcaresearch.com Footnotes 1 While the plan is yet to be finalized, payments of ~$2/bushel to soybean farmers, $0.63/bushel to wheat farmers, and $0.04/bushel to corn farmers are under consideration. Unlike last year when the payments were distributed according to farmers’ current production, a potential modification to this year’s plan is that the payments will be distributed based on this years’ planted acreage and past yields.
Highlights So What? Odds of a total breakdown in U.S.-China relations are highly underrated. Why? The key market-relevant geopolitical event is Trump’s large risk appetite. Inflationary pressures resulting from the trade tariffs are not prohibitive for Trump’s trade war. Chinese stimulus will surprise to the upside, but a massive stimulus package will depend on talks collapsing and maximum tariffs. Markets will sell before they recover. We will maintain our current portfolio hedge of Swiss bonds and gold. Feature Chart 1Equities Sell, Safe Havens Rally
Equities Sell, Safe Havens Rally
Equities Sell, Safe Havens Rally
Global equities have sold off and safe-haven assets caught a bid since the near-breakdown in U.S.-China trade negotiations on May 5 (Chart 1). Yet financial markets are still complacent, as the 2.8% drawdown to date on global equities and the S&P 500 does not yet reflect the depth of the geopolitical risk to sentiment and corporate earnings. To understand this risk we need to step away from the ups and downs of the trade negotiations and ask, What have we learned about U.S. policy over the past month and what does it mean for global markets on a cyclical and structural horizon? We have learned that in the lead-up to the 2020 election, President Trump is not seeking to protect his greatest asset – namely, a strong American economy – but rather to solidify his support through new ventures. By imposing the full brunt of sanctions on Iran and hiking the tariff rate on Chinese imports, Trump has made two highly significant decisions that could jeopardize the American voter’s pocketbook, with a full 18 months to go before November 3, 2020. Why has he done this? Because he believes the American economy can take the pain and he will achieve resounding foreign policy successes. These, he hopes, will make his reelection more likely. President Trump’s aggressive posture is a direct threat to the global equity bull market due to (1) higher odds of a negative shock to global trade when global growth is already weak, and (2) higher odds of an oil price shock due to a potential vicious spiral of Middle East conflict. Wreaking Havoc Historically, the United States thrives when the rest of the world is in chaos. This was obviously the case during World War I and II (Chart 2). But it also proved true in the chaotic aftermaths of the Soviet Union’s collapse and the global financial crisis, though the U.S. did suffer along with everyone else during the 2008-09 downturn. American equities have generally outperformed during periods of global chaos (Chart 3). Chart 2America Thrives Amid Global Chaos
America Thrives Amid Global Chaos
America Thrives Amid Global Chaos
Chart 3U.S. Equities Outperform During Global Crises
U.S. Equities Outperform During Global Crises
U.S. Equities Outperform During Global Crises
The reasons for U.S. immunity are well known: the U.S. has a large, insulated, consumer-driven economy; it has immense economic advantages enhanced by its dominance of North America; it has vast and liquid financial markets; and it is the world’s preponderant technological and military power. This position enables Washington to act more aggressively than other capitals in pursuit of the national interest – and to recover more quickly from mistakes. Chart 4U.S. Preponderance Declining
U.S. Preponderance Declining
U.S. Preponderance Declining
It follows that there is an influential idea or myth that the country can or should exploit this advantage, when necessary or desirable, by “wreaking havoc” abroad. The prime example is the preemptive invasion of Iraq. In this way Washington can turn the tables on its opponents and keep them off balance. The Trump administration, regardless of Trump’s intentions, could soon become the epitome of this school of thought. First, it is true that, structurally, American preponderance has been decreasing: despite various crises, there has been sufficient peace and prosperity in the twenty-first century to see the rest of the world’s wealth, trade, and arms grow relative to the United States (Chart 4). With the rise of China and resurgence of Russia, U.S. global leadership is at risk and the Trump administration has adopted unorthodox policies to confront its rivals and try to reverse this process. Second, cyclically, President Trump is stymied at home after his Republican Party lost the House of Representatives in the 2018 midterm election. Scandals and investigations plague his inner circle. Unable to secure funding for his signature campaign promise – the southern border wall – Trump faces the risk of irrelevance. Foreign policy, especially trade policy, thus becomes the clearest avenue for him to try to notch up victories. Trump faces the risk of irrelevance. Foreign policy thus becomes the clearest avenue for him to try to notch up victories. Bottom Line: The key market-relevant event over the past month has been the Trump administration’s demonstration of voracious risk appetite. This is fundamentally a cyclical not tactical risk to the bull market due to tit-for-tat tariffs, sanctions, and provocations with rivals like China and Iran. Pocketbooks Versus Patriotism Trump’s vulnerability becomes clear by looking at our electoral Map 1, which highlights his excruciatingly thin margins of victory in the critical “swing states” in the 2016 election. We emphasize the margin of victory among white voters – which are slightly higher than the margins overall – because the Trump campaign courted the white working class specifically in a calculated strategy to swing the Midwest “Rustbelt” states and win the election.
Chart
The problem for Trump is that while whites remain the majority of the eligible voting population, it is a declining majority due to demographic change. Demographics is not near-term destiny, but the vanishingly thin margins ensure that Trump cannot assume that he will win reelection without generating even more turnout and support among blue-collar whites in the key states.
Chart 5
Job creation and rising incomes are the chief hope. The problem is that Trump’s tax cuts and the red-hot economy in 2018 did not prevent Republicans from getting hit hard in the midterm elections, especially in the Midwest. Moreover today’s resilient economy is not preventing the top two Democratic candidates, former Vice President Joe Biden and independent Vermont Senator Bernie Sanders, from beating Trump in head-to-head polling in the key swing states (Chart 5). Trump’s national approval rating, at about 44%, is nearly as good as it gets, but the indications from the Midwest are worrisome, especially because the economy has slowed. If the economy is not winning the argument on the campaign trail in 2020, Trump will need to have another leg to stand on. In addition to hammering home his attempts to build a wall on the border, Trump will highlight his economic nationalism. Protectionism has won the Rustbelt over the past three elections. As we have since 2016 argued, this now boils down to pressure on China. If Trump’s policies provoke China (or Iran) to take aggressive actions, he will have a pretext to exercise American power in a way that will likely create a rally-around-the-flag effect, at least in the short term. Elections do not normally hinge on foreign policy, but they certainly can. While President Trump may not actually want a war with Iran, he knows that George W. Bush cruised to victory amid the Afghan and Iraqi wars. Or he may have in mind 1964, when Lyndon B. Johnson crushed Barry Goldwater, an offbeat, ideological “movement candidate” (can anyone say Bernie Sanders?) in the face of a hulking communist menace, the Soviet Union. A conflict with China (or Iran) could serve similar purposes in 2020, either distracting the populace from a weakening economy or adding to an election bid centered on a reaccelerating economy. The problem is that a patriotic conflict with China or Iran is an insurance policy that threatens to undermine the health and safety of the very thing being insured: the U.S. economy. Indeed, U.S. stocks did not outperform after the September 11th attacks or during the Bush administration’s wars abroad. In essence, Trump is a gambler and is now going for broke. This constitutes a huge risk to the global economy and financial markets – a risk that was subdued just a month ago due to oil sanction waivers and tariff-free trade talks. Bottom Line: President Trump is courting international chaos because his policy priorities are tied down with gridlock and scandal at home. Aggressive foreign policy is a strategy to rack up policy victories and potentially expand his voter base, but it comes at the risk of higher policy uncertainty and negative economic impacts that could derail this year’s fledgling economic rebound and the long-running bull market. “No Deal” Is More Likely Than A Weak Deal It wasn’t just a tweet that sent volatility higher over the past two weeks. Most likely, President Trump decided to raise tariffs on China at the advice of his trade negotiators, who had become convinced that China was not offering deep enough concessions (“structural changes”) and was playing for time. This was always the greatest risk in the trade talks. China is indeed playing for time, as it has no security guarantee from the United States and therefore cannot embrace structural changes in the way that Japan did during the U.S.-Japanese trade war in the 1980s. Originally, the talks were set to last 90 days with the tariff hike by March 1. Trump was apparently determined not to lose credibility on this threat as China drew out the negotiations. Hence, he piled on the pressure to try to force a conclusion by the June 28-29 G20 summit in Japan, which has been the target date for our trade war probabilities over the past several months (Table 1). We have now adjusted those probabilities to upgrade the risk that talks collapse (50%) and downgrade the odds of a deal to 40% by that date. Table 1U.S.-China Trade War: Probabilities Of A Deal By End Of June 2019
How Trump Became A War President
How Trump Became A War President
The underlying calculation from the Trump administration is that a cosmetic, short-term deal – along the lines of the NAFTA renegotiation – will be difficult to defend on the campaign trail and hence politically risky. We upgraded the risk that talks collapse (50%) and downgraded the odds of a deal to 40% by end of June. If China agreed arbitrarily to increase imports from the U.S. by 10% by 2020, it would only increase the level of imports above the pre-trade war 2015-18 trend by $23 billion dollars in 2029 (Chart 6, panel 1). It would also have a minimal impact on the trade deficit. The deficit has increased so much in recent years that the impact of a 10% increase in exports by 2020 would merely offset the high point we reached during the trade war, leaving Trump with a mere $800 million per year by 2029 (Chart 6, panel 2).
Chart 6
For commodities in particular – where China offered the largest purchases – the negative impact of the trade war has been so great that a 10% increase by 2020 over the status quo would fail to offset the recent damages over a ten-year period. China would have to increase imports by at least 17% to offset the trade war-induced decreases. If commodity imports were 30% higher in 2020 than otherwise, the impact 10 years down the line would amount to a mere $11 billion per year. These gains are smaller, as Chinese negotiators have long argued, than what could be made if the U.S. increased exports of advanced technology products to China. If the U.S. exported as many of these products to China as it does to the EU, as a share of EU GDP, it would amount to a $48 billion increase in exports. For Japan, the equivalent would be an $85 billion increase. Increasing the growth of these exports to China to match the recent trend of such exports globally would nearly double the amount sent to China by 2029, earning the U.S. an additional $60 billion that year (Chart 6, panel 3). The problem, of course, is that the confrontation with China is specifically focused on the latter’s technological acquisition and competition with the United States – it is precisely not about making reductions to the trade deficit at the expense of technological superiority. The tech war is more likely to derail the trade talks than the trade talks are likely to resolve the tech war. It is hugely significant that, at the moment of decision, President Trump sided with U.S. Trade Representative Robert Lighthizer and did not accept a deal focused on marginal improvements to the trade deficit. There was always a strong possibility – we previously put it at a 50% chance – that Trump would accept a short-term deal in order to get a “quick win” and minimize tariff pains ahead of the election, while punting the longer-term structural grievances until his second term when he would be less constrained by the economy. But this possibility has clearly fallen. We now put it at 35%, as shown in Table 1 above. Trump sees a shallow deal as a political liability. The most important takeaway from Table 1, however, is that the odds of a “Grand Compromise” have dropped to a mere 5%. Trump still may settle for a deal to reduce economic risks ahead of the election, but a grand compromise is very hard to get. Bottom Line: Our adjusted trade war probabilities suggest that global equities can fall further on a tactical horizon and that downside risks are grave, given a 50% chance that talks utterly collapse by the end of June. This would include a 30% chance of igniting an intense period of saber-rattling, sanctions, and Cold War-esque tensions that would cause a global flight to quality. Won’t The Trade War Turn Voters Against Trump? No.
Chart 7
While geopolitical and political constraints push against a weak deal, the economic constraints of a failure to conclude a deal are not prohibitive. The latest tariff hike doubles the dollar magnitude of the tariffs, and an additional 25% tariff on the remaining $300 billion of imports would more than quadruple the magnitude of the tariffs from the April 2019 level (Chart 7). With all U.S. imports from China affected, price rises will percolate upward through all tradable industries and consumer goods. A few points are worth noting: The domestic value-add of Chinese exports to the U.S. is not as low as consensus holds. China’s manufacturing sector is highly competitive, comparable to the EU and Germany in the degree to which its exports to the U.S. incorporate foreign value (Chart 8). This means that Americans cannot substitute other goods for Chinese goods as easily as one might think.
Chart 8
There remains a massive gulf between the nominal output of China’s manufacturing sector and the rest of Asia (Chart 9). Strategically it makes sense for the U.S. to want to decrease China’s share of American imports from Asia and reduce China’s centrality to the production process. But Asia cannot yet substitute for China. In practical terms this requires spreading China’s concentrated production system across the Indonesian archipelago. It is inefficient and will raise costs and import prices. Even in areas where China is lacking – such as technology, institutions, and governance – it still has a productivity advantage over the rest of Asia, pointing yet again to the cost-push inflationary consequences of an abrupt transition forced by tariffs (Chart 10). Chart 9Asia Cannot Replace China ... Yet
Asia Cannot Replace China ... Yet
Asia Cannot Replace China ... Yet
Chart 10China's Productivity Beats Rest Of Asia
China's Productivity Beats Rest Of Asia
China's Productivity Beats Rest Of Asia
Nevertheless, these cost factors are not so great as to force Trump into a weak deal. While the new and proposed tariff expansions will impact consumer goods more than the earlier batches that attempted to spare the consumer, the truth is that Chinese imports do not comprise a large share of the U.S. consumer basket (Chart 11). Chart 11American Shoppers Not Too Exposed To China
American Shoppers Not Too Exposed To China
American Shoppers Not Too Exposed To China
Chart 12Goods Price Inflation Not An Immediate Risk
Goods Price Inflation Not An Immediate Risk
Goods Price Inflation Not An Immediate Risk
Goods prices have been flat in the U.S., albeit in great part because of China, and they have fallen while the consumer price index and the real wage component of the CPI have risen by more than 20% since 2001 (Chart 12). Moreover, it is precisely in consumer goods where the American shopper does have considerable ability to substitute away from China – as opposed to the American corporation, which will have a harder time replacing Chinese-made capital goods quickly (Table 2). Thus, the risk impacts Wall Street differently than Main Street. Table 2Capital Goods Harder To Substitute
How Trump Became A War President
How Trump Became A War President
Further, the median American household’s real income growth is still elevated (Chart 13). This comes on top of the fact that net household worth and the saving rate are both in good shape. President Trump has some leeway in waging his trade war. The risk, of course, is that this income growth is decelerating and Trump has given the tariffs 18 months to cause negative impacts for consumers prior to the election. He is also simultaneously wagering that the U.S.’s newfound energy independence – and his own ability to tap the strategic petroleum reserve – will prevent gasoline prices from spiking (Chart 14). This would occur as a result of any Iranian-backed attacks on oil production and export facilities across the Middle East. Chart 13American Household Still In Good Shape
American Household Still In Good Shape
American Household Still In Good Shape
Chart 14Fuel Prices Already Rising
Fuel Prices Already Rising
Fuel Prices Already Rising
Bottom Line: Inflationary pressures will result from trade tariffs (and Iranian sanctions) but they are not prohibitive for Trump thus far. This is not a recipe for cost-push inflation significant enough to trigger a recession or derail Trump’s reelection odds at present, but it is a risk that will need to be monitored. How Will China Respond? More Stimulus! The immediate ramification of a heightened trade war is deteriorating global trade and sentiment and hence slower global growth that pushes down prices. Indeed, the escalation of the trade war brings sharply into focus two long-running Geopolitical Strategy themes: Sino-American Conflict: U.S. and Chinese exports to each other have already sharply fallen off (Chart 15). Trade is interconnected so this will further depress global and Asia-ex-China exports. Chart 15Trade War Hurts Bilateral Trade ... And All Trade
Trade War Hurts Bilateral Trade ... And All Trade
Trade War Hurts Bilateral Trade ... And All Trade
Chart 16Global Trade Already Rolling Over
Global Trade Already Rolling Over
Global Trade Already Rolling Over
Apex of Globalization: Global trade as a whole is contracting as a result of the global slowdown, which the trade war has exacerbated (Chart 16). The negative impact on China is acute and threatens something akin to the global manufacturing recession of 2015 (Chart 17). Given that the trade war is now piling onto a merely fledgling rebound in Chinese and global growth this year, it is possible that the manufacturing slowdown could even get worse than 2015 and culminate in a global recession in our worst case scenario of a major strategic escalation. Preventing this outcome, China will increase fiscal-and-credit stimulus, which we have argued is likely to overshoot expectations this year due to trade war and the country’s desire to meet 2020 urban income goals (Chart 18). The magnitude should be comparable to the 2015-16 stimulus, unless a global recession is immediately in view, in which case it will be larger. Chart 17A Relapse Would Point Toward 2015-Sized Crisis
A Relapse Would Point Toward 2015-Sized Crisis
A Relapse Would Point Toward 2015-Sized Crisis
It was the Xi administration that undertook the huge 2015-16 expansion of credit, so this magnitude is not out of the question. While Xi has attempted to contain leverage and reduce systemic financial risk, he is ultimately like his predecessors, most notably Jiang Zemin, in the sense that he will aim for social stability above all. Chart 18China Will Keep Stimulating
China Will Keep Stimulating
China Will Keep Stimulating
The pain threshold of today’s policymakers has already been discovered, seeing how President Xi and the Politburo began easing policy in July 2018 after the U.S. implemented the initial Section 301 tariffs. The Chinese leaders were willing to tighten credit controls until this external risk materialized. The fact that the trade war is the proximate cause of heightened stimulus was confirmed in the wake of the Buenos Aires summit, where Xi chose to stimulate the economy further – resulting in a surge of credit in Q1 – as a way of improving China’s leverage vis-à-vis the United States in the 90-day talks. China will increase fiscal-and-credit stimulus … The magnitude should be comparable to the 2015-16 stimulus. In short, Xi and his government will stimulate first and ask questions later. Both fiscal and credit stimulus will be utilized, including traditional fiscal infrastructure spending and permissiveness toward shadow banking. A dramatic renminbi depreciation could occur but would be evidence that talks will fail (Chart 19). Chart 19Currency Agreement: Far From A Plaza Accord
Currency Agreement: Far From A Plaza Accord
Currency Agreement: Far From A Plaza Accord
Stimulus will continue to be tactical, rolled out in piecemeal announcements, at least as long as the trade talks continue and there is a prospect of China’s economy rebounding without drastic measures. Only a total breakdown in negotiations – and collapse into outright Cold War – will prompt a massive stimulus package. Bottom Line: Chinese stimulus will surprise to the upside while talks are going, and it will increase dramatically if talks collapse. This will ultimately support global growth but it will not prevent market riots between a negative policy shock and the point at which markets are totally reassured about the magnitude of stimulus. How Will The Negotiations Proceed? Precariously. The risk of a strategic conflict is much higher than the markets are currently pricing. This is highlighted in Table 1 above, but there are additional reasons to have a high conviction on this point. We can demonstrate this by constructing a simple decision tree that outlines the step-by-step process by which the U.S. and China will proceed in their negotiations after the May 10 tariff rate hike (Diagram 1). To these we attach subjective probabilities that we believe are fair and slightly conservative. The result shows that it is not difficult to conclude that the conditional probability of a long-term, durable trade agreement is a mere 4%, whereas the conditional probability of an uncontained escalation in strategic tensions is as high as 59%! This is a much worse outcome than our actual view as expressed in Table 1. Diagram 1A Simple Decision Tree Says Geopolitical Risks Are Huge
How Trump Became A War President
How Trump Became A War President
A similar exercise – an analysis of competing hypotheses conducted according to analytical techniques used by the U.S. intelligence community – reinforces the point that the most likely scenario is a major escalation in tensions, while the least likely is a “grand compromise” (Appendix). While our final trade war probabilities in Table 1 are not as pessimistic as these exercises suggest, the latter reinforce the point that the market is too sanguine. An increase in tariffs after five months of negotiations, with a threat to impose even more sweeping tariffs with a one-month deadline, is not conducive to Chinese concessions and therefore increases the odds of talks failing and an escalation in strategic conflict unprecedented in U.S.-China relations since the rupture from 1989-91. And this rupture would be considerably worse for the global economy. The Trump administration’s political logic is willing to accept such a conflict on the basis that a foreign policy confrontation can produce a rally-around-the-flag effect whereas a short-term deal that does not address significant technological and national security concerns is a political liability on the campaign trail. Yes, it is important that Presidents Trump and Xi are making verifiable preparations to attend the G20 summit in Japan. But they could cancel their attendance or snub each other at the event. In our view investors should wait for something more substantial to become more optimistic about political risk – such as public commitments to structural changes by China and a complementary tariff rollback schedule by the United States. Bottom Line: The odds of a total breakdown in U.S.-China relations and a Cold War-style escalation of strategic conflict are highly underrated. Markets will sell before they recover. Investment Implications Chart 20China's Nuclear Option Might Fizzle
China's Nuclear Option Might Fizzle
China's Nuclear Option Might Fizzle
Equity markets are exposed to further downside in the short run. Even a minor escalation is not fully priced according to our Global Investment Strategy’s equity market forecasts based on our own geopolitical scenario probabilities (see Table 1 above). Our Chief Global Strategist Peter Berezin would recommend increasing exposure to risk if the S&P 500 falls 5% from current levels, other factors being equal. Cyclically, any trade agreement will fail to bring substantial benefits to the U.S.-China trade and investment outlook over a horizon beyond 12-24 months. The tech industries of the two countries will not benefit greatly from the deal. While multinational corporations exposed to the Asian manufacturing supply chain could suffer earnings downgrades from trade war, China’s stimulus will be a countervailing factor, particularly for commodities and commodity-oriented EMs. Therefore, we will keep our China Play Index and long Indonesia trades in place despite near-term risks. Ironically, U.S. treasuries can rally even when China is reducing its holdings, as global demand rises amid crisis (Chart 20). However, given that bonds have already rallied and we expect Chinese stimulus to come sooner rather than later, we will maintain our current portfolio hedge of Swiss bonds and gold, which is up 2%. We are closing our long small caps trade for a loss of 11.9%. Matt Gertken, Vice President Geopolitical Strategist mattg@bcaresearch.com Appendix
Image
Highlights So What? Investors should look to European assets for considerable upside. Why? In the Euro Area, investors have constantly overestimated the angst of the median voter towards the currency union. The European Parliament has few real powers, so a fractured European Parliament does not really matter. Europe’s high-beta economy should benefit from a Chinese and global rebound. Stronger European growth will translate into more credit demand and lower non-performing loans, which will boost bank earnings. Go long European banks as a tactical trade, and long European equities versus Chinese equities as a strategic play. We will also consider going long EUR/USD as a strategic play once we get clarity on potential tariffs. Feature
Chart 1
Europe’s economy and asset markets continue to underperform in 2019 despite a global policy pivot away from tightening monetary policy and a solid quarter of Chinese credit growth. Investors are broadly unattracted to continental Europe, regularly voicing fears that it is beset by a combination of hazards: from a no-deal Brexit to the ballooning Target 2 imbalances. According to the latest Bank of America Merrill Lynch survey of fund managers, the most crowded trade remains “short European equities” (Chart 1). The doom and gloom are intriguing considering that China is stimulating its economy and will continue to do so as long as trade tensions are elevated. “Higher beta” equities, including Europe and EM, should benefit from this stimulus (Chart 2). Exports, a key growth engine for the currency union, are closely linked to Chinese credit growth (Chart 3). Chart 2Chinese Stimulus Good For "High Beta" Economies
Chinese Stimulus Good For "High Beta" Economies
Chinese Stimulus Good For "High Beta" Economies
Chart 3Europe Will Benefit From Improving Chinese Growth
Europe Will Benefit From Improving Chinese Growth
Europe Will Benefit From Improving Chinese Growth
And yet Europe remains unloved. Given that most client questions focus on the political situation – and that many ask about the upcoming May 23 European Parliament (EP) elections – we focus on both in this analysis. First, we review the latest survey data on the collective sentiment towards Europe and integration. Second, we give our insights regarding the upcoming EP elections. Our broad conclusion is simple. If our house view that global growth is about to bottom is correct, and barring a collapse in U.S.-China trade talks, European assets – primarily equities and the euro – should be the top performers this year. What Does The European Median Voter Want? The Median Voter Theory is a critical concept for investors. At BCA Research Geopolitical Strategy, we believe that the median voter – not the policymaker – is the price maker in the political market place. Politicians, especially in democracies, are price takers. They are bound by constraints, of which the preferences of the median voter are the most concrete impediments to action. This concept is simple to understand, but difficult to implement. It is far easier to get lost in rumor intelligence-driven analysis of political consultants and journalists who pass on the cocktail party chatter insights gathered through speaking with policymakers. These insights focus on the preferences of the people in power. But their preferences are secondary to those of the median voter. Trust in the EU remains below 50%, but this is in line with or better than the usual trust most governments achieve. Chart 4Support For The Euro Has Been Trending Upwards
Support For The Euro Has Been Trending Upwards
Support For The Euro Has Been Trending Upwards
In the Euro Area, investors have constantly overestimated the angst of the median voter towards the currency union. This has led many investors to keep their money off the table, or take active short positions, even when it was prudent to remain invested. The prime example is the sentiment towards the common currency itself. Support for the euro hit a low in 2013 but has shot up since then across the continent (Chart 4). Even in Italy, the support for the euro is now at an eight-year high. Many investors have remained blind to this empirical fact. Not only has the support for the currency rebounded, but it has done so by converting doubters. Chart 5 shows that the increased support for the common currency – particularly in Spain, Germany, the Netherlands, and Italy – has occurred at the same time as the opposition has fallen. In other words, it is not the “undecideds” that are switching into supporters of the euro, rather it is the opponents who are relenting. Chart 5ASupport For The Common Currency Rising...
Support For The Common Currency Rising...
Support For The Common Currency Rising...
Chart 5B...As Doubters Convert
...As Doubters Convert
...As Doubters Convert
Chart 6Support For The EU Also On The Rise
Support For The EU Also On The Rise
Support For The EU Also On The Rise
What of the support for the EU broadly defined? Latest Pew Research polling also shows a strong rebound in support among the public in the largest member states (Chart 6). The last time we published the data – in the summer of 2016 following Brexit – the figures were much lower. Given that for many Europeans the EU is merely another layer of bureaucracy and government, the support level is impressive when put in the international context. Chart 7 shows that the trust in the EU, compared to the trust Europeans have in their own governments, falls somewhere squarely in the middle. When compared to non-European countries, Europeans have considerably more trust in the EU than Americans have in their own government and in line with the sentiment of Japanese towards their own government. In other words, the trust in the EU remains below 50%, but this is in line with or better than the usual trust most governments achieve.
Chart 7
Why has the median voter remained supportive of European institutions despite mixed economic performance? For one, investors – particularly outside continental Europe – continue to overstate how much emphasis Europeans put on “economic prosperity” as a key goal of the integrationist process. Sure, everyone wants a humming economy, but Chart 8 shows that for most large European economies, “peace” and a “stronger say in the world” are more cogent explanations for the EU’s raison d’être than economic performance.
Chart 8
Now, a skeptic might argue that this is because the EU has failed to deliver on the promise of prosperity. Nonetheless, the data suggest that Europeans today no longer expect European institutions to focus primarily on economic matters. Geopolitics, particularly security and foreign policy, are not just concerns of the shadowy elites and bureaucrats in Brussels. The median voter is concerned with these matters as well. The one worrying aspect of Chart 8 is that voters in Italy and Spain don’t think the EU means much to them at all. That level of nihilism might be compatible with continued European integration today. However, it also means that both countries, particularly Italy, remain a risk whenever a recession hits. The second reason for the improvement in median voter support of European institutions is that the migration crisis of 2015 – which peaked in October 2015, merely eight months ahead of the fateful referendum in the U.K. – is done and gone (Chart 9). Illegal immigration is an issue of concern, but it has been for over half a century. In fact, every decade has seen a turn against immigration, usually following a recession. It is a recurring problem that will remain a major policy issue for the rest of the century. The path from a “policy problem” to “the end of European integration” is neither direct nor immediate. Third, terrorism has abated as an existential threat to Europe. Chart 10 shows that we have seen the end of the “bull market in terror” in Europe. Unfortunately, the data for that chart only goes to 2017, otherwise it would show an even more jarring collapse in both attacks and casualties. Chart 9The Migration Crisis Is No Longer A Crisis
The Migration Crisis Is No Longer A Crisis
The Migration Crisis Is No Longer A Crisis
Chart 10The "Bull Market In Terror" Is Over
The "Bull Market In Terror" Is Over
The "Bull Market In Terror" Is Over
The chart is also useful in putting the latest bout of terrorism – mainly of the radical Islamic variety – in its proper historical context. Europe has been riven with far left and nationalist terror (often both) since the late 1960s. The number of casualties per year in the 1970s was nearly two times greater than the peak of the recent bout of radical Islamic terror. This is largely the case even excluding the Troubles in Ireland and Northern Ireland. There is simply no evidence that the European median voter is moving towards Euroskepticism. Although it is difficult to make the connection, we would go on to posit that the abating of the migration crisis and bull market in radical Islamic terror has allowed the median voter in Europe to assess whether breaking apart the EU would truly resolve these crises. Elements of European integration, particularly the common labor market and Schengen Agreement – which is part and parcel of the integrationist evolution – definitely make it easier for migrants and terrorists to cross borders. However, the geopolitical forces that breed both are at least partly, if not completely, non-European in origin. As such, it is not clear how individual European countries that lack any hard power would deal with these events on their own. Thus European integration is not a policy born of strength but of weakness. Chart 11 illustrates this concept empirically. It shows the percent of respondents who think their country could better face the future outside the EU. The dotted line represents the pessimistic view. An astounding 87% of Dutch responders, for example, are pessimistic about the country’s future outside the EU. We pick on the Dutch because they have tended to vote for Euroskeptic parties. Similarly, a very high number of Germans, Finns, Swedes, French, and Spaniards are lacking confidence in “national sovereignty.” Only the Italians are flirting with “going it alone,” although even in their case the momentum for sovereignty appears to have stalled, as it has in traditionally Euroskeptic Austria. Chart 11AEuropeans Lack Confidence In National Sovereignty...
Europeans Lack Confidence In National Sovereignty...
Europeans Lack Confidence In National Sovereignty...
Chart 11B...And Believe They Are Better Off Sticking Together
...And Believe They Are Better Off Sticking Together
...And Believe They Are Better Off Sticking Together
Many investors approach European integration with an ideological slant. But charts don’t lie. Since we founded BCA Research Geopolitical Strategy, we have used Euro Area perseverance as the premier example of how an empirically-driven approach to political analysis can generate alpha. There is simply no evidence that the European median voter is moving towards Euroskepticism. A broad trend has existed since 2013 of rising support for the common currency, the euro. And a mini up-cycle in support for broader European institutions appears to be present since 2016, probably due to the combination of Brexit, an abating migration crisis, and the end of the bull market in terror. Bottom Line: The median voter supports both the euro and broad European integration. This is an empirical fact. But … Euroskeptics Are Winning Seats! Chart 12Anti-Establishment Parties Are Gaining Seats
Anti-Establishment Parties Are Gaining Seats
Anti-Establishment Parties Are Gaining Seats
Despite the comfort of our empirical data, the reality is that anti-establishment parties continue to increase their share of parliamentary seats across the continent (Chart 12). In the recent Spanish election, for example, the populist Vox managed to win 10.3% of the vote. Headlines immediately picked up on the extraordinary performance, noting that Euroskeptics have finally established a foothold in Spain. Spanish Prime Minister Pedro Sánchez, the leader of the victorious Socialist Party, has welcomed the characterization as a foil to his program, promising to build a pro-European bloc with other left-leaning parties. Sánchez is playing politics. He understands how broadly European integration is supported in Spain and is trying to paint his opponents – who disagree with him on many issues, but not on Spain’s membership in the EU and EMU – as being on the other side of the median voter’s preferences. In reality, Vox is not a hard Euroskeptic party. It is right wing on immigration, multiculturalism, and the centralization of the Spanish state, but on Europe Vox merely wants less integration from the current, already highly integrated level. Anti-establishment parties are realizing that the median voter does not want to abandon European integration. As such, the right-leaning anti-establishment parties are focusing on anti-immigrant and anti-multicultural policies, while the left-leaning are focusing on anti-austerity politics. But there appears to be an emerging truce on integration. We forecast this transition in our 2016 report titled “After Brexit, N-Exit?” We posited that anti-establishment parties would increasingly focus on anti-immigration policies, while reducing the emphasis on Euroskepticism, in order to remain competitive. We now have a number of examples of this process, from Italy’s Lega to Finland’s the Finns Party. Which brings us to the election at hand: the EP election on May 23.
Chart 13
Ironically, the EP election gives Euroskeptics the best chance at winning seats. First, the turnout has been falling for decades (Chart 13) given the dubious relevance of the legislative body (more on that below). Second, Euroskeptic voters tend to be highly motivated during EP elections as they get to vote “against Europe.” Third, ironically, EP elections allow Euroskeptics to build pan-European coalitions with their fellow skeptics. Despite the hype, the latest seat projections give Euroskeptics merely 26% of the seat total in the body, or just under 200 seats in the 750-seat body (Diagram 1). Chart 14 shows that the support for Euroskeptics has actually taken a serious dip following the Brexit referendum, with the overall continent-wide support remaining around 20%. This is broadly the same level at which the support was five years ago, giving Euroskeptic parties no gain in half a decade. Diagram 1Euroskeptics Expected To Hold Only A Quarter Of The Seats
European Parliament Election: Much Ado About A Moderately Relevant Event
European Parliament Election: Much Ado About A Moderately Relevant Event
Chart 14
All that said, if a fifth of Europe’s electorate is voting for anti-integrationist parties in the midst of the most important European-wide election, that must be a bad sign for Europe. Right? Wrong. The media rarely unpacks the Euroskeptics beyond citing their overall support figures. However, we have gone beyond merely citing the three leading Euroskeptic blocs. Instead, we have separated the individual Members of European Parliament (MEPs) from across the three Euroskeptic blocs into four camps: Eastern European Camp – These are MEPs from EU member states that are former members of the Warsaw Pact or former Republics of the Soviet Union. Hardcore Camp – These are committed Euroskeptics who genuinely want their countries to leave European institutions. The Dutch Party for Freedom wants to see the Netherlands leave both the EU and the EMU. However, parties such as the Swedish Democrats and the Finns Party are more nuanced. Nonetheless, we erred on the side of apocalypse and added them all to the hardcore camp. Classical Camp – These are MEPs who would have fit the Euroskeptic definition back in the 1990s. They generally do not have a problem with the EU, but tend to be skeptical of the EMU and definitely do not want to see any further integration (although some would welcome integration on the military front). Italy’s Lega belongs to this camp, at least since the 2017 election, given the reorientation of the party’s policy away from criticizing the EMU and toward anti-immigrant policies. On The Way Out Camp – The U.K. MEPs will eventually be forced to exit the EP given the eventual departure of the U.K. from the EU. In this camp, we have thrown all the U.K. MEPs who sit in Euroskeptic groupings, which includes both UKIP MEPs and Conservative Party members – even those who are not actually anti-EU. Diagram 2Almost Three Quarters Of Euroskeptic MEPs Are Bluffing
European Parliament Election: Much Ado About A Moderately Relevant Event
European Parliament Election: Much Ado About A Moderately Relevant Event
Diagram 2 shows the distribution of the currently 311 Euroskeptic MEPs. The largest portion, by far, are Eastern European MEPs. The second-largest portion are MEPs from the U.K., who are either on their way out or about to become the “lamest ducks” in the history of any legislature. What does this mean? First, that almost three quarters of the Euroskeptic MEPs are essentially bluffing. Eastern European Euroskepticism is a geopolitical oxymoron. Investors should ignore any Euroskeptic rhetoric from Eastern Europe for two reasons. First, many Eastern European economies remain highly dependent on the EU for structural funding (Chart 15). But even that crude measure does not illustrate the benefit of EU membership. If Eastern and Central European countries were to leave the EU, they would lose access to the common market, a huge economic cost given their close integration with the German manufacturing supply chain. Second, and perhaps more importantly, the EU is a critical geopolitical anchor for the former Warsaw Pact member states. As much as the Polish and Hungarian Euroskeptic MEPs like to speak of the “tyranny of Brussels,” they all remember all too clearly the actual tyranny of Moscow. As such, Eastern Europe’s Euroskepticism is a bluff, a rhetorical political tool to blame the ills of poor governance on Brussels for the sake of domestic political gains. It holds no actual threat to European integration or its institutions given that the alternative to Brussels is… Moscow.
Chart 15
This is why the three Euroskeptic blocs will find it difficult to cooperate in the future. The Eastern European-heavy European Conservatives and Reformists (ECR) are highly skeptical of Russia, as the largest party in the bloc is the Polish Law and Justice (PiS) Party. The PiS is highly critical of Moscow’s foreign policy and is the ruling party of Poland. Its rhetoric is on occasion illiberal and anti-EU, but it has also changed domestic policy when pressured by Brussels. The ECR is expected to be the smallest Euroskeptic party, with 55 MEPs. The genuinely hard-core Euroskeptic bloc is the Europe of Nations and Freedom (ENF). It is expected to win 58 MEPs and is dominated by genuine, long-time, anti-EU parties such as Marine Le Pen’s National Rally of France (formerly the National Front) and the Dutch Party for Freedom. However, its latest iteration is likely to be dominated by Matteo Salvini’s Lega, which is Italy’s ruling party and has taken a decided turn towards soft Euroskepticism. Finally, the moderately Euroskeptic Europe of Freedom and Direct Democracy (EFDD) is expected to win 57 seats. However, its largest bloc are the ruling Italian Five Star Movement (M5S) and an assortment of Euroskeptic British MEPs, including Niger Farage. Italy’s M5S has already toned down its Euroskeptic rhetoric given that it now sits in Rome and runs the EMU’s third-largest economy. Meanwhile, U.K. MEPs will be largely irrelevant, raising the question of whether EFDD should even be classified as Euroskeptic in the next EP. Bottom Line: When all is said and done, the European Parliament election is a much-hyped non-event. By our count, only about 60 out of approximately 190 Euroskeptic MEPs will be actual hard-core Euroskeptics (or, just 8% of the entire EP). The rest are either reformed centrists – the two major Italian parties, Lega and M5S – on their way out – U.K. Euroskeptics – or are just bluffing – all Eastern European MEPs. That said, the EP seat distribution will reflect the polarization and fracturing observed in most national parliaments across of Europe. It is likely that neither the center-left nor the center-right will have enough seats to select the European Commission President. Does Any Of This Even Matter? Does the EP election even matter? To answer this question, we first have to assess whether the European Parliament itself matters. Both the proponents and opponents of the EU overstate the bloc’s supranational institutions: the EP and the Commission. A fractured European Parliament does not really matter ... In fact, the European Parliament has few real powers. The true power in the EU is vested in the European Council. The European Council could be conceived of as an upper chamber of a combined EU legislature, the Senate to the European Parliament’s House of Representatives (to put into U.S. context). It is comprised of the heads of government of EU member states and is therefore elected on the national, not supranational, level. It is, by far, where most power resides in the EU. The Commission, on the other hand, is the EU’s technocratic executive. Its members are not democratically elected, but are chosen by the European Council and approved by both the Council and the EP.1 The EU Commission President is elected according to the Spitzenkandidat system. The party grouping that secures a majority governing coalition in the EP gets to name their leader as the candidate for the European Commission President. This system is not enshrined in EU law, it is merely a convention. In fact, it was designed to try to boost the voting turnout for the EP elections. The idea being that Europe’s voters would turn out to vote if it meant that their votes would ultimately determine who gets to head the European Commission. At the end of the day, the European Council has to approve the Spitzenkandidat. And, according to the letter of the law, the European Council can ultimately even ignore the Spitzenkandidat suggestions of the European Parliament and propose their own head of the European Commission. As such, the fact that Diagram 1 suggests a fractured European Parliament does not really matter. The European Council could, in the end, simply find a consensus candidate and have national governments instruct their MEPs to vote for that candidate in the EP. In fact, the European Parliament has few real powers. It is one of the only legislatures in the world with no actual legislative initiative (i.e., it cannot produce laws!). It gets to hold a ceremonial vote on new EU treaties – the treaties that act as a constitution of the bloc – but cannot veto them. On most important matters – including the EU budget – the Parliament cannot overrule the European Council (the heads of national governments), which means that it cannot subvert the sovereignty of the EU member states. In the political construct that is the EU, it is the upper-chamber that holds all the power (if we are to extend the analogy of the European Council as the “Senate”). Another important thing to remember is that MEPs are rarely unaffiliated. The vast majority are members of national parties on the national level. Few, if any, are actual supranational agents. In fact, most MEPs fall into two categories. They are either young up-and-comers being groomed for a successful career on the national level – the level that actually matters – or they are past-their-expiration-date elders looking for a cushy retirement posting that includes frequent, taxpayer-funded, trips between Brussels and Strasbourg. Bottom Line: The importance of the EP is vastly overstated by both Europhiles and Euroskeptics. Its role within the EU legislative process has been increasing through treaty evolution and convention. However, the true power in the EU still rests with the national governments and the EP can be sidelined if the European capitals so desire. Furthermore, while the EP is a supranational body with supranational powers, its soul is very much national. This is because most of its MEPs either have an eye on returning to domestic politics or are emeriti of domestic politics looking for one last bout of relevance. Investment Implications Given our sanguine view of European politics, and the BCA House View that global growth should bottom (Chart 16), investors should look to European assets for considerable upside. This is particularly the case if the U.S. and China overcome their cold feet and conclude a trade deal. Our colleague Peter Berezin, BCA’s Chief Investment Strategist, has proposed that investors go long European banks as a tactical trade. Peter has pointed out that banks are now trading at distressed valuations (Chart 17).2 Given a Chinese and global rebound, and barring a total relapse into trade war, Europe’s high-beta economy should benefit, leading to higher bond yields in core European markets.This has tended to help European bank stocks in the past (Chart 18). Stronger economic growth will also translate into more credit demand and lower non-performing loans. This will boost bank earnings (Chart 19). Chart 16Growth Is Recovering In The U.S. And China
Growth Is Recovering In The U.S. And China
Growth Is Recovering In The U.S. And China
Chart 17European Banks: A Good Value Play
European Banks: A Good Value Play
European Banks: A Good Value Play
Chart 18Euro Area: Higher Bond Yields Bode Well For Bank Stocks
Euro Area: Higher Bond Yields Bode Well For Bank Stocks
Euro Area: Higher Bond Yields Bode Well For Bank Stocks
Chart 19More Credit, Fatter Bank Earnings
More Credit, Fatter Bank Earnings
More Credit, Fatter Bank Earnings
In addition, U.S. dollar outperformance is long-in-the-tooth. If global growth is truly bottoming, and assuming a trade deal is done, then the policy divergence that has favored the greenback should be over (Chart 20). As such, we will consider going long EUR/USD as a strategic play once we get clarity on China tariffs and potential tariffs on U.S. auto imports (the latter risk is rising from 35% to 50% given Trump’s willingness to take risks this year). Chart 20If Trade War Subsides, Dollar May Fall
If Trade War Subsides, Dollar May Fall
If Trade War Subsides, Dollar May Fall
Chart 21A Reversal In Tech Outperformance Supports Long Europe/China
A Reversal In Tech Outperformance Supports Long Europe/China
A Reversal In Tech Outperformance Supports Long Europe/China
Finally, Dhaval Joshi, BCA’s Chief European Strategist, believes that Europe is a clear tactical overweight to China.3 Part of the reason is that the two markets are mirror opposites of each other in terms of sector skews. China is overweight technology and underweight healthcare, while Europe is overweight healthcare and underweight technology. The year-to-date outperformance by global technology stocks relative to healthcare is long in the tooth and ripe for a correction (Chart 21). Given our positive structural assessment of European political risk, we recommend going long European equities and short China as a strategic play. Marko Papic Consulting Editor marko@bcaresearch.com Footnotes 1 For the American context, the Commission would be what the various U.S. Departments would look like if they were serving at the pleasure of the U.S. Senate. While the analogy is not perfect, it does capture the fact that the EU’s executive is controlled by the European Council. 2 Please see BCA Global Investment Strategy Weekly Report, “King Dollar Is Due For A Breather,” dated April 26, 2019, available at gis.bcaresearch.com. 3 Please see BCA Research European Investment Strategy Weekly Report, “Suffering Market Vertigo,” dated May 2, 2019, available at eis.bcaresearch.com.
Highlights Foreign investors have been rushing into Indian equities in anticipation of a Modi win. While Modi’s chances are reasonable, he may not win an outright majority. Keep tactically underweighting Indian stocks for now. The structural outlook for Vietnam is strong and improving. A bottom in Vietnamese equities is in the making. Investors should overweight Vietnamese stocks within an EM equity portfolio. Feature Indian Equities: A Window Of Risk Remains Foreign investors have been rushing into Indian equities in anticipation of a win by current Prime Minister Narendra Modi in the upcoming general elections. As a result, Indian stocks have been outperforming the EM benchmark. Nevertheless, a window of risk for the Indian bourse remains. While Modi’s chances of winning the elections are reasonable, he and his party – the Bharatiya Janata Party, or BJP – may not win an outright majority in the lower house, as occurred in May 2014. While Modi’s chances of winning the elections are reasonable, he and his party – the Bharatiya Janata Party, or BJP – may not win an outright majority in the lower house, as occurred in May 2014. The basis for Modi not being able to win an outright majority is that rural area incomes have weakened substantially due to falling food prices (Chart I-1). Corroborating this distress in rural areas, stock prices of rural-exposed companies have massively underperformed urban-exposed ones (Chart I-2). Chart I-1India's Food Prices Have Been Falling Despite Low Rainfall
India's Food Prices Have Been Falling Despite Low Rainfall
India's Food Prices Have Been Falling Despite Low Rainfall
Chart I-2Rural-Exposed Stocks Have Massively Underperformed Urban Stocks
Rural-Exposed Stocks Have Massively Underperformed Urban Stocks
Rural-Exposed Stocks Have Massively Underperformed Urban Stocks
Even though both monetary and fiscal policies are easing, these macro policies always work with a time lag and will not improve domestic growth before the elections. A BJP-led minority-government will force Modi to increasingly rely on his allies in the National Democratic Alliance (NDA) coalition. The prime minister will then be forced to frequently offer concessions, watering down his reform agenda. The BJP’s allies in the NDA coalition are not necessarily as market-friendly. This is why we believe such an outcome would upset Indian financial markets after its most recent outperformance. Meanwhile, rural demand weakness has spilled over into the broader Indian economy. Passenger car sales, as well as sales of two- and three-wheelers are on the verge of contraction, and growth in tractor sales is falling sharply (Chart I-3). Chart I-3Indian Cyclical Growth Is Decelerating
Indian Cyclical Growth Is Decelerating
Indian Cyclical Growth Is Decelerating
Chart I-4Indian EPS Growth Will Likely Contract
Indian EPS Growth Will Likely Contract
Indian EPS Growth Will Likely Contract
Moreover, the bottom panel of Chart I-3 illustrates that the production of intermediate goods is contracting and manufacturing production is decelerating. Worryingly, the domestic growth slowdown has stalled EPS growth for the overall market, and net profit margins are falling (Chart I-4). The large-cap equity index has so far disregarded poor earnings performance, which magnifies the risk to Indian stocks if the BJP fails to win a majority government. Notably, small-cap stocks have failed to advance much and have not corroborated the rally in large-caps (Chart I-5). India’s stock market breadth is also poor, which is a bad omen for the sustainability of the current rally (Chart I-6). Chart I-5India Small Cap Stock Are Not Confirming The Rally
India Small Cap Stock Are Not Confirming The Rally
India Small Cap Stock Are Not Confirming The Rally
Chart I-6India's Stock Market Breadth Is Poor
India's Stock Market Breadth Is Poor
India's Stock Market Breadth Is Poor
Finally, rising oil prices will negatively impact India’s trade balance dynamics (Chart I-7, top panel). The stock market’s relative performance has diverged from the recent rise in oil prices – an unsustainable trend (Chart I-7, bottom panel). Investment Recommendations Chart I-7Higher Oil Prices Are Not Discounted By Indian Equities
Higher Oil Prices Are Not Discounted By Indian Equities
Higher Oil Prices Are Not Discounted By Indian Equities
The Indian economy will remain weak over the next several months, which places Modi’s majority re-election bid at risk. Beyond the elections, fiscal and monetary easing will kick in and boost cyclical growth in the second half of the year. Food prices are also beginning to pick up due to below average rainfall (Chart I-1, page 1). The latter will revive rural income and by extension spending. We recommend tactically underweighting Indian stocks for now. A better entry point to upgrade will likely emerge in the next few months as euphoria surrounding the upcoming elections comes to an end and a growth slowdown is finally priced in. For fixed-income investors, we recommend continuing to bet on yield-curve steepening. A dovish central bank will cut interest rates and keep them low. This, along with fiscal easing, will revive growth later this year. A growth recovery and rising food inflation will lift the long end of the yield curve. Ayman Kawtharani, Associate Editor ayman@bcaresearch.com Vietnam: Structural Tailwinds Getting Stronger; Buy On A Dip Our negative call on Vietnamese stocks since last May has turned out well.1 The significant deceleration in export growth alongside the selloff in broader emerging markets has generated a double-digit drop in Vietnamese stock prices over the past 12 months (Chart II-1, top panel). Chart II-1Vietnamese Equities: An Upturn Is Ahead
Vietnamese Equities: An Upturn Is Ahead
Vietnamese Equities: An Upturn Is Ahead
Looking forward, a new upturn in Vietnamese equities is in the making. The structural outlook for Vietnam is strong and improving. Investors should overweight Vietnamese stocks within an EM equity portfolio (Chart II-1, bottom panel). Shifting Supply Chain For some time, companies in China have been moving their supply chain to Vietnam due to its cheap labor, inexpensive land and supportive policies. The geopolitical confrontation between the U.S. and China that began last year has served to accelerate this process. The U.S. and China may soon reach a trade deal. This will give Chinese manufacturers and multinational companies more time to prepare for their relocation, but it will not stop the ongoing supply chain shift. Both multinationals and Chinese producers would prefer to have alternative supply chains that are not exposed to a potential re-escalation in geopolitical tensions between the U.S. and China in the years to come.2 Chart II-2 shows that Chinese companies have nearly tripled their foreign direct investment in Vietnam over the past nine months. The surge in relocations from the mainland has boosted land prices and wages in Vietnam significantly. For example, the rental price of industrial land at Giang Dien industrial park on a long-term lease of up to 50 years has risen as much as 50% to US$90 per square meter last October from US$60-70 a year ago. The relocations have occurred not only for low-value-added companies such as textile and footwear makers, but also for high-value-add companies like electronics assembly producers. According to the Chairman of Shenzhen-Vietnam Industrial Park, most of the companies that established factories in the park last year have been focused on light processing such as electronic assembly. Chart II-2Accelerating Supply Chain Shift
Accelerating Supply Chain Shift
Accelerating Supply Chain Shift
Chart II-3Strong U.S. Imports From Vietnam
Strong U.S. Imports From Vietnam
Strong U.S. Imports From Vietnam
Chart II-3 shows that U.S. imports from Vietnam have been much stronger than those from China and the rest of the world. This may be the result of both the accelerated supply chain shift last year and the structural competitiveness of Vietnamese goods. Vietnam continues to take market share from China in global markets such as footwear, garments and electronics (Chart II-4). Both multinationals and Chinese producers would prefer to have alternative supply chains that are not exposed to a potential re-escalation in geopolitical tensions between the U.S. and China in the years to come. In fact, rising FDIs have already led to a growth rebound in imports among foreign invested enterprises (FIE), heralding an export growth acceleration in the months ahead (Chart II-5). FIEs import most of the input materials they need to manufacture their goods, which are then exported overseas. This is why this segment’s imports lead export growth. Chart II-4Vietnam: Taking More Market Share From China
Vietnam: Taking More Market Share From China
Vietnam: Taking More Market Share From China
Chart II-5Rising FIE Imports Herald Export Growth Acceleration
Rising FIE Imports Herald Export Growth Acceleration
Rising FIE Imports Herald Export Growth Acceleration
Escaping A Global Slowdown In Smartphone Demand The biggest contributor to Vietnam’s current account and trade surplus has been the smartphone sector (Chart II-6). However, the ongoing downturn in global smartphone shipments may not affect Vietnam due to the latter’s gains in the global smartphone production and assembly market share: Vietnam mobile phone output (mostly Samsung smartphones) fell only slightly (1.2%) last year when Samsung smartphone shipments contracted by 8% (Chart II-7). This reflected Vietnam’s strong competitiveness relative to the other five countries where Samsung smartphones are manufactured: China, India, Brazil, Indonesia and South Korea. Over half of Samsung smartphones were produced in Vietnam last year. Chart II-6Phone Sector: The Biggest Driver Of Vietnamese Trade Surplus
Phone Sector: The Biggest Driver Of Vietnamese Trade Surplus
Phone Sector: The Biggest Driver Of Vietnamese Trade Surplus
Chart II-7Vietnam May Withstand Well In A Global Smartphone Demand Slowdown
Vietnam May Withstand Well In A Global Smartphone Demand Slowdown
Vietnam May Withstand Well In A Global Smartphone Demand Slowdown
Last December, Samsung closed its Chinese Tianjin plant. Without any additional production reductions in other plants, total Samsung capacity will be cut by about 7%. This further lowers the odds of a considerable production cut in Vietnam in the case of a further drop in global smartphone demand. Other Encouraging Signs Many other positive signs have emerged that point to a cyclical upturn ahead for Vietnam: Chart II-8Strong Domestic Demand
Strong Domestic Demand
Strong Domestic Demand
Retail sales growth has been accelerating, and automobile sales have reached new highs, suggesting strong domestic demand (Chart II-8). Despite declining visitor arrivals, the country’s tourism revenue still grew at a robust 10% pace last year. In 2019, the country is expecting a 15% year-on-year growth in visitor arrivals. The Comprehensive and Progressive Agreement for Trans-Pacific Partnership (CPTPP), which came into force for Vietnam in January, and the EU-Vietnam Free Trade Agreement (EVFTA), which will take effect later this year, will be highly beneficial to the Vietnamese economy. Both headline and core inflation are low. The country’s foreign reserves also jumped by 14% over the past 12 months to a record high of US$63.5 billion, equivalent to 26% of GDP. Investment Recommendations We recommend buying Vietnamese equities on dips. Dedicated equity investors should overweight Vietnam in an EM equity portfolio: The Vietnamese property market is booming on surging income growth and low interest rates. The real estate sector accounts for 45% of the MSCI Vietnam Index and 28% of the VN All-Share Index. According to CBRE Vietnam, there was a sharp rise in overseas investors in Vietnamese real estate in 2018, particularly from China. The real estate services firm reported that Chinese customers accounted for 44% of total transactions in the first nine months of 2018. In 2017, there was a 21% year-on-year increase in Chinese buyers. Buoyant household income growth is positive for consumer staples stocks, which accounts for 34% of the MSCI Vietnam Index and 8% of the VN All-Shares Index. Buoyant household income growth is positive for consumer staples stocks, which accounts for 34% of the MSCI Vietnam Index and 8% of the VN All-Shares Index. Vietnamese corporate earnings will outpace broader EM EPS, warranting equity market outperformance (Chart II-9). Vietnam's inclusion into some influential EM equity indices would significantly boost interest from foreign investors (Chart II-10). Chart II-9Vietnamese Corporate Earnings Growth: Better Than EM
Vietnamese Corporate Earnings Growth: Better Than EM
Vietnamese Corporate Earnings Growth: Better Than EM
Chart II-10Rising Interest From Foreign Investors
Rising Interest From Foreign Investors
Rising Interest From Foreign Investors
Technically, it seems the correction in Vietnamese stocks is late, and that the equity market will resume its upturn sooner rather than later. Ellen JingYuan He, Associate Vice President Emerging Markets Strategy ellenj@bcaresearch.com Footnotes 1 Please see Frontier Markets Strategy Special Report titled “Vietnamese Equities: Take A Step Back For Now, ” dated May 15, 2018. Available at fms.bcaresearch.com. 2 Please see Geopolitical Strategy and China Investment Strategy Special Report titled “China-U.S. Trade: A Structural Deal?” dated March 6, 2019. Available at gps.bcaresearch.com. Equity Recommendations Fixed-Income, Credit And Currency Recommendations
Highlights So what? EM elections bring opportunities as well as risks. Why? Emerging market equities will benefit as long as China’s stimulus does not fizzle. Modi is on track to win India’s election – which is a positive – though risks lie to the downside. Thailand’s next cycle of political instability is beginning, but we are still cyclically overweight. Indonesia will defy the global “strongman” narrative – go overweight tactically. Populism remains a headwind to Philippine and Turkish assets. Wait for Europe to stabilize before pursuing Turkish plays. Feature Chart 1Risks of China's Stimulus Have Shifted To The Upside
Risks of China's Stimulus Have Shifted To The Upside
Risks of China's Stimulus Have Shifted To The Upside
China’s official PMIs in March came at just the right time for jittery emerging market investors awaiting the all-important March credit data. EM equities, unlike the most China-sensitive plays, have fallen back since late January, after outperforming their DM peers since October (Chart 1). This occurred amid a stream of negative economic data and policy uncertainties: China’s mixed signals, prolonged U.S.-China trade negotiations, the Fed’s extended “pause” in rate hikes, the inversion of the yield curve, Brexit, and general European gloom. We have been constructive on EM plays since February 20, when we determined that the risks of China’s stimulus had shifted to the upside. However, several of the EM bourses that are best correlated with Chinese stimulus are already richly valued (the Philippines, Indonesia, Malaysia, etc). The good news is that a series of elections this spring provide a glimpse into the internal politics of several of these countries, which will help determine which ones will outperform if we are correct that global growth will find its footing by Q3. First, A Word On Turkey … More Monetary Expansion On The Way Local elections in Turkey on March 31 have dealt a black eye to President Recep Tayyip Erdogan. His ruling Justice and Development Party (AKP) has lost control of the capital Ankara for the first time since 2004. Erdogan has also (arguably) conceded the mayoralty of Istanbul, the economic center of the country, where he first rose to power in 1994. Other cities also fell to the opposition. Vote-counting is over and the aftermath will involve a flurry of accusations, investigations, and possibly unrest. Erdogan’s inability to win elections with more than a slim majority is a continual source of insecurity for him and his administration. This weekend’s local elections reinforce the point. The AKP alone failed to cross 45% in terms of popular votes. Combined with its traditional ally – the Nationalist Movement Party (MHP) – it received 51.6% of the total vote (in the 2015 elections, the two parties combined for over 60% of the vote). While losing the local elections will not upset the balance in parliament, it is a rebuke to Erdogan over his economic policy and a warning to the AKP for the future. Erdogan does not face general elections until 2023. But judging by his response to the first serious challenge to his rule – the Gezi Park protests of May 2013 – his reaction will be to double down on unorthodox, populist economic policy. Chart 2Erdogan Will Respond With Populist Politics
Erdogan Will Respond With Populist Politics
Erdogan Will Respond With Populist Politics
Back in 2013, the government responded to the domestic challenge through expansive monetary policy. The central bank gave extraordinary liquidity provisions to the banking system. Chart 2 clearly shows that the liquidity injections began with the Gezi protests. These provisions only paused in 2016-17, when global growth rebounded on the back of Chinese stimulus and EM asset prices rose, supporting Turkey’s currency and enabling the central bank to hold off. Today, the severe contraction in GDP (by 3% in Q4 2018), with a negative global backdrop, will likely end Erdogan’s patience with tight monetary policy.1 To illustrate how tight policy has been, note that bank loan growth denominated in lira is contracting at a rate of 17% in real terms. Given the authorities’ populist track record, rising unemployment will likely lead to further “backdoor” liquidity easing. A new bout of unorthodox monetary policy will be negative for domestic bank equities, local-currency bonds, and the lira. As one of the first EM currencies and bourses to begin outperforming in September 2018, Turkey has been at the forefront of the EM mini-rally over the past six months. But with global growth still tepid, this mini-cycle is likely to come to an end for the time being. Watch for the bottoming in Chinese followed by European growth before seeking new opportunities in Turkish assets. Erdogan’s domestic troubles could also prompt him to renew his foreign combativeness, which raises tail risks to Turkish risk assets, such as through U.S. punitive measures. Last year, Erdogan responded to the economic downswing by toning down his belligerent rhetoric and mending fences with Europe and the U.S. However, a reversion to populism may require him to seek a convenient distraction. The U.S. is withdrawing from Syria and the Middle East, leaving Turkey in a position where it needs other relationships to pursue its interests. Russia is a key example. Currently Erdogan is bickering with the U.S. over the planned purchase of a missile defense system from Russia. But the consequence is that relations with the U.S. could deteriorate further, potentially leading to new sanctions. Bottom Line: Turkey is still in the grip of populist politics and will respond to the recession and domestic discontent with easier monetary policy which would bode ill for the lira and lira-denominated assets. The stabilization of the European economy is necessary before investors attempt to take advantage of the de-rating of Turkish assets. India: Focus On Modi’s Political Capital We have long maintained that Modi is likely to stay in power after India’s general election on April 11-May 19. His coalition has recovered in public opinion polling since the Valentine’s Day attack on Indian security forces in Indian Kashmir (Chart 3). The government responded to the attacks by ordering airstrikes on February 26 against Pakistani targets in Pakistani territory for the first time since 1974. The attack was theatrical but the subsequent rally-around-the-flag effect gave Modi and his Bharatiya Janata Party (BJP) a badly needed popular boost. The market rallied on the back of Modi’s higher chances of reelection. Modi is the more business-friendly candidate, as opposed to his chief rival, Rahul Gandhi of the Indian Congress Party. Nevertheless, election risks still lie to the downside: Modi and his party are hardly likely to outperform their current 58% share of seats in the lower house of parliament, since the conditions for a wave election – similar to the one that delivered the BJP a single-party majority in 2014 – do not exist today. While the range of outcomes is extremely broad (Chart 4), the current seat projections shown in Chart 3 put Modi’s coalition right on the majority line. Meanwhile his power is already waning in the state legislatures.
Chart 3
Chart 4
Thus Modi’s reform agenda has lost momentum, at least until he can form a new coalition. This will take time and markets may ultimately be disappointed by the insufficiency of the tools at his disposal in his second term. Indian equities are the most expensive in the EM space, and only more so after the sharp rally in March on the back of the Kashmir clash and Modi’s recovering reelection chances (Chart 5). Additional clashes with Pakistan are not unlikely during the election season, despite the current appearance of calm. This is because Modi’s patriotic dividend in the polls could fade. Since even voters who lack confidence in Modi as a leader believe that Pakistan is a serious threat (Chart 6), he could be encouraged to stir up tensions yet again. This would be playing with fire but he may be tempted to do it if his polling relapses or if Pakistan takes additional actions. Chart 5...And Lofty Valuations
...And Lofty Valuations
...And Lofty Valuations
Chart 6
Further escalation would be positive for markets only so long as it boosts Modi’s chances of reelection without triggering a wider conflict. Yet the standoff revealed that these two powers continue to run high risks of miscalculation: their signaling is not crystal clear; deterrence could fail. Thus, further escalation could become harder to control and could spook the financial markets.2 Even if Modi eschews any further jingoism, his lead is tenuous. First, the economic slowdown is taking a toll – even the official unemployment rate is rising (Chart 7) and the government has been caught manipulating statistics. There is no time for the economy to recover enough to change voters’ minds. Opinion polls show that even BJP voters are not very happy about the past five years. They care more about jobs and inflation than they do about terrorism, and a majority thinks these factors have deteriorated over Modi’s five-year term (Chart 8). Chart 7Manipulated Stats Can't Hide Deteriorating Economy
Manipulated Stats Can't Hide Deteriorating Economy
Manipulated Stats Can't Hide Deteriorating Economy
Chart 8
If the polling does not change, Modi will win with a weak mandate at best. A minority government or a hung parliament is possible. A Congress Party-led coalition, which would be a market-negative event, cannot be ruled out. The latter especially would prompt a big selloff, but anything short of a single-party majority for Modi will register as a disappointment. Bottom Line: There may be a relief rally after Modi is seen to survive as prime minister, but his likely weak political capital in parliament will be disappointing for markets. The market will want additional, ambitious structural reforms on top of what Modi has already done, but he will struggle to deliver in the near term. While we are structurally bullish, in the context of this election cycle – which includes rising oil prices that hinder Indian equity outperformance – we urge readers to remain underweight Indian equities within emerging markets. Thailand: An Outperformer Despite Quasi-Military Rule
Chart
A new cycle of political instability is beginning in Thailand as the country transitions back into civilian rule after five years under a military junta. However, this is not an immediate problem for investors, who should remain overweight Thai equities relative to other EMs on a cyclical time horizon. The source of Thai instability is inequality – both regional and economic. Regionally, 49% of the population resides in the north, northeast, and center, deprived of full representation by the royalist political and military establishment seated in Bangkok (Map 1). Economically, household wealth is extremely unevenly distributed. Thailand’s mean-to-median wealth ratio is among the highest in the world (Chart 9). Eventually these factors will drive the regional populist movement – embodied by exiled Prime Minister Thaksin Shinawatra and his family and allies – to reassert itself against the elites (the military, the palace, and the civil bureaucracy). New demands will be made for greater representation and a fairer distribution of wealth. The result will be mass street protests and disruptions of business sentiment and activity that will grab headlines sometime in the coming years, as occurred most recently in 2008-10 and 2013-14.
Chart 9
Chart 10Social Spending Did Not Hinder Populism
Social Spending Did Not Hinder Populism
Social Spending Did Not Hinder Populism
The seeds of the next rebellion are apparent in the results of the election on March 24. The junta has sought to undercut the populists by increasing infrastructure spending and social welfare (Chart 10), and controlling rice prices for farmers. Yet the populists have still managed to garner enough seats in the lower house to frustrate the junta’s plans for a seamless transition to “guided” civilian rule. The final vote count is not due until May 9 but unofficial estimates suggest that the opposition parties have won a majority or very nearly a majority in the lower house. This is despite the fact that the junta rewrote the constitution, redesigned the electoral system to be proportional (thus watering down the biggest opposition parties), and hand-picked the 250-seat senate. Such results point to the irrepressible population dynamics of the “Red Shirt” opposition in Thailand, which has won every free election since 2001. Nevertheless, the military and its allies (the “Yellow Shirt” political establishment) are too powerful at present for the opposition to challenge them directly. The junta has several tools to shape the election results to its liking in the short run.3 It would not have gone ahead with the election were this not the case. As a result, the cycle of instability is only likely to pick up over time. Investors should note the silver lining to the period of military rule: it put a halt to the spiral of polarization at a critical time for the country. The unspoken origin of the political crisis was the royal succession. The traditional elites could not tolerate the rise of a populist movement that flirted with revolutionary ideas at the same time that the revered King Bhumibol Adulyadej drew near to passing away. This combination threatened both a succession crisis and possibly the survival of the traditional political system, a constitutional monarchy backed by a powerful army. With the 2014 coup and five-year period of military rule (lengthy even by Thai standards), the military drew a stark red line: there is no alternative to the constitutional monarchy. The royalist faction had its bottom line preserved, at the cost of an erosion of governance and democracy. The result is that going forward, there is a degree of policy certainty. Chart 11Thai Confidence Has Bottomed
Thai Confidence Has Bottomed
Thai Confidence Has Bottomed
Chart 12Strong Demand Sans Risk Of Being Overleveraged
Strong Demand Sans Risk Of Being Overleveraged
Strong Demand Sans Risk Of Being Overleveraged
The long-term trend of Thai consumer confidence tells the story (Chart 11). Optimism surged with the election of populist Thaksin in the wake of the Asian Financial Crisis in 2001. The long national conflict that ensued – in which the elites and generals exiled Thaksin and ousted his successors, and the country dealt with a global financial crisis and natural disasters – saw consumer confidence decline. However, the coup of 2014 and the royal succession (to be completed May 4-6 with the new king’s coronation) has reversed this trend, with confidence trending upward since then. Revolution is foreclosed yet the population is looking up. Military rule is generally disinflationary in Thailand and this time around it initiated a phase of private sector deleveraging. Yet the economy has held up reasonably well. Private consumption has improved along with confidence and investment has followed, albeit sluggishly (Chart 12). The advantage is that Thailand has had slow-burn growth and has avoided becoming overleveraged again, like many EM peers. Chart 13Thailand Outperformed EM Despite Military Interference
Thailand Outperformed EM Despite Military Interference
Thailand Outperformed EM Despite Military Interference
Furthermore, Thailand is not vulnerable to external shocks. It has a 7% current account surplus and ample foreign exchange reserves. It is not too exposed to China, either economically or geopolitically: China makes up only 12% of exports, while Bangkok has no maritime-territorial disputes with Beijing in the South China Sea. In fact, Thailand maintains good diplomatic relations with China and yet has a mutual defense treaty with the United States (the oldest such treaty in Asia). It is perhaps the most secure of any of the Southeast Asian states from the point of view of the secular U.S.-China conflict. Finally, if our forecast proves wrong and political instability returns sooner than we expect, it is important to remember that Thailand’s domestic political conflicts rarely affect equity prices in a lasting way. Global financial crises and natural disasters have had a greater impact on Thai assets over the past two decades than the long succession crisis. Thailand has outperformed both EM and EM Asia during the period of military interference, though democratic Indonesia has done better (Chart 13). Bottom Line: Thailand’s political risks are domestic and stem from regional and economic inequality, which will result in a revived opposition movement that will clash with the traditional military and political elite. This clash will eventually create policy uncertainty and political risk. But it will need to build up over time, since the military junta has strict control over the current environment. Meanwhile macro fundamentals are positive. Indonesia: Rejecting Strongman Populism We do not expect any major surprises from the Indonesian election. Instead, we expect policy continuity, a marginal positive for the country’s equities. However, stocks are overvalued, overexposed to the financial sector,4 and vulnerable if global growth does not stabilize.
Chart 14
The most important trend since the near collapse of Indonesia in the late 1990s has been the stabilization of the secular democratic political system and peaceful transition of power. That trend looks to continue with President Joko Widodo’s likely victory in the election on April 17. President Jokowi defeated former general Prabowo Subianto in the 2014 election and has maintained a double-digit lead over his rival in the intervening years (Chart 14). Prabowo is a nationalist and would-be strongman leader who was accused of human rights violations during the fall of his father-in-law Suharto’s dictatorship in 1998. Emerging market polls are not always reliable but a lead of this size for this long suggests that the public knows Prabowo and does not prefer him to Jokowi. In fact he never polled above 35% support while Jokowi has generally polled above 45%. The incumbent advantage favors Jokowi. Household consumption is perking up slightly and consumer confidence is high (see Chart 11 above). Wages have received a big boost during Jokowi’s term and are now picking up again, in real as well as nominal terms and for rural as well as urban workers. Jokowi’s minimum wage law has not resulted in extravagant windfalls to labor, as was feared, and inflation remains under control (Chart 15). Government spending has been ramped up ahead of the vote (and yet Jokowi is not profligate). All of these factors support the incumbent. Real GDP growth is sluggish but has trended slightly upward for most of Jokowi’s term. Chart 15Favorable Economic Conditions Support Incumbent Jokowi
Favorable Economic Conditions Support Incumbent Jokowi
Favorable Economic Conditions Support Incumbent Jokowi
Chart 16
Jokowi has been building badly needed infrastructure with success and has been attracting FDI to try to improve productivity (Chart 16). This is the most positive feature of his government and is set to continue if he wins. A coalition in parliament has largely supported him after an initial period of drift. The biggest challenge for Jokowi and Indonesia are lackluster macro fundamentals. For instance, twin deficits, which show a lack of savings and invite pressure on the currency, which has been very weak. The twin deficits have worsened since 2012 because China’s economic maturation has forced a painful transition on Indonesia, which it has not yet recovered from.
Chart 17
There is some risk to governance as Jokowi has chosen Ma’ruf Amin, the top cleric of the world’s largest Muslim organization, as his running mate. Jokowi wants to counteract criticisms that he is not Islamic enough (or is a hidden Christian), which cost his ally the governorship of Jakarta in 2017. However, Jokowi is not a strongman leader like Erdogan in Turkey, whose combination of Islamism and populism has been disastrous for the country’s economy. As mentioned, Jokowi will be defeating the would-be strongman Prabowo, who has also allied with Islamism. In fact, Indonesia is a relatively secular and modern Muslim-majority country and Amin is the definition of an establishment religious leader. The security forces have succeeded in cracking down on militancy in the past decade, greatly improving Indonesia’s stability and security as a whole (Chart 17). Governance is weak on some measures in Indonesia, but Jokowi is better than the opposition on this front and neither his own policies nor his vice presidential pick signals a shift in a Turkey-like, Islamist, populist direction. Bottom Line: We should see Indonesian equities continue to outperform EM and EM Asia as long as China’s stimulus efforts do not collapse and global growth picks up as expected in the second half of the year. Peaceful democratic transitions and economic policy continuity have been repeatedly demonstrated in Indonesia despite the inherent difficulties of developing a populous, multi-ethnic archipelago. Nationalism is a constant risk but it would be more virulent under Jokowi’s opponent. The Philippines: Embracing Strongman Populism
Chart 18
The May 13 midterm elections mark the three-year halfway point in President Rodrigo Duterte’s presidential term. Duterte is still popular, with approval ratings in the 75%-85% range. These numbers likely overstate his support, but it is clearly above 50% and superior to that of his immediate predecessors (Chart 18). Further, his daughter’s party, Faction for Change, has gained national popularity, reinforcing the signal that he can expand his power base in the vote. The senate is the root of opposition to Duterte. His supporters control nine out of 24 seats. But of the twelve senators up for election, only three are Duterte’s supporters. So he could make gains in the senate which would increase his ability to push through controversial constitutional reforms. (He needs 75% of both houses of parliament plus a majority in a national referendum to make constitutional changes.) In terms of the economy, we maintain the view that Duterte is a true “populist” – pursuing nominal GDP growth to the neglect of everything else. His fiscal policy of tax cuts and big spending have supercharged the economy but macro fundamentals have deteriorated (Chart 19). He has broken the budget deficit ceiling of 3%, up from 2.2% in 2017. His reflationary policies have turned the current account surplus into a deficit, weighing heavily on the peso, which peaked against other EM currencies when he came to power in 2016 (Chart 20). Inflation peaked last year but we expect it to remain elevated over the course of Duterte’s leadership. He has appointed a reputed dove, Benjamin Diokno, as his new central banker. Chart 19Reflationary Policies Created Twin Deficits...
Reflationary Policies Created Twin Deficits...
Reflationary Policies Created Twin Deficits...
Chart 20...And Twin Deficits Weigh On The Peso
...And Twin Deficits Weigh On The Peso
...And Twin Deficits Weigh On The Peso
Rule of law has deteriorated, as symbolized by the removal of the chief justice of the Supreme Court for questioning Duterte’s extension of martial law in Mindanao. Duterte also imprisoned his top critic in the senate, Leila de Lima, on trumped-up drug charges. He tried but failed to do so with Senator Antonio Trillanes, a former army officer and quondam coup ring-leader who has substantial support in the military. The army is pushing back against any prosecution of Trillanes, and against Duterte’s ongoing détente with China, prompting Duterte to warn of the risk of a coup. Duterte’s China policy is to attract Chinese investment while avoiding a conflict in the South China Sea. His administration has failed to downgrade relations with the U.S. thus far, but further attempts could be made. This strategy could make the Philippines a beneficiary of Chinese investment if it succeeds. However, China knows that the Philippine public is very pro-American (more so than most countries) and that Duterte could be replaced by a pro-U.S. president in as little as three years, so it is not blindly pouring money into the country. Pressure to finance the current account deficit will persist. If pro-Duterte parties gain seats in the senate the question will be whether he comes within reach of the 75% threshold required for constitutional changes. His desire to change the country into a federal system has not gained momentum so far. He claims he will stand down at the end of his single six-year term but he could conceivably attempt to use any constitutional change to stay in power longer. If the revision goes forward, it will be a hugely divisive and unproductive use of political capital. Bottom Line: The Philippine equity market is highly coordinated with China’s credit cycle and so should benefit from China’s stimulus measures this year (as well as the Fed’s backing off). Nevertheless, Philippine equities are overvalued and macro fundamentals and quality of governance have all deteriorated. Duterte’s emphasis on building infrastructure and human capital is positive, but the means are ill-matched to the ends: savings are insufficient and inflation will be a persistent problem. We would favor South Korea, Thailand, Indonesia, and Malaysia over the Philippines in the EM space. Investment Implications We expect China’s stimulus to be significant and to generate increasingly positive economic data over the course of the year. China is a key factor in the bottoming of global growth, which in turn will catalyze the conditions for a weaker dollar and outperformance of international equities relative to U.S. equities. Caveat: In the very near term, it is possible that China plays could relapse and EM stocks could fall further due to the fact that Chinese and global growth have not yet clearly bottomed. We are structurally bullish India, but recommend sitting on the sidelines until financial markets discount the disappointment of a Modi government with insufficient political capital to pursue structural reforms as ambitious as the ones undertaken in 2014-19. Go long Thai equities relative to EM on a cyclical basis. Stay long Thai local-currency government bonds relative to their Malaysian counterparts. Go long Indonesian equities relative to EM on a tactical basis. Maintain vigilance regarding Russian and Taiwanese equities: the Ukrainian election, Russia’s involvement in Venezuela, and the unprecedented Taiwanese presidential primary election reinforce our view that Russia and Taiwan are potential geopolitical “black swans” this year. Matt Gertken, Vice President Geopolitical Strategy mattg@bcaresearch.com Footnotes 1 See BCA Emerging Markets Strategy, “Turkey: Brewing Policy Reversal?” March 21, 2019, available at www.bcaresearch.com. 2 See Sanjeev Miglani and Drazen Jorgic, “India, Pakistan threatened to unleash missiles at each other: sources,” Reuters, March 16, 2019, available at uk.reuters.com. 3 The junta can disqualify candidates and rerun elections in the same district without that candidate if the candidate is found to have violated a range of very particular laws on campaigning and use of social media. Also, the Election Commission is largely an instrument of the Bangkok establishment and can allocate seats according to the junta’s interests. 4 See BCA Emerging Markets Strategy, “Indonesia: It Is Not All About The Fed,” March 7, 2019, available at www.bcaresearch.com. Geopolitical Calendar
Highlights So What? India is overcoming the economic constraints to its strategic rise. Why? India faces rising political risk once again as public opinion puts Modi’s tenure in power at risk. However, India will continue to improve its economy, as outside pressures will force it to act coherently as a nation. Stay on the sidelines for now but remain constructive over the long run. Feature “An enemy of my enemy is my friend.” This is to paraphrase Kautilya, a philosopher of the Mauryan Empire, circa 200 BC. Kautilya was the Indian Machiavelli and wrote the Arthashastra to give hard-nosed political advice to rulers who wanted to know how kingdoms and states really behave rather than how they ought to behave.1 The quotation is no less true today than it was in ancient times. It explains why risks are rising to our view that Prime Minister Narendra Modi will remain in power after the election in April or May. This reinforces our underweight position on Indian risk assets over a 12-month time horizon. The quotation also explains why China’s growing influence in South Asia will drive India to continue reforming its economy and befriend the United States, thus supporting an optimistic view of India’s economic and investment potential in the long run (Chart 1).
Chart 1
What Is India’s Grand Strategy? India’s geopolitical predicament stems from the fact that it is a relatively rational geographic unit, but one whose political unity is extremely difficult to maintain. Almost every side of the subcontinent is demarcated by forbidding geology: the Himalayas, the Bay of Bengal, the Arabian Sea, the thick jungles of Burma. Even the northwest, the traditional route of invaders, hosts vast obstacles like the Hindu Kush and Thar Desert. Any kingdom that takes shape can soon dream of expanding its borders to a natural stopping place (Map 1).
Chart
Yet formidable obstacles stand between the cradles of Indian civilization – the Indus and Ganges Rivers – and the river ways and coastal outlets of the south. The Vindhya-Satpura mountains, the Deccan plateau, and the eastern and western Ghats make it extremely difficult for a northern power to govern the various cultures of the southern cone. This geography ensures that empires are always trying and failing to unify the subcontinent into a coherent whole. As a result, India rarely projects power beyond it. When it does, the projection is short-lived.2 Historically India has seen the rise of five major empires that dominated the subcontinent: the Mauryans, the Guptas, the Mughals, the British, and the modern Republic of India (Chart 2). The Mughals and many other invaders periodically streamed in from the northwest – most often from modern-day Afghanistan and northern Pakistan, but also from Iran and southern Pakistan. Meanwhile several European empires invaded from the sea and established coastal settlements. The British East India Company settled in Bengal and then drove west and south, cutting off the French who had settled on the southeastern shores.
Chart 2
The modern Republic of India, founded in 1947 after Mahatma Gandhi and his followers harassed the British into leaving, feared that the United States would follow in Britain’s footsteps, being the world’s preeminent naval power. The Indians also distrusted the U.S.’s constructive relations with China and Pakistan that aimed to “contain” the Soviet Union. The Soviets, by contrast, could apply great pressure on Pakistan’s flank in Afghanistan and thus proved useful to India. They could also sell India weapons and capital goods as founding Prime Minister Jawaharlal Nehru pursued a socialist path of economic development. The collapse of the Soviet Union coincided with a balance-of-payments crisis in India in 1991 that resulted in the abandonment of the old command-style economy and the adoption of modern capitalism under the reforms of Narasimha Rao. India also supported the U.S.’s intervention in the region after September 11, 2001 as a way of maintaining pressure on Pakistan’s back door. From this brief history we can glean a few solid points about India’s grand strategy: An Indian empire must establish control along the Indus or Ganges rivers, or both; An Indian empire must assimilate or drive out foreign rulers and unify the north and south; An Indian empire must strive to become the kingmaker across the subcontinent, through influence if not conquest; An Indian empire must fend off an invasion from the sea. The result of Rao’s reforms, India’s achievement of nuclear status in 1998, and nearly three decades of economic growth have been an India that is clearly an emerging “great power.” According to our Geopolitical Power Index, India is today on the cusp of supplanting Russia as the world’s third most powerful state (Chart 3). It surpassed the U.K., its former colonial master, in 1993. Chart 3India On Cusp Of Overtaking Russia In Comprehensive National Power
India On Cusp Of Overtaking Russia In Comprehensive National Power
India On Cusp Of Overtaking Russia In Comprehensive National Power
Like China in East Asia, India is modernizing its vast army, developing a blue-water navy, and carving out a sphere of influence in South Asia (Chart 4). Also like China, India’s ambitions of regional hegemony are frustrated by its neighbors. India’s rivalry with Pakistan is foundational and existential – it is as if China faced Taiwan with nuclear weapons. Chart 4India's Military Clout Quietly Rising
India's Military Clout Quietly Rising
India's Military Clout Quietly Rising
Today the fragile world order that prevailed in the wake of the Cold War is under severe strain. China’s grand regional ambitions are provoking a harsh reaction from the United States, which is setting up a new “containment policy” to limit China’s technological advance. The U.S. is withdrawing military forces from the Middle East and South Asia as it becomes energy self-sufficient and looking to counter-balance China with its free hand. Meanwhile China’s influence on the subcontinent is growing – already it is a rival to India as a trade partner for India’s South Asian neighbors (Chart 5). The Sino-Indian rivalry has often been overstated – the Himalayas are more than a hindrance. But China’s Belt and Road Initiative (BRI) means that this logic is increasingly out of date. Historically, India faced overland invasions from the northwest and maritime invasions from the northeast. The Belt and Road – of which Pakistan is probably the most comprehensive beneficiary – potentially threatens India from both directions sometime in the future. Chart 5China Encroaching In India's Sphere Of Influence
China Encroaching In India's Sphere Of Influence
China Encroaching In India's Sphere Of Influence
Of course the U.S. and India still face tensions between each other – foremost being the impending withdrawal from Afghanistan and the U.S. “maximum pressure” policy towards Iran (Chart 6). There are also trade tensions with the Trump administration and a broader problem of inconsistent U.S. outreach to India. Nevertheless the logic of “the enemy of my enemy is my friend” suggests that over the long run the U.S. will grow warmer with India as a regional counterweight to China, while India will wish to become less isolationist and cultivate its relationship with the U.S. as a counter both to Pakistan and China. Simply put, China is making historic advances into India’s neighborhood in South Asia and the Indian Ocean basin. Chart 6A Good Sign For U.S.-India Ties: Cooperation On Iran
A Good Sign For U.S.-India Ties: Cooperation On Iran
A Good Sign For U.S.-India Ties: Cooperation On Iran
This logic also suggests that India will be driven to continue reforming its economic structure so as to preserve internal unity and South Asian influence. If its economy languishes, it will lose preponderance within its neighborhood and become vulnerable to foreign aggression. Bottom Line: India and the U.S. are likely to see an ever-strengthening strategic partnership. They will overcome hurdles to the relationship because of their mutual need to counter China’s regional ascendancy. India’s Economic Hang-Up India has been ineffective in establishing an international presence because it has only reluctantly and haltingly reformed its economy. Today India’s middle class – measured by the share of adults with total wealth from $10,000 to $100,000 – is less than 10%, comparable to the Philippines and Thailand. China’s is now above 50%, according to Credit Suisse’s Global Wealth Report (Chart 7).
Chart 7
This weakness stems in great part from policy decisions, namely the dogged pursuit of socialism through the latter stages of the Cold War. The same ruling ideology that prized independence also prized self-sufficiency, doubling down on import-substitution and thus missing the chance to industrialize with the export-oriented Asian Tigers in the 1970s or China in the 1980s. The result of insufficient measures to limit the state, curtail monopolies, contain inflation, and promote trade and private enterprise has been a chronic shortfall of national savings (Chart 8), which are needed to invest in capital projects and boost productivity (Chart 9).3 Chart 8India Lacks National Savings
India Lacks National Savings
India Lacks National Savings
Chart 9India's Lagging Productivity
India's Lagging Productivity
India's Lagging Productivity
Many of these historic hang-ups have begun to change, however, first under the reforms of the 1990s-2000s and more recently under the government of Prime Minister Narendra Modi since 2014. As a result, there are a number of “truisms” about India’s economy that are no longer true. For instance, while India’s government is said to be small and weak due to its federal structure – which empowers the states – the truth is that its government is not notably smaller than that of other comparable emerging markets (Chart 10). There is no doubt that it is harder for India’s leaders to drive their agenda than it is for Russia’s and China’s leaders, but this is due to the type of government rather than the size. India inherited liberal democracy and rule of law from the British and its own revolutionary leaders built on this foundation, providing relative stability despite its patchwork of languages, ethnicities, and castes. Democratic checks and balances have led to better governance. Chart 10India's Government Neither Small Nor Weak
India's Government Neither Small Nor Weak
India's Government Neither Small Nor Weak
The contrast has had clear effects on demography. India has a strong demographic foundation and hence a large internal market and robust labor force growth. China, by contrast, is suffering from the distortive effects of the “One Child Policy” on its working age population. As a result India’s population will increasingly provide the global labor force as China’s workers become scarcer and rise in cost (Chart 11) and as trade conflicts between China and the West drive investors to relocate supply chains.
Chart 11
This is also a risk to India, of course, if job creation lags. But that is where other economic improvements come in. Cumulatively, Modi’s policies have improved the trajectory of a capital formation relative to consumption, which will increase productivity, potential growth, and job creation (Chart 12). Chart 12Modi Corrected India's Investment Trajectory
Modi Corrected India's Investment Trajectory
Modi Corrected India's Investment Trajectory
On openness to trade, India has largely closed the gap with China and other comparable EMs like Indonesia (Chart 13). And while India has long been highly restrictive toward foreign investment, it is much less so than China (Chart 14), and a slew of policies to ease restrictions has resulted in a surge in foreign direct investment that only recently came off the boil (Chart 15). Chart 13India Not So Closed To Trade Anymore
India Not So Closed To Trade Anymore
India Not So Closed To Trade Anymore
Chart 14
Chart 15Modi Opened India To Foreign Investment
Modi Opened India To Foreign Investment
Modi Opened India To Foreign Investment
Further, while India remains broadly under-invested and has not managed to rebalance its overall economy toward manufacturing, it has created some bright spots within the manufacturing sector, such as autos (Chart 16).4 Modi’s government has significantly improved other conditions that will encourage private investment: the ease of doing business, global competitiveness, infrastructure effectiveness, and human capital (Chart 17). Chart 16Cars A Bright Spot In Indian Manufacturing
Cars A Bright Spot In Indian Manufacturing
Cars A Bright Spot In Indian Manufacturing
Chart 17
Bottom Line: India’s grand strategy has historically suffered because internal unity and regional influence could not be achieved with a floundering economy. Over recent decades, however, India’s reforms have accumulated into substantial improvements – and the Modi administration has made some key improvements. But Will Modi Survive? Our baseline case for the general election due in April or May is that Modi and his ruling Bharatiya Janata Party (BJP), along with their allies in the National Democratic Alliance (NDA), will remain in power, if narrowly. However, in recent weeks the public opinion polling has taken a turn for the worse for Modi (Chart 18), raising the odds of a hung parliament or opposition victory. Modi still remains well ahead of Rahul Gandhi, the dynastic leader of the opposition Indian National Congress and its United Progressive Alliance (UPA), in terms of popularity (Chart 19). But in some polling he is barely holding onto a double-digit lead. Meanwhile Gandhi’s sudden viability as a candidate is a significant change from only a year ago.
Chart 18
Chart 19
Nevertheless the range of seat projections for the lower house of parliament, the Lok Sabha, is very wide and suggests that Modi’s coalition could still win a majority, as long as the opposition’s current rally breaks (Chart 20).
Chart 20
A critical election dynamic points back to Kautilya’s ancient advice. Recently, two major parties in Uttar Pradesh – the key bellwether state – have joined forces to avoid stealing each other’s votes and thus help the opposition take seats. If this scheme works, then the NDA could be outmatched at the polls.5 For investors, however, the key takeaway is that Modi’s reform agenda is past its peak and policy uncertainty can only rise from here: Modi’s seats will certainly shrink from the landslide of 2014 – the BJP is likely to lose its single-party majority, weakening Modi and his party members on their reform agenda. The support of their NDA allies will have to be bought with favorable policy tradeoffs (Chart 21);
Chart 21
The high tide of Modi’s movement has already come and gone in the state governments, where the BJP recently lost Madhya Pradesh, Rajasthan, and Chhattisgarh, among others (Map 2). It is possible to lose these states and still win the general election, as largely occurred in 2004 and 2009, but state governments are a decisive factor in implementing federal policies and Modi’s influence is now clearly on the wane;
Chart
Estimates of the NDA’s future gains in the Rajya Sabha, the upper house, suggest that even if Modi stays in power, he will never obtain a majority there (Diagram 1) – meaning that lower house bills other than supply bills will be subject to a veto; Diagram 1Modi Unlikely To Gain Majority In Upper House … Ever
India's Geopolitics: What Investors Need To Know
India's Geopolitics: What Investors Need To Know
Modi is unlikely to have enough seats in the two houses to have the option of driving key legislation through a joint session of parliament. This is a rare occurrence but it would be a valuable ace up the sleeve. Modi’s reform movement has already seen high tide. He will struggle to institute reforms if he is weakened in parliament and the states. This is even truer if a hung parliament occurs, or if the UPA ekes out a slim majority. In essence, the next Indian government will likely be hobbled if Modi’s polling and performance do not recover from here – and even then he will not reclaim the political capital of his first term in office. It would be a mistake, however, to believe that reforms cannot get done without Modi. Prime Minister Rao came from the Congress Party, after all. Moreover, it is possible for India to undertake major reforms with a weak coalition or minority government. This was the backdrop of the critical pro-market reforms of the 1990s. But this implies that there would need to be a market riot to induce additional reform momentum, as was the case at that time, and India is not at a comparable crisis point today. Bottom Line: Modi’s reform momentum is over. The next government will be weaker and less able to drive major pro-productivity reforms. But eventually reform momentum will recover, driven by the geopolitical forces outlined above. Does Modi Matter? What is the basis for Modi’s loss of momentum? The gist of the problem is that Modi’s reforms were structural and therefore entailed substantial economic and social costs. As a result, Modi has lost support. The good news is that Modi’s achievements thus far will continue to yield benefits for India. To highlight a few: The creation of a single market by means of the Goods and Services Tax (GST) is a significant reform that will ensure a strong legacy for Modi in the long run. However, the new tax obviously does not get voters enthused. The new Bankruptcy Law has helped to cleanse economic inefficiencies. But it has resulted in layoffs and financial deleveraging, weighing on credit growth and the broader economy. Demonetization, the sudden replacement of key denominations of money in circulation, has helped to formalize gray and black parts of the economy. But it was executed in a hugely disruptive manner and various scandals have arisen in the wake of it, hurting the ruling party. Controlling the fiscal deficit has been a federal government objective that has had some success. However, Modi and the state governments are more recently boosting spending ahead of the election to avoid what otherwise would be a negative fiscal thrust this year. This is a factor that should play to Modi’s advantage, although it has not so far. It also highlights the difficulty of fiscal consolidation over the long run (Chart 22). Chart 22Election Cycle Fiscal Easing Is The Norm
Election Cycle Fiscal Easing Is The Norm
Election Cycle Fiscal Easing Is The Norm
More concerning, both for Modi and for India, is the unemployment rate. Even the official unemployment rate is rising despite the fast clip of economic growth and the pro-growth reforms (Chart 23). A leaked government statistical report suggests that unemployment has indeed gone up and labor participation has fallen more than the government is willing to admit. Chart 23Even Official Unemployment Is Rising
Even Official Unemployment Is Rising
Even Official Unemployment Is Rising
The jury is still out on the extent of the current growth slowdown. Some estimates suggest that the output gap is closed, others say slightly negative. While there has been a soft patch in wage growth – particularly among the important 40% of the population that still works on the farm (Chart 24) – the latest data show improvement. Unit labor costs are ebullient and suggest that employee compensation is rising (Chart 25). The reality could make all the difference for Modi’s coalition at the ballot box. Chart 24Rural Wages Improving... But Is It Enough?
Rural Wages Improving... But Is It Enough?
Rural Wages Improving... But Is It Enough?
Chart 25Will Workers Reward Modi?
Will Workers Reward Modi?
Will Workers Reward Modi?
More importantly, if India cannot keep unemployment down amidst significant labor force growth, then Modi will only become the near-term casualty of a more profound problematic trend. Another long-term concern is Modi’s political pressure on the Reserve Bank of India. This has resulted in the replacement of two orthodox and credible central bankers under Modi’s watch. The result is a noticeably dovish policy shift, as confirmed by the cut of the repo rate to 6.25% (from 6.5%) on February 7. This cut and later cuts may be supported by global growth fears but will raise suspicions of political influence. Any damage to the central bank’s credibility will have lasting negative effects since the election result cannot reverse it (at least not fully). It will feed inflation expectations marginally and insofar as it does it will worsen the conditions for sustainable private sector capital investment. However, inflation is currently low and other reforms – such as the RBI’s adoption of inflation-targeting and ample domestic grain production – will help to offset any new monetary policy risk. Bottom Line: Modi’s reform legacy is mostly positive for India structurally, although the erosion of central bank independence is a critical exception. Investment Implications In the short run, cooperation among Modi’s political opponents poses a risk of removing him from power and short-circuiting his reform agenda. In the long run, cooperation between China and India’s South Asian neighbors poses a risk of undermining India’s grand strategy, driving it into the arms of the United States. In both cases Kautilya’s ancient wisdom is on display. In the first case, a Modi defeat would be negative for India’s policy continuity, currency, and risk assets. The upside to our baseline view of a Modi victory is not high, however, unless Modi and the BJP surprise to the upside and win a substantial majority. This is unlikely unless the polling changes. In the second case, the geopolitical environment will pressure India to continue reforming and improving its economy so as to maintain internal stability, influence its neighbors, and ward off unwanted foreign influence. With China’s Belt and Road putting pressure on India’s strategic interests, leaders in New Delhi will have a continual motivation to focus on improving the economy as well as seeking alliances. This is the only way to ensure India retains its influence within its neighborhood. For now, investors should steer clear of the Indian currency and risk assets in absolute terms because Modi’s reforms are priced in; election cycle dynamics are undermining monetary and fiscal policy; and the risk of sharp policy discontinuity is rising. On a relative basis, India may also underperform EM in the short term while oil prices rise: oil prices and India’s equity performance relative to EM are negatively correlated.6 Beyond that, however, India is a structural opportunity. Capital investment in China, which has powered much of the structural bull market in commodities and EM assets over the past two decades, is declining, while India’s is improving (Chart 26). Capex is the key to improving India’s productivity and keeping inflation in check even as the demographic dividend pushes up growth rates. Although many EM economies will suffer from a slowdown in Chinese capex, India is not overly exposed to China or global trade, and it is further along than other EMs in its process of bank deleveraging, which opens the prospect of a new credit cycle that will improve its investment outlook (Chart 27). Chart 26China Capex Down, India Capex Up
China Capex Down, India Capex Up
China Capex Down, India Capex Up
Chart 27Deleveraging Enables A New Credit Cycle
Deleveraging Enables A New Credit Cycle
Deleveraging Enables A New Credit Cycle
Matt Gertken, Vice President Geopolitical Strategy mattg@bcaresearch.com Footnotes 1 Kajari Kamal, “Kautilya’s Arthashastra: Indian Strategic Culture and Grand Strategic Preferences,” Journal of Defence Studies 12:3 (2018), pp. 27-54, available at idsa.in 2 The medieval Chola Kingdom sailed across the Bay of Bengal and as far as Malacca in 1025. Please see Manjeet Singh Pardesi, “Deducing India’s Grand Strategy of Regional Hegemony from Historical and Conceptual Perspectives,” Institute of Defense and Strategic Studies, Working Paper 76 (April 2005), available at www.rsis.edu. For an in-depth study of India’s strategic history, see Graham P. Chapman, The Geopolitics of South Asia: From Early Empires to the Nuclear Age (Burlington, VT: Ashgate, 2009). 3 Please see BCA Emerging Market Strategy Special Report, “Capital Rationing Is Deterring Growth,” February 28, 2012, and “India’s Inflation: How Serious Is The Problem?” January 26, 2010, available at www.bcaresearch.com. 4 Please see BCA Commodity and Energy Strategy Weekly Report, “India’s Commodity Demand, With Or Without Modi,” February 7, 2019, available at ces.bcaresearch.com. 5 Please see Milan Vaishnav and Jamie Hintson, “As Uttar Pradesh Goes, So Goes India,” Carnegie Endowment for International Peace, February 5, 2019, available at carnegieendowment.org. 6 Please see BCA Emerging Markets Strategy Weekly Report, “EM: Sustained Decoupling, Or Domino Effect?”June 14, 2018, available at ems.bcaresearch.com.
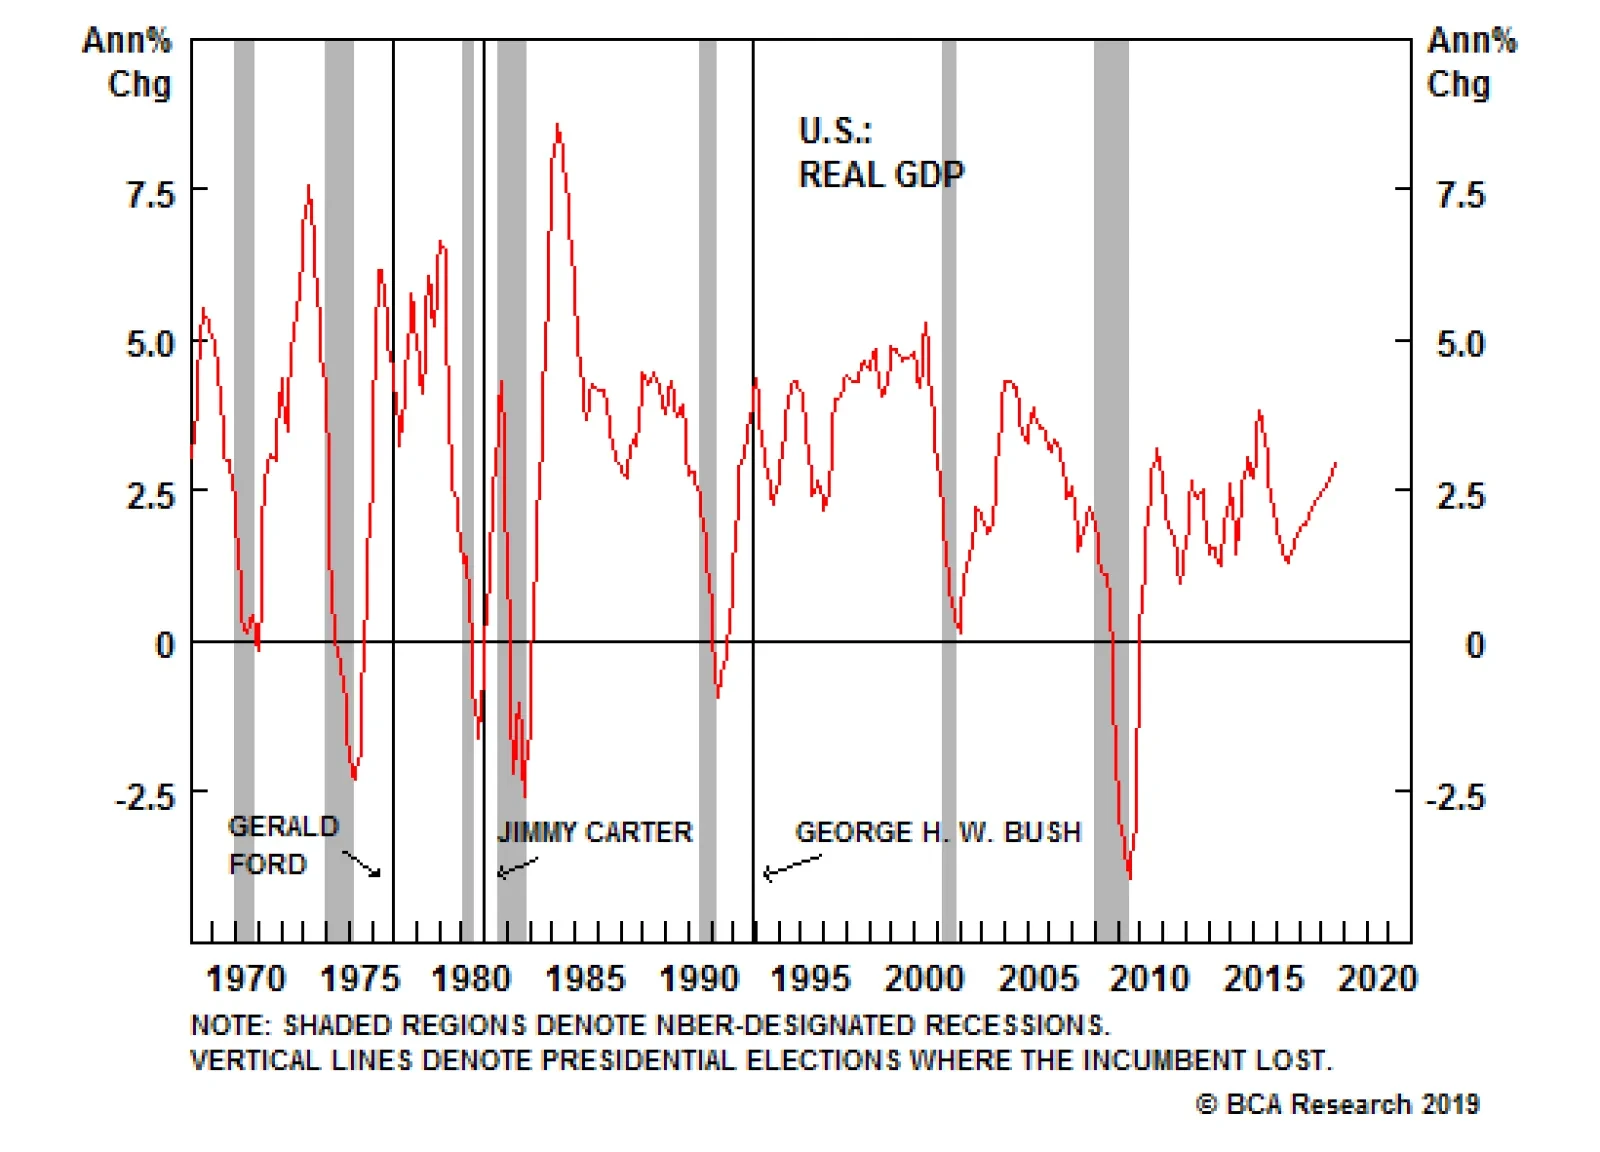
President Trump does not care about stock prices any more than previous presidents. What matters to him is to avoid a protracted equity bear market, which might trigger a recession, endangering his chances of re-election. Accordingly, we expect him over…