Economic Growth

Executive Summary Italy’s right-wing alliance, led by Brothers of Italy, will likely outperform in the upcoming election. The new government will prioritize the economy, posing a risk to the EU’s united front against Russia. It is conducive to an eventual ceasefire, which is marginally positive for risk assets in 2023. We recommend investors underweight Italian assets on a tactical basis. China’s political risks will remain elevated until Xi consolidates power this fall, positive news will come after, if at all. Geopolitical risk in the Taiwan Strait will remain high and persistent until China and the US reach a new understanding. Separately, we are booking a 9% gain on our long US equities relative to UAE equities trade. Italy: GeoRisk Indicator
Italy: GeoRisk Indicator
Italy: GeoRisk Indicator
Tactical Recommendation Inception Date Return LONG US / UAE EQUITIES (CLOSED) 2022-03-11 9.0% Bottom Line: Italy’s political turmoil suggests a more pragmatic policy toward Russia going forward. Europe’s energy cutoff will also motivate governments to negotiate with Russia. Feature In this report we update our GeoRisk Indicators, with a special focus on Italy’s newest political turmoil. Italy Over the past several months, we have argued that Italy was a source of political risk within the European Union and that the market underestimated the probability of an early Italian election. In the past two weeks, this forecast has become a reality (Chart 1). Chart 1Italy: GeoRisk Indicator
Italy: GeoRisk Indicator
Italy: GeoRisk Indicator
The grand coalition under Prime Minister Mario Draghi had fulfilled its two main purposes – to distribute EU recovery funds and secure an establishment politician in the Italian presidency. At the same time, headline inflation hit 8.5% in June, the highest since 1986, even as the Italian and global economy slowed down, Italian government bonds sold off, and Russia induced an energy crisis. The stagflationary economic environment is biting hard and the different coalition members are looking to their individual interests ahead of election season. On July 14, Giuseppe Conte, the former prime minister, pulled its populist Five Star Movement (M5S) out of Mario Draghi’s national unity government, triggering a new round of political turmoil in Italy. Draghi’s first resignation was rejected by Italian President Mattarella later that day. However, on July 21, the League and Forza Italia also defected from the grand coalition. After Draghi’s plan of reviving the coalition collapsed, President Mattarella accepted his resignation and called for a snap election to be held on September 25, ten months ahead of the original schedule. Based on the latest public opinion polls, right-wing political parties are well-positioned for the upcoming election. The far-right Brothers of Italy is now the front runner in the election race and is expected to win around 23% of the votes. Another far-right party, the League, is the third most popular party, with nearly 15% support despite a drop in support during its time within the grand coalition. In addition, the center-right Forza Italia receives 8.5% of the support. Together, the right-wing conservative bloc amounts to 46.5% of voting intentions. There is still positive momentum for Brothers of Italy to harvest more support given that they are the flag-bearer for anti-incumbent sentiment amid the stagflationary economy. By contrast, the left-wing parties – the Democrats, the Left, and the Greens – only command about 27%. The possibility of an extended left-wing coalition, even with the inclusion of the M5S, is looking slim. On July 25, Enrico Letta, the leader of the Democratic Party, publicly expressed his anger against party leader Giuseppe Conte and ruled out any electoral pact with the M5S because of the recent political chaos they caused. He stressed that the Democratic Party would seek ties with parties that had remained loyal to Draghi’s national unity. However, there are not many parties left for the Democrats to partner with. Apart from the Left and the Greens, the Democrats’ best chance would be the center-left Action Party and Italia Viva, which is led by Matteo Renzi, who served as the secretary of the Democratic Party from 2013 to 2018. However, these four parties are small and will not enable the Democrats to form a government. Courting M5S is the Democrats’ only chance to set up an alternative to the right-wing bloc, but that will require the election to force the two parties together. Related Report Geopolitical StrategyLe Pen And Other Hurdles (GeoRisk Update) The Democratic Party was the biggest supporter of Draghi’s government, while the Brothers of Italy were the sole major opposition. Thus the September 25 election will be a race between these two major parties. Both are expected to outperform current polling, as they will attract the most supporters from each side. The other right-wing parties, Forza Italia and the League, will at least perform in line with their polling, while the other left-wing parties will underperform. In the meantime, M5S’ popularity will continue to decline – the party is bruised over its role in Draghi’s coalition and divided over how to respond to the Ukraine war. Foreign policy is a major factor in this election. Italy has the highest share of citizens in the Eurozone who support solving the Russia-Ukraine conflict through peaceful dialogue (52% versus the Eurozone average of 35%). Italy has long maintained pragmatic relations with Russia, including the Putin administration, as it imported 40% of its natural gas from there prior to 2022. The EU is struggling to maintain a united front against Russia, and war policy will be a key focal point among the different parties. Draghi and the Democratic Party are the strongest supporters of the EU’s oil embargo on Russia and decision to send arms to support Ukraine. On the other side, the right-wing Forza Italia and the League have been more equivocal due to their traditional friendship with Russia. What’s more important is the stance of the Brothers of Italy on Russia, as it is the largest party now and will probably lead a right-wing government after the election. On July 27, the three right-wing parties struck a deal to officially form an alliance in the upcoming election and whichever party wins the most votes would determine the next prime minister if the alliance wins. This deal puts Giorgia Meloni, the leader of Brothers of Italy, one step closer to becoming Italy’s first female PM. Giorgia Meloni, unlike her right-wing peers, has endorsed Draghi’s hawkish stance towards Russia. Recently, she stressed that Italy would keep sending arms to Ukraine if her party forms a government after the election. However, Meloni’s speech could be a tactical move to win the election more than an unshakeable policy position. First, like the other two right-wing parties, the Brothers of Italy have had close connections with Russia. After the 2018 Russian presidential election, Meloni congratulated Putin and claimed his victory was “the unequivocal will of Russians.” In addition, she is close to Prime Minister Viktor Orban of Hungary and National Rally leader Marine Le Pen of France, both of whom have criticized the EU’s decision to provide military support to Kyiv. Hence her sharp change of stance this year seems calculated to avoid accusations of being pro-Russian. But that does not preclude a more pragmatic approach to Russia once in office. Second, Meloni has compromised other far-right positions to broaden her voter base. She has reversed the party’s original anti-EU stance and claimed it does not seek to leave the EU, as most European anti-establishment parties have had to do in order to make themselves electable. Being the only female in the election race, Meloni also pledged to protect women’s access to safe abortions in Italy, also a softer stance than before. Even if the Brothers of Italy distance themselves from some unpopular right-wing positions, including on Ukraine, they probably cannot form a government on their own. They will need to court Forza Italia and the League. These two parties prefer a more pragmatic approach to Russia and a peaceful resolution to the war. Thus while it will be hard to find a middle ground on the issue of Ukraine, the election will likely prevent Italy from taking a more confrontational stance toward Russia. It will probably do the opposite. Consider the context in which the next Italian government will operate. Russia declared on July 25 that it will further reduce natural gas supplies to Europe through Nord Stream 1, as we expected, bringing pipeline flows to 20% of its full capacity. Energy prices will go up even as European economic activity and industry will suffer greater strains. If Meloni is elected as the new prime minister this September, she will have to keep talking tough on Russia while simultaneously seeking a solution to soaring energy prices and economic crisis. This solution will be diplomacy – unless Russia seeks to expand its invasion all the way to Moldova. A right-wing victory is the most likely outcome based on opinion polling, the negative cyclical economy, and the underlying structural factors supporting populism in Italy that we have monitored for years. Such a coalition will not be pro-Russian but it will be pragmatic and focused on salvaging Italy’s economy, which means it will be highly inclined toward diplomacy. If Russia halts its military advance – does not attempt to conquer southwestern Ukraine to Moldova – then this point will be greatly reinforced. Italy will become a new veto player within the European Union when it comes to any major new sanctions on Russia. While Europeans will continue diversifying their energy mix away from Russia, it will be much harder for the EU to implement a natural gas embargo in the coming years if Italy as well as Hungary oppose it. Even if we are wrong, and the Democratic Party or other left-wing parties surprise to the upside in the election, the new coalition will most likely have to focus on mitigating the economic crisis and thus pursuing diplomacy with Russia. That is, as long as Russia pushes for a ceasefire after it achieves its military aims in Donetsk, the last holdout within the south-southeastern territories Russia is trying to conquer. Bottom Line: Due to persistent political uncertainty, we recommend investors underweight Italian stocks and bonds at least until a new government takes shape, which could take months even after the election. However, government bonds will remain vulnerable if a right-wing coalition assumes power, since it will pursue loose fiscal policies and will eschew structural reforms. Overall Italy’s early elections will lead to a new government that is focused on short-term economic growth, likely including pragmatism toward Russia. From an investment point of view that will not be a negative development, though much depends on whether Russia expands its invasion or declares victory after Donetsk. Russia Market-based measures of Russian geopolitical risk are rebounding after subsiding from peak levels hit during the invasion of Ukraine in February (Chart 2). Chart 2Russia: GeoRisk Indicator
Russia: GeoRisk Indicator
Russia: GeoRisk Indicator
Russia’s continued tightening of natural gas supplies (and food exports) this week is precisely what we predicted would happen despite a wave of wishful thinking from investors over the past month. The optimists claimed that Russia would resume Nord Stream 1 pipeline flows after a regular “maintenance” period. They also said that Canada’s cooperation in resolving some “technical” issues around turbines would stabilize natural gas supply. The truth is that Russia is seeking to achieve its war aims in Ukraine. Until it has achieved its aims, it will use a range of leverage, including tightening food and energy supplies. Most likely Russia will halt the advance after completing the conquest of the Donbas region and land-bridge to Crimea. Then it will seek to legitimize its conquests through a ceasefire agreement. However, it could launch a new phase of the war to try to take Odessa and Transniestria, which would cement European resolve, even in Italy, and trigger a new round of sanctions. Bottom Line: Russia faces a fork in the road once it completes the conquest of Donetsk. Most likely it will declare victory and start pushing for a ceasefire late this year or early next year. Movement toward a ceasefire would reduce geopolitical risk for global financial markets in 2023. But there is still a substantial risk that Russia could expand the invasion to eastern Moldova, which would escalate the overarching Russia-West conflict and sustain the high level of geopolitical risk for markets. China Chinese political and geopolitical risk will continue to rise and the bounce in Chinese relative equity performance is faltering as we expected (Chart 3). Chart 3China: GeoRisk Indicator
China: GeoRisk Indicator
China: GeoRisk Indicator
China’s leaders will hold their secretive annual meeting at Beidaihe in August ahead of the critical Communist Party national congress this fall. General Secretary Xi Jinping is attempting to cement himself as the paramount leader in China, comparable to Chairman Mao Zedong, transforming China’s governance from that of single-party rule to single-person rule. The reversion to autocratic government is coinciding with a historic economic slowdown consisting of cyclical factors (weak domestic demand, weakening foreign demand, draconian Covid-19 restrictions) and structural factors (labor force contraction, property sector bust, social change and unrest). Both Xi and US President Biden face major domestic political challenges in the coming months with the party congress and the US midterm election. Hence they are holding talks to try to stabilize relations. But we do not think they will succeed. China cannot reject Russia’s strategic overture, while the US cannot afford to re-engage with a China that is partnering with Russia in a challenge to the liberal-democratic world order. In addition, US policies are erratic and the US cannot credibly promise China that it will not pursue a containment strategy even if China offers trade concessions. Bottom Line: China-related political and geopolitical risks will remain very high until at least after the twentieth party congress. At that point we expect President Xi to loosen a range of policies to stabilize the economy and foreign trade relations. These policies may bring positive news in 2023, though China’s biggest macroeconomic and geopolitical problems remain structural in nature and we remain underweight Chinese assets. Taiwan For many years we have warned of a “fourth Taiwan Strait crisis” due to the unsustainable geopolitical situation between China, Taiwan, and the United States. After the war in Ukraine we argued that the US would try to boost its strategic deterrence around Taiwan, since it failed to deter Russia from invading Ukraine, but that the increased commitment to Taiwan would in fact provoke China (Chart 4). Chart 4Taiwan: GeoRisk Indicator
Taiwan: GeoRisk Indicator
Taiwan: GeoRisk Indicator
Until the US and China reach a new understanding over Taiwan, we argued that the region would be susceptible to rising tensions and crisis points that would send investors fleeing from risky assets, especially risky regional assets. It is possible that we have arrived at this crisis now, with House Speaker Nancy Pelosi making preparations to visit Taiwan, China pledging “forceful” countermeasures if she does, President Biden suggesting that the US military thinks Pelosi should not visit, and Biden and Xi preparing for a phone conversation. In essence China is giving an ultimatum and setting a new bar, and a very low bar, for taking some kind of action on Taiwan, i.e. the mere visit of a US House speaker, which has happened before (House Speaker Newt Gingrich in 1997). China’s purpose is to lay the groundwork for preventing the US from upgrading Taiwan relations in any more substantial way, whether political or military. If the Biden administration calls off the Pelosi visit, then American relations with Taiwan will have been curtailed, at least for this administration. If Biden goes forward with the visit, then Beijing will need to respond with an aggressive show of force to prevent any future president from repeating the exercise or building on it. And if this show threatens US personnel or security, a full-blown diplomatic or military crisis could ensue. While we doubt it would lead to full-scale war, it could lead to a frightening confrontation. Biden may want to stabilize relations with China, since he is primarily focused on countering Russia, but his options are limited. China cannot save him from inflation but it can solidify the public perception that he is weak. Hence he is more likely to maintain his administration’s hawkish approach. Biden’s approval rating is 38% and his party faces a drubbing in the midterm elections. A confrontation with Russia, China, Iran, or anyone else would likely help his party by producing a public rally around the flag. Any unilateral concessions will merely strengthen Xi’s power consolidation at the party congress, which is detrimental to US interests. Only if the Biden administration pursues a dovish policy of re-engagement that is subsequently confirmed by the 2024 presidential election will there be potential for a substantial US-China economic re-engagement. We are pessimistic. Bottom Line: Taiwan-related geopolitical risk will rise in the short run. If there is a new US-China understanding over Taiwan, then regional and global geopolitical risk will decline over the medium term. But we remain short Taiwanese assets. Investment Takeaways Investors should remain defensively positioned until the US midterm election ends with congressional gridlock; the Chinese party congress is over and Xi Jinping launches a broad pro-growth policy; and Russia starts pushing for a ceasefire in Ukraine. We also expect that markets will need to get over new, unexpected oil supply shocks arising from the failure of US-Iran nuclear negotiations, which remains off the radar and therefore a source of negative surprises. Any US-Iran nuclear deal would be a major positive surprise that postpones this risk for a few years. Having said that, we are booking a 9% gain on our long US versus UAE equity trade for technical reasons. Democrats have reached a deal to pass a budget reconciliation bill in an effort to mitigate midterm election losses. This development reinforces the 65% odds of passage that we have maintained for this bill’s passage in our US Political Strategy reports since last year. Yushu Ma Research Analyst yushu.ma@bcaresearch.com Matt Gertken Chief Geopolitical Strategist mattg@bcaresearch.com Appendix UK Chart 5UK: GeoRisk Indicator
United Kingdom: GeoRisk Indicator
United Kingdom: GeoRisk Indicator
Germany Chart 6Germany: GeoRisk Indicator
Germany: GeoRisk Indicator
Germany: GeoRisk Indicator
France Chart 7France: GeoRisk Indicator
France: GeoRisk Indicator
France: GeoRisk Indicator
Spain Chart 8Spain: GeoRisk Indicator
Spain: GeoRisk Indicator
Spain: GeoRisk Indicator
Canada Chart 9Canada: GeoRisk Indicator
Canada: GeoRisk Indicator
Canada: GeoRisk Indicator
Australia Chart 10Australia: GeoRisk Indicator
Australia: GeoRisk Indicator
Australia: GeoRisk Indicator
Korea Chart 11Korea: GeoRisk Indicator
Korea: GeoRisk Indicator
Korea: GeoRisk Indicator
Brazil Chart 12Brazil: GeoRisk Indicator
Brazil: GeoRisk Indicator
Brazil: GeoRisk Indicator
Turkey Chart 13Turkey: GeoRisk Indicator
Turkey: GeoRisk Indicator
Turkey: GeoRisk Indicator
South Africa Chart 14South Africa: GeoRisk Indicator
South Africa: GeoRisk Indicator
South Africa: GeoRisk Indicator
Strategic Themes Open Tactical Positions (0-6 Months) Open Cyclical Recommendations (6-18 Months) Regional Geopolitical Risk Matrix "Batting Average": Geopolitical Strategy Trades Geopolitical Calendar
Executive Summary Iran Reaches Nuclear Breakout
Biden And Putin Court The Middle East
Biden And Putin Court The Middle East
The next geopolitical crisis will stem from the Middle East. The US, Russia, and China are striving for greater influence there and Iran’s nuclear quest is reaching a critical juncture. The risk of US-Israeli attacks against Iran remains 40% over the medium term and will rise sharply if Iran attempts to construct a deliverable nuclear device. Saudi Arabia may increase oil production but only if global demand holds up, which OPEC will assess at its August 3 meeting. Global growth risks will prevail in the short term and reduce its urgency. Russia will continue to squeeze supplies of energy and food for the outside world. The restart of Nord Stream 1 and the Turkey-brokered grain export proposal are unreliable signals. Russia’s aim is victory in Ukraine and any leverage will be used. The US may be done with the Middle East but the Middle East may not be done with the US. Structurally we remain bullish on gold and European defense stocks but we are booking 17% and 18% gains on our current trades. The deterioration in global growth and likely pullback in inflation will temporarily undercut these trades. Tactical Recommendation Inception Date Return LONG GOLD (CLOSED) 2019-06-12 17.1% LONG EUROPEAN AEROSPACE & DEFENSE / EUROPEAN TECH EQUITIES (CLOSED) 2022-03-18 17.9% Bottom Line: Global demand is weakening, which will weigh on bond yields and commodities. Yet underlying oil supply constraints persist – and US-Iran conflict will exacerbate global stagflation. Feature Chart 1Equity Volatility And Oil Price Volatility
Equity Volatility And Oil Price Volatility
Equity Volatility And Oil Price Volatility
US President Joe Biden visited Saudi Arabia last week in a belated attempt to make amends with OPEC, increase oil production, and reduce inflation ahead of the midterm election. Biden also visited Israel to deter Iran, which is the next geopolitical crisis that markets are underrating. Meanwhile Russian President Vladimir Putin went to Iran on his second trip outside of Russia since this year’s invasion of Ukraine. Putin sought an ally in his conflict with the West, while also negotiating with Turkish President Recep Erdogan, who sought to position himself as a regional power broker. In this report we analyze Biden’s and Putin’s trips and what they mean for the global economy and macro investors. Macroeconomics is bearish for oil in the short term but geopolitics is bullish for oil in the short-to-medium term. The result is volatility (Chart 1). OPEC May Pump More Oil But Not On Biden’s Time Frame Here are the important developments from Biden’s trip: A credible threat against Iran: The US and Israel issued a joint declaration underscoring their red line against Iranian nuclear weaponization.1 Meanwhile the Iranians claimed to have achieved “nuclear breakout,” i.e. enough highly enriched uranium to construct a nuclear device (Chart 2). A balance-of-power coalition to contain Iran: Israel and Saudi Arabia improved relations on the margin. Each took action to build on the strategic détente between Israel and various Arab states that is embodied in the 2020 Abraham Accords.2 This strategic détente has staying power because it is a self-interested attempt by the various nations to protect themselves against common rivals, particularly Iran (Chart 3). Biden also tried to set up a missile defense network with Israel and the Arabs, although it was not finalized.3 Chart 2Iran Reaches Nuclear Breakout
Biden And Putin Court The Middle East
Biden And Putin Court The Middle East
A reaffirmed US-Saudi partnership: The US and Saudi Arabia reaffirmed their partnership despite a rocky patch over the past decade. The rocky patch arises from US energy independence, China’s growth, and US attempts to normalize ties with Iran (Chart 4). These trends caused the Saudis to doubt US support and to view China as a strategic hedge. Chart 3Iran: Surrounded And Outgunned
Biden And Putin Court The Middle East
Biden And Putin Court The Middle East
President Biden came into office aiming to redo the Iran deal and halt arms sales to Saudi Arabia. Since then he has been chastened by high energy prices, a low approval rating, and hawkish Iranian policy. On this trip he came cap in hand to the Saudis in a classic example of geopolitical constraints. If the US-Iran deal is verifiably dead, then US-Saudi ties will improve sustainably. (Though of course the Saudis will still do business with China and even start trading with China in the renminbi.) What global investors want to know is whether the Saudis and OPEC will pump more oil. The answer is maybe someday. The Saudis will increase production to save the global business cycle but not the Democrats’ election cycle. They told Biden that they will increase production only if there is sufficient global demand. Global Brent crude prices have fallen by 6% since May, when Biden booked his trip, so the kingdom is not in a great rush to pump more. Its economy is doing well this year (Chart 5). Chart 4Drivers Of Saudi Anxiety
Drivers Of Saudi Anxiety
Drivers Of Saudi Anxiety
Chart 5Saudis Won't Pump If Demand Is Weak
Saudis Won't Pump If Demand Is Weak
Saudis Won't Pump If Demand Is Weak
At the same time, if global demand rebounds, the Saudis will not want global supply constraints to generate punitive prices that cap the rebound or kill the business cycle. After all, a global recession would deplete Saudi coffers, set back the regime’s economic reforms, exacerbate social problems, and potentially stir up political dissent (Chart 6). Related Report Geopolitical StrategyThird Quarter Geopolitical Outlook: Thunder And Lightning Hence the Saudis will not increase production substantially until they have assessed the global economy and discussed the outlook with the other members of the OPEC cartel in August and September, when the July 2021 agreement to increase production expires. We expect global demand to weaken as Europe and China continue to struggle. Our Commodity & Energy Strategist Bob Ryan argues that further escalation in the energy war between the EU and Russia could push prices above $220 per barrel by Q4 2023, whereas an economic collapse could push Brent down to $60 per barrel. His base case Brent price forecast remains $110 per barrel on average in 2022 and $117 per barrel in 2023 (Chart 7). Chart 6Saudis Will Pump To Prevent Recession
Saudis Will Pump To Prevent Recession
Saudis Will Pump To Prevent Recession
Chart 7BCA's July 2022 Oil Price Forecast
BCA's July 2022 Oil Price Forecast
BCA's July 2022 Oil Price Forecast
The geopolitical view suggests upside oil risks over the short-to-medium time frame but the macroeconomic view suggests that downside risks will be priced first. Bottom Line: Saudi Arabia may increase production but not at any US president’s beck and call. The Saudis are not focused on US elections, they benefit from the current level of prices, and they do not suffer if Republicans take Congress in November. The downside risk in oil prices stems from demand disappointments in global growth (especially China) rather than any immediate shifts in Saudi production discipline. Volatility will remain high. US-Iran Talks: Dying But Not Dead Yet In fact the Middle East underscores underlying and structural oil supply constraints despite falling global demand. While Iran is a perennial geopolitical risk, the world is reaching a critical juncture over the next couple of years. Investors should not assume that Iran can quietly achieve nuclear arms like North Korea. Since August 2021 we have argued that the US and Iran would fail to put back together the 2015 nuclear deal (the Joint Comprehensive Plan of Action or JCPA). This failure would in turn lead to renewed instability across the Middle East and sporadic supply disruptions as the different nations trade military threats and potentially engage in direct warfare. This forecast is on track after Biden’s and Putin’s trip – but we cannot yet say that it is fully confirmed. Biden’s joint declaration with Israeli Prime Minister Yair Lapid closed any daylight that existed between the US and Israel. Given that there was some doubt about the intentions of Biden and the Democrats, it is now crystal clear that the US is determined to prevent Iran from getting nuclear weapons even if it requires military action. The US specifically said that it will use “all instruments of national power” to prevent that outcome. Chart 8Iran Not Forced To Capitulate
Iran Not Forced To Capitulate
Iran Not Forced To Capitulate
Judging by the tone of the statement, the Israelis wrote the document and Biden signed it.4 Biden’s foreign policy emphasizes shoring up US alliances and partnerships, which means letting allies and partners set the line. Israel’s Begin Doctrine – which says that Israel is willing to attack unilaterally and preemptively to prevent a hostile neighbor from obtaining nuclear weapons – has been reinforced. The US is making a final effort to intimidate Iran into rejoining the deal. By clearly and unequivocally reiterating its stance on nuclear weapons, and removing doubts about its stance on Israel, there is still a chance that the Iranian calculus could change. This is possible notwithstanding Ayatollah Khamenei’s friendliness with Putin and criticisms of western deception.5 After all, why would the Iranians want to be attacked by the US and Israeli militaries? Iran will need to think very carefully about what it does next. Khamenei just turned 83 years old and is trying to secure the Islamic Republic’s power transition and survival after his death. Here are the risks: Iran’s economy, buoyed by the commodity cycle, is not so weak as to force Khamenei to capitulate. Back in 2015 oil prices had collapsed and his country was diplomatically isolated. Today the economy has somewhat weathered the storm of the US’s maximum pressure sanctions (Chart 8). Iran is in bad shape but it has not been brought to its knees. Another risk is that Khamenei believes the American public lacks the appetite for war. Americans say they are weary of Middle Eastern wars and do not feel particularly threatened by Iran. However, this would be a miscalculation. US war-weariness is nearing the end of its course. The US engages in a major military expedition roughly every decade. Americans are restless and divided – and the political elite fear populism – so a new foreign distraction is not as unlikely as the consensus holds. Moreover a nuclear Iran is not an idle threat but would trigger a regional nuclear arms race and overturn the US grand strategy of maintaining a balance of power in the Middle East (as in other regions). In short, the US government can easily mobilize the people to accept air strikes to prevent Iran from going nuclear because there is latent animosity toward Iran in both political parties (Chart 9). Chart 9Risk: Iran Overrates US War-Weariness
Biden And Putin Court The Middle East
Biden And Putin Court The Middle East
Another risk is that Iran forges ahead believing that the US and Israel are unwilling or unable to attack and destroy its nuclear program. The western powers might opt for containment like they did with North Korea or they might attack and fail to eliminate the program. This is hard to believe but Iran clearly cannot accept US security guarantees as an alternative to a nuclear deterrent when it seeks regime survival. At the same time Russia is courting Iran, encouraging it to join forces against the American empire. Iran is planning to sell drones to Russia for use in Ukraine, while Russia is maintaining nuclear and defense cooperation with Iran. Putin’s trip highlighted a growing strategic partnership despite a low base of economic ties (Chart 10).6 Chart 10Russo-Iranian Ties
Russo-Iranian Ties
Russo-Iranian Ties
Chart 11West Vulnerable To Middle East War
Biden And Putin Court The Middle East
Biden And Putin Court The Middle East
While Russia does not have an interest in a nuclear-armed Iran, it is not afraid of Iran alone, and it would benefit enormously if the US and Israel got bogged down in a new war that destabilized the Middle East. Oil prices would rise, the US would be distracted, and Europe would be even more vulnerable (Chart 11). Chart 12China's Slowdown And Dependency On Middle East
China's Slowdown And Dependency On Middle East
China's Slowdown And Dependency On Middle East
China’s interest is different. It would prefer for Iran to undermine the West by means of a subtle and long-term game of economic engagement rather than a destabilizing war in the region that would upset China’s already weak economy. However, Beijing will not join with the US against Iran, especially if Iran and Russia are aligned. Ultimately China needs to access Iranian energy reserves via overland routes so that it gains greater supply security vis-à-vis the American navy (Chart 12). Since June 2019, we have maintained 40% odds of a military conflict with Iran. The logic is outlined in Diagram 1, which we have not changed. Conflict can take various forms since the western powers prefer sabotage or cyber-attacks to outright assault. But in the end preventing nuclear weapons may require air strikes – and victory is not at all guaranteed. We are very close to moving to the next branch in Diagram 1, which would imply odds of military conflict rise from 40% to 80%. We are not making that call yet but we are getting nervous. Diagram 1Iran Nuclear Crisis: Decision Tree
Biden And Putin Court The Middle East
Biden And Putin Court The Middle East
Moreover it is the saber rattling around this process – including an extensive Iranian campaign to deter attack – that will disrupt oil distribution and transport sooner rather than later. Bottom Line: The US and Iran could still find diplomatic accommodation to avoid the next step in our decision tree. Therefore we are keeping the odds of war at a subjective 40%. But we have reached a critical juncture. The next step in the process entails a major increase in the odds of air strikes. Putin’s Supply Squeeze Will Continue As we go to press, financial markets are reacting to President Putin’s marginal easing of Russian political pressure on food and energy supplies. First, Putin took steps toward a deal, proposed by Turkish President Erdogan, to allow Ukrainian grain exports to resume from the Black Sea. Second, Putin allowed a partial restart of the Nord Stream 1 natural gas pipeline, after a total cutoff occurred during the regular, annual maintenance period. However, these moves should be kept into perspective. Nord Stream 1 is still operating at only 40% of capacity. Russia reduced the flow by 60% after the EU agreed to impose a near-total ban on Russian oil exports by the end of the year. Russia is imposing pain on the European economy in pursuit of its strategic objectives and will continue to throttle Europe’s natural gas supply. Russia’s aims are as follows: (1) break up European consensus on Russia and prevent a natural gas embargo from being implemented in future (2) pressure Europe into negotiating a ceasefire in Ukraine that legitimizes Russia’s conquests (3) underscore Russia’s new red line against NATO military deployments in Finland and Sweden. Europe, for its part, will continue to diversify its natural gas sources as rapidly as possible to reduce Russia’s leverage. The European Commission is asking countries to decrease their natural gas consumption by 15% from August to March. This will require rationing regardless of Russia’s supply squeeze. The collapse in trust incentivizes Russia to use its leverage while it still has it and Europe to try to take that leverage away. The economic costs are frontloaded, particularly this winter. The same goes for the Turkish proposal to resume grain exports. Russia will continue to blockade Ukraine until it achieves its military objectives. The blockade will be tightened or loosened as necessary to achieve diplomatic goals. Part of the reason Russia invaded in the first place was to seize control of Ukraine’s coast and hold the country’s ports, trade, and economy hostage. Bottom Line: Russia’s relaxation of food and energy flows is not reliable. Flows will wax and wane depending on the status of strategic negotiations with the West. Europe’s economy will continue to suffer from a Russia-induced supply squeeze until Russia achieves a ceasefire in Ukraine. So will emerging markets that depend on grain imports, such as Turkey, Egypt, and Pakistan. Investment Takeaways The critical juncture has arrived for our Iran view. If Iran does not start returning to nuclear compliance soon, then a fateful path of conflict will be embarked upon. The Saudis will not give Biden more oil barrels just yet. But they may end up doing that if global demand holds up and the US reassures them that their regional security needs will be met. First, the path for oil over the next year will depend on the path of global demand. Our view is negative, with Europe heading toward recession, China struggling to stimulate its economy effectively, and the Fed unlikely to achieve a soft landing. Second, the path of conflict with Iran will lead to a higher frequency of oil supply disruptions across the Middle East that will start happening very quickly after the US-Iran talks are pronounced dead. In other words, oil prices will be volatile in a stagflationary environment. In addition, while inflation might roll over for various reasons, it is not likely to occur because of any special large actions by Saudi Arabia. The Saudis are waiting on global cues. Of these, China is the most important. We are booking a 17% gain on our long gold trade as real rates rise and China’s economy deteriorates (Chart 13). This is in line with our Commodity & Energy Strategy, which is also stepping aside on gold for now. Longer term we remain constructive as we see a secular rise in geopolitical risk and persistent inflation problems. Chart 13Book Gains On Gold ... For Now
Book Gains On Gold ... For Now
Book Gains On Gold ... For Now
We are booking an 18% gain on our long European defense / short European tech trade. Falling bond yields will benefit European tech (Chart 14). We remain bullish on European and global defense stocks. Chart 14Book Gains On EU Defense Vs Tech ... For Now
Book Gains On EU Defense Vs Tech ... For Now
Book Gains On EU Defense Vs Tech ... For Now
Chart 15Markets Underrate Middle East Geopolitical Risk
Biden And Putin Court The Middle East
Biden And Putin Court The Middle East
Stay long US equities relative to UAE equities. Middle Eastern geopolitical risk is underrated (Chart 15). Matt Gertken Chief Geopolitical Strategist mattg@bcaresearch.com Footnotes 1 The White House, “The Jerusalem U.S.-Israel Strategic Partnership Joint Declaration,” July 14, 2022, whitehouse.gov. 2 Israel and the US will remove international peacekeepers from the formerly Egyptian Red Sea islands of Tiran and Sanafir, which clears the way for Saudi Arabia to turn them into tourist destinations. Saudi Arabia also removed its tight airspace restrictions on Israel, enabling civilian Israeli airlines to fly through Saudi airspace on normal basis. Of course, Saudi allowance for Israeli military flights to pass through Saudi airspace would be an important question in any future military operation against Iran. 3 The US has long wanted regional missile defense integration. The Biden administration is proposing “integrated air defense cooperation” that would include Israel as well as the Gulf Cooperation Council (GCC). A regional “air and missile defense architecture” would counter drones and missiles from rival states and non-state actors such as Iran and its militant proxies. Simultaneously the Israelis are putting forward the proposed Middle East Air Defense Alliance (MEAD) in meetings with the same GCC nations. Going forward, Iran’s nuclear ambitions will give more impetus to these attempts to cooperate on air defense. 4 This is apparent from the hard line on Iran and the relatively soft line on Russia in the document. Israel is wary of taking too hard of a line against Russia because of its security concerns in Syria where Russian forces are present. See footnote 1 above. 5 Khamenei called for long-term cooperation between Russia and Iran; he justified Russia’s invasion of Ukraine as a defense against NATO encroachment; he called for the removal of the US dollar as the global reserve currency. See “Khamenei: Tehran, Moscow must stay vigilant against Western deception,” Israel Hayom, July 20, 2022, israelhayom.com. 6 Russia’s natural gas champion Gazprom signed an ostensible $40 billion memorandum of understanding with Iran’s National Oil Company to develop gas fields and pipelines. See Nadeen Ebrahim, “Iran and Russia’s friendship is more complicated than it seems,” CNN, July 20, 2022, cnn.com. However, while there are longstanding obstacles to Russo-Iranian cooperation, the West’s tough new sanctions on Russia and EU diversification will make Moscow more willing to invest in Iran. Strategic Themes Open Tactical Positions (0-6 Months) Open Cyclical Recommendations (6-18 Months) Regional Geopolitical Risk Matrix
Executive Summary China's Unemployment
Questions From The Road
Questions From The Road
Over the past week we have been visiting clients along the US west coast. In this report we hit some of the highlights from the most important and frequently asked questions. Xi Jinping is seizing absolute power just as the country’s decades-long property boom turns to bust. He will stimulate the economy but Chinese stimulus is less effective than it used to be. The US and Israel are underscoring their red line against Iranian nuclear weaponization. If Iran does not freeze its nuclear program, the Middle East will begin to unravel again. The UK’s domestic instability is returning, with Scotland threatening to leave the union. Brexit, the pandemic, and inflation make a Scottish referendum a more serious risk than in the past. Shinzo Abe’s assassination makes him a martyr for a vision of Japan as a “normal country” – i.e. one that is not pacifist but capable of defending itself. Japan’s rearmament, like Germany’s, points to the decline of the WWII peace settlement and the return of great power competition. Bottom Line: Investors need a new global balance to be achieved through US diplomacy with Russia, China, and Iran. That is not forthcoming, as the chief nations face instability at home and a stagflationary global economy. Feature The world is becoming less stable as stagflation combines with great power competition. Global uncertainty is through the roof. From a macroeconomic perspective, investors need to know whether central banks can whip inflation without triggering a recession. From a geopolitical perspective, investors need to know whether Russia’s conflict with the West will expand, whether US-China and US-Iran tensions will escalate in a damaging way, and whether domestic political rotations in the US and China this fall will lead to more stable and productive economies. China: What Will Happen At The Communist Party Reshuffle? General Secretary Xi Jinping will cement another five-to-10 years in power while promoting members of his faction into key positions on the Politburo and Politburo Standing Committee. By December Xi will roll out a pro-growth strategy for 2023 and the government will signal that it will start relaxing Covid-19 restrictions. But China’s structural problems ensure that this good news for global growth will only have a fleeting effect. China’s governance is shifting from single-party rule to single-person rule. It is also shifting from commercially focused decentralization to national security focused centralization. Xi has concentrated power in himself, in the party, and in Beijing at the expense of political opponents, the private economy, and outlying regions like Hong Kong, the South China Sea, and Xinjiang. The subordination of Taiwan is the next major project, ensuring that China will ally with Russia and that the US and China cannot repair or deepen their economic partnership. Related Report Geopolitical StrategyWill China Let 100 Flowers Bloom? Only Briefly. Xi and the Communist Party began centralizing political power and economic control shortly after the Great Recession. At that time it became clear that a painful transition away from export manufacturing and close relations with the United States was necessary. The transition would jeopardize China’s long-term economic, social, political, and geopolitical stability. The Communist Party believed it needed to revive strongman leadership (autocracy) rather than pursuing greater liberalization that would ultimately increase the odds of political revolution (democratization). The Xi administration has struggled to manage the country’s vast debt bubble, given that total debt standing has surged to 287% of GDP. The global pandemic forced the government to launch another large stimulus package, which it then attempted to contain. Corporate and household deleveraging ensued. The property and infrastructure boom of the past three decades has stalled, as the regime has imposed liquidity and capital requirements on banks and property developers to try to avoid a financial crisis. Regulatory tightening occurred in other sectors to try to steer investment into government-approved sectors and reduce the odds of technological advancement fanning social dissent. China’s draconian “zero Covid” policy sought to limit the disease’s toll, improve China’s economic self-reliance, and eliminate the threat of social protest during the year of the twentieth party congress. But it also slammed the brakes on growth. China is highly vulnerable to social instability for both structural and cyclical reasons. Chinese social unrest was our number one “Black Swan” for this year and it is now starting to take shape in the form of angry mortgage owners across the country refusing to make mortgage payments on houses that were pre-purchased but not yet built and delivered (Chart 1). Chart 1China: Mortgage Payment Boycott
Questions From The Road
Questions From The Road
The mortgage payment boycott is important because it is stemming from the outstanding economic and financial imbalance – the property sector – and because it is a form of cross-regional social organization, which the Communist Party will disapprove. There are other social protests emerging, including low-level bank runs, which must be monitored very closely. Local authorities will act quickly to stop the spread of the mortgage boycott. But unhappy homeowners will be a persistent problem due to the decline of the property sector and industry. China’s property sector looks uncomfortably like the American property sector ahead of the 2006-08 bust. Prices for existing homes are falling while new house prices are on the verge of falling (Chart 2). While mortgages only make up 15% of bank assets, and household debt is only 62% of GDP, households are no longer taking on new debt (Chart 3). Chart 2China's Falling Property Prices
China's Falling Property Prices
China's Falling Property Prices
Chart 3China's Property Crisis
China's Property Crisis
China's Property Crisis
Chart 4China's Unemployment
China's Unemployment
China's Unemployment
Most likely China’s property sector is entering the bust phase that we have long expected – if not, then the reason will be a rapid and aggressive move by authorities to expand monetary and fiscal stimulus and loosen economic restrictions. That process of broad-based easing – “letting 100 flowers bloom” – will not fully get under way until after the party congress, say in December. Unemployment is rising across China as the economy slows, another point of comparison with the United States ahead of the 2008 property collapse (Chart 4). Unemployment is a manipulated statistic so real conditions are likely worse. There is no more important indicator. China’s government will be forced to ease policy, creating a positive impact on global growth in 2023, but the impact will be fleeting. Bottom Line: The underlying debt-deflationary context will prevail before long in China, weighing on global growth and inflation expectations on a cyclical basis. Middle East: Why Did Biden Go And What Will He Get? President Biden traveled to Israel and now Saudi Arabia because he wants Saudi Arabia and the Gulf Arab members of OPEC to increase oil production to reduce gasoline prices at the pump for Americans ahead of the midterm elections (Chart 5). Chart 5Biden Goes To Israel And Saudi Arabia
Biden Goes To Israel And Saudi Arabia
Biden Goes To Israel And Saudi Arabia
True, fears of recession are already weighing on prices, but Biden embarked on this mission before the growth slowdown was fully appreciated and he is not going to lightly abandon the anti-inflation fight before the midterm election. Biden also went because one of his top foreign policy priorities – the renegotiation of the 2015 nuclear deal with Iran – is falling apart. The Iranians do not want to freeze their nuclear program because they want regime survival and security. While Biden is offering a return to the 2015 deal, the conditions that produced the deal are no longer applicable: Russia and China are not cooperating with the US and EU to isolate Iran. Russia is courting Iran, oil prices are high and sanction enforcement is weak (unlike 2015). The Iranians now know, after the Trump administration, that they cannot trust the Americans to give credible security guarantees that will last across parties and administrations. The war in Ukraine also underscores the weakness of diplomatic security guarantees as opposed to a nuclear deterrent. Hence the joint US and Israeli declaration that Iran will never be allowed to obtain nuclear weapons. The good news is that this kind of joint statement is precisely what needed to occur – the underscoring of the red line – to try to change Ayatollah Ali Khamenei’s calculus regarding his drive to achieve nuclear breakout. In 2015 Khamenei gave diplomacy a chance to try to improve the economy, stave off social unrest, prepare the way for his eventual leadership succession process, and secure the Islamic Republic. The bad news is that Khamenei probably cannot make the same decision this time, as the hawkish faction now runs his government, the Americans are unreliable, and Russia and China are offering an alternative strategic orientation. The Saudis will pump more oil if necessary to save the global business cycle but not at the beck and call of a US president. The drop in oil prices reduces their urgency. The Americans can reassure the Saudis and Israel as long as the deal with Iran is not going forward. That looks to be the case. But then the US and Israel will have to undertake joint actions to underline their threat to Iran – and Iran will have to threaten to stage attacks across the region so as to deter any attack. Bottom Line: If a US-Iran deal does not materialize at the last minute, Middle Eastern instability will revive and a new source of oil supply constraint will plague the global economy. We continue to believe a US-Iran deal is unlikely, with only 40% odds of happening. Europe: Will Russia Turn Back On The Natural Gas? Russia’s objective in cutting off European natural gas is to inflict a recession on Europe. It wants a better bargaining position on strategic matters. Therefore we assume Russia will continue to squeeze supplies from now through the winter, when European demand rises and Russian leverage will peak. If Russia allows some flow to return, then it will be part of the negotiating process and will not preclude another cutoff before winter. It is possible that Russia is merely giving Europe a warning and will revert back to supplying natural gas. The problem is that Russia’s purpose is to achieve a strategic victory in Ukraine and in negotiations over NATO’s role in the Nordic countries. Russia has not achieved these goals, so natural gas cutoff will likely continue. Russia also hopes that by utilizing its energy leverage – while it still has it – it will bring forward the economic pain of Europe’s transition away from reliance on Russian energy. In that case European countries will experience recession and households will begin to change their view of the situation. European governments will be more likely to change their policies, to become more pragmatic and less confrontational toward Russia. Or European governments will be voted out of power and do the same thing. Other states could join Hungary in saying that Europe should never impose a full natural gas embargo on Russia. Russia would be able to salvage some of its energy trade with Europe over the long run, despite the war in Ukraine and the inevitable European energy diversification. In recent months we highlighted Italy as the weakest link in the European chain and the country most likely to see such a shift in policy occur. Italy’s national unity coalition had lost its reason for being, while the combination of rising bond yields and natural gas prices weighed on the economy. The Italian bond spread over German bunds has long served as our indicator of European political stress – and it is spiking now, forcing the European Central Bank to rush to plan an anti-fragmentation strategy that would theoretically enable it to tighten monetary policy while preventing an Italian debt crisis (Chart 6). The European Union remains unlikely to break up – Russian aggression was always one of our chief arguments for why the EU would stick together. But Italy will undergo a recession and an election (due by June 2023 but that could easily happen this fall), likely producing a new government that is more pragmatic with regard to Russia so as to reduce the energy strain. Chart 6Italy's Crisis Points To EU Divisions On Russia
Italy's Crisis Points To EU Divisions On Russia
Italy's Crisis Points To EU Divisions On Russia
Italy’s political turmoil shows that European states are feeling the energy crisis and will begin to shift policies to reduce the burden on households. Households will lose their appetite for conflict with Russia on behalf of Ukrainians, especially if Russia begins offering a ceasefire after completing its conquest of the Donetsk area. If Russia expands its invasion, then Europe will expand sanctions and the risk of further strategic instability will go up. But most likely Russia will seek to quit while it is ahead and twist Europe’s arm into foisting a ceasefire onto Ukraine. Bottom Line: A change of government in Italy will increase the odds that the EU will engage in diplomacy with Russia in the coming year, if Russia offers, so as to reach a new understanding, restore natural gas flows, and salvage the economy. This would leave NATO enlargement unresolved but a shift in favor of a ceasefire in Ukraine in 2023 would be less negative for European assets and the euro. UK: Who Will Replace Boris Johnson? Last week UK Prime Minister Boris Johnson fell from power and now the Conservative Party is engaging in a leadership competition to replace him. We gave up on Johnson after he survived his no-confidence vote and yet it became clear that he could not recover in popular opinion. The inflation outburst destroyed his premiership and wiped away whatever support he had gained from executing Brexit. In fact it reinforced the faction that believed Brexit was the wrong decision. Going forward the UK will be consumed with domestic political turmoil as the cost of stagflation mounts, and geopolitical turmoil as Scotland attempts to hold a second independence referendum, possibly by October 2023. Global investors should focus primarily on Scotland’s attempt to secede, since the breakup of the United Kingdom would be a momentous historical event and a huge negative shock for pound sterling. While only 44.7% of Scots voted for independence in 2014, now they have witnessed Brexit, Covid-19, and stagflation, producing tailwinds for the Scots nationalist vote (Chart 7). Chart 7Forget Bojo's Exit, Watch Scotland
Questions From The Road
Questions From The Road
There are still major limitations on Scotland exiting, since its national capabilities are limited, it would need to join the European Union, and Spain and possibly others will threaten to veto its membership in the European Union for fear of feeding their own secessionist movements. But any new referendum – including one done without the approval of Westminster – should be taken very seriously by investors. Bottom Line: Johnson’s removal will only marginally improve the Tories’ ability to manage the rebellion brewing in the north. A snap election that brings the Labour Party back into power would have a greater chance of keeping Scotland in the union, although it is not clear that such a snap election will happen in time to affect any Scottish decision. The UK faces economic and political turmoil between now and any referendum and investors should steer clear of the pound. (Though we still favor GBP over eastern European currencies). Britain will remain aggressive toward Russia but its ability to affect the Russian dynamic will fall, leaving the US and EU to decide the fate of Russian relations. Japan: What Is The Significance Of Shinzo Abe’s Assassination? Former Japanese Prime Minister Shinzo Abe was assassinated by a lone fanatic with a handmade gun. The significance of the incident is that Abe will become a martyr for a certain vision of Japan – his vision of Japan, which is that Japan can become a “normal country” that moves beyond the shackles of the guilt of its imperial aggression in World War II. A normal country is one that is economically stable and militarily capable of defending itself – not a pacifist country mired in debt-deflation. Abe stood for domestic reflation and a proactive foreign policy, along with the normalization of the Japanese Self-Defense Forces (JSDF). True, economic policy can become less dovish if necessary to deal with inflation. Some changes at the Bank of Japan may usher in a less dovish shift in monetary policy in particular. But monetary policy cannot become outright hawkish like it was before Abe. And Abe’s fiscal policy was never as loose as it was made out to be, given that he executed several hikes to the consumption tax. Japan’s structural demographic decline and large debt burden will continue to weigh on economic activity whenever real rates and the yen rise. The government will be forced to reflate using monetary and fiscal policy whenever deflation threatens to return. Debt monetization will remain an option for future Japanese governments, even if it is restrained during times of high inflation. Chart 8Shinzo Abe's Legacy
Questions From The Road
Questions From The Road
This is not only because Japanese households will become depressed if deflation is left unchecked but also because economic growth must be maintained in order to sustain the nation’s new and growing national defense budgets. Japan’s growing need for self defense stems from China’s strategic rise, Russia’s aggression, and North Korea’s nuclearization, plus uncertainty about the future of American foreign policy. These trends will not change anytime soon. Indeed the Liberal Democratic Party’s popularity has increased under Abe’s successor, Prime Minister Fumio Kishida, who will largely sustain Abe’s vision. The Diet still has a supermajority in favor of constitutional revision so as to enshrine the self-defense forces (Chart 8). And the de facto policy of rearmament continues even without formal revision. Bottom Line: Any Japanese leader who attempts to promote a hawkish BoJ, and a dovish JSDF, will fail sooner rather than later. The revolving door of prime ministers will accelerate. As Japan’s longest-serving prime minister, Shinzo Abe opened up the reliable pathway, which is that of a dovish BoJ and a hawkish foreign policy. This is important for the world, as well as Japan, because a more hawkish Japan will increase China’s fears of strategic containment. The frozen conflicts in Asia will continue to thaw, perpetuating the secular rise in geopolitical risk. We remain long JPY-KRW, since the BoJ may adjust in the short term and Chinese stimulus is still compromised, but that trade is on downgrade watch. Investment Takeaways Russia’s energy cutoff is aimed at pushing Europe into recession so as to force policy changes or government changes in Europe that will improve Russia’s position at the negotiating table over Ukraine, NATO, and other strategic disputes. Hence Russia is unlikely to increase the natural gas flow until it believes it has achieved its strategic aims and multiple veto players in the EU will prevent the EU from ever implementing a full-blown natural gas embargo. Chinese stimulus cannot be fully effective until it relaxes Covid-19 restrictions, likely beginning in December or next year when Xi Jinping uses his renewed political capital to try to stabilize the economy. However, China’s government powers alone are insufficient to prevent the debt-deflationary tendency of the property bust. The Middle East faces rising geopolitical tensions that will take markets by surprise with additional energy supply constraints. The implication is continued oil volatility given that global growth is faltering. Once global demand stabilizes, the Middle East’s turmoil will add to existing oil supply constraints to create new price pressures. The odds are not very high of the Federal Reserve achieving a “soft landing” in the context of a global energy shock and a stagflationary Europe and China. Matt Gertken Chief Geopolitical Strategist mattg@bcaresearch.com Strategic Themes Open Tactical Positions (0-6 Months) Open Cyclical Recommendations (6-18 Months) Regional Geopolitical Risk Matrix "Batting Average": Geopolitical Strategy Trades () Section II: Special (EDIT this Header) Section III: Geopolitical Calendar
Executive Summary Global risk assets are oversold, and investor sentiment is downbeat. In this context, a technical equity rebound cannot be ruled out. However, we do not think it will be the beginning of a major cyclical rally. The Fed and the stock market remain on a collision course. An equity rally and easing financial conditions would make the Fed even more resolute to continue hiking interest rates. There are many similarities between dynamics that prevailed in US tech stocks and in previous bubbles. While it is not our baseline view, the odds of a protracted bear market are nontrivial. Resource prices and commodity plays have more downside. The History Of Financial Bubbles: Is This Time Different?
On A Bull Case, Bubbles And Commodity Prices
On A Bull Case, Bubbles And Commodity Prices
Bottom Line: The decline in commodity prices and the relentless US dollar rally will ensure that EM currencies, bonds and stocks continue to sell off even if the US equity market rebounds in the near term. Feature Among the most frequently discussed topics in recent client calls are the upside and downside risks to our baseline view. We elaborate on these risks in this report. To recap, our baseline view is as follows: EM and DM stocks have another 15% downside in USD terms, the US dollar will continue overshooting and commodity prices will fall. Global yields are topping out, and the US yield curve will soon invert. Hence, defensive positioning for absolute-return investors is still warranted, and global equity and fixed-income portfolios should continue to underweight EM. The rationale is that US and EU demand for goods ex-autos, and hence global trade, is about to contract while the Fed is straightjacketed by high and broad-based inflation. China’s economy will be struggling to recover. In EM ex-China, domestic demand will relapse. Chart 1Will The S&P 500's Technical Support Hold?
Will The S&P 500's Technical Support Hold?
Will The S&P 500's Technical Support Hold?
If one believes that the US equity bull market that began in 2009 is still alive (i.e. the March 2020 selloff is a short-lived red herring), odds are that the S&P 500 drawdown is over. The reasoning is that the S&P 500 is already down 23% from its 2021 peak, on par with the selloffs that occurred in 2011, 2015-16 and 2018 (Chart 1). However, if one believes that the structural bull market is over, the magnitude of the current equity selloff is likely to exceed the ones in 2011, 2015-16 and 2018. Hence, a bearish stance is still warranted. As we argue below, after a 12-year bull run, the excesses in the US equity market in general, and US tech stocks in particular, have become extreme. There are many signs of a bubble, or at least of a major top. Even though we risk overstaying in our negative view, our bias is that the global equity market rout is not yet over. A Bullish Scenario A (hypothetical) bullish case would look something like this: Weakening global and US growth and falling commodity prices bring down US inflation and Treasury yields. As US bond yields drop further, the S&P 500 rallies given their negative correlation of the past 18 months or so. As US inflation declines rapidly, the Fed makes a dovish pivot, reinforcing the risk asset rally and reversing the US dollar’s uptrend. Finally, Chinese stimulus produces a robust business cycle recovery in China that propels commodity prices higher and lifts the rest of EM out of the abyss. Chart 2Keep An Eye On Rising US Trimmed-Mean Inflation
Keep An Eye On Rising US Trimmed-Mean Inflation
Keep An Eye On Rising US Trimmed-Mean Inflation
In our opinion, this scenario has no more than a 25% chance of playing out. Even if there are apparent signs of a US/global slowdown, elevated US core inflation and accelerating wages and unit labor costs would keep the Fed from dialing down its hawkishness Critically, even though US core PCE inflation has rolled over and will likely decline further, its trimmed-mean PCE inflation is rising (Chart 2). The latter means that inflation is broadening even as some volatile items like food, energy and used-auto prices deflate. As we have written extensively, wages and inflation are lagging variables. Despite the ongoing slowdown in the US economy, it will take many months before the underlying core inflation rate drops below 3%. We maintain that the Fed and the stock market remain on a collision course. An equity rally and easing financial conditions would make the Fed even more resolute to hike interest rates. The basis is that even if core inflation falls in the coming months, it would still be well above the Fed’s target of 2%. Notably, the Fed has recently communicated that its commitment to bring down inflation to 2% is unconditional. Chart 3The Anatomy Of The US Equity Bear Market In 2000-2002
The Anatomy Of The US Equity Bear Market In 2000-2002
The Anatomy Of The US Equity Bear Market In 2000-2002
This policy stance represents a major departure from the past several decades when the Fed was very sensitive to any tightening in financial conditions and often eased preemptively. In short, with inflation still well above its target, the Fed will, for now, err on the side of hawkishness if financial conditions ease. Importantly, US corporate profits will likely contract even if US real GDP does not shrink. As US corporate top-line growth slows and unit labor costs accelerate, profit margins will shrink. For example, the 2001-2002 recession was very mild – consumer spending did not contract at all, and housing boomed (Chart 3, top two panels). Yet, the S&P 500 operating earnings dropped by 30%, and the S&P 500 fell by 50% (Chart 3, bottom two panels). In brief, a devastating bear market does not necessarily require a hard landing. Concerning China, the recovery will likely be U-shaped rather than V-shaped with risks skewed to the downside. Finally, contracting global trade and falling commodity prices will continue, which are negative for EM currencies and assets. Notably, industry data from Taiwan’s manufacturing PMI suggest that the slowdown in the Asian and global economies is widespread. Taiwan’s substantial trade linkages with mainland China signify that the slowdown is not limited to the US and the EU but includes China too. Taiwanese PMI export orders of both semiconductor and basic material producers have plunged to 40 and 30, respectively (Chart 4). Barring a quick turnaround, global semiconductor and basic materials stocks have more downside. Even as US Treasury yields drop, the dollar will continue firming versus EM currencies, including those of Emerging Asian countries. In such a scenario, EM stocks and bonds will weaken further (Chart 5). Chart 4A Broad-Based Contraction In Global Trade Is In The Cards
A Broad-Based Contraction In Global Trade Is In The Cards
A Broad-Based Contraction In Global Trade Is In The Cards
Chart 5A Free Fall In EM Ex-China Stocks And Currencies
A Free Fall In EM Ex-China Stocks And Currencies
A Free Fall In EM Ex-China Stocks And Currencies
Bottom Line: The S&P 500 is oversold, and investor sentiment is downbeat. In this context, a technical equity rebound can occur at any moment. However, we do not think it will be the beginning of a major cyclical rally. A Bearish Case: Are US TMT Stocks A Bubble? What is a more bearish scenario than our baseline case? The bursting of bubbles or the unwinding of excesses would entail a more protracted and devastating bear market than the 15% drop in global share prices we currently expect. We can identify two major excesses in the global economy and financial system: In US TMT (Technology, Media & Entertainment and Internet & Catalog Retail) stocks and private equity In Chinese real estate. We have written extensively about property market excesses in China. Below we discuss the recent sharp selloff in commodities, which is partially linked to Chinese property construction. We also present the case for major excesses in US stocks. Chart 6 illustrates the history of bubbles of the past several decades: The Nifty-fifty (involving the 50 US large-cap stocks) bubble occurred in the 1960s and burst in the 1970s (not shown in the chart). The commodity bubble took place in the 1970s and burst in the 1980s. Japanese equity and property prices rose exponentially in the 1980s and deflated in the 1990s. The Nasdaq bubble occurred in the 1990s and was shattered in the early 2000s. Commodities/EM/China were the leaders of the 2000s, and they were devastated in the 2010s. We use iron ore in this chart because its price surged the most in the 2000s. FAANGM stocks, the Nasdaq 100 index and private equity were by far the biggest beneficiaries of the 2010s. No one can be certain about bubbles in real time because there are always superior fundamentals or persuasive stories that justify exponential price appreciation. That said, there are a lot of similarities between dynamics prevailing in US tech and private equity and in previous bubbles: In the past decade, FAANGM stocks, the Nasdaq 100 index and private equity companies registered gains comparable to the bubbles of the previous 60 years. Furthermore, as Chart 6 illustrates, the equal-weighted FAANGM index in inflation-adjusted terms rose 30-fold, much more than the bubbles of the previous decades. The Nasdaq 100 index and share prices of Blackstone, the largest private equity company, have risen by nearly 10-fold in real (inflation-adjusted terms) between 2010 and the end of 2021. Chart 6The History Of Financial Bubbles: Is This Time Different?
On A Bull Case, Bubbles And Commodity Prices
On A Bull Case, Bubbles And Commodity Prices
The final phase of bubbles is often characterized by growing retail investor participation. This is exactly what happened with US tech/new economy stocks. Chart 7US TMT Stocks: Exponential Growth Rarely Ends Well
US TMT Stocks: Exponential Growth Rarely Ends Well
US TMT Stocks: Exponential Growth Rarely Ends Well
Toward the end of the decade, not only retail but also institutional capital stampedes into the winners of the decade. This played out with US large-cap tech stocks as well as in private equity and private debt spaces. Inflows into private equity and private debt have been enormous. As a result of these inflows into US large-cap stocks, the market cap share of US TMT stocks as a percentage of total US market cap has surpassed 40%, its peak in 2000 (Chart 7). Bubbles often thrive during periods of low interest rates and crash when the cost of capital rises. This is exactly what has been happening in global financial markets since early 2019. The parameters of the overall US equity market were also excessive prior to this bear market. As of last year, the S&P 500 stock prices in real (inflation-adjusted) terms became as elevated relative to their long-term time trend as they were in the late 1960s and the late 1990s − the peaks of previous secular bull markets (Chart 8, top panel). Chart 8The S&P 500 and Operating Profits: A Long-Term Perspective
The S&P 500 and Operating Profits: A Long-Term Perspective
The S&P 500 and Operating Profits: A Long-Term Perspective
Chart 9Equity Issuance Marks Market Tops
Equity Issuance Marks Market Tops
Equity Issuance Marks Market Tops
The S&P 500’s operating earnings in real terms have surpassed two standard deviations above its time trend (Chart 8, bottom panel). Some sort of mean reversion to its long-term trend is in the cards. US corporate profits have benefited from fiscal/monetary stimulus, low labor costs and pricing power. All of these are now working against profits. Finally, new share issuance in the US mushroomed in 2021, another sign of a major top (Chart 9). Bottom Line: We are not entirely convinced that US TMT stocks are a bubble waiting to burst. Yet, the odds of this happening are nontrivial. This time might not be different. A Word On Commodities The selloff in the commodity space has been broad-based. Odds are that it will continue for the following reasons: A global business cycle downtrend is always bearish for commodity prices. In fact, oil prices are often lagging and are typically the last shoe to drop during global slowdowns. US sales of gasoline have started to contract. Besides, Saudi Arabia will likely increase its oil output and shipments following President Biden’s visit to the Kingdom next week. Chart 10Investors Have Been Long Commodity Futures
Investors Have Been Long Commodity Futures
Investors Have Been Long Commodity Futures
As we have argued in recent months, China’s demand for commodities was contracting and, in our opinion, the rally in resource prices over the past 12 months was supported by investment demand for commodities, i.e., financial inflows into the commodity space. Many portfolios have bought commodities as an inflation hedge. When a hedge becomes a consensus trade and crowded, it stops being a hedge. Chart 10 demonstrates that net long positions in 17 commodities have been very elevated. The speed at which liquidation is taking place corroborates our thesis that it is investors not producers or consumers who have been caught being long commodities. China’s business cycle recovery will be U-shaped at best. Domestic orders point to weaker import volumes in the months ahead (Chart 11, top panel). Corporate loan demand has plunged suggesting that liquidity provisions by the PBoC might fail to produce a meaningful recovery in credit growth (Chart 11, bottom panel). Finally, technicals bode ill for commodity prices. As Chart 12 illustrates, copper prices and global material stocks have probably formed medium-term tops, and risks are skewed to the downside. Chart 11China: The Economy Is Struggling To Gain Traction
China: The Economy Is Struggling To Gain Traction
China: The Economy Is Struggling To Gain Traction
Chart 12A Major Top In Commodity Prices?
A Major Top In Commodity Prices?
A Major Top In Commodity Prices?
Bottom Line: Commodity prices and their plays have more downside. Investment Strategy The decline in commodity prices and the relentless US dollar rally will ensure that EM currencies, bonds and stocks continue to sell off even if the US equity market rebounds in the near term driven by lower Treasury yields. Global equity and fixed-income portfolios should continue underweighting EM. We also continue to short the following currencies versus the USD: ZAR, COP, PEN, PLN, PHP and IDR; as well as HUF vs. CZK, and KRW vs. JPY. Arthur Budaghyan Chief Emerging Markets Strategist arthurb@bcaresearch.com Strategic Themes (18 Months And Beyond) Equities Cyclical Recommendations (6-18 Months) Cyclical Recommendations (6-18 Months)
Executive Summary Caught In Risk-Off Selling
Copper Testing Support
Copper Testing Support
Weak Chinese and European economies are suppressing copper demand and helping to temper prices in a market that remains fundamentally tight. Weaker US GDP growth could put the three largest economies in the world in or close to recession in 2H22/1H23, which would contribute to demand-side weakness in copper markets. The odds manufacturing and base-metals refining will be curtailed in Europe are rising. Although a strike in Norway has been averted by government intervention, maintenance on Russia’s Nord Stream 1 pipeline scheduled to begin next week likely will serve as a pretext for longer and deeper natgas supply cuts to the EU. Bottom Line: Despite fundamental tightness in global copper markets, prices are being restrained by fears weaker Chinese and European economic performance will lead to a global recession. Early reads of US GDP pointing to negative growth in 2Q22 stoke these fears. Heightened economic policy uncertainty globally exacerbates them. We remain fundamentally bullish copper and will re-establish our long SPDR S&P Metals & Mining ETF (XME) – down ~ 40% from its highs in April – at tonight’s close. In addition, we went long the XOP oil and gas ETF at Tuesday’s close, after prompt Brent breached the buy-trigger we set last week of $105/bbl during this week’s crude-oil sell-off. Feature Lower GDP growth expectations in China and the EU – along with a wobbly US economy being flagged by an Atlanta Fed GDPNow forecast pointing to negative growth in 2Q22 – are stoking fears of a global manufacturing and industrial recession. This prompted a rout in industrial commodities – base metals and oil – this week, which still has markets on edge. This slow-down in the world’s three largest economies – accounting for almost 50% of global GDP expressed in purchasing-power terms – is the only thing keeping the level of global copper demand close to supply at present (Chart 1).1 At least for the time being, this is keeping the threat of sharply higher copper prices, which would be more in line with the low levels of supplies and inventories globally, at bay (Chart 2). As of the week ended May 27th, global copper stocks stood at just above 562k tons, which is ~ 31% lower y/y. Chart 1World’s Biggest Economies Slowing
Copper Prices Decouple From Fundamentals
Copper Prices Decouple From Fundamentals
Chart 2Copper Prices Disconnect From Fundamentals
Copper Prices Disconnect From Fundamentals
Copper Prices Disconnect From Fundamentals
Uncertainty Weakens Copper Prices Energy and metals markets remain extremely tight on a fundamental supply-demand basis.2 The sharp sell-off this week in oil and metals prices is, in our view, evidence industrial-commodity prices have decoupled from fundamentals. This makes traders – hedgers and speculators – extremely risk-averse, which reduces liquidity and increases volatility. On the back of these concerns, markets exhibit the sort of volatility associated with economic collapse, despite still-strong underlying fundamentals. Chart 3Rising Global Policy Uncertainty
Copper Prices Decouple From Fundamentals
Copper Prices Decouple From Fundamentals
Volatility is on the rise due to increasing economic uncertainty in these markets. This makes it extremely difficult to assign probabilities to different price outcomes (i.e., true uncertainty). The BBD Global Economic Policy Uncertainty is approaching levels seen during the early pandemic (Chart 3). We put this rising uncertainty down to poor policy and communication from central banks and governments; a pig’s breakfast of energy policy globally that increasingly adds nothing but confusion to markets; and a muddled public-health policy in China, which produces random shut-downs in global supply chains as covid infections randomly crop up in important port cities. Lastly, the East and West are moving toward a new Cold War, which already is having profound effects on all markets, trade flows and capital availability in the short- and medium-term. This keeps markets on edge and forces them to parse every geopolitical development that hits the tape.3 Re-forging supply chains, re-building basic industrial infrastructure as the West moves away from outsourcing to China and other EM states will be costly and volatile, especially as embargoes and sanctions increase between these blocs. This political and economic evolution will require increased investment in base metals production and exploration, along with similar commitments to oil and gas. Low and volatile prices will not support this, as they disincentivize investment, and set markets up for continued shortage and scarcity going forward. In the metals markets, years of underinvestment by major mining companies will keep copper supplies and inventories tight going forward (Chart 4). This will hinder and delay the global renewable-energy transition, which cannot be realized without higher base-metals supplies. Chart 4Structural Underinvestment In Mining Fundamentally Bullish Copper
Copper Prices Decouple From Fundamentals
Copper Prices Decouple From Fundamentals
Recession Fears Haunt Metals Globally … The proximate causes of the persistent weakening of copper prices is the demand destruction arising from the lockdown in China, and an increasing concern over the economic prospects of the EU as it prepares for a possible shut-off of Russian natgas exports. Should Russian supplies be cut off, the EU will be pushed into recession as natural-gas rationing – and the attendant prioritization of human needs going into winter – will constrict economic activity, particularly in manufacturing. This leaves two of the three largest economies in the world either in recession or not growing at all. Added to this is the fear of a wobbly US economy, which has been slowed by higher energy prices and the Fed’s hawkish tightening of monetary policy. The Atlanta Fed’s GDPNow forecast for 2Q22 estimates a 2.1% contraction in US GDP. This would be the second consecutive quarter of negative growth and would meet a widely held rule-of-thumb indicator or recession.4 In our modelling, we estimate the income elasticity of copper demand in DM economies like the EU and US (1.39) and EM-ex-China (0.87) states is higher than that of China (0.37). This means that a 1% contraction in p.a. Chinese real GDP would translate to a 0.37% p.a. fall in copper demand, all else equal. A contraction of real incomes – i.e., real GDP – in the EU and EM-ex-China will cause a larger relative adjustment in copper demand than in China, even though the level of copper demand in China is far greater in absolute terms (Chart 5). A recession in the EU will reduce import demand for China’s manufactured output in these markets (Chart 6). As China’s trade volumes fall, Chinese manufacturing PMIs will contract. Similarly, exports to China from the EU will weaken as manufacturing weakens and real GDP moves lower. We believe this will put more pressure on the Chinese government to provide fiscal and monetary stimulus to counter such a downdraft. Chart 5Copper Demand Sensitive to Real GDP (Income)
Copper Demand Sensitive to Real GDP (Income)
Copper Demand Sensitive to Real GDP (Income)
Chart 6Trade Channel Effects Follow GDP Weakness
Trade Channel Effects Follow GDP Weakness
Trade Channel Effects Follow GDP Weakness
… But China Worries Dominate The Chinese economy is showing signs of further slowing.5 Weakness in credit levels, infrastructure investment, manufacturing, the property sector, and exports all indicate the covid-policy lockdowns, high commodity prices, and parsimonious credit and fiscal policies have produced a dramatic slowing in economic activity. In our modelling, we find evidence that each of these components exhibits a long-run inverse relationship with Chinese copper inventories, which in turn exhibits a long-run inverse relationship with COMEX copper prices. Roughly 10 days after the initial Shanghai lockdown, copper prices went into contango (Chart 7). This occurred despite continuous declines in Chinese copper inventories during the lockdown months (Chart 8). Such anomalous behavior – i.e., as inventories fall markets become more backwardated – makes it difficult to connect prices and supply-demand-inventory fundamentals. Chart 7Copper In Contango For Most Of China’s Lockdown
Copper In Contango For Most Of Chinas Lockdown
Copper In Contango For Most Of Chinas Lockdown
Chart 8Chinese Copper Inventories Continue To Draw In Lockdown
Chinese Copper Inventories Continue To Draw In Lockdown
Chinese Copper Inventories Continue To Draw In Lockdown
BCA’s China Investment Strategy expects a muted 2H22 recovery for the Chinese economy. Rolling lockdowns due to China’s COVID policy will reduce the potency of fiscal and monetary stimulus. The stop-start nature of economic activity will stymie growth in disposable income and job creation, which in turn will translate to weaker aggregate demand. The knock-on effect of weaker business activity due to the lockdown earlier this year has been a higher propensity to save by households (Chart 9). Household surveys conducted by the PBoC show that, since 2017, household savings have been increasing, suggesting a precautionary sentiment (Chart 10). Chart 9Chinese Economic Slowdown Reduced Credit Demand
Chinese Economic Slowdown Reduced Credit Demand
Chinese Economic Slowdown Reduced Credit Demand
Chart 10Rising Precautionary Savings...
Rising Precautionary Savings...
Rising Precautionary Savings...
Chart 11...Will Impact Domestic Property Market
...Will Impact Domestic Property Market
...Will Impact Domestic Property Market
We do not expect the property market to recover in a manner similar to what occurred following China’s re-opening after the first wave of the COVID-19 pandemic. Depressed household purchasing power will keep housing demand subdued, while the “three red lines” policy, which limits the amount property developers can borrow, will keep supply low (Chart 11).6 Housing accounts for ~ 30% of copper consumption in China, which means weak property markets will remain a drag on copper demand. Investment Implications Continued weakness in China’s economy and a potentially deep recession in the EU will continue to restrain demand for copper globally. In addition, with the US economy looking wobbly, the third global pillar of economic strength also will be weakening going into 2H22. These fundamental demand-side effects will lower pressure on tight copper inventories and keep prices subdued, in our view. This does not, however, signal an all-clear for copper supply or inventory tightness. Weaker demand is the only thing keeping prices from rising sharply, given the tight supply and inventory position of global copper markets. On the supply side, governance issues in copper-rich Latin American states, which are in the process of revising their social contracts with copper producers and consumers, will increase mining costs for companies, disincentivizing long-term and large-scale investments in new mines.7 These costs ultimately will be borne by consumers as supply shortages mount and the need to increase capex grows. Ultimately, this will feed into longer-term inflation and inflation expectations. Chart 12Caught In Risk-Off Selling
Copper Testing Support
Copper Testing Support
We remain long-term bullish copper, as fundamentals remain tight and will get tighter. That said, over the short term, aggregate-demand weakness in the three major economic pillars in the world makes us leery of getting long copper futures, particularly as prompt COMEX prices test support (Chart 12). Persistently weak copper prices will disincentivize the needed investment in new supply the world will need to effect a transition to renewable energy in coming decades. For this reason, we are comfortable re-establishing our long XME metals and mining ETF at tonight’s close, as copper prices are down 40% from their April highs. Robert P. Ryan Chief Commodity & Energy Strategist rryan@bcaresearch.com Ashwin Shyam Research Analyst Commodity & Energy Strategy ashwin.shyam@bcaresearch.com Paula Struk Research Associate Commodity & Energy Strategy paula.struk@bcaresearch.com Commodity Round-Up Energy: Bullish. A strike by Norwegian energy-sector workers that would have hit the natural gas market in Europe particularly hard was averted earlier this week.8 This still leaves the EU and UK (Europe) at risk of additional losses of Russian natgas exports beginning next week when Nord Stream 1 (NS1) maintenance is due to start. These threats have pushed Dutch Title Transfer Facility (TTF) natural gas prices up close to 93% since 1 June, and close to 400% y/y as of Tuesday. For the first five months of this year, Europe’s been importing just under 15 Bcf/d of LNG, with ~ 8.5 Bcf/d of those volumes coming from the US, based on EIA data. The EIA expects US LNG exports to average ~ 11.9 Bcf/d this year and 12 Bcf/d in 2023. Europe accounted for just under 75% of US exports in January – April of this year, and we expect that to continue going forward. The IEA expects Russia to supply 25% of EU demand this year, the lowest in 20 years. Last year, Russian imports covered ~ 40% (~ 7 TCF) of EU demand. Base Metals: Zinc stocks are depleted but prices are dropping on recession fears (Chart 13). Smelting operations were hit last year following the power-supply crunches in China and Europe. While China has recovered its energy security, Europe, which accounts for ~15% of global refined zinc supply, has not. Reduced natgas supply from Russia will make the smelting shortage in Europe even more acute, especially if power and fuel rationing occur. In April, China was a net exporter of zinc for the first time since 2014, as low demand in the state and low European zinc supply incentivized Chinese smelters to ship metal to the West despite high outbound tariffs. Precious Metals: Markets switched from inflation to growth fears, as central banks, notably the Fed began hiking interest rates aggressively to curb inflation. Investors have been flocking to the USD, which hit a 20-year high on recession fears this week (Chart 14). This has happened at the expense of the yellow metal, which, since breaking through the USD 1800/oz mark last week, has continued to drop, hitting an 8-month low as of yesterday's close. Chart 13Global Copper Inventories Remain Tight
Global Copper Inventories Remain Tight
Global Copper Inventories Remain Tight
Chart 14
Copper Prices Decouple From Fundamentals
Copper Prices Decouple From Fundamentals
Footnotes 1 Please see China, US and EU are the largest economies in the world, which was published by Eurostat 19 May 2020. 2 For additional discussion of oil-market fundamentals, please see Recession Unlikely To Batter Oil Prices, which covers our expectation for global oil balances and prices. It was published 16 June 2022. 3 Please see Hypo-Globalization (A GeoRisk Update) published by BCA Research’s Geopolitical Strategy 30 July 2021. See also Commodities' Watershed Moment, which we published 22 March 2022. 4 Please see GDPNow, published by the Federal Reserve Bank of Atlanta 1 July 2022. 5 Please see Third Quarter Geopolitical Outlook: Thunder And Lightning, published by BCA’s Geopolitical Strategy 24 June 2022. This report notes, “China’s political crackdown, struggle with Covid-19, waning exports, and deflating property market have led to an abrupt slowdown this year. The government is responding by easing monetary, fiscal, and regulatory policy, though so far with limited effect … . Economic policy will not be decisive in the third quarter unless a crash forces the administration to stimulate aggressively.” 6 In August 2020, the Ministry of Housing and Urban-Rural Development and the People’s Bank of China proposed to implement a policy which kept a ceiling on companies’ asset to liability ratio at 70%, net debt to equity ratio at 100%, and cash to short-term borrowings ratio at 1. Developers whose liabilities are within these requirements may increase their liabilities by less than 15%. These were known as the “three red lines.” Per that policy, if one or more of these ceilings are surpassed, maximum liabilities growth is capped at a lower percentage. 7 Please see Add Local Politics To Copper Supply Risks, which we published 25 November 2021. It is available at ces.bcaresearch.com. See also Chile sticks to plan for new mining profit tax up to 32% linked to copper price, published by reuters.com via mining.com 1 July 2022. 8 Please see Norway’s government halts oil and gas strike published by ft.com 5 July 2022. Investment Views and Themes Strategic Recommendations Tactical Trades Trades Closed In 2022
Executive Summary Our recommended model bond portfolio outperformed its custom benchmark index by +24bps in Q2/2022, improving the year-to-date outperformance to a solid +72bps. The Q2 outperformance came entirely from the credit side of the portfolio (+35bps), led by underweights to US investment grade corporates (+28bps) and EM hard currency debt (+24bps). The rates side of the portfolio was down slightly (-11bps), with gains from underweights in US and UK inflation-linked bonds (a combined +24bps) helping offset the hit from overweights to German and French government bonds (a combined -30bps). Looking ahead, we continue to see more defensive positioning in growth-sensitive credit sectors like US investment grade corporate bonds and EM hard currency debt, rather than duration management, as providing the better opportunity to generate alpha in bond portfolios over the latter half of 2022. GFIS Model Bond Portfolio Recommended Positioning For The Next Six Months
GFIS Model Bond Portfolio Q2/2022 Review & Outlook: Winning By Playing Defense
GFIS Model Bond Portfolio Q2/2022 Review & Outlook: Winning By Playing Defense
Bottom Line: In our model bond portfolio, we are maintaining an overall neutral duration stance and a moderate underweight of spread product versus developed market sovereign bonds. We are, however, reducing the recommended tilts in inflation-linked bonds by upgrading US TIPS to neutral and downgrading Canadian linkers to neutral. Feature Dear Client, We are about to take a mid-summer publishing break, as this humble bond strategist moves his family into a new home in a new city. Next week, you will be receiving a report written by BCA Research’s Chief US Bond Strategist, Ryan Swift. The following week, there will be no Global Fixed Income Strategy report published. Our next report will be published on July 26, 2022. Regards, Rob Robis Bond investors are running out of places to hide to avoid losses in 2022. The total return on the Bloomberg Global Aggregate index (hedged into USD) in the second quarter of this year was -4%, nearly matching the -6% loss seen in Q1. No sector, from government bonds to corporate debt to emerging market credit, could avoid the damage caused by hawkish central bankers belated responding to the worst bout of global inflation since the 1970s. Related Report Global Fixed Income StrategyGFIS Model Bond Portfolio Q1/2022 Review & Outlook: Trading The Consolidation Phase Global inflation rates will soon peak, led by slowing growth of goods prices and commodity prices. However, inflation will remain well above central bank targets across the bulk of the developed world, supported by more domestic sources like services prices, housing costs and wages. This will limit the ability for important central banks like the Fed and ECB to quickly pivot in a more dovish direction to support weakening growth – and bail out foundering bond markets. With that backdrop in mind, we present our quarterly review of the BCA Research Global Fixed Income Strategy (GFIS) model bond portfolio for the second quarter of 2022. We also present our recommended positioning for the portfolio for the next six months, as well as portfolio return expectations for our base case and alternative investment scenarios. As a reminder to existing readers (and to new clients), the model portfolio is a part of our service that complements the usual macro analysis of global fixed income markets. The portfolio is how we communicate our opinion on the relative attractiveness between government bond and spread product sectors. We do this by applying actual percentage weightings to each of our recommendations within a fully invested hypothetical bond portfolio. Q2/2022 Model Bond Portfolio Performance: All About Credit Chart 1Q2/2022 Performance: Gains From Defensive Credit Positioning
Q2/2022 Performance: Gains From Defensive Credit Positioning
Q2/2022 Performance: Gains From Defensive Credit Positioning
The total return for the GFIS model portfolio (hedged into US dollars) in the second quarter was -4.3%, outperforming the custom benchmark index by +24bps (Chart 1).1 In terms of the specific breakdown between the government bond and spread product allocations in our model portfolio, the former generated -11bps of underperformance versus our custom benchmark index while the latter outperformed by +35bps. In our previous quarterly portfolio performance review in April, we noted that the greater opportunities to generate outperformance for fixed income investors would come from more defensive allocations to spread product, rather than big directional moves in government bond yields. That forecast largely panned out, as global credit markets moved to price in the growing risk of a deep economic downturn. Declining nominal government bond yields provided some modest relief at the end of June, with markets modestly pricing out some of the rate hikes discounted over the next year amid deepening global recession fears. While we maintained a neutral stance on overall portfolio duration during the quarter, we did benefit from the fact that the decline in global bond yields in late June was concentrated more in lower inflation expectations than falling real yields. Thus, our underweight positioning in inflation-linked bonds, focused on the US and UK, helped add a combined +25bps of outperformance versus the benchmark (Table 1). Table 1GFIS Model Bond Portfolio Q2/2022 Overall Return Attribution
GFIS Model Bond Portfolio Q2/2022 Review & Outlook: Winning By Playing Defense
GFIS Model Bond Portfolio Q2/2022 Review & Outlook: Winning By Playing Defense
The bar charts showing the total and relative returns for each individual government bond market and spread product sector in our model portfolio are presented in Charts 2 & 3. Chart 2GFIS Model Bond Portfolio Q2/2022 Government Bond Performance Attribution
GFIS Model Bond Portfolio Q2/2022 Review & Outlook: Winning By Playing Defense
GFIS Model Bond Portfolio Q2/2022 Review & Outlook: Winning By Playing Defense
Chart 3GFIS Model Bond Portfolio Q2/2022 Spread Product Performance Attribution By Sector
GFIS Model Bond Portfolio Q2/2022 Review & Outlook: Winning By Playing Defense
GFIS Model Bond Portfolio Q2/2022 Review & Outlook: Winning By Playing Defense
Biggest Outperformers: Underweight US investment grade Industrials (+19bps) Underweight UK index-linked Gilts (+15bps) Underweight US TIPS (+9bps) Underweight US investment grade Financials (+7bps) Underweight US MBS (+6bps) Underweight US Treasuries with maturities beyond ten years (+6bps) Biggest Underperformers: Overweight euro area investment grade corporates (-19bps) Overweight German government bonds with maturities beyond ten years (-14bps) Overweight French government bonds with maturities beyond ten years (-8bps) Overweight UK Gilts with maturities beyond ten years (-6bps) Overweight US CMBS (-4bps) Chart 4 presents the ranked benchmark index returns of the individual countries and spread product sectors in the GFIS model bond portfolio for Q2/2022. Returns are hedged into US dollars (we do not take active currency risk in this portfolio) and adjusted to reflect duration differences between each country/sector and the overall custom benchmark index for the model portfolio. We have also color coded the bars in each chart to reflect our recommended investment stance for each market during Q2 (red for underweight, dark green for overweight, gray for neutral). Chart 4Ranking The Winners & Losers From The GFIS Model Bond Portfolio Universe In Q2/2022
GFIS Model Bond Portfolio Q2/2022 Review & Outlook: Winning By Playing Defense
GFIS Model Bond Portfolio Q2/2022 Review & Outlook: Winning By Playing Defense
Ideally, we would look to see more green bars on the left side of the chart where market returns are highest, and more red bars on the right side of the chart were returns are lowest. That pattern largely held true in Q2/2022, especially at the tail ends of the chart. During a quarter where all the major asset classes in our portfolio lost money on a hedged and duration-matched basis, we outperformed by selectively underweighting the worst performers within the credit side of the benchmark portfolio universe. Notably, we were underweight EM USD-denominated Sovereigns (-1099bps), EM USD-denominated corporates (-816bps) and US investment grade corporates (-686bps) on the extreme right side of the chart. Some of our key overweight positions did relatively well, led by overweights in US CMBS (-148bps), Australian government bonds (-288bps) and euro area investment grade corporates (-378bps), all of which were on the left side of Chart 4. One of our key recommendations throughout the first half of 2022 - overweighting German government bonds (-517bps) and French government bonds (-657bps) versus underweighting US Treasuries (-283bps) - performed poorly in Q2. This was due to investors rapidly pricing in a far more aggressive series of ECB rate hikes than we expected, resulting in some convergence of US-European bond yield differentials. Importantly, core European bond yields have pulled back substantially over the last month, and by much more than US yields have declined. Most notably, the 2-year German yield, which began Q2 at minus-7bps and hit a peak of 1.2% on June 14, has now fallen all the way back to 0.4% as this report went to press. The 2-year US-Germany yield differential has already widened by 35bps in the first week of July, suggesting that our overweight core Europe/underweight US allocation is already contributing positively to the model bond portfolio returns for Q3. Bottom Line: Our model bond portfolio outperformed its benchmark index in the second quarter of the year by +24bps – a positive result coming largely from underweight positions in US corporate bonds, EM spread product and inflation-linked bonds in the US and UK. Future Drivers Of Model Bond Portfolio Returns Just as in Q2/2022, the performance of the model bond portfolio in Q3/2022 will be driven more by relative allocations between countries and spread product sectors, rather than big directional moves in bond yields or credit spreads. Overall Duration Exposure Chart 5A More Stable Backdrop For Global Bond Yields
A More Stable Backdrop For Global Bond Yields
A More Stable Backdrop For Global Bond Yields
In terms of portfolio duration, we still see a stronger case for global bond yields to be more rangebound than trending, especially in the US. There has already been a major downward adjustment to global bond yields via lower inflation expectations and reduced rate hike expectations. A GDP-weighted average of major developed market 10-year inflation breakevens has already fallen from an April 2022 peak of 281bps to 216bps (Chart 5). That aggregate breakeven is now back to the levels that began 2022, before the Russian invasion of Ukraine that triggered a surge in global energy prices. We anticipate that additional declines in global inflation expectations – and the associated reductions in central bank rate hike expectations – will be harder to achieve over the latter half of 2022. “Stickier” inflation from services, housing costs and wages will remain strong enough to keep overall inflation rates above central bank targets, even as decelerating goods and commodity price inflation act to slow headline inflation rates. Our Global Duration Indicator, which is comprised of growth indicators like the ZEW expectations index for the US and Europe as well as our own global leading economic indicator, has fallen substantially and is signaling a decline in global bond yield momentum once realized inflation rates peak (Chart 6). Chart 6Our Duration Indicator Calling For Slowing Global Yield Momentum
Our Duration Indicator Calling For Slowing Global Yield Momentum
Our Duration Indicator Calling For Slowing Global Yield Momentum
Chart 7Overall Portfolio Duration: Stay Neutral
Overall Portfolio Duration: Stay Neutral
Overall Portfolio Duration: Stay Neutral
We see that as signaling more of a sideways action in bond yields over the next six months, rather than a big downward move, especially in the US. Thus, we are keeping the duration of the model bond portfolio close to that of the benchmark index (Chart 7). Government Bond Country Allocation We are sticking with our view that, for countries with active central banks (i.e. everyone but Japan), favoring markets where interest rate expectations are above plausible estimates of neutral policy rates should lead to outperformance from country allocation. In Chart 8, we show 10-year bond yields and 2-years-forward 1-month Overnight Index Swap (OIS) rates for the US, euro area, UK, Canada and Australia. The shaded regions in the chart represent estimates of the range of neutral policy rates. In the case of the US, rate expectations and Treasury yields are now below the upper level of the range of neutral fed funds rates estimates, between 2-3%, taken from the latest set of FOMC economic projections. Hence, we are sticking with an underweight stance on US Treasuries with yields offering less protection against the Fed following through on its current guidance and lifting the funds rate into restrictive territory above 3%. In the other countries, rate expectations are above the range of neutral rate estimates, which suggests that bond yields have a bit more protection against hawkish central bank actions. That leads us to stay overweight core Europe, the UK and Australia in the government bond portion of the model bond portfolio. We are only keeping Canada at neutral, however, as we suspect that the Bank of Canada is more willing than other central banks to follow the Fed’s lead on taking rates to a restrictive level to help bring down elevated Canadian inflation. For other countries, we are staying neutral on Italian government bond exposure, for now, and underweight Japan (Chart 9). Chart 8Favor Countries Where Markets Expect Above-Neutral Rates
Favor Countries Where Markets Expect Above-Neutral Rates
Favor Countries Where Markets Expect Above-Neutral Rates
Chart 9Underweight JGBs, Stay Neutral Italy (For Now)
Underweight JGBs, Stay Neutral Italy (For Now)
Underweight JGBs, Stay Neutral Italy (For Now)
For Italy, we await news from the July 21 ECB meeting on the details of a proposal to help support Italian bond markets in the event of additional yield increases or spread widening versus Germany. It is clear from the history of the past decade that Italian bond returns suffer when the ECB is either hiking rates or slowing the growth of its balance sheet (top panel). In other words, it is difficult to recommend overweighting Italian bonds without the support of easy ECB monetary policy. Chart 10Our Inflation-Linked Bond Country Allocations
Our Inflation-Linked Bond Country Allocations
Our Inflation-Linked Bond Country Allocations
For Japan, our recommendation is strictly related to our view on the move in overall global bond yields. The Bank of Japan is bucking the worldwide trend to tighten monetary policy because core Japanese inflation remains weak. This makes Japanese government bonds (JGBs) a good place for bond investors to “hide out” in when global bond yields are rising. Given our view that global bond yield momentum will slow – in line with the signal from our Global Duration Indicator – we do not see a strong cyclical case for overweighting low-yielding JGBs. On inflation-linked bonds, we are maintaining a cautious overall stance, with commodity prices decelerating, realized inflation momentum set to soon peak and central banks signaling more tightening ahead (Chart 10). This week, we are closing out our lone overweight recommendation on inflation-linked bonds in Canada, where we downgrading to neutral (3 out of 5, see the model bond portfolio table on page 24).2 At the same time, we are neutralizing our underweight stance on US TIPS, moving the allocation to neutral. We still see shorter-term TIPS breakevens as having downside from here, but longer-maturity breakevens have already made enough of a downward adjustment, in our view. Global Spread Product Turning to credit markets, we are maintaining our moderately cautious view on the overall allocation to credit versus government bonds. Slowing global growth momentum and tightening global monetary policy is not an environment where credit spreads can narrow, especially for growth-sensitive credit like corporate bonds and high-yield (Chart 11). Having said that – the spread widening seen in US and European corporate bond markets has introduced a better valuation cushion into spreads. Our preferred measure of spread product valuation – the historical percentile ranking of the 12-month breakeven spread – shows that investment grade spreads in the euro area are now in the top quartile (85%) of its history on a risk-adjusted basis (Chart 12). US investment grade spreads are now up into the second quartile (64%), which is a big improvement from the start of 2022 but not as much as seen in Europe. Chart 11Global Monetary Backdrop Turning More Negative For Credit
Global Monetary Backdrop Turning More Negative For Credit
Global Monetary Backdrop Turning More Negative For Credit
Chart 12Corporate Spread Valuations Have Improved In The US & Europe
Corporate Spread Valuations Have Improved In The US & Europe
Corporate Spread Valuations Have Improved In The US & Europe
European credit spreads likely need to be wide as a risk premium against the numerous risks the region is facing right now – slowing growth, an increasingly hawkish ECB, soaring energy prices and the lingering uncertainties stemming from the Ukraine war. However, a lot of bad news is now discounted in European spreads and, as a result, we are maintaining our overweight stance on European investment grade corporates, especially versus US investment grade where we remain underweight. High-yield spreads on both sides of the Atlantic look more attractive on a 12-month breakeven spread basis, but also on a default-adjusted spread basis (Chart 13). Assuming a moderate increase in the high-yield default rates in the US and Europe - consistent with a sharp slowing of economic growth but no deep recession - the current level of high-yield spreads net of expected default losses over the next year is above long-run averages. It is too soon to move to an overweight stance on high-yield, with the Fed and ECB set to tighten more amid ongoing growth uncertainty, but given the improved valuation cushion we see a neutral allocation to junk in both the US and Europe as appropriate in our model portfolio. Chart 13Junk Spreads Offer Value If Recession Can Be Avoided
Junk Spreads Offer Value If Recession Can Be Avoided
Junk Spreads Offer Value If Recession Can Be Avoided
Finally, we remain comfortably underweight emerging market USD-denominated sovereign and corporate debt. The backdrop is poor for emerging market bond returns, given slowing global growth, softening commodity prices, a tightening Fed and a strengthening US dollar (Chart 14). Chart 14Staying Cautious On EM Debt Exposure
Staying Cautious On EM Debt Exposure
Staying Cautious On EM Debt Exposure
Summing It All Up The full list of our recommended portfolio allocations can be seen in Table 2. The portfolio enters the second half of 2022 with the following high-level characteristics: Table 2GFIS Model Bond Portfolio Recommended Positioning For The Next Six Months
GFIS Model Bond Portfolio Q2/2022 Review & Outlook: Winning By Playing Defense
GFIS Model Bond Portfolio Q2/2022 Review & Outlook: Winning By Playing Defense
Chart 15Overall Portfolio Allocation: Underweight Spread Product Vs Governments
GFIS Model Bond Portfolio Q2/2022 Review & Outlook: Winning By Playing Defense
GFIS Model Bond Portfolio Q2/2022 Review & Outlook: Winning By Playing Defense
the overall duration exposure remains at-benchmark (i.e. neutral) the portfolio has an underweight allocation to overall spread products versus government bonds, equal to four percentage points of the portfolio (Chart 15) the tracking error of the portfolio, or its expected volatility in excess of that of the benchmark, is 77bps – below our self-imposed 100bps tracking error limit (Chart 16) the portfolio now has a yield below that of the custom benchmark index, equal to -31bps on a currency-unhedged basis but a more modest “carry gap” of -10bps on a USD-hedged basis given the gains from hedging into USD (Chart 17). Chart 16Overall Portfolio Risk: Moderate
Overall Portfolio Risk: Moderate
Overall Portfolio Risk: Moderate
Chart 17Overall Portfolio Yield: Below-Benchmark
Overall Portfolio Yield: Below-Benchmark
Overall Portfolio Yield: Below-Benchmark
Bottom Line: Looking ahead, our model bond portfolio performance will continue to be driven by the same factors in Q3/2022 as in the previous quarter: the relative performance of US bonds versus European equivalents for both government debt and corporate bonds, and the path for emerging market credit spreads. Portfolio Scenario Analysis For The Next Six Months After making the modest changes to our inflation-linked bond allocations in the US and Canada, which can be seen in the tables on pages 23-24, we now turn to our regularly quarterly scenario analysis to determine the return expectations for the portfolio for the next six months. On the credit side of the portfolio, we use risk-factor-based regression models to forecast future yield changes for global spread product sectors as a function of four major factors - the VIX, oil prices, the US dollar and the fed funds rate (Table 3A). For the government bond side of the portfolio, we avoid using regression models and instead use a yield-beta driven framework, taking forecasts for changes in US Treasury yields and translating those in changes in non-US bond yields by applying a historical yield beta (Table 3B). Table 3AFactor Regressions Used To Estimate Spread Product Yield Changes
GFIS Model Bond Portfolio Q2/2022 Review & Outlook: Winning By Playing Defense
GFIS Model Bond Portfolio Q2/2022 Review & Outlook: Winning By Playing Defense
Table 3BEstimated Government Bond Yield Betas To US Treasuries
GFIS Model Bond Portfolio Q2/2022 Review & Outlook: Winning By Playing Defense
GFIS Model Bond Portfolio Q2/2022 Review & Outlook: Winning By Playing Defense
For our scenario analysis over the next six months, we use a base case scenario plus two alternate “tail risk” scenarios. In the current environment, our scenarios center around the pace of global growth. Base Case (Slow Global Growth) Global growth momentum slows substantially, with firms cutting back on hiring and investing activity due to slowing corporate profit growth. An outright recession is avoided because softening energy prices help ease the drag on real spending power for consumers. China introduces more monetary and fiscal stimulus measures to boost growth. Global inflation peaks and eases on the back of slowing growth of goods prices and commodity prices, but the floor on inflation in the US and other developed markets is higher than central bank inflation targets due to sticky domestic price pressures. The Fed continues to hike at every policy meeting in H2/2022. There is a very mild bear flattening of the US Treasury curve, but with longer-term yields remain broadly unchanged over the full six month scenario period with the Fed not hiking by more than currently discounted. The Brent oil price retreats by -10%, the US dollar modestly appreciates by 2%, the VIX stays close to current levels at 28 and the fed funds rate reaches 3.25% by year-end. Resilient Growth Scenario Consumer spending surprises to the upside in the US and even Europe, as softer momentum of energy prices eases the relentless downward pressure on real incomes. Labor demand remains sold across the developed world, particularly with firms reluctant to do mass layoffs because of a perceived scarcity of quality labor. China enacts more policy stimulus with growth likely to fall below 2022 government targets. The Fed is forced to be more aggressive on rate hikes, given resilient US growth and inflation staying well above the Fed’s 2% target. The US Treasury curve bear-flattens into outright inversion, but with Treasury yields rising across the curve. The Brent oil price rises +20%, the VIX index climbs to 30, the US dollar appreciates by +3% thanks to a more aggressive Fed that lifts the funds rate to 3.75% by year-end. Recession Scenario A toxic combination of contracting corporate profits and negative real income growth drags the major developed economies into outright recession. Global inflation rates slow rapidly from current elevated levels, fueled by a rapid decline in commodity prices, but remain above central bank targets making it hard for the Fed and other major central banks to pivot dovishly to support growth. Chinese policymakers belatedly act to ease monetary and fiscal policy, but not by enough to offset the slow response from developed market policymakers. The Treasury curve moderately bull-steepens, although the absolute decline in nominal Treasury yields is relatively modest as the Fed will not pivot quickly to signaling policy easing with inflation still likely to remain above 2%. The Brent oil price falls -20%, the VIX index soars to 35, the US dollar depreciates by -3% (as lower US rates win out over slowing global growth) and the Fed pushes the funds rate to 2.75% before pausing after September. The excess return scenarios for the model bond portfolio, using the above inputs in our simple quantitative return forecast framework, are shown in Table 4A. The US Treasury yield assumptions are shown in Table 4B. For the more visually inclined, we present charts showing the model inputs and Treasury yield projections in Chart 18 and Chart 19, respectively. Table 4AGFIS Model Bond Portfolio Scenario Analysis For The Next Six Months
GFIS Model Bond Portfolio Q2/2022 Review & Outlook: Winning By Playing Defense
GFIS Model Bond Portfolio Q2/2022 Review & Outlook: Winning By Playing Defense
Table 4BUS Treasury Yield Assumptions For The 6-Month Forward Scenario Analysis
GFIS Model Bond Portfolio Q2/2022 Review & Outlook: Winning By Playing Defense
GFIS Model Bond Portfolio Q2/2022 Review & Outlook: Winning By Playing Defense
Chart 18Risk Factor Assumptions For The Scenario Analysis
Risk Factor Assumptions For The Scenario Analysis
Risk Factor Assumptions For The Scenario Analysis
Chart 19US Treasury Yield Assumptions For The Scenario Analysis
US Treasury Yield Assumptions For The Scenario Analysis
US Treasury Yield Assumptions For The Scenario Analysis
Given our neutral overall duration stance, the return scenarios will be driven by mostly by the credit side of the portfolio. In the recession scenario where Treasury yields decline, there is a modest projected outperformance from the rates side of the portfolio coming through the underweight to low-beta JGBs. In all scenarios, financial market volatility is expected to stay at, or above, current levels as central banks will be unable to ease policy, even in the event of an actual recession, because of lingering high inflation. Thus, the return on the credit side of the model portfolio will be the main driver of performance, delivering a range of excess return outcomes between +47bps and +60bps. Bottom Line: The model bond portfolio should benefit in H2/2022 from the ongoing cautious stance on global spread product, focused on underweights to US investment grade corporates and EM hard currency debt. Robert Robis, CFA Chief Fixed Income Strategist rrobis@bcaresearch.com Footnotes 1 The GFIS model bond portfolio custom benchmark index is the Bloomberg Barclays Global Aggregate Index, but with allocations to global high-yield corporate debt replacing very high-quality spread product (i.e. AA-rated). We believe this to be more indicative of the typical internal benchmark used by global multi-sector fixed income managers. 2 We are also closing out our Canadian breakeven widening trade in our Tactical Overlay portfolio. GFIS Model Bond Portfolio Recommended Positioning Active Duration Contribution: GFIS Recommended Portfolio Vs. Custom Performance Benchmark
GFIS Model Bond Portfolio Q2/2022 Review & Outlook: Winning By Playing Defense
GFIS Model Bond Portfolio Q2/2022 Review & Outlook: Winning By Playing Defense
The GFIS Recommended Portfolio Vs. The Custom Benchmark Index Global Fixed Income - Strategic Recommendations*
GFIS Model Bond Portfolio Q2/2022 Review & Outlook: Winning By Playing Defense
GFIS Model Bond Portfolio Q2/2022 Review & Outlook: Winning By Playing Defense
Dear Client, This month’s Special Report has been written by Martin Barnes, BCA’s former Chief Economist. Martin, who retired from BCA Research last year after a long and illustrious career, discusses the long-run outlook for inflation. The views expressed in this report are his, and may not be consistent with those of the Bank Credit Analyst or other BCA Research services. But Martin’s warning of future stagflation is sobering, and I trust you will find his report both interesting and insightful. Jonathan LaBerge, CFA The Bank Credit Analyst Highlights Overly stimulative policies meant that inflation was set to rise even before the disruptions caused by the pandemic and Ukraine conflict. Inflation should decline sharply over the coming year in response to weaker economic growth and an easing in supply problems. But it will be a temporary respite. Central banks will not have the stomach to keep policy tight enough for long enough to squeeze inflation out of the system. Price pressures will return as economies bottom and the environment will become one of stagflation. Financial assets will rally strongly when inflation fears subside but subsequent stagflation will not be bullish for markets. Feature Former Federal Reserve Chairman Alan Greenspan once defined price stability as existing when “households and businesses need not factor expectations of changes in the average level of prices into their decisions”. Until recently, that state of affairs was the case for much of the past 30 years and for many, inflation was quiescent during their entire working lives. But inflation is now back as a huge issue and there is massive debate and uncertainty about whether it will be a temporary or lasting problem. I lean toward the latter view. Major changes in the economic and/or financial environment more often are identified in hindsight than in real time. It is easier to attribute large trend deviations to temporary factors than to make bold predictions about structural shifts. Obviously, the pandemic and conflict in Ukraine have had a significant impact on the near-term inflation picture via massive supply-side disruptions and represent temporary events. Thus, inflation will retreat from current elevated levels as those disruptions diminish. But the conditions for higher inflation were already in place before those two unfortunate events occurred. Specifically, central banks have been erring on the side of stimulus for several years and they will find it extremely difficult, if not impossible, to put the inflation genie back into the bottle. Inflation has moved from a non-issue to the most important factor driving markets. Over the next year, the next big surprise might be how fast inflation retreats and investors and policymakers will then breathe a big sigh of relief. However, this will prove to be a temporary respite because it will not take long for inflation to move back up and remain stubbornly above central bank targets. In other words, a whipsaw is in prospect over the next few years as inflation goes from up, to down, and to up again. The Current Inflation Problem The biggest increases in consumer prices have occurred in areas most affected by supply problems, with energy attracting the most attention. Nevertheless, in most countries, inflation has risen across the majority of goods and services. The core inflation rate (i.e. consumer prices excluding food and energy) in the G7 economies climbed from 2% to 4.8% between April 2021 and April 2022 (Chart II-1). Meanwhile, the Cleveland Fed’s trimmed mean measure of US consumer price inflation has spiked dramatically higher, consistent with a broad-based acceleration in inflation.1 The rise in underlying inflation is a bigger problem in the US, UK and Canada than in Japan or the Euro Area. Chart II-2 shows current core inflation rates relative to the target rate of 2% pursued by most central banks. That geographical divergence will be touched on later and in the meantime, the focus will be on the US situation. Chart II-1A Broad-Based Pickup In Inflation
A Broad-Based Pickup in Inflation
A Broad-Based Pickup in Inflation
Chart II-2The US, UK And Canada Have A Bigger Inflation Problem
July 2022
July 2022
The latest US inflation data for a range of goods and services is shown in Table II-1. The table shows the three- and six-month annualized changes in prices because 12-month rates can be affected by a base effect given the impact of pandemic-related shutdowns and disruptions a year ago. Also, a comparison of the three- and six-month rates shows if momentum is building or fading. The trends are not encouraging in that momentum has accelerated, not diminished in many key areas. Table II-1Selected Inflation Rates In The US CPI
July 2022
July 2022
Even if the data show a moderation in core inflation in the months ahead, it is important to note that rent inflation – the CPI component with the biggest weight – is seriously underestimated. This is one of the few items where prices are collected with a lag and real estate industry reports highlight that rent inflation is running at double-digit rates in the major cities. According to one report, average rents nationally increased by more than 25% in the year to May.2 The CPI data will eventually catch up with reality, providing at least a partial offset to any inflation improvements in other areas. Another problem for inflation is the acceleration in wage growth against the backdrop of an unusually tight labor market. Currently, the number of unfilled vacancies is almost twice the number of unemployed and it is thus no surprise that wage growth has picked up sharply (Chart II-3). The Atlanta Fed’s measure of annual wage inflation has risen above 6%, its highest reading since the data began in 1997. Wage growth is unlikely to suddenly decline absent a marked rise in the unemployment rate. There is much debate about whether the US economy is on the verge of recession, but let’s not get bogged down in semantics. Regardless of whether the technical definition of recession is met (at least two consecutive quarters of negative GDP growth), the pace of activity is set to slow sharply. Plunging consumer and business confidence, contracting real incomes and a peaking in housing activity all point to a significant weakening in growth, even if the labor market stays healthy (Chart II-4). Chart II-3A Very Tight US Labor Market
A Very Tight US Labor Market
A Very Tight US Labor Market
Chart II-4The US Economy Is In Trouble
The US Economy is in Trouble
The US Economy is in Trouble
Softer economic growth eventually will take the edge off inflationary pressures in many goods and services. Combined with an easing in supply-side disruptions, the inflation rate is certain to decline in the coming year, even if oil prices move higher in the short run. Currently, the Fed is talking tough about dealing with inflation and there is little doubt that further rate hikes are on the way. However, policymakers will have little stomach for inflicting enough economic pain to completely squeeze inflation out of the system. Once there are clear signs of a significant economic slowdown, the Fed will back off quickly. What Causes Inflation Anyway? Economics 101 teaches that prices are determined by the interaction of supply and demand. If the demand for a good or service exceeds supply, then prices will rise to bring things back into balance. Seems simple enough but, unfortunately, this leaves many unanswered questions. How much must prices rise and for how long in order to restore balance? What if there are structural impediments to supply? What if there are monopolies in key commodities or services? What if policy interferes with the operation of market-clearing solutions? And, finally, what measure of inflation should we be looking at? Chart II-5Inflation Is A 'Modern' Issue
Inflation is a 'Modern' Issue
Inflation is a 'Modern' Issue
For much of economic history, deflation was just as prevalent as inflation, with the latter only being a problem during periods of war (Chart II-5). As the pre-WWII world pre-dated fiat money, automatic stabilizers (e.g. the welfare state), and counter-cyclical fiscal policy, economies were prone to regular depressions that served to wash out financial and economic excesses and any inflationary pressures. But those days are long gone and free market forces should not be expected to keep inflation under wraps. I rather like the simple explanation of inflation’s roots as being “too much money chasing too few goods”. In that sense, the control of inflation lies firmly at the door of central banks. In the “old days” (i.e. before the 1990s), it was possible to use the growth in the money supply to gauge the stance of policy because there was a fairly stable and predictable relationship between monetary and economic trends. That all ended when financial deregulation and the explosion in non-bank financial activities meant that monetary trends ceased to be a reliable indicator of economic growth and inflation. As a result, the Fed stopped setting monetary growth targets more than 20 years ago and since then, money supply data has rarely been mentioned in FOMC discussions. Chart II-6A Simple Measure Of The Monetary Stance
A Simple Measure of the Monetary Stance
A Simple Measure of the Monetary Stance
Fortunately, all is not lost. The gap between the federal funds rate and nominal GDP growth is a reasonably good proxy for the stance of monetary policy. Conditions are easy when rates are persistently below GDP growth and vice versa when they are above. As can be seen in Chart II-6, rates were below GDP growth during most of the 1960s and 1970s, a period when inflation rose sharply. And inflation fell steadily in the 1980s into the first half of the 1990s when the Fed kept interest rates above GDP growth. And look at what has happened in the past decade: rates have been significantly below GDP growth, suggesting an aggressively easy monetary stance. It was only a matter of time before inflation picked up, even without the recent supply-side disruptions. The FOMC’s latest projections show long-run growth of 3.8% in nominal GDP while the fed funds rate is expected to average only 2.5%. That implies a continued accommodative stance, yet inflation is forecast to be in line with the 2% target. That all seems very unlikely. Fed policymakers spend a lot of time trying to figure out the level of the equilibrium real interest rate – the level consistent with steady non-inflationary economic growth. It would be very helpful to have this number but coming up with an accurate measure is a largely futile exercise. It cannot be measured empirically and its estimation requires a lot of assumptions, explaining why there is no broad agreement on what the right number is. I think there is a case for the simpler approach of using the nominal growth in GDP as a proxy for where rates should be in normal circumstances. As noted above, that suggests monetary policy was excessively accommodative for an extended period. If US Policy Was Too Easy, Why Was Inflation Low For So Long? The Fed’s preferred measure of underlying inflation is the change in the personal consumption deflator, excluding food and energy. In the 25 years to 2019, inflation by this measure averaged only 1.7%, compared to the Fed’s desired level of 2%. Thus, even though the level of interest rates implied very accommodative policy over that period, inflation remained tame. This leads to an important caveat. The stance of monetary policy plays the key role in driving inflation, but it is not everything. Offsetting forces on inflation (in both directions) can mute or even swamp the impact of policy. There were several disinflationary forces in operation during the past 25 years. Specifically: In the second half of the 1990s, the explosive growth of the internet and accompanying boom in technology spending led to a marked pickup in productivity growth. The entry of China into the World Trade Organization at the end of 2001 unleashed a wave of offshoring and downward pressure on traded goods prices. A series of deflationary shocks hit the US and global economy including the 1998 financial crisis in South-East Asia and Russia, the bursting of the tech bubble after 2000, and of course the global financial meltdown in 2007-09. Unstable economic conditions undermined labor’s bargaining power, keeping a tight lid on wage growth. This was highlighted by the dramatic decline in labor’s share of income after 2000. Importantly, the above forces are no longer in place and in some cases are reversing. The key technological advances of the past decade have not been particularly good for productivity. Indeed, one could argue that the activities of most so-called FANG stocks – especially those involved in social media - have had a negative impact on productivity. Time spent on FaceBook, Twitter and Netflix do not have obvious benefits for increased economic efficiency. Chart II-7Globalization In Retreat
Globalization in Retreat
Globalization in Retreat
Even before the pandemic’s impact on supply chains, there were signs that globalization had peaked (Chart II-7). Indeed, BCA first suggested in 2014 that globalization was running out of steam. More recently, the interruption to supply chains has highlighted the downside of relying excessively on overseas production for key goods such as semi-conductors and pharmaceuticals. Onshoring rather than offshoring will become more common with higher prices being the cost for greater control over supply. Globalization is not dead, but, at the margin, it no longer is a powerful source of disinflation. US import prices from China are back to their highest level in a decade after falling steadily during the eight years to 2020. The inflationary impact of the pandemic and the war in Ukraine via supply-side disruptions are more than offsetting any disinflationary effects of softer economic growth. In other words, they have represented stagflationary rather than deflationary shocks. Finally, with regard to income shares, the pendulum has swung more in favor of labor. Demographic trends (e.g. slow growth in the working-age population) suggest that the labor market will remain relatively tight in the years ahead, notwithstanding short-term weakness as the economy slows. Profit margins are likely to weaken and labor’s share of income will rise. The bottom line is that easy money policies will no longer be offset by a number of powerful external forces that served to keep consumer price inflation under wraps in the pre-pandemic period. And this raises another important point. If monetary policy is too easy, then it will show up somewhere, even if consumer price inflation is under control. There Is More Than One Kind Of Inflation Inflation most commonly refers to the change in the prices of consumer goods and services. That is understandable because consumer spending accounts for more than half of GDP in the major developed economies (and almost 70% in the US). And because consumers are the ones who vote, it is the inflation rate that politicians care most about. However, there are other kinds of inflation. If there are structural impediments to increased consumer prices, then excessively easy monetary policy most likely will show up in higher asset prices. This is a very different kind of inflation because it is welcomed by the owners of assets and by politicians. Nobody is happy to face higher prices for the goods and services they buy, but asset owners love the wealth-boosting effect of higher prices for homes and shares. Consumer inflation may have been subdued in the pre-pandemic decade, but the same is not true for asset prices. During the period that the Fed ran accommodative policies, there were several periods of rampant asset inflation such as the tech stock bubble of the late 1990s, the housing bubble of the 2000s, and the bond bubble of 2016-2020. And both equity and home prices surged in response to monetary stimulus triggered by the pandemic. Central banks may fret about the potential financial stability implications of surging asset prices, but in practice they do not act to curb them. Policymakers argue that it is hard to determine when an asset bubble exists and even when one is obvious, monetary policy is a crude tool to deal with it. If rising asset prices occur alongside an economy that is characterized by stable growth and moderate inflation, then acting to burst a bubble could inflict unnecessary economic damage. That is an understandable position, but it means ignoring the longer-term problems that occur when bubbles inevitably burst. This was highlighted by the economic and financial chaos after the US housing bubble burst in 2007. The reality is that central banks have been forced to rely more heavily on asset inflation as a source of monetary stimulus. An easing in monetary policy affects economic conditions in three primary ways: boosting credit demand and supply, raising asset prices, and lowering the exchange rate.3 Historically, the credit channel was by far the most important. BCA has written extensively about the Debt Supercycle and the role of monetary policy in fueling ever-rising levels of private sector indebtedness (see the Appendix for a brief description of the Debt Supercycle). Chart II-8No Releveraging Cycle In Household Debt
No Releveraging Cycle in Household Debt
No Releveraging Cycle in Household Debt
The environment changed dramatically after the 2007-09 financial meltdown. The collapse of the credit-fueled housing bubble drove a stake through the heart of the household sector’s love affair with debt. The ratio of household debt to income peaked in early 2009 and ten years later it was back to the levels of 2001 (Chart II-8). Even an extended period of record low interest rates has failed to trigger a new leveraging cycle. If the Fed can’t persuade consumers and businesses to fall back in love with debt, then it must rely on the other two transmission channels for monetary policy – asset prices and the exchange rate. And the Fed really has limited control over the latter channel given that it also depends on the actions of other central banks. The deleveraging of the household sector in the post-2009 period could have been very bearish for the economy, but the Fed’s easy money policies underpinned the stock market, allowing household net worth to revive. There was an explosive rise in household net worth in 2020-21 as surging house prices added to stock market gains. Between end-2019 and end-2021, the household sector’s direct holdings of equities plus owner’s equity in real estate increased in value by around $20 trillion, equal to more than one year’s personal disposable income. The recent decline in equity prices has reversed some of the gains, but net worth remains elevated by historical standards. The bottom line is that it was wrong to suggest that the Fed’s accommodative stance did not create inflation. Consumer price inflation was tame in the pre-pandemic period, but there was lots of asset inflation and that gathered pace in 2020 and 2021. There was always going to be some leakage of this into more generalized inflation but this was accelerated by the double whammy of the supply disruptions caused by the pandemic and the Ukraine war. The Strange Case Of Japan If higher inflation in the US has seemed inevitable, how can one explain the situation in Japan? In contrast to other developed countries, Japan’s annual core inflation rate was only 0.2% in May. While this was an increase from the average -1.3% rate in the prior six months, it is impressive given the country’s continued highly stimulative monetary policy and the same exposure to supply disruptions as elsewhere. Most importantly, Japan has suffered structural deflation for so long that inflation expectations are totally dormant for both consumers and businesses. In other words, raising prices is seen as a desperate measure and something to be avoided. Japan’s poor demographics may also have played a role. A sharply declining labor force and rapidly aging population are disinflationary rather than inflationary influences and help reinforce the corporate sector’s reluctance to raise prices. While Japan seems an outlier, it is worth noting that core inflation also has remained relatively subdued in many European countries. For the overall Euro area, the latest core inflation rate is 3.8%, well below that of the US and UK. Two common features of the higher inflation countries are that they tended to have more aggressively-easy fiscal policies in recent years and greater asset inflation – especially in real estate. Unfortunately, inflation expectations and business pricing behavior in the US and other Anglo-Saxon economies have not followed Japan’s example. Employees have become more aggressive in demanding higher wages, and most companies have no problem in passing on higher costs to their customers. The UK is facing a wave of public sector strikes over pay the likes of which have not been seen for decades. The Outlook Chart II-9A Peaking In Supply Problems?
A Peaking in Supply Problems?
A Peaking in Supply Problems?
Inflation may prove sticky over the next few months, but as noted earlier, it should move significantly lower over the coming year. Crude oil prices have risen by around 75% in the past year and that pace of rise cannot be sustained. Meanwhile, while shipping rates remain historically high, they are down sharply from earlier peaks (Chart II-9). Together with a revival in Chinese exports, this suggests some easing in supply chain problems. And as mentioned above, the pace of economic activity is set to slow sharply. But a return to pre-pandemic inflation levels is not in the cards. The Fed currently is talking tough and further rate hikes are on the way. But the tightening will end as soon as it becomes clear that the economy is heading south. A deep recession is not likely because there are not the worrying imbalances such as excessive consumer debt or inventories that typically precede serious downturns. However, policymakers will not take any risks and policy will return quickly to an accommodative stance, even though inflation is unlikely to return to the desired 2% level. On a positive note, inflation may be the highest in 40 years in many countries, but we are not facing a return to the destructive high-inflation environment of the 1970s. Inflation back then was institutionalized and a self-feeding cycle of higher wages and rising prices was deeply embedded. I was working as an economist for BP in London in the 1970s and remember receiving large quarterly pay rises just to compensate for inflation. In the absence of inflation-accounting practices, companies seriously underestimated the destruction that inflation was creating to balance sheets and profitability, making them complacent about the problem. Moreover, there were not the same global competitive pressures that exist today. Inflation in the US likely will form a new base of 3% to 4% over the medium term, with occasional fluctuations to 5% or above. An environment of stagflation is in prospect: growth will not be weak enough to suppress inflation and not strong enough to allow the Fed to maintain a restrictive stance. This puts the Fed in a difficult spot as it will be reluctant to admit defeat by raising the inflation target from its current 2%, even though that level will be out of reach in practical terms. A counter view is that I am too pessimistic by underestimating the disinflationary effects of technological advances. A sustained improvement in productivity would certainly help lower inflation but how likely is this? Technological advances are occurring all the time, but in recent years they largely have been incremental in nature and it is hard to think of any new breakthrough productivity-enhancing technologies. There is a difference between new technologies that simply represent better ways to do existing tasks (3D printing would fall into that category) and general purpose technologies that completely change the way economies operate (e.g. electricity and the internet). While businesses are still exploiting the benefits of the digital world, we await innovations that will trigger a new sustained upsurge in productivity. A game changer would be the development of unlimited cheap energy (cold fusion?) but that does not seem likely any time soon. Nevertheless, I will keep an open mind about the potential for productivity to surprise on the upside, despite my current skepticism. Chart II-10Inflation Expectations Spike Higher
Inflation Expectations Spike Higher
Inflation Expectations Spike Higher
What does all this mean for the markets? Not surprisingly, shifts in market expectations for future inflation are highly correlated with the current rate and have thus spiked higher in recent months, hurting both bonds and stocks (Chart II-10). Obvious inflation hedges would be inflation-protected bonds and resources, but neither group currently is attractively priced. The good news is that the current panic about inflation is setting the scene for a buying opportunity in both stocks and bonds. The exact timing is tricky to predict but both stocks and bonds will rally strongly later this year when inflation expectations retreat as it becomes clear that the economy is weakening and the Fed softens its hawkish tones. The bad news is that this bullish phase will not last much more than a year because a re-emergence of inflationary pressures will bring things back to earth. The long-run outlook is one of stagflation and that will be a tough environment for financial assets. Martin H. Barnes Former Chief Economist, BCA Research mhbarnes15@gmail.com Appendix: A Primer On The Debt Supercycle The Debt Supercycle is a description of the long-term decline in U.S. balance-sheet liquidity and rise in indebtedness during the post-WWII period. Economic expansions have always been associated with a buildup of leverage. However, prior to the introduction of automatic stabilizers such as the welfare state and deposit insurance, balance-sheet excesses tended to be fully unwound during economic downturns, albeit at the cost of severe declines in activity. The pain of the Great Depression led governments to intervene to smooth out the business cycle, and their actions were given legitimacy by the economic theories of John Maynard Keynes. Fiscal and monetary reflation, together with the introduction of automatic stabilizers such as unemployment insurance, were successful in preventing the frequent depressions that plagued the pre-WWII economy, but the downside was that balance-sheet imbalances and financial excesses built up during each expansion phase were never fully unwound. Periodic "cyclical" corrections to the buildup of debt and illiquidity occurred during recessions, but these were never enough to reverse the long-run trend. Although liquidity was rebuilt during a recession, it did not return to its previous cyclical high. Meanwhile, the liquidity rundown during the next expansion phase established new lows. These trends led to growing illiquidity, and vulnerability in the financial markets. The greater the degree of illiquidity in the economy, the greater is the threat of deflation. Thus, the bigger that balance-sheet excesses become, the more painful the corrective process would be. So, the stakes became higher in each cycle, putting ever-increasing pressure on the authorities to reflate demand, by whatever means were available. The Supercycle process was driven over time by the building tension between rising underlying deflationary risks in the economy, and the ability of policymakers to create inflation. The Supercycle reached an important inflection point in the recent economic and financial meltdown, with the authorities reaching the limit of their ability to get consumers to take on more leverage. This forced the government to leverage itself up instead, representing the Debt Supercycle's final inning. Footnotes 1This trimmed mean measure excludes the top 8% of CPI components with the largest monthly price gains and the bottom 8% with the smallest monthly gains. 2 Rent.com, https://www.rent.com/research/average-rent-price-report/, June 2022. 3 A fourth channel can be via a psychological boost to business and consumer confidence, but this can cut both ways if an easing in policy is interpreted as a sign of worsening economic conditions rather than as a reason for optimism.
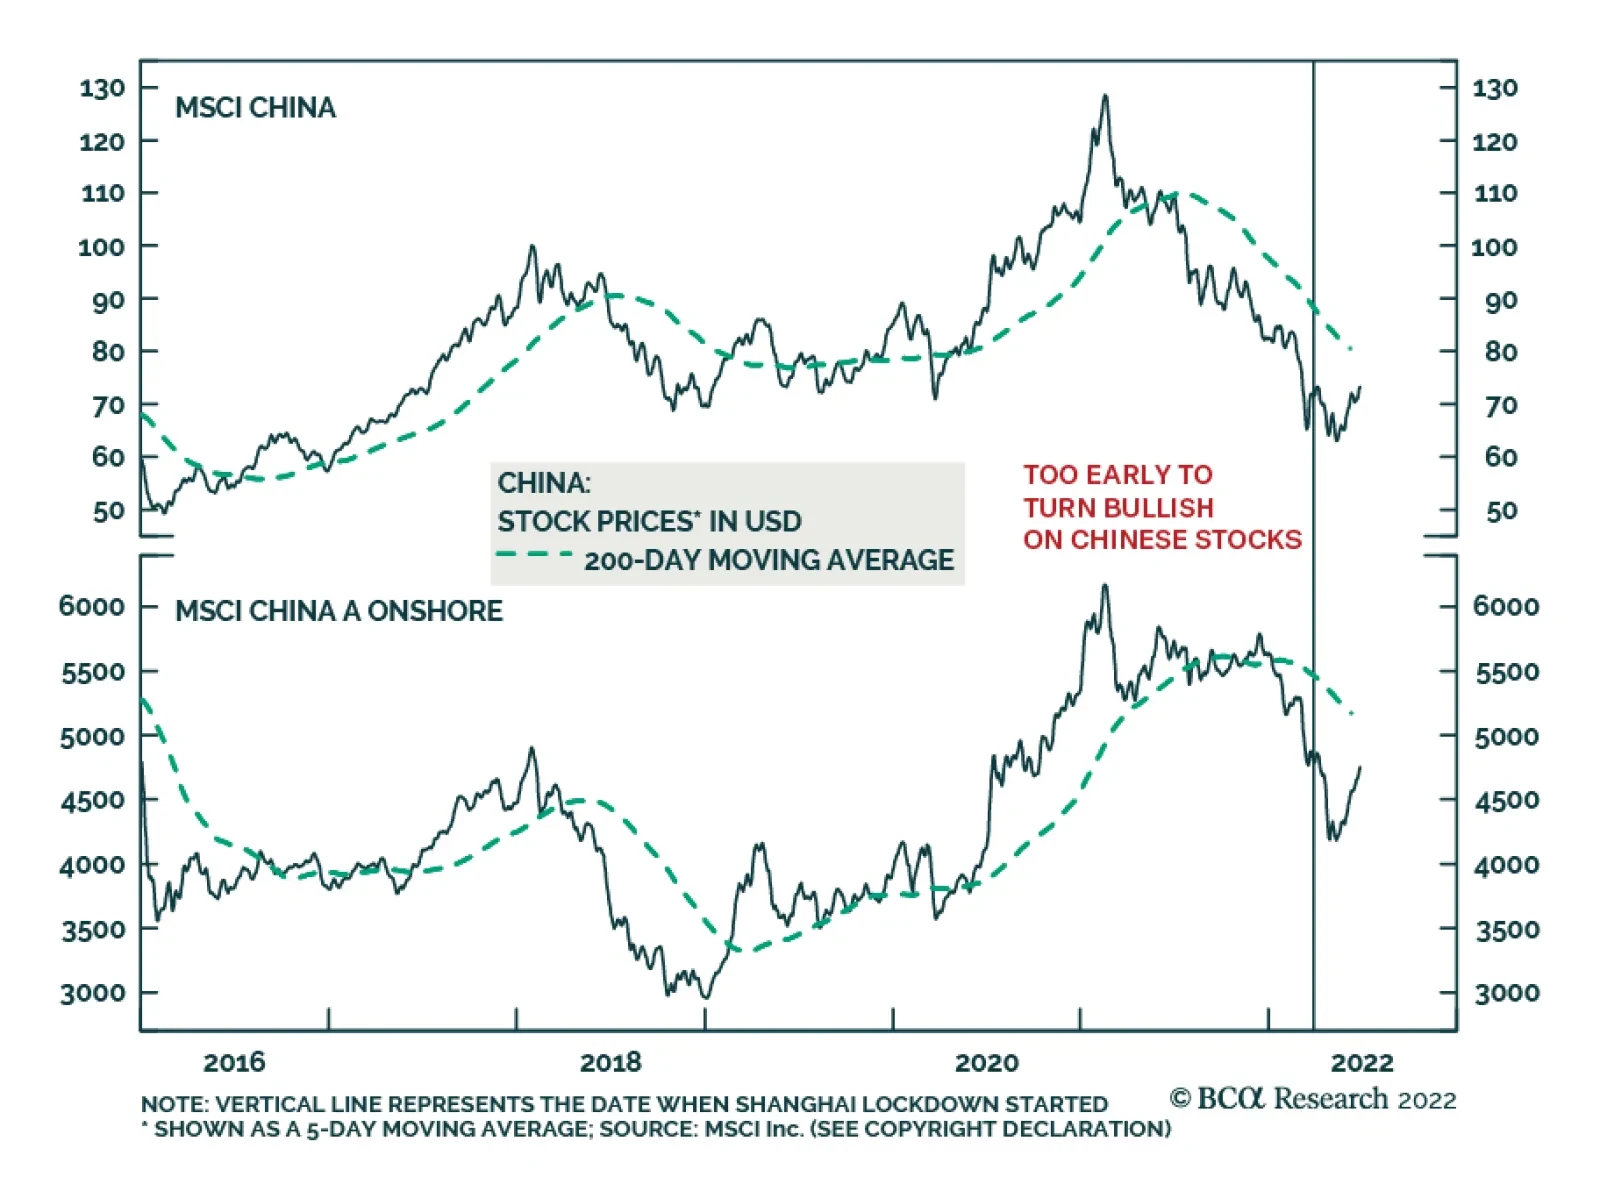
BCA Research’s China Investment Strategy service continues to recommend a neutral stance in Chinese equities within a global portfolio. China’s economic data moved up slightly in May from an extremely depressed level in April. A normalization of the supply…
Executive Summary Russia Squeezes EU Natural Gas
Russia Squeezes EU Natural Gas
Russia Squeezes EU Natural Gas
Major geopolitical shocks tend to coincide with bear markets, so the market is getting closer to pricing this year’s bad news. But investors are not out of the woods yet. Russia is cutting off Europe’s natural gas supply ahead of this winter in retaliation to Europe’s oil embargo. Europe is sliding toward recession. China is reverting to autocratic rule and suffering a cyclical and structural downshift in growth rates. Only after Xi Jinping consolidates power will the ruling party focus exclusively on economic stabilization. The US can afford to take risks with Russia, opening up the possibility of a direct confrontation between the two giants before the US midterm election. A new strategic equilibrium is not yet at hand. Tactical Recommendation Inception Date Return LONG GLOBAL DEFENSIVES / CYCLICALS EQUITIES 2022-01-20 18.3% Bottom Line: Maintain a defensive posture in the third quarter but look for opportunities to buy oversold assets with long-term macro and policy tailwinds. Feature 2022 is a year of geopolitics and supply shocks. Global investors should remain defensive at least until the Chinese national party congress and US midterm election have passed. More fundamentally, an equilibrium must be established between Russia and NATO and between the US and Iran. Until then supply shocks will destroy demand. Checking Up On Our Three Key Views For 2022 Our three key views for the year are broadly on track: 1. China’s Reversion To Autocracy: For ten years now, the fall in Chinese potential economic growth has coincided with a rise in neo-Maoist autocracy and foreign policy assertiveness, leading to capital flight, international tensions, and depressed animal spirits (Chart 1). Related Report Geopolitical StrategyWill China Let 100 Flowers Bloom? Only Briefly. Rising incomes provided legitimacy for the Communist Party over the past four decades. Less rapidly rising incomes – and extreme disparities in standards of living – undermine the party and force it to find other sources of public support. Fighting pollution and expanding the social safety net are positives for political stability and potentially for economic productivity. But converting the political system from single-party rule to single-person rule is negative for productivity. Mercantilist trade policy and nationalist security policy are also negative. China’s political crackdown, struggle with Covid-19, waning exports, and deflating property market have led to an abrupt slowdown this year. The government is responding by easing monetary, fiscal, and regulatory policy, though so far with limited effect (Chart 2). Economic policy will not be decisive in the third quarter unless a crash forces the administration to stimulate aggressively. Chart 1China's Slowdown Leads To Maoism, Nationalism
China's Slowdown Leads To Maoism, Nationalism
China's Slowdown Leads To Maoism, Nationalism
Chart 2Chinese Policy Easing: Limited Effect So Far
Chinese Policy Easing: Limited Effect So Far
Chinese Policy Easing: Limited Effect So Far
Chart 3Nascent Rally In Chinese Shares Will Be Dashed
Nascent Rally In Chinese Shares Will Be Dashed
Nascent Rally In Chinese Shares Will Be Dashed
Once General Secretary Xi Jinping secures another five-to-ten years in power at the twentieth national party congress this fall, he will be able to “let 100 flowers bloom,” i.e. ease policy further and focus exclusively on securing the economic recovery in 2023. But policy uncertainty will remain high until then. The party may have to crack down anew to ensure Xi’s power consolidation goes according to plan. China is highly vulnerable to social unrest for both structural and cyclical reasons. The US would jump to slap sanctions on China for human rights abuses. Hence the nascent recovery in Chinese domestic and offshore equities can easily be interrupted until the political reshuffle is over (Chart 3). If China’s economy stabilizes and a recession is avoided, investors will pile into the rally, but over the long run they will still be vulnerable to stranded capital due to Chinese autocracy and US-China cold war. If the Politburo and Politburo Standing Committee are stacked with members of Xi’s faction, as one should expect, then the reduction in policy uncertainty will only be temporary. Autocracy will lead to unpredictable and draconian policy measures – and it cannot solve the problem of a shrinking and overly indebted population. If the Communist Party changes course and stacks the Politburo with Xi’s factional rivals, to prevent China from going down the Maoist, Stalinist, and Putinist route, then global financial markets will cheer. But that outcome is unlikely. Hawkish foreign policy means that China will continue to increase its military threats against Taiwan, while not yet invading outright. Beijing has tightened its grip over Tibet, Xinjiang, and Hong Kong since 2008; Taiwan and the South China Sea are the only critical buffer areas that remain to be subjugated. Taiwan’s midterm elections, US midterms, and China’s party congress will keep uncertainty elevated. Taiwan has underperformed global and emerging market equities as the semiconductor boom and shortage has declined (Chart 4). Hong Kong is vulnerable to another outbreak of social unrest and government repression. Quality of life has deteriorated for the native population. Democracy activists are disaffected and prone to radicalization. Singapore will continue to benefit at Hong Kong’s expense (Chart 5). Chart 4Taiwan Equity Relative Performance Peaked
Taiwan Equity Relative Performance Peaked
Taiwan Equity Relative Performance Peaked
Chart 5Hong Kong Faces More Troubles
Hong Kong Faces More Troubles
Hong Kong Faces More Troubles
Chart 6Japan Undercuts China
Japan Undercuts China
Japan Undercuts China
China and Japan are likely to engage in clashes in the East China Sea. Beijing’s military modernization, nuclear weapons expansion, and technological development pose a threat to Japanese security. The gradual encirclement of Taiwan jeopardizes Japan’s vital sea lines of communication. Prime Minister Fumio Kishida is well positioned to lead the Liberal Democratic Party into the upper house election on July 10 – he does not need to trigger a diplomatic showdown but he would not suffer from it. Meanwhile China is hungry for foreign distractions and unhappy that Japan is reviving its military and depreciating its currency (Chart 6). A Sino-Japanese crisis cannot be ruled out, especially if the Biden administration looks as if it will lose its nerve in containing China. Financial markets would react negatively, depending on the magnitude of the crisis. North Korea is going back to testing ballistic missiles and likely nuclear weapons. It is expanding its doctrine for the use of such weapons. It could take advantage of China’s and America’s domestic politics to stage aggressive provocations. South Korea, which has a hawkish new president who lacks parliamentary support, is strengthening its deterrence with the United States. These efforts could provoke a negative response from the North. Financial markets will only temporarily react to North Korean provocations unless they are serious enough to elicit military threats from Japan or the United States. China would be happy to offer negotiations to distract the Biden administration from Xi’s power grab. South Korean equities will benefit on a relative basis as China adds more stimulus. 2. America’s Policy Insularity: President Biden’s net approval rating, at -15%, is now worse than President Trump’s in 2018, when the Republicans suffered a beating in midterm elections (Chart 7). Biden is now fighting inflation to try to salvage the elections for his party. That means US foreign policy will be domestically focused and erratic in the third quarter. Aside from “letting” the Federal Reserve hike rates, Biden’s executive options are limited. Pausing the federal gasoline tax requires congressional approval, and yet if he unilaterally orders tax collectors to stand down, the result will be a $10 billion tax cut – a drop in the bucket. Biden is considering waiving some of former President Trump’s tariffs on China, which he can do on his own. But doing so will hurt his standing in Rust Belt swing states without reducing inflation enough to get a payoff at the voting booth – after all, import prices are growing slower from China than elsewhere (Chart 8). He would also give Xi Jinping a last-minute victory over America that would silence Xi’s critics and cement his dictatorship at the critical hour. Chart 7Democrats Face Shellacking In Midterm Elections
Third Quarter Geopolitical Outlook: Thunder And Lightning
Third Quarter Geopolitical Outlook: Thunder And Lightning
Chart 8Paring Trump Tariffs Won't Reduce Inflation Much
Paring Trump Tariffs Won't Reduce Inflation Much
Paring Trump Tariffs Won't Reduce Inflation Much
Chart 9Only OPEC Can Help Biden - And Help May Come Late
Only OPEC Can Help Biden - And Help May Come Late
Only OPEC Can Help Biden - And Help May Come Late
Biden is offering to lift sanctions on Iran, which would free up 1.3 million barrels of oil per day. But Iran is not being forced to freeze its nuclear program by weak oil prices or Russian and Chinese pressure – quite the opposite. If Biden eases sanctions anyway, prices at the pump may not fall enough to win votes. Hence Biden is traveling to Saudi Arabia to make amends with Crown Prince Mohammed bin Salman. OPEC’s interest lies in producing enough oil to prevent a global recession, not in flooding the market on Biden’s whims to rescue the Democratic Party. Saudi and Emirati production may come but it may not come early in the third quarter. Lifting sanctions on Venezuela is a joke and Libya recently collapsed again (Chart 9). Even in dealing with Russia the Biden administration will exhibit an insular perspective. The US is not immediately threatened, like Europe, so it can afford to take risks, such as selling Ukraine advanced and long-range weapons and providing intelligence used to sink Russian ships. If Russia reacts negatively, a direct US-Russia confrontation will generate a rally around the flag that would help the Democrats, as it did under President John F. Kennedy in 1962 – one of the rare years in which the ruling party minimized its midterm election losses (Chart 10). The Cuban Missile Crisis counted more with voters than the earlier stock market slide. 3. Petro-States’ Geopolitical Leverage: Oil-producing states have immense geopolitical leverage this year thanks to the commodity cycle. Russia will not be forced to conclude its assault on Ukraine until global energy prices collapse, as occurred in 2014. In fact Russia’s leverage over Europe will be greatly reduced in the coming years since Europe is diversifying away from Russian energy exports. Hence Moscow is cutting natural gas flows to Europe today while it still can (Chart 11). Chart 10Biden Can Afford To Take Risks With Russia
Third Quarter Geopolitical Outlook: Thunder And Lightning
Third Quarter Geopolitical Outlook: Thunder And Lightning
Chart 11Russia Squeezes EU's Natural Gas
Russia Squeezes EU's Natural Gas
Russia Squeezes EU's Natural Gas
Chart 12EU/China Slowdown Will Weigh On World
Third Quarter Geopolitical Outlook: Thunder And Lightning
Third Quarter Geopolitical Outlook: Thunder And Lightning
Russia’s objective is to inflict a recession and cause changes in either policy or government in Europe. This will make it easier to conclude a favorable ceasefire in Ukraine. More importantly it will increase the odds that the EU’s 27 members, having suffered the cost of their coal and oil embargo, will fail to agree to a natural gas embargo by 2027 as they intend. Italy, for example, faces an election by June 2023, which could come earlier. The national unity coalition was formed to distribute the EU’s pandemic recovery funds. Now those funds are drying up, the economy is sliding toward recession, and the coalition is cracking. The most popular party is an anti-establishment right-wing party, the Brothers of Italy, which is waiting in the wings and can ally with the populist League, which has some sympathies with Russia. A recession could very easily produce a change in government and a more pragmatic approach to Moscow. The Italian economy is getting squeezed by energy prices and rising interest rates at the same time and cannot withstand the combination very long. A European recession or near-recession will cause further downgrades to global growth, especially when considering the knock-on effects in China, where the slowdown is more pronounced than is likely reported. The US economy is more robust but it will have to be very robust indeed to withstand a recession in Europe and growth recession in China (Chart 12). Russia does not have to retaliate against Finland and Sweden joining NATO until Turkey clears the path for them to join, which may not be until just before the Turkish general election due in June 2023. But imposing a recession on Europe is already retaliation – maybe a government change will produce a new veto against NATO enlargement. Russian retaliation against Lithuania for blocking 50% of its shipments to the Kaliningrad exclave is also forthcoming – unless Lithuania effectively stops enforcing the EU’s sanctions on Russian resources. Russia cannot wage a full-scale attack on the Baltic states without triggering direct hostilities with NATO since they are members of NATO. But it can retaliate in other ways. In a negative scenario Moscow could stage a small “accidental” attack against Lithuania to test NATO. But that would force Biden to uphold his pledge to defend “every inch” of NATO territory. Biden would probably do so by staging a proportionate military response or coordinating with an ally to do it. The target would be the Russian origin of attack or comparable assets in the Baltic Sea, the Black Sea, Ukraine, Belarus, or elsewhere. The result would be a dangerous escalation. Russia could also opt for cyber-attacks or economic warfare – such as squeezing Europe’s natural gas supply further. Ultimately Russia can afford to take greater risks than the US over Kaliningrad, other territories, and its periphery more broadly. That is the difference between Kennedy and Biden – the confrontation is not over Cuba. Russia is also likely to take a page out of Josef Stalin’s playbook and open a new front – not so much in Nicaragua as in the Middle East and North Africa. The US betrayal of the 2015 nuclear deal with Iran opens the opportunity for Russia to strengthen cooperation with Iran, stir up the Iranians’ courage, sell them weapons, and generate a security crisis in the Middle East. The US military would be distracted keeping peace in the Persian Gulf while the Europeans would lose their long-term energy alternative to Russia – and energy prices would rise. The Iranians – who also have leverage during a time of high oil prices – are not inclined to freeze their nuclear program. That would be to trade their long-term regime survival for economic benefits that the next American president can revoke unilaterally. Bottom Line: Xi Jinping is converting China back into an autocracy, the Biden administration lacks options and is willing to have a showdown with Russia, and the Putin administration is trying to inflict a European recession and political upheaval. Stay defensive. Checking Up On Our Strategic Themes For The 2020s As for our long-term themes, the following points are relevant after what we have learned in the second quarter: 1. Great Power Rivalry: The war in Ukraine has reminded investors of the primacy of national security. In an anarchic international system, if a single great nation pursues power to the neglect of its neighbors’ interests, then its neighbors need to pursue power to defend themselves. Before long every nation is out for itself. At least until a new equilibrium is established. For example, Russia’s decision to neutralize Ukraine by force is driving Germany to abandon its formerly liberal policy of energy cooperation in order to reduce Russia’s energy revenues and avoid feeding its military ambitions. Russia in turn is reducing natural gas exports to weaken Europe’s economy this winter. Germany will re-arm, Finland and Sweden will eventually join NATO, and Russia will underscore its red line against NATO bases or forces in Finland and Sweden. If this red line is violated then a larger war could ensue. Chart 13China Will Shift To Russian Energy
China Will Shift To Russian Energy
China Will Shift To Russian Energy
Until Russia and NATO come to a new understanding, neither Europe nor Russia can be secure. Meanwhile China cannot reject Russia’s turn to the east. China believes it may need to use force to prevent Taiwan independence at some point, so it must prepare for the US and its allies to treat it the same way that they have treated Russia. It must secure energy supply from Russia, Central Asia, and the Middle East via land routes that the US navy cannot blockade (Chart 13). Beijing must also diversify away from the US dollar, lest the Treasury Department freeze its foreign exchange reserves like it did Russia’s. Global investors will see diversification as a sign of China’s exit from the international order and preparation for conflict, which is negative for its economic future. However, the Russo-Chinese alliance presents a historic threat to the US’s security, coming close to the geopolitical nightmare of a unified Eurasia. The US is bound to oppose this development, whether coherently or not, and whether alone or in concert with its allies. After all, the US cannot offer credible security guarantees to negotiate a détente with China or Iran because its domestic divisions are so extreme that its foreign policy can change overnight. Other powers cannot be sure that the US will not suffer a radical domestic policy change or revolution that leads to belligerent foreign policy. Insecurity will drive the US and China apart rather than bringing them together. For example, Russia’s difficulties in Ukraine will encourage Chinese strategists to go back to the drawing board to adjust their plans for military contingencies in Taiwan. But the American lesson from Ukraine is to increase deterrence in Taiwan. That will provoke China and encourage the belief that China cannot wait forever to resolve the Taiwan problem. Until there is a strategic understanding between Russia and NATO, and the US and China, the world will remain in a painful and dangerous transitional phase – a multipolar disequilibrium. Chart 14Hypo-Globalization: Globalizing Less Than Potential
Third Quarter Geopolitical Outlook: Thunder And Lightning
Third Quarter Geopolitical Outlook: Thunder And Lightning
2. Hypo-Globalization: If national security rises to the fore, then economics becomes a tool of state power. Mercantilism becomes the basis of globalization rather than free market liberalism. Hypo-globalization is the result. The term is fitting because the trade intensity of global growth is not yet in a total free fall (i.e. de-globalization) but merely dropping off from its peaks during the phase of “hyper-globalization” in the 1990s and early 2000s (Chart 14). Hypo-globalization is probably a structural rather than cyclical phenomenon. The EU cannot re-engage with Russia and ease sanctions without rehabilitating Russia’s economy and hence its military capacity – which could enable Russia to attack Europe again. The US and China can try to re-engage but they will fail. Russo-Chinese alliance ensures that the US would be enriching not one but both of its greatest strategic rivals if it reopened its doors to Chinese technology acquisition and intellectual property theft. Iran will see its security in alliance with Russia and China. China has an incentive to develop Iran’s economy so as not to depend solely on Russia and Central Asia. Russia has an incentive to develop Iran’s military capacity so as to deprive Europe of an energy alternative. Both Russia and China wish to deprive the US of strategic hegemony in the Middle East. By contrast the US and EU cannot offer ironclad security guarantees to Iran because of its nuclear ambitions and America’s occasional belligerence. Thus the world can see expanding Russian and Chinese economic integration with Eurasia, and expanding American and European integration with various regions, but it cannot see further European integration with Russia or American integration with China. And ultimately Europe and China will be forced to sever links (Chart 15). Globalization will not cease – it is a multi-millennial trend – but it will slow down. It will be subordinated to national security and mercantilist economic theory. 3. Populism/Nationalism: In theory, domestic instability can cause introversion or extroversion. But in practice we are seeing extroversion, which is dangerous for global stability (Chart 16). Chart 15Global Economic Disintegration
Global Economic Disintegration
Global Economic Disintegration
Chart 16Internal Sources Of Nationalism
Internal Sources Of Nationalism
Internal Sources Of Nationalism
Russia’s invasion of Ukraine derived from domestic Russian instability – and instability across the former Soviet space, including Belarus, which the Kremlin feared could suffer a color revolution after the rigged election and mass protests of 2020-21. The reason the northern European countries are rapidly revising their national defense and foreign policies to counter Russia is because they perceive that the threat to their security is driven by factors within the former Soviet sphere that they cannot easily remove. These factors will get worse as a result of the Ukraine war. Russian aggression still poses the risk of spilling out of Ukraine’s borders. China’s Maoist nostalgia and return to autocratic government is also about nationalism. The end of the rapid growth phase of industrialization is giving way to the Asian scourge: debt-deflation. The Communist Party is trying to orchestrate a great leap forward into the next phase of development. But in case that leap fails like the last one, Beijing is promoting “the great rejuvenation of the Chinese nation” and blaming the rest of the world for excluding and containing China. Taiwan, unfortunately, is the last relic of China’s past humiliation at the hands of western imperialists. China will also seek to control the strategic approach to Taiwan, i.e. the South China Sea. China’s claim that the Taiwan Strait is sovereign sea, not international waters, will force the American navy to assert freedom of passage. American efforts to upgrade Taiwan relations and increase deterrence will be perceived as neo-imperialism. The United States, for its part, could also see nationalism convert into international aggression. The US is veering on the brink of a miniature civil war as nationalist forces in the interior of the country struggle with the political establishment in the coastal states. Polarization has abated since 2020, as stagflation has discredited the Democrats. But it is now likely to rebound, making congressional gridlock all but inevitable. A Republican-controlled House will find a reason to impeach President Biden in 2023-24, in hopes of undermining his party and reclaiming the presidency. Another hotly contested election is possible, or worse, a full-blown constitutional crisis. American institutions proved impervious to the attempt of former President Trump and his followers to disrupt the certification of the Electoral College vote. However, security forces will be much more aggressive against rebellions of whatever stripe in future, which could lead to episodes in which social unrest is aggravated by police repression. If the GOP retakes the White House – especially if it is a second-term Trump presidency with a vendetta against political enemies and nothing to lose – then the US will return to aggressive foreign policy, whether directed at China or Iran or both. In short, polarization has contaminated foreign policy such that the most powerful country in the world cannot lead with a steady hand. Over the long run polarization will decline in the face of common foreign enemies but for now the trend vitiates global stability. Chart 17Germany And Japan Rearming
Third Quarter Geopolitical Outlook: Thunder And Lightning
Third Quarter Geopolitical Outlook: Thunder And Lightning
It goes without saying that nationalism is also an active force in Iran, where 83-year-old Supreme Leader Ayatollah Khamenei is attempting to ensure the survival of his regime in the face of youthful social unrest and an unclear succession process. If Khamenei takes advantage of the commodity cycle, and American and Israeli disarray, he can make a mad dash for the bomb and try to achieve regime security. But if he does so then nationalism will betray him, since Israel and/or the US are willing to conduct air strikes to uphold the red line against nuclear weaponization. If any more proof of global nationalism is needed, look no further than Germany and Japan, the principal aggressors of World War II. Their pacifist foreign policies have served as the linchpins of the post-war international order. Now they are both pursuing rearmament and a more proactive foreign policy (Chart 17). Nationalism may be very nascent in Germany but it has clearly made a comeback in Japan, which exacerbates China’s fears of containment. The rise of nationalism in India is widely known and reinforces the trend. Bottom Line: Great power rivalry is intensifying because of Russia’s conflict with the West and China’s inability to reject Russia. Hypo-globalization is the result since EU-Russia and US-China economic integration cannot easily be mended in the context of great power struggle. Domestic instability in Russia, China, and the US is leading to nationalism and aggressive foreign policy, as leaders find themselves unwilling or unable to stabilize domestic politics through productive economic pursuits. Investment Takeaways BCA has shifted its House View to a neutral asset allocation stance on equities relative to bonds (Chart 18). Chart 18BCA House View: Neutral Stocks Versus Bonds
BCA House View: Neutral Stocks Versus Bonds
BCA House View: Neutral Stocks Versus Bonds
Geopolitical Strategy remains defensively positioned, favoring defensive markets and sectors, albeit with some exceptions that reflect our long-term views. Tactically stay long US 10-year Treasuries, large caps versus small caps, and defensives versus cyclicals. Stay long Mexico and short the UAE (Chart 19). Strategically stay long gold, US equities relative to global, and aerospace/defense sectors (Chart 20). Among currencies favor the USD, EUR, JPY, and GBP. Chart 19Stay Defensive In Q3 2022
Stay Defensive In Q3 2022
Stay Defensive In Q3 2022
Chart 20Stick To Long-Term Geopolitical Trades
Stick To Long-Term Geopolitical Trades
Stick To Long-Term Geopolitical Trades
Chart 21Favor Semiconductors But Not Taiwan
Favor Semiconductors But Not Taiwan
Favor Semiconductors But Not Taiwan
Chart 22Indian Tech Will Rebound Amid China's Geopolitical Risks
Indian Tech Will Rebound Amid China's Geopolitical Risks
Indian Tech Will Rebound Amid China's Geopolitical Risks
Chart 23Overweight ASEAN
Overweight ASEAN
Overweight ASEAN
Go long US semiconductors and semi equipment versus Taiwan broad market (Chart 21). While we correctly called the peak in Taiwanese stocks relative to global and EM equities, our long Korea / short Taiwan trade was the wrong way to articulate this view and remains deeply in the red. Similarly our attempt to double down on Indian tech versus Chinese tech was ill-timed. China eased tech regulations sooner than we expected. However, the long-term profile of the trade is still attractive and Chinese tech will still suffer from excessive government and foreign interference (Chart 22). Go long Singapore over Hong Kong, as Asian financial leadership continues to rotate (see Chart 5 above). Stay long ASEAN among emerging markets. We will also put Malaysia on upgrade watch, given recent Malaysian equity outperformance on the back of Chinese stimulus and growing western interest in alternatives to China (Chart 23). Matt Gertken Chief Geopolitical Strategist mattg@bcaresearch.com Strategic Themes Open Tactical Positions (0-6 Months) Open Cyclical Recommendations (6-18 Months) Regional Geopolitical Risk Matrix
Executive Summary The Fed has sought to convince one and all of its commitment to overcome high inflation and asset markets have taken heed, tightening financial conditions at a breakneck pace. As we write, the S&P 500 is down 23% year to date, the Bloomberg Barclays Treasury index is down 10%, its sister Corporate and High Yield indexes are down 15% and 12%, respectively, and the dollar had risen by 10% at its peak last week. According to Goldman Sachs’ Financial Conditions Index, the combination has amounted to a 3-percentage-point drag on GDP. Financial markets’ reaction function vis-a-vis monetary policy actions in this tightening cycle has been markedly different than in the previous three tightening cycles. Where tighter financial conditions had previously followed tighter monetary policy with a lengthy lag, they moved ahead of the Fed this time. If the recession is further away than moves in the bond, equity and foreign exchange markets imply, or if inflation eases across the rest of the year in line with our expectations, risk assets are poised to rebound. All Together Now
All Together Now
All Together Now
Bottom Line: The FOMC appears to be on course to induce a recession in its quest to bring inflation to heel. The outlook for financial markets depends on when the recession arrives and how bad it will be, however, and we see scope for positive surprises on both counts. Feature 2022 has not been a good year for financial markets and the action over the last week and a half has made it decidedly worse. In six sessions through Thursday, the S&P 500 nosedived 11%, swooning into bear market territory and unwinding nineteen months of advances. The benchmark 10-year Treasury note’s yield needed just three sessions to back up 45 basis points, from 3.05% to 3.5%. The upheaval has not been unique to the US – inflation and decelerating growth are global phenomena and central banks around the world are scrambling to tighten monetary conditions to rein in rising consumer prices while markets agonize about the effect on growth – but the Fed has been at the center of the storm and last week’s FOMC meeting inspired more swings. This week’s report highlights the most important takeaways from the latest FOMC meeting and how financial markets and Fed policy may interact going forward. There are several factors that are at least slightly different this time. Those differences may keep volatility elevated but they do not condemn stocks and bonds to continued declines. Financial markets have made huge pre-emptive moves that may be subject to reversals as inflation data improve and/or growth holds up better than expected. Prioritizing Price Stability Times have changed. Until inflation began to stir last year, the Fed had been able to prioritize the full employment element of its dual mandate for the entire post-crisis period. Chair Powell made it abundantly clear that price stability is the FOMC’s top priority now, opening his post-meeting remarks with the “overarching message” that it has the means and the will to bring inflation back down to its target level. Living up to this commitment will not be as much fun as trying to prod the economy back to full employment, and it looks as if it will ultimately result in a recession. Following 150 basis points (bps) of hikes so far this year, the target range for the fed funds rate now stands at 1.5-1.75%, and the revised Summary of Economic Projections (SEP) indicated that the median FOMC participant expects another 175 bps of hikes across the year’s remaining four meetings, bringing the funds rate to 3.25-3.5% by year end, at the low end of the money markets’ expectations range (Chart 1). Chart 1Markets And The Fed Are On The Same Page
Markets And The Fed Are On The Same Page
Markets And The Fed Are On The Same Page
During the press conference, Powell repeatedly cited the committee’s concern over rising inflation expectations, calling out the increase in 5-year inflation expectations in the University of Michigan’s preliminary June survey as “quite eye-catching.” The series rose from 30 basis points, to 3.3%, after spending the last four months at 3% and the previous ten in a tight 2.9-3.1% range. The reading was the highest since 2008, when the average national gasoline price first rose above $4 per gallon (Chart 2). Chart 2An "Eye-Catching" Move ...
An "Eye-Catching" Move ...
An "Eye-Catching" Move ...
Threading The Needle FOMC participants’ median projections for real growth, unemployment and inflation at the end of 2022, 2023 and 2024 were benign to pollyannaish, signaling their confidence that the committee will be able to thread the needle, wrestling inflation back to target while maintaining trend growth and capping the unemployment rate at 4.1%. That would meet anyone’s definition of a soft landing, but soft landings have been notoriously elusive. It is fiendishly difficult to fine-tune a complex multi-faceted economy with central bankers’ blunt tools. Empirically, every unemployment rate increase of at least one-third of a percentage point has led to a recession (Chart 3), so even the modest one-half point rise envisioned in the SEP could bring some challenges. A closer examination of past unemployment rate increases suggests a potential way around the dour history, but it depends on reversing the decline in labor force participation that is not yet fully understood. The labor force participation rate – the share of the 16-and-over population that is either working or actively looking for a job – remains more than a percentage point below its pre-pandemic level (Chart 4). If it recovered its early 2020 share, the labor force would expand by 2.8 million people. Chart 3... That Could Put Upward Pressure On The Unemployment Rate
... That Could Put Upward Pressure On The Unemployment Rate
... That Could Put Upward Pressure On The Unemployment Rate
Chart 4The Mystery Of The Missing Workers
The Mystery Of The Missing Workers
The Mystery Of The Missing Workers
If the participation rate were restored to its pre-pandemic level, the fortified labor force would allow for payroll expansion despite the unemployment rate increases envisioned in the latest SEP, as per the population growth and household-to-establishment-survey conversion rate estimates embedded in Table 1. It is reasonable to think that the expansion could continue, or the ensuing recession would be mild, despite a rising unemployment rate if payrolls manage to keep growing. An increasing unemployment rate/increasing payrolls scenario is plausible, but we cannot deem it probable when we do not know what has impeded the participation rate’s recovery. The committee is unlikely to be of one mind on the participation rate question, but it may hold the key to reconciling the sunny projections with the observed difficulty of achieving a soft landing. Table 1A Path To A Soft Landing
One Overarching Message, Multiple Potential Outcomes
One Overarching Message, Multiple Potential Outcomes
We’ll Take The Over We agree with Chair Powell and the FOMC’s assessment that solid consumer balance sheets and robust job gains have the economy on a sound footing, despite slowing growth. We do not see familiar underlying vulnerabilities that herald a reversal like an overreliance on debt, broad supply overhangs or an investment boom that has gone on too long. Inflation is the signal problem in the US and the rest of the world, and we continue to expect that it will recede in the second half as supply constraints in pandemic-squeezed segments ease and the pre-emptive backup in yields holds back some marginal demand for big-ticket items that require financing. No one knows the equilibrium fed funds rate in real time, but Powell indicated the committee thinks it’s around 3.5%, placing the year end 2022 median funds rate dot just shy of equilibrium and the median 2023 dot in modestly restrictive territory. A recession is the likely outcome of the rate hike campaign, but if the target rate doesn’t exceed the equilibrium rate until early next year, it may not begin until the middle of 2023 or early in 2024. Given that the consensus view now appears to be that a recession will begin this year if it hasn’t done so already, and financial markets have gone a long way toward pricing in its effects, we don’t see much upside to joining the bearish chorus now. We’ll take the over on the recession-by-year-end proposition. The Big Difference This Time When asked how high the funds rate has to go to arrest inflation, Powell offered the following description of how rate hikes work. “I … look at it this way: We move the policy rate that affects financial conditions, and that affects the economy. We have [more] rigorous ways to think about it, but ultimately it comes down to, ‘do we think financial conditions are in a place where they’re having the desired effect on the economy?’ And that desired effect is we’d like to see demand moderating.” Related Report US Investment StrategyInflation And Investing Two questions later, he approvingly noted how much bang the committee had already gotten for its buck to this point in the tightening campaign. “[T]his year has been a demonstration of how well [guidance] can work. With us having … done very little in the way of raising interest rates, financial conditions have tightened quite significantly through the expectations channel, as we’ve made clear what our plans are. I think that’s been … very healthy[.]” We stay away from making value judgments about policy, though we can see that a central banker would be in favor of anything that shortens the lag between policy actions and their economic effect. It is immediately obvious, however, that the current rate hike campaign’s real-time impact on financial conditions contrasts sharply with the last three decades’ campaigns (Chart 5). Every one-point change in the Goldman Sachs Financial Conditions Index (FCI) is calibrated to correspond to a one-percentage-point change in real GDP. The FOMC hiked by 175 bps ahead of the 2001 recession and the FCI eventually rose four points, peaking in October 2002, 29 months after the FOMC pushed fed funds to its terminal rate and 21 after it began cutting rates. After the 2004-6 “conundrum” campaign, when financial conditions eased despite 17 consecutive quarter-point rate hikes, the FCI tightened by five points, reaching its peak almost three years after the last hike and 18 months after the first cut. Chart 5Seize The Day
Seize The Day
Seize The Day
Chart 6Decoupling
Decoupling
Decoupling
Some of the response is a simple reflection of the about-face in the inflation backdrop. As our Chief Emerging Markets Strategist Arthur Budaghyan predicted in February 2021, Treasury yields and stock prices have flipped from several decades of positive correlation (rising stock prices offset falling bond valuations and vice versa) in a disinflationary environment to negative correlation in an inflationary environment. Now that Treasury bond, corporate bond and stock prices have been falling together, and the safe-haven dollar has risen amidst the general flight from risk, all of the FCI’s subcomponents have been reinforcing one another, making the index jumpier. More volatile financial conditions raise the probability of overshoots. To wit, has the FCI moved too far, too soon? The volcanic upward move in the 10-year Treasury yield has severed its reliable empirical link with the gold-to-commodity ratio (Chart 6, top panel) and the relative performance of cyclical and defensive equity sectors (Chart 6, bottom panel). They suggest a retracement could be in store. Projected policy rate differentials between the Fed and other currency majors’ central banks are narrowing as monetary policy makers rush to combat inflation. Gloom about growth is widespread. Any positive global growth surprise, from China regarding COVID or stimulus, from the Ukrainian theater, or from supply chain relief, could reel in the extended dollar. Investors should not lose sight of the potential that the coming recession could be mild. A 25% selloff in the S&P 500 may be nearly enough to address that outcome. As of Thursday’s close, the index’s forward four-quarter multiple was down to 15.5 from just under 22 at the start of the year – stocks were expensive, but the nearly 30% de-rating haircut has been severe. The 15.5 multiple assumes the next four quarters’ earnings grow almost 10% year-over-year, which looks ambitious. 5% growth would yield a 16.2 multiple, while no growth would price stocks at 17 times. Those multiples are not cheap, but a lot of froth has come out of the equity market. Against the gloom that has taken over financial markets, we think the next twelve months can be rewarding for investors in risk assets. We are alert to the principal ways our constructive view could be proven wrong and will change our view if it is invalidated by the evidence, but we remain overweight equities in a multi-asset portfolio over the cyclical three-to-twelve-month timeframe. Doug Peta, CFA Chief US Investment Strategist dougp@bcaresearch.com