China

Executive Summary The Excess Return Of Corporate Bonds Is Driven By Corporate Profits
The Excess Return Of Corporate Bonds Is Driven By Corporate Profits
The Excess Return Of Corporate Bonds Is Driven By Corporate Profits
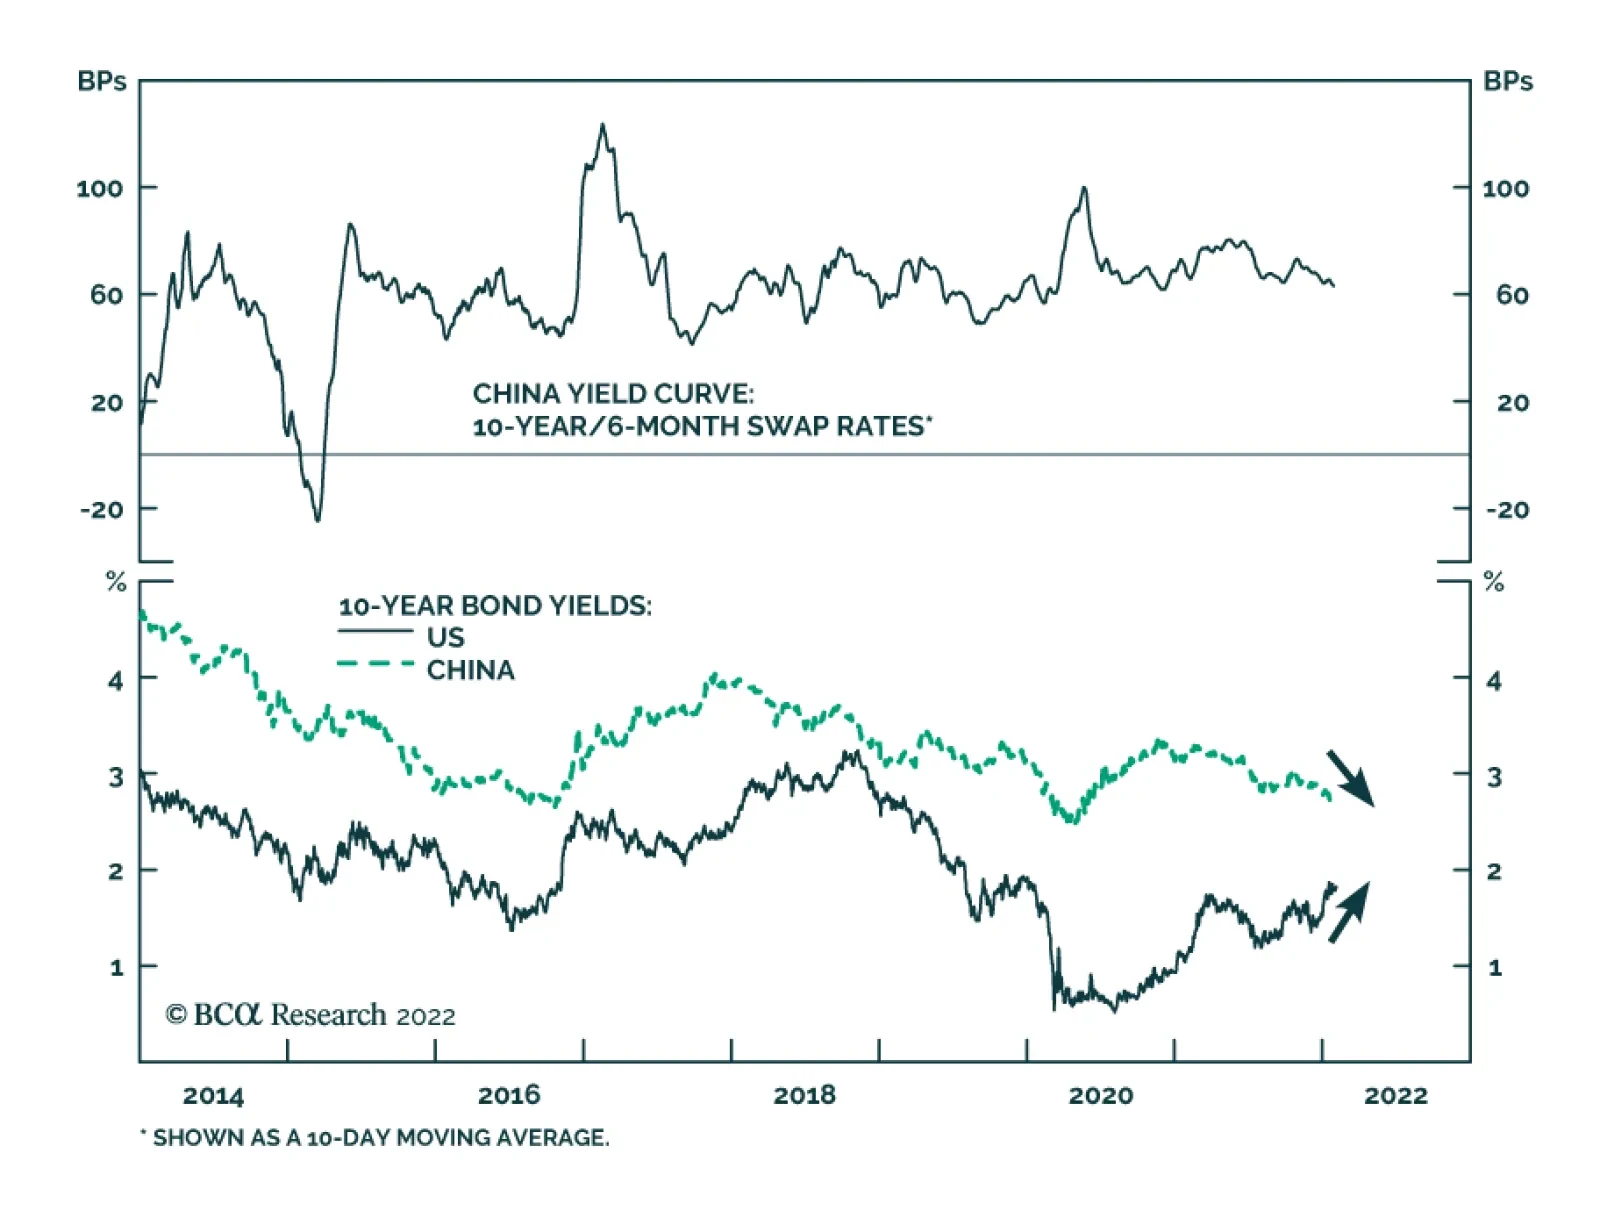
Given that a sustainable business cycle acceleration in China is unlikely in the short term, onshore government bond yields will likely drop further. In the long run, odds are that Chinese government bond yields will drop below US Treasury yields. For domestic asset allocators, we continue to recommend overweighting government bonds over stocks for now. The excess return of corporate bonds is driven by the corporate profit cycle. On a volatility-adjusted basis, the total return on equities exceeds the excess return on corporate bonds during periods when economic growth is accelerating and underperforms during deceleration phases. Bottom Line: Given our view that a meaningful growth recovery in China will only be a theme for the second half of this year, onshore asset allocators should continue favoring corporate credit over stocks and government bonds over corporate bonds. The bear market in Chinese offshore corporate credit might be in its late stages but it is not yet over. Feature In this report we (1) elaborate on our outlook for Chinese government and corporate bonds and (2) offer a framework for understanding how asset allocation for fixed-income (government and corporate bonds) and multi-asset portfolios (comprised of fixed-income plus equities) should be implemented. Domestic Government Bonds Chart 1Chinese Bond Yields Have Bucked The Global Trend
Chinese Bond Yields Have Bucked The Global Trend
Chinese Bond Yields Have Bucked The Global Trend
The risk-reward profile of Chinese domestic government bonds remains attractive. Chinese government bond yields have been declining, bucking the global trend of surging government bond yields (Chart 1, top panel). Odds are that Chinese bond yields will drop further, both cyclically and structurally: In contrast with the Americas and Europe, China’s consumer price inflation has remained subdued. Its core, trimmed mean and headline inflation rates have remained low (Chart 2). The ongoing growth slump will cap core inflation in China at around 1%, allowing monetary authorities to lower interest rates further. Real bond yields in China remain well above those in the majority of DM (Chart 1, bottom panel). Hence, risk-free bonds in China offer value. As to the Chinese stimulus and business cycle, the recent pickup in Chinese credit numbers has been entirely due to local government bond issuance. After excluding local government bonds, credit growth and its impulse have not improved (Chart 3). While infrastructure spending will pick up in the coming months (given large special bond issuance), sentiment among consumers and private companies remains downbeat and local government budgets are severely impaired by the collapse in revenues from land sales. Hence, it will take some time before a boost in infrastructure activity lifts broader business and consumer sentiment such that a sustainable economic recovery can take hold. Chart 2Chinese Consumer Price Inflation Is Subdued
Chinese Consumer Price Inflation Is Subdued
Chinese Consumer Price Inflation Is Subdued
Chart 3Recent Credit Improvement Is Entirely Due to Local Government Bond Issuance
Recent Credit Improvement Is EntirelyDue to Local Government Bond Issuance
Recent Credit Improvement Is EntirelyDue to Local Government Bond Issuance
The special bond quota for Q1 stands at RMB 1.46 trillion and is equivalent to 28% of local government aggregate quarterly revenue. Even though the special bond issuance in Q1 is massive, it will be largely offset by the drop in local governments’ land sales revenue. The latter is shrinking and makes up more than 40% of local government aggregate revenues. In brief, strong headwinds from the property market in the form of shrinking land sales might counteract the increase from front-loaded special bond issuance in Q1 2022. As to real estate construction, funding for property developers is down dramatically from a year ago (Chart 4). In the absence of financing, real estate developers will shrink construction volumes in the months ahead. Chart 5Debt Service Burden For Chinese Enterprises And Households Is High
Debt Service Burden For Chinese Enterprises And Household Is High
Debt Service Burden For Chinese Enterprises And Household Is High
Chart 4Property Completions Will Roll Over
Property Completions Will Roll Over
Property Completions Will Roll Over
Structurally, high enterprise and household debt levels in China amid slumping incomes mean that borrowing costs should drop to facilitate debt servicing. BIS estimates that debt service costs for the private sector (enterprises and households) in China are 21% of disposable income, much higher than in many other economies (Chart 5). Finally, China’s large and persistent current account surpluses mean that the nation is a major international creditor rather than a debtor. Thus, China does not need to offer high yields to attract foreign capital. Structurally speaking, foreign fixed-income inflows into Chinese domestic bonds will likely continue. Chart 6Credit Cycle And Government Bond Yields
Credit Cycle And Government Bond Yields
Credit Cycle And Government Bond Yields
Bottom Line: Bond yields will likely drop further as a sustainable business cycle acceleration in China is unlikely in the short term. Chart 6 illustrates that the total social financing impulse leads bond yields by nine months and a cyclical bottom in yields will probably occur a few months from now. In the long run, Chinese government bonds yields will likely drop below US Treasury yields. Onshore Corporate Bonds The proper measure of corporate bond performance is excess return over similar government bonds (herein excess return). The basis for using excess return instead of total return for corporate bonds is because investors can attain government bond return by purchasing them outright. Essentially, investors prefer corporate bonds over government bonds because of credit spreads. Hence, a corporate bond performance assessment – whether in absolute terms or relative to other asset classes – should be based on excess return. In China, the excess return on onshore corporate bonds1 usually moves in tandem with the business cycle and government bond yields. In particular: The excess return of corporate bonds is positive during periods of growth acceleration and negative during slowdowns (Chart 7, top panel). The middle panel of Chart 7 illustrates that the excess return of corporate bonds correlates with analysts’ net EPS revisions for onshore listed companies. This confirms the above point that corporate bonds correlate with the profit/business cycle. Significantly, even though industrial profit growth is not yet negative (Chart 8, top panel), earnings in commodity-user industries have crashed (Chart 8, bottom panel). This explains the negative excess return for onshore corporate bonds in the past 12 months. Chart 7The Excess Return Of Corporate Bonds Is Driven By Corporate Profits
The Excess Return Of Corporate Bonds Is Driven By Corporate Profits
The Excess Return Of Corporate Bonds Is Driven By Corporate Profits
Chart 8Corporate Profit Cycle: Mind The Divergence
Corporate Profit Cycle: Mind The Divergency
Corporate Profit Cycle: Mind The Divergency
Furthermore, the excess return of corporate bonds declines and rises with interest rate expectations (Chart 7, bottom panel). As the outlook for corporate profits remains sour, fixed-income investors should continue to favor government bonds over corporate bonds. Now, how do corporate bonds perform versus stocks? What drives their relative performance? To compare stock performance to corporate bond excess return, one should adjust for volatility. In other words, share prices are much more volatile than the excess return on corporate bonds. Hence, during risk-on periods equities always outperform corporate bonds and vice versa. Chart 9The Performance of Stocks over Corporate Bonds is Very Pro-Cyclical
The Performance of Stocks over Corporate Bonds is Very Pro-Cyclical
The Performance of Stocks over Corporate Bonds is Very Pro-Cyclical
Chart 9 demonstrates that even on a volatility-adjusted basis, the total return on equities exceeds the excess return on corporate bonds during periods when economic growth is accelerating and underperforms during deceleration phases. In short, the performance of stocks over corporate bonds is very pro-cyclical. Bottom Line: The excess return of corporate bonds is driven by corporate revenue and profits rather than by interest rate expectations. Getting China’s business cycle right is critical to the allocation between government and corporate bonds in fixed-income portfolios and to the allocation between corporate bonds and equities in multi-asset portfolios. Given our view that a meaningful growth recovery in China will only be a theme in the second half of this year, onshore asset allocators should continue favoring corporate bonds over stocks and government bonds over corporate credit. Offshore Corporate Bonds What drives the excess return of Chinese USD corporate bonds in absolute terms as well as versus Chinese non-TMT investable stocks2 and onshore corporate bonds? Given that the offshore corporate bond universe is dominated by property developers, their excess return correlates with perceived risks to the mainland property market in general and the financial health of property developers in particular (Chart 10, top panel). Property developers are very overleveraged, their sales are shrinking and their financing has dried up. Yet, authorities are compelling them to complete construction of their pre-sold housing. Property developers will therefore continue to experience financial distress. Odds are that bond prices of corporate developers – both investment grade and high yield - will continue falling (Chart 10, middle and bottom panels). Chart 11Investable Stocks Vs. Offshore Corporate Credit: Volatility-Adjusted Performance
Investable Stocks Vs. Offshore Coporate Credit: Volatility-Adjusted Performance
Investable Stocks Vs. Offshore Coporate Credit: Volatility-Adjusted Performance
Chart 10A Massive Bear Market In Offshore Corporate Bonds
A Massive Bear Market In Offshore Corporate Bonds
A Massive Bear Market In Offshore Corporate Bonds
On a volatility-adjusted basis, non-TMT investable stocks outpace the excess return of offshore corporate bonds during periods of growth improvement and underperform during growth slowdowns (Chart 11, top panel). The same pattern holds true when it comes to the performance of offshore corporate bond versus the aggregate MSCI Investable equity index (including TMT stocks) (Chart 11, bottom panel). The credit cycle leads the business cycle and, thereby, it leads these financial market trends. Bottom Line: The bear market in Chinese offshore corporate credit might be in its late stages but it is not yet over. Chinese offshore corporate bonds will continue underperforming EM corporate bonds as well as Chinese onshore corporate bonds. Investment Recommendations Investors often read market signals across asset classes to gauge which market moves will persist and which ones will be short-lived. In this regard, we have two observations for Chinese onshore markets: Chart 12Moving In Tandem
Moving In Tandem
Moving In Tandem
The sustainability of an equity rally is higher when it is confirmed by rising excess returns of corporate bonds and rising government bond yields (Chart 12). Presently, there is no strong signal to switch from government bonds to either corporate bonds or stocks. Unfortunately, the yield curve in China does not correlate with its business cycle and, hence, cannot be used as a tool in macro analysis. Our key investment conclusions are: For fixed-income investors, we continue to recommend receiving 10-year swap rates in China and for dedicated EM local currency bond managers to remain overweight China. The renminbi has been firm versus the US dollar despite a considerable narrowing in the interest rate differential between China and the US. In the long run, the real interest rate differential between China and the US will drive the exchange rate, and it will favor the RMB. While US real bond yields might rise relative to Chinese bond yields in the coming months, triggering a period of yuan softness, it will prove to be transitory. The basis is that the Federal Reserve is very sensitive to asset prices. As US share prices decline and corporate spreads widen, the central bank will eventually turn dovish and will lag behind the inflation curve. When a central bank falls behind the inflation curve, real rates stay low and its currency depreciates. Chart 13China’s Stock-to-Bond Ratio
China"s Stock-to-Bond Ratio
China"s Stock-to-Bond Ratio
For domestic asset allocators, we continue to recommend favoring government bonds over stocks (Chart 13). Within fixed-income portfolios, investors should overweight government bonds over corporate bonds. Finally, corporate bonds will fare better than equities in the near term. In a few months there will be an opportunity to shift these positions. More aggressive stimulus from authorities and aggressive property market relaxation measures will create conditions for an improvement in domestic demand. Finally, the risk-reward profile for offshore USD corporate bonds remains unattractive. Chinese offshore corporate credit will continue underperforming EM USD corporate credit as well as Chinese onshore corporate bonds. Arthur Budaghyan Chief Emerging Markets Strategist arthurb@bcaresearch.com Footnotes 1 Due to the lack of excess return data from the index provider (Bloomberg Barclays onshore bond indexes), we calculated the excess return on onshore corporate bonds as the ratio of the total return on the corporate bond index divided by the total return on the government bond index. This measure is not ideal as it does not account for duration mismatches between the corporate and government bond indexes. However, the key conclusions of this report will hold true for the duration-adjusted excess return not least because this framework is valid for financial markets in the US and Europe. 2 The reason to compare it to non-TMT (technology, media and telecommunication, i.e., Chinese tech and internet stocks) is that offshore corporate bond issuers are largely old economy industries.
Executive Summary The Excess Return Of Corporate Bonds Is Driven By Corporate Profits
The Excess Return Of Corporate Bonds Is Driven By Corporate Profits
The Excess Return Of Corporate Bonds Is Driven By Corporate Profits
Given that a sustainable business cycle acceleration in China is unlikely in the short term, onshore government bond yields will likely drop further. In the long run, odds are that Chinese government bond yields will drop below US Treasury yields. For domestic asset allocators, we continue to recommend overweighting government bonds over stocks for now. The excess return of corporate bonds is driven by the corporate profit cycle. On a volatility-adjusted basis, the total return on equities exceeds the excess return on corporate bonds during periods when economic growth is accelerating and underperforms during deceleration phases. Bottom Line: Given our view that a meaningful growth recovery in China will only be a theme for the second half of this year, onshore asset allocators should continue favoring corporate credit over stocks and government bonds over corporate bonds. The bear market in Chinese offshore corporate credit might be in its late stages but it is not yet over. Feature In this report we (1) elaborate on our outlook for Chinese government and corporate bonds and (2) offer a framework for understanding how asset allocation for fixed-income (government and corporate bonds) and multi-asset portfolios (comprised of fixed-income plus equities) should be implemented. Domestic Government Bonds Chart 1Chinese Bond Yields Have Bucked The Global Trend
Chinese Bond Yields Have Bucked The Global Trend
Chinese Bond Yields Have Bucked The Global Trend
The risk-reward profile of Chinese domestic government bonds remains attractive. Chinese government bond yields have been declining, bucking the global trend of surging government bond yields (Chart 1, top panel). Odds are that Chinese bond yields will drop further, both cyclically and structurally: In contrast with the Americas and Europe, China’s consumer price inflation has remained subdued. Its core, trimmed mean and headline inflation rates have remained low (Chart 2). The ongoing growth slump will cap core inflation in China at around 1%, allowing monetary authorities to lower interest rates further. Real bond yields in China remain well above those in the majority of DM (Chart 1, bottom panel). Hence, risk-free bonds in China offer value. As to the Chinese stimulus and business cycle, the recent pickup in Chinese credit numbers has been entirely due to local government bond issuance. After excluding local government bonds, credit growth and its impulse have not improved (Chart 3). While infrastructure spending will pick up in the coming months (given large special bond issuance), sentiment among consumers and private companies remains downbeat and local government budgets are severely impaired by the collapse in revenues from land sales. Hence, it will take some time before a boost in infrastructure activity lifts broader business and consumer sentiment such that a sustainable economic recovery can take hold. Chart 2Chinese Consumer Price Inflation Is Subdued
Chinese Consumer Price Inflation Is Subdued
Chinese Consumer Price Inflation Is Subdued
Chart 3Recent Credit Improvement Is Entirely Due to Local Government Bond Issuance
Recent Credit Improvement Is EntirelyDue to Local Government Bond Issuance
Recent Credit Improvement Is EntirelyDue to Local Government Bond Issuance
The special bond quota for Q1 stands at RMB 1.46 trillion and is equivalent to 28% of local government aggregate quarterly revenue. Even though the special bond issuance in Q1 is massive, it will be largely offset by the drop in local governments’ land sales revenue. The latter is shrinking and makes up more than 40% of local government aggregate revenues. In brief, strong headwinds from the property market in the form of shrinking land sales might counteract the increase from front-loaded special bond issuance in Q1 2022. As to real estate construction, funding for property developers is down dramatically from a year ago (Chart 4). In the absence of financing, real estate developers will shrink construction volumes in the months ahead. Chart 5Debt Service Burden For Chinese Enterprises And Households Is High
Debt Service Burden For Chinese Enterprises And Household Is High
Debt Service Burden For Chinese Enterprises And Household Is High
Chart 4Property Completions Will Roll Over
Property Completions Will Roll Over
Property Completions Will Roll Over
Structurally, high enterprise and household debt levels in China amid slumping incomes mean that borrowing costs should drop to facilitate debt servicing. BIS estimates that debt service costs for the private sector (enterprises and households) in China are 21% of disposable income, much higher than in many other economies (Chart 5). Finally, China’s large and persistent current account surpluses mean that the nation is a major international creditor rather than a debtor. Thus, China does not need to offer high yields to attract foreign capital. Structurally speaking, foreign fixed-income inflows into Chinese domestic bonds will likely continue. Chart 6Credit Cycle And Government Bond Yields
Credit Cycle And Government Bond Yields
Credit Cycle And Government Bond Yields
Bottom Line: Bond yields will likely drop further as a sustainable business cycle acceleration in China is unlikely in the short term. Chart 6 illustrates that the total social financing impulse leads bond yields by nine months and a cyclical bottom in yields will probably occur a few months from now. In the long run, Chinese government bonds yields will likely drop below US Treasury yields. Onshore Corporate Bonds The proper measure of corporate bond performance is excess return over similar government bonds (herein excess return). The basis for using excess return instead of total return for corporate bonds is because investors can attain government bond return by purchasing them outright. Essentially, investors prefer corporate bonds over government bonds because of credit spreads. Hence, a corporate bond performance assessment – whether in absolute terms or relative to other asset classes – should be based on excess return. In China, the excess return on onshore corporate bonds1 usually moves in tandem with the business cycle and government bond yields. In particular: The excess return of corporate bonds is positive during periods of growth acceleration and negative during slowdowns (Chart 7, top panel). The middle panel of Chart 7 illustrates that the excess return of corporate bonds correlates with analysts’ net EPS revisions for onshore listed companies. This confirms the above point that corporate bonds correlate with the profit/business cycle. Significantly, even though industrial profit growth is not yet negative (Chart 8, top panel), earnings in commodity-user industries have crashed (Chart 8, bottom panel). This explains the negative excess return for onshore corporate bonds in the past 12 months. Chart 7The Excess Return Of Corporate Bonds Is Driven By Corporate Profits
The Excess Return Of Corporate Bonds Is Driven By Corporate Profits
The Excess Return Of Corporate Bonds Is Driven By Corporate Profits
Chart 8Corporate Profit Cycle: Mind The Divergence
Corporate Profit Cycle: Mind The Divergency
Corporate Profit Cycle: Mind The Divergency
Furthermore, the excess return of corporate bonds declines and rises with interest rate expectations (Chart 7, bottom panel). As the outlook for corporate profits remains sour, fixed-income investors should continue to favor government bonds over corporate bonds. Now, how do corporate bonds perform versus stocks? What drives their relative performance? To compare stock performance to corporate bond excess return, one should adjust for volatility. In other words, share prices are much more volatile than the excess return on corporate bonds. Hence, during risk-on periods equities always outperform corporate bonds and vice versa. Chart 9The Performance of Stocks over Corporate Bonds is Very Pro-Cyclical
The Performance of Stocks over Corporate Bonds is Very Pro-Cyclical
The Performance of Stocks over Corporate Bonds is Very Pro-Cyclical
Chart 9 demonstrates that even on a volatility-adjusted basis, the total return on equities exceeds the excess return on corporate bonds during periods when economic growth is accelerating and underperforms during deceleration phases. In short, the performance of stocks over corporate bonds is very pro-cyclical. Bottom Line: The excess return of corporate bonds is driven by corporate revenue and profits rather than by interest rate expectations. Getting China’s business cycle right is critical to the allocation between government and corporate bonds in fixed-income portfolios and to the allocation between corporate bonds and equities in multi-asset portfolios. Given our view that a meaningful growth recovery in China will only be a theme in the second half of this year, onshore asset allocators should continue favoring corporate bonds over stocks and government bonds over corporate credit. Offshore Corporate Bonds What drives the excess return of Chinese USD corporate bonds in absolute terms as well as versus Chinese non-TMT investable stocks2 and onshore corporate bonds? Given that the offshore corporate bond universe is dominated by property developers, their excess return correlates with perceived risks to the mainland property market in general and the financial health of property developers in particular (Chart 10, top panel). Property developers are very overleveraged, their sales are shrinking and their financing has dried up. Yet, authorities are compelling them to complete construction of their pre-sold housing. Property developers will therefore continue to experience financial distress. Odds are that bond prices of corporate developers – both investment grade and high yield - will continue falling (Chart 10, middle and bottom panels). Chart 11Investable Stocks Vs. Offshore Corporate Credit: Volatility-Adjusted Performance
Investable Stocks Vs. Offshore Coporate Credit: Volatility-Adjusted Performance
Investable Stocks Vs. Offshore Coporate Credit: Volatility-Adjusted Performance
Chart 10A Massive Bear Market In Offshore Corporate Bonds
A Massive Bear Market In Offshore Corporate Bonds
A Massive Bear Market In Offshore Corporate Bonds
On a volatility-adjusted basis, non-TMT investable stocks outpace the excess return of offshore corporate bonds during periods of growth improvement and underperform during growth slowdowns (Chart 11, top panel). The same pattern holds true when it comes to the performance of offshore corporate bond versus the aggregate MSCI Investable equity index (including TMT stocks) (Chart 11, bottom panel). The credit cycle leads the business cycle and, thereby, it leads these financial market trends. Bottom Line: The bear market in Chinese offshore corporate credit might be in its late stages but it is not yet over. Chinese offshore corporate bonds will continue underperforming EM corporate bonds as well as Chinese onshore corporate bonds. Investment Recommendations Investors often read market signals across asset classes to gauge which market moves will persist and which ones will be short-lived. In this regard, we have two observations for Chinese onshore markets: Chart 12Moving In Tandem
Moving In Tandem
Moving In Tandem
The sustainability of an equity rally is higher when it is confirmed by rising excess returns of corporate bonds and rising government bond yields (Chart 12). Presently, there is no strong signal to switch from government bonds to either corporate bonds or stocks. Unfortunately, the yield curve in China does not correlate with its business cycle and, hence, cannot be used as a tool in macro analysis. Our key investment conclusions are: For fixed-income investors, we continue to recommend receiving 10-year swap rates in China and for dedicated EM local currency bond managers to remain overweight China. The renminbi has been firm versus the US dollar despite a considerable narrowing in the interest rate differential between China and the US. In the long run, the real interest rate differential between China and the US will drive the exchange rate, and it will favor the RMB. While US real bond yields might rise relative to Chinese bond yields in the coming months, triggering a period of yuan softness, it will prove to be transitory. The basis is that the Federal Reserve is very sensitive to asset prices. As US share prices decline and corporate spreads widen, the central bank will eventually turn dovish and will lag behind the inflation curve. When a central bank falls behind the inflation curve, real rates stay low and its currency depreciates. Chart 13China’s Stock-to-Bond Ratio
China"s Stock-to-Bond Ratio
China"s Stock-to-Bond Ratio
For domestic asset allocators, we continue to recommend favoring government bonds over stocks (Chart 13). Within fixed-income portfolios, investors should overweight government bonds over corporate bonds. Finally, corporate bonds will fare better than equities in the near term. In a few months there will be an opportunity to shift these positions. More aggressive stimulus from authorities and aggressive property market relaxation measures will create conditions for an improvement in domestic demand. Finally, the risk-reward profile for offshore USD corporate bonds remains unattractive. Chinese offshore corporate credit will continue underperforming EM USD corporate credit as well as Chinese onshore corporate bonds. Arthur Budaghyan Chief Emerging Markets Strategist arthurb@bcaresearch.com Footnotes 1 Due to the lack of excess return data from the index provider (Bloomberg Barclays onshore bond indexes), we calculated the excess return on onshore corporate bonds as the ratio of the total return on the corporate bond index divided by the total return on the government bond index. This measure is not ideal as it does not account for duration mismatches between the corporate and government bond indexes. However, the key conclusions of this report will hold true for the duration-adjusted excess return not least because this framework is valid for financial markets in the US and Europe. 2 The reason to compare it to non-TMT (technology, media and telecommunication, i.e., Chinese tech and internet stocks) is that offshore corporate bond issuers are largely old economy industries.
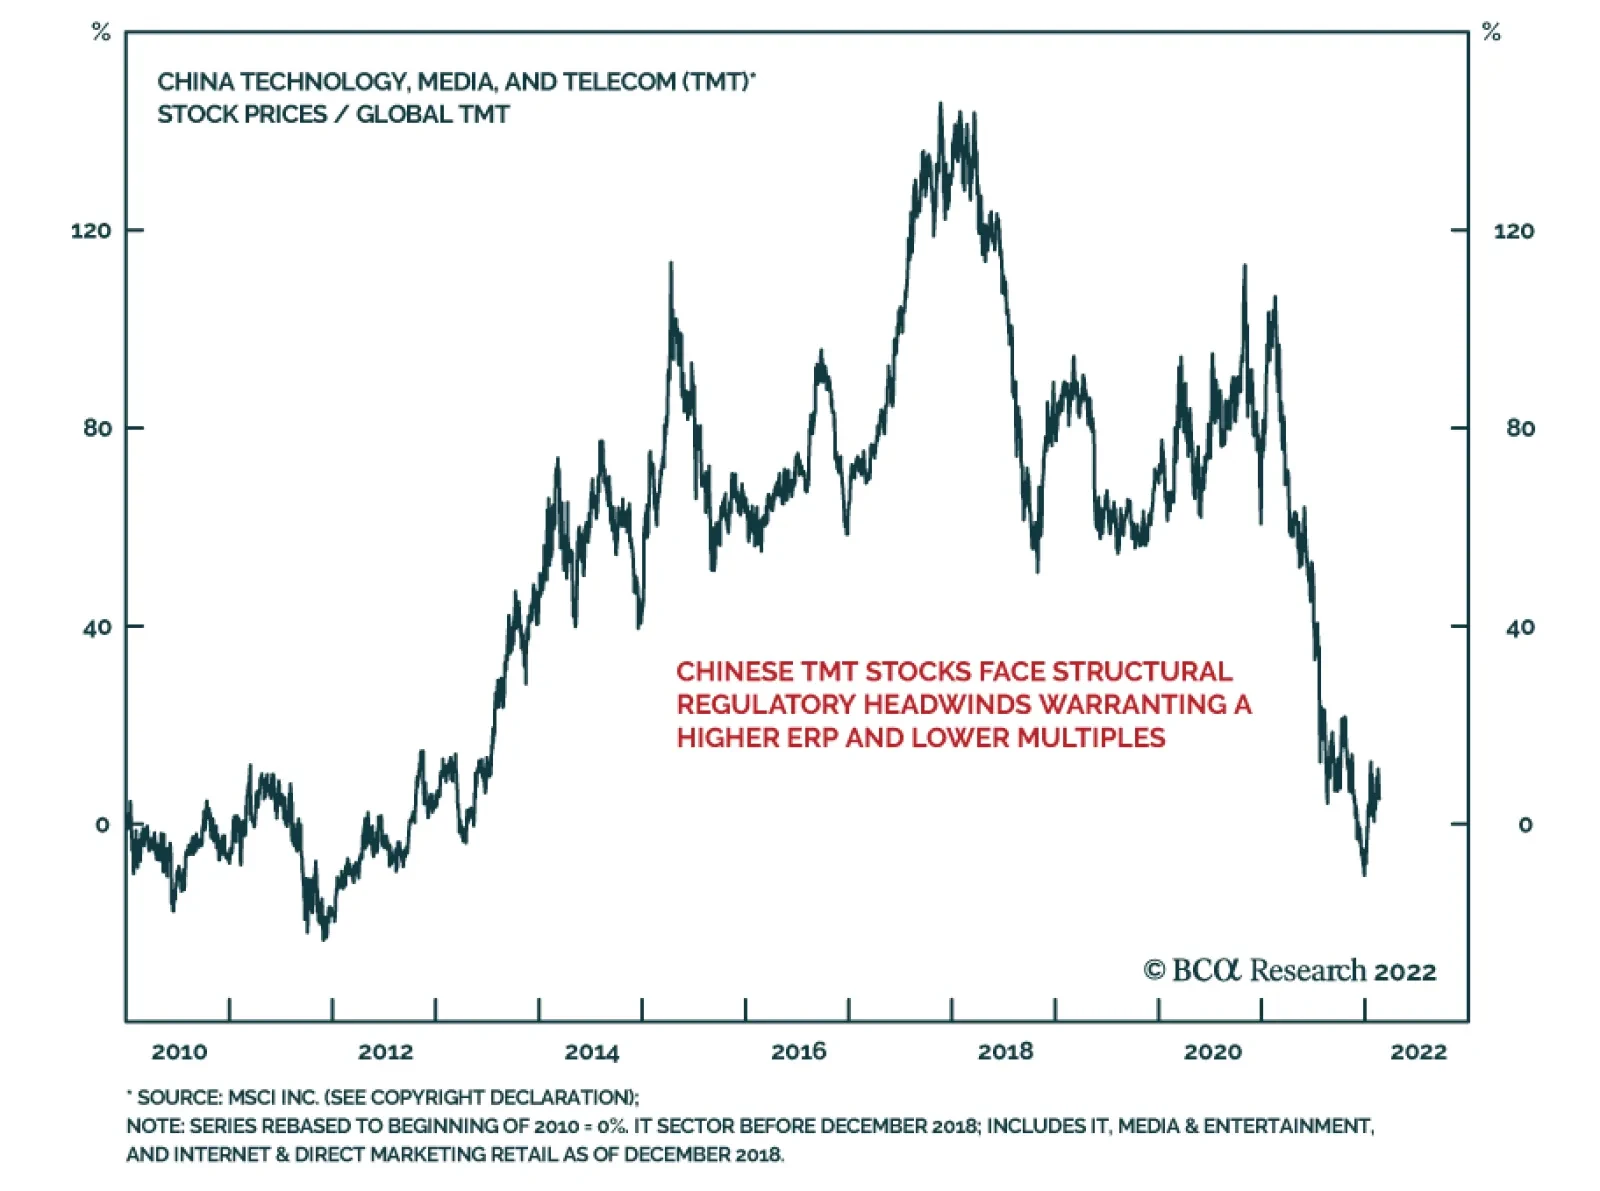
Chinese authorities have asked state-owned firms and banks to closely examine their exposure to Ant Group and report their findings as soon as possible. The move highlights that the regulatory clampdown on Chinese companies operating in the technology, media,…
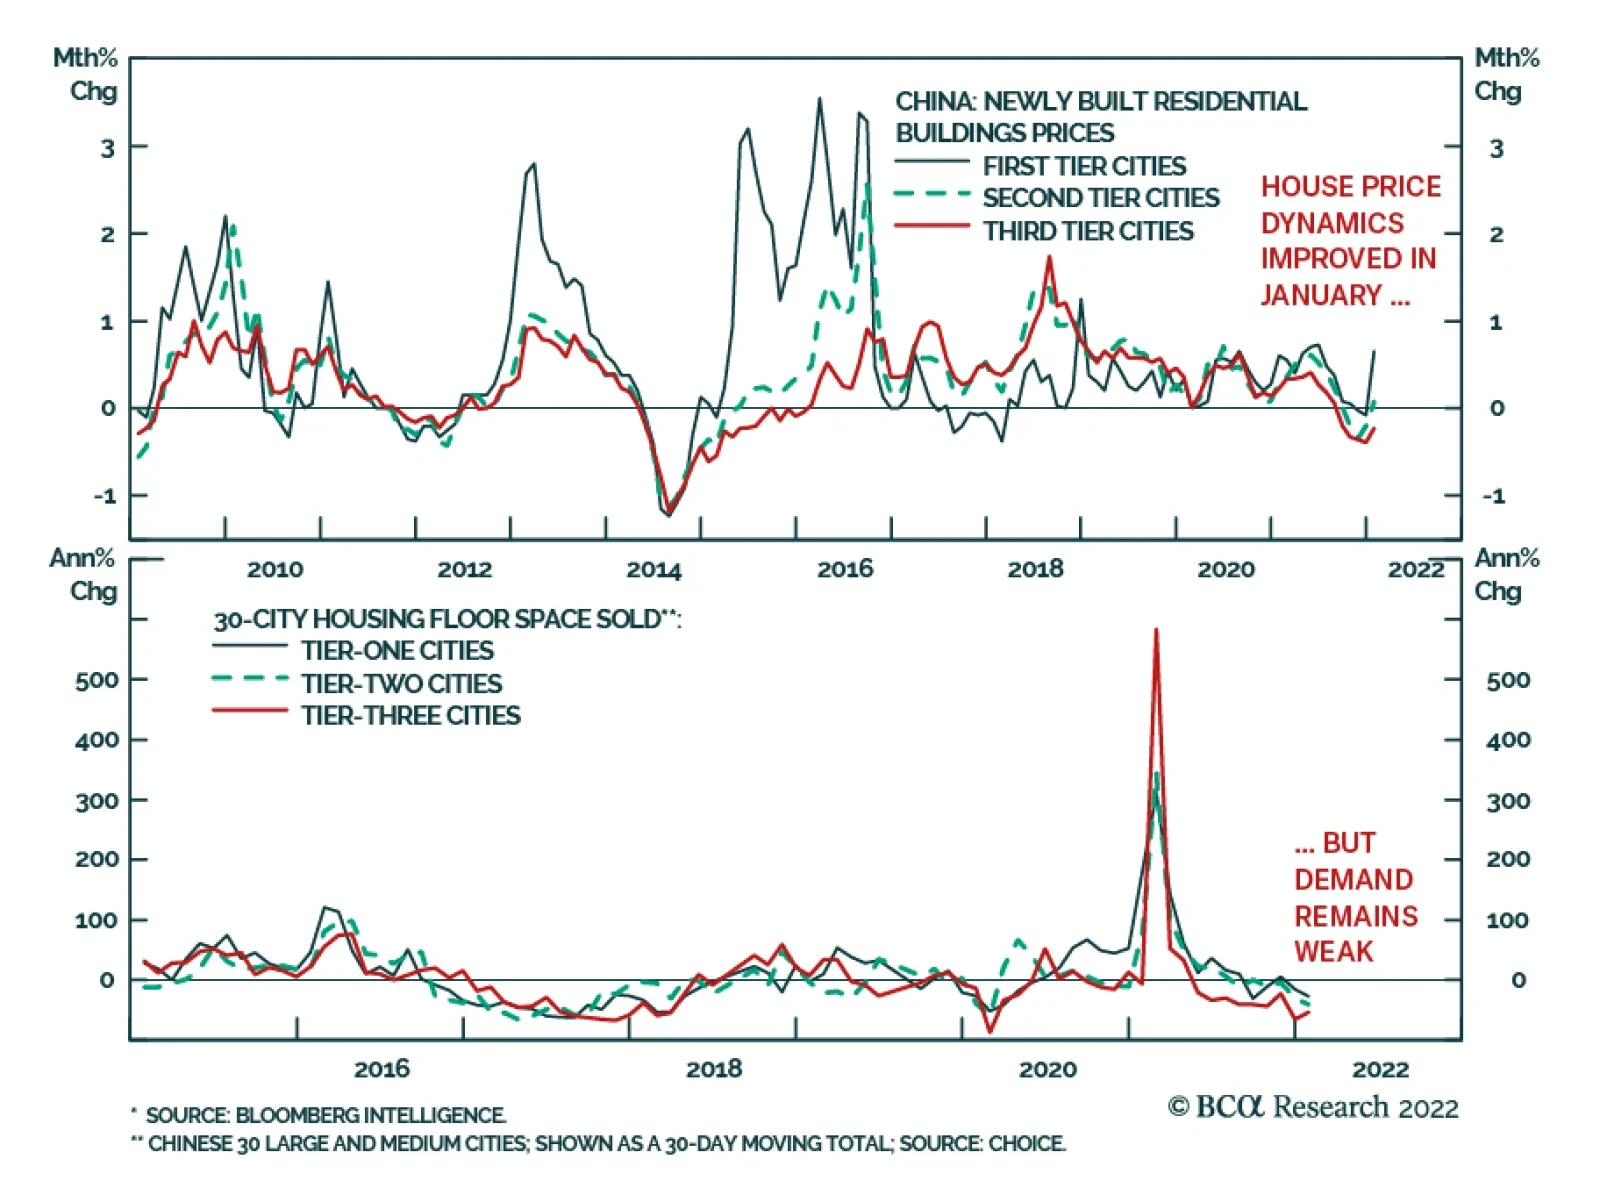
China’s 70-city monthly average new home prices were broadly flat in January at -0.04% m/m following four consecutive months of falling prices. The underlying data show a bifurcation whereby new home prices in Tier 1 and Tier 2 cities increased by 0.65% m/m…
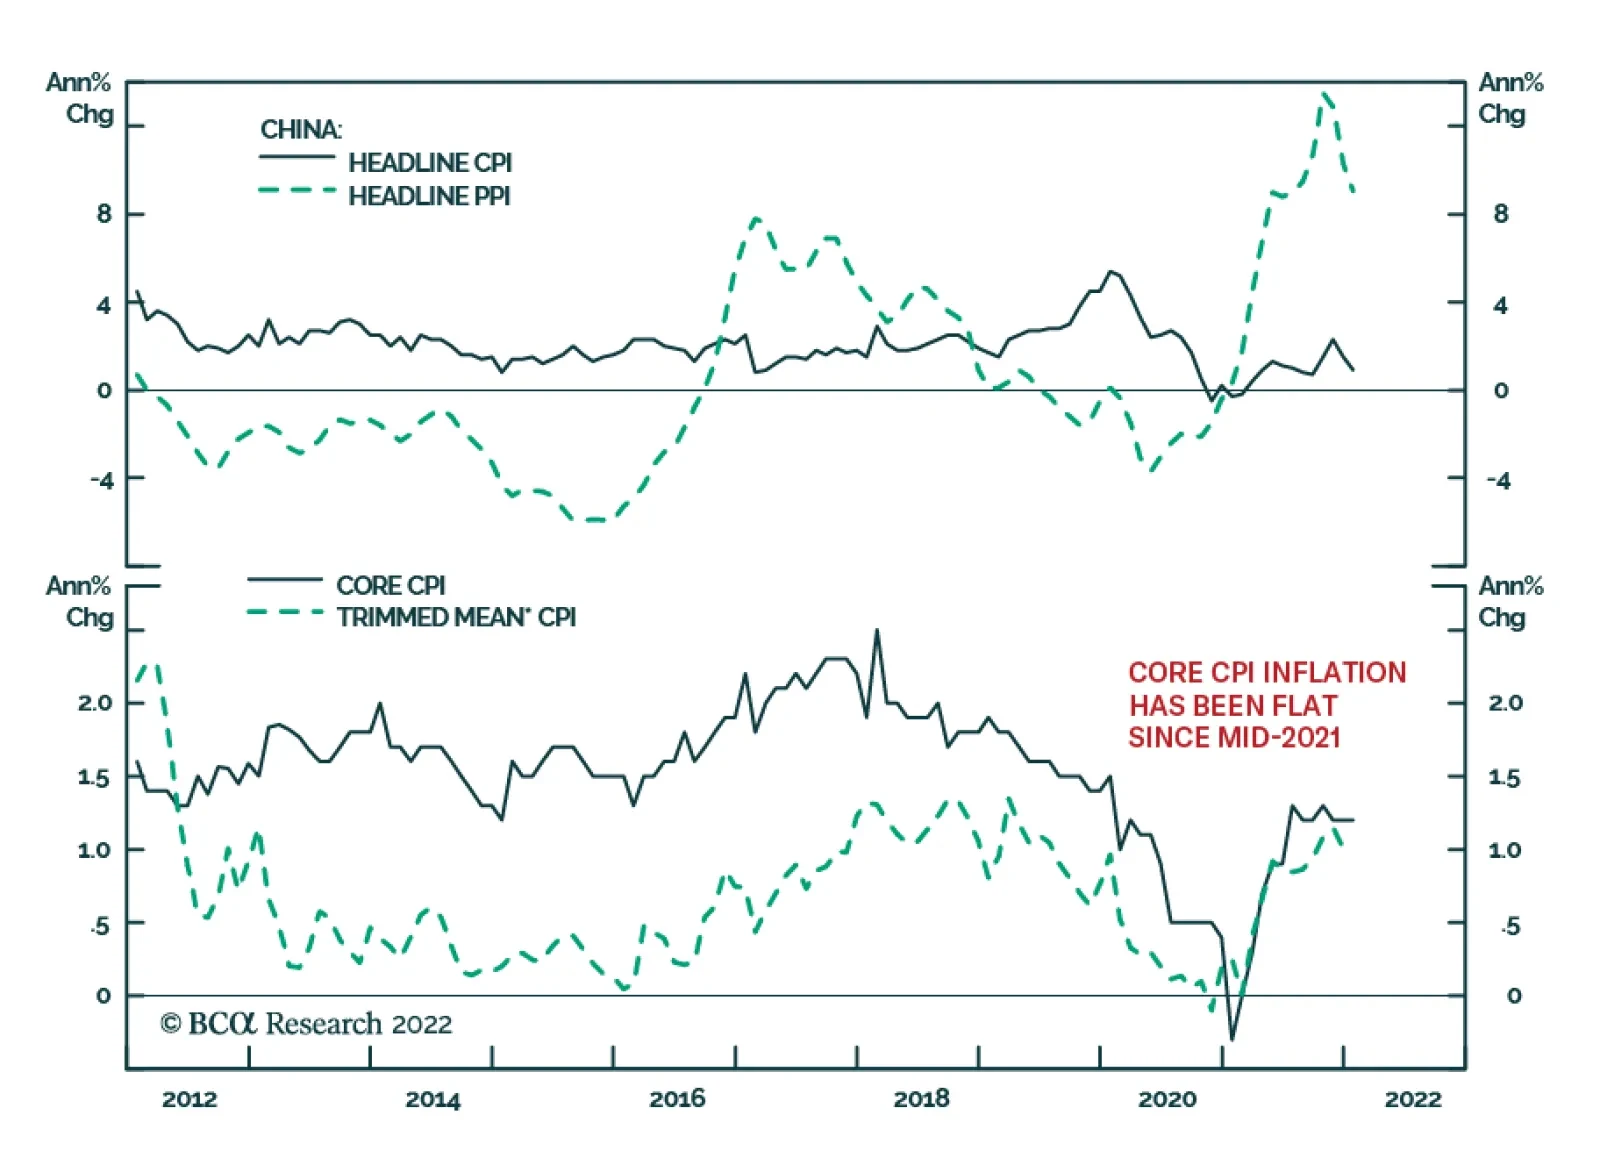
Chinese producer and consumer price inflation eased in January and fell below consensus estimates. CPI inflation slowed from 1.5% y/y to 0.9% y/y, slightly lower than the 1.0% expected. Similarly, at 9.1% y/y PPI inflation is beneath both December’s 10.3% y/y…
Executive Summary China Needs To Create RMB35 Trillion In Credit In 2022
China Needs To Create RMB35 Trillion In Credit In 2022
China Needs To Create RMB35 Trillion In Credit In 2022
The pace of credit creation in January increased sharply over December. However, the jump was less than meets the eye compared with previous easing cycles and adjusted for seasonality. Our calculation suggests that a minimum of approximately RMB35 trillion of new credit, or a credit impulse that accounts for 29% of this year's nominal GDP, will be needed to stabilize the economy. January’s credit expansion falls short of the RMB35 trillion mark on a six-month annualized rate of change basis. Our model will provide a framework for investors to gauge whether the month-over-month credit expansion data is on track to meet our estimate of the required stimulus. Despite an improvement in January's credit growth from December, it is premature to update Chinese stocks (on- and off-shore) to overweight relative to global equities. Bottom Line: Approximately RMB35 trillion in newly increased credit this year will probably be needed to revive China’s domestic demand. Any stimulus short of this goal would mean that investors should not increase their cyclical asset allocation of Chinese stocks in a global portfolio. Feature January’s credit data for China exceeded the market consensus. The aggregate total social financing (TSF) more than doubled in the first month of 2022 from December last year. However, on a year-over-year basis, the increase in January’s TSF was smaller than in previous easing cycles, such as in 2013, 2016 and 2019. Furthermore, underlying data in the TSF reflects a prolonged weak demand for bank loans from both the corporate and household sectors. While January’s uptick in credit expansion makes us slightly more optimistic about China’s policy support, economic recovery and equity performance in the next 6 to 12 months, we are not yet ready to upgrade our view. An estimated RMB35 trillion in newly increased credit this year will likely be necessary to revive flagging domestic demand. In the absence of seasonally adjusted TSF data in China, our framework will help investors determine whether incoming stimulus is on course to meet this objective. Interpreting January’s Credit Numbers Chart 1A Sharp Increase In Credit Creation In January
A Sharp Increase In Credit Creation In January
A Sharp Increase In Credit Creation In January
January’s credit creation beat the market consensus to reach RMB6.17 trillion, pushed up by a seasonal boost and a frontloading of government bond issuance (Chart 1). However, the composition of the TSF data reflects an extended weakness in business and consumer credit demand. On the plus side, net government bond financing, including local government special purpose bonds, rose to RMB603 billion last month, more than twice the amount from January 2021 (Chart 1, bottom panel). Corporate bond issuance also picked up, reflecting cheaper market rates and more accommodative liquidity conditions (Chart 2). Furthermore, shadow credit (including trust loans, entrust loans and bank acceptance bills) also ticked up in January compared with a year ago. The increase in informal lending sends a tentative signal that policymakers may be willing to ease the regulatory pressure on shadow bank activities (Chart 3). Chart 2Corporate Financing Through Bond Issuance Also Increased
Corporate Financing Through Bond Issuance Also Increased
Corporate Financing Through Bond Issuance Also Increased
Chart 3Shadow Banking Activity Ticked Up For The First Time In A Year
Shadow Banking Activity Ticked Up For The First Time In A Year
Shadow Banking Activity Ticked Up For The First Time In A Year
Meanwhile, several factors suggest that the surge in January’s credit expansion may be less than what it appears to be at first glance. First, credit growth is always abnormally strong in January. Banks typically increase lending at the beginning of a year, seeking to expand their assets rapidly before administrative credit quotas kick in. In recent years loans made during the first month of a year accounted for about 17% - 20% of total bank credit generated for an entire year. Secondly, the credit flow in January, although higher than in January 2021, was weaker than in the first month of previous easing cycles. Credit impulse – measured by the 12-month change in TSF as a percentage of nominal GDP – only inched up by 0.6 percentage points of GDP in January this year from December, much weaker than that during the first month in previous easing cycles (Chart 4). TSF increased by RMB980 billion from January 2021, lower than the RMB1.5 trillion year-on-year jump in 2019 and the RMB1.4 trillion boost in 2016 (Chart 4, bottom panel). Chart 4The Magnitude Of Increase In January’s Credit Impulse Less Than Meets The Eye
Takeaways From January’s Credit Data
Takeaways From January’s Credit Data
Chart 5Corporate Demand For Bank Credit Remains Soft
Corporate Demand For Bank Credit Remains Soft
Corporate Demand For Bank Credit Remains Soft
Furthermore, China’s households and private businesses have significantly lagged in their responses to recent policy easing measures and their demand for credit remained soft in January (Chart 5). Bank credit in both short and longer terms to households were lower than a year earlier due to downbeat consumer sentiment (Chart 6A and 6B). Chart 6AConsumption Was Unseasonably Weak During Chinese New Year
Consumption Was Unseasonably Weak During Chinese New Year
Consumption Was Unseasonably Weak During Chinese New Year
Chart 6BHouseholds' Propensity To Consume Continues Trending Down
Households' Propensity To Consume Continues Trending Down
Households' Propensity To Consume Continues Trending Down
How Much Stimulus Is Necessary? Our calculation suggests that China will probably need to create approximately RMB35 trillion in new credit, or 29% of GDP in credit impulse, over the course of this year to avoid a contraction in corporate earnings. In our previous reports, we argued that the state of the economy today is in a slightly better shape than the deep deflationary period in 2014/15, but the magnitude of the property market contraction is comparable to that seven years ago. Chart 7 illustrates our approach, which uses a model of Chinese investable earnings growth. The model is designed to predict the likelihood of a serious contraction in investable earnings in the coming 12 months. It includes variables on credit, manufacturing new orders and forward earnings momentum. The chart shows that the flow of TSF as a share of GDP needs to reach a minimum of 28.5% in order that the probability of a major earnings contraction falls below 50%. The size of the credit impulse necessary is 2 percentage points higher than that achieved last year, but still lower than the scope of the stimulus rolled out in 2016. Assuming an 8% growth rate in nominal GDP in 2022, the credit flow that should to be originated this year would be about RMB35 trillion, as illustrated in Chart 8. The chart also shows that this amount would exceed a previous high in credit flow reached in late-2020. Chart 7China Needs At Least A 29% Credit Impulse In 2022 To Avoid An Earnings Recession
China Needs At Least A 29% Credit Impulse In 2022 To Avoid An Earnings Recession
China Needs At Least A 29% Credit Impulse In 2022 To Avoid An Earnings Recession
Chart 8China Needs To Create RMB35 Trillion In Credit In 2022
China Needs To Create RMB35 Trillion In Credit In 2022
China Needs To Create RMB35 Trillion In Credit In 2022
Based on a 3-month annualized rate of change, January’s credit growth appears that it will achieve the RMB35 trillion mark. However, the jump in TSF largely reflects a one-month leap in frontloaded local government bond issuance and it is not certain if private credit will accelerate in the months ahead. For now, we contend the stimulus have been insufficiently provided during the past six months (Chart 8, bottom panel). Chance Of A Stimulus Overshoot? We will closely monitor whether the month-to-month pace of credit growth is consistent with the scope of the reflationary policy response required to revive China’s domestic demand. Despite a sharp improvement in January’s headline credit number, we view the policy signal from January’s credit data as neutral. China’s unique cyclical patterns and the lack of official seasonally adjusted data make monthly credit figures difficult to interpret. Charts 9 and 10 represent an approach that we previously introduced to help gauge whether the pace of credit creation is on track to meet the stimulus called for to stabilize the economy. Chart 9Jan Credit Growth Looked To Be Stronger Than A “Half-Strength” Credit Cycle…
Takeaways From January’s Credit Data
Takeaways From January’s Credit Data
Chart 10…But It Is Too Early To Conclude It Is In Line With What Is Needed
Takeaways From January’s Credit Data
Takeaways From January’s Credit Data
The charts show an average cumulative amount of TSF as the year advances, along with a ±0.5 standard deviation, based on data from 2010 to 2021. The thick black line in both charts shows the progress in new credit creation this year, assuming an 8% annual nominal GDP growth rate. Chart 9 shows the cumulative progress in credit, assuming a 27% new credit-to-GDP ratio for the year, whereas Chart 10 assumes 30%. The 27% ratio scenario shown in Chart 9, which is slightly higher than the magnitude of stimulus in 2019, would correspond to a very measured credit expansion. If the thick black line continues to trend within this range, it would suggest that policymakers are reluctant to allow credit growth to surge. Consequently, global investors should continue an underweight stance on Chinese stocks. In contrast, Chart 10 represents a 30% rate of TSF as a share of this year’s GDP; this would be the adequate stimulus needed for a recovery in domestic demand. A cumulative amount of TSF that trends within or above this range would provide more confidence that a credit overshoot similar to 2015/16 and 2020 would occur. Investment Conclusions It is premature to upgrade Chinese stocks to an overweight cyclical stance (i.e. over 6-12 months) within a global portfolio. For now, we recommend investors stay only tactically overweight in Chinese investable equities versus the global benchmark, given their cheap relative valuations. Meanwhile, the increase in January’s TSF, while registering an improvement relative to previous months, does not signal that the pace of credit growth will be strong enough to overcome the negative ramifications of the ongoing deceleration in housing market activity. Therefore, in view of policymakers’ steadfast desire to avoid another major credit overshoot, our cyclical recommendation to underweight Chinese stocks remains unchanged. Jing Sima China Strategist jings@bcaresearch.com Strategic Themes Cyclical Recommendations Tactical Recommendations
BCA Research’s China Investment Strategy service sees four significant risks to turning bullish towards Chinese domestic stocks (in both absolute and relative terms) in the next 6 to 12 months. A subdued recovery in China’s economic activity. When…
Executive Summary Chinese Onshore Stock Prices And Earnings Are Set To Deteriorate
Chinese Onshore Stock Prices And Earnings Are Set To Deteriorate
Chinese Onshore Stock Prices And Earnings Are Set To Deteriorate
Macro fundamentals indicate that for the time being there is no basis to overweight Chinese onshore stocks (in both absolute terms and relative to global stocks) given the outlook for profit growth contraction in 1H22. We are reluctant to shift our stance on Chinese domestic stocks to overweight in the next 6 to 12 months due to the following non-trivial risks: a subdued recovery in China’s economic activity, a deceleration in fiscal impulse in 2H22, a re-focus on reducing carbon emissions, as well as higher US bond yields and tighter global liquidity conditions. Despite a sharp drop in January, valuations in Chinese onshore stocks are still neutral in absolute terms, and only slightly cheaper than global stocks. As such, Chinese onshore stocks offer little valuation buffer in the wake of any negative surprises. Bottom Line: We maintain our underweight stance on Chinese onshore stocks (in both absolute terms and relative to global equities) due to non-trivial risks in the coming year. Feature China’s stock markets was very weak in the first month of 2022. The domestic equity market tumbled by 8% in January, while the offshore market dropped by 3%. We discussed our view on Chinese investable stocks in last week’s report and recommended that investors go long on investable value stocks versus growth stocks. This week’s report focuses on the onshore market. While we expect the economy to stabilize by mid-year on the back of increased policy support, we are reluctant to move to a cyclical overweight in the next 6 to 12 months, in both absolute terms and relative to their global peers. Near-term challenges in economic fundamentals will continue to weigh on Chinese domestic stocks. Over a cyclical time frame, the main risks to a bullish view on Chinese stocks are fourfold: a potentially subdued economic recovery; a sharp deceleration in fiscal impulse in the second half of the year; a re-acceleration in de-carbonization efforts; as well as higher bonds yields in the US and tighter global financial conditions. Chinese onshore stocks are not as deeply discounted as their offshore peers and, therefore, are less able to counter any negative surprises. Macroeconomics Matter Chart 1Weak Economic Fundamentals Undermine Stock Performance
Weak Economic Fundamentals Undermine Stock Performance
Weak Economic Fundamentals Undermine Stock Performance
China’s economic fundamentals still drive corporate earnings and the country’s domestic stock performance, despite an escalation in monetary policy easing (Chart 1). Current macro fundamentals do not provide a legitimate support for investors to overweight Chinese stocks. The domestic stock market’s rocky start to 2022 underscores extremely fragile sentiment and heightened anxiety among investors. Credit growth bottomed in October last year but has not shown any signs of a strong rebound. Corporate demand for credit remains in the doldrums while turmoil in the housing market has disincentivized households from taking mortgages (Chart 2). The real economy, which in previous business cycles lagged credit growth by about six to nine months, has not responded to policy easing measures. Housing market indicators in January deteriorated further (Chart 3). Moreover, the nation’s counter-COVID measures have disrupted a recovery in the service sector and private consumption. Chart 2Demand For Loans Remains Weak
Demand For Loans Remains Weak
Demand For Loans Remains Weak
Chart 3Housing Sales Weakened Further In January
Housing Sales Weakened Further In January
Housing Sales Weakened Further In January
Chart 4Chinese Onshore Stock EPS Is Set To Deteriorate
Chinese Onshore Stock EPS Is Set To Deteriorate
Chinese Onshore Stock EPS Is Set To Deteriorate
The financial market is forward looking and macro policies have become more market friendly. However, Chart 4 suggests that China's onshore corporate profits are set to deteriorate in the coming six months or so, and investors will likely react negatively to any further weakness in China’s measures of economic activity. Bottom Line: At the moment, China’s domestic economic fundamentals do not support an overweight stance in Chinese stocks. Mindful Of Cyclical Risks Chinese authorities have prioritized stimulating growth through countercyclical measures in 2022. However, we are reluctant to move to a cyclical overweight stance because we see four significant risks to turning bullish towards Chinese stocks (in both absolute and relative terms) in the next 6 to 12 months. These scenarios not only threaten the performance of Chinese stocks relative to global equities but could also prevent Chinese stocks’ absolute performance from trending higher. A subdued recovery in China’s economic activity. When policymakers wait too long to decisively stimulate the economy, business and consumer sentiment as well as the economy can remain downbeat for a prolonged period. For example, in the 2014/15 business cycle, monetary policy started to ease in early 2015, but policymakers hesitated to back down from supply-side reforms. As a result, the economy did not bottom until Q1 2016. Business activity and the financial markets reached their lows only after the authorities opened the “flood irrigation” to the economy by massively stimulating the housing sector (Chart 5). Arguably China’s economy is in a better shape now than in 2014/15 and the ongoing economic slowdown is not the result of a four-year downtrend in industrial activity as was the case prior to 2015’s economic slump (Chart 6). The drop in the A-share market in January was nothing compared with the turmoil in the financial markets seven years ago. Chart 5Economic Activity Picked Up In Q1 2016 Following A Massive Stimulus
Economic Activity Picked Up In Q1 2016 Following A Massive Stimulus
Economic Activity Picked Up In Q1 2016 Following A Massive Stimulus
Chart 6China's Economy In General Is In A Better Shape Now Than In 2014/15...
China's Economy In General Is In A Better Shape Now Than In 2014/15...
China's Economy In General Is In A Better Shape Now Than In 2014/15...
On the other hand, the housing market, which is estimated to account for about 29% of China’s economy, is currently decelerating at the same pace as in 2014/15. Growth in home sales and new projects dropped to their 2015 lows, while real estate inventories are comparable to the 2015 highs (Chart 7). Furthermore, property developers and consumers are even more indebted than during the 2014/15 cycle (Chart 8). Chart 7...But Downward Momentum In Property Market Comparable To 2015
...But Downward Momentum In Property Market Comparable To 2015
...But Downward Momentum In Property Market Comparable To 2015
Chart 8Chinese Real Estate Developers And Households Are More Leveraged Now Than In 2015
Chinese Real Estate Developers And Households Are More Leveraged Now Than In 2015
Chinese Real Estate Developers And Households Are More Leveraged Now Than In 2015
Chart 9Policymakers Will Have To Allow Significant Re-leveraging To Revive The Housing Market
Policymakers Will Have To Allow Significant Re-leveraging To Revive The Housing Market
Policymakers Will Have To Allow Significant Re-leveraging To Revive The Housing Market
As noted in a previous report, unless regulators are willing to initiate more aggressive policy boosts as in 2015/16, the ongoing easing measures will not be sufficient to revive sentiment in the property market. Thus, the property market downtrend will likely extend through 2022 (Chart 9). The IMF recently revised its 2022 growth projection for China from 5.6% to 4.8%. It attributed the sharp downgrade to China’s protracted financial stress in the housing sector and pandemic-induced disruptions related to a zero-tolerance COVID-19 policy. A sub-5% economic expansion in 2022, although still an improvement from the 4.5% average annual rate in 2H21, is subdued and below China’s potential growth. Such a weak economic recovery will weigh on investor sentiment towards Chinese stocks in the coming year. A deceleration in fiscal impulse in 2H22. The impulse in fiscal stimulus - without any intervention - will fall sharply in the second half of the year. The Ministry Of Finance has approved a quota of RMB1.46 trillion in local government special purpose bonds (SPBs), which accounts for more than one-third of the yearly SPB quota, to be issued in Q1 this year. Chart 10Large Amount Of Local Government Debts Due In 2H22
Chinese Onshore Stocks: How Much Upside?
Chinese Onshore Stocks: How Much Upside?
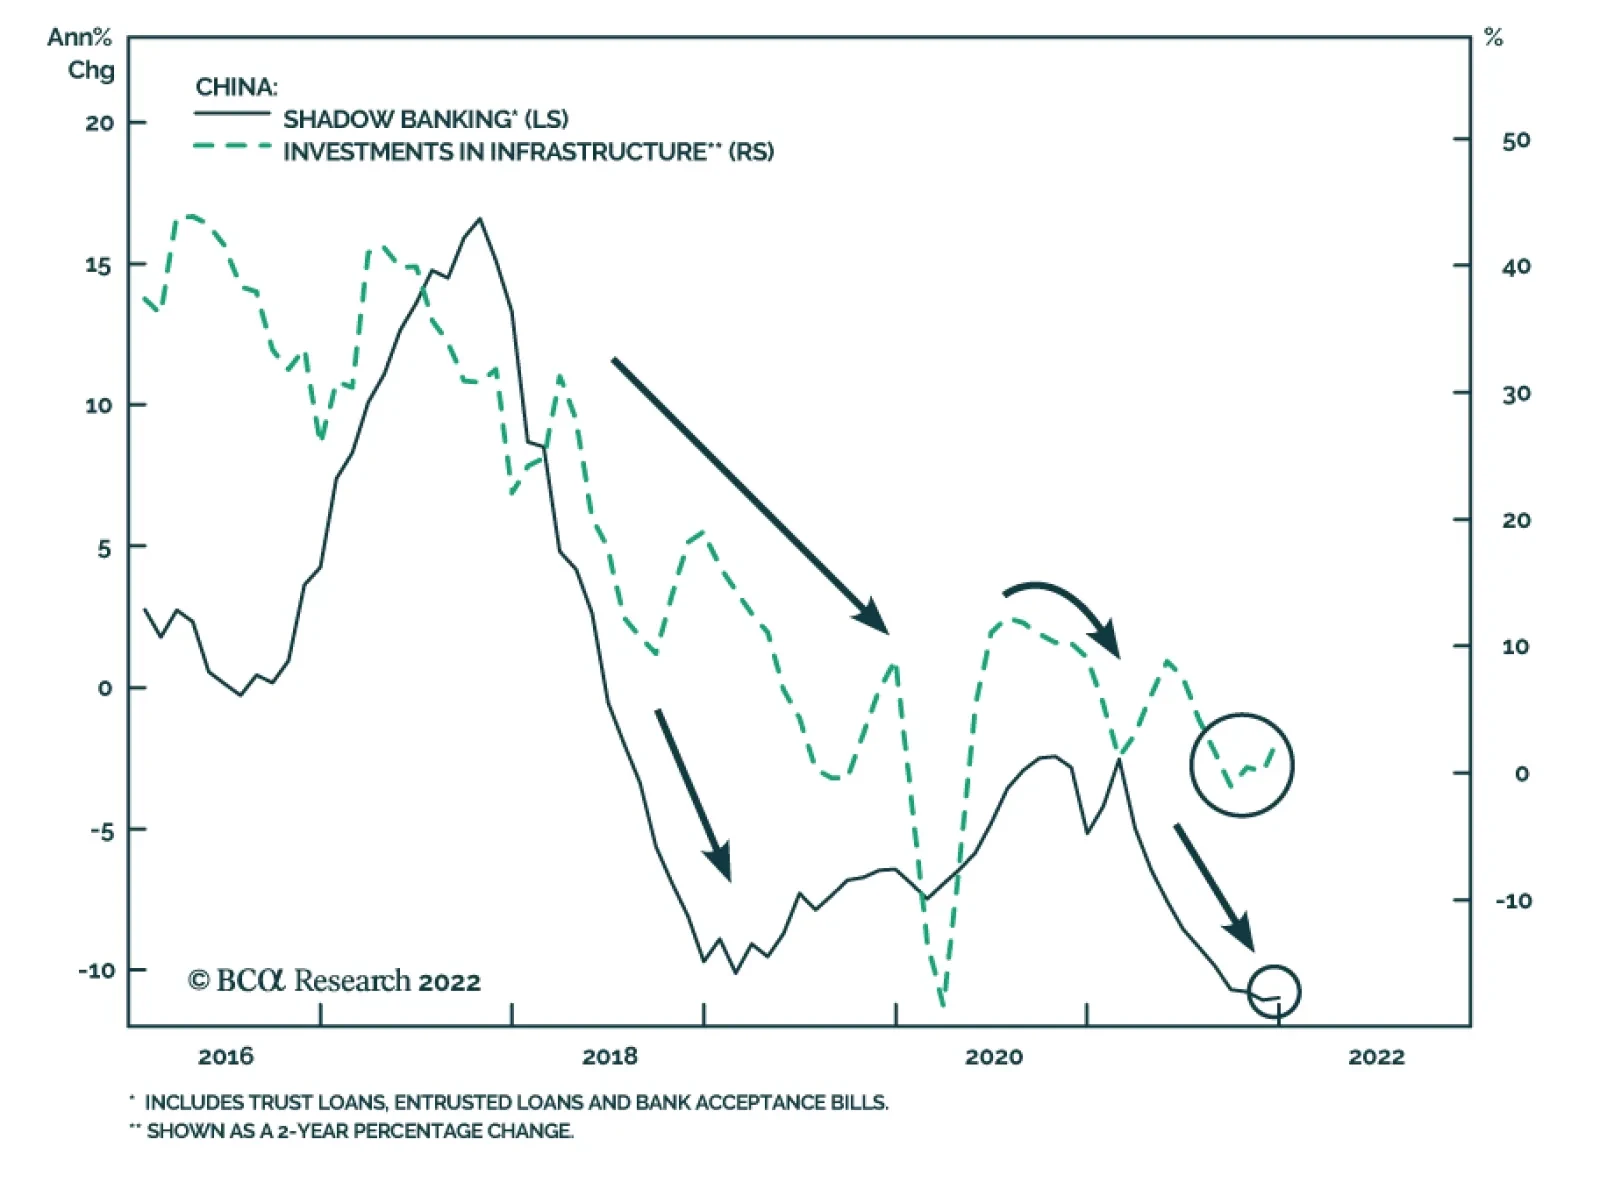
However, the frontloading of SPBs also means that the fiscal impulse will slow significantly in 2H22. Our geopolitical strategists have noted that a total of RMB2.7 trillion worth of local government bonds (LGB) will reach maturity this year, with RMB2.2 trillion coming due after June 2022 (Chart 10). The number of maturing LGBs in 2H22 will be only slightly smaller than those in all of 2021; in 2021 42% of LGBs issued were re-financing bonds to pay off existing local government debts, undermining real fiscal support for the economy. Furthermore, authorities have not loosened their grip on implicit local government debts (Chart 11). These so-called shadow banking debts through local government financing vehicles (LGFVs) are an important source of funding for investments in infrastructure projects. If the central government does not reverse its efforts to curb hidden debts while explicit fiscal stimulus also wanes, then we will likely see a sharp deceleration in fiscal support in 2H22. Lastly, we think Chinese policymakers are still serious about preventing “flood irrigation” type of stimulus, and will not opt for it unless the economic slowdown is much sharper. In Q1 2019 stock prices jumped sharply, boosted by an above-expectation pace of local government SPB issuance and credit expansion. However, following the public spat between Premier Li Keqiang and the PBoC over whether the January 2019 credit spike represented “flood irrigation-style” stimulus, policymakers quickly scaled back credit expansion in Q2 and onshore stock prices ended the year 5% lower than in Q1 (Chart 12). Chart 11Authorities Have Kept Tight Grip On Shadow Banking Activity
Authorities Have Kept Tight Grip On Shadow Banking Activity
Authorities Have Kept Tight Grip On Shadow Banking Activity
Chart 12Policymakers Scaled Back Stimulus And Took The Wind Out Of Onshore Stocks In 2019
Policymakers Scaled Back Stimulus And Took The Wind Out Of Onshore Stocks In 2019
Policymakers Scaled Back Stimulus And Took The Wind Out Of Onshore Stocks In 2019
Carbon emission reduction targets are still viable. In the current 14th Five-Year Plan (2021-2025), the cumulative targets reduction in energy consumption intensity is 13.5%.1 Last year’s energy crisis slowed the de-carbonization process and energy consumption intensity fell by 2.7% in 2021, missing the official annual target of 3%. To meet the de-carbonization target by 2025, energy consumption intensity will have to be lowered by at least 2.7% per year in the next four years. If energy- and carbon-intensive infrastructure activity picks up sharply in 1H22, then policymakers will have to renew their vigilance to constrain carbon-intensive activities later this year. The de-carbonization target has become a key parameter for assessing the performance of local governments, and meeting de-carbonization targets is particularly important given the rotation of local officials will be completed in late 2022. Furthermore, the initiative to reduce energy intensity reflects China’s commitment to move to a green economy. Given the important political events in both China and the US in the fall of 2022, meeting the annual de-carbonization target will be an important projection of China’s international image and will likely play a role in US-China negotiations. Chart 13Prior To The Pandemic, Chinese Stocks Had Little Correlation With US Treasury Yields
Prior To The Pandemic, Chinese Stocks Had Little Correlation With US Treasury Yields
Prior To The Pandemic, Chinese Stocks Had Little Correlation With US Treasury Yields
Higher bond yields in the US and tighter global liquidity conditions. Historically, Chinese onshore stocks have exhibited a loose cyclical correlation with US government bond yields (Chart 13). Nonetheless, if US bond yields rise more than global investors expect and to a level that is economically restrictive, then capital expenditures and household consumption in the US will weaken. This, in turn, will weigh down global trade and Chinese exports of manufactured goods. Against the backdrop of escalating US bond yields, Chinese onshore stocks may passively outperform their US counterparts because China’s A-share market is heavily weighted in value stocks. However, A-share prices in absolute terms will not be immune to heightened volatility in the global financial markets. The risk-off sentiment across global bourses will discourage portfolio flows into emerging economies including China. On a monthly basis, foreign portfolio net inflows account for less than 1% of the onshore equity market trading volume, but in recent years foreign portfolio inflows have increasingly influenced China’s onshore market sentiment and prices (Chart 14). China’s domestic household savings will not provide much support to stock prices this year. Chinese households have increasingly invested in the domestic equity market in the past few years, given that the authorities have been vigilant in containing price inflation in the property market.2 While we think Chinese consumers will continue rotating investment from property to financial market, household savings growth has fallen sharply since mid-2021, which means there have been less available funds to invest in the stock market (Chart 15). Chart 15Chinese Households' Quickly Diminishing Dry Powder
Chinese Households' Quickly Diminishing Dry Powder
Chinese Households' Quickly Diminishing Dry Powder
Chart 14Foreign Investors Have Become More Influential In The Chinese Onshore Market
Foreign Investors Have Become More Influential In The Chinese Onshore Market
Foreign Investors Have Become More Influential In The Chinese Onshore Market
Bottom Line: For the time being, the significant risks described above make us reluctant to turn bullish on Chinese stocks in both absolute and relative terms. Investment Conclusions There are few upsides related to Chinese onshore stocks in the next 6 to 12 months. However, there are two risks to our underweight stance on Chinese onshore stocks: First, we cannot rule out the possibility that Chinese policymakers will go “all in” for economic stability and allow a significant credit overshoot. In this scenario, a strong pickup in credit growth will produce a rebound in profit growth and support share prices in absolute terms and relative to global equities. Secondly, recent gyrations in global financial markets, coupled with China’s sluggish domestic economy, have triggered shakeouts in the onshore equity markets. The pullback in stock prices has helped to shed some excesses in Chinese stock valuations. Chart 16In Very Optimistic Scenario Chinese Stocks Would Have Some Upside Potential Vs. Global
In Very Optimistic Scenario Chinese Stocks Would Have Some Upside Potential Vs. Global
In Very Optimistic Scenario Chinese Stocks Would Have Some Upside Potential Vs. Global
If the stimulus in the next 6 to 12 months returns Chinese corporate profit growth to their 2021 peaks, then Chinese stock prices (in absolute terms) will also approach or go back to their early-2021 highs. Chart 16 highlights that reverting to these levels would imply a return of about 10-15% for domestic stocks in both absolute and relative price terms. We think China’s potential to command a higher multiple than global stocks is capped, barring a major structural improvement in earnings growth. However, Chart 16 (bottom panel) shows that Chinese onshore stocks at their height early last year were still cheaper than their global counterparts. Therefore, in a scenario where Beijing does “whatever it takes” to stimulate its economy, we will have no strong reasons to argue against a return of domestic forward multiples and a strong earnings growth back to levels seen in early-2021. Jing Sima China Strategist jings@bcaresearch.com Footnotes 1 Energy consumption intensity refers to energy consumption per unit of GDP. 2 There was a sharp jump in demand in 2020 for investment products from households; mutual funds in China raised money at a record pace, bringing in over 2 trillion yuan ($308 billion), which is more than the total amount in the previous four years. Strategic Themes Cyclical Recommendations Tactical Recommendations
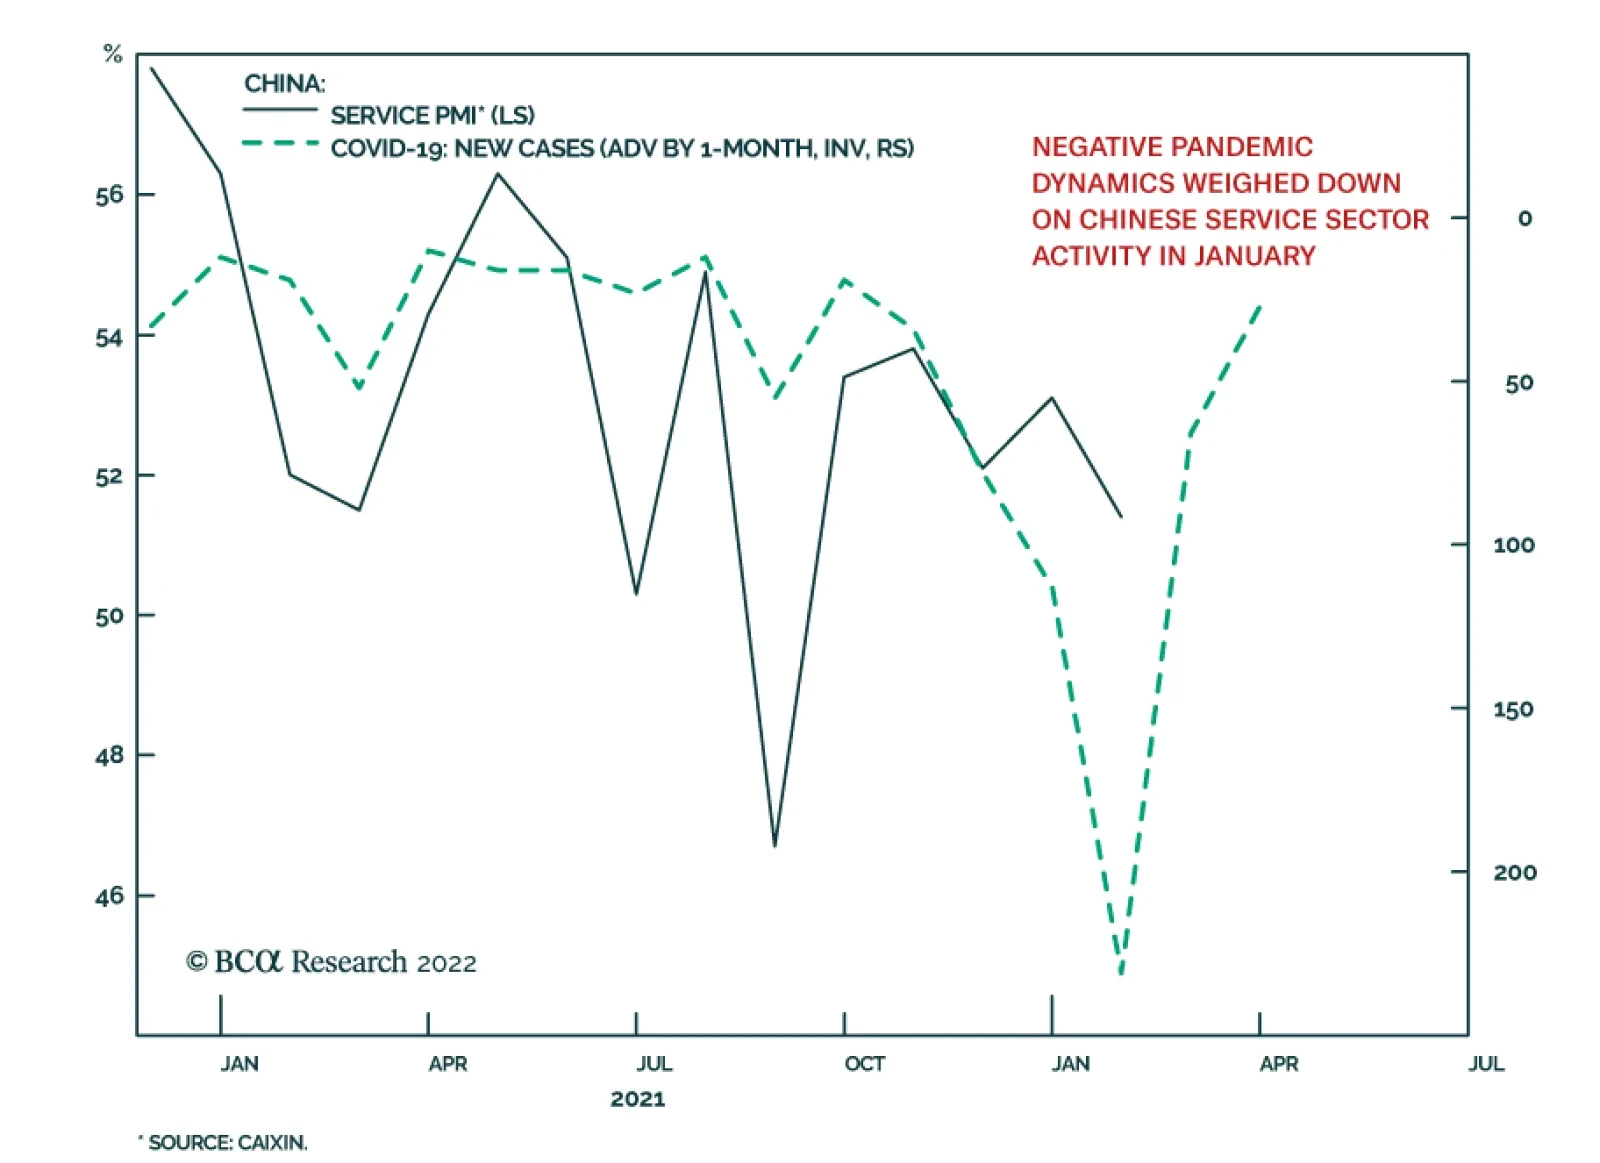
The Caixin PMI suggests that Chinese economic activity stagnated in January. The Composite PMI declined by 2.9 points to 50.1 – a hair above the boom-bust line separating contraction from expansion. The services PMI declined by 1.7 points to 51.4. This…
For international investors in local bonds, total returns are predicated on two main drivers: (1) the direction and magnitude of change in bond yields; and (2) currency performance. In all Asian countries, the dominant macro factor that drives local bond…