China

Executive Summary Credit Demand Collapsed
Credit Demand Collapsed
Credit Demand Collapsed
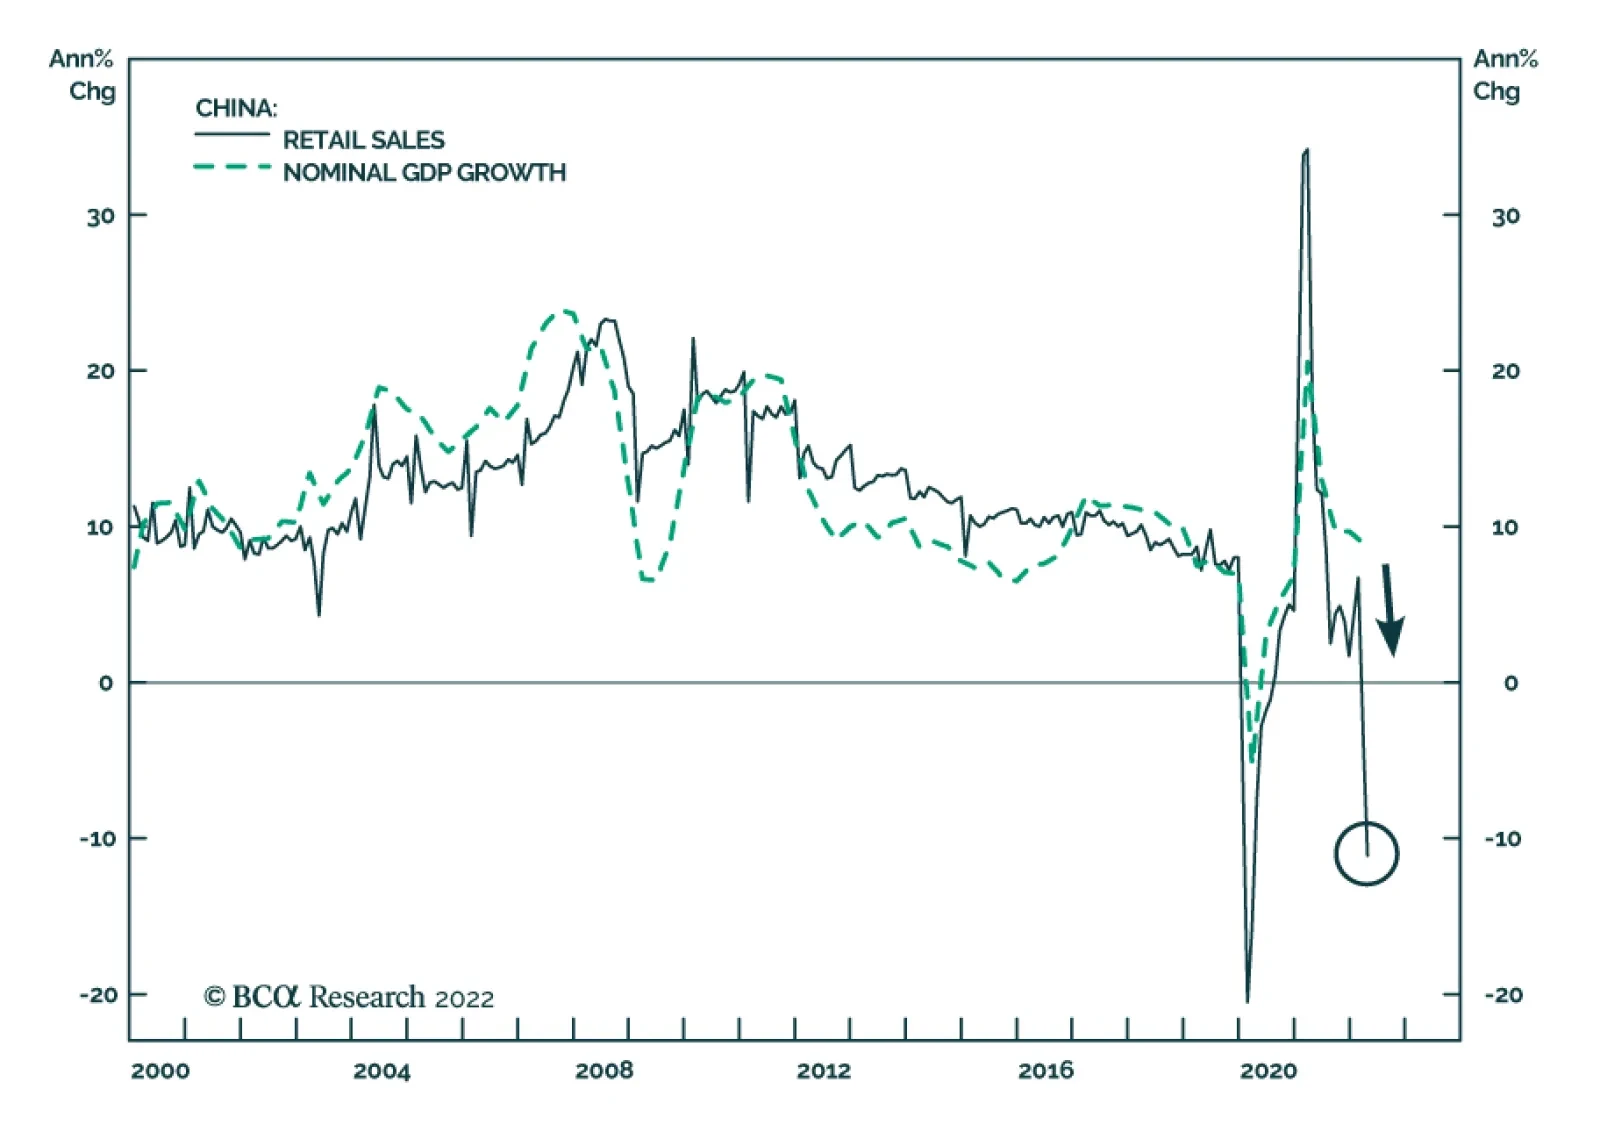
Business activity data from April showed a broad-based contraction in China’s economy. Credit growth tumbled as demand collapsed. Bank loan expansion slowed by the most in nearly five years and annual change in new household loans declined to an all-time low. Exports decelerated sharply in April. China’s export sector faces headwinds from Omicron-related supply chain disruptions and weakening global demand for goods. Export growth will rebound following the resumption of business activity in China’s major cities, but is set to decelerate from 2021 as external demand for goods weakens. The PBOC lowered the 5-year loan prime rate (LPR) by 15bps last Friday, following a cut in the floor rate of first-home mortgages to 20bp below the benchmark. These moves will help to arrest the ongoing deep contraction in the property market. However, these policies alone will not generate strong recovery in housing demand, amid near-term Covid-related disruptions and dampened household income growth. Barring major lockdowns, China’s economy will likely bottom around mid-2022. We expect a muted recovery in the second half of the year, despite an acceleration in policy easing. From a cyclical perspective, we continue to recommend a neutral allocation to Chinese onshore stocks in a global portfolio. Bottom Line: China’s economy has been hit by a relapse in demand and Covid-induced production disruptions. The economy will likely bottom by mid-year, but the ensuing recovery may be subdued. A Subdued Recovery In 2H 2022 A broad-based contraction in China’s economy in April reflects hit by a combination of slumping domestic demand and Covid-related disruptions. Growth in retail sales and industrial production contracted from a year ago and home sales shrunk further. Economic activity will rebound when the current Covid wave is under control and lockdown restrictions are lifted. However, we expect a much more muted recovery in the second half of this year compared with two years ago when China’s economy staged an impressive V-shaped recovery as it emerged from the first wave of lockdowns in spring 2020. Presently, reported virus cases have steadily declined in cities in the Yangtze River region, including Shanghai which aims to lift its lockdown on June 1st. The number of regions and cities under stringent confinement also fell. However, China firmly maintains its dynamic zero-Covid policy, which means tight mobility restrictions and some forms of lockdowns will occur across the country on a rolling basis going forward. China’s leadership has stepped up its pro-growth policy measures, such as a 15bps cut in the 5-year LPR last week. Given the pace of credit expansion collapsed in April and private-sector sentiment remains in the doldrums, a recovery will not be imminent or strong despite this rate cut (Chart 1). In the near term, the poor economic outlook in China, coupled with jitters in the global equity market, will continue to depress the performance of Chinese stocks in absolute terms (Chart 1, bottom panel). From a cyclical perspective, we maintain our neutral view on China’s onshore stocks and underweight view on China’s investable stocks within a global equity portfolio. China’s economy is set to underwhelm investor expectations and stock prices probably are unlikely to outperform their global counterparts (Chart 2). Chart 1Weak Economic Fundamentals Undermine Stock Performance
Weak Economic Fundamentals Undermine Stock Performance
Weak Economic Fundamentals Undermine Stock Performance
Chart 2Too Early To Upgrade Chinese Stocks In A Global Portfolio
Too Early To Upgrade Chinese Stocks In A Global Portfolio
Too Early To Upgrade Chinese Stocks In A Global Portfolio
Qingyun Xu, CFA Associate Editor qingyunx@bcaresearch.com Credit Growth Slowed Notably As Loan Demand Slumps Credit expansion in April relapsed, as lockdowns exacerbated the weakness in business activity and further depressed the demand for credit. Bank loan growth plummeted to its worst level in almost five years (Chart 3). Notably, annual change in new household loans origination contracted the most since data collection began because Covid lockdowns and the property market slump sapped consumers’ willingness to borrow (Chart 4). In addition, household propensity to spend declined to an all-time low, highlighting that bleak sentiment will continue to curb demand for loans (Chart 4, bottom panel). Moreover, a rapid deceleration in corporate medium-and long-term loans versus soaring short-term bill financing indicates corporates’ weak demand for credit and investment (Chart 5). The deterioration in corporate sentiment is also reflected in business condition surveys (Chart 6). Chart 3Subdued TSF Growth Due To Collapsed Loan Demand
Subdued TSF Growth Due To Collapsed Loan Demand
Subdued TSF Growth Due To Collapsed Loan Demand
Chart 4Annual Change In New Household Loans Contracted The Most In April
Annual Change In New Household Loans Contracted The Most In April
Annual Change In New Household Loans Contracted The Most In April
Chart 5Corporate Demand For Credit Remains in The Doldrums …
Corporate Demand For Credit Remains in The Doldrums...
Corporate Demand For Credit Remains in The Doldrums...
Chart 6... And Unlikely To Turn Around Soon Despite Accommodative Monetary Conditions
...And Unlikely To Turn Around Soon Despite Accommodative Monetary Conditions
...And Unlikely To Turn Around Soon Despite Accommodative Monetary Conditions
Chart 7Early Signs Of Authorities Loosening Their Grip On Shadow Banking
Early Signs Of Authorities Loosening Their Grip On Shadow Banking
Early Signs Of Authorities Loosening Their Grip On Shadow Banking
Local government bond issuance unexpectedly moderated in April after most of the front-loaded local government special purpose bonds (SPBs) was issued in Q1. In the January-April period this year, the amount of SPBs issuance was RMB 1.41 trillion. The SPBs quota for 2022 is 3.65 trillion, along with 1.1 trillion of SPB proceeds that can be carried over from last year. Given that most of the planned SPBs will be issued by the end of June, we will likely see a peak in SPB issuance in Q2.This entails about RMB 3 trillion of SPBs will be issued in May-June. The intensified SPB issuance will underpin total social financing (TSF) growth in the next two to three months. However, barring an increase in the SPB quota or an approval to issue Special Treasury bonds as occurred in 2H 2020, the support from government bonds issuance to TSF will likely decline sharply in the second half of this year. Notably, there has been stabilization in shadow bank financing growth, although it remains below zero (Chart 7). It may be an early sign that China’s leadership is allowing some shadow banking activity; a meaningful relaxation of local governments’ shadow banking activity would be positive for infrastructure investment. Exports: Weaker Than Last Year China’s exports growth softened sharply in April, led by an extensive reduction in shipments to major developed markets (Chart 8). In addition, exports by product group also indicate a wide ranging slowdown in both exports of lower-end consumer goods and tech products (Chart 9). The softness in China’s exports reflects Omicron-related supply chain and logistical disruptions along with a weakening external demand for goods. Chart 8China's Exports To Developed Markets Fell
China's Exports To Developed Markets Fell
China's Exports To Developed Markets Fell
Chart 9A Broad-Based Decline Among Categories of Exported Goods
A Broad-Based Decline Among Categories of Exported Goods
A Broad-Based Decline Among Categories of Exported Goods
Chart 10Weakening Global Demand For Goods
Weakening Global Demand For Goods
Weakening Global Demand For Goods
South Korean exports, a bellwether for global trade, have also been easing in line with Chinese exports, which indicates dwindling global demand for manufacturing goods (Chart 10). In addition, the sharp underperformance of global cyclical stocks versus defensives heralds a worldwide manufacturing downturn (Chart 11). Falling US demand for consumer goods corroborates diminishing external demand (Chart 12). China’s exports will likely rebound from its April levels when manufacturing production resumes in Shanghai and supply-chain interruptions subside in the Yangtze River Delta region. Nonetheless, we expect a contraction in exports this year, as global consumer demand for goods dwindles. Chart 11Global Manufacturing Sector Is Heading Into A Downturn
Global Manufacturing Sector Is Heading Into A Downturn
Global Manufacturing Sector Is Heading Into A Downturn
Chart 12External Demand For Chinese Export Goods Is Dwindling
External Demand For Chinese Export Goods Is Dwindling
External Demand For Chinese Export Goods Is Dwindling
Recovery In China’s Manufacturing Sector Will Be Muted In 2H 2022 Manufacturing production growth contracted in April at the fastest rate since data collection began. The contraction was due to Covid-induced production troubles and weak demand (Chart 13). Chart 13Manufacturing Output Growth Contracted The Most Since Data Reporting Began
Manufacturing Output Growth Contracted The Most Since Data Reporting Began
Manufacturing Output Growth Contracted The Most Since Data Reporting Began
Chart 14Mounting Product Inventory
Mounting Product Inventory
Mounting Product Inventory
Chart 15Chinese Manufacturing Output And Capacity Utilization Face Headwinds From Weakening Exports
Chinese Manufacturing Output And Capacity Utilization Face Headwinds From Weakening Exports
Chinese Manufacturing Output And Capacity Utilization Face Headwinds From Weakening Exports
The inventory of finished products soared to the highest point in the past 10 years due to port closures and domestic logistical issues (Chart 14). Even when the impact of the current Covid wave wanes in the second half of this year, destocking pressures will dampen manufacturing production. In addition, Chinese manufacturing output and capacity utilization face headwinds from decelerating exports (Chart 15). While upstream industries, such as the mining, resources and materials sectors, benefit from strong pricing trends, profit margins for middle-to-downstream manufacturers remain very subdued (Chart 16). The large gap between prices for producer goods and consumer goods is a reflection of the inability of manufacturers to pass on higher input costs to consumers (Chart 17). Elevated input cost pressures and, hence, disappointing corporate profits, will continue to curb manufacturing investments and production in 2H 2022. Chart 16Manufacturing Sector's Profit Margins Are Further Squeezed
Manufacturing Sector's Profit Margins Are Further Squeezed
Manufacturing Sector's Profit Margins Are Further Squeezed
Chart 17Manufacturers Are Under Rising Cost Pressures
Manufacturers Are Under Rising Cost Pressures
Manufacturers Are Under Rising Cost Pressures
Housing Market Outlook Remains Gloomy The PBOC lowered the 5-year LPR by 15bps from 4.6% to 4.45% on May 20, the largest LPR rate cut since 2019. The easing measure followed a reduction in first-home mortgages to 20bps below the benchmark announced on May 15. The national-level mortgage rate floor and benchmark rate drops are clear signals that policymakers are ramping up policy easing measures in the property sector, given the failure of previous efforts to revive housing demand. Historically, mortgage rates tend to lead household loans and home sales by two quarters, suggesting that the housing market may see some improvement by year-end (Chart 18). However, as we pointed out in previous reports, without large-scale and direct fiscal transfers to consumers to boost household income, these housing measures will unlikely generate a strong rebound in household sentiment and home purchases (Chart 19). Chart 18Mortgage Rates Tend To Lead Consumer Loans And Home Sales By Two Quarters
Mortgage Rates Tend To Lead Consumer Loans And Home Sales By Two Quarters
Mortgage Rates Tend To Lead Consumer Loans And Home Sales By Two Quarters
Chart 19Housing Market Sentiment Shows Little Signs Of Revival
Housing Market Sentiment Shows Little Signs Of Revival
Housing Market Sentiment Shows Little Signs Of Revival
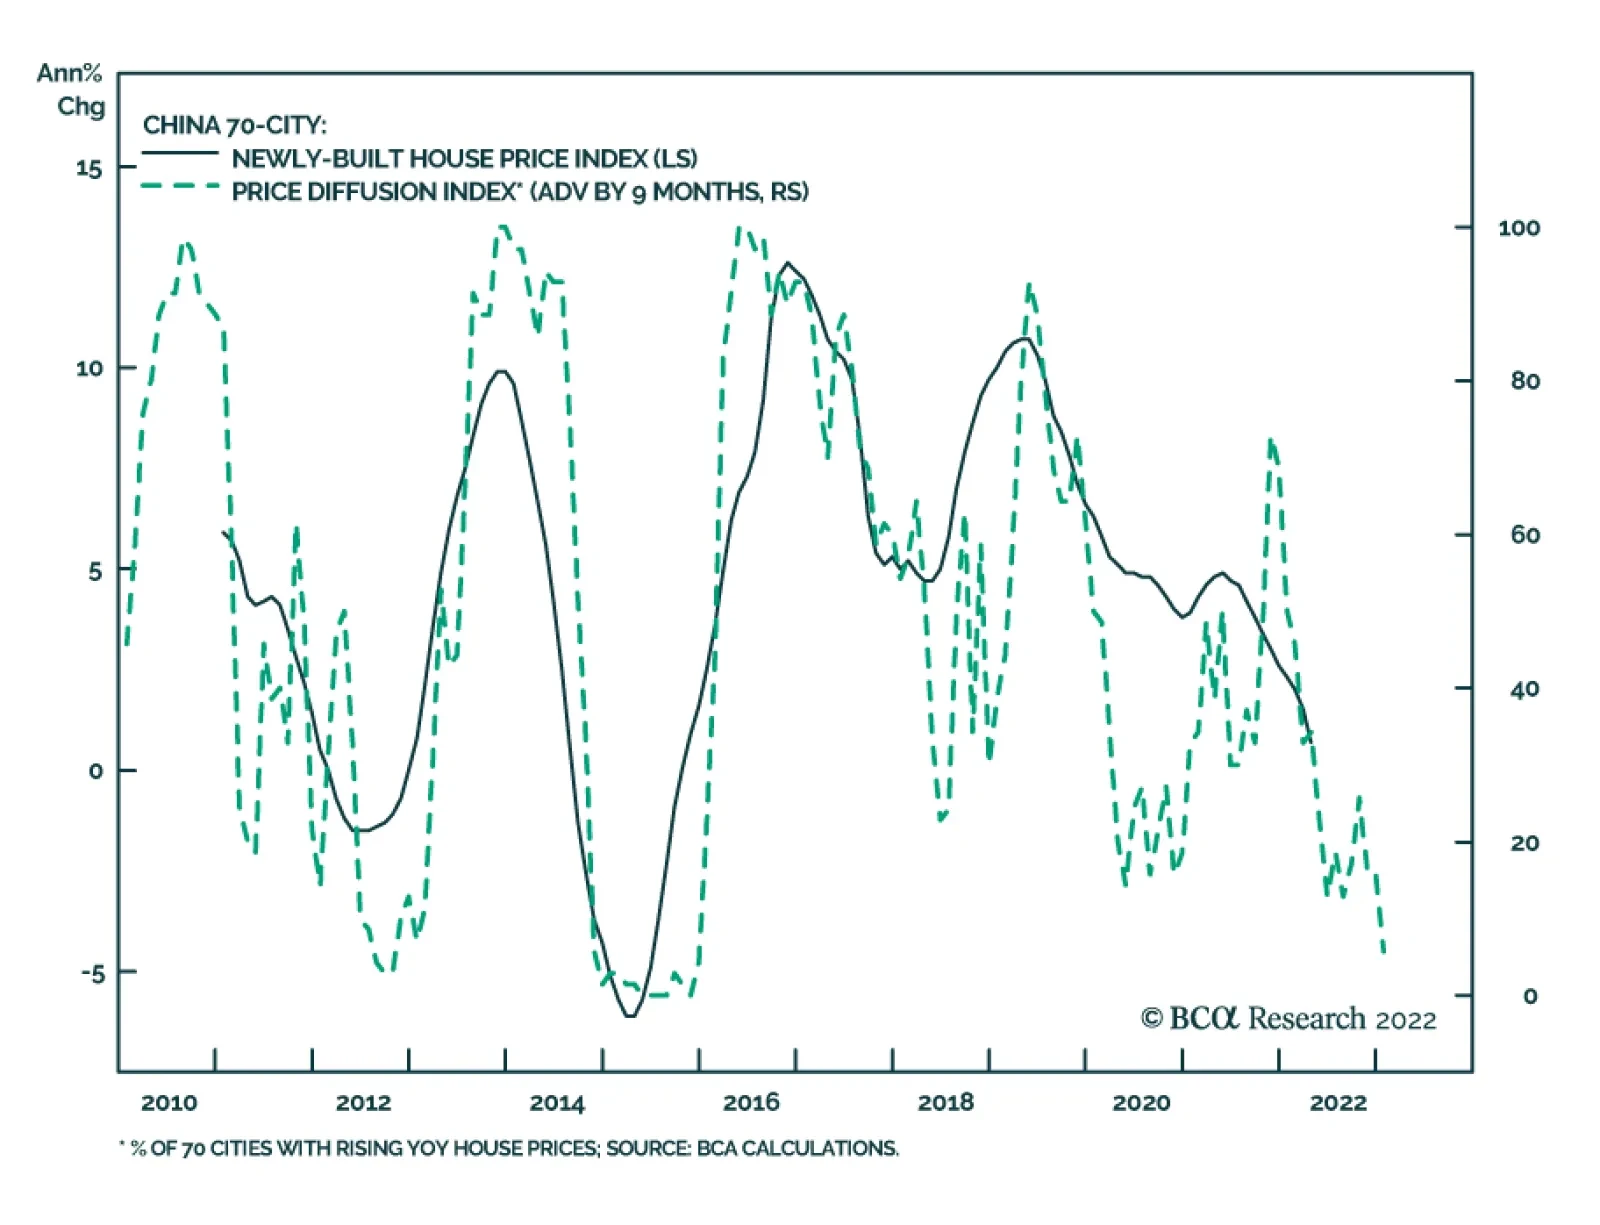
Lockdowns in April exacerbated the slump in all housing market indicators, with the exception of a moderate improvement in floor space completed (Chart 20). Home prices, which tend to lead housing starts, decelerated even more in April following seven consecutive month-to-month declines. Moreover, our housing price diffusion index suggests that home prices on a year-on-year basis will contract in the next six to nine months, a further drop from the current 0.7% growth (Chart 21, top panel). Falling home prices will curb housing starts and construction activity (Chart 21, bottom panel). In addition, real estate developers’ financing conditions have not improved because the “three red lines” policy is still in place and home sales have collapsed (Chart 22). Chart 20A Further Deterioration In Housing Market Indicators In April
A Further Deterioration In Housing Market Indicators In April
A Further Deterioration In Housing Market Indicators In April
Chart 21Housing Prices Are Set To Contract In 2H 2022
Housing Prices Are Set To Contract In 2H 2022
Housing Prices Are Set To Contract In 2H 2022
Chart 22Slumping Home Sales Exacerbate Real Estate Developers’ Funding Woes
Slumping Home Sales Exacerbate Real Estate Developers' Funding Woes
Slumping Home Sales Exacerbate Real Estate Developers' Funding Woes
A Collapse In Household Consumption Due To Covid Confinement Measures City lockdowns have taken a heavy toll on China’s household consumption. Both retail sales and service sector business activity experienced their deepest contractions since March 2020 (Chart 23). Notably, the growth of online goods sales slipped under zero in April, below that recorded in early 2000 and the first contraction since data collection began. Furthermore, both core and service consumer prices (CPI) weakened again in April, reflecting lackluster consumer demand (Chart 24). Chart 23Chinese Retail Sales Contracted The Most Since March 2020
Chinese Retail Sales Contracted The Most Since March 2020
Chinese Retail Sales Contracted The Most Since March 2020
Chart 24Weak Core And Service CPIs Also Reflect Lackluster Household Demand
Weak Core And Service CPIs Also Reflect Lackluster Household Demand
Weak Core And Service CPIs Also Reflect Lackluster Household Demand
Labor market dynamics went downhill rapidly. The nationwide urban unemployment rate rose to its highest level since mid-2020, while the unemployment rate among younger workers climbed to an all-time high (Chart 25). Meanwhile, sharply slowing wage growth since mid-2021 has contributed to a deceleration of household income (Chart 26). The gloomy sentiment on future income also impedes a household’s willingness to consume (Chart 27). Chart 25Labor Market Situation Is Dramatically Worse
Labor Market Situation Is Dramatically Worse
Labor Market Situation Is Dramatically Worse
Chart 26Household Income Growth Has Been Falling
Household Income Growth Has Been Falling
Household Income Growth Has Been Falling
All in all, China’s household consumption will be hindered not only by renewed threats from flareups in domestic COVID-19 cases, but also by a worsening labor market situation and depressed household sentiment in the medium term. Chart 27Poor Sentiment On Funture Income Contributes To Consumers' Unwillingness To Spend
Poor Sentiment On Funture Income Contributes To Consumers' Unwillingness To Spend
Poor Sentiment On Funture Income Contributes To Consumers' Unwillingness To Spend
Table 1China Macro Data Summary
A Subdued Recovery In 2H 2022
A Subdued Recovery In 2H 2022
Table 2China Financial Market Performance Summary
A Subdued Recovery In 2H 2022
A Subdued Recovery In 2H 2022
Strategic Themes Cyclical Recommendations
The PBoC reduced the five-year loan prime rate – the mortgage reference rate – by 15bps on Friday to 4.45%, below expectations of 4.55%. This marks the latest attempt by Chinese policymakers to revive the housing market. Earlier in the week, financial…
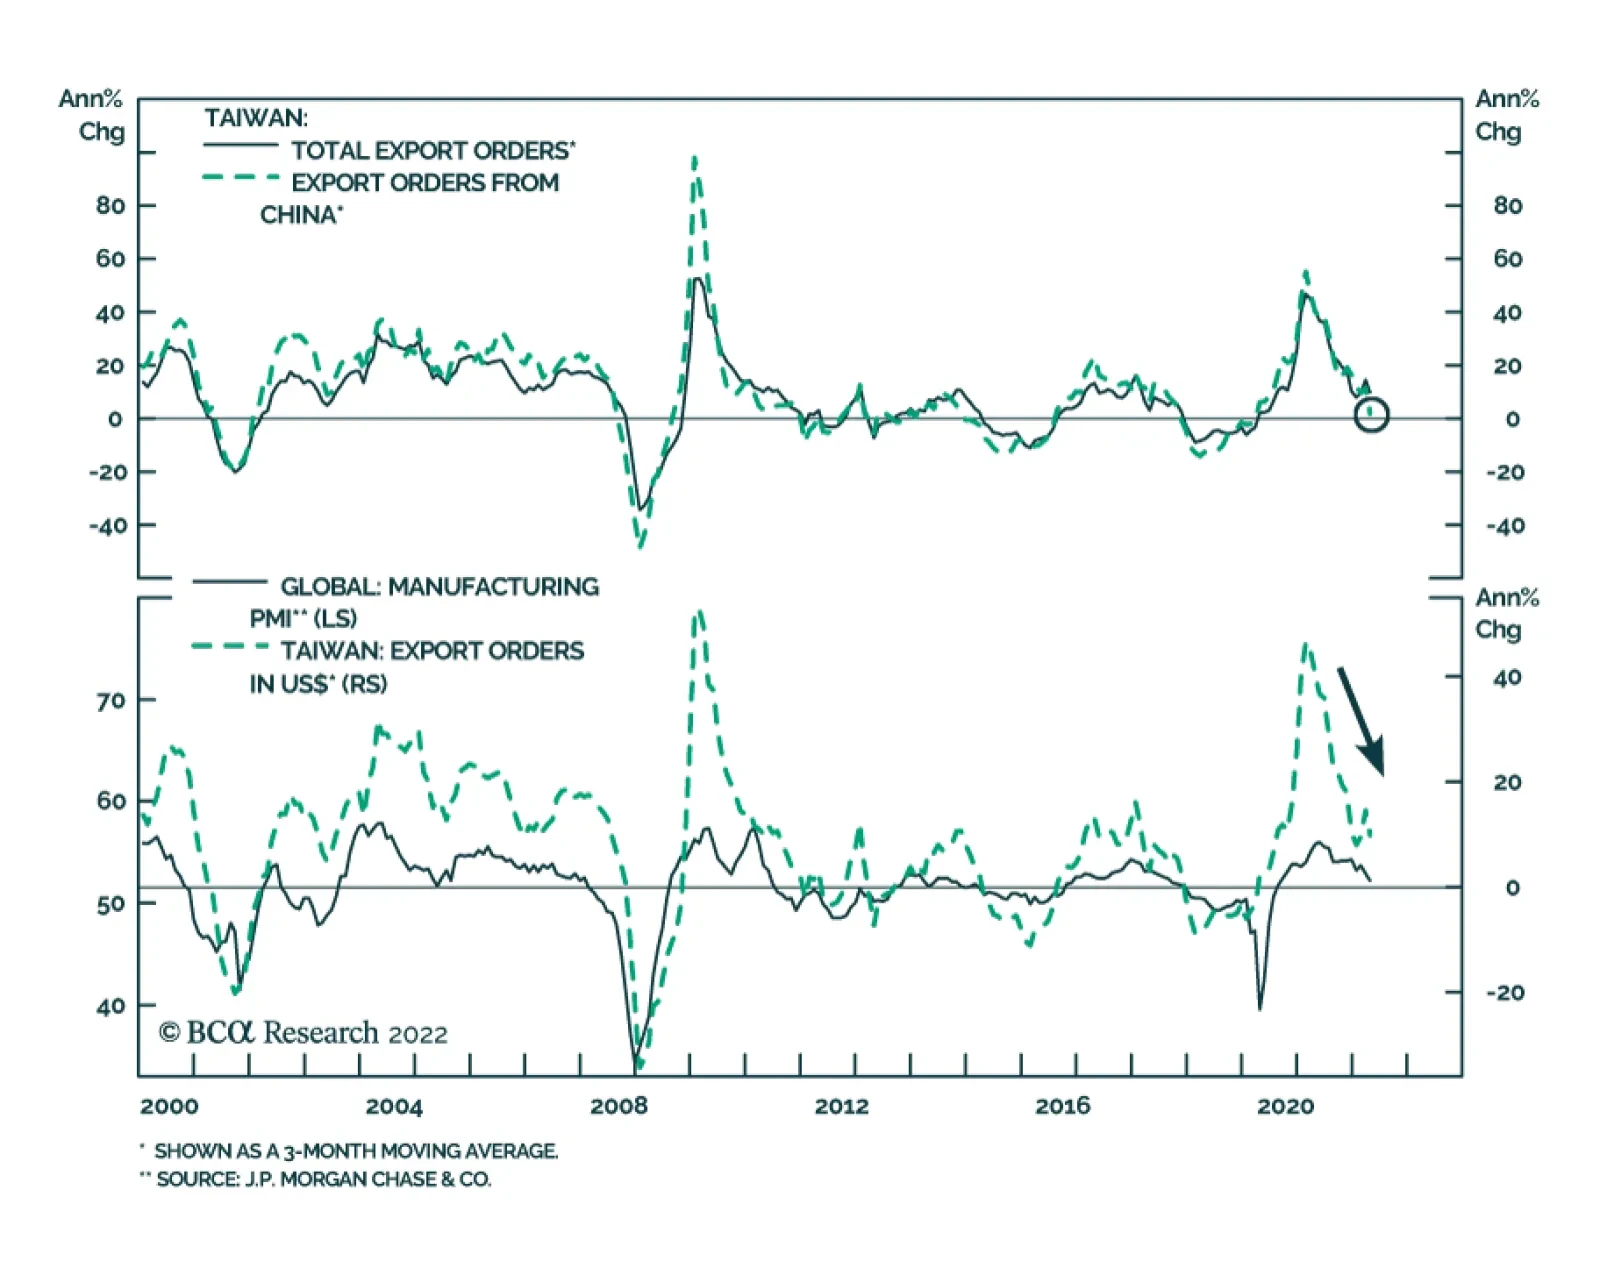
Taiwanese export orders for April sent a negative signal about the global manufacturing cycle. Overall export orders contracted by 5.5% y/y, a massive disappointment to expectations of a slowdown in the annual rate of increase from 16.8% in March to 11.5%.…
Listen to a short summary of this report. Executive Summary The US Inflation Surprise Index Has Rolled Over
Goldilocks: A Skeptical Q&A
Goldilocks: A Skeptical Q&A
Global equities are nearing a bottom and will rally over the coming months as inflation declines and growth reaccelerates. While equity valuations are not at bombed-out levels, they have cheapened significantly. Global stocks trade at 15.3-times forward earnings. We are upgrading tech stocks from underweight to neutral. The NASDAQ Composite now trades at a forward P/E of 22.6, down from 32.9 at its peak last year. The 10-year Treasury yield should decline to 2.5% by the end of the year, which will help tech stocks at the margin. The US dollar has peaked. A weakening dollar will provide a tailwind to stocks, especially overseas bourses. US high-yield spreads are pricing in a default rate of 6.2% over the next 12 months, well above the trailing default rate of 1.2%. Favor high-yield credit over government bonds within a fixed-income portfolio. Bottom Line: The recent sell-off in stocks provides a good opportunity to increase equity allocations. We expect global stocks to rise 15%-to-20% over the next 12 months. Back to Bullish We wrote a report on April 22nd arguing that global equities were heading towards a “last hurrah” in the second half of the year as a Goldilocks environment of falling inflation and supply-side led growth emerges. Last week, we operationalized this view by tactically upgrading stocks to overweight after having downgraded them in late February. This highly out-of-consensus view change, coming at a time when surveys by the American Association of Individual Investors and other outfits show extreme levels of bearishness, has garnered a lot of attention. In this week’s report, we answer some of the most common questions from the perspective of a skeptical reader. Q: Inflation is at multi-decade highs, global growth is faltering, and central banks are about to hike rates faster than we have seen in years. Isn’t it too early to turn bullish? A: We need to focus on how the world will look like in six months, not how it looks like now. Inflation has likely peaked and many of the forces that have slowed growth, such as China’s Covid lockdown and the war in Ukraine, could abate. Q: What is the evidence that inflation has peaked? And may I remind you, even if inflation does decline later this year, this is something that most investors and central banks are already banking on. Inflation would need to fall by more than expected for your bullish scenario to play out. A: That’s true, but there is good reason to think that this is precisely what will happen. Overall spending in the US is close to its pre-pandemic trend. However, spending on goods remains above trend while spending on services is below trend (Chart 1). Services prices tend to be stickier than goods prices. Thus, the shift in spending patterns caused goods inflation to rise markedly with little offsetting decline in services inflation. To cite one of many examples, fitness equipment prices rose dramatically, but gym membership fees barely fell (Chart 2). Chart 1Total US Consumer Spending Is Almost Exactly At Its Pre-Pandemic Trend, But The Composition Of Spending Remains Skewed
Total US Consumer Spending Is Almost Exactly At Its Pre-Pandemic Trend, But The Composition Of Spending Remains Skewed
Total US Consumer Spending Is Almost Exactly At Its Pre-Pandemic Trend, But The Composition Of Spending Remains Skewed
Chart 2Asymmetries Matter: Firms Manufacturing Sports Equipment Jacked Up Prices, But Gyms Barely Cut Prices
Asymmetries Matter: Firms Manufacturing Sports Equipment Jacked Up Prices, But Gyms Barely Cut Prices
Asymmetries Matter: Firms Manufacturing Sports Equipment Jacked Up Prices, But Gyms Barely Cut Prices
As goods demand normalizes, goods inflation will come down. Meanwhile, the supply of goods should increase as the pandemic winds down, and hopefully, a detente is reached in Ukraine. There are already indications that some supply-chain bottlenecks have eased (Chart 3). Q: Even if supply shocks abate, which seems like a BIG IF to me, wouldn’t the shift in spending towards services supercharge what has been only a modest acceleration in services inflation so far? A: Wages are the most important driver of services inflation. Although the evidence is still tentative, it does appear as though wage inflation is peaking. The 3-month annualized growth rate in average hourly earnings for production and nonsupervisory workers slowed from 7.2% in the second half of 2021 to 3.8% in April (Chart 4). Assuming productivity growth of 1.5%, this is consistent with unit labor cost inflation of only slightly more than 2%, which is broadly consistent with the Fed’s CPI inflation target.1
Image
Chart 4Wage Pressures May Be Starting To Ease
Wage Pressures May Be Starting To Ease
Wage Pressures May Be Starting To Ease
Image
Moreover, a smaller proportion of firms expect to raise wages over the next six months than was the case late last year according to a variety of regional Fed surveys (Chart 5). The same message is echoed by the NFIB small business survey (Chart 6). Consistent with all this, the US Citi Inflation Surprise Index has rolled over (Chart 7). Chart 6... Small Business Owners Included
... Small Business Owners Included
... Small Business Owners Included
Chart 7The US Inflation Surprise Index Has Rolled Over
The US Inflation Surprise Index Has Rolled Over
The US Inflation Surprise Index Has Rolled Over
Q: What about the “too cold” risk to your Goldilocks scenario? The risks of recession seem to be rising. A: The market is certainly worried about this outcome, and that has been the main reason stocks have fallen of late. However, we do not think this fear is justified, certainly not in the US (Chart 8). US households are sitting on $2.3 trillion excess savings, equal to about 14% of annual consumption. The ratio of household debt-to-disposable income is down 36 percentage points from its highs in early 2008, giving households the wherewithal to spend more. Core capital goods orders, a good leading indicator for capex, have surged. The homeowner vacancy rate is at a record low, suggesting that homebuilding will be fairly resilient in the face of higher mortgage rates. Q: It seems like the Fed has a nearly impossible task on its hands: Increase labor market slack by enough to cool the economy but not so much as to trigger a recession. You yourself have pointed out that the Fed has never achieved this in its history. A: It is correct that the unemployment rate has never risen by more than one-third of a percentage point in the US without a recession occurring (Chart 9). That said, there are three reasons to think that a soft landing can be achieved this time.
Image
Chart 9When Unemployment Starts Rising, It Usually Keeps Rising
When Unemployment Starts Rising, It Usually Keeps Rising
When Unemployment Starts Rising, It Usually Keeps Rising
First, increasing labor market slack is easier if one can raise labor supply rather than reducing labor demand. Right now, the participation rate is nearly a percentage point below where it was in 2019, even if one adjusts for increased early retirement during the pandemic (Chart 10). Wages have risen relatively more at the bottom end of the income distribution. This should draw more low-wage workers into the labor force. Furthermore, according to the Federal Reserve, accumulated bank savings for the lowest-paid 20% of workers have been shrinking since last summer, which should incentivize job seeking (Chart 11). Chart 10Labor Participation Has Further Scope To Recover
Labor Participation Has Further Scope To Recover
Labor Participation Has Further Scope To Recover
Chart 11Depleted Savings Will Force More Lower-Wage Workers Into The Labor Market
Depleted Savings Will Force More Lower-Wage Workers Into The Labor Market
Depleted Savings Will Force More Lower-Wage Workers Into The Labor Market
Second, long-term inflation expectations remain well contained, which makes a soft landing more likely. Median expected inflation 5-to-10 years out in the University of Michigan survey stood at 3% in May, roughly where it was between 2005 and 2013 (Chart 12). Median expected earnings growth in the New York Fed Survey of Consumer Expectations was only slightly higher in April than it was prior to the pandemic (Chart 13). Chart 12Consumer Long-Term Inflation Expectations Have Risen But Remain Relatively Low
Consumer Long-Term Inflation Expectations Have Risen But Remain Relatively Low
Consumer Long-Term Inflation Expectations Have Risen But Remain Relatively Low
Chart 13US Consumers Do Not Expect Wages To Grow At A Much Higher Rate Than In The Pre-Pandemic Period
US Consumers Do Not Expect Wages To Grow At A Much Higher Rate Than In The Pre-Pandemic Period
US Consumers Do Not Expect Wages To Grow At A Much Higher Rate Than In The Pre-Pandemic Period
A third reason for thinking that a soft landing may be easier to achieve this time around is that the US private-sector financial balance – the difference between what the private sector earns and spends – is still in surplus (Chart 14). This stands in contrast to the lead-up to both the 2001 and 2008-09 recessions, when the private sector was living beyond its means. Q: You have spoken a lot about the US, but the situation seems dire elsewhere. Europe may already be in recession as we speak! A: The near-term outlook for Europe is indeed challenging. The euro area economy grew by only 0.8% annualized in the first quarter. Mathieu Savary, BCA’s Chief European Strategist, expects an outright decline in output in Q2. To no one’s surprise, the war in Ukraine is weighing on European growth. The Bundesbank estimates that a full embargo of Russian oil and gas would reduce German real GDP by an additional 5% on top of the damage already inflicted by the war (Chart 15). Chart 14The US Private-Sector Financial Balance Remains In Surplus
The US Private-Sector Financial Balance Remains In Surplus
The US Private-Sector Financial Balance Remains In Surplus
Chart 15Germany’s Economy Will Sink Without Russian Energy
Goldilocks: A Skeptical Q&A
Goldilocks: A Skeptical Q&A
While such a full embargo is possible, it is not our base case. In a remarkable about-face, Putin now says he has “no problems” with Finland and Sweden joining NATO, provided that they do not place military infrastructure in their countries. He had previous threatened a military response at the mere suggestion of NATO membership. In any case, there are few signs that Putin’s increasingly insular and dictatorial regime would respond to an oil embargo or other economic incentives. The wealthy oligarchs who were supposed to rein him in are cowering in fear. It is also not clear if Europe would gain any political leverage over Russia by adopting policies that push its own economy into a recession. It is worth noting that the price of the December 2022 European natural gas futures contract is down 39% from its peak at the start of the war (Chart 16). It is also noteworthy that European EPS estimates have been trending higher this year even as GDP growth estimates have been cut (Chart 17). This suggests that the analyst earnings projections were too conservative going into the year. Chart 16European Natural Gas Futures Are High But Below Their Peak
European Natural Gas Futures Are High But Below Their Peak
European Natural Gas Futures Are High But Below Their Peak
Chart 17European And US EPS Estimates Have Been Trending Higher This Year
European And US EPS Estimates Have Been Trending Higher This Year
European And US EPS Estimates Have Been Trending Higher This Year
Chart 18Chinese Property Sector: Signs Of Contraction
Chinese Property Sector: Signs Of Contraction
Chinese Property Sector: Signs Of Contraction
Q: What about China? The lockdowns are crippling growth and the property market is in shambles. A: There is truth to both those claims. The government has all but said that it will not abandon its zero-Covid policy anytime soon, even going as far as to withdraw from hosting the 2023 AFC Asian Cup. While the number of new cases has declined sharply in Shanghai, future outbreaks are probable. On the bright side, China is likely to ramp up domestic production of Pfizer’s Paxlovid drug. Increased availability of the drug will reduce the burden of the disease once social distancing restrictions are relaxed. As far as the property market is concerned, sales, starts, completions, as well as home prices are all contracting (Chart 18). BCA’s China Investment Strategy expects accelerated policy easing to put the housing sector on a recovery path in the second half of this year. Nevertheless, they expect the “three red lines” policy to remain in place, suggesting that the rebound in housing activity will be more muted than in past recoveries.2 Ironically, the slowdown in the Chinese housing market may not be such a bad thing for the rest of the world. Remember, the main problem these days is inflation. To the extent that a sluggish Chinese housing market curbs the demand for commodities, this could provide some relief on the inflation front. Q: So bad news is good news. Interesting take. Let’s turn to markets. You mentioned earlier that equity sentiment was very bearish. Fair enough, but I would note the very same American Association of Individual Investors survey that you cited also shows that investors’ allocation to stocks is near record highs (Chart 19). Shouldn’t we look at what investors are doing rather than what they’re saying? A: The discrepancy may not be as large as it seems. As Chart 20 illustrates, investors may not like stocks, but they like bonds even less. Chart 19Individual Investors Still Hold A Lot Of Stock
Individual Investors Still Hold A Lot Of Stock
Individual Investors Still Hold A Lot Of Stock
Image
Chart 20B... But They Like Bonds Even Less
... But They Like Bonds Even Less
... But They Like Bonds Even Less
Chart 21Global Equities Are More Attractively Valued After The Recent Sell-Off
Global Equities Are More Attractively Valued After The Recent Sell-Off
Global Equities Are More Attractively Valued After The Recent Sell-Off
Global equities currently trade at 15.3-times forward earnings; a mere 12.5-times outside the US. The global forward earnings yield is 6.7 percentage points higher than the global real bond yield. In 2000, the spread between the earnings yield and the real bond yield was close to zero (Chart 21). It should also be mentioned that institutional data already show a sharp shift out of equities. The latest Bank of America survey revealed that fund managers cut equity allocations to a net 13% underweight in May from a 6% overweight in April and a net 55% overweight in January. Strikingly, fund managers were even more underweight bonds than stocks. Cash registered the biggest overweight in two decades. Q: Your bullish equity bias notwithstanding, you were negative on tech stocks last year, arguing that the NASDAQ would turn into the NASDOG. Given that the NASDAQ Composite is down 29% from its highs, is it time to increase exposure to some beaten down tech names? A: Both the cyclical and structural headwinds facing tech stocks that we discussed in These Three High-Flying Equity Sectors Could Come Crashing Back Down To Earth and The Disruptor Delusion remain in place. Nevertheless, with the NASDAQ Composite now trading at 22.6-times forward earnings, down from 32.9 at its peak last year, an underweight in tech is no longer appropriate (Chart 22). A neutral stance is now preferable. Chart 22Tech Stock Valuations Have Returned To Earth
Tech Stock Valuations Have Returned To Earth
Tech Stock Valuations Have Returned To Earth
Q: I guess if bond yields come down a bit more, that would help tech stocks? A: Yes. Tech stocks tend to be growth-oriented. Falling bond yields raise the present value of expected cash flows more for growth companies than for other firms. While we do expect global bond yields to eventually rise above current levels, yields are likely to decline modestly over the next 12 months as inflation temporarily falls. We expect the US 10-year yield to end the year at around 2.5%. Q: A decline in US bond yields would undermine the high-flying dollar, would it not? A: It depends on how bond yields abroad evolve. US Treasuries tend to be relatively high beta, implying that US yields usually fall more when global yields are declining (Chart 23). Thus, it would not surprise us if interest rate differentials moved against the dollar later this year. Chart 23US Treasuries Have A Higher Beta Than Most Other Government Bond Markets
US Treasuries Have A Higher Beta Than Most Other Government Bond Markets
US Treasuries Have A Higher Beta Than Most Other Government Bond Markets
It is also important to remember that the US dollar is a countercyclical currency (Chart 24). If global growth picks up as pandemic dislocations fade and the Ukraine war winds down, the dollar is likely to weaken. Chart 24The Dollar Is A Countercyclical Currency
The Dollar Is A Countercyclical Currency
The Dollar Is A Countercyclical Currency
Image
A wider trade deficit could also imperil the greenback. The US trade deficit has increased from US$45 billion in December 2019 to US$110 billion. Equity inflows have helped finance the trade deficit, but net flows have turned negative of late (Chart 25). Finally, the dollar is quite expensive – 27% overvalued based on Purchasing Power Parity exchange rates. Q: Let’s sum up. Please review your asset allocation recommendations both for the next 12 months and beyond. A: To summarize, global inflation has peaked. Growth should pick up later this year as supply-chain bottlenecks abate. The combination of falling inflation and supply-side led growth will provide a springboard for equities. We expect global stocks to rise 15%-to-20% over the next 12 months. Historically, non-US stocks have outperformed their US peers when the dollar has been weakening (Chart 26). EM stocks, in particular, have done well in a weak dollar environment Chart 26Non-US Stocks Will Benefit From A Weaker US Dollar
Non-US Stocks Will Benefit From A Weaker US Dollar
Non-US Stocks Will Benefit From A Weaker US Dollar
Chart 27The Market Is Too Pessimistic On Default Risk
The Market Is Too Pessimistic On Default Risk
The Market Is Too Pessimistic On Default Risk
Within fixed-income portfolios, we recommend a modest long duration stance over the next 12 months. We favor high-yield credit over safer government bonds. US high-yield spreads imply a default rate of 6.2% over the next 12 months compared to a trailing 12-month default rate of only 1.2% (Chart 27). Chart 28Falling Inflation Will Buoy Consumer Sentiment
Falling Inflation Will Buoy Consumer Sentiment
Falling Inflation Will Buoy Consumer Sentiment
Our guess is that this Goldilocks environment will end towards the end of next year. As inflation comes down, real wage growth will turn positive. Consumer confidence, which is now quite depressed, will improve (Chart 28). Stronger demand will cause inflation to reaccelerate in 2024, setting the stage for another round of central bank rate hikes. Peter Berezin Chief Global Strategist peterb@bcaresearch.com Follow me on LinkedIn Twitter Footnotes 1 The Federal Reserve targets an average inflation rate of 2% for the Personal Consumption Expenditures (PCE) index. Due to compositional differences between the two indices, CPI inflation has historically averaged 30-to-50 basis points higher than PCE inflation. This is why the Fed effectively targets a CPI inflation rate of 2.3%-to-2.5%. 2 The People’s Bank of China and the housing ministry issued a deleveraging framework for property developers in August 2020, consisting of a 70% ceiling on liabilities-to-assets, a net debt-to-equity ratio capped at 100%, and a limit on short-term borrowing that cannot exceed cash reserves. Developers breaching these “red lines” run the risk of being cut off from access to new loans from banks, while those who respect them can only increase their interest-bearing borrowing by 15% at most. Global Investment Strategy View Matrix
Goldilocks: A Skeptical Q&A
Goldilocks: A Skeptical Q&A
Special Trade Recommendations Current MacroQuant Model Scores
Goldilocks: A Skeptical Q&A
Goldilocks: A Skeptical Q&A
Executive Summary The Fed will continue to hike rates at a time when global trade is contracting. Earlier this week, Fed Chairman Jerome Powell reiterated that the Fed will not hesitate to hike rates until core consumer price inflation gets closer to 2%. Given that US core consumer price inflation is currently at around 5-6%, a mere rollover in core inflation from current levels will not be enough for the Fed to tone down its hawkishness. Besides, according to Powell, US financial conditions are not yet at a level that is consistent with inflation coming down substantially. China will stick to its dynamic zero-COVID policy this year. The economy will continue to underwhelm as the magnitude and nature of stimulus measures announced thus far are not adequate to produce a recovery. Industrial metal prices and global material stocks are at risk of gapping down. Play these markets on the short side. Commodity Currencies Are Signaling Lower Commodity Prices
Commodity Currencies Are Signaling Lower Commodity Prices
Commodity Currencies Are Signaling Lower Commodity Prices
Bottom Line: It is still dangerous to bottom fish in global equities and risk assets in general. The US dollar has more upside. Continue underweighting EM stocks and credit within global equity and credit portfolios, respectively. Feature The risks to global and EM risk assets are still skewed to the downside. Although investor sentiment on global equities has soured of late, we do not think global or EM equities have made a bottom, and the US dollar has not yet reached an apex. Consequently, absolute-return investors should stay defensive, and global equity portfolios should continue to underweight EM stocks. The Fed and Equities Are Still On A Collision Course Earlier this week, Fed Chairman Jerome Powell reiterated the Fed’s commitment to hiking interest rates until core consumer price inflation gets closer to 2%. Notably, in his speech at a WSJ event on May 17, Powell noted: “This is not a time for tremendously nuanced readings of inflation”… “We need to see inflation coming down in a convincing way. Until we do, we’ll keep going.” Given that US core consumer price inflation is currently at around 5-6%, a mere rollover in core inflation from current levels will not be enough for the Fed to tone down its hawkishness. Chart 1US Core Inflation Will Roll Over But Stay Above 3.5-4% For Now
US Core Inflation Will Roll Over But Stay Above 3.5-4% For Now
US Core Inflation Will Roll Over But Stay Above 3.5-4% For Now
Chart 1 shows the average of core median CPI, core trimmed-mean CPI and core sticky CPI, which are better indicators of genuine inflationary pressures because they are less affected by outliers. Even though core CPI inflation ticked down in April, other core measures such as core median CPI, core trimmed-mean CPI and core sticky CPI continued to rise. These core inflation measures are not likely to ease back to 2% unless economic growth falls below its potential. In his same speech, Chairman Powell also asserted: “We will go until we feel like we are at a place where we can say, ‘Yes, financial conditions are at an appropriate place. We see inflation coming down.’ We will go to that point, and there will not be any hesitation about that.” This means that US financial conditions have not yet tightened enough for the Fed to back down on its hawkishness. Finally, we have been arguing that a wage-price spiral has developed in the US as the labor market has become very tight (Chart 2, top panel). Wages and unit labor costs have been surging. Unit labor costs are the most important driver of US core CPI (Chart 2, bottom panel). Therefore, it will be impossible for the Fed to bring down core inflation toward 2% without a retrenchment in the labor market, i.e., layoffs. Rising unemployment will in turn weigh on household income growth and consumption. Chart 2The US Labor Market Is Very Tight And Wage Growth Is Accelerating
The US Labor Market Is Very Tight And Wage Growth Is Accelerating
The US Labor Market Is Very Tight And Wage Growth Is Accelerating
The cost of borrowing for companies is rising globally, and these periods often coincide with equity selloffs. Notably, surging US high-yield ex-energy corporate bond yields herald lower US share prices ahead (Chart 3, top panel). Similarly, rising EM corporate bond yields foreshadow a further decline in EM ex-TMT share prices (Chart 3, bottom panel). Chart 3Rising Corporate Bond Yields Are Bearish For Stocks
Rising Corporate Bond Yields Are Bearish For Stocks
Rising Corporate Bond Yields Are Bearish For Stocks
On the whole, the Fed and many other central banks will be hiking interest rates at a time when global trade volumes are contracting in H2 2022. As discussed in our report A Whiff Of Stagflation? US and EU imports of consumer goods are set to shrink following the pandemic boom. Chart 4Global Export/Manufacturing Are Heading Into Contraction
Global Export/Manufacturing Are Heading Into Contraction
Global Export/Manufacturing Are Heading Into Contraction
Meantime, rolling lockdowns and extremely weak income growth are depressing domestic demand in China. High food and energy prices as well as rising interest rates are weighing on EM ex-China consumption. The sharp underperformance of global cyclicals equities versus global defensive sectors corroborates our expectation that global manufacturing activity will contract (Chart 4). The trade-weighted US dollar typically benefits from both Fed hikes and a global trade slump. As long as the Fed is hawkish and global exports are contracting, the greenback will continue to appreciate. For now, the US dollar remains in a strong position for further appreciation, especially versus EM currencies (Chart 5). Consistently, the selloff in broad EM risk assets is not yet over. Chart 5EM Currencies: More Downside
EM Currencies: More Downside
EM Currencies: More Downside
A major reversal in the trade-weighted dollar will be a signal that the global macro backdrop is improving and that global share prices and EM risk assets are bottoming. Bottom Line: Although equities have become oversold and investor sentiment is depressed, any rebound will prove to be short lived. The Fed will continue to hike rates at a time when global trade is about to shrink. The global/EM equity selloff has further to run. China: Ordinary Stimulus Despite Extraordinary Conditions Only one thing is currently certain in China: authorities are committed to the dynamic zero-COVID policy. However, most experts outside China believe that it will be very difficult to wholly limit the spread of the easily transmissible Omicron variants, even with such stringent mainland containment policies. As a result, rolling lockdowns are the most likely scenario for China’s regions and cities in 2022. These lockdowns will depress household income, confidence and consumption. Private business investment and hiring will also tank. Have authorities provided enough stimulus to support a recovery in H2 2022? We do not think so. Chinese stimulus has so far been ordinary in nature and in magnitude. Policy easing will likely prove to be insufficient to lift the economy out of the current extraordinary slump. First, Chinese exports are set to shrink in H2 as US and EU consumption of consumer goods revert to their pre-pandemic trend. Demand from EM will remain weak. Second, rising unemployment and under-employment is hindering household income. Generous cash transfers are needed to offset this hit to income. Not only did aggregate retail sales collapse in April, but online sales of goods and service also plunged (Chart 6). It is hard to imagine that private businesses will be investing when consumer spending and exports are weak. Our proxies for the marginal propensity to spend for households and enterprises continue to fall (Chart 7). Chart 6China: Even Online Retail Sales Are Shrinking
China: Even Online Retail Sales Are Shrinking
China: Even Online Retail Sales Are Shrinking
Chart 7China: Household And Enterprise Propensity To Spend Have Been Declining
China: Household And Enterprise Propensity To Spend Have Been Declining
China: Household And Enterprise Propensity To Spend Have Been Declining
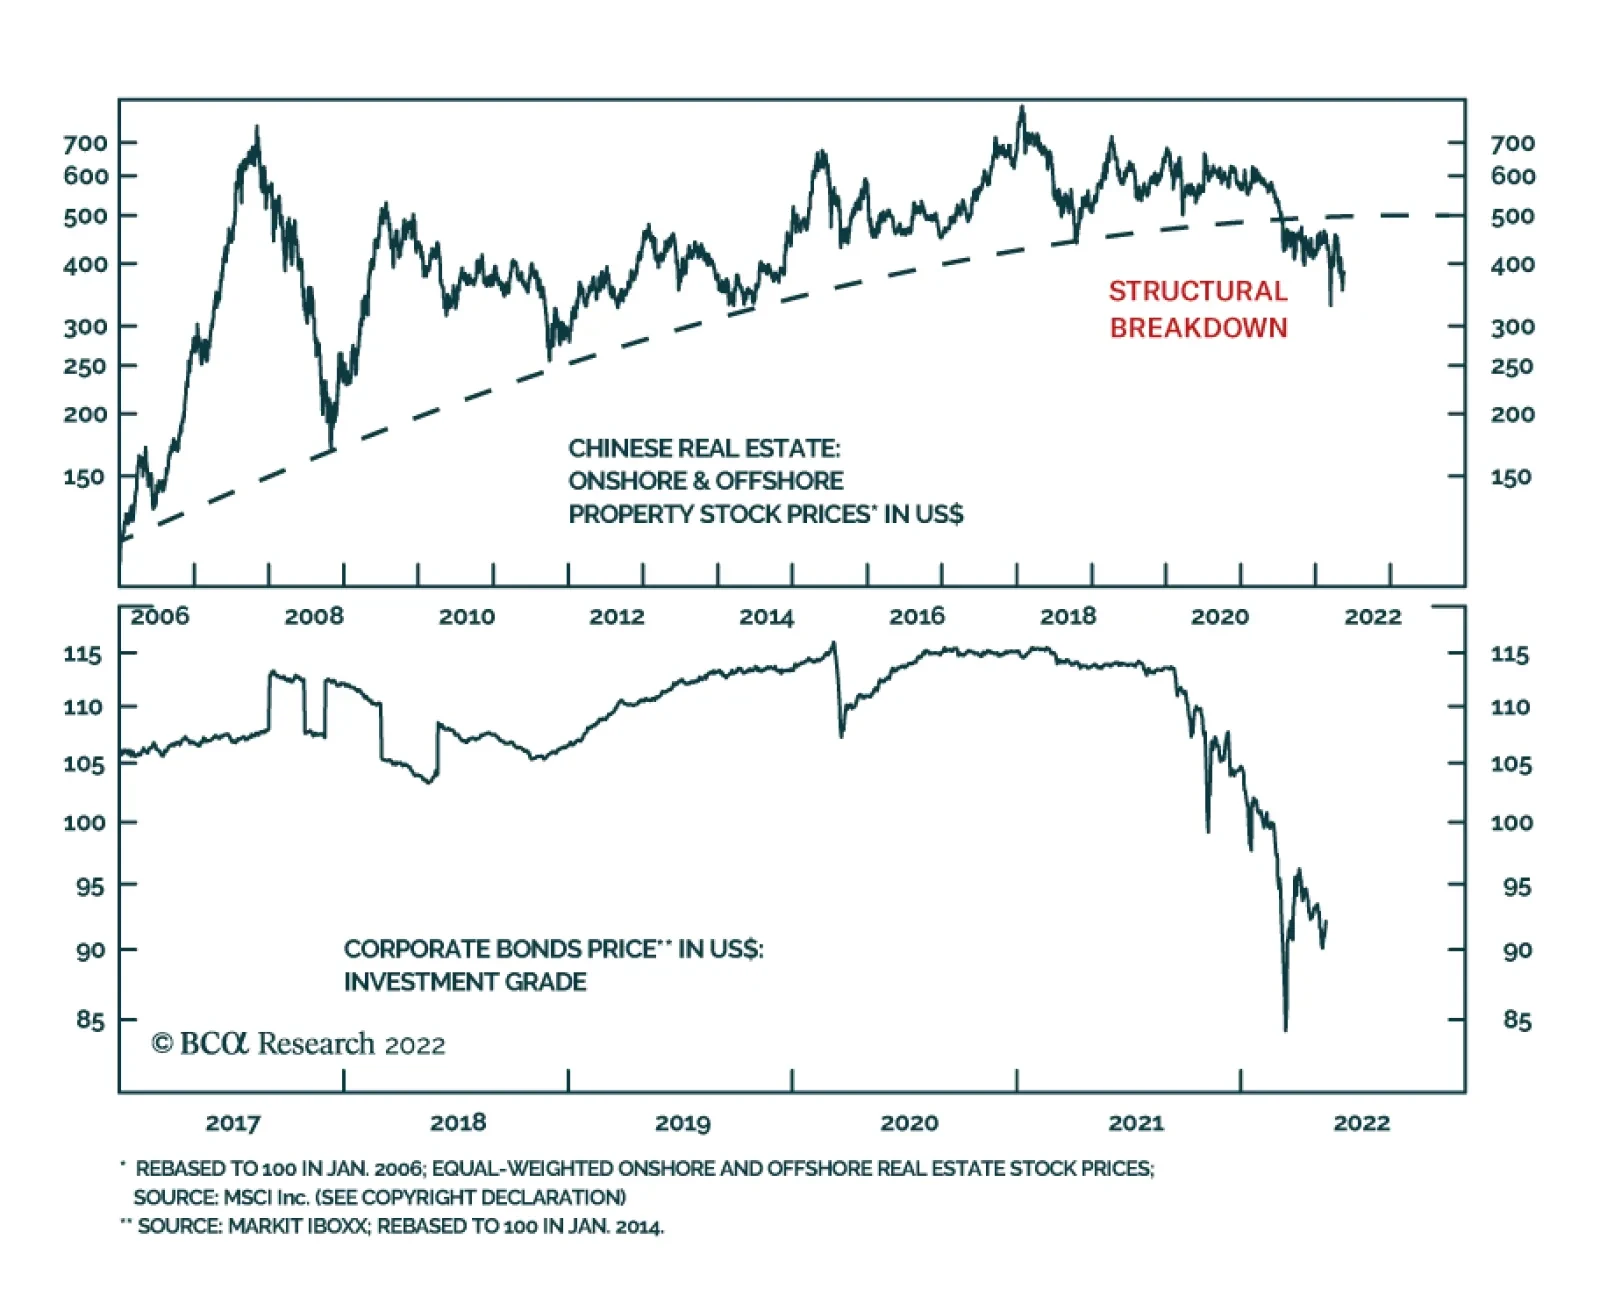
Critically, China’s credit impulse, excluding government bond issuance, remains in negative territory (Chart 8). Third, China’s property market is frail. Despite modest policy easing for the real estate market, sentiment among home buyers and developers remains downbeat. Given that the housing sector faces structural headwinds, odds are that buyers and developers might not react to the modest property market easing that authorities have so far provided. It is worth noting that Chinese property stocks seem to have had a structural breakdown, and offshore corporate bonds of real estate developers remain in a bear market (Chart 9). These market patterns corroborate that China's housing market has experienced a structural breakdown. Chart 8Chinese Stimulus Has So Far Been Tame
Chinese Stimulus Has So Far Been Tame
Chinese Stimulus Has So Far Been Tame
Chart 9Chinese Property Market Has Experienced A Structural Breakdown
Chinese Property Market Has Experienced A Structural Breakdown
Chinese Property Market Has Experienced A Structural Breakdown
Finally, even though infrastructure spending is being ramped up, it will prove to be insufficient for the economy to recover from a deep slump. Local governments are facing a major financing shortfall. Land sales – which make up about 40% of local government revenues – have dried up. This will hinder local governments’ ability to finance infrastructure projects. As to Chinese equities, internet/platform stocks have become oversold. However, their long-term outlook remains dismal. As we have been arguing since late 2020, the fundamental case for their de-rating remains intact. This week’s meeting between government officials and technology companies has not produced any positive news. Although the tone from authorities was more balanced, they did not offer any relief from already imposed regulations. Chart 10Implications Of China's Common Prosperity Policies
Implications Of China's Common Prosperity Policies
Implications Of China's Common Prosperity Policies
Looking forward, implementing common prosperity policies will be the primary objective of the Communist Party in the coming years. These policies will assure that labor’s share of income will rise further at the expense of corporate profits. Chart 10 demonstrates that the share of labor in national income has been rising since 2011. Conversely, the share operating profits peaked in 2011 and has dropped to a 30-year low. These dynamics will persist as income will continue to be redistributed from shareholders to labor in the majority of industries/companies in China. This is an unfriendly outlook for shareholders, especially foreign ones. Bottom Line: Chinese policy stimulus has so far been insufficient. The economy is in a deep slump, and share prices remain at risk of further decline. Short Industrial Metals And Material Stocks Chart 11Chinese Imports Of Metals Was Shrinking In 2021
Chinese Imports Of Metals Was Shrinking In 2021
Chinese Imports Of Metals Was Shrinking In 2021
Industrial metals’ resilience last year in the face of shrinking Chinese import volumes was unusual (Chart 11). This resilience was probably due to robust DM demand for goods, supply bottlenecks and investors buying commodities as an inflation hedge. As we elaborated in the April 28 report, risks to industrial metals are skewed to the downside. This is despite the fact that agriculture prices will likely rise further, and energy prices will remain volatile due to the geopolitical situation. We continue to recommend investors underweight/short materials stocks and industrial metals for the following reasons: It is ill-advised to play the US inflation story by being long industrial metals and materials stocks. As shown in Chart 2 above, US unit labor costs are driving core inflation, not industrial metals. China accounts for 50-55% of global industrial metal consumption, and since early 2021 the key risk in China has been decelerating demand/deflation not inflation. In fact, commodities have become a crowded hedge against inflation and a global growth slowdown poses a substantial risk to industrial metals. Chart 12 demonstrates that Chinese materials stocks have plunged. We read this as a warning sign for global materials because China is by far the largest consumer of raw materials (excluding energy). Chart 12Chinese Material Stocks Are Signaling Trouble For Global Materials
Chinese Material Stocks Are Signaling Trouble For Global Materials
Chinese Material Stocks Are Signaling Trouble For Global Materials
When share prices of customers are falling, equity prices of suppliers will likely follow. Chart 13 shows that over the past 200 years raw material prices in real US dollar terms (deflated by US headline CPI) have oscillated around a well-defined downtrend. The pandemic surge in commodity prices has pushed raw material prices to two standard deviations above this long-term trend. Chart 13Raw Material Prices (In Real Terms) Are At The Upper End Of A 200-Year Downtrend
Raw Material Prices (In Real Terms) Are At The Upper End Of A 200-Year Downtrend
Raw Material Prices (In Real Terms) Are At The Upper End Of A 200-Year Downtrend
Historically, commodity rallies (and even their secular bull markets) ended when prices reached this threshold. Hence, odds are that industrial commodities might hit a soft spot. Energy prices remain a wild card due to geopolitics. It is critical to note that the raw materials price index shown in Chart 13 does not include energy, gold and semi-precious metals. Finally, shrinking global trade volumes are also negative for raw materials. The average of AUD, NZD and CAD points to lower industrial metal prices (Chart 14). Chart 14Commodity Currencies Are Signaling Lower Commodity Prices
Commodity Currencies Are Signaling Lower Commodity Prices
Commodity Currencies Are Signaling Lower Commodity Prices
Chart 15Bearish Technical Patterns: BHP Share Price And Copper
Bearish Technical Patterns: BHP Share Price And Copper
Bearish Technical Patterns: BHP Share Price And Copper
The share price of BHP, the world’s largest mining company, has put in a major top and is now gapping down (Chart 15, top panel). Copper prices have broken below their 200-day moving average that served as a support in the past 12 months (Chart 15, bottom panel). These market profiles point to more downside. We continue to recommend that investors play this theme in the following ways: Short copper or short copper / long gold; Short global materials / long global industrials; Short ZAR / long USD. Also, we downgraded Brazil early this week partly due to expectations of lower iron ore prices and souring investor attitude toward commodity plays in general. Investment Conclusions Global and EM equities have entered a capitulation phase. It is still dangerous to bottom fish in global equities and risk assets in general. Continue underweighting EM stocks and credit within global equity and credit portfolios, respectively. The US dollar has more upside. Continue shorting the following EM currencies versus the USD: ZAR, PLN, HUF, COP, PEN, PHP and IDR. As we discussed in a recent report, we are approaching a major buying opportunity in EM local currency bonds. However, the US dollar needs to peak for that to transpire. Arthur Budaghyan Chief Emerging Markets Strategist arthurb@bcaresearch.com Strategic Themes (18 Months And Beyond) Equities Cyclical Recommendations (6-18 Months) Cyclical Recommendations (6-18 Months)
Prices of newly built homes in 70 Chinese cities declined by 0.3% m/m in April, marking the eighth consecutive monthly decline. Home prices in both second- and third-tier cities declined last month, while the pace of increase in first-tier cities moderated to…
BCA Research’s China Investment Strategy service concludes that China’s food price inflation is not immune to the higher prices of global agricultural products. China is well stocked with food reserves and does not rely on imports for most of its…
Executive Summary Increase In Chinese Ag Prices Has Been Much More Muted Than Globally
Increase In Chinese Ag Prices Has Been Much More Muted Than Globally
Increase In Chinese Ag Prices Has Been Much More Muted Than Globally
China’s food price inflation accelerated in April. The rising cost of global agricultural goods and domestic COVID-related disruptions in the supply-chain contributed to a sharp bump in food prices last month. China is not overly reliant on food imports. The country is also well stocked with grain reserves and should weather ongoing global food supply shortages, particularly wheat, better than most emerging economies. However, China will still be impacted by escalating prices of global agricultural products and energy. Some imported goods (e.g. soybeans and related products) that China relies on, coupled with higher energy costs and a bottoming in China’s pork prices, will continue to push up food prices and headline inflation. Higher reading in headline inflation will not change the direction of the PBoC’s monetary policy. However, more expensive food will dampen Chinese households’ spending power on non-food consumer goods, especially as income growth slows. The food and beverage sector in China’s onshore stocks will benefit from higher food costs. We are initiating a new trade: long domestic consumer staples/broad A-share market. CYCLICAL RECOMMENDATIONS (6 - 18 MONTHS) INITIATION DATE RETURN SINCE INCEPTION (%) COMMENT LONG DOMESTIC CONSUMER STAPLES/BROAD A-SHARE MARKET 05/18/2022 Bottom Line: Despite China’s solid self-sufficiency in food supplies, its food price inflation is not immune from the mounting prices of global agricultural products. Is China’s Food Price Inflation Transitory? The food component of China’s consumer price index (CPI) increased by 0.9% in April compared with the previous month, a sharp reversal from a 1.2% month-over-month decline in March. Higher food and energy prices pushed headline CPI to 2.1% in April, the fastest year-on-year growth since August 2020. China is not overly reliant on food imports and has abundant grain reserves. The country is in a better position to weather ongoing global supply shortages in grain compared with other emerging economies, such as the Middle East and North Africa. Moreover, agricultural product prices in China have been structurally higher than those traded in the global commodity market. Large margins in China’s bulk agricultural pricing provide a cushion from escalating global food prices. Nonetheless, China remains at risk for higher food prices this year. Elevated oil prices and the war in Ukraine will further lift the price of fertilizers, adding to input costs for agricultural products. A strong USD will add to the price of USD-denominated commodity imports, particularly soybeans. In addition, China’s domestic pork price may have reached its hog cycle bottom and will pick up in the second half of this year. Food Prices Are Driving Up Inflation China’s headline CPI accelerated to 2.1% in April, on a year-on-year basis, from 1.5% in the previous month. Even though pork prices plunged by 33% in April from a year ago, food prices grew by 1.9% and have been boosted by a jump in the cost of fresh food, such as vegetables (+24% year-on-year), fruit (+14%) and eggs (+12%). Prices in other food categories, such as grains and edible oil, also rose, albeit more modestly (Chart 1A and 1B). Chart 1ALarge Jump In Fresh Food Prices In April
Large Jump In Fresh Food Prices In April
Large Jump In Fresh Food Prices In April
Chart 1BOther Food Prices Also Picked Up, But More Modestly
Other Food Prices Also Picked Up, But More Modestly
Other Food Prices Also Picked Up, But More Modestly
China’s strict COVID-19 containment measures have had a broad-based impact on food supplies. Mobility restrictions, roadblocks and risk-averse truck drivers introduced significant challenges in food supplies and transportation. Lockdowns in some large urban areas also led to panic buying and stockpiling among consumers, pushing up demand. Chart 2Increase In Chinese Ag Prices Has Been Much More Muted Than Globally
Increase In Chinese Ag Prices Has Been Much More Muted Than Globally
Increase In Chinese Ag Prices Has Been Much More Muted Than Globally
Meanwhile, higher global food and energy prices have likely both directly and indirectly contributed to food price inflation in China. The UN Food and Agriculture Organization (FAO) Food Price Index in April this year leapt to its highest level since its inception in 1990; it is 30% higher than last year and nearly double from its trough in mid-2020. Although price increases in China’s domestic agricultural products have been more moderate, the country’s agricultural wholesale prices have jumped by 10% from a year ago (Chart 2). Bottom Line: Food accounts for about 20% of China’s CPI basket (Chart 3). Climbing food, along with energy, prices are driving up China’s headline inflation. Chart 3Food Accounts For 20% Of Chinese Household Budgets
Is China’s Food Price Inflation Transitory?
Is China’s Food Price Inflation Transitory?
China Is In A Good Position To Weather Global Food Supply Shocks … Chart 4Ex-China Food Inventories Haven’t Been Built
Is China’s Food Price Inflation Transitory?
Is China’s Food Price Inflation Transitory?
China is well stocked with food reserves and does not rely on imports for most of its agricultural supplies. Thus, the country should weather ongoing global shortages in the food supply better than most emerging economies (Chart 4). China’s food inventories are significantly higher than levels in the 2006-2008 and 2010-2012 global food price hikes (Chart 5). The nation’s inventories have been steadily building up in the past decade to avert potential food supply shortages. Corn and rice stocks are sufficient to cover consumption for nearly three quarters of a year and wheat stocks are at nearly a year’s worth of consumption. Chart 5China Has Been Building Up Inventories To Buffer Against Supply Shortfalls
Is China’s Food Price Inflation Transitory?
Is China’s Food Price Inflation Transitory?
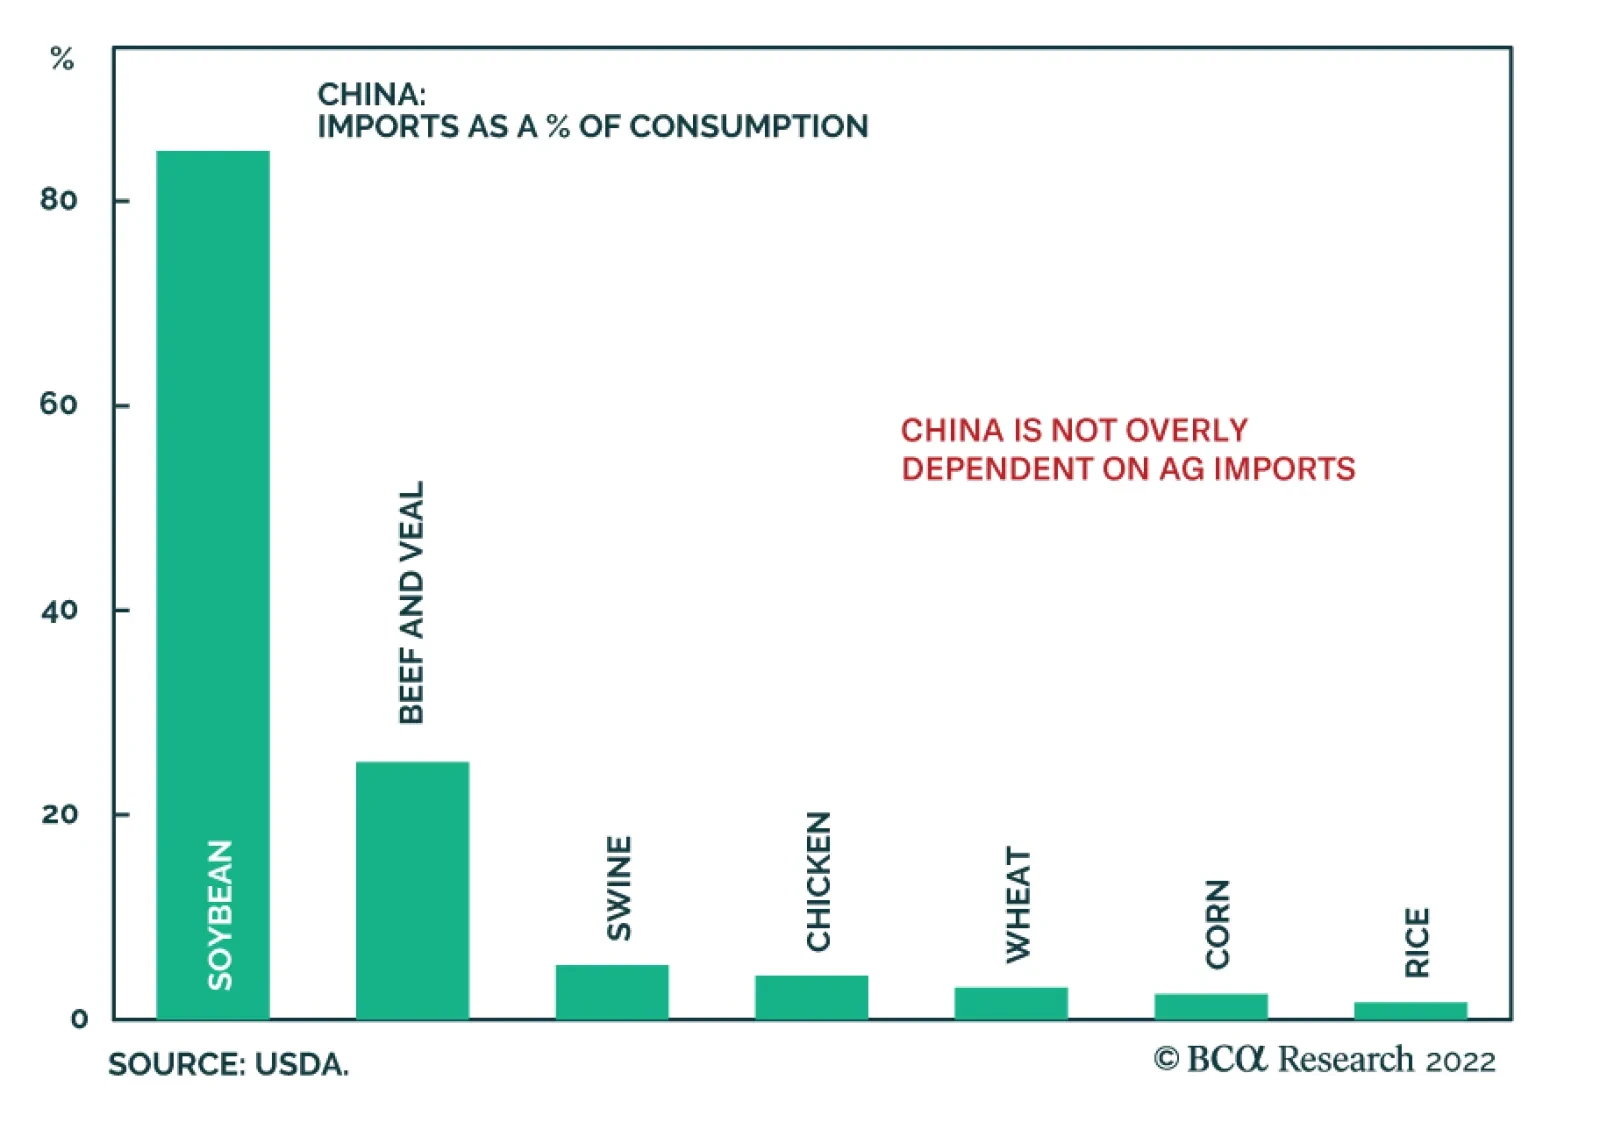
Chart 6China Is Not Overly Dependent On Ag Imports
Is China’s Food Price Inflation Transitory?
Is China’s Food Price Inflation Transitory?
Furthermore, with the exception of soybeans, China is not overly dependent on imports for agricultural supplies (Chart 6). The country is self-sufficient in supplying rice, wheat, and corn, three major staples in China’s grain consumption basket. Less than 5% of China’s total consumption of the three staple grains comes from imports. Bottom Line: China is well stocked with agriculture products and is not overly dependent on imports for its food supplies. … But Not Immune To Food Price Hikes Worldwide Chart 7Ag Products Are Traded At Higher Prices In China Than In The Global Market
Ag Products Are Traded At Higher Prices In China Than In The Global Market
Ag Products Are Traded At Higher Prices In China Than In The Global Market
Rising global agricultural and energy prices could still push up the country’s food price inflation. In USD terms, prices of China’s domestic agricultural products have been structurally higher than those traded on global commodity markets (Chart 7). The government heavily regulates and subsidizes its agricultural procurement prices as an encouragement to domestic farmers. When global food supply shocks sharply pushed up agricultural prices worldwide, China’s domestic agricultural prices, with their large buffer versus global food prices, rose more moderately. Nonetheless, China’s domestic food prices are not insulated from worldwide price hikes. China is facing higher inflation in food prices this year for the following reasons: Pork prices, which account for 13% of China’s CPI food basket, have likely bottomed. Although pork prices remain in a deep contraction year-over-year, they rebounded sharply in April on a month-on-month basis (Chart 8). The number of sows peaked in mid-2021 and has been declining for the past 10 consecutive months. Falling sow numbers have historically led to rising pork prices (Chart 9). Chart 8Pork Prices May Have Bottomed
Pork Prices May Have Bottomed
Pork Prices May Have Bottomed
Chart 9Pork Prices Will Likely Increase In 2H22
Is China’s Food Price Inflation Transitory?
Is China’s Food Price Inflation Transitory?
Nearly 90% of China’s soybean consumption relies on imports, making the country vulnerable to external price fluctuations. Soybean prices have jumped sharply this year. A stronger USD will also add to the price of USD-denominated commodity imports. About 80% of Chinese soybeans are crushed to produce meal to feed China’s massive pork industry, which means higher soybean prices will indirectly lead to rising pork prices by boosting input costs. Given that pig output is approaching its cyclical bottom, an increase in pig livestock would mean more demand for soybeans. Chart 10Edible Oil Prices Reached Their Highest In Decades
Edible Oil Prices Reached Their Highest In Decades
Edible Oil Prices Reached Their Highest In Decades
Growing prices in soybeans and corn will lift the cost of cooking oil, which represents about 8% of China’s food CPI basket (Chart 10). Ukraine supplies 30% of China’s corn imports, and Russia and Ukraine together account for nearly 20% of China’s soybean oil imports. China ramped up corn imports from Ukraine through March despite the war and snapped up large volumes of US corn in April after supplies from Ukraine were cut off. Nonetheless, prices of soybeans and corn will likely remain elevated with no end in sight to the Russia-Ukraine war and supply shortages globally. In addition, as global travel becomes more popular and oil prices remain elevated, the demand for corn-based ethanol, which is blended with gasoline, will also expand. Wheat prices will continue to experience upward pressure in the global market, mainly due to reduced production and exports from Ukraine and Russia (these countries account for 30% of world’s wheat exports). The World Bank forecasts that wheat will be 40% more expensive this year, reaching an all-time high in nominal terms.1 Although China is about 96% self-sufficient in wheat, the upsurge in global prices has boosted China’s domestic cost for wheat; it climbed by 15% in May from a year ago (Chart 11). Higher shipping and input costs, especially for fertilizers, will exacerbate the upside price pressures on agricultural goods. China is the world’s largest exporter of phosphate fertilizer, but its domestic fertilizer prices are heavily subsidized and much cheaper than exported ones (Chart 12). However, the domestic cost of fertilizer will likely follow the lead of rising global prices for fertilizers and agricultural products. Chart 11Chinese Wheat Prices Jumped Against The Backdrop Of Global Supply Shortages
Chinese Wheat Prices Jumped Against The Backdrop Of Global Supply Shortages
Chinese Wheat Prices Jumped Against The Backdrop Of Global Supply Shortages
Chart 12China's Domestic Fertilizer Prices Will Likely Trend Up
China's Domestic Fertilizer Prices Will Likely Trend Up
China's Domestic Fertilizer Prices Will Likely Trend Up
The relationship between agricultural prices and the dollar broke down early last year (Chart 13). Historically, a strong USD would weigh down agricultural prices by encouraging ex-US producers to raise exports and boost global supplies. However, the COVID pandemic and war in Ukraine have triggered a global surge in government controls on food exports. Such broad enforcement of protectionist measures will continue to exacerbate worldwide inflationary pressures on food. Chart 13The Inverse Relationship Between Global Ag Prices And The Dollar Has Broken Down
The Inverse Relationship Between Global Ag Prices And The Dollar Has Broken Down
The Inverse Relationship Between Global Ag Prices And The Dollar Has Broken Down
Bottom Line: China’s food prices face upward pressure. Strengthening global prices in a wide range of agricultural products, coupled with higher energy costs and a bottoming in China’s pork prices, will all contribute to higher food price inflation in the country. Investment Conclusions Chart 14Core CPI Remains Subdued
Core CPI Remains Subdued
Core CPI Remains Subdued
Food price inflation should not constrain the PBoC from further easing monetary policy. As mentioned in previous reports, China’s monetary policy framework has shifted away from headline CPI and has been anchored in core CPI, which has remained subdued (Chart 14). However, China’s accelerating food and energy prices, as household income growth is slowing, will lower households’ purchasing power and curb their demand for non-food consumer goods and services. While China’s overall consumption and economy will suffer from higher food price inflation, soaring food prices will help to widen the profit margins among food processing firms (Chart 15). Furthermore, food and beverage companies in China’s onshore equity market have one of the highest ROAs and the lowest financial leverages (Chart 16). We are initiating a new trade: long Chinese onshore consumer staples/short broad A-share market. Chart 15Long Chinese Onshore Consumer Staples...
Long Chinese Onshore Consumer Staples...
Long Chinese Onshore Consumer Staples...
Chart 16...As The Sector Will Benefit From Rising Food Prices
...As The Sector Will Benefit From Rising Food Prices
...As The Sector Will Benefit From Rising Food Prices
Jing Sima China Strategist jings@bcaresearch.com Footnotes 1 The World Bank’s Commodity Markets Outlook Report, April 2022. Strategic Themes Cyclical Recommendations
Chinese retail sales shrunk by a whopping 11.1% y/y in April, significantly below the anticipated 6.6% decline. Consumer staples (food, beverage, medicine and petroleum) are the only categories that did not experience a contraction in sales. Instead, their…
Executive Summary China’s Property Market: Signs Of Improvement?
China’s Property Market: Moderate Recovery Ahead
China’s Property Market: Moderate Recovery Ahead
The slump in China’s property market is nearing its cyclical end. The accelerated policy easing in the housing sector should lift the sector out of deep contraction and put it on its recovery path in the second half of this year. Policy easing had supported a quick and strong recovery in Chinese property demand during 2H2020, following the first COVID wave to hit China. This time, however, with the “three red lines” policy still in place and depressed household income growth, we expect only a moderate year-on-year growth (4-6%) in property sales during 2H2022. Chinese construction activity will also revive slightly, based on a mild recovery in project completions in 2H2022. Chinese property developers’ stocks could still have some downside in absolute terms before the pandemic situation in China stabilizes. Bottom Line: Chinese real estate market is still facing downside risks in the near term. However, accelerated policy easing from both the central government and local governments may result in a moderate recovery in Chinese property market in 2H2022. Feature Chart 1China Property Sector Woes
China’s Property Market: Moderate Recovery Ahead
China’s Property Market: Moderate Recovery Ahead
China’s aggressive housing-sector deleveraging campaign since late 2020 has triggered turmoil in the country’s property market, while this year’s COVID-induced lockdowns have exacerbated the slump. Property sales, starts, completions as well as home prices are all in deep contraction (Chart 1). Is a demand recovery on the way and how strong will it be? Compared with the 2020 episode, we believe that this time it will take longer to restore homebuyer confidence and the strength of the recovery will be considerably weaker. In 2H2020, to stimulate a pandemic-hit domestic property market, the Chinese authorities announced a set of supportive policies to encourage housing demand as well as to help domestic home developers overcome their extreme funding shortages. This led to an 11% year-on-year (YOY) growth in property sales during 2H2020. Although this year housing-sector policies have loosened more than they did in 1H2020, demand for housing has been sluggish and real estate developers’ propensity to take on more leverage and to invest has fallen to a multi-year low. The “three red lines” policy applied to property developers as well as the lending constraints imposed on banks remain in place. Furthermore, China’s zero-COVID policy will likely lead to rolling lockdowns and frequent disruptions to the economy, depressing household income growth, which has fallen over the past two years. Hence, assuming that the COVID-induced full lockdowns in China’s large cities are lifted before the end of May (COVID cases in China have gradually come down in the past couple of weeks), we expect only a moderate pickup in home sales in the second half of this year – about 4-6% YOY growth –about half of that in 2H2020. In terms of China’s housing-related construction activity, we believe it will only recover slightly in 2H2022, in line with our projection of a modest rebound in home completion. Chart 2China’s Housing Demand: Structural Headwinds
China’s Property Market: Moderate Recovery Ahead
China’s Property Market: Moderate Recovery Ahead
As we discussed in previous reports, China’s housing demand is facing major structural headwinds, as demand for properties in China has already entered a saturation phase and the country’s working-age population (15-64 years of age) is shrinking (Chart 2). Despite short-term measures to stabilize the property market, China’s top leadership will likely stick to their overarching “housing is for living not for speculation” policy mantra and continue to make efforts to reduce the housing sector’s share in the economy. As such, our longer-term view on the Chinese property market remains negative. A Mild Recovery In Home Sales Chart 3The Recovery of Chinese Property Market Relies On Home Sales
China’s Property Market: Moderate Recovery Ahead
China’s Property Market: Moderate Recovery Ahead
Home sales, which contributed to at least 50% of Chinese property developers’ funding, hold the key to the recovery of the Chinese property market (Chart 3). The core of the ongoing crisis in China’s housing market is Chinese property developers’ increasingly constrained financing due to rapidly falling home sales as well as stringent deleveraging policies. We expect a 4-6% annual growth in Chinese property sales (i.e. floor space sold in square meters) in the second half of this year. While this is a significant improvement from the 15% contraction in the past two quarters, the projected rebound will be much more muted than the 11% growth in 2H2020 and the 23% rebound in the 2016 housing-market recovery. In 2020, Chinese property sales tanked 40% YOY during January-February. After a flurry of supportive policiestook effect in March-April, the growth in home sales on a YOY basis turned positive in May 2020 and jumped to 11%YOY for the period of July-December 2020. Chart 4Slowing Household Disposable Income
China’s Property Market: Moderate Recovery Ahead
China’s Property Market: Moderate Recovery Ahead
While we think an acceleration in housing-market stimulus1 may be able to spur some rebound in demand for housing in the second half of this year, notably, economic fundamentals and household sentiment have both turned much less favorable this year than in 2020. COVID-related restrictions have exacerbated matters and have weighed heavily on the demand for housing. The growth rate of national disposable income per capita slowed by more than two percentage points (in nominal terms) in Q1 this year from the pre-pandemic era (Chart 4). Moreover, the PBoC’s quarterly urban depositor survey in Q1 showed subdued confidence in future household income (Chart 5). Household willingness to save also hit a record high and this sentiment is even more elevated than it was in early 2020; on the other hand, the propensity to invest has dropped to a multi-year low (Chart 6). Chart 5Subdued Confidence In Future Household ##br##Income
China’s Property Market: Moderate Recovery Ahead
China’s Property Market: Moderate Recovery Ahead
Chart 6More Chinese Households Intend To Save Rather Than Invest
China’s Property Market: Moderate Recovery Ahead
China’s Property Market: Moderate Recovery Ahead
There are some early signs that demand for housing, including pent-up demand that has been curbed by the ongoing COVID-induced full and partial lockdowns in China’s major cities, may see some modest rebound in 2H2022: Chart 7Banks Can Moderately Loosen Up Their Lending To The Property Sector
China’s Property Market: Moderate Recovery Ahead
China’s Property Market: Moderate Recovery Ahead
First, banks may be slowly increasing their lending to the real estate sector while complying with the real estate loan concentration management regulations (Chart 7). Second, household willingness to buy homes, although still significantly lower than a year ago, is improving somewhat. According to the Survey And Research Center For China Household Finance, the proportion of households planning to buy a house has been increasing, albeit moderately for two consecutive quarters (Chart 8). Third, we expect local governments to roll out more aggressive measures to stimulate housing demand. Land sales account for the lion’s share of the local government’s revenue but the developers’ land purchase has contracted (Chart 9). Against this backdrop, local governments will likely accelerate the implementation of supportive policies. Chart 8More Households Plan To Buy A House
China’s Property Market: Moderate Recovery Ahead
China’s Property Market: Moderate Recovery Ahead
Chart 9Local Governments Will Likely Push For More Supportive Policies To Boost Land Sales
China’s Property Market: Moderate Recovery Ahead
China’s Property Market: Moderate Recovery Ahead
Bottom Line: Property sales are likely to grow by 4-6%YOY during 2H2022. Will Developers’ Funding Conditions Improve? Real estate developers’ funding conditions are likely to improve modestly in the rest of 2022 , mainly due to improved property sales, from what was an extremely dire situation in 2H21 (Chart 3 on page 4). Property development is an asset-heavy and capital-intensive business, and the government-led deleveraging mandate and depressed home sales have massively curtailed cash flows to homebuilders. Chart 10Chinese Real Estate Investment: A Breakdown Of Funding Source
China’s Property Market: Moderate Recovery Ahead
China’s Property Market: Moderate Recovery Ahead
Chinese homebuilders generally have several ways to finance themselves. Chart 10 shows a breakdown of the source of Chinese real estate investment funding, with 12% of the total funding from domestic and foreign loans, 33% from a self-raised fund through bond and equity issuances, or retained earnings, 37% from deposits and advanced payments (e.g., down payments), and 16% from homebuyers’ mortgages in 2021. Other than some modest rebound in home sales, property developers’ alternative cash flows – which account for the other 50% of their funding – will remain under constraint for the following reasons: Regulations on leveraging among property developers have not loosened much. The “three red line" policy, implemented in July 2020, has limited Chinese property developers’ borrowing capacity and has so far remained firmly in place. Under this policy, homebuilders who breach none of the three red lines can only increase their interest-bearing borrowing by 15% at most, while failing to meet all three “red lines” may result in them being cut off from access to new loans from banks. The lending ceilings imposed on banks − the real estate loan concentration management system– which came into effect on 1 January 2021, also remain in place. Due to these stringent rules, Chart 11 shows the year-on-year growth of loans to real estate developers had dropped to zero in Q3 2021 from the 25% growth in Q3 2018. As these rules are critical to containing the high leverage of the Chinese property market from evolving into a systemic risk, the Chinese authorities are unlikely to radically change them (Chart 12). Chart 11More Loans To Property Developers, Albeit Capped By A Lending Ceiling
China’s Property Market: Moderate Recovery Ahead
China’s Property Market: Moderate Recovery Ahead
Chart 12Chinese Homebuilders’ Leverage Is Still High
China’s Property Market: Moderate Recovery Ahead
China’s Property Market: Moderate Recovery Ahead
Chart 13The Increase In Self-raising Funds Will Be Limited This Yea
China’s Property Market: Moderate Recovery Ahead
China’s Property Market: Moderate Recovery Ahead
Self-raised funds through bond and equity issuance also account for a large share of the Chinese real estate investment funding source. The recent riot in China’s stock market and the crisis in the offshore corporate bond market made such methods of raising fund less favorable. Indeed, self-raised funds have been in contraction since last September when the Evergrande default shocked investors (Chart 13). We do not see a sizeable increase in self-raised funds this year. Bottom Line: Developers’ funding conditions are likely to improve only moderately in 2H2022 as property sales see a mild rebound. The other sources of funding will continue to be constrained by the deleveraging policy. What About Housing-Related Construction Activity? China’s housing-related construction activity will revive slightly in 2H2022. Property developers may accelerate completion of their existing projects, while the deep contraction in housing starts will likely narrow in 2H22. Chart 14Homebuilders Need To Deliver Their Unfinished Projects
China’s Property Market: Moderate Recovery Ahead
China’s Property Market: Moderate Recovery Ahead
In recent years, Chinese real estate developers have raised funds by selling more newly started buildings instead of completed properties. This resulted in a divergence between property sales and completions, suggesting that there is a considerable inventory of pre-sold but unfinished projects (Chart 14). With more funding available, mainly from property sales, and to a lesser extent from bank lending, property developers will likely speed up the construction of those pre-sold but unfinished buildings. We expect property completions to grow 2-4% YOY in 2H2022, based on the following observations: The authorities repeatedly emphasized that property developers should meet their obligations by finishing and delivering their pre-sold but unfinished properties on time. They also have fine-tuned policies to support building completions by developers. New policies announced in February 2022 stated that property developers must prioritize those properties from which they have received pre-sale funds such as down payments. Meanwhile, odds are that the growth rate of property starts will stop falling in 2H2022. However, it will remain in contraction. Once property developers have some financing from property sales, they will tend to purchase land and start construction of new properties in order to generate revenue from presold properties. However, with deleveraging polices still in place, homebuilders can only increase their property starts to some extent. Some early signs of bottoming in land sales may be emerging (Chart 15). The uptick in land sales, although very small, may suggest that the deep contraction in the indicator has come to an end. Since late last year, state-owned property developers have been the main land buyers as private property developers were in a severe shortage of financing. This year, improving home sales and increasing bank lending may allow these private developers to return to the land acquisition market. Land sale transactions are highly correlated with housing starts (Chart 16). The improvement in land sales, if sustained into the coming months, suggests housing starts will improve somewhat in 2H2022. Chart 15Land Sales May Be Bottoming
China’s Property Market: Moderate Recovery Ahead
China’s Property Market: Moderate Recovery Ahead
Chart 16Land Sales Are Highly Correlated With Housing Starts
China’s Property Market: Moderate Recovery Ahead
China’s Property Market: Moderate Recovery Ahead
Chart 17Housing-related Construction Activity Will Likely Revive Moderately In 2H2022
China’s Property Market: Moderate Recovery Ahead
China’s Property Market: Moderate Recovery Ahead
Bottom Line: Housing-related construction activity will likely revive moderately on a mild recovery in project completions (Chart 17). Investment Implications Given the negative forces from rolling lockdowns and low homebuyer confidence in the property market, property developers’ stocks (both investable and A-share) could have more downside in the near term (Chart 18). In relative terms, property developers’ stocks (both investable and A-share) have outperformed their respective benchmarks (Chart 19). We are doubtful that this outperformance in property developers’ stocks will develop into a cyclical or structural bull markert since our overall outlook for the real estate sector remains downbeat beyond next 6-9 months. Chart 18Chinese Property Developers’ Stocks: No Bottom Yet Both In Absolute Terms…
China’s Property Market: Moderate Recovery Ahead
China’s Property Market: Moderate Recovery Ahead
Chart 19…And Relative To Benchmarks
China’s Property Market: Moderate Recovery Ahead
China’s Property Market: Moderate Recovery Ahead
Chart 20Neutral On Prices Of Construction-related Commodities For Now
China’s Property Market: Moderate Recovery Ahead
China’s Property Market: Moderate Recovery Ahead
Commodity prices have already been rising significantly across the board. Even though we expect a slight pickup in China’s real estate construction activity in the remainder of this year, the improvement will be only marginally positive for the country’s demand for construction-related commodities. As such, our view on the price of construction-related commodities (steel, cement, and glass) in the rest of 2022 remains neutral (Chart 20). Ellen JingYuan He Associate Vice President ellenj@bcaresearch.com Footnotes 1 By April 29, nearly 100 cities had rolled out favorable policies such as lowering down payment ratio, relaxing curbs on home purchases or offering subsidies or even giving out cash to homebuyers. In addition, banks in more than 100 cities have cut mortgage rates ranging between 20 basis points and 60 basis points. Strategic Themes Cyclical Recommendations