Bear/Bull Market

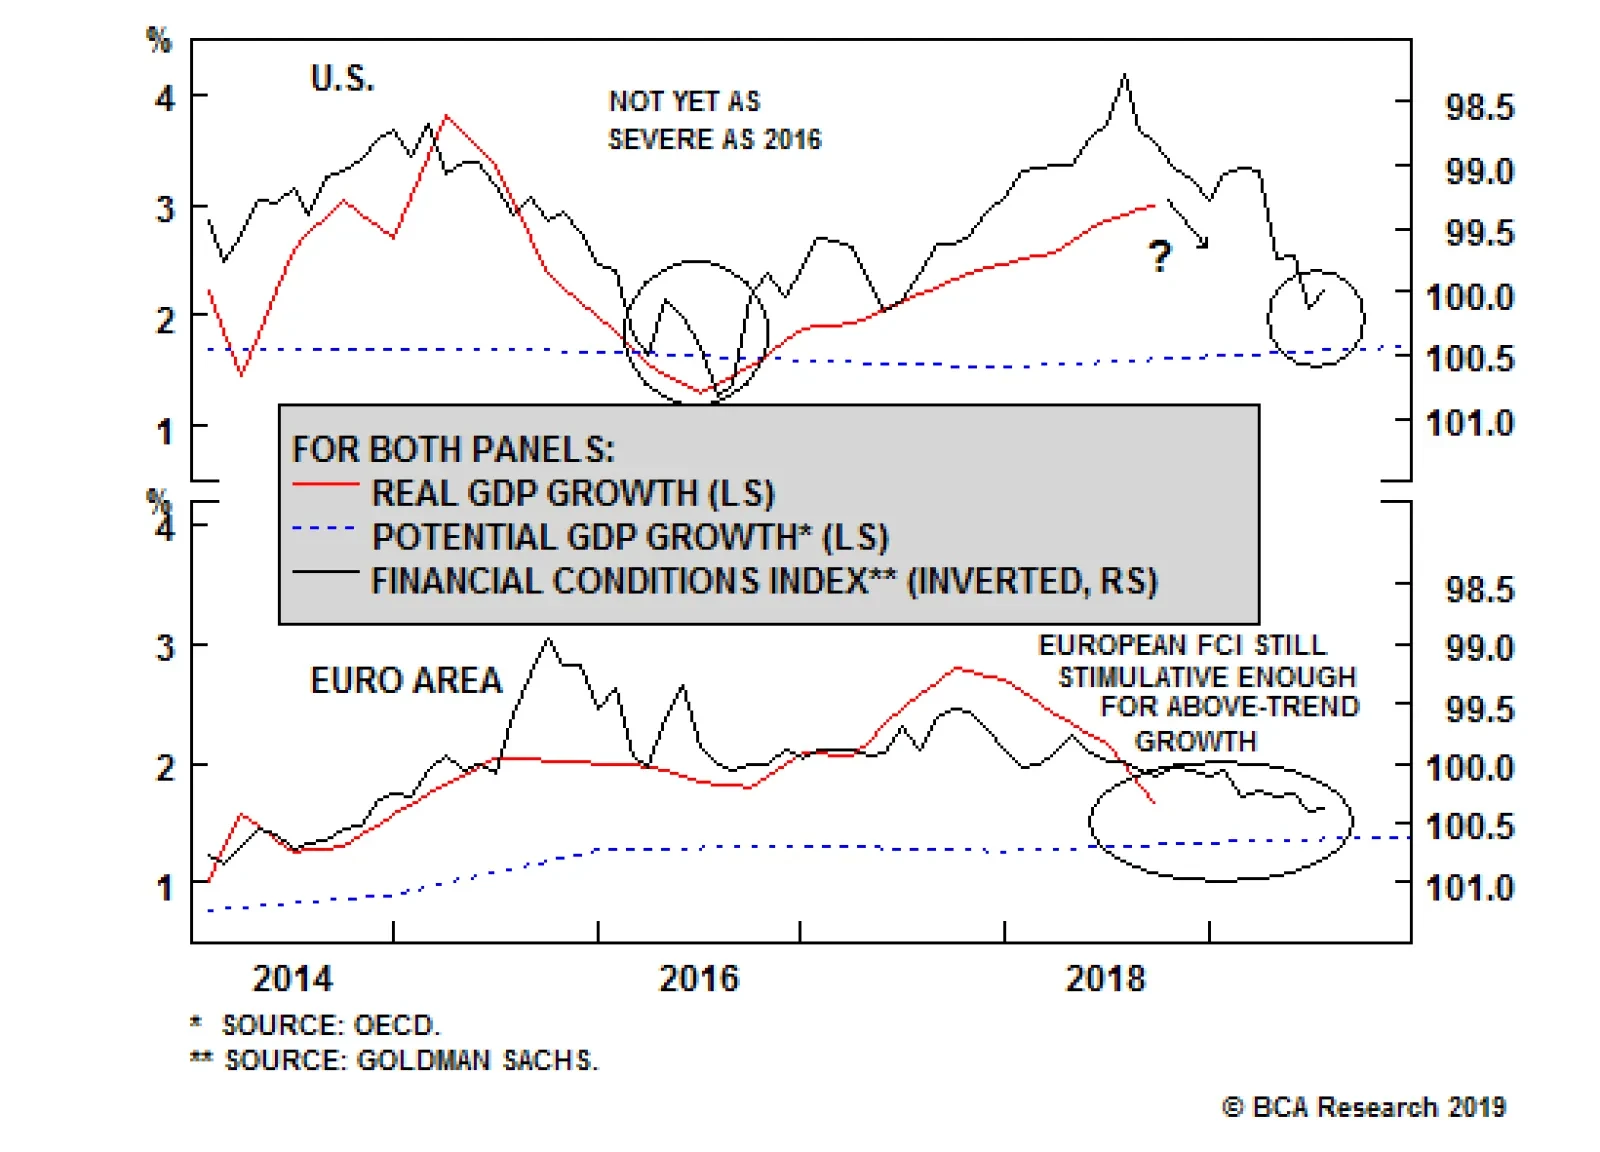
Highlights All the U.S. data look broadly similar to us, …: The data series are decelerating, one by one, but they generally remain at a fairly high level relative to history. … and we have begun sounding like a broken record in our morning meetings, … : “There’s no doubt that [insert data series name here] is slowing, but it’s still nowhere close to heralding a recession. As a matter of fact, it remains at a level consistent with above-trend growth. That’s what we should expect given the pattern of fiscal thrust across last year and this year, combined with still-accommodative monetary policy.” … so we’re revisiting our checklists to see if we should change our bearish rates and bullish equities views: We periodically review our checklists, which we rolled out in the fall, to assess whether or not our positioning rationale still applies. Our recommendations may still be the same, but at least we put them to the test: The business cycle, the inflation outlook, the Fed’s reaction function, the corporate profit outlook, and valuations have not changed enough to dictate changing our views. We continually seek out evidence that we’re getting it wrong, but we haven’t found any in the current data. Feature We have become a bit self-conscious about offering our take on the latest U.S. economic data releases at BCA’s daily morning meetings. It’s one thing to be out of step with the prevailing view, or to offer a novel theory that fails to achieve much traction in the room. (Strategists who don’t get shot down by their peers every once in a while aren’t pushing the conventional wisdom enough.) It’s quite another to keep recycling the same narrative, and we’re at something of a loss for a way to maintain our colleagues’ interest. Beep. You’ve reached the voicemail box of the U.S. Investment Strategy team. We believe today’s (insert series name here) release indicates that while the U.S. economy is decelerating, it continues to be on a path to grow at, if not above, trend in 2019. This is consistent with the 60-basis-point decline in fiscal thrust from 2018 to 2019. That decline is large enough to ensure deceleration in 2019, but the 40 bps that’s still going to be deployed this year is also sufficient to ensure that the economy will be able to grow above its 2% trend rate, provided the rest of the world does not fall apart. Thank you for your call, and please do not hesitate to call again if we can be of any further assistance. Beep. We created our bond upgrade and equity downgrade checklists last fall to help guard against sticking with our views beyond their sell-by date. Both checklists have a negative bias, in that they’re meant to help reveal the points at which the underpinnings of our views no longer apply. The bond checklist is broadly geared to identifying either, one, the presence of slack in the economy that might call for easier policy, or, two, a convergence of the fixed-income markets’ views with ours that would limit the potential payoff from maintaining below-benchmark duration positioning.1 Our equity downgrade checklist looks out for signs of an approaching recession, pressure on corporate earnings, inflation pressures that might inspire the Fed to remove accommodation in a hurry, or signs of euphoria that can’t be sustained.2 Reviewing the data series that comprise the checklists did not lead us to change our views. The exercise does help us adhere to a process, however, and we think they help keep us from falling into an analytical rut. We will revisit them with increasing frequency as the cycles we’re trying to track approach their inflection points, while keeping an eye out for any new indicators that might broaden their insights. Is A Bearish Rates View Still Appropriate? The first section of our bond checklist (Table 1) focuses on market perceptions of the Fed. Following our U.S. Bond Strategy service’s golden rule, if the Fed hikes more than it is expected to hike, long-duration positions will underperform. If it hikes less than expected, long-duration positions will outperform. As implied by the overnight index swap (OIS) curves, the money market now expects that the fed funds rate has peaked at 2.5%, and that a rate cut will likely bring it down to 2.25% by the end of 2020 (Chart 1). Table 1Bond Upgrade Checklist
Status Quo
Status Quo
Chart 1Markets Are Pricing In A Rate Cut
Markets Are Pricing In A Rate Cut
Markets Are Pricing In A Rate Cut
We beg to differ. With little to no slack remaining in the economy as a whole (the output gap is closed), and unemployment well below its natural level and poised to fall further, we think inflation pressures are percolating below the surface. Once they begin to reveal themselves, we expect the Fed will have no choice but to resume its tightening campaign. Our estimate of the equilibrium rate (3% now, rising to about 3⅜% by year-end) appears to be well above the financial markets’ estimate, and we therefore believe the Fed has plenty of room to hike without capsizing the economy. An inverted yield curve has historically been a reliable sign that the Fed has gone too far in its efforts to prevent overheating, and we are watching it now for hints that the fed funds rate may be done rising. Though the curve flattened considerably as the 10-year Treasury yield plunged in the fourth quarter (Chart 2), we think it’s very unlikely to invert while the Fed is on hold. An on-hold Fed implies that the 3-month bill rate will remain in the mid-to-high 2.40s and that the 10-year Treasury yield would have to dip below 2.5% for the curve to invert. Such an outcome would be completely incompatible with below-target inflation and above-trend economic growth. Chart 2The Yield Curve Has Flattened, But Inversion Is A Stretch
The Yield Curve Has Flattened, But Inversion Is A Stretch
The Yield Curve Has Flattened, But Inversion Is A Stretch
Inflation is not yet an issue on most investors’ radar screens because it has been conspicuously missing in action around the developed world for the last ten years. In the U.S., headline measures rolled over upon oil’s slide, masking the fact that the core measures are hovering around 2% and remain in uptrends (Chart 3). Inflation break-evens have plunged, and are well below the 2.3-2.5% level that is consistent with the Fed’s 2% inflation target, but their decline was nearly entirely a function of the decline in oil prices (Chart 4). Our Commodity & Energy Strategy service is calling for higher crude prices across the rest of this year, so even though we’ve checked the break-evens box, we expect we’ll be unchecking it as the break-evens reverse in step with oil. Chart 3Headline Inflation's Decline ...
Headline Inflation's Decline ...
Headline Inflation's Decline ...
Chart 4... Is An Oil Story
... Is An Oil Story
... Is An Oil Story
The labor market remains quite tight. Although the unemployment rate ticked up in December and January, it came down again in February and remains below the estimated natural rate of unemployment where upward wage pressures typically begin to take hold (Chart 5, top panel). Unemployment ticked higher in December and January, despite robust job gains, because the share of working-age Americans participating in the labor force rose. The exodus of the baby boomers from the work force will make it very difficult for the participation rate to keep rising, however (Chart 5, middle panel), and the elevated level of workers quitting their jobs (Chart 5, bottom panel) indicates that employers are poaching workers from one another, driving wages higher. Chart 5The Labor Market Is Tight And Getting Tighter
The Labor Market Is Tight And Getting Tighter
The Labor Market Is Tight And Getting Tighter
Instability is a double-edged sword as it relates to monetary policy. The Fed is likely to return to hiking rates if it believes it can cut off rising instability before it goes too far. If instability is far enough advanced that it threatens the economy, however, the Fed may well ease policy to try to counteract it. For now, it appears to us that the key cyclical segments of the economy are on track to keep warming up, but are nowhere near overheating (Chart 6). We are not overly concerned about the frisky lending climate that Governor Brainard called out in September, but ongoing anecdotal reports of bond-market froth will presumably keep the Fed alert to the need to dial back accommodation. Acutely bad conditions elsewhere in the global economy would make the Fed consider rate cuts, but if the rest of the world perks up by mid-year, in line with BCA’s base case, the Fed will feel less urgency to indemnify the U.S. against foreign distress. Chart 6Cyclical Segments Are Warming Up
Cyclical Segments Are Warming Up
Cyclical Segments Are Warming Up
Should We Still Be Constructive On Equities? Every box in our equity downgrade checklist remains unchecked, starting with our silent recession alarms (Table 2). The yield curve has not inverted, and as we noted in the review of our rates checklist, we do not believe it will while the Fed remains on hold. Growth has come off the boil, but the LEI is not close to contracting on a year-over-year basis (Chart 7). The fed funds rate remains below our estimate of equilibrium, as we expect it will for the rest of the year, and the three-month moving average of the unemployment rate has not risen by a third of a percentage point from its current cyclical bottom. Table 2Equity Downgrade Checklist
Status Quo
Status Quo
Chart 7The LEI May Be Decelerating, But It's Still A Ways From Contracting
The LEI May Be Decelerating, But It's Still A Ways From Contracting
The LEI May Be Decelerating, But It's Still A Ways From Contracting
Labor market tightness will eventually manifest itself in higher wages, which will squeeze corporate profit margins, but until real wage gains begin to outstrip productivity growth (i.e., until labor starts capturing a bigger piece of the pie), corporate earnings will not be at risk (Chart 8). The dollar has spent the last several months going sideways, and BBB corporate yields are now below their level when we rolled out the equity checklist in mid-October (Chart 9). The savings rate has backed up to near the top of its six-year range, and we would check the box if it were to break out of it (Chart 10). There have been no blowups in EM or anywhere in the rest of the world that cast a shadow over U.S. corporate earnings. Chart 8Wage Growth Doesn't Cut Into Profits Until It Outstrips Productivity And Inflation
Wage Growth Doesn't Cut Into Profits Until It Outstrips Productivity And Inflation
Wage Growth Doesn't Cut Into Profits Until It Outstrips Productivity And Inflation
Chart 9Round Trip
Round Trip
Round Trip
Chart 10The Savings Rate Has Risen, But Not Enough To Check The Box
The Savings Rate Has Risen, But Not Enough To Check The Box
The Savings Rate Has Risen, But Not Enough To Check The Box
As noted in our bond checklist comments, above, core inflation measures have dipped below 2% but remain in an uptrend. Both headline CPI and the inflation break-evens relapsed with oil prices, but we expect that a crude recovery will help restore inflation expectations. Bull markets tend to end amid a general feeling of euphoria, and we therefore continue to keep an eye out for signs of over-exuberance. Valuations are elevated but hardly extreme, and we don’t see anecdotal indications of widespread silliness, or suspension of disbelief. Investment Implications From our perspective, overheating in the U.S. remains a very real possibility. Since that is a distinctly minority view, the potential reward for underweighting Treasuries and holding all bond exposures below benchmark duration is alluring. We reiterate our recommendations that investors underweight Treasuries and maintain below-benchmark-duration across their fixed-income portfolios. We expect we will continue to do so until the U.S. economy weakens, or the Treasury curve begins to price in some of our bearish rates view. We reiterate our cyclical recommendation to overweight equities despite the tactical caution we expressed last week.3 We simply expect that the S&P 500 will have to consolidate some of its rapid year-to-date gains before moving on to an eventual new cycle high at 3,000 or above. Stocks don’t go straight up, even if they did for nearly all of January and February, and it is reasonable to expect elevated volatility in the latter stages of a bull market. We thought that the 2,800 level might provide some technical resistance, offering tactically oriented sellers an attractive point to reduce equity exposures, while tactically oriented buyers were likely to find better entry points going forward. Doug Peta, CFA Chief U.S. Investment Strategist dougp@bcaresearch.com Footnotes 1 Please see the U.S. Investment Strategy Weekly Report, “What Would It Take To Change Our Bearish Rates View?,” published September 17, 2018. Available at usis.bcaresearch.com. 2 Please see the U.S. Investment Strategy Weekly Report, “Introducing Our Equity Downgrade Checklist,” published October 15, 2018. Available at usis.bcaresearch.com. 3 Please see the U.S. Investment Strategy Weekly Report, “How Much Do U.S. Equities Have Left?,” published March 4, 2019. Available at usis.bcaresearch.com.
Highlights Hyman Minsky famously said that “stability begets instability.” The converse is also true: Instability begets stability. None of the preconditions for a U.S. recession are in place yet. The Fed’s decision to press the pause button on further rate hikes ensures that it will take at least another 18 months for monetary policy to turn restrictive. Global growth should accelerate by mid-2019, as Chinese stimulus kicks in and the headwinds facing Europe dissipate. Investors should overweight global equities and underweight bonds over the next 12 months. The leadership role in the equity space will gradually shift outside the United States. Feature The Long Shadow Of The Financial Crisis "Stability begets instability” declared Hyman Minsky in his widely cited, seldom-read book.1 By this, Minsky meant that periods of economic tranquility often encourage excessive risk-taking, sowing the seeds of their own demise. We would not quarrel with Minsky’s assessment, but we would point out that the converse is also true: Instability begets stability. Following periods of intense financial stress, lenders become more circumspect about whom they lend to, while borrowers become reluctant to take on debt. The result is economically bittersweet. On the plus side, the newfound caution of lenders and borrowers alike ensures that financial imbalances are slow to build up again. On the negative side, sluggish credit growth restrains spending. The net effect is a recovery that is often slow and uneven, but one which lasts longer than expected. Few Signs Of Major U.S. Economic Imbalances This is the world in which we find ourselves today. It took a decade following the subprime crisis for the U.S. to return to full employment. Much of Europe is not even there yet. Lenders continue to take risks. However, they have been quicker than usual to scale back exposure at the first sign of trouble. For example, as U.S. auto loan defaults began rising in 2015, banks tightened lending standards. As a result, the share of auto loans transitioning into delinquency peaked in Q4 of 2016 and has since drifted down modestly (Chart 1). Chart 1Lenders Are More Circumspect These Days: The Case Of Autos
Lenders Are More Circumspect These Days: The Case Of Autos
Lenders Are More Circumspect These Days: The Case Of Autos
A similar thing happened when corporate credit spreads blew out in 2015 following the crash in oil prices (Chart 2). Banks tightened lending standards starting in late 2015. Once defaults peaked in early 2017, banks started easing standards. Chart 2Banks Were Quick To Tighten Lending Standards In 2015
Banks Were Quick To Tighten Lending Standards In 2015
Banks Were Quick To Tighten Lending Standards In 2015
Tellingly, the distress in corporate debt markets in 2015-16 did not cause the financial system to seize up, as evidenced by the fact that financial stress indices only increased marginally during that period. This suggests that financial imbalances never had a chance to rise to a level that threatened the overall economy. The Preconditions For The Next U.S. Recession Are Not Yet In Place Today, the U.S. private-sector financial balance – the difference between what the private sector earns and spends – stands at a healthy surplus of 2.1% of GDP. Both of the last two recessions began when the private-sector balance was in deficit (Chart 3). Chart 3The Private Sector Is Not Living Beyond Its Means The Way It Was Before The Last Two Recessions
The Private Sector Is Not Living Beyond Its Means The Way It Was Before The Last Two Recessions
The Private Sector Is Not Living Beyond Its Means The Way It Was Before The Last Two Recessions
This raises an intriguing question: If the U.S. private sector is not suffering from any major imbalances, what is going to cause the next recession? That’s a very good question, with no obvious answer! The past two recessions were triggered by the bursting of asset bubbles – first the dotcom bubble and then the housing bubble. Today, U.S. equities are far from cheap, but with the S&P 500 trading at 16.1-times forward earnings, they are hardly in a bubble (Chart 4). The housing market is also on much firmer footing: The homeowner vacancy rate is near all-time lows, while the quality of mortgage lending has been very high (Chart 5). Chart 4While U.S. Stocks Are Not Cheap, They Aren't In A Bubble
While U.S. Stocks Are Not Cheap, They Aren't In A Bubble
While U.S. Stocks Are Not Cheap, They Aren't In A Bubble
Chart 5Housing Fundamentals Are Solid
Housing Fundamentals Are Solid
Housing Fundamentals Are Solid
Of course, recessions can occur for reasons other than the bursting of asset bubbles. The 1973-74 recession and the recessions of the early 1980s were triggered by a surge in oil prices, requiring the Fed to hike rates aggressively. Luckily, such an oil-induced recession is highly unlikely today. Inflation expectations are better anchored, while oil consumption represents a much smaller share of GDP than it did back then (Chart 6). In addition, the U.S. has become a major oil producer, which implies that the drag to consumers from higher oil prices would be partly offset by increased capital spending in the energy sector. At any rate, the ability of shale producers to respond to higher prices with additional output limits the extent to which prices can rise in the first place. Chart 6An Oil Price Shock Is Unlikely To Cause A Recession
An Oil Price Shock Is Unlikely To Cause A Recession
An Oil Price Shock Is Unlikely To Cause A Recession
Past economic downturns have also been caused by major adjustments in the cyclical parts of the economy. As a share of GDP, cyclical spending is lower today than it has been at the outset of most recessions (Chart 7). The proliferation of just-in-time inventory systems has also reduced the influence that inventory swings have on the economy (Chart 8). Chart 7Cyclical Spending Is Not Extended
Cyclical Spending Is Not Extended
Cyclical Spending Is Not Extended
Chart 8
A severe tightening of fiscal policy can also trigger a recession.2 Fortunately, the end of the government shutdown reduces the risk of such an outcome. Rightly or wrongly, voters blamed President Trump for the recent closure (Chart 9). As we speak, the Trump administration is negotiating with Democrats to avert another shutdown slated to begin on February 15. The key item of contention concerns funding for a border wall with Mexico. Even if a deal falls through, rather than shuttering the government again, Trump will probably pursue funding for the wall by declaring a national emergency. Our geopolitical strategists believe such an action will be challenged by the Democrats, but is likely to be upheld by the Supreme Court. Chart 9''I Am Proud To Shut Down The Government''
''I Am Proud To Shut Down The Government'''
''I Am Proud To Shut Down The Government'''
Global Growth Should Improve Admittedly, the external environment now has a greater influence on the U.S. economy than in the past. Nevertheless, given that exports are only 12% of GDP, it would take a sizeable external shock to knock the U.S. into recession. We think that such a shock is not in the cards. The trade war is likely to go on hiatus as Trump seeks to take credit for a deal with China. In addition, as we discussed two weeks ago, China will scale back its deleveraging campaign now that credit growth has fallen close to nominal GDP growth (Chart 10).3 Chart 10China: Time To Scale Back Deleveraging
China: Time To Scale Back Deleveraging
China: Time To Scale Back Deleveraging
Euro area growth should reaccelerate over the coming months thanks to lower oil prices, a revival in EM demand, modestly more stimulative fiscal policy, and the palliative effects from the decline in government bond yields across the region. We have also argued that the risks of a “Hard Brexit” should abate.4 Waiting... And Waiting For Inflation To Rise When the next recession rolls around, it will probably be sparked by a surge in inflation, which forces the Fed to raise interest rates much more rapidly than it has so far. Here is the thing though: Inflation is a highly lagging indicator. It usually only peaks long after a downturn has started and troughs after the recovery is well underway (Chart 11).
Chart 11
Consider the example of the 1960s. The unemployment rate fell below NAIRU in 1964, but it took another four years for inflation to break out in earnest (Chart 12). The U.S. unemployment rate has been below NAIRU only since 2017. The unemployment rate in Germany and Japan has been below NAIRU for much longer, yet inflation remains stubbornly low in both countries (Chart 13). Chart 12It Took An Overheated Economy For Inflation To Take Off In The Late-1960s
It Took An Overheated Economy For Inflation To Take Off In The Late-1960s
It Took An Overheated Economy For Inflation To Take Off In The Late-1960s
Chart 13The U.S., Japanese, And German Economies Are At Full Employment
The U.S., Japanese, And German Economies Are At Full Employment
The U.S., Japanese, And German Economies Are At Full Employment
Cheer Up This leaves us with a striking conclusion: Perhaps the next U.S. recession is not around the corner, as some grumpy economists seem to think. Perhaps this economic expansion can endure beyond 2020. The recent U.S. data has certainly been consistent with that thesis. The ISM manufacturing index rose 2.3 percentage points to 56.6 in January. New orders jumped by 6.9 percentage points to 58.2. Payroll growth has also accelerated. Real aggregate earnings are up 4.2% from a year earlier, the fastest pace since October 2015 (Chart 14). Chart 14U.S. Labor Income Growth Has Been Accelerating
U.S. Labor Income Growth Has Been Accelerating
U.S. Labor Income Growth Has Been Accelerating
Housing data are showing tentative evidence of stabilization. New home sales are rebounding, while mortgage applications are back near cycle-highs (Chart 15). Chart 15Housing Activity Is Stabilizing After Last Year's Weakness
Housing Activity Is Stabilizing After Last Year's Weakness
Housing Activity Is Stabilizing After Last Year's Weakness
Reflecting these positive developments, the Citigroup economic surprise index has jumped into positive territory (Chart 16). The New York Fed’s estimate for Q1 2019 GDP growth has also moved up to 2.4%. Chart 16U.S. Economic Data Are Beating Low Expectations
U.S. Economic Data Are Beating Low Expectations
U.S. Economic Data Are Beating Low Expectations
Investment Conclusions Recessions and bear markets usually overlap (Chart 17). With the next recession still at least 18 months away, it is premature to turn bearish on equities. We upgraded stocks in December following the post-FOMC sell-off. Although our tactical MacroQuant model is pointing to an elevated risk of a setback over the next few weeks, we continue to see global equities finishing the year 5%-to-10% above current levels. As global growth bottoms out mid-year, the leadership role in equity markets should increasingly move away from the U.S. towards EM and Europe. Chart 17Recessions And Bear Markets Usually Overlap
Recessions And Bear Markets Usually Overlap
Recessions And Bear Markets Usually Overlap
Bonds are a tougher call. We do not expect the Fed to raise rates again at least until June. This will limit the upside for bond yields, as well as the dollar, in the near term. Nevertheless, with the fed funds futures pricing in no rate hikes for the next few years, even a modest shift back to tightening in the second half of this year and beyond will push up bond yields, dampening total returns to fixed income. Looking beyond 2019, the case for maintaining a short duration stance in fixed-income portfolios is very strong. The longer the Fed allows the economy to overheat, the greater the eventual overshoot in inflation will be. Inflation expectations have fallen over the past few months (Chart 18). They should have risen. Ultimately, Gentle Jay Powell’s decision to press the pause button on further rate hikes means that rates will end up peaking at a higher level during this cycle than they would have otherwise. Chart 18Inflation Expectations Have Declined
Inflation Expectations Have Declined
Inflation Expectations Have Declined
Peter Berezin, Chief Global Strategist Global Investment Strategy peterb@bcaresearch.com Footnotes 1 As argued in Hyman P. Minsky, “Stabilizing an Unstable Economy,” Yale University Press, (1986). 2 Severe episodes of fiscal tightening have normally followed military demobilizations. These include the recessions following WW1, WW2, and the Korean War, and to a much lesser extent, the 1990-91 recession which was exacerbated by cuts to the defense budget at the end of the Cold War. 3 Please see Global Investment Strategy Weekly Report, “China’s Savings Problem,” dated January 25, 2019. 4 Please see Global Investment Strategy Weekly Report, “Patient Jay,” dated January 18, 2019. Strategy & Market Trends MacroQuant Model And Current Subjective Scores
Chart 19
Tactical Trades Strategic Recommendations Closed Trades
Question Three: Have central banks become less concerned about financial market selloffs? The idea that central banks have fallen “out of tune” with financial markets has spooked investors who fear that policymakers will not provide sufficient easing when…
Dear Client, This Wednesday January 9th 2019, we are publishing a joint report co-written with BCA’s Geopolitical Strategy team. There will be no report on Friday. Best Regards, Mathieu Savary, Vice President Foreign Exchange Strategy mathieu@bcaresearch.com Highlights So What? U.S. President Donald Trump is not solely focusing on stock prices, but he does not want an entrenched bear market to develop under his watch. Why? Entrenched bear markets often herald recessions. A recession would seriously endanger Trump’s re-election chances. The Federal Reserve will not alter its course to please Trump, but it will pause in order to safeguard the economy. While at first the dollar will weaken in response to a Fed pause, economic fundamentals argue that the greenback will enjoy a last hurrah before a true bear market can begin. Feature Despite U.S. President Donald Trump’s legendary concern for the stock market, the S&P 500 is nonetheless down 6.7% since his G-20 truce with Chinese President Xi Jinping. We mark that date as notable on Chart I-1 – not because we think it caused the markets to plunge, but because many investors thought it would buoy equities into a Santa Claus rally. Further, many investors predicted that the G-20 truce would come about specifically because Trump wanted stocks to do well. Chart I-1Santa Did Not Show Up After The Buenos Aires Meeting
Santa Did Not Show Up After The Buenos Aires Meeting
Santa Did Not Show Up After The Buenos Aires Meeting
There are so many methodological problems with this train of thought that it could be the main thrust of a PhD dissertation. But, for starters, the assertion that Trump is obsessed with stocks embeds causality into a dependent variable. In simple terms, it posits that the stock market’s performance is an end in of itself for President Trump, and thus he will do whatever it takes to prolong the bull market. Here’s a hint for the collective investment community: If something sounds too good to be true, it is almost definitely not true. The idea that the President of the United States, no matter how unorthodox… …Exclusively cares about the stock market… … And has the extraordinary power… ... and mental acumen… …to keep the stock market perpetually rising, is indeed too good to be true. First, President Trump has clearly shown that he does not exclusively care about the stock market, by shutting down the government midway through a bear market. Now, it is not clear to us how a federal government shutdown directly impacts the earnings of U.S. companies, but it is clear that it does not instill confidence among investors that Trump and the incoming Democrat-held House will be able to play nice together, or at least nice enough, to avert a potentially recession-inducing 2020 stimulus cliff (Chart I-2). Chart I-2Can Trump And The Democrats Play Nice Enough To Dodge The Cliff?
Can Trump And The Democrats Play Nice Enough To Dodge The Cliff?
Can Trump And The Democrats Play Nice Enough To Dodge The Cliff?
BCA’s Geopolitical Strategy noted the danger of the government shutdown by calling it “the one true midterm-related risk.” The reasoning was that, “A lame duck Congress, or worse a Democratic Congress, will give President Trump all the reason he needs to grind things to a halt over his wall, with a view to 2020.” Further to this point, Trump has not exactly been a boon to the stock market since passing his signature legislation – the tax reform bill – at the end of 2017. Throughout 2018, he has focused his policy on a trade war with China, and we would also argue with a view towards the 2020 election. Now admittedly, the stock market completely and utterly ignored all bad news on the trade front (Chart I-3) – ironically, until a truce was called! – but the fact remains that President Trump did not listen to the almost-certain advice from his “globalist” advisors that a trade war could, at some point, hurt the S&P 500. Chart I-3The Market's Schizophrenic Relationship With The Trade War
The Market's Schizophrenic Relationship With The Trade War
The Market's Schizophrenic Relationship With The Trade War
Second, the President of the United States of America is not a medieval king. He is not even the president of China nor even the prime minister of Canada (both policymakers with far more power inside their own political systems than the American president).1 The president is massively constrained in terms of economic policy by the Congress, a branch of government he only nominally has influence over. Further, his regulatory policy can be impeded by the bureaucracy and the courts. In addition, steering an economy as massive and multifaceted as that of the U.S. is not a one-man job. It is not a “job” at all. The best a president can do is set the conditions in place – through regulation, tax policy, and rhetoric – which stokes animal spirits in a positive direction. For much of 2017 and early 2018, President Trump did this. But the stock market, and the economy by extension, always wants more. More pro-business regulation and more reassuring rhetoric. President Trump generally gets an A on the former, but an F on the latter. Not only is the trade war a concern to investors, but so are a slew of other confidence-deflating comments by the president on FAANG regulation, the government shutdown, the White House staffing, the Fed’s independence, and foreign policy writ large. As for the question of mental acumen, President Trump may be a “stable genius,” but no single policymaker is able to influence equities. As an aside, we are shocked by how much the investment community has changed in the past eight years. When we began taking politics seriously in our investment strategy, back in 2011, it took a lot of convincing that systemic political analysis had a role to play with respect to one’s asset allocation. Now, investors are willing to bet their shirt on the actions of one politician. It is as if the investment community is trying to overcorrect for decades of ignoring politics as a valuable input in one single presidential term. So, what does this mean for U.S. equities from here on out? We agree with our clients that the one thing President Trump wanted to avoid was a bear market. We staunchly disagreed that equities could not correct significantly under his watch, and we shorted the S&P 500 outright in September, but we begrudgingly agreed that President Trump, as with all other presidents before him, would rather not deal with a bear market. Those tend to foreshadow a recession, and recessions tend to end re-election bids (Chart I-4).
Chart I-4
For much of 2019, we expect that President Trump will focus on ensuring that a recession does not occur ahead of his 2020 election bid. This is likely to become a defining motivating factor in all policy, whether domestic, foreign or trade. Can he be successful? It is not up to the U.S. President to determine when a recession hits, but the point is that he is likely to put his re-election bid above all other considerations. As such, we would expect that: The government shutdown will be resolved in January. A compromise will emerge to end the shutdown that falls short of president Trump’s demands. Ultimately, Trump needs Democrats to play ball with the White House and the Republican Senate in order to avert the stimulus cliff in 2020. Trade negotiations may produce a truce. There is a combined, subjective, probability of 70-75% that the ongoing trade negotiations produce either an outright deal (45-50%) or an extension of the talks with no further tariffs (25%). Trump is likely to back off from further trade antagonism, at least until the run-up to the 2020 election. There will be a parallel process where a China-U.S. tech war continues. Attacks on the Fed will cease. At least until the 2020 election, or until the recession actually hits. But with the Fed itself already signalling that it won’t be dogmatic, the reasons to go after the central bank will recede. Bottom Line: President Trump does not care about stock prices any more than other presidents have in the past. What matters to him is to avoid a protracted bear market in equity prices, as it would severely raise the probability of an upcoming recession, endangering his chances of re-election. This means the government shutdown will likely end this month, that the trade negotiations have a solid chance of producing a protracted truce, and that attacks on the Fed will ebb. Can The Dollar Rally Further? Is a U.S. president focused on avoiding a recession in order to get re-elected a good thing or a bad thing for the dollar? While stronger U.S. growth is inherently a positive for the dollar, the current juncture muddies the waters. To begin with, the risk of a correction in the U.S. dollar has risen considerably in recent weeks. The dollar is historically a momentum currency, implying that as much as strength begets further strength, weakness begets additional weakness.2 As a result, the fall in the DXY from 97.5 in December to 96 raises a red flag. This red flag is even more worrisome when looking at the dollar’s technical picture (Chart I-5). The 13-month rate-of-change has been forming a bearish divergence with prices, and both sentiment and net speculative positioning are holding at lofty levels. Not only does this confirm that on a tactical basis, the dollar is losing momentum, but it also highlights that if momentum deteriorates further, a large pool of potential sellers exist. Chart I-5Tactical Risks For The Greenback
Tactical Risks For The Greenback
Tactical Risks For The Greenback
Policy too constitutes a risk. President Trump could relent on his attacks on the Fed, but as we mentioned, the Fed seems to also be relenting on its own hard-nosed approach to monetary policy. Last Friday, Fed Chairman Jerome Powell highlighted that policy was not on autopilot, and that monetary policy is ultimately data dependent. In fact, the Federal Open Market Committee is not antagonistic to a pause in its hiking campaign, nor to tweaking its balance-sheet policy if economic and financial conditions deteriorate further. The Fed moving away from hiking once every quarter should provide ammunition to sellers of the greenback. However, the interest rate market already has very muted expectations for the Fed, anticipating 6 basis points and 17 basis points of cuts over the next 12 and 24 months, respectively (Chart I-6). Thus, to be a durable headwind to the dollar, the Fed needs to be more dovish than what is already priced in. We doubt this will be the case: Chart I-6Scope For A Hawkish Fed Surprise In 2019
Scope For A Hawkish Fed Surprise In 2019
Scope For A Hawkish Fed Surprise In 2019
The ISM may have been weak, but the U.S. continues to generate a healthy level of job growth, and wages continue to accelerate (Chart I-7). Down the road, this will be inflationary. Consumption, or 68% of GDP, remains healthy. Real retail sales excluding motor vehicle and part dealers are still growing at a 4.3% pace. Robust job and wage growth will continue to support the ultimate driver of household spending: disposable income. Moreover, the household savings rate stands at 6% of disposable income, debt-servicing costs at 9.9%, and overall household debt has fallen to 100%, a level not seen since the turn of the century. The financial health of households insulates them against the negative impact of the tightening in financial conditions recorded this past fall. Despite the recent deterioration in the ISM and the rise in credit costs, commercial and industrial loan growth continues to accelerate, with both the annual and the quarterly-annualized growth rates of this series rising the most in more than two years (Chart I-8). Chart I-7U.S. Wages Are Still Accelerating
U.S. Wages Are Still Accelerating
U.S. Wages Are Still Accelerating
Chart I-8Positive Developments On The U.S. Credit Front
Positive Developments On The U.S. Credit Front
Positive Developments On The U.S. Credit Front
Based on this combination, we would anticipate the Fed pausing in its hiking campaign for one to two quarters. This would nonetheless represent a more hawkish outcome than the one expected by the market, and thus would not be a dollar-bearish configuration. In our view, the biggest domestic risk for the Fed remains the housing market, which for most of this cycle has been the principal vehicle through which monetary policy has been transmitted to the economy. Housing has indubitably slowed, but the recent pick-up in the purchases component of the Mortgage Bankers Association index gives hope that this sector is making a trough as we write. What about tighter financial conditions: could they also threaten the dollar? After all, the tightening in FCI in the second half of 2018 is acting as a break on growth, diminishing the need for Fed hikes. If stocks and high-yield bonds sell off further, the Fed will likely hike less than we anticipate. However, a Fed pause and the more attractive valuations created by the recent selloff suggest that FCI should not deteriorate much more. Indeed, the 64-basis-point contraction in high-yield spreads since January 3rd shows that financial conditions have begun to ease. Our Global Investment Strategy team thinks that stocks are a buy, a view also consistent with an easing in U.S. FCI.3 As a result, we do not believe that U.S. financial conditions will force the Fed to cut rates, and thus will not create a handicap for the dollar. Finally, the most important factor for the dollar remains global growth. The dollar historically performs best when both global growth and inflation are decelerating (Chart I-9). Because the U.S. economy has a low exposure to both manufacturing and exports, it is a low-beta economy, relatively insulated from the global industrial cycle. Hence, when global growth decelerates, the U.S. suffers less than the rest. As a result, the U.S. syphons funds from the rest of the world, lifting the dollar in the process.
Chart I-9
Currently, the outlook for global growth remains poor. At the epicenter of it all lies China. Chinese manufacturing PMIs have fallen below 50. There are plenty of reasons to worry that the slowdown will not end here. Chinese consumers too are feeling the pinch, despite having been the recipient of much governmental support, including tax cuts (Chart I-10). Moreover, the fall in the combined fiscal and credit impulse also suggests that Chinese imports could suffer more in the coming months, creating a greater drag on the trading nations of the world (Chart I-11). Finally, China’s rising marginal propensity to save confirms these insights, pointing to slowing Chinese industrial activity and imports as well as deteriorating global export growth and industrial activity (Chart I-12).4 Chart I-10The Chinese Consumer Is Also Hungover
The Chinese Consumer Is Also Hungover
The Chinese Consumer Is Also Hungover
Chart I-11Chinese Credit Trends Point To Weaker Imports...
Chinese Credit Trends Point To Weaker Imports...
Chinese Credit Trends Point To Weaker Imports...
Chart I-12...And China's Rising Marginal Propensity To Save Corroborates This Risk
...And China's Rising Marginal Propensity To Save Corroborates This Risk
...And China's Rising Marginal Propensity To Save Corroborates This Risk
Ultimately, these developments suggest that China needs to ease policy a lot more before growth can be revived. The reserve-requirement-ratio cuts announced last week are not enough to do the trick and may in fact only alleviate the traditional liquidity crunch associated with the Chinese New Year celebration – nothing more. Instead, we expect Chinese interest rates to continue to lag behind U.S. rates, a development historically associated with a strong dollar (Chart I-13). A tangible symptom that China’s reflation is positively affecting the global growth outlook will be when Chinese rates rise relative to U.S. ones. This is what is needed for the dollar to peak this cycle. We are not there yet. Continued weakness in the global PMI and German factory orders only gives more weight to this view. Chart I-13Rising U.S.-China Spreads Point To A Stronger Dollar
Rising U.S.-China Spreads Point To A Stronger Dollar
Rising U.S.-China Spreads Point To A Stronger Dollar
Practically, we think a move in DXY to 94 or EUR/USD to 1.17 is likely in the coming weeks. However, the combined realization that the U.S. economy will not go into recession – and that therefore the Fed will not pause for the whole of 2019 – and that global growth has yet to bottom, means at those levels the dollar will be a buy. The yen is likely to suffer most in this context. If the markets begin pricing in a stronger U.S. economy than what is currently anticipated, U.S. 10-year yields will rise and the U.S. yield curve will steepen, hurting the JPY in the process. EUR/JPY is an attractive buy right now (Chart I-14). Chart I-14EUR/JPY Set To Rebound
EUR/JPY Set To Rebound
EUR/JPY Set To Rebound
Bottom Line: As the market begins digesting the reality of a Fed pause, the dollar could experience some short-term vulnerability, pushing DXY toward 94 and EUR/USD toward 1.17. However, we would anticipate the dollar’s weakness to end at those levels. Interest rate markets are already pricing in Fed rate cuts, something we believe is not warranted. Moreover, financial conditions are set to ease, which will give comfort to the Fed that it can resume hiking. Finally, Chinese growth has more downside, which normally leads to a dollar-bullish environment. Mathieu Savary, Vice President Foreign Exchange Strategy mathieu@bcaresearch.com Marko Papic, Senior Vice President Chief Geopolitical Strategist marko@bcaresearch.com Footnotes 1 The comparison may not entirely be apt since not even the President of China was able to avert the stock market collapse in China in 2015. 2 Please see Foreign Exchange Strategy Special Report, titled “Riding The Wave: Momentum Strategies in Foreign Exchange Markets”, dated December 8, 2017, available at fes.bcaresearch.com 3 Please see Global Investment Strategy Special Report, titled “Market Alert: The Correction Cometh, The Correction Came: Upgrade Global Equities To Overweight”, dated December 19, 2018, available at gis.bcaresearch.com 4 Please see Foreign Exchange Strategy Weekly Report, titled “Fade The Green Shoots”, dated December 14, 2018, available at fes.bcaresearch.com
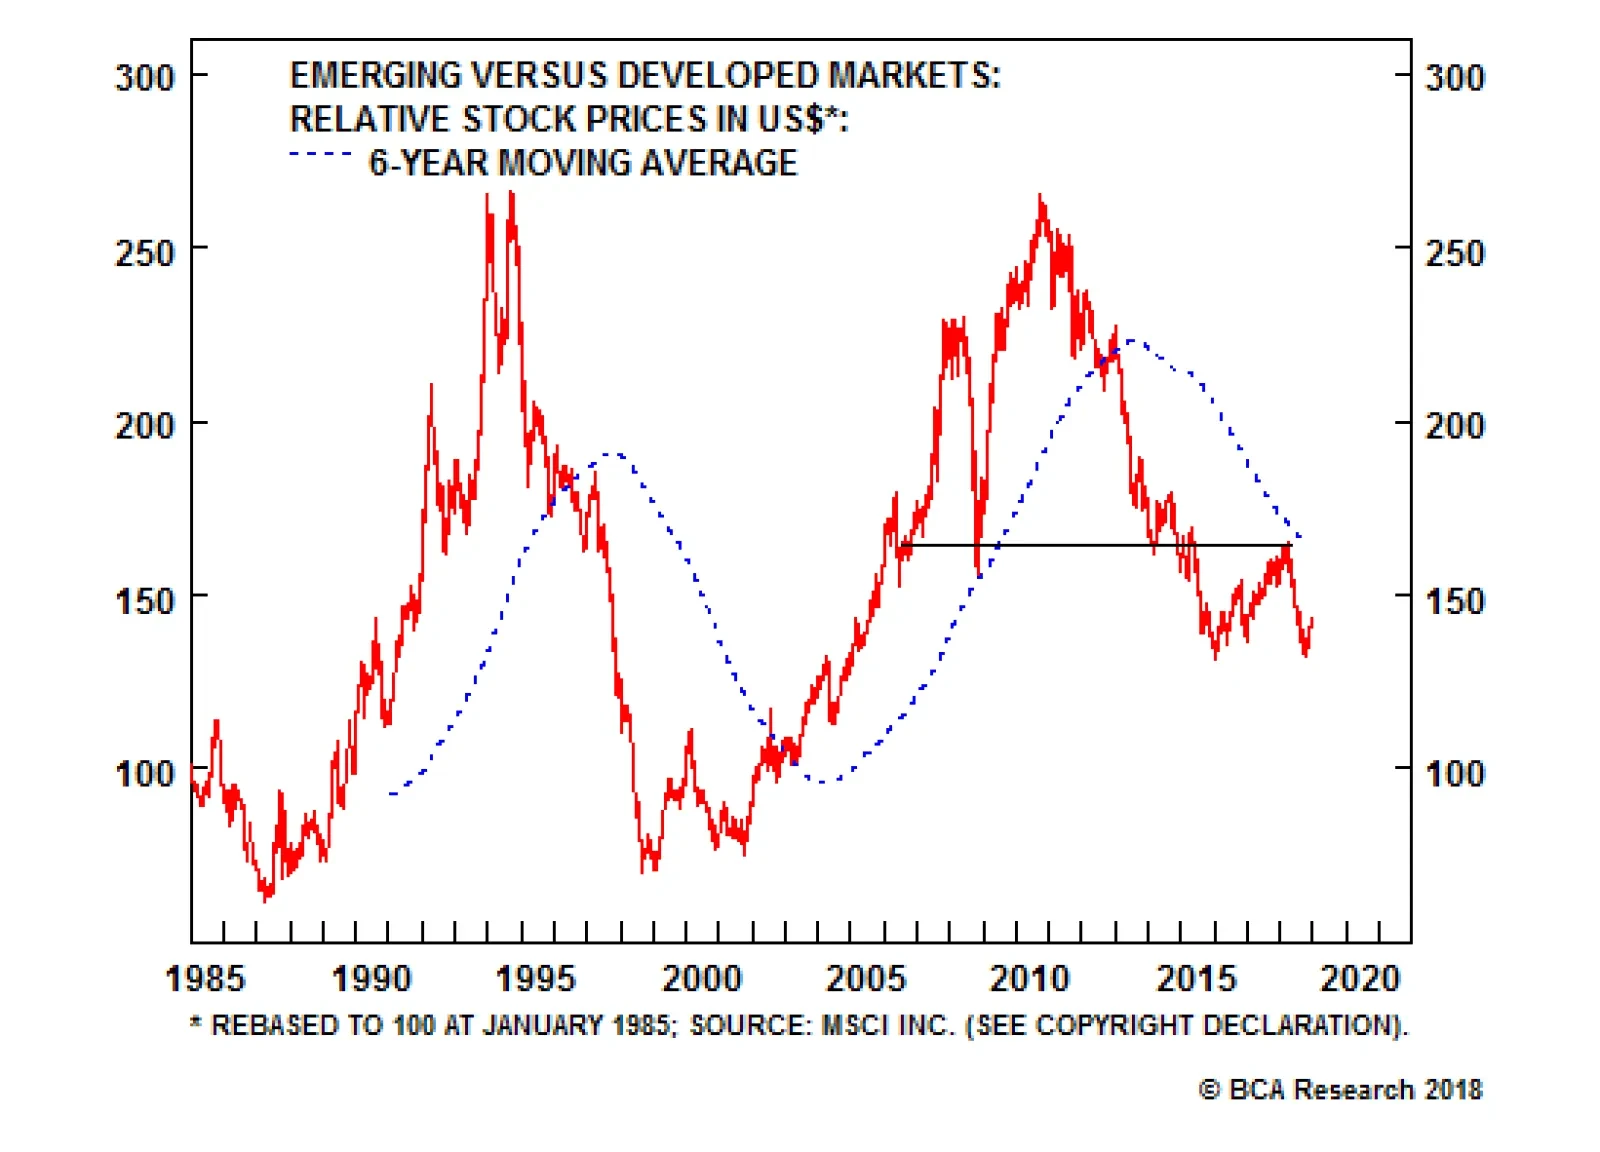
As we head into 2019, the past decade is shaping up to be a lost one for emerging markets (EM) assets. In particular: EM stocks have substantially underperformed DM equities since the end of 2010. In absolute terms, EM shares are at the same level as they…
Highlights Downside risks to EM assets remain substantial. Stay put. EM stocks, credit and currencies will underperform their DM counterparts in the first half of 2019. The key and necessary condition for a new secular EM bull market to emerge is the end of abundant financing. The latter is imperative to compel corporate restructuring, bank recapitalization as well as structural reforms. The cyclical EM outlook hinges on China’s business cycle. The slowdown in China is broad-based and will deepen. The slowdown in China/EM will likely lead to global trade contraction. The latter is negative for global cyclicals yet bullish for the U.S. dollar. Feature As we head into 2019, the past decade is shaping up to be a lost one for emerging markets (EM) assets. In particular: EM stocks have underperformed DM markets substantially since the end of 2010 (Chart I-1). In absolute terms, EM share prices are at the same level as they were in early 2010. Chart I-1EM Equities Have Been Underperforming DM For Eight Years
EM Equities Have Been Underperforming DM For Eight Years
EM Equities Have Been Underperforming DM For Eight Years
EM currencies have depreciated substantially since 2011, and the EM local currency bond index (GBI-EM) on a total-return basis has produced zero return in U.S. dollar terms since 2010 (Chart I-2). Chart I-2A Lost Decade For Investors In EM Local Currency Bonds?
A Lost Decade For Investors In EM Local Currency Bonds?
A Lost Decade For Investors In EM Local Currency Bonds?
Finally, EM sovereign and corporate high-yield bonds have not outperformed U.S. high-yield corporate bonds on an excess-return basis. Will 2019 witness a major reversal of such dismal EM performance? And if so, will it be a structural or cyclical bottom? The roots underneath this lost decade for EM stem neither from trade wars nor from Federal Reserve tightening. Therefore, a structural bottom in EM financial markets is contingent neither on the end of Fed tightening nor the resolution of current trade tussles. We address the issues of Fed tightening and trade wars below. A Lost Decade: Causes And Remedies What led to a lost decade for EM was cheap and plentiful financing. When the price of money is low and financing is abundant, companies and households typically rush to borrow and spend unwisely. Capital is misallocated and, consequently, productivity and real income growth disappoint – and debtors’ ability to service their debts worsens. This is exactly what has happened in EM, as easy money splashed all over developing economies since early 2009. There have been three major sources of financing for EM: Source 1: Chinese Banks Chinese banks have expanded their balance sheets by RMB 198 trillion to RMB 262 trillion (or the equivalent of $28.8 trillion) over the past 10 years (Chart I-3, top panel). When commercial banks expand their balance sheets by lending to or buying an asset from non-banks, they create deposits (money). Consistently, the broad money supply has expanded by RMB 175 trillion to RMB 234 trillion (or the equivalent of $25.5 trillion). Chart I-3Enormous Boom In Chinese Banks' Assets And Money Supply
Enormous Boom In Chinese Banks' Assets And Money Supply
Enormous Boom In Chinese Banks' Assets And Money Supply
Notably, the People’s Bank of China (PBoC) has increased commercial banks’ excess reserves by RMB 1.5 trillion to RMB 2.8 trillion (or the equivalent of $0.22 trillion) (Chart I-3, bottom panel). Hence, the meaningful portion of money supply expansion has been due to the money multiplier – money created by mainland banks – not a provision of excess reserves by the PBoC (Chart I-4). Chart I-4Attribution Of Rise In Money Supply To Excess Reserves And Money Multiplier
Attribution Of Rise In Money Supply To Excess Reserves And Money Multiplier
Attribution Of Rise In Money Supply To Excess Reserves And Money Multiplier
Not only has such enormous money creation by commercial banks generated purchasing power domestically, but it has also boosted Chinese companies’ and households’ purchases of foreign goods and services. The Middle Kingdom’s imports of goods and services have grown to $2.5 trillion compared with $3.2 trillion for the U.S. (Chart I-5). China’s spending has boosted growth considerably in many Asian, Latin American, African, Middle Eastern, and even select advanced economies. Chart I-5Imports Of Goods And Services: China And The U.S.
Imports Of Goods And Services: China And The U.S.
Imports Of Goods And Services: China And The U.S.
Source 2: DM Central Banks’ QE By conducting quantitative easing, the central banks of several advanced economies have crowded out investors from fixed-income markets, incentivizing them to search for yield in EM. The Fed, the Bank of England, the European Central Bank and the Bank of Japan have in aggregate expanded their balance sheets by $10 trillion (Chart I-6). Chart I-6Quantitative Easing In DM
Quantitative Easing In DM
Quantitative Easing In DM
This has led to massive inflows of foreign portfolio capital into EM, and reflated asset prices well beyond what was warranted by their fundamentals. Specifically, since January 2009, foreign investors have poured $1.5 trillion on a net basis into the largest 15 developing countries excluding China, Taiwan and Korea (Chart I-7, top panel). For China, net foreign portfolio inflows amounted to $560 billion since January 2009 (Chart I-7, bottom panel). Chart I-7Cumulative Foreign Portfolio Inflows Into EM And China
Cumulative Foreign Portfolio Inflows Into EM And China
Cumulative Foreign Portfolio Inflows Into EM And China
Source 3: EM Ex-China Banks EM ex-China began expanding their balance sheets aggressively in early 2009, originating new money (local currency) and thereby creating purchasing power. This was especially the case between 2009 and 2011. Since that time, money creation by EM ex-China banks has decelerated substantially due to periodic capital outflows triggering currency weakness and higher borrowing costs. Out of these three sources, China’s money/credit cycles remain the primary driver of EM. The mainland’s imports from developing economies serves as the main nexus between China and the rest of EM. Essentially, Chinese money and credit drive imports, influencing growth and corporate profits in the EM universe (Chart I-8). Chart I-8China's Credit Cycle Leads Its Imports
China's Credit Cycle Leads Its Imports
China's Credit Cycle Leads Its Imports
In turn, EM business cycle upturns attract international capital. Meanwhile, credit creation by local banks in EM ex-China – primarily in economies with high inflation or current account deficits – is a residual factor. In these countries, domestic credit creation is contingent on a healthy balance of payments and a stable exchange rate. The latter two, in turn, transpire when exports to China and international portfolio capital inflows are improving. The outcome of easy financing is over-borrowing and capital misallocation. The upshot of the latter is usually lower efficiency and productivity growth. Not surprisingly, productivity growth in both China and EM ex-China has decelerated considerably since 2009 (Chart I-9). EM return on assets has dropped a lot in the past 10 years and is now on par with levels last seen during the 2008 global recession (Chart I-10). Chart I-9Falling Productivity Growth In EM And China =...
Falling Productivity Growth In EM And China =...
Falling Productivity Growth In EM And China =...
Chart I-10... = Low Profit Margins And Low Return On Capital
... = Low Profit Margins And Low Return On Capital
... = Low Profit Margins And Low Return On Capital
Accordingly, the ability to service debt by EM companies has deteriorated considerably in the past decade – the ratios of cash flows from operations to both interest expenses and net debt have dropped (Chart I-11). Chart I-11EM: Deteriorating Ability To Service Debt
EM: Deteriorating Ability To Service Debt
EM: Deteriorating Ability To Service Debt
These observations offer unambiguous confirmation that money has been spent inefficiently – i.e., misallocated. Credit booms and capital misallocations warrant a period of corporate restructuring and banking sector recapitalization. Without this, a new cycle cannot emerge. A secular bull market in equities and exchange rates arises when productivity growth and hence income-per-capita growth accelerates, and return on capital begins to climb. This is not yet the case for most developing economies. The end of cheap and abundant financing is imperative to compel corporate restructuring, bank recapitalization as well as structural reforms. These are necessary conditions to create the foundation for a new secular bull market. Ironically, the best remedy for an addiction to easy money is a period of tight money. For example, U.S. share prices would not be as high as they currently are if the U.S. did not go through the Lehman crisis. This 10-year bull market in U.S. equities was born from the ashes of the Lehman crisis. Vanished financing and the private sector’s tight budgets in 2008-‘09 compelled corporate restructuring as well as a focus on efficiency and return on equity. Has EM financing become scarce and tight? Cyclically, China’s money creation and credit flows have slowed, pointing to a cyclical downturn in EM share prices and commodities (please see below for a more detailed discussion). International portfolio flows to EM have also subsided since early this year. There has been selective corporate restructuring post the 2015 commodities downturn, including in the global/EM mining and energy sectors, China steel and coal industries as well as among Russian and Brazilian companies. However, there are many economies and industries where corporate restructuring, bank recapitalization and structural reforms have not been undertaken. Yet from a structural perspective, China’s money and credit growth remain elevated and excesses have not been purged. Besides, international portfolio flows to EM have had periodic “stop-and-gos” but have not yet retrenched meaningfully (refer to Chart I-7 on page 4). Consequently, structural overhauls and corporate restructuring in China/EM have by and large not yet occurred – in turn negating the start of a new secular bull market. Bottom Line: Conditions for a structural bull market in EM/China are not yet present. EM/China: A Cyclical Bottom Is Not In Place From a cyclical perspective, China is an important driving force for the majority of EM economies, and its deepening growth slowdown will continue to weigh on EM growth and global trade. In fact, odds are that global trade will contract in the first half of 2019: In China, tightening of both monetary policy as well as bank and non-bank regulation from late 2016 has led to a deceleration in money and credit growth. The latter has, with a time, lag depressed growth since early this year. Policymakers have undertaken some stimulus since the middle of this year, but it has so far been limited. Stimulus also works with a time lag. Besides, even though the broad money impulse has improved, the credit and fiscal spending impulse remains in a downtrend (Chart I-12). Therefore, there are presently mixed signals from money and credit. Chart I-12China's Stimulus Leads EM And Commodities
China's Stimulus Leads EM And Commodities
China's Stimulus Leads EM And Commodities
As illustrated in Chart I-12, the bottoms in the money and combined credit and fiscal spending impulses, in July 2015, preceded the bottom in EM and commodities by six months and their peak led the top in financial markets by about 15 months in January 2018. Besides, in 2012-‘13, the rise in the money and credit impulses did not do much to help EM stocks or industrial commodities prices. Hence, even if the money as well as credit and fiscal impulses bottom today, it could take several more months before the selloff in EM financial markets and commodities prices abates. Additionally, the ongoing regulatory tightening of banks and non-bank financial institutions will hinder these institutions' willingness and ability to extend credit, despite lower interest rates. We discussed in a recent report that both the effectiveness of the monetary transmission mechanism and the time lag between policy easing and a bottom in the business cycle are contingent on the money multiplier (creditors' willingness to lend, and borrowers' readiness to borrow) and the velocity of money (the marginal propensity to spend among households and companies). Growth in capital spending in general and construction in particular have ground to a halt (Chart I-13). Chart I-13China: Weak Capital Spending
China: Weak Capital Spending
China: Weak Capital Spending
Not only has capital spending decelerated but household consumption has also slowed since early this year, as demonstrated in the top panel of Chart I-14. Chart I-14China: A Broad-Based Slowdown
China: A Broad-Based Slowdown
China: A Broad-Based Slowdown
Finally, mainland imports are the main channel in terms of how China’s growth slowdown transmits to the rest of the world. Not surprisingly, EM share prices and industrial metals prices correlate extremely well with the import component of Chinese manufacturing PMI (Chart I-15). Chart I-15China's Imports And EM And Commodities
China's Imports And EM And Commodities
China's Imports And EM And Commodities
Bottom Line: The slowdown in China is broad-based, and our proxies for marginal propensity to spend by households and companies both point to further weakness (Chart I-14, middle and bottom panels). Constraints And Chinese Policymakers’ Dilemma Given the ongoing slowdown in the economy, why are Chinese policymakers not rushing to the rescue with another round of massive stimulus? First, policymakers in China realize that the stimulus measures of 2009-‘10, 2012-‘13 and 2015-‘16 led to massive misallocations of capital and fostered both inefficiencies and speculative excesses in many parts of the economy – the property markets being among the main culprits. Indeed, policymakers recognize that easy money does not foster productivity growth, which is critical to the long-term prosperity of any nation. For China to grow and prosper in the long run, the economy’s addiction to easy financing should be curtailed. Second, policymakers are currently facing a dilemma. The real economy is saddled with enormous debt and is slowing. This warrants lower interest rates – probably justifying bringing down short-term rates close to zero. Yet, despite enforcing capital controls, it seems the exchange rate has been correlated with China’s interest rate differential with the U.S. since early 2010 (Chart I-16). Given the ongoing growth slowdown and declining return on capital in China, there are rising pressures for capital to exit the country. Notably, the PBoC’s foreign exchange reserves of $3 trillion are only equivalent to 10-14% of broad money supply (i.e., all deposits in the banking system) (Chart I-17). Chart I-16Chinese Currency And Interest Rates
Chinese Currency And Interest Rates
Chinese Currency And Interest Rates
Chart I-17China: Foreign Currency Reserves Are Very Low Compared To Money Supply/Deposits
China: Foreign Currency Reserves Are Very Low Compared To Money Supply/Deposits
China: Foreign Currency Reserves Are Very Low Compared To Money Supply/Deposits
The current interest rate differential is only 33 basis points. If the PBoC guides short-term rates lower and the Fed stays on hold or hikes a few more times, the spread will drop to zero or turn negative. Based on the past nine-year correlation, the narrowing interest rate spread suggests yuan depreciation. This will weigh on EM and probably even global risk assets. In a scenario where policymakers prioritize defending the yuan’s value, they may not be able to reduce borrowing costs and assist indebted companies and households. As a result, the downtrend in the real economy would likely worsen. Consequently, EM and global growth-sensitive assets will drop further. Given the constraints Chinese policymakers are facing, reducing interest rates and allowing the yuan to depreciate further is the least-bad outcome. Yet this will rattle Asian and EM currencies and risk assets. What About The Fed And Trade Wars? The Fed and EM: Fed policy and U.S. interest rates are relevant to EM, but they are of secondary importance. The primary driver of EM economies are their own domestic fundamentals as well as global trade – not just U.S. growth. Historically, the correlation between EM risk assets and the fed funds rate has been mixed, albeit more positive than negative (Chart I-18). On this chart, we have shaded the five periods over the past 38 years when EM stocks rallied despite a rising fed funds rate. Chart I-18The Fed And EM Share Prices: A Historical Perspective
The Fed And EM Share Prices: A Historical Perspective
The Fed And EM Share Prices: A Historical Perspective
There were only two episodes when EMs crashed amid rising U.S. interest rates: the 1982 Latin American debt crisis and the 1994 Mexican Tequila crisis. Yet it is vital to emphasize that these crises occurred because of poor EM fundamentals – elevated foreign currency debt levels, negative terms-of-trade shocks, large current account deficits and pegged exchange rates. Dire EM fundamentals also prevailed before the Asian/EM crises of 1997-1998. However, these late-1990s crises occurred without much in the way of Fed tightening or rising U.S. bond yields. Trade Wars: China’s current growth slowdown has not originated from a decline in its exports. In fact, Chinese aggregate exports and those to the U.S. have been growing at a double-digit pace, largely due to the front running ahead of U.S. import tariffs. More importantly, China’s exports to the U.S. and EU account for 3.8% and 3.2% of its GDP, respectively (Chart I-19). Total exports amount to 20% of GDP, with almost two-thirds of that being shipments to developing economies. This compares with capital spending that makes up 42% of GDP and household consumption of 38% of GDP. Hence, capital expenditures and household spending are significantly larger than shipments to the U.S. Chart I-19Structure Of Chinese Economy
Structure Of Chinese Economy
Structure Of Chinese Economy
There is little doubt that the U.S.-China confrontation has affected consumer and business sentiment in China. Nevertheless, the slowdown in China has - until recently - stemmed from domestic demand, not exports. Investment Recommendations It is difficult to forecast whether the current EM down leg will end with a bang or a whimper. Whatever it is, the near-term path of least resistance for EM is to the downside. “A bang” scenario – where financial conditions tighten substantially and for an extended period – would likely compel corporate and bank restructuring as well as structural reforms. Therefore, it is more likely to mark a structural bottom in EM financial markets. “A whimper” scenario would probably entail only moderate tightening in financial conditions. Thereby, it would not foster meaningful corporate restructuring and structural reforms. Hence, such a scenario might not mark a secular bottom in EM stocks and currencies. In turn, the EM cyclical outlook hinges on China’s business cycle. If and when Chinese policymakers reflate aggressively, the mainland business cycle will revive, producing a cyclical rally in EM risk assets. At the moment, Chinese policymakers are behind the curve. With respect to investment strategy, we continue to recommend: Downside risks to EM assets remain substantial. Stay put. EM stocks, credit and currencies will underperform their DM counterparts in the first half of 2019. The slowdown in China/EM will likely lead to global trade contraction. The latter is negative for global cyclicals yet bullish for the U.S. dollar. For dedicated EM equity portfolios, our overweights are: Brazil, Mexico, Chile, Colombia, Russia, central Europe, Korea and Thailand. Our underweights are: South Africa, Peru, Indonesia, India, the Philippines and Hong Kong stocks. We are neutral on the remaining bourses. In the currency space, we continue to recommend shorting a basket of the following EM currencies versus the U.S. dollar: ZAR, CLP, IDR, MYR and KRW. The latter is a play on RMB depreciation. The full list of our recommendation across EM equity, fixed-income, currency and credit markets is available on pages 14-15. Arthur Budaghyan, Senior Vice President Emerging Markets Strategy arthurb@bcaresearch.com Equity Recommendations Fixed-Income, Credit And Currency Recommendations
Highlights As investors increasingly look at allocating assets based on environmental, social, and governance (ESG) considerations, these strategies are becoming less niche. We look at different ESG investing strategies, in both equities and bonds, and analyze their historical risk-adjusted returns and performance in bear markets and recessions. We find that ESG indices have at least performed in line with, and often outperformed, aggregate indices, with lower volatility. However, performance varies from region to region and between asset classes. Markets with the worst ESG standards tend to see the biggest improvement in performance when ESG factors are considered Feature Increasing investor interest in environmental, social, and governance (ESG) investing poses a big question for money managers: how does an allocation to ESG investments affect the return and volatility profile of a traditional portfolio? This Special Report addresses the following issues: What are the risk-return characteristics of ESG investments from a top-down perspective? Do ESG investments provide recession/bear market protection? What are the unique challenges that money managers using an ESG strategy need to account for? A Brief Overview Of ESG To begin, we need to define what exactly ESG investing means. We see it as any investment activity that recognizes a certain set of principles to screen for environmental, social, and governance standards. ESG investing, as a term, is relatively new. However, the core concept can be traced back several decades. During the 20th century, ethical investing (EI) emerged, as investors applied faith-based criteria to their investments. From the 1980s, socially responsible investing (SRI) allowed investors to focus on social and environmental goals, in addition to their ethical beliefs. This was mainly due to an increased global awareness of environmentalism that emerged in this period, following events such as the Exxon Valdez oil spill in 1989 and claims of labor-rights abuses in various industries. In the early 2000s, ESG investing arose from investors' increasing awareness of the need to include corporate governance as an additional screening to SRI investing. The inclusion of the governance factor was also due to numerous corporate scandals, such as Enron's bankruptcy in 2001. Simply put, ESG is a broader concept than the previous incarnations of ethical investing. Throughout the early 2000s, various global initiatives started supporting the cause of ESG investing. The United Nations launched the Principles for Responsible Investing (PRI) in 2006 to promote ESG investing among institutional investors.1 Based upon six pillars, the PRI aims to encourage the use of ESG factors by investors in their investment process. Currently, most of the demand for ESG investing comes from larger financial institutions, particularly pension funds, whereas smaller investment institutions and retail investors lag in their interest. The Global Sustainable Investment Alliance (GSIA) has released a global standard classification to distinguish between the different ESG strategies as summarized in Table 1. Negative screening, positive screening, and corporate engagement are the most used strategies, while themed investing and targeted-situation investing have relatively less allocation. Figure 1 illustrates various examples of which types of investments might fall under ESG.2 Table 1Global Standard ESG Classification*
ESG Investing: No Harm, Some Benefit
ESG Investing: No Harm, Some Benefit
Figure 1Types Of Investments That Fall Under ESG*
ESG Investing: No Harm, Some Benefit
ESG Investing: No Harm, Some Benefit
The total market size of "sustainable investing" is difficult to quantify, due to the wide range of securities that could fall under this ambiguous label. According to the 2016 Global Sustainable Investment Review, published bi-annually by the GSIA, global ESG assets under management (using a very broad definition of ESG) totaled $22.9 trillion dollars as of 2016, a 25% increase from 2014.3 The development of cleaner energy sources, changing social norms, interest by millennials in environmental and social issues, and regulation are among the drivers of this growth. The increasing number of ETFs and mutual funds that define themselves as "socially conscious", standing at 279 as of Q3 2018, also demonstrates the growing interest in ESG investing.4 Additionally, the number of active managers integrating ESG factors in their investment strategy has grown (Chart 1). Chart 1Growing Interest...
ESG Investing: No Harm, Some Benefit
ESG Investing: No Harm, Some Benefit
Increasing investor demand has translated into further transparency from companies. According to the Governance & Accountability Institute, the number of S&P 500 firms that disclose their sustainability, corporate governance and social responsibility performance more than quadrupled between 2011 and 2017 (Chart 2).5 Chart 2...More Transparency
ESG Investing: No Harm, Some Benefit
ESG Investing: No Harm, Some Benefit
However, transparency is not the only barrier to the growth of ESG investing. The term ESG is still utilized and defined in different ways, confusing investors. A joint survey by the UN and the CFA Institute showed that 43% of U.S. equity and fixed income investors cited a lack of historical data, and 41% limited understanding and knowledge of ESG issues as the top barriers to incorporating ESG.6 Additionally, due to the lack of a standardized reporting system, investors cannot properly assess and compare ESG metrics across firms.7 ESG factors tend to be hard to quantify. Inconsistent ESG ratings due to differences in data analysis and reporting contribute to the lack of comparability. Investors should do their own thorough due diligence before investing. Various funds that screen for "socially responsible" criteria do sometimes include controversial stocks. For example, Vanguard's SRI European Stock Fund includes Royal Dutch Shell and British American Tobacco plc amongst its top 10 holdings.8 Risk-Return Characteristics9 To compare returns across regions, we use the MSCI ESG Leaders Index, which MSCI describes as using a best-in-class strategy and excluding companies involved in the alcohol, gambling, tobacco, nuclear power, and weapons businesses. It also minimizes sector-based tracking error by targeting 50% of the market capitalization within each GICS sector.10 MSCI assigns companies an ESG rating ranging from AAA to CCC; companies must maintain a rating above BB to be eligible for inclusion. We use the Bloomberg Barclays MSCI Socially Responsible Indices for our fixed-income comparisons. These indices use a negative screening process to exclude issuers involved in businesses that are in conflict with social and environmental values. Historical data for ESG indices tend to be limited; the earliest data-point for the MSCI ESG Leaders Index is September 2007. We analyze historical metrics for two periods: one starting September 2007, and the other starting July 2009 to show returns after the negative impact of the Global Financial Crisis (GFC). Tables 2 and 3 show that equity investors have enjoyed higher risk-adjusted returns on equity ESG indices thanon standard equity indices. However, this is not the case across all regions. The global ESG equity index outperformed in both periods, with lower volatility (Chart 3). In the U.S. and U.K., ESG indices underperformed their conventional counterparts, but in the euro area, China and Canada they significantly outperformed, while achieving lower volatility (charts for all countries shown in the Appendix). Emerging markets are perhaps the biggest surprise, since here the ESG index outperformed by over 3.5% annually in both periods. However, EM outperformance was mainly driven by China (Chart 4). Table 2Equities: Risk-Return Profile (September 2007 - October 2018)
ESG Investing: No Harm, Some Benefit
ESG Investing: No Harm, Some Benefit
Table 3Equities: Risk-Return Profile (July 2009 - October 2018)
ESG Investing: No Harm, Some Benefit
ESG Investing: No Harm, Some Benefit
Chart 3ESG Equities: Global Outperformance
ESG Equities: Global Outperformance
ESG Equities: Global Outperformance
Chart 4China Drove EM Outperformance
China Drove EM Outperformance
China Drove EM Outperformance
A study conducted by MSCI ESG Research showed that stock selection had the biggest contribution to the excess return of the emerging markets ESG equity indices, followed by sector-selection tilts. In fact, stock-selection added value in most regions, except the U.S. The MSCI ESG Leaders Index excludes firms such as Amazon (for its labor practices), Apple (supply-chain issues), and Facebook (privacy and data security) from both the U.S. and the global ESG indices, which resulted in its relative poor performance during the strong technology market of the past few years. Some argue that the regions with the worst ESG standards tend to see the biggest improvement in performance when ESG factors are considered. However, a debate then arises as to whether ESG ratings can be taken at face value, or should simply be an input into a broader analysis.11 One of the most surprising results from Tables 2 and 3 is the finding that the global ESG index has lower volatility, given the more idiosyncratic risk of ESG indices, which have on average only about half the number of constituents of aggregate market indices. The concentration - based on a Herfindahl-Hirschman Index (HHI) - of the top 10 ESG constituents is about four times that of the broad indices. ESG equity indices trade at lower PE multiples than traditional indices. Chart 5 shows that, on average, ESG equities' outperformance has been mainly driven by stronger relative earnings growth rather than relative multiple expansion. Earnings contributed 48% to total return growth for the ACWI ESG index, compared to 41% for its counterpart. PE expansion contributed 21% of the ESG index's total return, compared to over 30% for the ACWI index. Chart 5Drivers Of Return
Drivers Of Return
Drivers Of Return
The conclusions are not very different for fixed income (Table 4). There is little difference between returns for corporate SRI bonds and investment grade bonds. Despite the slight sector tilts towards financials and banks in SRI Bond Indices, the indices have largely tracked each other (Chart 6). Table 4Bonds: Risk-Return Profile (July 2009 - October 2018)
ESG Investing: No Harm, Some Benefit
ESG Investing: No Harm, Some Benefit
Chart 6ESG Bonds: No Difference In Performance
ESG Bonds: No Difference In Performance
ESG Bonds: No Difference In Performance
Only a limited amount of research has been conducted into the importance of ESG factors for credit portfolios, but several papers concluded that ESG scores do not significantly impact performance, though there was some evidence that bonds of companies with higher ESG scores actually trade at wider spreads.12 Recession/Bear Market Protection Despite the efforts of ESG providers to limit sector-based tracking error, ESG equity indices still tend to have sector tilts due to over- and under-weighting firms based on their ESG scores. Sectors such as Information Technology, Financials, Communication Services, and Healthcare usually are favored relative to Materials, Industrials, and Energy. However, the magnitude of these tilts differs from region to region, and understanding the scope of these tilts is important when considering an ESG allocation. For example, the Chinese MSCI ESG Leaders Index is heavily skewed towards Communication Services (one stock, Tencent, in particular). Simply put, the sector composition/index construction of ESG indices alters their cyclicality and, therefore, performance. To understand this, it is important to observe this behavior over as many cycles as possible. To analyze this, we looked at the U.S. MSCI KLD 400 Index, one of the oldest ESG indices, with data starting in 1990. In 2001-2002 (the aftermath of the tech bubble), the KLD 400 underperformed the S&P 500 due to the former's larger exposure to tech. On the other hand, during the 2007-2008 GFC, the KLD 400 had a smaller drawdown than the S&P 500 (Chart 7). Chart 7Sector Tilts Matter
Sector Tilts Matter
Sector Tilts Matter
Additionally, Table 5 shows that an ESG allocation has tended to at least perform in line with equities overall, if not slightly outperform them, during bear markets. The MSCI KLD 400 outperformed the S&P 500 by an annualized average of 1% in the past five bear markets.13 Table 5Bear Market Protection?
ESG Investing: No Harm, Some Benefit
ESG Investing: No Harm, Some Benefit
We performed a risk-return analysis of a portfolio consisting of 60% conventional equities and 40% investment-grade bonds, compared to similarly weighted ESG-focused equity and fixed income indices. The results for the three regions for the period July 2009 and October 2018 are shown in Chart 8. Chart 8Portfolio Performance (Jul 2009 - Oct 2018)
ESG Investing: No Harm, Some Benefit
ESG Investing: No Harm, Some Benefit
The global and the euro area multi-asset ESG portfolios outperformed the conventional portfolios by 2 and 10 bps a year respectively while achieving slightly lower volatility. The U.S. ESG portfolio, on the other hand, slightly underperformed due to the underperformance of the ESG equity index in a strong tech market of the past nine years. Conclusion From the above analysis, we would draw the following conclusions: There is little evidence that ESG investing detracts from performance. In fact, there is some evidence that it can provide some outperformance and bear-market protection depending on the ESG index composition. Consideration of ESG factors in taking investment decisions needs to go beyond simply looking at ESG scores. Incorporating ESG analysis will increasingly become a core step in assessing risk for both equity and fixed-income investors. Index methodology and construction, as well as sector composition, play a big role in evaluating expected performance. ESG indices are growing. As of end of 2017, there were 42 ESG-focused equity indices by the major three providers as shown in Appendix Table 1. We expect to see more as ESG becomes increasingly acknowledged. Amr Hanafy, Research Associate amrh@bcaresearch.com Footnotes 1 Please see https://www.unpri.org/pri/about-the-pri 2 Please see https://www.ussif.org/files/Publications/Retail_Investor_Guide.pdf 3 Please see http://www.gsi-alliance.org/wp-content/uploads/2017/03/GSIR_Review2016.F.pdf 4 Please see Charles Schwab, Socially Conscious Funds List https://www.schwab.com/public/file/P-9561751/. Based on data from Morningstar, Inc. 5 Please see https://www.ga-institute.com/press-releases/article/flash-report-85-of-sp-500-indexR-companies-publish-sustainability-reports-in-2017.html 6 Please see ESG Integration In The Americas: Markets, Practices, And Data https://www.unpri.org/download?ac=5397 7 Please see CFA Financial Analysts Journal, Third Quarter 2018, Volume 74, Issue 3 https://www.cfapubs.org/doi/pdf/10.2469/faj.v74.n3.full 8 Please see https://global.vanguard.com/portal/site/loadPDF?country=ch&docId=14053 9 It is important to note that, in this report, we make no assumptions regarding the methodology or ESG ranking scores of the indices discussed, but rather take them as given by their providers (MSCI and Bloomberg Barclays). 10 Please see https://www.msci.com/eqb/methodology/meth_docs/MSCI_ESG_Leaders_Indexes_Methodology_June_2017.pdf 11 Please see http://www.whebgroup.com/what-do-esg-ratings-actually-tell-us/#_edn4 12 Please see https://static.macquarie.com/dafiles/Internet/mgl/global/shared/sf/images/corporate/asset-management/investment-management/understanding-esg-in-credit-portfolios.pdf?v=3 13 Bear markets defined as a drawdown of 15% lasting more than three months. Appendix Appendix Table 1ESG Equity Indices
ESG Investing: No Harm, Some Benefit
ESG Investing: No Harm, Some Benefit
Appendix Chart 1ESG Equities: U.S.
ESG Equities: U.S.
ESG Equities: U.S.
Appendix Chart 2ESG Equities: Euro Area
ESG Equities: Euro Area
ESG Equities: Euro Area
Appendix Chart 3ESG Equities: Emerging Markets
ESG Equities: Emerging Markets
ESG Equities: Emerging Markets
Appendix Chart 4ESG Equities: Canada
ESG Equities: Canada
ESG Equities: Canada
Appendix Chart 5ESG Equities: U.K.
ESG Equities: U.K.
ESG Equities: U.K.
Appendix Chart 6ESG Bonds: U.S.
ESG Bonds: U.S.
ESG Bonds: U.S.
Appendix Chart 7ESG Bonds: Euro Area
ESG Bonds: Euro Area
ESG Bonds: Euro Area
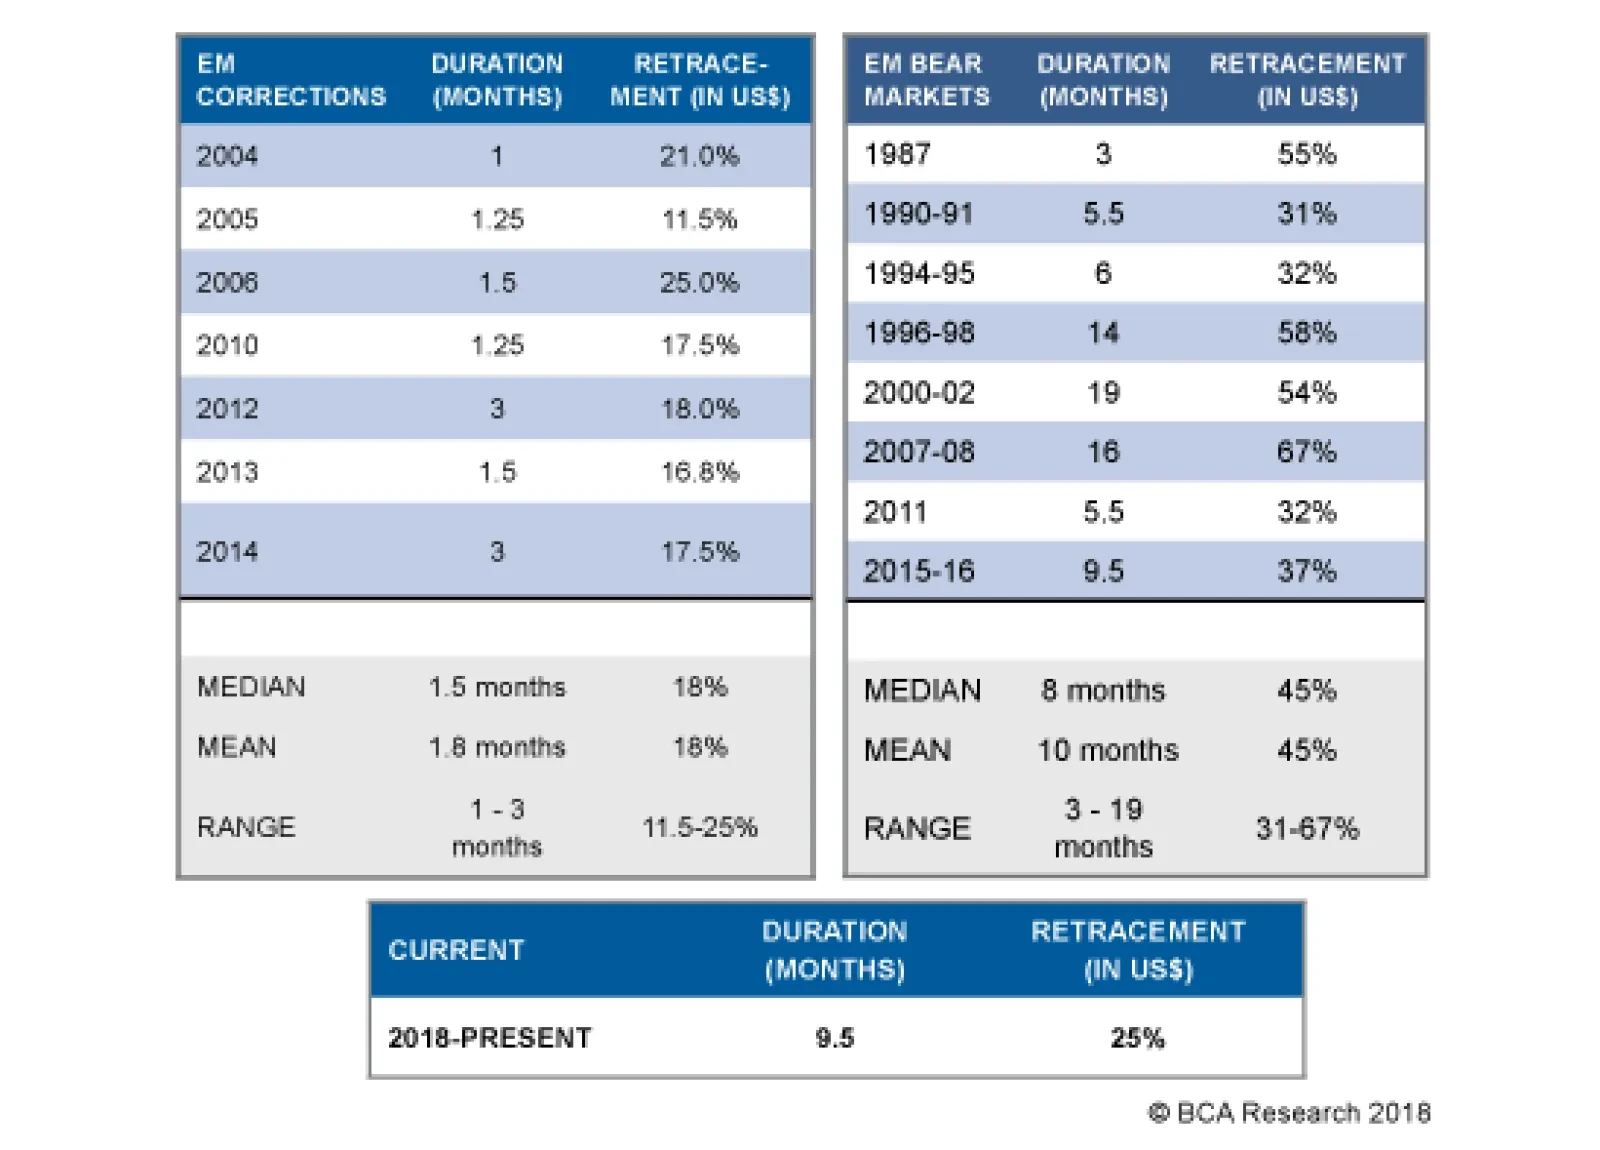
According to the 21st century’s encyclopedia, Wikipedia, “a domino effect or chain reaction is the cumulative effect produced when one event sets off a chain of similar events…It typically refers to a linked sequence of events where the time between…
Highlights Did October's equity rout ... : Before bouncing back in its final two sessions, October was the S&P 500's 12th-worst month of the postwar era. ... represent a watershed for financial markets?: Shaken investors have begun asking if the equity bull market is finally over, and if Treasury yields are in the process of making their cyclical highs. Not according to the macro backdrop, which still supports risk assets, ... : There is no recession in sight. An earnings contraction sufficient to induce an equity bear market, or a meaningful pickup in defaults, isn't imminent. ... or our rates checklist, which still supports a bearish take: Inflation may be taking its time, but nothing on our rates checklist calls for increasing duration in a bond portfolio. Feature U.S. equity investors were relieved to close the books on October, which was a notably bad month for the S&P 500. Its 7% loss was good for 33rd-worst in the postwar record books, and just missed being a -2 standard-deviation event. Had the month ended before its robust bounce in the final two sessions, it would have been the 12th-worst, two-and-a-half standard deviations below the mean (Chart 1). At its lowest point, a half-hour before the October 29th close, the index was down a whopping 10.5% for the month. Chart 1Standing Out From The Crowd
Standing Out From The Crowd
Standing Out From The Crowd
The price action understandably unnerved investors. Monthly declines of this magnitude are almost always associated with bear markets; just seven of the thirty-two larger declines occurred outside of bear markets, two of them by the skin of their teeth. Decomposing the equity returns into changes in earnings estimates and changes in forward multiples shows that sharp multiple contraction is a feature of nearly every bad month (Table 1). Table 1Worst Postwar Monthly Declines
Checking In On Our Rates View
Checking In On Our Rates View
It is estimate growth - a robust 0.8% - that makes October something of an outlier among the S&P 500's worst months, and we expect growing forward earnings will keep the S&P out of a bear market for another year, especially now that its multiple is more than 15% off its peak. Earnings growth should also keep spread product out of trouble for the time being. Although we recommend no more than an equal weight in corporate bonds, modest spread widening has boosted their total return prospects. Too Legit To Quit We expect that earnings will keep growing because they rarely contract in a meaningful way outside of recessions. With monetary accommodation likely reinforcing certain fiscal stimulus over the coming year, it is hard to see how the next U.S. recession will occur before 2020. As our U.S. bond strategists pointed out last week, the ongoing market implications of last month's equity decline depend on what precipitated it.1 Was it a simple correction sparked by a valuation reset, or has the market begun to sniff out an economic slowdown? With forward four-quarter earnings growing by an annualized 9.5% in October, it appears that the selloff was nothing more than a valuation reset. As our bond strategists point out, the picture was much different when the S&P 500 corrected in the summer of 2015 and the winter of 2015-16. Those corrections unfolded against the backdrop of a global manufacturing recession (Chart 2). The U.S. economy is not bulletproof, and slowing global growth and tighter financial conditions will eventually bring it to heel, but we think the next recession is still too far down the line for markets to begin selling off in advance of it. Chart 2The Fundamentals Are Much Improved From 2015-16
The Fundamentals Are Much Improved From 2015-16
The Fundamentals Are Much Improved From 2015-16
Checking In With Our Rates Checklist If macro conditions really did change for the worse last month, our bearish rates view may no longer apply, and we would have to rethink our underweight Treasury and below-benchmark-duration calls. We introduced our rates checklist in September to identify and track the key series that could trigger a view change. We review it now to see if perceptions of the Fed, inflation measures, labor-market developments, or financial-market excesses suggest that rates may be at a turning point (Table 2). Table 2Rates View Checklist
Checking In On Our Rates View
Checking In On Our Rates View
Market Perceptions Of The Fed We continue to scratch our head over markets' refusal to take the FOMC's terminal-rate projections seriously. The overnight index swap (OIS) curves are calling for a measly two hikes over the next 12 months ... and the next 18 months ... and the next 24 as well (Chart 3). That would leave the terminal fed funds rate for this tightening cycle at a mere 2.75%. The median projection among FOMC voters is 3 1/8%, and we're looking for anywhere from 3.5 to 4%. We will have to start backing off once the gap between our expectations and the market's expectations begins to close, but it's only widened since we established the checklist. Chart 3Stubbornly Staying Behind The Curve
Stubbornly Staying Behind The Curve
Stubbornly Staying Behind The Curve
We get to our 3.5-4% estimate on the premise that measured inflation will pick up enough to force the Fed to keep hiking beyond its own expectations in a bid to keep inflation from getting out of hand. Client meetings suggest that investors find our inflation call hard to swallow. Some eye-rolling when we mention the Phillips Curve is understandable, but our view is ultimately based on capacity constraints. Tepid investment in the years following the crisis have left the economy's productive potential ill-suited to meet the surge in aggregate demand provoked by tax cuts and fiscal stimulus. An inverted curve would indicate that the bond market has begun to anticipate that rate hikes will soon stifle the economy's momentum. For all the hand-wringing in the media about flattening over the 2-year/10-year segment of the curve, our preferred 3-month/10-year measure remains nowhere near inverting (Chart 4). The yield curve tends to invert way ahead of a recession, so we would look for other indicators to corroborate its message before we changed our big-picture take. We also note that a bear flattening would support below-benchmark-duration positioning. Chart 4The Fed Hasn't Gone Too Far Yet
The Fed Hasn't Gone Too Far Yet
The Fed Hasn't Gone Too Far Yet
Bottom Line: The bond market remains well behind the Fed, and the Fed may well wind up behind the economy. A broad repricing of the Treasury curve awaits. Inflation Measures Inflation's slow creep has gotten a little slower since we initially rolled out the checklist. Headline PCE and CPI have hooked downward, though their uptrends remain intact (Chart 5). Looking forward, continued tightening of the output gap should boost inflation (Chart 6), though long-term expectations have stalled for now (Chart 7). Inflation is the only section of the checklist that has backslid since September, but not by nearly enough to justify checking any of the boxes. Chart 5Two Steps Forward, One Step Back
Two Steps Forward, One Step Back
Two Steps Forward, One Step Back
Chart 6An Economy Running Hot ...
An Economy Running Hot ...
An Economy Running Hot ...
Chart 7... Will Eventually Produce Inflation
... Will Eventually Produce Inflation
... Will Eventually Produce Inflation
Labor Market Indicators The first item on our list of labor-market indicators is the unemployment gap, the difference between the unemployment rate and NAIRU. NAIRU (the Non-Accelerating-Inflation Rate of Unemployment), is the estimate of the lowest sustainable unemployment rate. The actual rate fell below NAIRU in early 2017, and the gap has been getting steadily more negative ever since (Chart 8, top panel). A negative gap is associated with higher compensation, but the wage response has been muted so far (Chart 8, bottom panel). Chart 8Supply And Demand
Supply And Demand
Supply And Demand
Friday's October employment report pointed to further downward pressure on the unemployment gap. The three-month moving average of net payroll additions came in at 218,000, keeping job growth for the last seven years at around 200,000/month (Chart 9). If the trend were to continue for another twelve months, and population growth and the labor force participation rate (Chart 10, middle panel) were to remain constant, the Atlanta Fed Jobs Calculator2 projects that the unemployment rate will fall to 3%. Chart 9A Steady, Job-Rich Recovery
A Steady, Job-Rich Recovery
A Steady, Job-Rich Recovery
Chart 10As 'Hidden' Unemployment Shrinks ...
As "Hidden" Unemployment Shrinks …
As "Hidden" Unemployment Shrinks …
We understand investors' impatience with the Phillips Curve. We admit to being surprised that compensation growth hasn't shown more life to this point (Chart 11). Just because wage gains have been sluggish out of the gate, however, doesn't mean they won't speed up in the future. Ancillary indicators like the broader definition of unemployment that includes discouraged and involuntary part-time workers (Chart 10, top panel), and the ratio of workers voluntarily leaving their jobs (Chart 10, bottom panel), reinforce the unemployment rate's signal that the labor market is on its way to becoming as tight as a drum. Chart 11... Wages Should Rise
... Wages Should Rise
... Wages Should Rise
Broader Indications Of Instability The final three items on our checklist are meant to flag factors that could bump the Fed off its gradual rate-hiking pace. Overheating would encourage the Fed to move more quickly, but there is nothing in the main cyclical elements of the economy that stirs concern (Chart 12). The Fed might move faster if its third mandate - preserving financial stability - dictated it, but the Fed has been quiet about financial-sector imbalances since Governor Brainard expressed concern about corporate lending two months ago. Finally, the Fed is not oblivious to economic strain in the rest of the world, but conditions in even the most vulnerable emerging markets are far from triggering some sort of "EM put." Chart 12No Sign Of Overheating Yet
No Sign Of Overheating Yet
No Sign Of Overheating Yet
Investment Implications We remain constructive on the economy and markets in the absence of a near-term catalyst to cut off the expansion, the credit cycle and/or the equity bull market. Like our bond strategists, we simply think the U.S. economy is too healthy to merit revising our bearish view on rates. The implication for investors with a balanced mandate is to continue to underweight Treasuries. Within fixed-income portfolios, investors should continue to maintain below-benchmark duration. No investment stance is forever, and we are counting on our checklist to help keep us alert to an approaching inflection point in rates, but the coast is clear for now. Doug Peta, Senior Vice President U.S. Investment Strategy dougp@bcaresearch.com 1 Please see BCA Research's U.S. Bond Strategy Weekly Report, "What Kind Of Correction Is This?," published October 30, 2018. Available at usbs.bcaresearch.com. 2https://www.frbatlanta.org/chcs/calculator.aspx?panel=1
Highlights Investors are worrying too much about the things that caused the global financial crisis, and not enough about those that could cause the next downturn. Despite the recent patch of soft data, the U.S. housing market is in good shape. Go long homebuilders relative to the S&P 500. Imbalances in the corporate debt market have increased, but are not severe enough to generate systemic economic distress. U.S. rates will need to rise quite a bit more than the market anticipates before the economy slows by enough to force the Fed to back off. The combination of a stronger dollar and inadequate Chinese stimulus will continue to pressure emerging markets. Even Brazil's pro-capitalist new president may not be able to reverse the country's bleak fiscal dynamics. Our MacroQuant model, which predicted the correction, points to further near-term downside risk for global equities. The cyclical (12-to-18 month) outlook looks much better, however. Feature The Market's Maginot Line One of the most reliable ways to make money as an investor is to figure out the market's collective biases and trade against them. Behavioral economists have long noted that people tend to assign too much weight to recent experience in taking decisions. As a result, in finance, as in military strategy, there is a constant temptation to fight the last war. The last war policymakers waged was against the scourge of deflation that followed the housing bust and financial crisis. For much of the past decade, investors have held a magnifying glass over anything that could possibly resemble the conditions that led up to the Global Financial Crisis. While such behavior is understandable, it is misplaced. History suggests that both lenders and borrowers tend to act prudently for years, if not decades, following major financial crises. Mistakes are still made, but they are different mistakes. People overcompensate. They obsess about the past rather than focusing on the future. U.S. Housing Is Okay There is no denying that the U.S. housing market has softened this year (Chart 1). Housing starts, building permits, and home sales have all fallen. Residential investment has subtracted from GDP growth over three consecutive quarters. Chart 1Housing Has Been A Drag On The U.S. Economy This Year
Housing Has Been A Drag On The U.S. Economy This Year
Housing Has Been A Drag On The U.S. Economy This Year
There is little mystery as to why the housing market has been on the back foot. The Trump tax bill capped the deduction on state and local property taxes, while reducing the amount of mortgage debt on which homeowners can deduct interest payments from $1 million to $750,000. This had a negative effect on housing activity, especially in high-tax Democrat-leaning states with elevated real estate prices. More importantly, mortgage rates have risen by over 100 basis points since last August. Chart 2 shows that home sales and construction almost always decline after mortgage rates rise. In this respect, the weakness in housing activity is reminiscent of the period following the taper tantrum, when housing activity also slowed sharply. Chart 2No Mystery Why U.S. Housing Has Been Weak...
No Mystery Why U.S. Housing Has Been Weak...
No Mystery Why U.S. Housing Has Been Weak...
We do not expect mortgage rates to fall from current levels. But they are not going to rise at the same pace as they have over the past year. Thus, while the headwinds from higher financing costs will not disappear, they will abate to some extent. Fundamentally, the housing market is on solid ground (Chart 3). Mortgage rates are still well below their historic average. Home prices have risen considerably, but do not appear excessively stretched compared to rents or incomes. Unlike in 2006, the home vacancy rate is near its historic lows. Residential investment stands at only 3.9% of GDP, compared with a peak of 6.7% of GDP in the second half of 2005. The average age of the residential capital stock has risen by nearly five years since 2006, the largest increase since the Great Depression. With household formation rebounding briskly from its post-recession lows, homebuilders are still arguably not churning out enough new homes. Chart 3A...But Fundamentals Are Still In Good Shape (I)
...But Fundamentals Are Still In Good Shape (I)
...But Fundamentals Are Still In Good Shape (I)
Chart 3B...But Fundamentals Are Still In Good Shape (II)
...But Fundamentals Are Still In Good Shape (II)
...But Fundamentals Are Still In Good Shape (II)
Mortgage lenders have learned from past mistakes (Chart 4). While lending standards have eased modestly over the past 4 years, underwriting standards have remained high. The average FICO score for new borrowers is more than 40 points above pre-recession levels. The Urban Institute Housing Credit Availability index, which measures the percentage of home purchase loans that are likely to default over the next 90 days, is at reassuringly low levels. This is particularly the case for private-label mortgages, whose default risk has hovered at just over 2% during the past few years, down from a peak of 22% in 2006. Moreover, banks today hold much more high-quality capital than in the past, which gives them additional space to absorb losses (Chart 5). Chart 4Lending Standards Have Been Tight, But Are Starting To Loosen
Lending Standards Have Been Tight, But Are Starting To Loosen
Lending Standards Have Been Tight, But Are Starting To Loosen
Chart 5U.S. Banks Are Well Capitalized
U.S. Banks Are Well Capitalized
U.S. Banks Are Well Capitalized
With all this in mind, we are initiating a new strategic trade to go long U.S. homebuilders relative to the S&P 500.1 Corporate Debt: How Big Are The Risks? Unlike household debt, U.S. corporate debt has risen over the past decade and now stands at a record high level as a share of GDP. The quality of the lending has also been less than pristine, as evidenced by the proliferation of "covenant lite" loans. The interest coverage ratio for the economy as a whole - defined as the volume of profits corporations generate for every dollar of interest paid - is still above its historic average (Chart 6). However, this number is skewed by a few mega-cap tech companies that hold a lot of cash and have little debt. Chart 6Interest Coverage Looks Relatively High
Interest Coverage Looks Relatively High
Interest Coverage Looks Relatively High
My colleague Mark McClellan, who writes our monthly Bank Credit Analyst publication, has shown that the interest coverage ratio for companies comprising the Bloomberg Barclays index would drop close to the lows of the Great Recession if interest rates were to rise by a mere 100 basis points across the corporate curve. The damage would be far worse if profits also fell by 25% in this scenario.2 While the corporate debt market has become increasingly frothy, it does not pose an imminent danger to the economy. There are several reasons for this. First, while U.S. corporate debt is high in relation to the past, it is still quite low in comparison with many other economies (Chart 7). The ratio of corporate debt-to-GDP, for example, is 30 percentage points higher in the euro area. This suggests that U.S. businesses still have the "carrying capacity" to take on additional debt. Chart 7U.S. Corporate Debt Is Not That High By Global Standards
U.S. Corporate Debt Is Not That High By Global Standards
U.S. Corporate Debt Is Not That High By Global Standards
Second, the average maturity of U.S. corporate debt has risen over the past decade, with an increasing share of companies opting for fixed over floating-rate borrowings. This implies that it will take a while for the effect of higher rates to make their way through the system. Third, and perhaps most importantly, corporate bonds are generally held by non-leveraged investors such as pension funds, insurance companies, and ETFs. Bank loans account for only 18% of nonfinancial corporate-sector debt, down from 40% in 1980 (Chart 8). The share of leveraged loans held by banks has declined from about 25% a decade ago to less than 10% today. Chart 8Banks Have Reduced Their Exposure To The Corporate Sector
Banks Have Reduced Their Exposure To The Corporate Sector
Banks Have Reduced Their Exposure To The Corporate Sector
Tellingly, we already had a dress rehearsal for what a corporate debt scare might look like. Credit spreads spiked in 2015. Default rates rose, but the knock-on effects to the financial system were minimal (Chart 9). This suggests that corporate America could withstand quite a bit of monetary tightening without buckling under the pressure. Chart 9The 2015 Debt Scare Did Not Topple The Economy
The 2015 Debt Scare Did Not Topple The Economy
The 2015 Debt Scare Did Not Topple The Economy
Government Debt: No Worries... Yet If the risks posed by both the housing market and corporate debt market are contained, what about the risks posed by soaring government debt? The long-term fiscal outlook is certainly bleak, but the near-term risks are low.3 President Trump's tweets aside, the U.S. has an independent central bank which has been able to keep inflation expectations well anchored. The U.S. private sector is also running a financial surplus at the moment, meaning that it earns more than it spends (Chart 10). Not only does this make the economy more resilient, it also provides the government with additional savings with which to finance its fiscal deficit. Chart 10The U.S. Private Sector Is A Net Saver
The U.S. Private Sector Is A Net Saver
The U.S. Private Sector Is A Net Saver
The private sector's financial balance will deteriorate over the next two years as household savings decline and corporate investment rises. This will put upward pressure on Treasury yields. However, if rising yields are reflective of stronger aggregate demand, this is unlikely to derail the economy. When Things Break Recessions are usually caused when the Fed raises rates by enough to undermine spending on interest rate-sensitive purchases such as housing, or when higher rates prick an asset bubble just waiting to burst. Given the lack of clear imbalances either in the real economy or financial markets, the Fed may have to raise rates significantly more than the market is currently anticipating. In fact, far from having to press the pause button midway through next year, our baseline expectation is that the Fed will expedite the pace of rate hikes in late 2019 as inflation finally starts to accelerate. Aggressive Fed rate hikes combined with an incrementally less expansionary fiscal policy will sow the seeds of a recession in late 2020 or 2021. Before the next U.S. downturn arrives, the dollar will have strengthened further. A resurgent greenback will cast a long shadow over emerging markets and commodity producers. As we discussed last week, China is unlikely to save the day by launching a massive stimulus program of the sort that it orchestrated in both 2009 and 2015.4 True, not all emerging markets are equal. Emerging Asia is more resilient now than it was two decades ago. Thailand, for example, was patient zero for the Asian crisis in 1997. Today, it sports a current account surplus of over 10% of GDP and low levels of external debt. This resilience will not prevent Asian economies from experiencing slower growth on the back of weaker Chinese demand, but it will prevent a full-blown balance of payments crisis from spiraling out of control. In contrast to Emerging Asia, Latin America looks more vulnerable (Table 1). BCA's chief emerging market strategist, Arthur Budaghyan, wisely upgraded Brazilian assets on a tactical basis on October 9th ahead of the presidential elections. Nevertheless, Arthur still worries that Brazil's daunting fiscal challenges - the budget deficit currently stands at 7.8% of GDP and the IMF expects government debt to rise to nearly 100% of GDP over the next five years (Chart 11) - are so grave that even South America's answer to Donald Trump may not be able to save the Brazilian economy. Table 1Vulnerability Heat Map For Key EM Markets
Fighting The Last War
Fighting The Last War
Chart 11Brazil Is Fiscally Challenged
Brazil Is Fiscally Challenged
Brazil Is Fiscally Challenged
A Correction, Not A Bear Market The current market environment bears some similarities to the late 1990s. The Fed is tightening monetary policy in order to keep the domestic economy from overheating. The U.S. economy is responding to higher rates to some extent, but the main effects are being felt overseas. The Asian Crisis did not end the bull market in U.S. stocks, but it did generate a few nasty selloffs, the most notable being the 22% peak-to-trough decline in the S&P 500 between July 20 and October 8, 1998. We witnessed such a selloff this October. The bad news is that our MacroQuant model is pointing to additional equity weakness over the coming weeks (Chart 12). The model tends to downgrade stocks whenever growth is slipping, financial conditions are tightening, and sentiment is deteriorating from bullish levels. All three of these things are currently occurring. Chart 12MacroQuant* Model Suggests Caution Is Warranted
Fighting The Last War
Fighting The Last War
The good news is that none of our recession indicators are flashing red. Since recessions and bear markets typically overlap (Chart 13), the odds are high that the current stock market correction will be just that, a correction. Chart 13Recessions And Bear Markets Usually Overlap
Recessions And Bear Markets Usually Overlap
Recessions And Bear Markets Usually Overlap
Peter Berezin, Chief Global Strategist Global Investment Strategy peterb@bcaresearch.com 1 The corresponding ETFs are long ITB/short SPY. 2 Please see The Bank Credit Analyst Special Report, "The Long Shadow Of The Financial Crisis," dated October 25, 2018. 3 It is actually not even clear that a loss of confidence in America's fiscal management would cause a recession. The Fed largely determines borrowing costs at the short-to-medium end of the yield curve, which is where the government finances most of its debt. If people lose confidence in the dollar, they will either need to run down their cash balances by purchasing more goods and services or try to move their wealth abroad. The former will directly increase aggregate demand, while the latter will indirectly increase it through a weaker currency. To be clear, we are not suggesting that such an outcome would be beneficial to the economy; it would, among other things, greatly slow potential GDP growth by discouraging investment. But the near-term effect would likely be economic overheating and rising inflation rather than a recession. 4 Please see Global Investment Strategy Weekly Report, "Chinese Stimulus: Not So Stimulating," dated October 26, 2018. Strategy & Market Trends Tactical Trades Strategic Recommendations Closed Trades