Asia
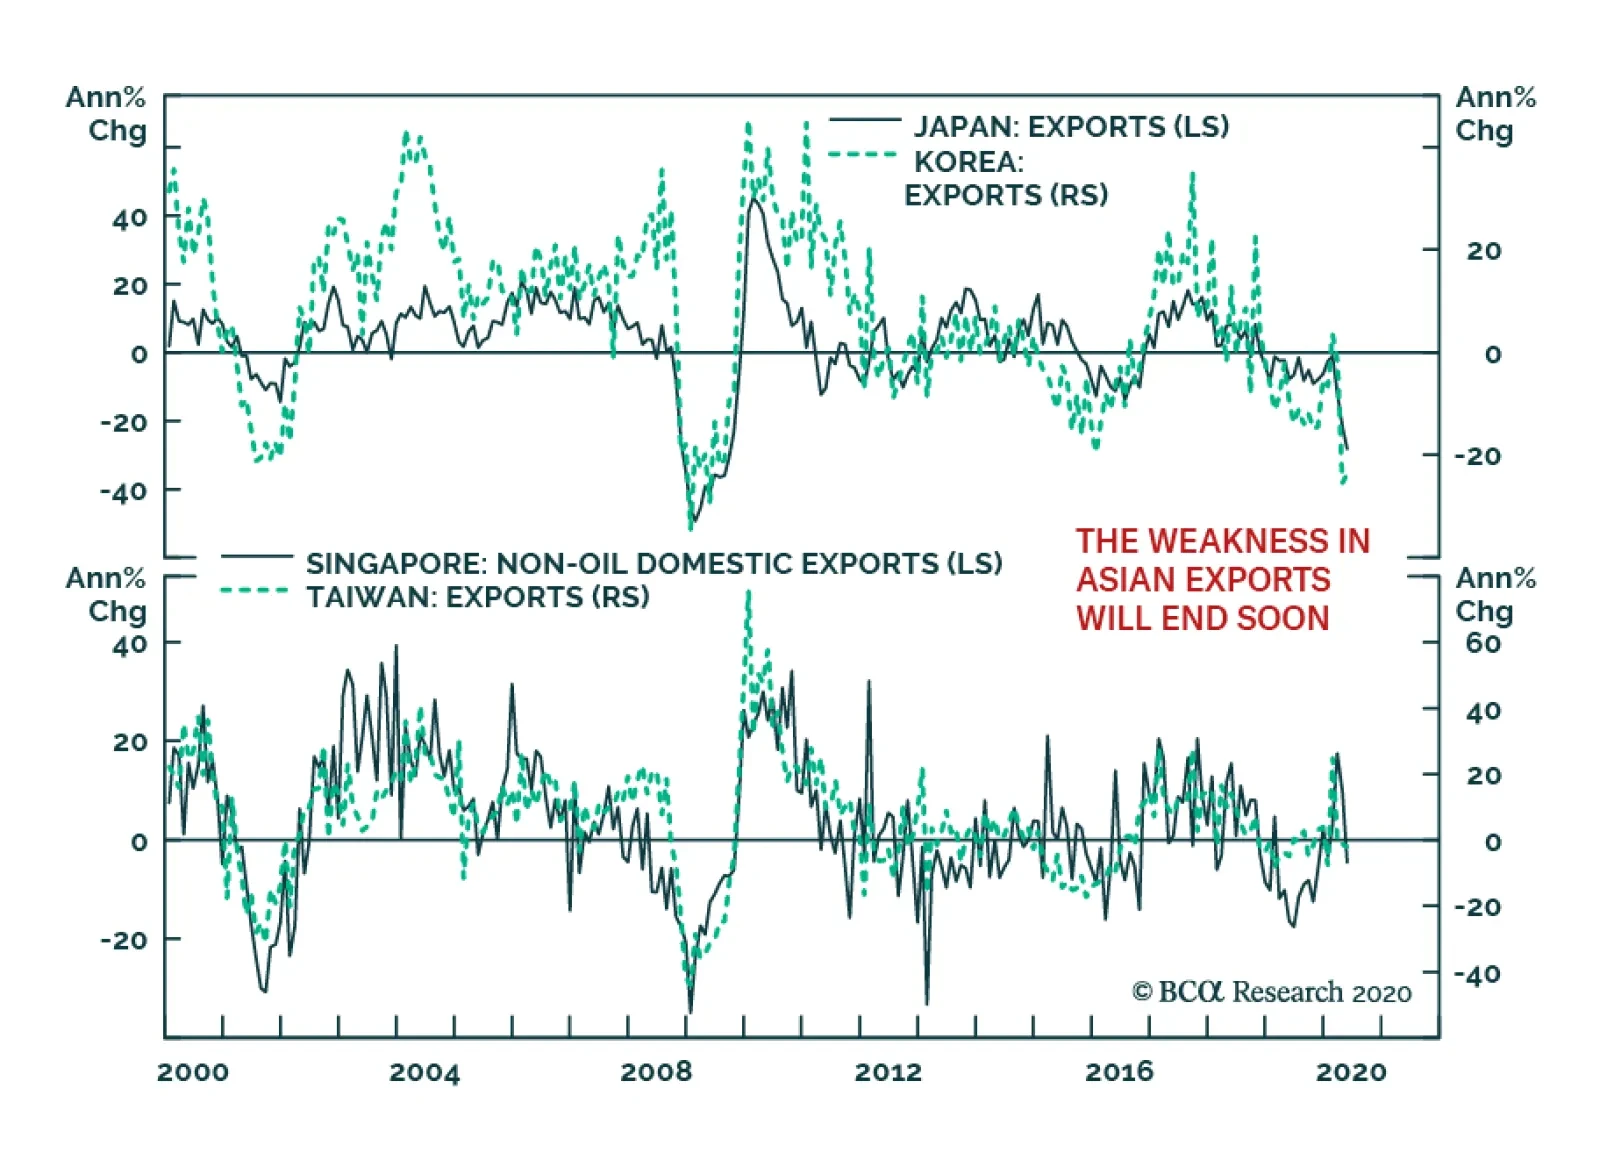
In recent months, the message from Asia’s trade data has been cacophonous. After big positive prints, annual export growth in Singapore fell to -4.5% in May. Taiwanese shipments growth is mildly negative. Meanwhile, Korean and Japanese exports are contracting…

Highlights China and India periodically fight each other on their fuzzy Himalayan border with zero market consequences. A major conflict is possible in the current environment – but it would present a buying opportunity. Chinese escalation with India would not have a negative impact on global trade and economy, unlike escalation with the US or its East Asian allies. If China gets into a major conflict with India, it is less likely to stage major military actions in the South China Sea or Taiwan Strait. It would reduce much more significant geopolitical risks. Go strategically long Indian pharmaceuticals. Feature India and China have engaged in their first deadly military clash since 1967. An Indian colonel and at least 20 troops died in fighting on June 15 in the Galwan Valley, Ladakh, where territorial disputes have heated up over the past month.At least 50 Chinese troops are estimated dead.1 Chart 1Regional Equities May Not Shrug Off War In Himalayas ... At First
Regional Equities May Not Shrug Off War In Himalayas ... At First
Regional Equities May Not Shrug Off War In Himalayas ... At First
It was a minor incident. No shots were fired. Combatants used stones and knives and threw each other off cliffs. However, the occasion of the battle was a negotiation to de-escalate tensions, and talks have gone on since June 3. So that bodes ill. Prime Minister Narendra Modi’s government has not responded but China’s foreign ministry is making conciliatory remarks. Normally India-China border clashes occur during the summer, when weather permits, and do not last long and do not impact the rest of the world, either politically or financially. However, the structural and cyclical drivers of the conflict suggest it could escalate over the summer. A major escalation between nuclear powers is unlikely but could conceivably cause volatility in global financial markets. Global equity investors are focused on other things (COVID-19, global stimulus), but recent volatility suggests that Chinese, Indian, and Pakistani bourses could be vulnerable to any major military escalation (Chart 1). However, a Himalayan-inspired selloff would be short-lived and would present a buying opportunity. India-China tensions are far less relevant to global financial markets than China’s disputes with the United States in East Asia. If the US uses India as a pretext for tougher actions on China, then that is a different story. But it is unlikely for reasons explained below. Our base case strategic assessment of India remains the same: Chinese expansionism will pressure India to speed up economic development to gain greater influence in South Asia. India will also pursue better trade and defense relations with the United States and its allies in East Asia and the Pacific. We are tactically cautious on global equities, but strategically we expect equities to beat bonds and cyclicals to beat defensives. Selloffs stemming from Himalayan conflict will create buying opportunities for emerging market equities, especially India. The Drivers Of The Ladakh Skirmish India and China have a 2,170-mile border in the Himalayan mountains that is disputed in India’s northwest (Aksai Chin) and northeast (Sikkim; Arunachal Pradesh). These border disputes have simmered for decades and occasionally flare into violent incidents, usually meaningless. An India-China border war could occur, but is unlikely. Today’s clashes are mostly taking place in eastern Ladakh, as with disputes in 2013-14. Minor incidents have also occurred in India’s northeast (Naku La, Sikkim). These may be unrelated, but they may also suggest a broad India-China border conflict is in the works (Map 1). Map 1India And China Often Fight Over Undefined Himalayan Border When Ice Melts
The China-India Skirmish: Buy India On Weakness
The China-India Skirmish: Buy India On Weakness
There is always a local spark for clashes along the Line of Actual Control. These tend to be triggered by infrastructure construction or military patrols that cross the countries’ various border claims. Typically China triggers the incident as it is always pouring more money and concrete into new structures to solidify its territorial claims, whereas India’s resources are more limited. However, in recent years India has grown more capable. Both sides may also be surging infrastructure spending amid the recession (Chart 2). Chart 2China No Longer Alone In Nation-Building In Himalayas
China No Longer Alone In Nation-Building In Himalayas
China No Longer Alone In Nation-Building In Himalayas
Chart 3China's Slower Growth Jeopardizes Communist Party Legitimacy
China's Slower Growth Jeopardizes Communist Party Legitimacy
China's Slower Growth Jeopardizes Communist Party Legitimacy
In the current dispute both sides claim the other broke the peace. Indian builders supposedly violated China’s space while working on the Darbuk-Shayok-DBO road which connects to an airfield near Galwan Valley, the site of the clash. But the Indian side argues that Chinese military forces have ventured several miles from their usual outposts and amassed major forces on their side suggesting they are preparing for a bigger effort to expand their control of territory. 2 We may never know who “started” it. There is no clear border and even the Line of Actual Control is hard to define.3 Investors should not confuse the proximate cause of this conflict for the underlying cause. There are structural and cyclical factors at work on both sides: 1. China’s declining domestic stability and rising international assertiveness. The crises of 2008, 2015, 2018-19, and 2020 have caused a hard break in China’s economic model. Slower trend growth jeopardizes the Communist Party’s long-term monopoly on power (Chart 3). The Xi Jinping administration has responded to each crisis by tightening the party’s grip and reasserting central Beijing control. This is true at home, in peripheral territories like Xinjiang and Hong Kong, and abroad, as in the South China Sea and the Belt and Road Initiative. Territorial disputes have flared up across China’s borders. India is no exception, with incidents in 2013, 2014, 2017, and now 2020 marking the change (Table 1). Table 1China’s Territorial Assertiveness Triggers Clashes With India
The China-India Skirmish: Buy India On Weakness
The China-India Skirmish: Buy India On Weakness
The China-Pakistan Economic Corridor strengthens the alliance between these two countries and deepens India’s insecurities. India perceives China’s Belt and Road Initiative as a threat of economic and eventually military encirclement. In 2017, the Doklam dispute between China, Bhutan, and India – which lasted over two months – served to distract the Chinese populace from a major increase in US pressure on China’s periphery. That was President Trump’s “fire and fury” campaign to intimidate North Korea into entering nuclear negotiations (Chart 4). In 2020, China faces its first recessionary environment since the mid-1970s as well as rocky relations with the United States over trade, technology, Hong Kong, North Korea again, and possibly even the Taiwan Strait. It is a convenient time to turn the public’s attention to the Himalayas. Chart 4China's Last Dispute With India Occurred During US-North Korea Tensions
China's Last Dispute With India Occurred During US-North Korea Tensions
China's Last Dispute With India Occurred During US-North Korea Tensions
2. India’s emerging national consensus and international coming-of-age. India’s rise as a global power has accelerated since the Great Recession, especially after oil prices fell in 2014. Prime Minister Modi has won two smashing general elections with single-party majorities, in 2014 and 2019. His movement also maintains the upper hand in state legislatures, which is important given that India’s weak federal government cannot simply force structural reforms onto the country (Map 2). Modi’s electoral success reflects a deeper national consensus on the need for stronger central leadership, faster economic development, deeper international trade and investment ties, and pro-efficiency reforms such as the creation of a single market. The policy retreat from globalization benefits insular and service-oriented economies like India at the expense of mercantilist trading powers such as China. America’s pivot to Asia and “Indo-Pacific” strategy create a chance for India to attract investment as multinational corporations diversify away from China (Chart 5). Map 2Modi’s Political Capital At State-Level
The China-India Skirmish: Buy India On Weakness
The China-India Skirmish: Buy India On Weakness
Chart 5India Attracts Investment As Supply Chains Diversify From China
The China-India Skirmish: Buy India On Weakness
The China-India Skirmish: Buy India On Weakness
Chart 6US And India Fiscal Stimulus Enable Supply Chain Shift Out Of China
The China-India Skirmish: Buy India On Weakness
The China-India Skirmish: Buy India On Weakness
In August 2019, after Modi’s big election victory, he launched an ambitious agenda of state-building. He converted the autonomous region of Jammu and Kashmir into two union territories under New Delhi: Jammu and Kashmir, and Ladakh. This change of status quo angered China and Pakistan, which felt their own territory threatened. Chinese territorial pressure could be retribution for these administrative reforms. China and Pakistan will also want to undermine Modi’s party in upcoming elections for the state assembly of Jammu and Kashmir. China’s territorial encroachments reflect its desire to gain control of the entire Aksai Chin plateau. India does not want China to gain such a strategic advantage at the head of the Indus River and valley. The global pandemic and recession reinforced these structural and cyclical trends by pushing both India and China to use nationalist devices to divert their populations from domestic ills. The use of fiscal stimulus across the world enables leaders to pursue risky strategic policies (Chart 6). There is also a tactical issue: India took over the chairmanship of the World Health Assembly in May, while the US is lobbying on behalf of Taiwan’s long desire to be represented in the World Health Organization in the wake of COVID-19. China is resisting this call and could be using Ladakh as a pressure tactic.4 How Far Will Sino-Indian Conflict Escalate? Reports suggest that India and China have reinforced troops in and near Ladakh and have brought more firepower and airpower into range.5 Some of this activity, on both sides, consists of seasonal military drills. So it is not certain that a build-up is occurring. China is less constrained and more capable of escalation than India. If China continues pressing its territorial advance, or if India tries to reclaim territory or take other territory in compensation, then the fight will expand. The conflict is taking place in rocky recesses at a far remove from the rest of the world, so there is a temptation to believe that any escalation can be controlled.6 This may be false and lead to tit-for-tat escalation. Table 2Military Balance: India Versus China In Himalayas
The China-India Skirmish: Buy India On Weakness
The China-India Skirmish: Buy India On Weakness
Which side faces greater constraints? China is least constrained and most capable of escalation. Over the short run, China can utilize improved military command and capabilities in the area and can control the media and political response at home. Besting India would demonstrate that all Asian territorial claimants should defer to China. However, over the long run, aggression would cement the balance-of-power alliance between the US and India. India is more constrained than China, less capable of escalation: Modi has considerable political capital, but his conventional military advantage in this area is eroding and China has the higher ground from which to stage attacks (Table 2). India’s loss in the 1962 Himalayan war with China was a national humiliation. A repeat of such an event could destroy much of Modi’s mystique as a strongman leader and national savior. In the worst-case scenario, China would demonstrate superior military capability while the US and its allies would remain utterly aloof, leaving India looking both weak and isolated. Therefore India will engage in tit-for-tat military response while seeking diplomatic de-escalation. The US lacks interest in the dispute: Trump has already offered to mediate, presumably to demonstrate his deal-making skills again before the election. But the US does not have a compelling interest in this dispute and India does not want US mediation. If Trump takes punitive measures against China it will be for other reasons. Serious punitive measures require the stock market and economy to relapse, since at the moment Trump’s average approval rating is 43% and he hopes financial and economic gains will help him recover (Diagram 1). Diagram 1Odds President Trump Will Hike Tariffs On China Before US Election
The China-India Skirmish: Buy India On Weakness
The China-India Skirmish: Buy India On Weakness
The above points suggest that China can afford to escalate if it wants to show India and the rest of Asia that the US is toothless and that China’s territorial claims in Asia should not be opposed. Since COVID-19, China has been aggressive in the South China Sea and Taiwan Strait, despite the fact that these areas bring economic risks. The Himalayas do not. The implication is that China’s risk appetite is large, particularly in territorial disputes, and driven by social and economic pressure at home. Investment Takeaways Because India and China (and Pakistan) have nuclear arms, and because the US could get involved, it is possible that a major escalation could occur and cause volatility in global financial markets. But it would not last long and no parties will use nuclear arms over Himalayan territorial disputes. A major conflict that results in a Chinese victory would subtract from Prime Minister Modi’s political capital and hence weigh on Indian equities, which have broken down badly since COVID-19 (Chart 7). The reason is that strong political support for Modi would enable India to continue making structural economic reforms that increase productivity. Chart 7Indian Equities Underperforming Since COVID-19
Indian Equities Underperforming Since COVID-19
Indian Equities Underperforming Since COVID-19
Chart 8India’s Path To Regional Primacy Lies Through Economic Opening And Reform
The China-India Skirmish: Buy India On Weakness
The China-India Skirmish: Buy India On Weakness
In the long run, a major conflict, especially a humiliating defeat, would accelerate India’s attempts to improve national economic prowess for the sake of strategic security. Since India cannot achieve its strategic objective of primacy in South Asia merely through military power, it will need to do so through a stronger economic pull (Chart 8). This is an impetus for structural economic reform even beyond Modi. Hence our secularly bullish outlook on India. Indian pharmaceutical equities offer an investment opportunity (Chart 9). In an attempt to address land acquisition, which is one of the biggest constraints faced by companies looking to invest in India, New Delhi has announced that it is developing an area the size of Luxembourg to attract businesses moving out of China. The government reached out to over 1,000 US companies in April with incentives for them to move their facilities to India, with a focus on industries in which India has a comparative advantage, such as medical equipment suppliers, food processing units, textiles, leather, and auto part makers. Chart 9US And Indian Stimulus Policies Will Boost Investment In Indian Pharma
US And Indian Stimulus Policies Will Boost Investment In Indian Pharma
US And Indian Stimulus Policies Will Boost Investment In Indian Pharma
While India is not as economically competitive as China, it could be attractive for non-strategic industries that would not want to relocate to the US but are looking to reduce uncertainty from US-China tensions. The next round of US fiscal stimulus is also likely to contain significant provisions that will incentivize companies to relocate from China, particularly in the medical and health care sector. For global investors, while a major Sino-Indian escalation could lead to short-term volatility, it would ultimately be a positive development if Beijing vented its nationalism on a strip of earth that is not globally relevant, rather than on the seas, which are highly relevant. Conflict between the US and China in East Asia is a far greater risk than Sino-Indian conflict. Indeed Chinese and American actions over the Taiwan Strait, North Korea, or the South and East China Seas are still far more likely than Sino-Indian tensions to affect global trade and stability and financial markets this year. The US could impose sanctions on Chinese tech and trade, a military incident could occur in the Taiwan Strait, North Korea could provoke US President Donald Trump into a new round of “fire and fury” that triggers a showdown with China, or the US and China could fight a naval skirmish in the South or East China Sea. None of these options is low probability, especially surrounding the US election. Over the short run, global investors should prepare for greater equity volatility, primarily because of hiccups in delivering new stimulus in the US, EU, and China, plus US domestic political risks and US-China-Asia strategic tensions. Stay long JPY-USD. Over the long run, a global growth rebound driven by massive global fiscal and monetary stimulus will drive the US dollar to weaken, global equities to outperform bonds, and cyclicals to outperform defensives. We remain long China-sensitive plays as well as infrastructure, cyber-security, and defense stocks. Strategically, go long Indian pharmaceuticals relative to the emerging market benchmark. Matt Gertken Vice President Geopolitical Strategist mattg@bcaresearch.com Footnotes 1 The Guardian, "Soldiers fell to their deaths as India and China’s troops fought with rocks," June 17, 2020. 2 See Ashley J. Tellis, "Hustling in the Himalayas: The Sino-Indian Border Confrontation," Carnegie Endowment for International Peace, June 4, 2020. See also Mohan Guruswamy, "India-China Border Dispute: Is A Give And Take Possible Now?" South Asia Monitor, June 3, 2020. 3 The Treaty of Tingmosgang (1684) only specifies one checkpost, at the Lhari Stream near Demchok, leaving everything else to disputed Indian and Chinese claims. See Alexander Davis and Ruth Gamble, "The local cost of rising India-China tensions," June 1, 2020. 4 See Nayanima Basu, "India Isn’t Worried About Tension With China, Unlikely To Give In To US Pressure On Taiwan," May 13, 2020. 5 See Ren Feng and He Penglei, "PLA Xizang Military Command holds coordinated exercise in plateau region," China Military Online, June 15, 2020. See also "空降兵某旅积极探索远程兵力投送新模式 空地同步 奔赴高原". 6 The reason escalation is normally limited is because of the extreme difficulty of operating extended military operations and resupply at 13,000-feet altitude. Both sides have the ability to surge reinforcements and equalize the contest. The cost and difficulty of retaking lost territory is often prohibitive. And while India’s conventional military power may overbalance China in this region, China has the uphill advantage and has made leaps and bounds in operational capabilities in recent decades. In short, escalation is normally controllable. See Aidan Milliff, "Tension High, Altitude Higher: Logistical And Physiological Constraints On The Indo-Chinese Border," War On The Rocks, June 8, 2020.
Highlights Our recalibrated model suggests that, if President Trump places a 25% tariff on all Chinese goods exports to the US, then the RMB should fall by 4% against the dollar from its current value. The RMB has been trending below its “fair value” in the past two years, but as US-China tensions escalate, the PBoC will likely allow the market forces to push the RMB lower. We continue to hold a long position in the USD-CNH, but recommend investors keep the position on a short leash. The key risk to this view is a broad-based dollar weakness. So far, the yuan has been resilient against a dramatic drop in the DXY. The more that the RMB deviates from its fair value, the more rapidly and strongly it could appreciate in the absence of further tariff hikes. Feature The strong probability of a re-ignited US-China trade war this year will place the RMB under downward pressure against the USD.1 Unlike in 2019 when China was trying to reconcile with the US to reach a trade deal, this year President Trump will encounter a much less compromising President Xi Jinping. Therefore, it is more likely that Beijing will use depreciation as a countervailing tool on, and even ahead of any additional tariffs on Chinese goods exports to the US. The RMB would likely fall by 4% if the US was to boost import tariffs to 25% on all Chinese goods. We recalibrated our Equilibrium Exchange Rate Model to project the tactical (0-3 months) fluctuations in the RMB against the dollar, in different scenarios of tariff hikes. If President Trump is to raise the tariff rate to 25% on all US imports of Chinese goods, the RMB should fall by 4% against the dollar from its current value. On a cyclical time horizon (the next 12 months), however, the RMB will likely rebound. The RMB has been trending below its fair value against the dollar since the onset of the trade war in mid-2018, but the economic fundamentals that supported the dollar’s strength in the last two years have diminished. Even if a second wave of the Covid-19 pandemic materializes, but does not result in severe lockdown measures, the dollar as a countercyclical currency will be pushed lower as global growth continues to recover. The combination of a stronger global economy and weaker dollar should help strengthen pro-cyclical currencies, such as the RMB. A Recalibrated Model Based On The Economics Of Tariffs If the US were to impose further tariffs on Chinese exports, how much will the RMB fall against the dollar? According to our recalibrated Equilibrium Exchange Rate Model, if the US was to boost import tariffs to 25% on all Chinese goods tomorrow, then the RMB would likely fall by 4% to around 7.35 against the dollar2 (Chart 1A and 1B). That said, currency markets tend to undershoot, and market forces will likely push the RMB lower on the prospect of further escalation. More importantly, the PBoC will be less likely to lean against this weakness, since the lower in the exchange rate will buffet exports. Chart 1AUSDCNY Under Tariff Rate Hike Scenarios
USDCNY Under Tariff Rate Hike Scenarios
USDCNY Under Tariff Rate Hike Scenarios
Chart 1BA Tariff Timeline The Evolution Of The US-China Trade War
A Tariff Timeline The Evolution Of The US-China Trade War
A Tariff Timeline The Evolution Of The US-China Trade War
Tariff hikes typically catalyze an adjustment between two countries: either in the exchange rate to realign price competitiveness, in the quantity of tradeable goods, or a combination of the two. Chinese goods exports to the US have only modestly decreased in the past two years from the pre-trade war year of 2017. Given that global trade has been mostly slowing since then, it signifies that the adjustment has largely occurred through the exchange rate (Chart 2). For a perfectly open economy, standard economic theory suggests that the exchange rate should move by the same percentage as the tariff increase to allow markets to clear. However, both the US and China do not have perfectly open economies. This suggests that the currency adjustment needed should be smaller.3 For example, as of 2019 only 16.7% of Chinese exports go to the US. A 25% tariff on all of these exports will lift overall export prices by only 4.2% (16.7*25%). This does not even take into consideration export substitution, and/or other factors that will influence tradeable prices. Chart 2Chinese Exports To The US Did Not Drop Much...
Chinese Exports To The US Did Not Drop Much...
Chinese Exports To The US Did Not Drop Much...
Chart 3...Mainly Because China "Paid For" The Tariffs By Depreciating Its Currency
...Mainly Because China "Paid For" The Tariffs By Depreciating Its Currency
...Mainly Because China "Paid For" The Tariffs By Depreciating Its Currency
Therefore, we recalibrated our model to reflect the assumed increases in both Chinese export prices and US import prices, rather than the pure increase in the US tariff rates. We also assumed that China will bear the brunt of the costs from the tariff hikes, which appears to have been the case in the past two years (Chart 3). The projections for where the USD/CNY rate is likely to settle in the next 0-3 months have closely tracked movements in the currency since July 2018. A Cyclical View On The RMB The RMB has depreciated by about 12% versus the dollar from its peak in April 2018, a non-trivial move for a currency that has been tightly managed. Rapid depreciations in the past two years have changed the valuation perspective of the RMB. Compared with our fair value estimates, the RMB has been undervalued in both real effective exchange rate terms and against the dollar. Chart 4The RMB Is Undervalued In Real Effective Terms...
The RMB Is Undervalued In Real Effective Terms...
The RMB Is Undervalued In Real Effective Terms...
Our revamped Equilibrium Exchange Rate Model concludes that existing tariff rates should have the USD-CNY settle at around 6.98. Currently, USDCNY is close to 7.1, suggesting that the market has been pricing in the risk of the US raising tariffs on China. This means in the absence of further tariff hikes, the RMB will rebound and revert towards its fair value. Moreover, the RMB in real effective exchange rate terms has been undervalued compared with our fair value estimate, which is based on China's relative productivity trends and real bond yield differentials (Chart 4). With a 10-year bond in China yielding 2.8%, versus 0.7% in the US, interest rate differentials are likely to continue to structurally favor the RMB. Against the dollar, the RMB is also undervalued based on our relative purchasing power parity (PPP) models (Chart 5). Our PPP models make two crucial adjustments for an apples-to-apples comparison. First, the CPI baskets are broken into five subcomponents including food, shelter, health, transportation and household goods. Second, we run two regressions, one using the relative price ratios of the five subgroups (regression 1), and another using an aggregated price index weighted symmetrically across both the US and China (regression 2).4 Chart 5...And Against The Dollar
...And Against The Dollar
...And Against The Dollar
Chart 6The PBoC Is Taking A More "Laissez-Faire" Approach Towards The RMB Depreciation
The PBoC Is Taking A More "Laissez-Faire" Approach Towards The RMB Depreciation
The PBoC Is Taking A More "Laissez-Faire" Approach Towards The RMB Depreciation
It is true that valuation rarely matters in the near term and the market almost always over- or under-shoots from its "fair value" levels. The strength in the USD since early 2018 has also played a dominant role in the RMB’s depreciation. However, the RMB’s spot exchange rate has deviated from its fundamental equilibrium in the past two years. In contrast with the previous cycle, the PBoC does not appear to have intervened heavily in the offshore market to prevent excessive currency weakness. For example, in 2015/2016, the PBoC heavily clamped down on outflows. Offshore HIBOR rates also spiked, which is widely viewed as the PBoC's attempt to maintain exchange rate stability and to punish speculators by dramatically squeezing RMB liquidity in the offshore market. This time around, the PBoC is taking a more “laissez-faire” approach even though the RMB is weaker than back then (Chart 6). The key message is that longer-term investors should use RMB weakness to accumulate long positions, as any tariff-related weakness will cheapen an already attractive currency. Investment Conclusions In the near-term, a flare-up in the US-China trade war could trigger investors’ risk-off sentiment and economic fundamentals could be temporarily put aside. We continue to recommend a long position in the USD-CNH. Nevertheless, the more that the RMB deviates from its fair value, the more rapidly and strongly it will reverse to its fundamental equilibrium when tensions ease between the nations. The sharp reversal in the USD-CNY spot rate in the past three weeks illustrates this view (Chart 7). Thus, we recommend investors keep the long USD-CNH position on a short leash. Chart 7CNY/USD Below Its Long-Term Trend
CNY/USD Below Its Long-Term Trend
CNY/USD Below Its Long-Term Trend
Chart 8US Money Supply Growth Way Outpaces China
US Money Supply Growth Way Outpaces China
US Money Supply Growth Way Outpaces China
The economic fundamentals that have supported the dollar over the past two years are evaporating. The large overhang of China’s local currency money supply may exert structural downward pressure on the RMB exchange rate.5 However, money supply in the US has grown exponentially since the onset of the pandemic and has outpaced that of China (Chart 8). Interest rate differentials between the US and China will likely widen as well. Last week’s FOMC meeting made it clear that the Fed does not intend to raise rates through 2022. In contrast, the PBoC has a track record of normalizing monetary conditions about nine months after a trough in China’s nominal GDP growth (Chart 9). Chart 9The 'Old Faithful' PBoC Policy Normalization Pattern
The 'Old Faithful' PBoC Policy Normalization Pattern
The 'Old Faithful' PBoC Policy Normalization Pattern
There is mounting evidence that the dollar is entering a new down cycle. Aside from the Fed’s dovish stance, there is mounting evidence that the dollar is entering a new down cycle. Typically, the dollar tends to run in long cycles, of about 10-years, with bear markets defined by rising twin deficits in the US. The reason is that as the Treasury issues more and more debt to finance spending, investors usually require a cheaper exchange rate to keep funding these deficits (Chart 10). Chart 10The Dollar And Cycles
The Dollar And Cycles
The Dollar And Cycles
Chart 11USD A Counter-Cyclical Currency
USD A Counter-Cyclical Currency
USD A Counter-Cyclical Currency
As such, in the next 12 months, barring a second wave of the pandemic that triggers severe lockdown measures, the dollar as a countercyclical currency will be pushed lower as global growth rebounds. This should help strengthen the RMB, given the USD/CNY rate tends to move with the dollar over cyclical periods (Chart 11). Jing Sima China Strategist jings@bcaresearch.com Chester Ntonifor Foreign Exchange Strategist chestern@bcaresearch.com Footnotes 1We assign a 40% probability that the US will revert to tariffs on China within the year. Please see China Investment Strategy Special Report "Watch Out For A Second Wave (Of US-China Frictions)," dated June 10, 2020, available at cis.bcaresearch.com 2As of June 15, 2020, USDCNY exchange rate is at 7.09. 3Please see Foreign Exchange Strategy Weekly Report "USD/CNY And Market Turbulence," dated August 9, 2019, available at fes.bcaresearch.com 4Please see Foreign Exchange Strategy Special Report "A Fresh Look At Purchasing Power Parity," dated August 23, 2019, available at fes.bcaresearch.com 5At around $3 trillion, China’s central bank foreign exchange reserves are equivalent to only 14% of all yuan deposits, and 11% of broad money supply Cyclical Investment Stance Equity Sector Recommendations
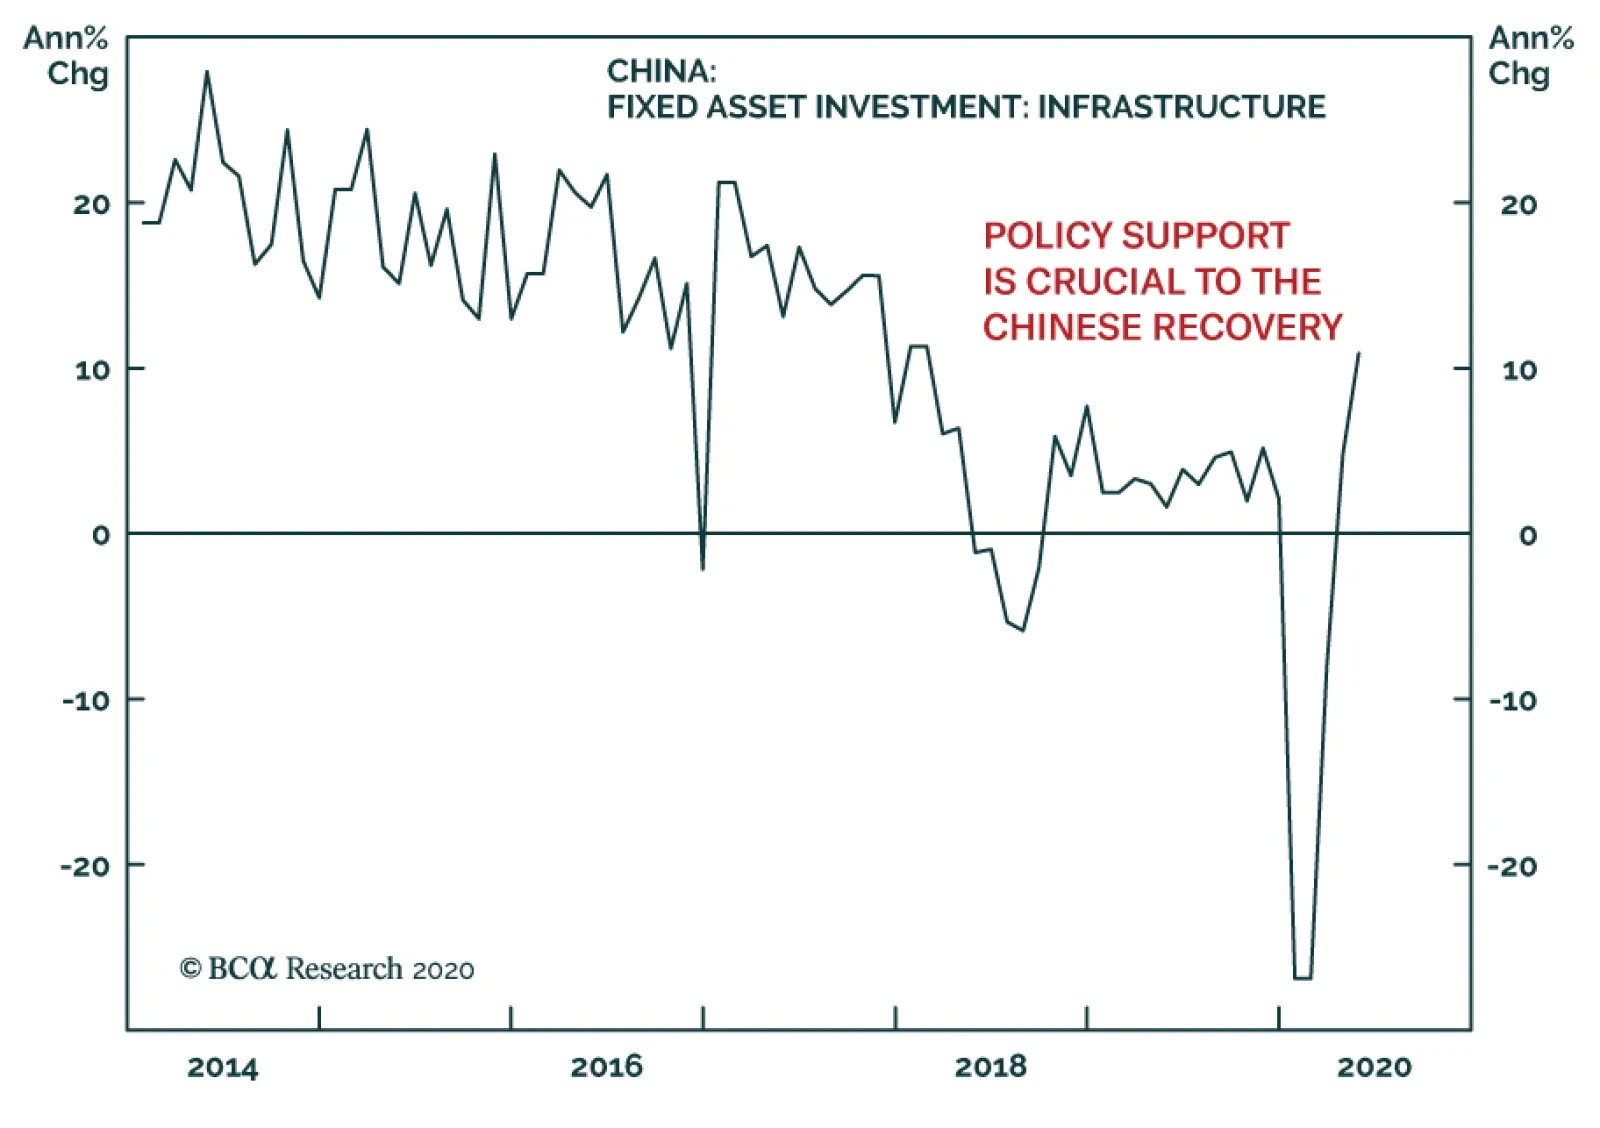
China’s recovery continues to carry the mark of government policy. In May, industrial production grew 4.4% on an annual basis. Retail sales are still contracting relative to last year but they are improving on a sequential basis. As a result, their annual…
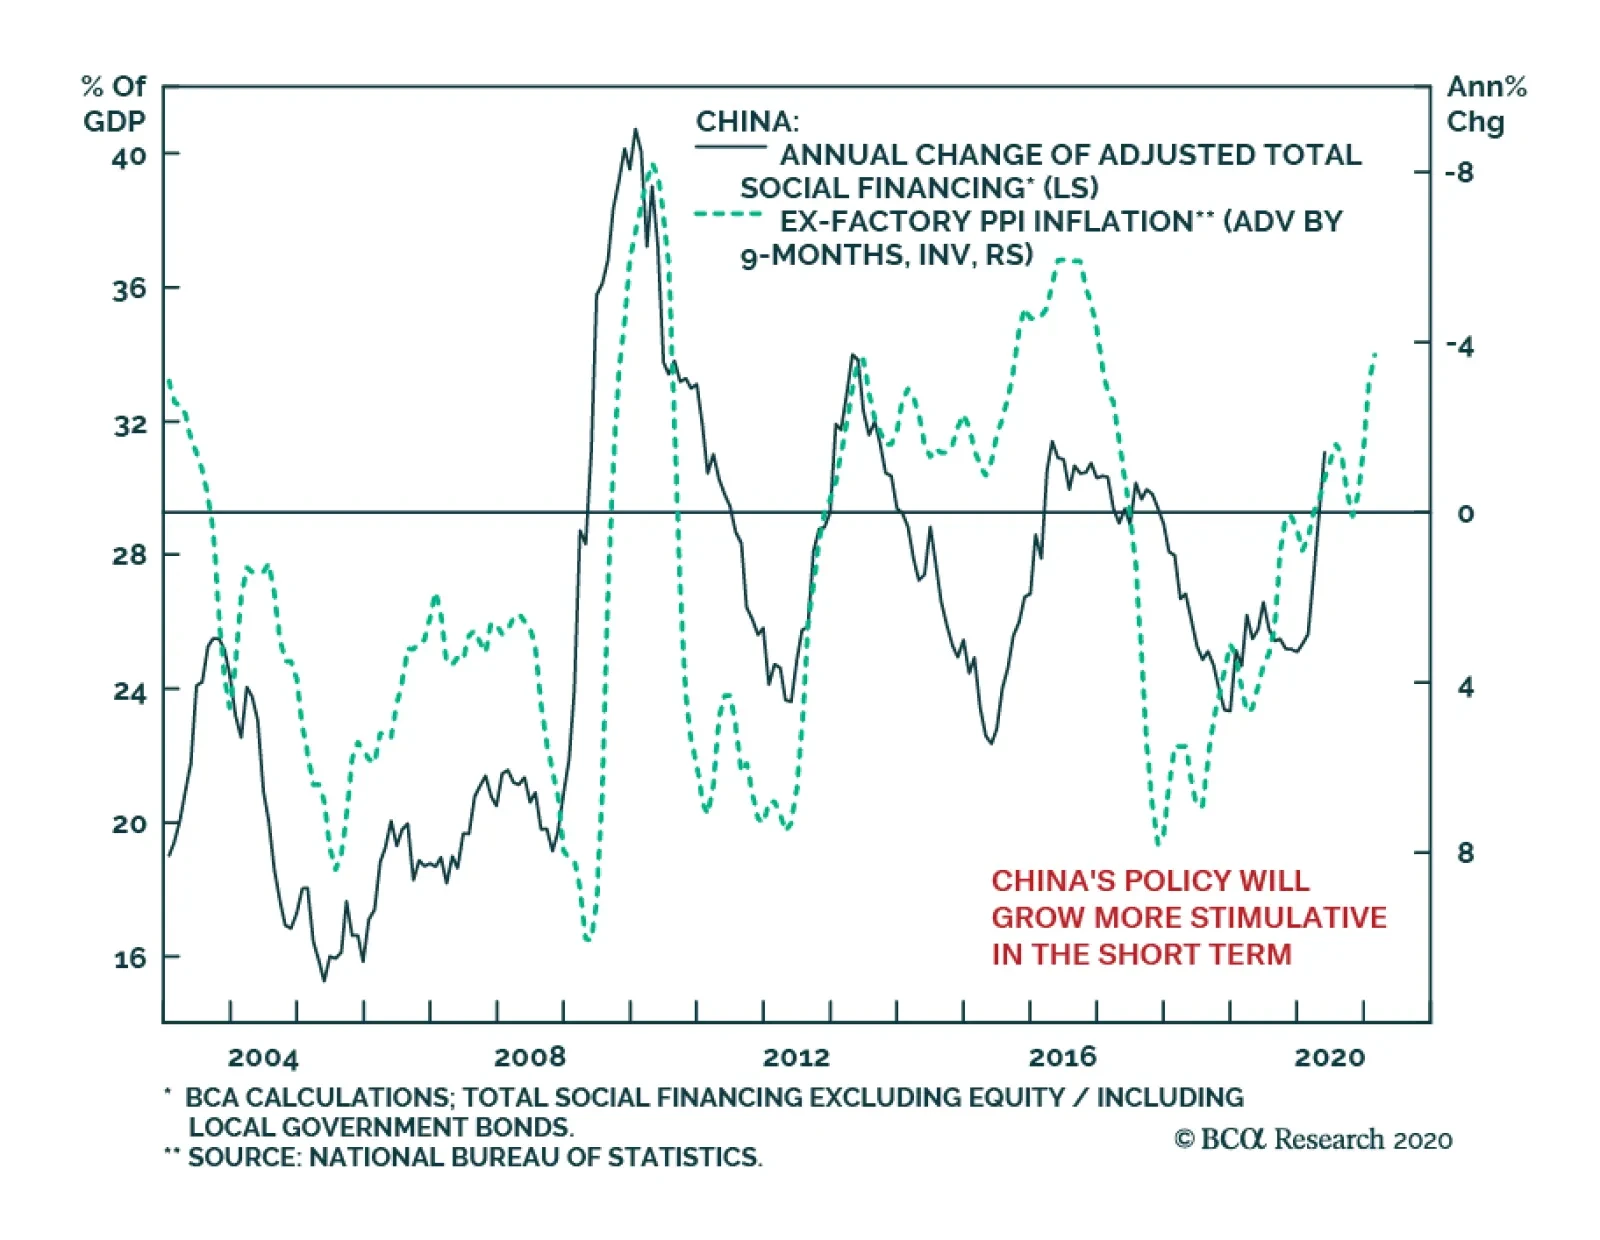
China’s total social financing flows remain strong. In May, TSF rose to CNY3.19 trillion from CNY3.09 trillion in April, even as new loans slowed from CNY1.70 trillion to CNY 1.58 trillion. Moreover, local governments issued CNY1.3 trillion of bonds this…
Highlights The economic and health crises since Q1 2020 have accelerated the breakdown in the US-China relationship. Although the US is in a much weaker economic position this year than in 2019, President Trump may have fewer political constraints to an escalation in the trade war. President Xi Jinping is fueling provocations with the US, adding instability and unpredictability to the geopolitical equation. The Phase One trade deal may be collapsing. We recommend a defensive stance on Chinese risk assets and the RMB during the summer. Feature The outbreak of COVID-19 this year has sparked the worst economic contraction in China and the US in decades. Economic calamities and social unrest should have tied the hands of leaders in both countries. However, as our Geopolitical Strategist Matt Gertken reminds us, this is an atypical election year in the US and some constraints that previously deterred both sides from taking aggressive actions may be diminishing.1 We agree that the economic and health crises have likely accelerated the possibility of a breakdown in the relationship between the US and China. The risk will likely reach a new height in the summer, when pressure on Trump’s election campaign intensifies leading up to the vote in November. While there is a growing bipartisan hawkish view on China in Washington, China is also playing a part in fanning the flames. The USD/CNY exchange rate will be extremely volatile during this episode of heightened geopolitical turbulence. We continue to hold a long USD-CNH position, with the expectation that the RMB will likely weaken further in the summer. Trump Facing Fewer Constraints Whether Trump’s chances of reelection increase through a strong recovery in the US stock market and economy, or decrease through an economic recession and/or weak public support, either scenario could remove constraints preventing Trump from confronting China. Trump’s current priority may be to secure a recovery in the equity market and improve his polling, which will require economic improvement. Ironically, the US stock market has been on fire despite the battered real economy. The S&P 500 Index has gone up by 44% since its trough on March 23, nearly erasing its losses for the year. The higher the market rises, the more Trump may believe that the market can sustain a shock even if he resorts to imposing tariffs on Chinese export goods - particularly if his approval rating does not rise along with the market. The market’s reaction in 2018 and 2019 provides a good example of how the US financial markets shrugged off any negative impact from a trade war between the US and China (Chart 1). If the pandemic prevents the US economy from fully reopening and/or recovering in the summer, then an equity market correction could send a negative signal about Trump’s reelection prospects. In this case, Trump may not be as enslaved by financial constraints as he would have been if the economy was in an expansionary state. A falling approval rating, coupled with domestic social unrest, would make Trump a “lame duck” President (Chart 2). Therefore, he may try to divert attention away from the economy and adopt an aggressive foreign and trade policy. China is already perceived negatively by a majority of American voters and certain political communities, thus there could be a political upside for Trump to escalate his confrontation with China. Chart 1US Stocks Kept Reaching New Highs In 2019 Despite An Ongoing Trade War
US Stocks Kept Reaching New Highs In 2019 Despite An Ongoing Trade War
US Stocks Kept Reaching New Highs In 2019 Despite An Ongoing Trade War
Chart 2Trump’s Polling Drops Below Average
Watch Out For A Second Wave (Of US-China Frictions)
Watch Out For A Second Wave (Of US-China Frictions)
All bets are off if Trump’s approval rating continues to trend downwards, regardless of whether the US equity market continues to rally and/or if the US economy is mired in recession. Our Geopolitical Strategy illustrates the scenarios as follows (Diagram 1). If Trump’s approval rating is high and the market is up, then Trump is “winning” and the only risk of a tariff hike would come from overconfidence or Chinese provocation. If his approval is up but the market falls, then he may become more inclined to use tariffs. If his approval rating is low but the market is up, then he has ammunition to get tougher on China. If his approval and the market are collapsing, then he is a “lame duck president” and all bets are off. Combined, these scenarios imply there is a 59% probability that Trump refrains from large tariffs, and a 41% chance that he reverts to large tariffs. Diagram 1Odds President Trump Will Hike Tariffs On China Before US Election
Watch Out For A Second Wave (Of US-China Frictions)
Watch Out For A Second Wave (Of US-China Frictions)
Bottom Line: All bets are off if Trump’s approval rating continues to trend downwards, regardless of whether the US equity market continues to rally and/or if the US economy is mired in recession. Both scenarios would remove financial and economic constraints that Trump faced in 2019. If Trump's polling is weak, he may spend financial ammunition to shore up his “America First” credentials. Adding China To The Geopolitical Instability Equation China itself may be an independent source of geopolitical instability and unpredictability. While President Xi Jinping does not have any electoral constraints, he needs to restore the confidence of Chinese people in the wake of the worst public health crisis and economic performance in decades. Like Trump, the pandemic gives President Xi an incentive to distract his populace from domestic crises by adopting hawkish foreign policies. This hawkish approach was demonstrated when a new Hong Kong SAR national security law was proposed and approved at this year’s National People’s Congress (NPC). The new law would give Beijing greater direct control over Hong Kong, in contravention of its promise of 50 years of substantial autonomy enshrined in the Sino-British Joint Declaration of 1984. China’s foreign policy tone recently shifted to a more combative one. This “wolf warrior diplomacy" has gained popularity among Chinese diplomats.2 During a news conference at this year’s NPC, China’s Foreign Minister Wang Yi defended the “wolf warrior diplomacy” by stating that the country will stand firm in defending its national interest and combating “smears.” Chart 3Chinese Imports Of American Goods Are Falling Far Short Of The Target Set By The Trade Deal
Chinese Imports Of American Goods Are Falling Far Short Of The Target Set By The Trade Deal
Chinese Imports Of American Goods Are Falling Far Short Of The Target Set By The Trade Deal
The response from the Trump administration has been lukewarm. While Secretary of State Mike Pompeo will strip Hong Kong of its autonomous status, President Trump is taking limited sanctions on mainland China and eschewing more drastic punitive measures. China may see the timid response as a sign that Trump is reluctant to take action on China and tip the bilateral relationship into an outright confrontation. This perception is, in itself, a risk that may lead to more provocation on both sides. Lastly, the Phase One trade deal is tenuous. US Trade Representative Robert Lighthizer last week stated that "China has done a pretty good job" at meeting its trade-deal quotas,3 but we have long argued China was never going to honor the commitment to its full extent.4 The latest data shows that Chinese purchases of American exports in the first four months of 2020, from manufacturing goods to agricultural produce and energy, have fallen far short of the huge expansion agreed in the deal (Chart 3). The recent depreciation in the RMB may be another sign that China is abandoning the Phase One trade deal.5 Weakness in economic fundamentals and renewed tensions between the US and China may have contributed to the RMB’s recent depreciation. However, the decline was reinforced by the PBoC’s move to set the CNY/USD fixing rate to its lowest point since 2008 (Chart 4). Given that the RMB has become an anchor for emerging market currencies, a rapid drop in the RMB would lead to selloffs in emerging Asian and Latin American currencies and, in turn, would strengthen the USD (Chart 5). The Trump administration may see a swift RMB depreciation as China is deliberately violating the Phase One trade deal, which will prompt Trump to seek retaliatory actions against China. Chinese purchases of American goods in the first four months of 2020 have fallen far short of the Phase One trade agreement. Chart 4Is The PBoC Sending A Warning Signal To Trump?
Is The PBoC Sending A Warning Signal To Trump?
Is The PBoC Sending A Warning Signal To Trump?
Chart 5The RMB Has Been The Anchor Currency In EM
The RMB Has Been The Anchor Currency In EM
The RMB Has Been The Anchor Currency In EM
Bottom Line: While China is prioritizing its own economic recovery, its foreign policy stance has decisively swung to a more combative one. Additionally, the Phase One trade deal is on the verge of collapsing. Investment Conclusions The USD/CNY exchange rate will likely be extremely volatile in the next quarter amid heightened geopolitical turbulence, with more downside risks to the RMB. As such, we continue to recommend that investors hedge their RMB exposure in Chinese stocks by holding a long USD-CNH position. We remain neutral on Chinese stocks in relative terms in view of the non-trivial, near-term vulnerability of risk assets. As in 2019, investable stocks are particularly exposed to an escalation in the US-China conflict (Chart 6). Chart 6Large Divergence In Onshore Versus Offshore Stock Performance During The Trade War
Large Divergence In Onshore Versus Offshore Stock Performance During The Trade War
Large Divergence In Onshore Versus Offshore Stock Performance During The Trade War
Chart 7Stocks In Some Domestic Demand-Oriented Sectors Are Still Relatively Safe Bets
Stocks In Some Domestic Demand-Oriented Sectors Are Still Relatively Safe Bets
Stocks In Some Domestic Demand-Oriented Sectors Are Still Relatively Safe Bets
Price corrections in both China’s onshore and offshore aggregate equity markets are likely to occur during the summer. Nevertheless, cyclical plays that closely track Chinese stimulus are relatively safe bets, especially for China’s domestic investors and in absolute terms (Chart 7). Jing Sima China Strategist jings@bcaresearch.com Footnotes 1Please see Geopolitical Strategy Weekly Report "Spheres Of Influence (GeoRisk Update)," dated May 29, 2020, available at gps.bcaresearch.com 2South China Morning Post, “Chinese Foreign Minister Wang Yi defends ‘wolf warrior’ diplomats for standing up to ‘smears’”, May 24, 2020 3Bloomberg, “Lighthizer Says He Feels ‘Very Good’ About Phase One China Deal”, June 4, 2020 4Please see China Investment Strategy Weekly Report "Managing Expectations," dated January 22, 2020, available at cis.bcaresearch.com 5The Phase One trade deal prohibits both the US and China from manipulating exchange rates to devalue their currencies for competitive purposes. Cyclical Investment Stance Equity Sector Recommendations
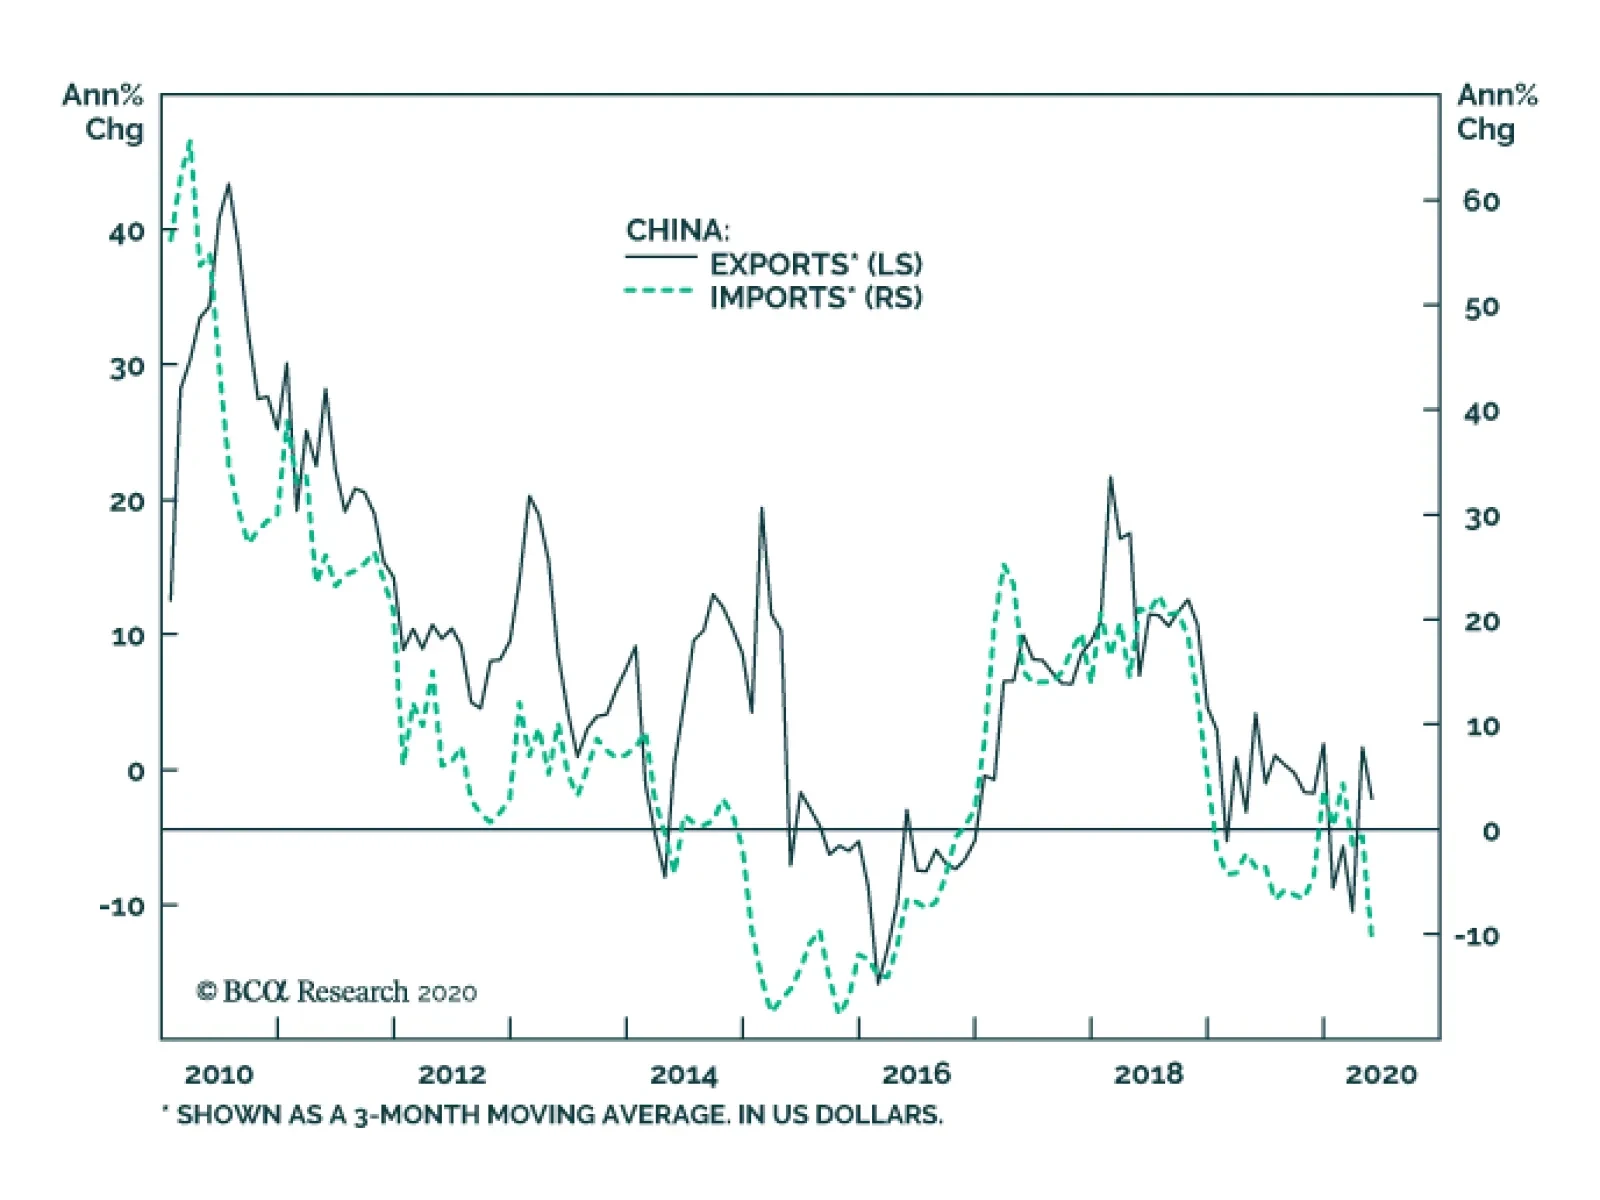
Chinese economic data continue to reflect the evolution of the global economy. In USD-term Chinese exports contracted 3.3% on a year-on-year basis and imports fell 16.7%. Chinese exports remain more resilient than feared. However, exports of medical…
Highlights Our base case reflects our view that China’s strong fiscal and monetary stimulus, combined with a weaker US dollar, will provide a favorable backdrop for copper markets in 2H20. Supply factors are for the most part reflected in current copper prices. In 2H20, the speed of the demand recovery will be the determining factor for prices. Global policy uncertainty remains high. Assessing the joint effects of global monetary and fiscal stimulus, along with consumers’ willingness to spend once lockdowns are lifted will keep uncertainty at relatively high levels. A possible second wave of COVID-19 returning large economies to lockdown status looms large for copper markets, and for commodity markets generally. The combination of safe-haven demand and a continued dollar shortage for borrowers without access to US swap lines could keep the dollar well bid, suppressing foreign flows to EM economies and commodity demand at the margin. Tactically, we remain on the sidelines until the fog clears around these known and unknown unknowns. A $3/lb COMEX refined copper price is likely in 2H20, but the risks to this outlook remain high. Feature Copper prices will end the year higher vs. current levels in our base case. But uncertainty remains elevated. Copper prices will end the year higher vs. current levels in our base case. But uncertainty remains elevated. Assessing the synchronicity of EM recoveries and the joint effects of global monetary and fiscal stimulus, along with consumers’ willingness to spend once lockdowns are lifted is extremely difficult. Looming over all of these considerations: A possible second wave of COVID-19 returning large economies to lockdown status loom large. Tactically, we remain on the sidelines as the fog clears around some of these known and unknown unknowns. Importantly, our positive view rests on our expectation of a robust recovery in China’s economic activity and, to a lesser extent, in its main export destinations, which were hit later by the pandemic. A weak recovery in China would slow the rate at which the current copper supply surplus subsides. At ~ $2.50/lb, copper prices have recovered significantly since bottoming in March at $2.11/lb on the COMEX. Still, clearing the $3.30/lb double top reached in June 2018 will require either a significant increase in global demand or a sharp contraction in supply, which we do not expect. Copper markets were severely hit by the global pandemic: Prices fell 10% in January, as the case count grew in China – the largest copper-consuming market – followed by another 19% decline as the virus spread globally (Chart of the Week). The intensification of lockdowns globally pushed copper markets to a 60k MT surplus as of March – the latest data reported by the World Bureau of Metal Statistics (WBMS) – from a 20k MT deficit in 2019. Bearish sentiment moved our Tactical Composite Indicator – which captures sentiment, positioning, and momentum dynamics – to oversold territories on in March (Chart 2). Chart of the WeekCopper Prices Were Severely Hit By The Pandemic
Speed Of Demand Recovery Remains Key To Copper Prices
Speed Of Demand Recovery Remains Key To Copper Prices
Chart 2Bearish Sentiment Crushes Copper Prices
Bearish Sentiment Crushes Copper Prices
Bearish Sentiment Crushes Copper Prices
After reaching a low of $2.11/lb on March 23, COMEX copper prices surged 18% with few interruptions as the Chinese economy reopened, and global monetary and fiscal authorities supplied unprecedented economic support (Chart 3). This prompted a wave of short-covering by money managers, releasing some of the downward pressure on prices (Chart 4). Chart 3Unprecedented Fiscal Response
Speed Of Demand Recovery Remains Key To Copper Prices
Speed Of Demand Recovery Remains Key To Copper Prices
Chart 4Money Managers Neutral For Now
Money Managers Neutral For Now
Money Managers Neutral For Now
Still, hedge funds have not yet entered bullish positions on the metal. And, importantly, inventory levels are not drawing sharply. China’s Economy Bottomed, World ex-China Still Contracting Our outlook hinges primarily on our assessment of China’s policy-driven copper demand – both from domestic usage perspective, and, to a lesser extent, from copper-intensive exported goods. Since the end of the Global Financial Crisis (GFC), copper prices have mostly shadowed China’s economic cycles (Chart 5). China’s importance for copper markets now dominates that of major DM countries (Chart 5, panel 3). The influence of global supply-demand fundamentals on copper prices has declined. Prices are increasingly policy-driven with supply adjusting to demand as dictated by Chinese policymakers’ decisions on the allocation of total social financing funds in that economy. Thus, our outlook hinges primarily on our assessment of China’s policy-driven copper demand – both from domestic usage perspective, and, to a lesser extent, from copper-intensive exported goods. According to the International Copper Study Group (ICSG), around 17% of Chinese copper demand comes from exports of products containing copper.1 In “normal” times, we rely heavily on our monthly indicators to gauge economic and commodity cycles. However, the speed with which the COVID-19 pandemic evolves – and the associated fiscal and monetary responses to it – makes short-term forecasting of cyclical commodities a perilous task. Chart 5DM Consumption Pales Vs. China
DM Consumption Pales Vs. China
DM Consumption Pales Vs. China
High-frequency data suggest Chinese economic growth bottomed in March and is rapidly recovering (Chart 6). Chart 6Chinese Economy Returning To Normal
Speed Of Demand Recovery Remains Key To Copper Prices
Speed Of Demand Recovery Remains Key To Copper Prices
Meanwhile in China’s major export destinations, the number of confirmed COVID-19 cases appear to be flattening, containment measures are gradually easing, and mobility is improving (Chart 7, panel 1 and 2). Globally, the copper- and oil-to-gold ratios have stabilized, and stock prices for nine of the largest copper producers have trended up since March 23 (Chart 7, panel 3 and 4). That said, we believe it is still too early to adopt a high-conviction view about a price recovery trajectory. For one, China recently reintroduced containment measures in certain regions, as clusters of coronavirus cases were detected, highlighting the fragility of the current recovery.2 Chart 7China's Major Export Partners Could Rebound Soon
China's Major Export Partners Could Rebound Soon
China's Major Export Partners Could Rebound Soon
Chart 8Strong Domestic Demand, Weak Export Growth
Strong Domestic Demand, Weak Export Growth
Strong Domestic Demand, Weak Export Growth
Moreover, the rebound in overall Chinese demand hasn’t fully offset the collapse in its exports. As a result, the reopening of the supply side of the economy outpaced demand growth (Chart 8). Extrapolating this to its copper market: Chinese refined copper production (40% share of world output) is facing robust domestic demand but weak export demand for copper (44% and 9% of world demand), leaving its market with a supply surplus. Nonetheless, absent a severe second wave of COVID-19 cases, the infrastructure-focused stimulus and market-friendly real estate policies in the country will allow internal demand to overtake production in 2H20, despite limited external demand (more on this below). China’s Credit Growth To Drive Copper Demand Higher The key message emerging from the NPC is that policymakers are willing to do whatever it takes – including abandoning their deleveraging objectives – to reflate the economy. Markets were unimpressed by the fiscal package announced during China’s National People’s Congress (NPC) last month, which, for the first time in decades, did not contain an annual economic growth target in the Government Work Report (Table 1). Even so, the key message emerging from the NPC is that policymakers are willing to do whatever it takes – including abandoning their deleveraging objectives – to reflate the economy. Broad money and total social financing growth will accelerate relative to last year and notably exceed nominal GDP growth. Our Emerging Markets strategists expect China’s fiscal and credit impulse will reach 15.5% this year (Chart 9).3 Table 1No Economic Growth Target In The Government Work Report
Speed Of Demand Recovery Remains Key To Copper Prices
Speed Of Demand Recovery Remains Key To Copper Prices
Additionally, China pledged to stabilize employment and targeted the creation of 9 million new jobs in urban areas. This is an ambitious target amidst the massive layoffs induced by the COVID-19 pandemic this year. Chart 9Chinese Credit Growth Will Surge
Chinese Credit Growth Will Surge
Chinese Credit Growth Will Surge
Policymakers also reserved policy space to be used – without the approval of the NPC at the Politburo’s mid-year review – in the event the shock from the pandemic proves persistent.4 Past episodes of Chinese stimulus resulted in strong rallies in base metals prices. Given China now represents more than half of global copper consumption (vs. 43% in 2009 following the GFC, and 32% in 2012 following the euro area debt crisis), we expect this new round of stimulus will lead to a sharp increase in copper prices.5 By and large, refined copper prices are highly sensitive to growth in EM imports – particularly China’s – which are closely tied to income growth. The latest CPB World Trade Monitor data for March shows EM ex-China imports have been resilient suggesting the rebound in China’s economic activity might be spilling over to other EMs highly leveraged to China (Chart 10). Still, our main cyclical commodity demand indicators were declining as of April. We expect stimulus-driven EM income and investment growth will show up in our indicators in 2H20 (Chart 10). Chart 10Awaiting A Rebound In Our Cyclical Indicators
Speed Of Demand Recovery Remains Key To Copper Prices
Speed Of Demand Recovery Remains Key To Copper Prices
Stalling Primary And Secondary Supply Growth In addition to the demand implications, lockdowns also resulted in restrictions – and few complete shutdowns – in mining activities in copper-producing countries. The ICSG revised down its global mine and refined copper output by 950k MT and 1.1mm MT, respectively, for this year on the back of the COVID-19 pandemic.6 The group now expects 2020 mine supply to decline by 3% this year and refined production to remain flat y/y, for a second consecutive year. While important, these adjustments were insufficient to completely offset the large negative demand shock in 1Q and 2Q20.7 In 2H20, the supply-side outlook rests on the evolution of COVID-19 cases and associated governments’ responses in major ore and refined copper-producing countries (i.e. Chile, Peru, US, DRC, China, Russia, and Japan). So far, mining activities were mostly treated as essential and allowed to operate at reduced capacity under additional sanitary and social distancing guidelines. Confirmed cases in these countries appears to be slowing, this could allow activity to slowly return to normal (Chart 11). Chart 11Further Supply Disruptions Are Unlikely
Speed Of Demand Recovery Remains Key To Copper Prices
Speed Of Demand Recovery Remains Key To Copper Prices
Supply factors are for the most part reflected in current prices. Going forward the speed of the demand recovery will be the determining factor for copper prices. While mining and refining of copper concentrates were often classified as essential, scrap activities were not. According to the ICSG, copper scrap supplied decreased significantly as trade flows and generation, collection, and disassembling activities were disrupted by the pandemic. China’s import of scrap copper – a key input for Chinese refiners – declined 37% in 1Q20. This prompted the government to allow more scrap imports to fill the gap, but it might struggle to find suppliers. Globally, scrap makes up ~ 25% of total refined copper supply, thus, it usually plays a non-negligible role in the rebalancing of global markets. Supply factors are for the most part reflected in current prices. Going forward the speed of the demand recovery will be the determining factor for copper prices. In addition, the crisis began at an abnormally low inventory level. Thus, despite the temporary build in 1Q20, inventories are still below their 2010 to 2019 average. The rebound in demand, combined with flat supply and limited scrap availability, will move Chinese inventory down in 2H20 and offset any builds at the LMEX and COMEX warehouses, supporting copper prices this year (Chart 12). Chart 12Inventories Still Low Despite Builds In 1Q20
Inventories Still Low Despite Builds In 1Q20
Inventories Still Low Despite Builds In 1Q20
USD Depreciation Leads To EM Economic Growth Uncertainty over the duration of lockdowns globally continues to fuel safe-haven demand for USD. As the COVID-19 shock abates we expect a weaker US dollar to be more supportive to copper demand. Uncertainty over the duration of lockdowns globally continues to fuel safe-haven demand for USD (Chart 13). The shortage of USD experienced by EM debtors servicing dollar-denominated debt continues to hamper their recovery. The combination of safe-haven demand and a continued dollar shortage for borrowers without access to US swap lines is keeping the dollar well bid, suppressing foreign flows to EM economies and commodity demand at the margin (Chart 14, panel 1). Chart 13Global Financial Cycles Hurting EM Economies
Speed Of Demand Recovery Remains Key To Copper Prices
Speed Of Demand Recovery Remains Key To Copper Prices
Chart 14Uncertainty Keeps USD Well Bid
Uncertainty Keeps USD Well Bid
Uncertainty Keeps USD Well Bid
The Fed will continue to accommodate USD demand, in an ongoing attempt to reverse a tightening of global financial conditions. EM economies – the bulk of base metals demand growth – are facing dual domestic demand and global financial shocks.8 These economies have become more dependent on foreign portfolio inflows, both in debt and equity markets (Chart 14, panel 2). Thus, global financial cycles now have a significant impact on their growth. The main factors influencing these flows are risk appetite, EM exchange rates, and DM interest rates.9 We expect all factors to support inflows to emerging markets as the COVID-19 shock abates. The Fed will continue to accommodate USD demand, in an ongoing attempt to reverse a tightening of global financial conditions. A lower USD will decrease the local-currency cost of consuming commodities ex-US. Metals producers' ex-US will face higher local-currency operating costs, reducing supply growth at the margin. A depreciating USD is a necessary factor for our bullish cyclical commodities view (Chart 15). The risk to this view is a severe second wave of COVID-19 infection which would cause safe assets to spike anew. Chart 15Metals Inversely Correlated With The US Dollar
Metals Inversely Correlated With The US Dollar
Metals Inversely Correlated With The US Dollar
$3.00/lb Copper Price Likely; Geopolitical Risks Mounting Over the short term, geopolitical risks – chiefly mounting Sino-US tensions – could derail the rally in copper prices and other risk assets. For April, our copper demand model suggested prices were at equilibrium relative to underlying demand trends (Chart 16). Chart 16Copper Prices Will Rise As The USD Depreciates
Copper Prices Will Rise As The USD Depreciates
Copper Prices Will Rise As The USD Depreciates
When simulating a 10% decline in the USD and a rebound in EM import growth in 2H20, our model suggests COMEX copper prices could move 25% higher, holding everything else constant. In reality, the USD’s path and the extent of the EM import rebound are among the key known unknowns we confront in estimating a model for copper prices. We do not have a precise view on these variables, which is why we run simulations. Theory would suggest the stimulus we are seeing globally points to a lower USD and a pick-up in EM imports, however, and these factors will create a more supportive environment for metals prices. Over the short term, geopolitical risks – chiefly mounting Sino-US tensions – could derail the rally in copper prices and other risk assets. With the US election now only 5 months away, President Trump’s odds of being reelected on the back of a strong economy are fading amidst the COVID-19 pandemic. According to our Geopolitical strategists, Trump is the underdog and will need to double down on foreign and trade policies to prop-up his chances of winning. Meanwhile, China is seeking to solidify its sphere of influence.10 This is causing US-China tensions to intensify. Depending on the nature of the actions taken by the Trump administration (i.e. increasing tariffs on US imports of Chinese goods vs. cutting China’s access to foreign technology), metals prices could suffer, as was the case in 2018. With these geopolitical risks in mind, we maintain that China’s strong fiscal and monetary stimulus, combined with a falling US dollar will provide a favorable backdrop for copper markets in 2H20. Hugo Bélanger Senior Analyst Commodity & Energy Strategy HugoB@bcaresearch.com Robert P. Ryan Chief Commodity & Energy Strategist rryan@bcaresearch.com Commodities Round-Up Energy: Overweight Doubts about OPEC 2.0’s commitment to extending their deepest-ever production cuts expiring this month to July, perhaps August, took some of the steam out of crude-oil rally earlier in the week. In our modeling, we do not see the need to extend the massive voluntary cuts announced by the Kingdom of Saudi Arabia (KSA) and its Gulf allies: KSA’s cuts of ~ 4.5mm b/d vs. its April output level of 12mm b/d starting this month will take the Kingdom’s output to ~ 7.5mm b/d. The UAE and Kuwait also voluntarily added cuts of 100k and 80k b/d, respectively, to their agreed quotas. We continue to believe the current schedule of production cuts will result in a physical supply deficit in 3Q20, which will require OPEC 2.0 to begin raising production to keep prices from getting too high going into a US presidential election. We expect Brent prices to average $40/bbl this year and $68/bbl next year, with WTI trading $2 - $4/bbl below that (Chart 17).11 Base Metals: Neutral Iron ore prices breached $100/MT this week, as COVID-19-induced supply disruptions in Brazil – the largest exporter of high-grade ore – and South Africa leave the seaborne market open to Australian suppliers to meet higher Chinese demand as port inventories are rebuilt. FastMarkets MB, a sister company of BCA Research, reported May exports to China from Brazil were down 28% y/y to 21.5mm MT from just under 30mm MT the year prior. Iron ore exports from Australia are expected to exceed A$100 billion this year, according to government estimates reported by the Financial Times.12 Precious Metals: Neutral As we go to press, gold prices retreated to $1,700/oz from ~ $1,740/oz last week, exhibiting a positive correlation with the dollar. This is a result of rising risk appetite globally as economies exit lockdowns. In the US, interest rates are continuing to support gold. Going forward, the probability of negative rates is remains low, but the Fed will continue to buy more debt from the public and private sectors to push the shadow rate further down. This supports gold prices (Chart 18). Chart 17Crude Prices Will Rebound
Crude Prices Will Rebound
Crude Prices Will Rebound
Chart 18Fed Buying Supports Gold Prices
Fed Buying Supports Gold Prices
Fed Buying Supports Gold Prices
Footnotes 1 Please see “The Impact of the COVID-19 Pandemic on World Copper Supply,” published by the International Copper Study Group on May 21, 2020. 2 A resurgence of infection triggered renewed lockdowns over a region of 100 million people in May. Please see More than 100 million people in China's northeast back under lockdown to thwart potential second wave published by the National Post on May 19, 2020. 3 Please see BCA's Emerging Markets Strategy Weekly Report "EM Stocks Are At A Critical Resistance Level," published May 28, 2020. It is available at ems.bcaresearch.com. 4 Please see BCA's China Investment Strategy Weekly Report "Taking The Pulse Of The People’s Congress," published May 28, 2020. It is available at cis.bcaresearch.com. 5 There remains a risk global monetary stimulus fails to ignite strong consumer and business consumption. The unprecedented shock could raise precautionary savings and keep risk aversion elevated for an extended period. Based on the Quantity Theory of Money, money supply times velocity (the rate at which money changes hands) equals nominal GDP. Low confidence translates to a low velocity of money limiting the reach of monetary policy. This value is extremely difficult to forecast. 6 Please see “The Impact of the COVID-19 Pandemic on World Copper Supply,” published by the International Copper Study Group on May 21, 2020. 7 According to BGRIMM Lilan Consulting, China’s real demand for refined copper declined by ~22% in 1Q20. This implies a ~11% decline in global copper consumption. Please see footnote 6 for more details. 8 Global financial cycles capture how global financial conditions affect individual economies. The analysis of these cycles stressed the importance of common factors in global risk asset prices which are driven by risk appetite and US monetary policy. These factors are mainly explained by developments in advanced economies but have a drastic effect on emerging markets. Please see Iñaki Aldasoro, Stefan Avdjiev, Claudio Borio and Piti Disyatat (2020). “Global and domestic financial cycles: variations on a theme,” BIS Working Papers, No 864. 9 Please see Chapter 3 of the Global Financial Stability Report titled “Managing Volatile Portfolio Flows,” published by IMF. 10 Please see BCA's Geopolitical Strategy Weekly Report "Spheres Of Influence (GeoRisk Update)," published May 29, 2020. It is available at gps.bcaresearch.com. 11 Please see our May 21, 2020 report entitled US Politics Will Drive 2H20 Oil Prices for our latest view on oil fundamentals and prices, available at ces.bcaresearch.com. 12 Please see Australia’s iron ore miners exploit supply gap as Covid-19 hobbles rivals published by the Financial Times June 3, 2020. Investment Views and Themes Recommendations Strategic Recommendations Tactical Trades Trade Recommendation Performance In 2020 Q1
Speed Of Demand Recovery Remains Key To Copper Prices
Speed Of Demand Recovery Remains Key To Copper Prices
Commodity Prices and Plays Reference Table Trades Closed in 2020 Summary of Closed Trades
Speed Of Demand Recovery Remains Key To Copper Prices
Speed Of Demand Recovery Remains Key To Copper Prices
Highlights Risks assets have entered a FOMO-driven mania phase that could last for a few more weeks. Markets are ignoring the particularities of this recession and are treating the post-lockdown activity snapback as a V-shaped recovery. A weaker than expected global recovery and rising geopolitical tensions between the US and China are the two primary risks that will weigh on EM risk assets after this mania phase runs out of steam. We are upgrading EM sovereign and corporate credit from underweight to neutral within a global credit portfolio. Within EM, local rates will perform well in both risk-on and risk-off phases. Feature The recovery in global risk assets has entered a fear-of-missing-out, or FOMO, mania phase. Like any mania, this one could last longer and go further than any fundamental analysis could presume. Investors who are long or cannot afford to stay on the sidelines should play this rally with tight stop points. Investors with longer time horizon should wait for a pullback in EM equities and currencies to buy. Within EM, local rates offer the best risk-reward profile. A recovery in global trade and mainland industrial sectors is necessary for EM equities and currencies to rally on a sustainable basis. The global equity rally has taken place amid a shrinking forward EPS. The top panel of Chart I-1 demonstrates that even the ever-bullish bottom-up analysts have been cutting their expectations of the level of corporate 12-month forward earnings per-share. As a result, the global forward P/E ratio has spiked to a 18-year high (Chart I-1, bottom panel). Chart I-1An Unprecedented Divergence: Surging Stocks Prices Amid Plunging Forward EPS Levels
An Unprecedented Divergence: Surging Stocks Prices Amid Plunging Forward EPS Levels
An Unprecedented Divergence: Surging Stocks Prices Amid Plunging Forward EPS Levels
Chart I-2EM Forward EPS Level Has Been Falling
EM Forward EPS Level Has Been Falling
EM Forward EPS Level Has Been Falling
Chart I-2 illustrates that the same phenomenon is true for EM equities. Their forward EPS has been contracting and their forward P/E has jumped to a decade high. Any overdrive in asset prices without supporting fundamentals can last for a while but typically ends with a crash. This FOMO-driven mania is unlikely to be any different. It is fair to say that during the March carnage, many investors operated on a “sell now, think later” principle. Since the rally began, they have switched to a “buy now, ask questions later” attitude. As this rally persists, global stocks and credit will become overbought and expensive. At that point, any negative shock could produce a sharp pullback that would likely devolve into another nasty selloff as investors shift back to a “sell now, think later” mentality. The Narratives Driving The Rally The narratives supporting this mania are simple and seem to be both accepted and embraced by a growing number of investors. We agree with some and disagree with others: Economies around the world are opening, which will ensure that an economic recovery will follow. Our interpretation: Surely as confinement policies are eased, activity will improve. However, in our opinion, this should not come as a surprise to investors. This is especially pertinent for the trend-setting US stock market. With US equity valuations not particularly cheap, the market was never pricing in extended lockdowns. Hence, it appears strange to us that markets have so exuberantly cheered the reopening of the economy. Looking forward, the key to the medium-term (six-month) equity outlook is the shape of the recovery following the initial partial normalization. The latter presently looks V-shaped because as stores and businesses reopen economic activity is bound to improve. Yet the odds are that following this initial normalization, the shape of the recovery is most likely to be U-shaped. For what it’s worth, manufacturing PMIs in export-oriented economies like Korea, Japan and Taiwan made new lows in May (Chart I-3). We are not suggesting these indicators will not improve in the months ahead; they surely will. Nevertheless, a marginal rise in diffusion indexes like PMIs from extraordinary depressed levels do not signify a profit recovery. This recession differs from previous ones as the level of business activity has dropped below breakeven points for more businesses than it did in other recessions. When a company operates below its breakeven level, a marginal rise in sales may not be sufficient to improve its debt-servicing capacity, hiring and capital spending intentions. However, it seems markets are ignoring the particularities of this recession and are treating the post-lockdown activity snapback as a V-shaped recovery. This is why we feel risk assets are in a FOMO-driven mania phase, where fundamentals do not matter. Authorities around the world are stimulating, with the US pumping enormous amounts of fiscal and credit stimulus into the economy (Chart I-4, top panel). Chart I-3Asian Manufacturing PMIs Made New Lows In May
Asian Manufacturing PMIs Made New Lows In May
Asian Manufacturing PMIs Made New Lows In May
Chart I-4An Unparalleled Global Money Boom
An Unparalleled Global Money Boom
An Unparalleled Global Money Boom
Chart I-5China Is Ramping Up Stimulus
China Is Ramping Up Stimulus
China Is Ramping Up Stimulus
China has finally embarked on aggressive stimulus. The National People’s Congress has set the monetary policy objective for 2020 as follows: Substantially accelerate the growth of broad money supply and total social financing (Chart I-4, bottom panel). Our interpretation: Indeed, government stimulus worldwide is massive. Yet, it is hard to know if it will be sufficient to produce a V-shaped recovery. The rise in money supply at the moment is being offset by the drop in the velocity of money. As a result, nominal GDP levels are extremely low. That said, last week we upgraded our growth outlook for China because of the above-mentioned aggressive policy stimulus. It is possible that China’s credit and fiscal impulse will reach about 15% of GDP before year-end (Chart I-5). What presently deters us from recommending outright long positions in China-related plays is the escalating US-China confrontation and the risk of a relapse in global stocks. Central banks around the world both in DM and EM are monetizing debt and injecting immense liquidity into the system. Our interpretation: Correct, but equally relevant is investors’ animal spirits. The latter will determine whether and when these liquidity injections leak into risk assets. For now, it seems that once again central banks’ actions have been successful in lifting asset prices, despite poor fundamentals. Equity valuations are cheap, especially outside the US. This is especially true given the low risk-free rate. Our interpretation: We agree that EM equities are cheap, something we have been highlighting since mid-March (Chart I-6). Yet valuations are not a good timing tool, as they can stay depressed so long as profits are not worsening. Meanwhile, US equities are expensive (Chart I-7). Critically, we argued in a recent report that equity multiples depend not only on the risk-free rate but also on the equity risk premium (ERP). Chart I-6EM Equities Are Cheap
EM Equities Are Cheap
EM Equities Are Cheap
Chart I-7US Stocks Are Expensive
US Stocks Are Expensive
US Stocks Are Expensive
Given the immense ambiguities investors are facing with respect to both the business cycle and economic, political and geopolitical trends, the ERP should be at the upper end of its historical range. Hence, the discount factor – the sum of the risk-free rate and the ERP – should be reasonably high. In this context, US equity valuations are rather expensive, despite the very low risk-free rate. In short, the expensive US stock market has until very recently been the locomotive of this rally. If US share prices had not rallied hard in the past two months, EM and other international bourses would not have caught a bid. The Fed’s public debt monetization is a structural, not near-term negative for the greenback. The US dollar is expensive and will depreciate a lot due to unrestrained fiscal and monetary stimulus in the US. Our interpretation: The US dollar is one standard deviation expensive (Chart I-8) and EM currencies have become cheap (Chart I-9). Chart I-8US Dollar Valuations Are Elevated
US Dollar Valuations Are Elevated
US Dollar Valuations Are Elevated
Chart I-9EM Currencies Are Cheap
EM Currencies Are Cheap
EM Currencies Are Cheap
Chart I-10EM Currencies And Stocks Correlate With Industrial Metals
EM Currencies And Stocks Correlate With Industrial Metals
EM Currencies And Stocks Correlate With Industrial Metals
We do not disagree with the view that the US dollar is vulnerable in the long term due to the Federal Reserve’s aggressive debt monetization and that the Fed will eventually fall behind the inflation curve. Yet inflation is not imminent, and the Fed’s public debt monetization is a structural, not near-term negative for the greenback. As such, these potholes for the US dollar may not be pertinent in the next several months. Critically, Chart I-10 illustrates that EM currencies move with industrial metals prices, and EM stocks correlate with global materials stocks. The common driver of all of these markets is global growth in general and China’s industrial sectors in particular. In short, a recovery in global trade and mainland industrial sectors is necessary for EM equities and currencies to rally on a sustainable basis. Investors are underinvested in global equities in general and cyclical plays in particular. Our interpretation: Indeed, we showed last week that institutional equity investors had been skeptical of this rally. What has driven or supercharged this equity rally since late March has been unsophisticated retail investors. They have been opening up broker accounts worldwide and aggressively trading since March lockdowns. We cited a few pieces of anecdotal evidence confirming this phenomenon in last week’s report. However, it seems that institutional investors in recent weeks have capitulated by raising their risk exposure in general and their exposure to cyclical plays in particular. This explains the recent surge in cyclical equities and currencies. Bottom Line: The narratives driving this rally are only partially correct. Markets are ignoring the particularities of this recession and are treating the post-lockdown activity snapback as a V-shaped recovery. A weaker than expected global recovery and rising geopolitical tensions between the US and China are the two primary risks that will weigh on EM risk assets after this FOMO-driven mania phase runs out of steam. Nuances To Beware Of There are several nuances about the market’s internals and characteristics that we would like to draw investors’ attention to: There is mixed evidence as to whether China’s economy in general and its industrial sectors in particular have entered a sustainable recovery. First, examining the Taiwanese manufacturing PMI data could help in assessing the growth outlook for both the mainland economy and for global trade. The basis is that Taiwan has done extremely well by avoiding COVID-19 outbreaks and lockdowns. Therefore, there are no domestic reasons for weak output growth. In addition, its manufacturing sector is very export-oriented, with about 40% of exports destined for mainland China. PMI export orders for Taiwan's aggregate manufacturing and its three key sectors plunged to new lows in May (Chart I-11). This includes both the electronic optical (semiconductor) and basic materials sectors. The latter correlates well with global materials stocks. There has so far not been a bullish signal from this indicator (Chart I-11, second panel). Second, China’s domestic A-share market in general and its cyclical sectors in particular have not yet broken out (Chart I-12). Given China was the first nation to exit from lockdowns, its share prices should be the first to signal a sustainable economic recovery. Yet onshore share prices have been rather subdued. China’s economy will eventually stage a recovery later this year. Our point is that global cyclicals might have run ahead of themselves by pricing in a recovery too early. Chart I-11Taiwanese Manufacturing PMIs In May: New Lows Across All Industries
Taiwanese Manufacturing PMIs In May: New Lows Across All Industries
Taiwanese Manufacturing PMIs In May: New Lows Across All Industries
Chart I-12Chinese Onshore Share Prices Are Not Flagging An Imminent Recovery
Chinese Onshore Share Prices Are Not Flagging An Imminent Recovery
Chinese Onshore Share Prices Are Not Flagging An Imminent Recovery
Equity market and sector leadership changes occur during selloffs or at the inception of rallies. Chart I-13 illustrates EM relative stock prices versus DM along with the global equity index. Over the past 25 years, there have been several major leadership changes between EM and DM. And all of them occurred during selloffs in global share prices. Chart I-13EM Versus DM Equity Leadership Rotations Took Place During Selloffs
EM Versus DM Equity Leadership Rotations Took Place During Selloffs
EM Versus DM Equity Leadership Rotations Took Place During Selloffs
Similarly, the relative performance of global growth versus value stocks experiences trend reversals during global bear markets (Chart I-14). Chart I-14Global Growth Versus Value Leadership Rotations Occurred During Bear Markets
Global Growth Versus Value Leadership Rotations Occurred During Bear Markets
Global Growth Versus Value Leadership Rotations Occurred During Bear Markets
Chart I-15EM Could Outperform DM For A Few Weeks
EM Could Outperform DM For A Few Weeks
EM Could Outperform DM For A Few Weeks
Leadership of US equities and global growth stocks did not change during the March crash nor during the following two-month rally from the bottom. Only in the past week or so have US equities and global growth stocks begun to lag EM bourses and global value, respectively (Chart I-15). In brief, the latest leadership rotation from US to EM did not occur during the selloff or at inception of the rally – i.e., it does not fit the typical profile of sustainable leadership reversal. As such, it may not be enduring. The internals of this rally are consistent with the fact that it might already be at a late stage. During rallies, laggards are the last to catch a bid. Contrarily, during selloffs, outperformers are the last to be liquidated. For example, US growth stocks were the last ones to be liquidated in both the 2015-early-2016 and 2018 selloffs. When the decade-long leaders – US growth stocks – were finally stamped out, it marked the bottom of those selloffs. We are upgrading EM sovereign and corporate credit from underweight to neutral within a global credit portfolio. The Fed’s purchases of US bonds will likely continue pushing investors into EM credit markets. Using an analogous framework for this rally, the latest extraordinary spike in the laggards such as EM, Europe and both value and cyclical stocks could be a sign of bear capitulation, and could signify the final phase of this equity rally. Bottom Line: There are several nuances to the current equity market rally, but investors seem reluctant to consider them amid a FOMO-driven mania. Investment Considerations The FOMO-driven rally could last for several more weeks. Afterwards it will be followed by a major setback. Investors who are long or cannot afford to stay on the sidelines should play this rally with tight stop points. Investors with longer time horizon should wait for a pullback in EM equities and currencies to buy. Chart I-16EM Local Rates Offer Value
EM Local Rates Offer Value
EM Local Rates Offer Value
We are making the following adjustments and changes to our strategy and trade recommendations: In regard to our EM versus DM asset allocation strategy, we are making one change: we are upgrading EM sovereign and corporate credit from underweight to neutral within a global credit portfolio. The Fed’s purchases of US bonds will likely continue pushing investors into EM credit markets. Consistently, we are closing two positions: (1) our short EM corporate and sovereign credit / long US investment-grade corporate bond trade; and (2) our long Asian investment-grade /short high-yield corporate bond trade. Within the EM credit space, we continue to favor sovereigns versus corporates – a strategy recommended on April 23. We are still reluctant to strategically upgrade EM stocks versus DM ones even though odds of EM outperforming DM stocks are high in the coming weeks. In light of the potential FOMO-driven rally, to protect profits we are closing the following two currency positions: Take profits on short BRL/long USD trade. It was initiated on November 29, 2019 and has produced a 19% gain. Book profits on short SGD/long JPY position. This recommendation has generated a 2.3% gain since its initiation on June 8, 2018. We are still maintaining shorts in the following EM currencies: CLP, ZAR, TRY, IDR, PHP and KRW. They could continue rallying in the near term but will relapse afterwards. We are also structurally short low beta currencies: the RMB and the Saudi riyal. Within EM, local rates offer the best risk-reward profile: they will perform well in both risk-on and risk-off phases. Real bond yields remain somewhat elevated in many EMs, as shown in Chart I-16. We continue to receive long-term rates in Mexico, Colombia, Russia, Ukraine, India, Pakistan, Malaysia, China and Korea, as well as 2-year rates in South Africa. Their central banks will reduce policy rates much further. In addition, several of these local bond markets will benefit from ongoing quantitative easing by their central banks. Arthur Budaghyan Chief Emerging Markets Strategist arthurb@bcaresearch.com Equities Recommendations Currencies, Credit And Fixed-Income Recommendations
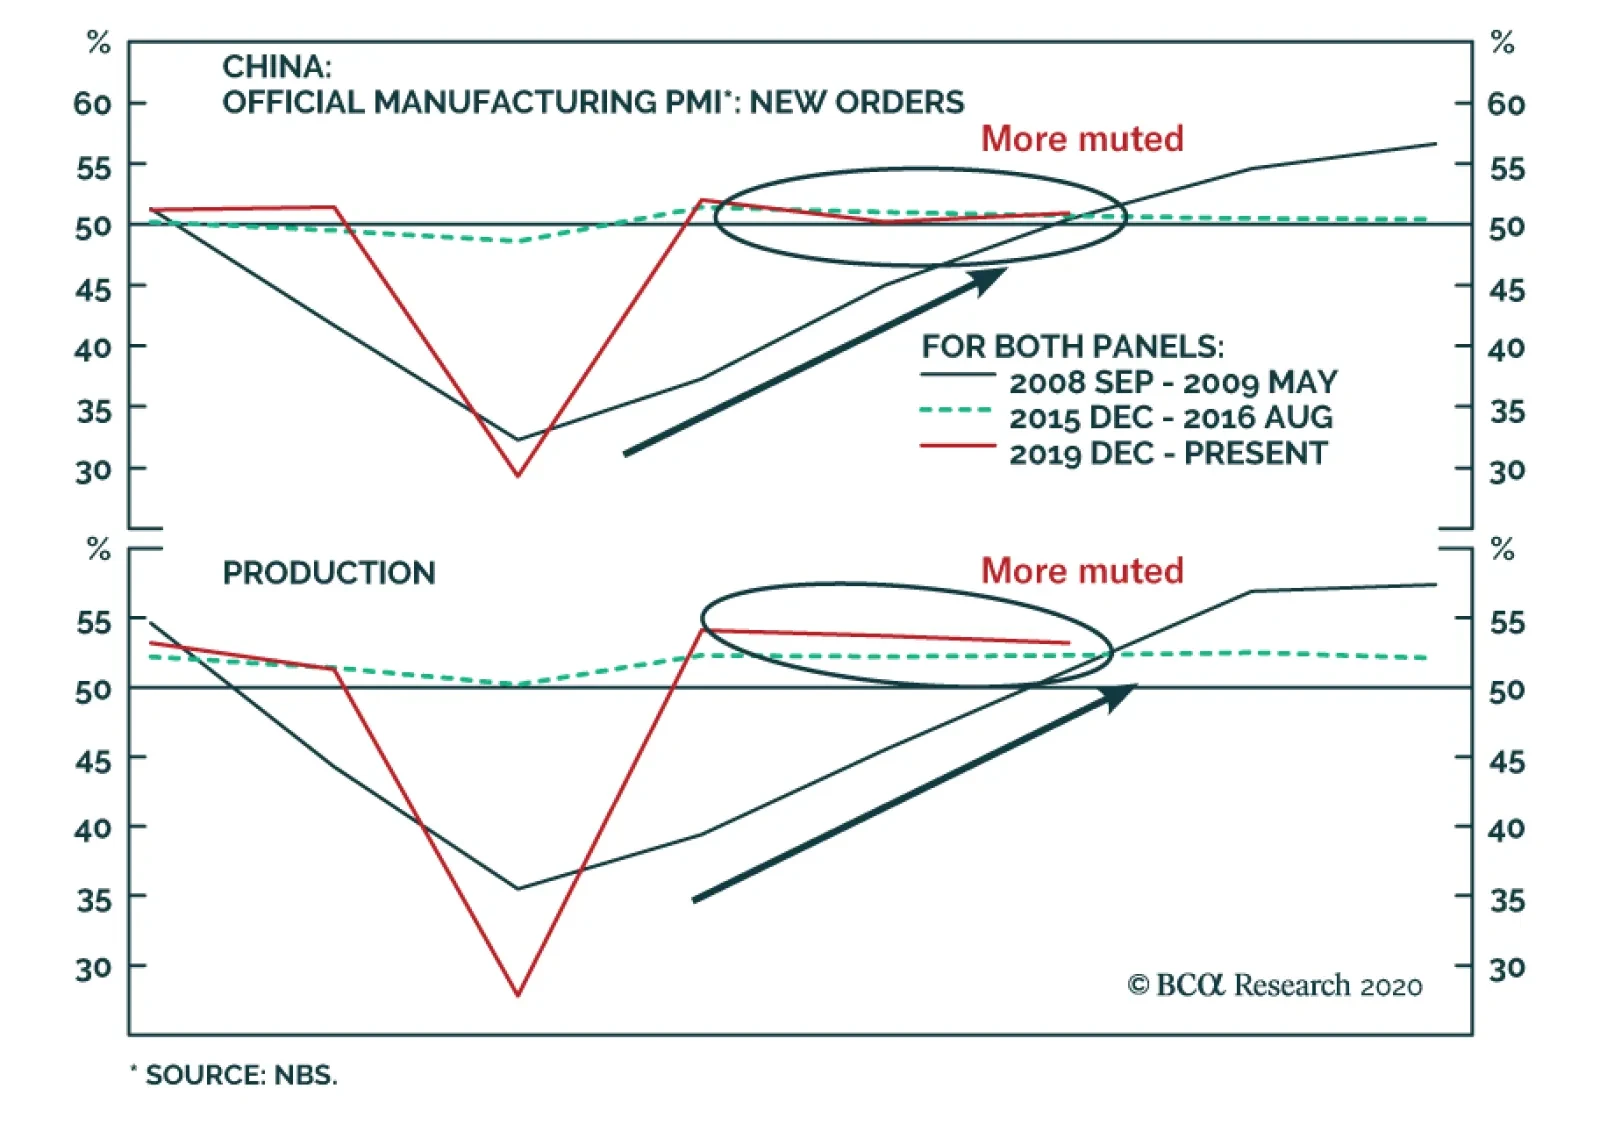
BCA Research's China Investment Strategy service shows that demand is struggling to outpace supply. China’s official manufacturing PMI slipped to 50.6 in May from 50.8 a month earlier. While the reading suggests that manufacturing activities are still in an…