Asia

Highlights Exogenous risks will remain more of a threat to grain prices than out-of-whack fundamentals, which are closer to balance than not, as the USDA’s World Agricultural Supply and Demand Estimates (WASDE) indicate. COVID-19-induced public-health risks leading to renewed lockdowns – particularly in the US, where infection rates are rampaging ahead of its trading partners’ – remain at the forefront of these exogenous risks (Chart of the Week). Headline-grabbing grain purchases notwithstanding, fraying Sino-US trade, diplomatic and military relations again threaten these markets, particularly soybeans. China promises to retaliate against actions taken by US President Donald Trump in response to a new security law Beijing foisted on Hong Kong at the end of June, which sharply curtails freedom and autonomy. Sino-US military tensions in the South China Sea remain elevated. Countering these risks, a weaker USD – in line with our House view – would boost demand for grains as EM income growth picks up. Still, global economic policy uncertainty will remain a formidable headwind to a weaker USD. Feature Grains generally are closer to balance than not globally, which suggests the next market-moving developments – outside weather – will be caused by news exogenous to fundamentals (Chart 2). Chart of the WeekCOVID-19 Infection Surge In US Could Lead To Renewed Lockdowns
Exogenous Risks Keep Grains, Beans On Edge
Exogenous Risks Keep Grains, Beans On Edge
The four key markets tracked by the UN’s Agricultural Market Information System (AMIS) – corn, wheat, rice and soybeans – are in “a generally comfortable global supply situation. However, in many parts of the world, local markets brace for the looming impacts of COVID-19, amid uncertainties related to demand, logistics and even access to food.”1 Chart 2Grain Markets Close To Balanced
Grain Markets Close To Balanced
Grain Markets Close To Balanced
The USDA sees corn markets tightening in the coming 2020-21 crop year beginning in September, with US production down 995mm bushels on the back of lower plantings and harvests.2 Output ex-US is expected to be largely unchanged, while Chinese corn demand will pick up in response to higher soybean feed usage. Stocks in China, Argentina, the EU, Canada, and Mexico, are expected to be lower leading to a net decline in global inventories. US soybean stocks are expected to increase, but this will be offset by declines in Brazil and China, reducing global bean inventories by some 1.3mm tons to 95.1mm, based on USDA estimates. The USDA’s soybean export commitments to China (i.e., outstanding sales plus accumulated exports) are 1.8mm tons higher than last year at 16.2mm tons, but still are well below historic levels (Chart 3). The US slack has been picked up by Brazilian exports, which have been aided by a weak BRL and record bean crops. A weaker USD and a resumption of Sino-US bean trade would reverse this. Wheat and rice stocks are expected to increase globally. Wheat inventories are expected to hit record highs globally, with China accounting for a little more than half of these stocks, and India accounting for 10%. Rice supplies are expected to increase more than demand globally, lifting ending stocks for the 2020-21 crop year to a record 186mm tons; China and India account for 63% and 21% of these inventories, respectively, in the USDA’s estimates. Chart 3Sino-US Trade Tensions Reduce Soybean Exports
Exogenous Risks Keep Grains, Beans On Edge
Exogenous Risks Keep Grains, Beans On Edge
Chart 4Rising US COVID-19 Infections Are A Risk, But Won’t Derail Global Recovery
Exogenous Risks Keep Grains, Beans On Edge
Exogenous Risks Keep Grains, Beans On Edge
Sources Of Market-Moving News The public-health fallout from the COVID-19 pandemic continues, particularly in the US, which is seeing a second wave of infections multiplying rapidly. With markets largely in line with fundamentals, the three most likely sources of market-moving “new news” affecting grain markets – outside weather – will come from public-health developments, particularly in the US; political developments affecting global trade, particularly the escalating Sino-US diplomatic tensions; and FX-market developments, which will continue to process these developments in real time. The public-health fallout from the COVID-19 pandemic continues, particularly in the US, which is seeing a second wave of infections multiplying rapidly (Chart 4). While we do not except a repeat of the massive lockdowns earlier this year, rising infection rates do place increasing strains on public-health resources, which could force officials to reimpose lockdowns locally. The global recovery from the pandemic remains uneven, with China’s recovery apparently ahead of most other states in terms of returning its economy to normal. China was first to be hit by the virus and first to largely recover, due to its more extensive lockdowns. Rising geopolitical tensions centered on China could throw global trade patterns into disarray again, just as the world is attempting to emerge from the COVID-19 pandemic. For grain markets, China remains an attractive destination for exporters, given the premium grains and soybeans trade at relative to other destinations (Chart 5). This should keep China’s imports of grains robust in the near future, particularly for corn (Chart 6). Chart 5China Grains Prices Are Attractive To Exporters
China Grains Prices Are Attractive To Exporters
China Grains Prices Are Attractive To Exporters
While economics favor movement of grains – and other commodities – to China, rising geopolitical tensions centered on China could throw global trade patterns into disarray again, just as the world is attempting to emerge from the COVID-19 pandemic. Chart 6China Should Remain Well Bid For Corn
Exogenous Risks Keep Grains, Beans On Edge
Exogenous Risks Keep Grains, Beans On Edge
A new security law foisted on Hong Kong by Beijing at the end of June limiting freedom and autonomy drew sharp responses from the US and EU. President Trump this week signed an order ending Hong Kong’s preferential status as a US trading partner in the wake of the new law, and threatened direct sanctions against Chinese officials involved in enforcing the law.3 The European Union issued a statement on July 1, which decried the passage of the law by the Standing Committee of China’s National People’s Congress, expressing “grave concerns about this law which was adopted without any meaningful prior consultation of Hong Kong’s Legislative Council and civil society.”4 In addition to this political turmoil, the US and China are engaged in a war of words over China’s territorial claims on the South China Sea, which is contested by states surrounding the sea and branded as illegal by the US.5 The US and China carried out simultaneous large-scale naval exercises earlier this month, raising concerns of an unintended military confrontation.6 Weaker USD Will Buoy Grain Markets We are aligned with our House view expecting a weakening of the USD, driven by the massive fiscal and monetary stimulus from the US; lower real rates in the US, and America’s apparent inability to successfully contain the COVID-19 pandemic to the degree other states (e.g., China) have (Chart 7). This implies the US is at a greater risk of a marked slowdown in its ongoing economic recovery. These factors will support flows to markets ex-US, pressuring the USD lower. For grain markets this will be bullish for demand. A weaker USD lifts EM GDP growth, which boosts industrial activity (Chart 8). Higher income boosts demand for protein, which drives demand for corn and soybeans used as animal feed, and grain consumption (wheat and rice).7 Chart 7USD Weakness Expected As Real Rates Fall, Deficits Rise
USD Weakness Expected As Real Rates Fall, Deficits Rise
USD Weakness Expected As Real Rates Fall, Deficits Rise
Chart 8Weaker USD Boosts EM Income, Which Lifts Protein and Grain Demand
Weaker USD Boosts EM Income, Which Lifts Protein and Grain Demand
Weaker USD Boosts EM Income, Which Lifts Protein and Grain Demand
On the supply side, a higher (lower) US dollar decreases (raises) the local costs of production for ag exporting countries with a certain lag. A persistently high (low) dollar will incentivize (disincentivize) crop planting in these countries – allowing producers to increase local currency profits from USD-denominated ag exports. This pushes up (down) global supply at the margin. Hence, over relatively long periods, ag prices and the US dollar tend to trend in opposite directions. We cannot ignore the USD’s role as a safe-haven, which is particularly evident during periods of financial, economic and geopolitical stress. Longer term, disparities in monetary and fiscal policies, interest rates, and economic activity between the US and other DM economies will dominate the evolution of the dollar. In our simulations for the USD’s trajectory between now and the end of the year, a 5% depreciation of the USD would lift the CCI grains and oilseed index 13%, while a 5% strengthening of the dollar would push the index down by -8% by December 2020 (Chart 9).8 Should this weakening in the USD materialize, we can expect US grains’ stocks-to-use ratios to fall, which would reinforce price strength in grains (Chart 10). Chart 9USD Weakness Will Buoy Grains
USD Weakness Will Buoy Grains
USD Weakness Will Buoy Grains
While the weaker-dollar scenarios are our favored evolution, we cannot ignore the USD’s role as a safe-haven, which is particularly evident during periods of financial, economic and geopolitical stress (Chart 11). Chart 10Weaker USD Would Lower STU Ratios, And Provide Support To Grain Prices
Weaker USD Would Lower STU Ratios, And Provide Support To Grain Prices
Weaker USD Would Lower STU Ratios, And Provide Support To Grain Prices
Chart 11USD's Safe-Haven Status Could Keep Dollar Well Bid
USD's Safe-Haven Status Could Keep Dollar Well Bid
USD's Safe-Haven Status Could Keep Dollar Well Bid
Bottom Line: Global grain markets are closer to balance than not, leaving exogenous risks – i.e., a COVID-19 second wave, renewed Sino-US trade and military tensions, and a stronger USD – as the key threats to grain prices. The impact of these exogenous risks will be filtered through to grain markets – and commodities generally – via FX markets. While we expect a weaker USD to prevail, in line with our House view, we cannot gainsay the dollar’s safe-haven role and its attraction during times of tension and crisis. Robert P. Ryan Chief Commodity & Energy Strategist rryan@bcaresearch.com Hugo Bélanger Associate Editor Commodity & Energy Strategy HugoB@bcaresearch.com Fernando Crupi Research Associate Commodity & Energy Strategy FernandoC@bcaresearch.com Commodities Round-Up Energy: Overweight As we go to press, Brent prices are steady at ~ $43/bbl as market participants await OPEC 2.0's Joint Ministerial Monitoring Committee decision on next month's output levels. The group is reportedly set to ease production curtailment to 7.7mm b/d starting next month from 9.7mm b/d in July. This would add to the growing concerns about the impact on oil demand of mounting COVID-19 cases in the US and in EM economies. Still, Saudi Arabia’s Energy Minister reiterated the effective cuts would be deeper as countries that overproduced in May/Jun will have to compensate with extra cuts over the coming months. Our global oil balances point to a supply deficit in 2H20. Thus, prices will recover if a correction were to occur. Base Metals: Neutral Copper prices surged by 5% since last week and have now completely recovered from the damaging COVID-19 shock – up 4% ytd. Fears of strike over wages at Antofagasta’s Zaldivar mine in Chile – following unionized workers rejection of a pay offer – and of virus-related mine disruptions in Latin America, combined with strong imports numbers out of China for the month of June supported the recent rally.9 In USD terms, Chinese imports growth recovered to 2.7% from -16.7% in May as stimulus programs start impacting the real economy (Chart 12). Precious Metals: Neutral Gold and silver prices are up 19% and 9% ytd. Silver rose to $19.5/oz as of Tuesday’s close, pushing the gold-to-silver ratio down to 93 after several weeks at ~ 100. Silver prices are supported by both safe-haven and industrial demand at the moment, which is pushing its equilibrium value higher, based on our silver price model (Chart 13). Our long Dec/20 silver futures trade is up 6.4% since inception on July 2, 2020. Ags/Softs: Underweight On Tuesday the corn market shrugged off the biggest Chinese single-day purchase of U.S. corn and the USDA’s report of a 2% decline in corn crop conditions rated good to excellent. Despite this arguable bullish news, corn prices were still down on prospects of large carryovers both this season and the next marketing year, which begins in September. Going forward, the USDA cattle on feed inventory figure as well as ethanol demand will be key to assessing the evolution of corn carryovers. Feed and residual use of corn went down in the latest WASDE report, with year-to-date cattle on feed inventory lower than 2019, due to consumer stockpiling during the pandemic. With the beginning of grilling season well on its way re-stocking will be a challenging task. Chart 12Chinese Stimulus Will Lift Import Growth
Chinese Stimulus Will Lift Import Growth
Chinese Stimulus Will Lift Import Growth
Chart 13Higher Equilibrium Value of Silver
Higher Equilibrium Value of Silver
Higher Equilibrium Value of Silver
Footnotes 1 Please see the UN’s AMIS Market Monitor for July 2020. 2 Please see World Agricultural Supply and Demand Estimates (WASDE) published by the USDA July 10, 2020. 3 Reuters reports that per the executive order signed by Trump this week, “U.S. property would be blocked of any person determined to be responsible for or complicit in ‘actions or policies that undermine democratic processes or institutions in Hong Kong.’” In addition, the order requires US officials to “revoke license exceptions for exports to Hong Kong.” Hong Kong passport holders no longer will be accorded special treatment under the order as well. Please see China vows retaliation after Trump ends preferential status for Hong Kong published by reuters.com July 14, 2020. 4 Please see Declaration of the High Representative on behalf of the European Union on the adoption by China’s National People’s Congress of a National Security Legislation on Hong Kong. This was issued by the EU July 1, 2020. 5 Please see South China Sea dispute: China's pursuit of resources 'unlawful', says US published by bbc.com July 14, 2020. See also China Pushes Back Against U.S. Statement on South China Sea Claims, ASEAN Stays Silent published by news.usni.org July 14, 2020. 6 Please see U.S. Carriers Send a Message to Beijing Over South China Sea published by foreignpolicy.com July 9, 2020. 7 In our modeling, we find that ag prices are generally less responsive to short-term changes in the US dollar compared to oil or base metals, but that they follow a common trend with the dollar over the long term. 8 These percent changes scale linearly in percentage terms, so a 10% weakening of the USD would lift the index 26%. 9 Please see Workers at Antofagasta's Zaldivar copper mine in Chile vote to strike: union published by reuters.com on July 10, 2020. Investment Views and Themes Recommendations Strategic Recommendations Tactical Trades Trade Recommendation Performance In 2020 Q2
Exogenous Risks Keep Grains, Beans On Edge
Exogenous Risks Keep Grains, Beans On Edge
Commodity Prices and Plays Reference Table Trades Closed in 2020 Summary of Closed Trades
Exogenous Risks Keep Grains, Beans On Edge
Exogenous Risks Keep Grains, Beans On Edge
Highlights The EM equity benchmark’s concentration in the top six stocks – that in turn correlate with US FAANGM – has risen substantially. Hence, the outlook for US mega-cap stocks will continue to significantly impact the EM equity benchmark. US FAANGM stocks have been closely tracking the trajectory of – and share many other similarities with – previous bubbles. Hence, it is risky to dismiss the mania thesis. That said, it is impossible to know how long this equity mania will last, how far it will go and what will trigger its volte-face. Odds of a repeat of the 2015 boom-bust cycle in Chinese equities are low. The rally in Chinese stocks and commodities might be due for a pause. Feature Concentration Risk Chart 1EM: Mega-Caps Stocks Versus The Equal-Weighted Index
EM: Mega-Caps Stocks Versus The Equal-Weighted Index
EM: Mega-Caps Stocks Versus The Equal-Weighted Index
The EM equity index's hefty gains since the late-March lows have largely been at the hands of about six stocks: Alibaba, Tencent, TSMC, Samsung, Naspers and Meituan-Dianping (Chart 1). The latter is a Chinese web-service platform company, while Naspers derives 75% of its revenue from its equity ownership in Tencent and 25% from a Russian internet company. For ease of reference, we refer to the big four (Alibaba, Tencent, Samsung and TSMC) as EM ATST. Table 1 illustrates that the top six companies combined account for about 24.3% of the MSCI EM equity market cap. For comparison, US FAANGM (Facebook, Apple, Amazon, Netflix, Google and Microsoft) account for 25% of the S&P 500 market cap. The remainder of the EM equity universe – including all Chinese, Korean and Taiwanese stocks other than the six mega caps listed above – has rallied less (Chart 1). This is very similar to the dynamics in the US equity market, where the equally-weighted index has substantially diverged from the FAANGM index (Chart 2). Table 1Market Cap Weights & Performance Since March Lows
EM Equities: Concentration And Mania Risks
EM Equities: Concentration And Mania Risks
Chart 2US: FAANGM Versus The Equal-Weighted Index
US: FAANGM Versus The Equal-Weighted Index
US: FAANGM Versus The Equal-Weighted Index
Table 2MSCI EM Stocks: Country Weights
EM Equities: Concentration And Mania Risks
EM Equities: Concentration And Mania Risks
The EM ATST’s exponential rise has also boosted their respective country weightings in the MSCI EM equity benchmark. Table 2 demonstrates that China, Korea and Taiwan together account for 65% of the EM benchmark, India for 8% and all other 22 countries combined for 27%. Note that the market cap ($1.7 trillion) of the remaining 22 countries is almost as large as the market cap of the top six EM individual stocks. On the whole, concentration in the EM benchmark is as high as ever. Apart from global trade and Chinese growth, there are two other forces that will define the direction of EM mega-cap stocks: (1) rising geopolitical tensions between the US and China, and (2) a continuous mania or bust in “new economy” stocks. We discuss the latter in the following section. Escalating tensions between the US and China, including North Korea’s potential assault on South Korea, pose risks to Chinese, Korean and Taiwanese stocks. This is one of the critical reasons why we have been reluctant to chase these markets higher, despite upgrading our outlook on Chinese growth. If these bourses relapse, their sheer weight in the EM benchmark will pull the index down. The EM equity index’s outperformance in recent weeks has been due to the surge in both EM mega-cap stocks and Chinese share prices more broadly. Bottom Line: The EM equity benchmark concentration has risen substantially due to outsized gains in several “new economy” stocks. What’s more, the EM equity index’s outperformance in recent weeks has been due to the surge in both EM mega-cap stocks and Chinese share prices more broadly (we discuss the latter below). If the global mania in “new economy” stocks persists, EM ATST could well drive the overall EM equity index higher. Conversely, if “new economy” shares roll over for whatever reason, the EM equity benchmark’s advance will reverse. A Bubble Or Not? An assessment of the sustainability of the rally in US FAANGM stocks is critical for investors in the EM equity benchmark if for no other reason than the concentration hazard. We present the following considerations in assessing whether the FAANGM and EM ATST rally is or is not a mania: First, the exponential rally in FAANGM stocks is not a new phenomenon: It has been taking place over the past 10 years. Our FAANGM index – an equal-weighted average of six stocks (Facebook, Amazon, Apple, Netflix, Google and Microsoft) – has increased 20-fold in real (inflation-adjusted) US dollar terms since January 2010. Its rise is on par with the magnitude of the bull market in the Nasdaq 100 index in the 1990s and Walt Disney in the 1960s, and well exceeds other bubbles, as illustrated in Chart 3. All price indexes on Chart 3 are shown in real (inflation-adjusted) terms. Chart 3Each Decade = One Mania
EM Equities: Concentration And Mania Risks
EM Equities: Concentration And Mania Risks
All these manias and bubbles started with excellent fundamentals, and price gains were initially justified. Toward the end of the decade, however, their outsized gains attracted momentum chasers and speculators, catapulting share prices exponentially higher. Second, a financial mania requires: (1) solid past performance; (2) a story that can capture investors’ imaginations, and (3) plentiful liquidity. The “new economy” stocks fit all of these criteria: They have delivered super-sized performance over the past 10 years; They easily capture ordinary people’s imaginations – the average person on the street knows that FAANGM and EM ATST stocks benefit from people working from home and spending more time online; The Federal Reserve and many other central banks are injecting enormous amounts of liquidity into their respective economies. Third, there is a striking similarity between the FAANGM rally and previous bubbles: The mania-subjects of the preceding decades assumed global equity leadership early in their respective decade, rose steadily throughout, and went exponential at the very end of the decade. The latest parabolic surge in FAANGM stocks along with its duration (10 years of global equity outperformance and leadership) and magnitude (20-fold price appreciation in real inflation-adjusted terms) conspicuously resembles those of previous bubbles. Interestingly, the majority of previous bubbles peaked and tumbled around the turn of each decade, the exception being Walt Disney – the Nifty-Fifty bubble of the 1960s – which rolled over in 1973. Given FAANGM stocks have been closely tracking the trajectory of previous bubbles, it will not be surprising if 2020 ends up marking the peak for “new economy” stocks. Fourth, the last exponential upleg in the tech and telecom bubble of 1999-2000 occurred amid a one-off demand surge for tech hardware and software. The Y2K scare – worries that computers and networks around the world might malfunction on the New Year/new millennium eve – spurred many companies to order new hardware and upgrade their systems and networks. As a result, there was a one-off boom in orders in the global technology industry in the fourth quarter of 1999 and first quarter of 2000. Chart 4Orders For Computers And Electronics Have Remained Resilient
Orders For Computers And Electronics Have Remained Resilient
Orders For Computers And Electronics Have Remained Resilient
Investors extrapolated this one-off demand surge into the future, mistaking it for recurring growth. As a result, they assigned extremely high valuations to these tech stocks in the first quarter of 2000. Similarly, since March, working and shopping from home has sharply increased demand for web services, online shopping, cloud computing and tech hardware. The top panel of Chart 4 demonstrates that US manufacturing orders for computers and electronic products did not contract in the March-May period, while orders for capital goods have plunged since March. Similarly, Taiwanese exports – which are heavy on tech hardware – are holding up well despite the crash in global trade (Chart 4, bottom panel). Some of this demand strength is structural, but part of it is one-off and non-recurring. Certainly, one should not extrapolate their recent growth rates into the future. However, investors are prone to extrapolation and chasing winners. Fifth, valuations of US FAANGM and EM ATST are elevated. Trailing P/E ratios for EM ATST stocks are shown in Table 3. Table 3Price-To-Earnings For Top 6 EM Stocks
EM Equities: Concentration And Mania Risks
EM Equities: Concentration And Mania Risks
All in all, provided both US FAANGM and EM ATST consist of admirable companies with great competitive advantages and business models, it is tempting to dismiss the bubble argument. Nevertheless, there are enough similarities with previous manias to compel investors to be vigilant. Even great companies have a fair price, and substantial price overshoots will not be sustainable. We sense a growing number of investors deem US FAANGM and EM ATST stocks as invincible. When some stocks are regarded as unbeatable, their top is not far. Our major theme for the past decade – elaborated in the report, How To Play EM In The Coming Decade1 published in June 2010 – has been as follows: Sell commodities / buy health care and technology. Until 2019, we were recommending being long EM tech/short EM resource stocks. Unfortunately, since 2019, the corrections in EM “new economy” stocks have proved to be too short and fleeting, and we were unable to buy-in. Their share prices have lately gone parabolic: They are now in a full-blown mania phase. As to global equity leadership change from growth to value stocks, we maintain that major leadership rotations typically occur during or at the end of an equity selloff, as we elaborated in our October 3, 2019 report (Charts 5 and 6). Chart 5EM vs DM: Leadership Rotation Requires Market Turbulence
EM vs DM: Leadership Rotation Requires Market Turbulence
EM vs DM: Leadership Rotation Requires Market Turbulence
Chart 6Growth vs Value: Leadership Rotation Requires Market Turbulence
Growth vs Value: Leadership Rotation Requires Market Turbulence
Growth vs Value: Leadership Rotation Requires Market Turbulence
Apparently, the February-March selloff did not produce a shift in equity leadership. Barring a major selloff, “new economy” stocks will likely continue to lead. Chart 7Fed Rate Cuts Did Not Prevent The S&P 500 Bubble From Unravelling
Fed Rate Cuts Did Not Prevent The S&P 500 Bubble From Unravelling
Fed Rate Cuts Did Not Prevent The S&P 500 Bubble From Unravelling
Finally, easy money policies encourage speculation and contribute to the build-up of manias. However, when a bubble starts unravelling, low interest rates are often unable to avert the bust. For example, when the tech bubble began bursting in 2000, the Fed cut rates aggressively and US bond yields plunged. Yet, low interest rates did not prevent tech share prices from deflating further (Chart 7). Bottom Line: It is impossible to know how long this equity mania will last, how far it will go and what will trigger its volte-face. One thing is certain: there is a lot of froth – particularly in terms of valuation and positioning – in these “new economy” stocks. Yet, these excesses could last longer and get larger. A Mania In Chinese Equities? Many commentators have rushed to compare the latest surge in Chinese stocks with the exponential advance in the first half of 2015. We do not think this rally will go on without interruption for another five months like it did back then. Our rationale is as follows: The Chinese authorities are much more vigilant now, and they will try to induce periodic corrections to avoid another mania and bust similar to those that occurred five years ago. The Chinese authorities are much more vigilant now, and they will try to induce periodic corrections to avoid another mania and bust similar to those that occurred five years ago. Both China’s MSCI Investable and CSI 300 equity indexes are retesting their previous highs (Chart 8). In the past they failed to break above these levels, and this time is likely to be no different, at least for now. The latest spike is more likely to be the final hurrah before a setback. Critically, the 12-month forward P/E ratio for China’s MSCI Investible index has also risen to its previous peaks (Chart 9, top panel). This has occurred with little improvement in the 12-month forward EPS (Chart 9, bottom panel). In short, share prices have run ahead of the business cycle and are already pricing in a lot of profit recovery. Chart 8Chinese Stocks Are At Their Previous Highs
Chinese Stocks Are At Their Previous Highs
Chinese Stocks Are At Their Previous Highs
Chart 9Chinese Investable Stocks: A Rally Driven By P/E Expansion
Chinese Investable Stocks: A Rally Driven By P/E Expansion
Chinese Investable Stocks: A Rally Driven By P/E Expansion
Chart 10Chinese Onshore Stocks: A Two-Tier Market
Chinese Onshore Stocks: A Two-Tier Market
Chinese Onshore Stocks: A Two-Tier Market
Most of the rally since the March lows has been due to “new economy” stocks. Share prices of “old economy” companies did not do that well before July. Tech stocks in the onshore market have gone parabolic (Chart 10, top panel). This contrasts with lackluster performance of materials, industrials, and property stocks (Chart 10, bottom panels). Critically, in the onshore market, tech stocks are trading at the following trailing P/E ratios: the market cap-weighted P/E is 155, and the median P/E is 60. Needless to say, these valuations are outright expensive. Bottom Line: Odds of a repeat of the 2015 boom-bust cycle are low. The rally in Chinese stocks might be due for a pause. On June 18, we upgraded Chinese stocks to overweight from neutral within the EM benchmark, a recommendation that remains intact. We have a much lower conviction on the absolute performance of Chinese stocks in the near-run. China And Commodities An important question to address is whether the rally in commodities in general and copper in particular are signals of a sustainable recovery in the mainland economy. Without a doubt, economic conditions in China have been improving, and infrastructure spending has been accelerating. However, the magnitude of the upswing in copper prices is excessive relative to the strength of the Chinese economy. The spike in resource prices in general and copper in particular has been due to three forces: (1) China’s unprecedented super-strong imports; (2) global investors buying commodities; and (3) output cuts. It is highly unlikely that commodity demand in China is this strong. In our opinion, this reflects restocking. Chart 11 shows that Chinse imports of copper and copper products surged by 100% in June from a year ago, while imports of steel products increased by 100% and oil import volumes rose by 34%. It is highly unlikely that commodity demand in China is this strong. In our opinion, this reflects restocking. Provided cheap credit availability, wholesalers, intermediaries or users of commodities have rushed to buy before prices rise further. In the case of copper, it will take several months before the real economy absorbs that much of the red metal. Hence, China’s copper imports are poised to relapse in the coming months. Chart 12 illustrates that investors’ net long positions in copper have risen to their highest level since early 2019. Consistently, the July Bank of America/Meryl Lynch Global Fund Manager Survey revealed that as of early July, portfolio managers had built up their largest net long positions in commodities since July 2011. Not only oil but also copper and iron ore prices have benefitted from production declines. Due to surging COVID infections, Chile and Peru have sharply reduced copper output and Brazil has curtailed iron ore production. Chart 11Chinese Imports Of Commodities Have Surged
Chinese Imports Of Commodities Have Surged
Chinese Imports Of Commodities Have Surged
Chart 12Investors Have Gone Long Copper
Investors Have Gone Long Copper
Investors Have Gone Long Copper
Simultaneous buying of commodities by China and global investors as well as production cuts have considerably benefited resource prices as of late. Our suspicion is that commodities inventories in China have become elevated. This entails reduced purchases by China, and by extension an air pocket in commodities prices in the months ahead. Bottom Line: The rally in resources in general and copper in particular is at risk of a correction. We remain long gold/short copper. Investment Strategy In absolute terms, the risk-reward of EM share prices is not attractive. However, as we have argued in the past two months, FOMO (fear-of-missing-out) mania forces could take share prices higher. The timing of a reversal is never easy especially when a FOMO-driven mania is alive. For now, for asset allocators we reiterate a below-benchmark allocation in EM stocks within a global equity portfolio. However, a breakdown in the trade-weighted US dollar will prompt us to upgrade EM within the global equity benchmark (Chart 13). The broad trade-weighted dollar is teetering on an edge but has not yet broken down (Chart 14). In sum, global equity portfolios should be ready to upgrade their EM allocation to neutral on signs that the broad trade-weighted US dollar is breaking down. Chart 13EM vs DM: Is The Downtrend Intact?
EM vs DM: Is The Downtrend Intact?
EM vs DM: Is The Downtrend Intact?
Chart 14The Broad Trade-Weighted Dollar Is On An Edge
The Broad Trade-Weighted Dollar Is On An Edge
The Broad Trade-Weighted Dollar Is On An Edge
As we argued last week, the US dollar could weaken against DM currencies amid the next selloff in global share prices. This is why last week we switched our short positions in an EM currency basket from the US dollar to an equally-weighted basket of the euro, the Swiss franc and Japanese yen. This strategy remains valid. The US dollar is at risk versus DM currencies. However, EM exchange rates may not be out of the woods, given their poor fundamentals on the one hand and potential geopolitical risks in North Asia on the other. We are neutral on both EM local currency bonds and EM sovereign and corporate credit. Arthur Budaghyan Chief Emerging Markets Strategist arthurb@bcaresearch.com Footnotes 1 Please see Emerging Markets Strategy Special Report "How To Play EM In The Coming Decade," dated June 10, 2010. Equities Recommendations Currencies, Credit And Fixed-Income Recommendations
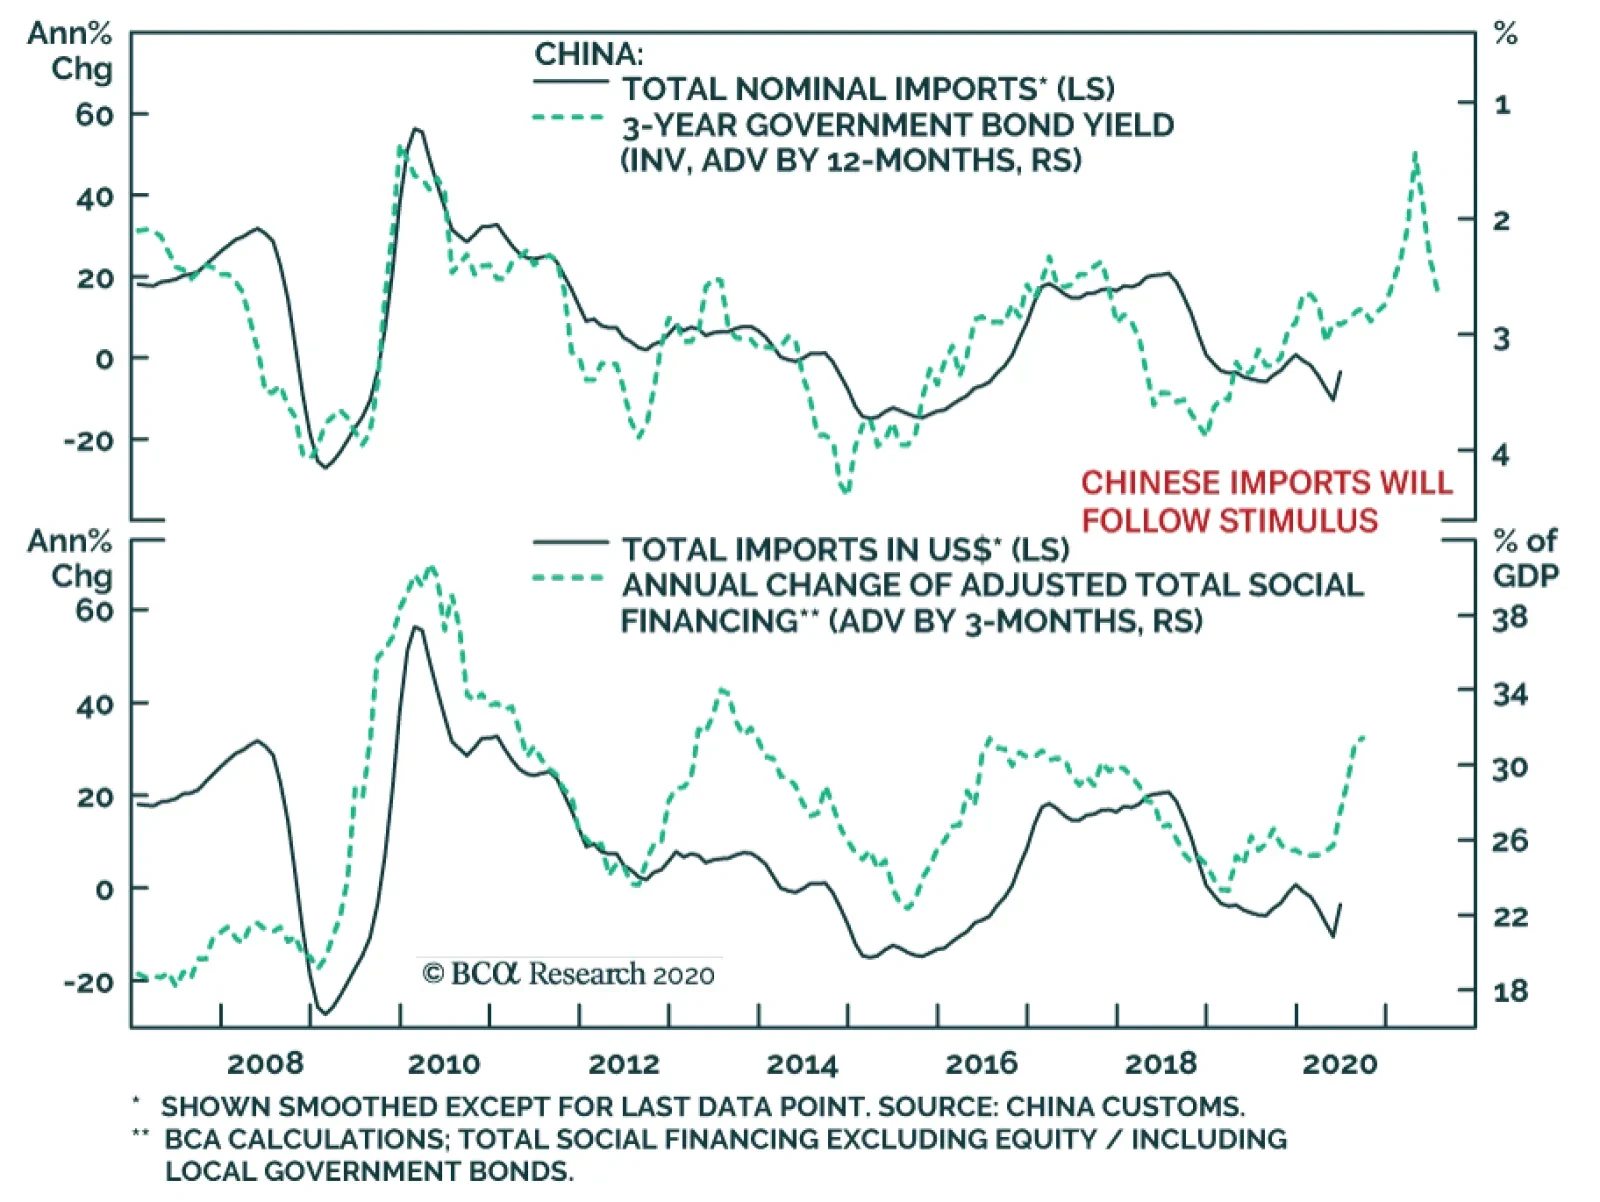
China’s June trade numbers offered some hope for the global economy. In USD terms, the annual growth rate of exports rebounded to 0.5% from -3.3% last May. Imports’ growth recovered to 2.7% from -16.7%. Shipments of masks and medical supplies supercharged…
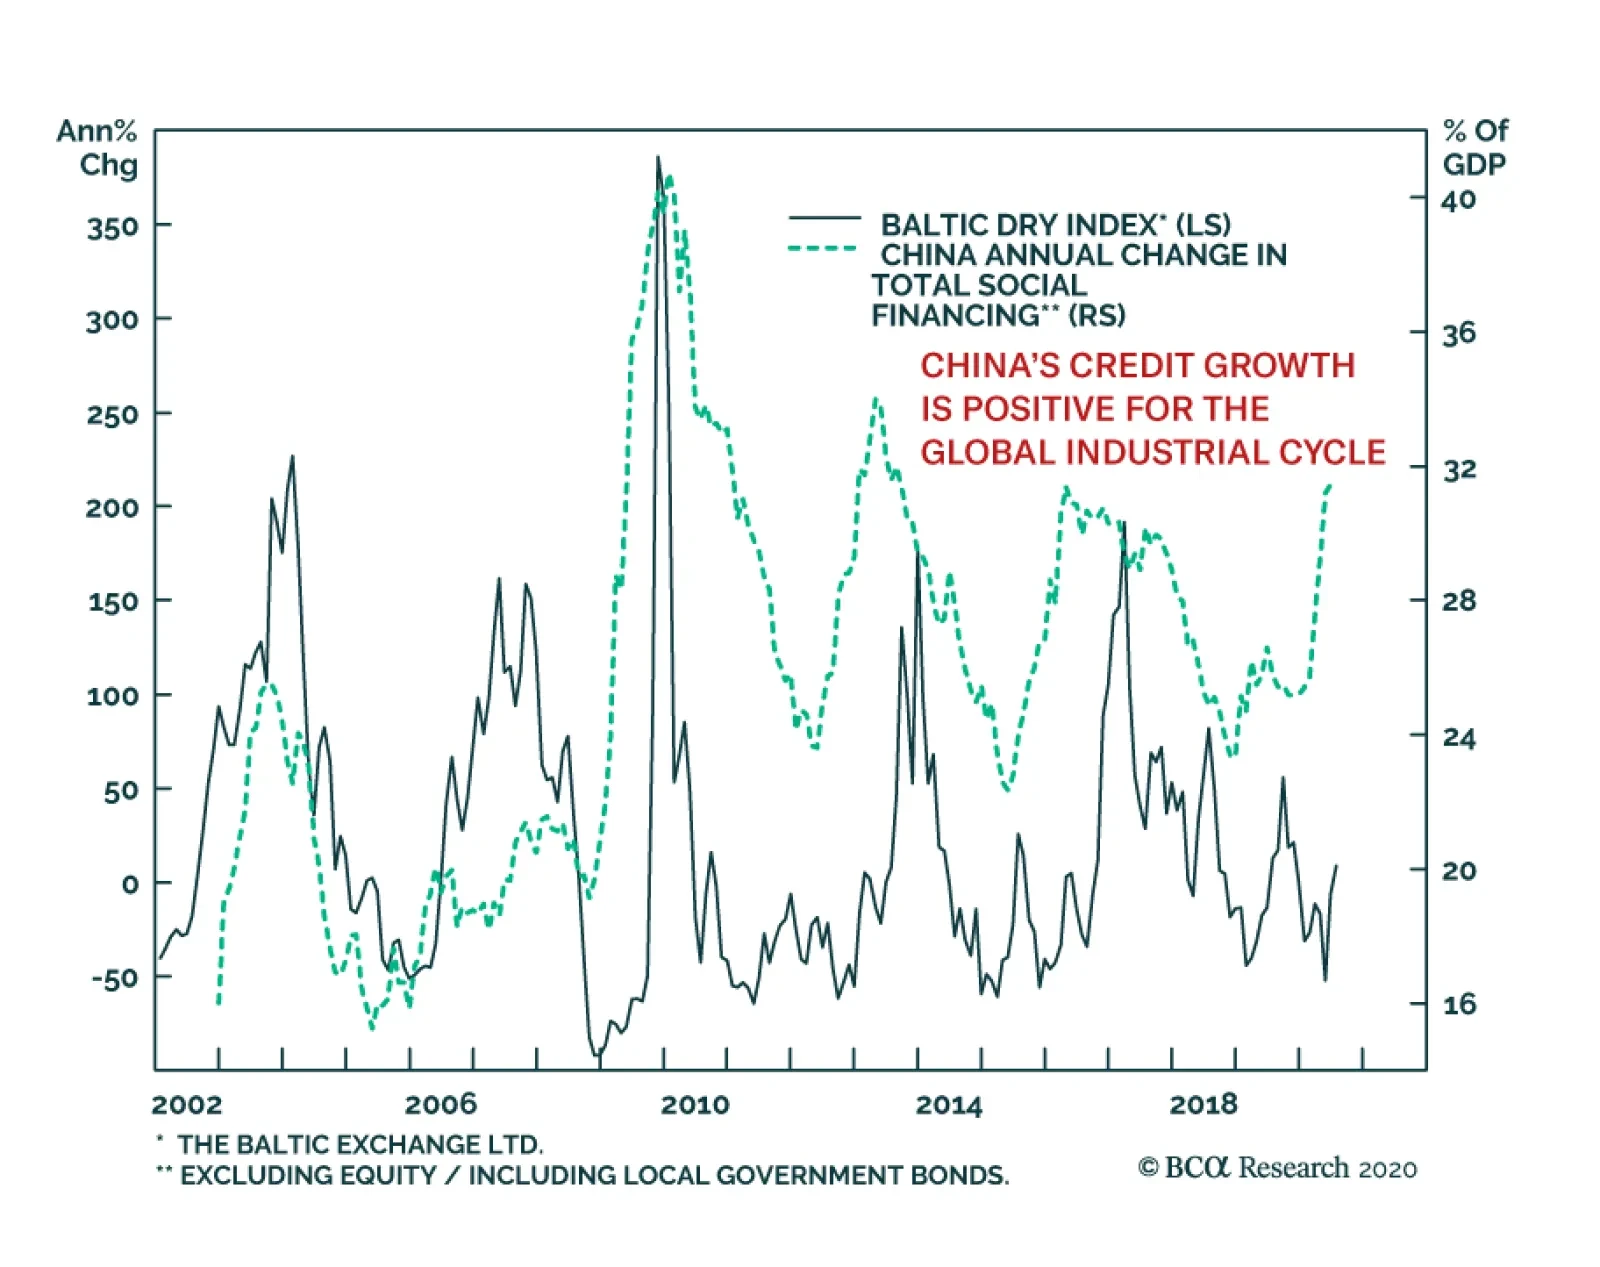
China’s credit growth remains strong. In June, new loans hit CNY1.8 trillion, bringing new bank lending to CNY12.1 trillion for the first half of 2020, which beats the previous peak of CNY9.7 trillion recorded in H1 2019. Total social financing (which…
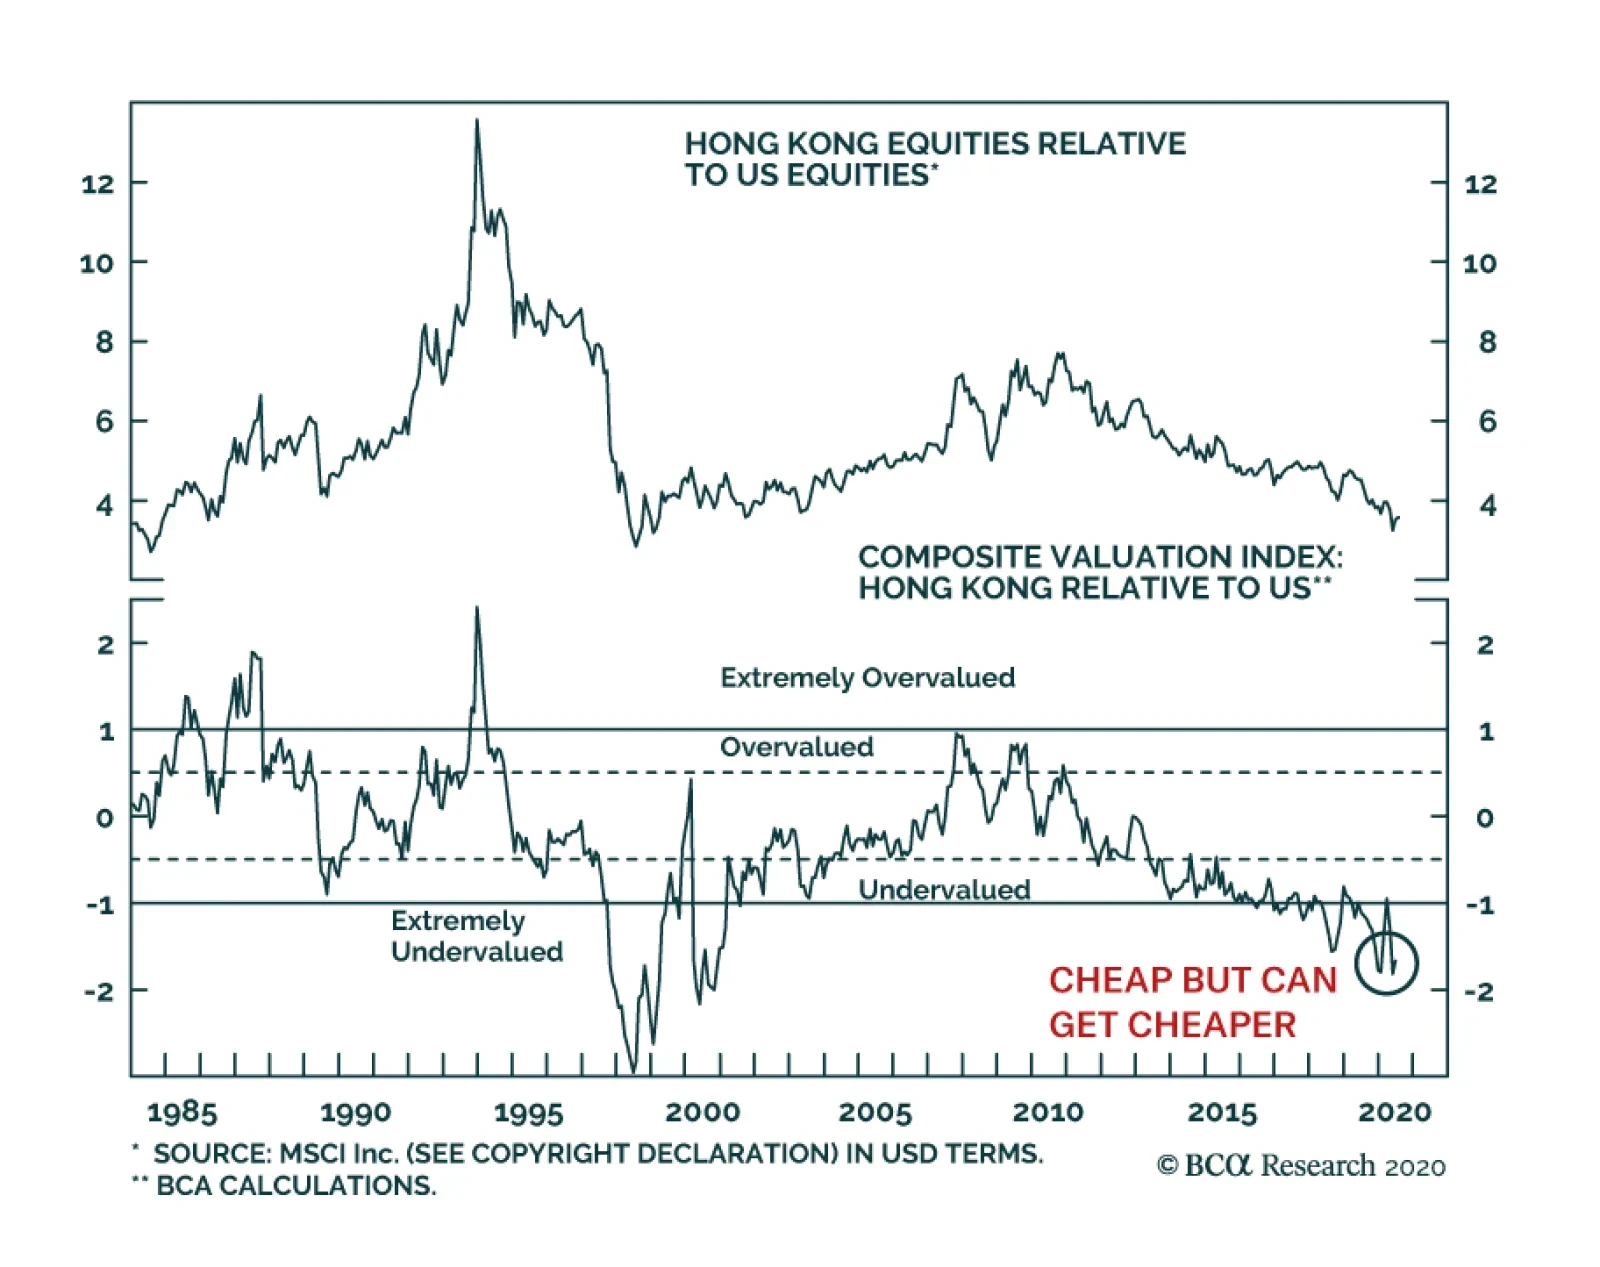
The growing incursion of Beijing into the governance of Hong Kong is accentuating the woes of a stock market already hurt by its heavy exposure to financials. As a result, investors are increasingly questioning the relevance of Hong Kong as a global financial…
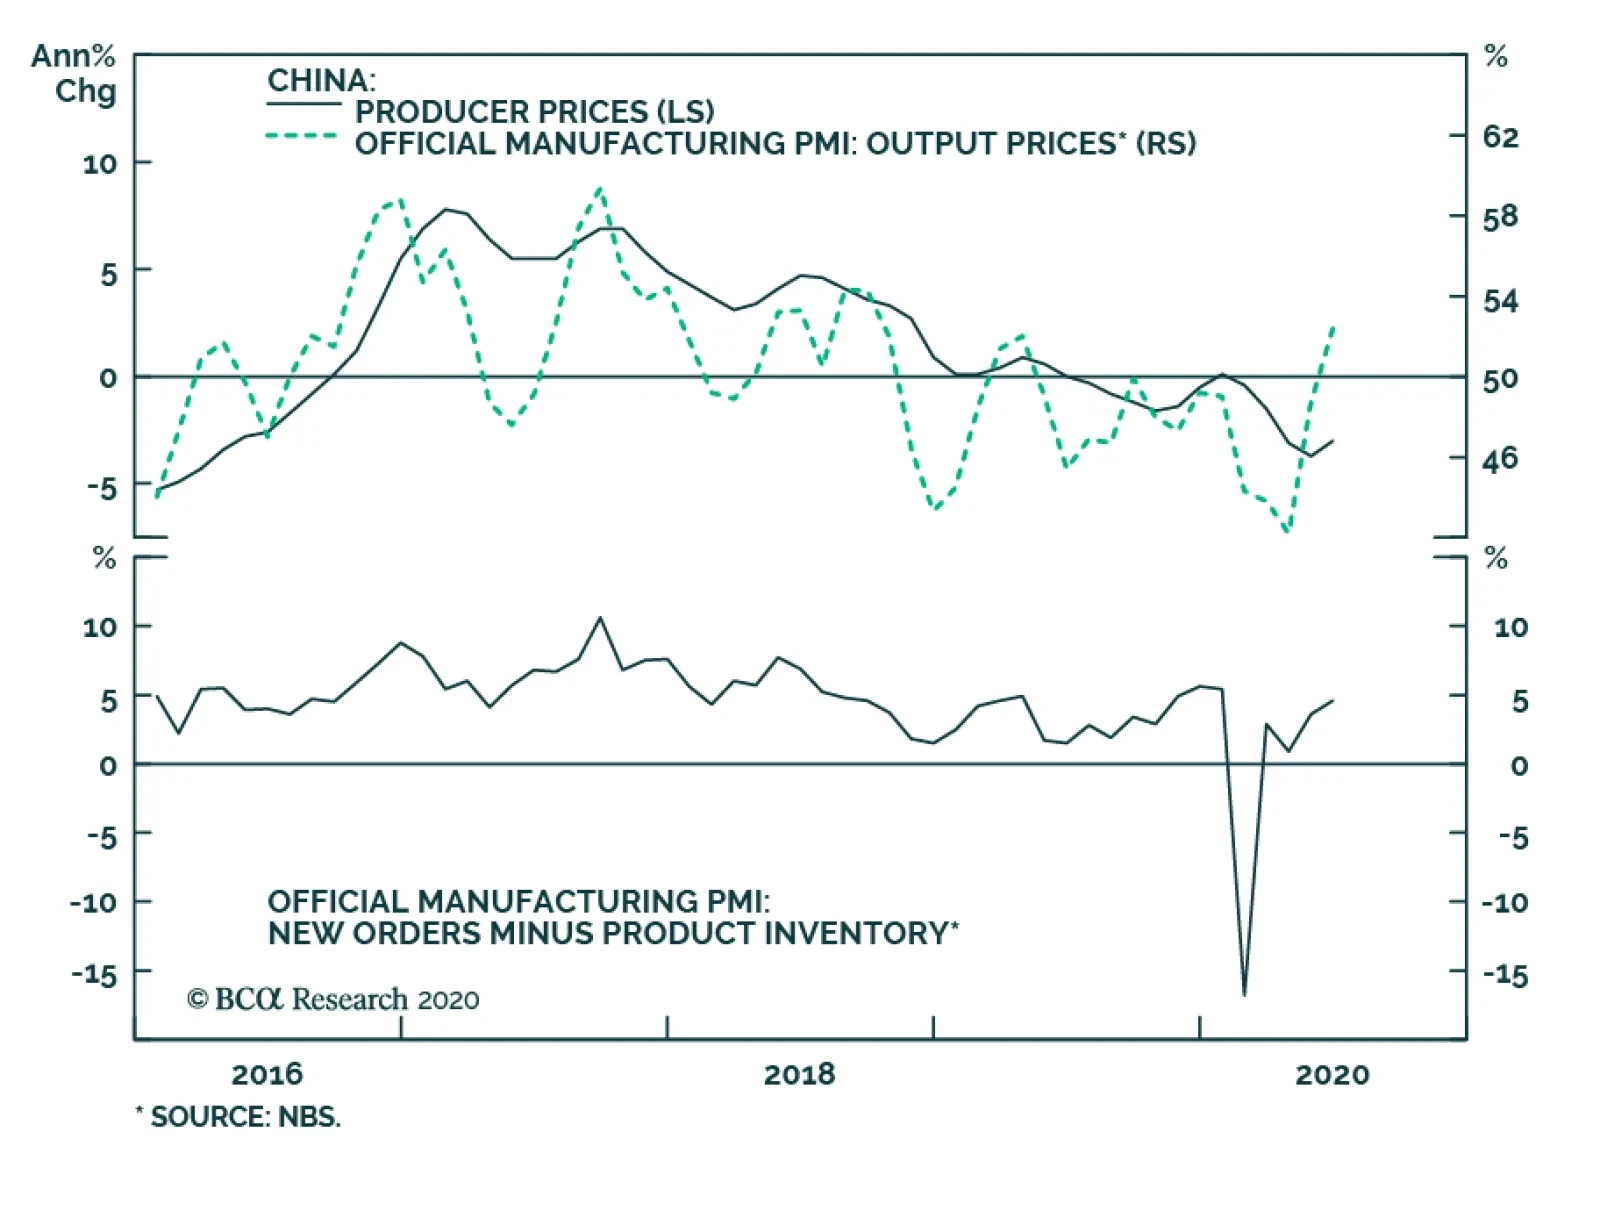
China’s official manufacturing PMI ticked up to 50.9 in June from 50.6 in the previous month. The Caixin manufacturing PMI came in at 51.2 in June vs. 50.7 in May and beat the market expectation of 50.5. Both readings suggest that China’s manufacturing sector…
Feature Over the last several years when I travelled to Europe, I would meet with Ms. Mea, an outspoken client of the Emerging Markets Strategy service. We have published our conversations with Ms. Mea in the past and this semi-annual series has complemented our regular reports. She has challenged our views and convictions, serving as a voice for many other clients. In addition, these conversations have highlighted nuances of our analysis, for her and to the benefit of our readers. With travel restrictions in force, this time we had to resort to an online meeting with Ms. Mea. Below are the key parts of our conversation from earlier this week. Ms. Mea: Let’s begin with your main thesis, which over the past several years has been as follows: China’s growth drives EM business cycles and financial markets overall. Indeed, as long as China’s growth dithers, EM growth and asset prices languish. However, since the pandemic started China has stimulated aggressively and there are clear signs that the economy is recovering. The latest surge in Chinese share prices confirms that a robust recovery is underway. Why do you not think China’s economy is on the upswing? Answer: True, we believe China’s business cycle is instrumental to EM economies’ growth and balance of payments. We upgraded our outlook for Chinese growth in our May 28 report as the National People’s Congress set the objective for monetary policy in 2020 to significantly accelerate the growth rate of broad money supply and total social financing relative to last year. Indeed, broad money growth as well as both private and public credit have accelerated since April and will continue to increase (Chart I-1). Domestic orders have also surged though export orders are still languishing (Chart I-2). Chart I-1China: Money And Credit Will Continue Accelerating
China: Money And Credit Will Continue Accelerating
China: Money And Credit Will Continue Accelerating
Chart I-2China: Improvement In Domestic Orders But Not In Export Ones
China: Improvement In Domestic Orders But Not In Export Ones
China: Improvement In Domestic Orders But Not In Export Ones
That said, financial markets, including the ones leveraged to China, have run ahead of fundamentals and a pullback is overdue. We have been waiting for such a setback to turn more positive on EM risk assets and currencies. Further, the snapback in business activity following the lockdown should not be confused with an economic expansion. As economies around the world reopened, business activity was bound to improve. Were any asset markets priced to reflect months or a whole year of closures? Even at the nadir of the global equity selloff in late March, we do not think risk assets were priced for extended lockdowns. The Chinese economy will likely eventually experience a robust expansion later this year but the nearterm outlook for global risk assets and commodities remains risky. In our view, the rally in global stocks and commodities has been much stronger than is warranted by the near-term economic conditions in a majority of economies around the world. In short, we have not been surprised at all by the economic data that has emerged since economies have reopened, but we have been perplexed by the markets’ response to these data. Even in China, which is ahead of all other countries in regards to the reopening and normalization of business activity, the level and thrust of economic activity remains worrisome. Specifically: China's manufacturing PMI new orders and the backlog of orders sub-components remain below the neutral 50 line (Chart I-3). The imports subcomponent of the manufacturing PMI has shown signs of peaking below the 50 line, portending a risk to industrial metals prices (Chart I-4). Chart I-3China Manufacturing PMI: Measures Of Orders Are Still Below 50
China Manufacturing PMI: Measures Of Orders Are Still Below 50
China Manufacturing PMI: Measures Of Orders Are Still Below 50
Chart I-4A Yellow Flag For Commodities
A Yellow Flag For Commodities
A Yellow Flag For Commodities
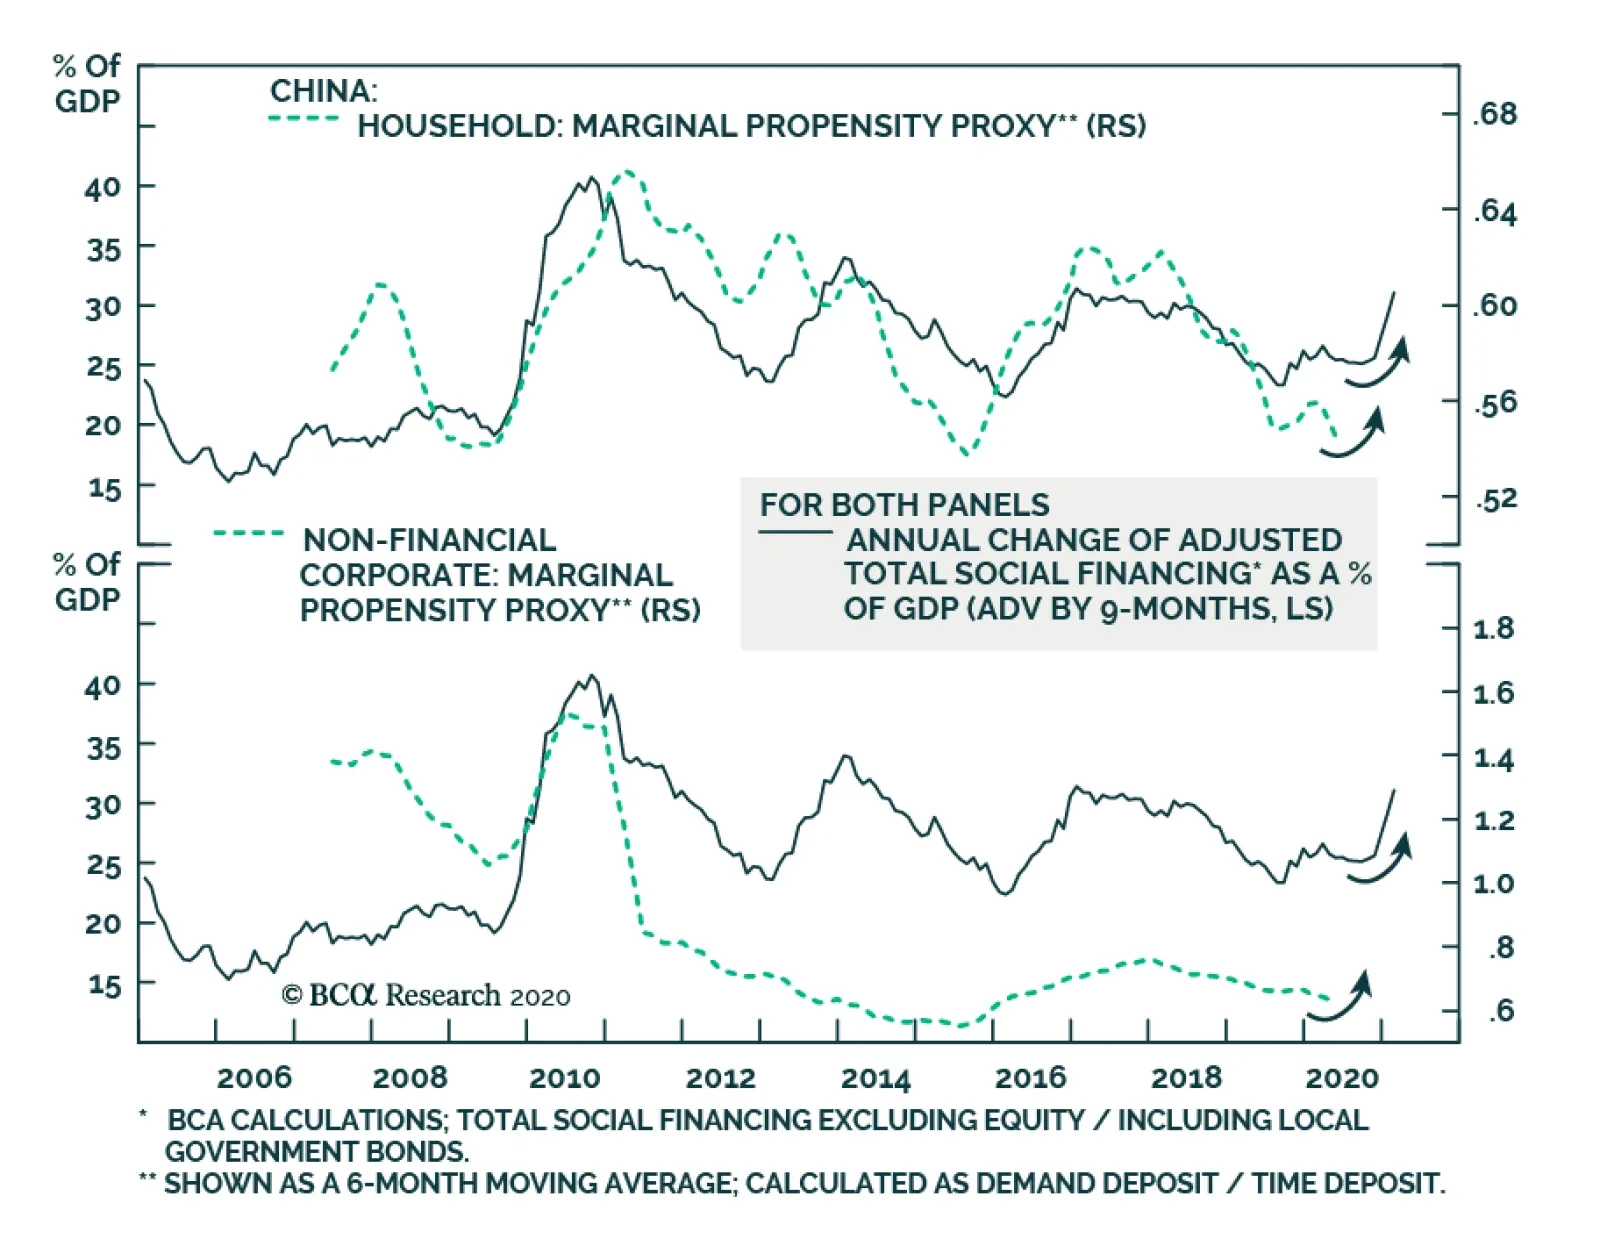
Marginal propensity to spend for both enterprises and households continues to trend lower (Chart I-5). These gauge the willingness of consumers and companies to spend and, hence, reflect the multiplier effect of the stimulus. These indicators contend that the multiplier so far remains low/weak. Finally, with the exception of new economy stocks (such as Ali-Baba and Tencent) that have been exceptionally strong worldwide, Chinese share prices leveraged to capital expenditure and consumer discretionary spending had not been particularly strong before last week, as illustrated in Chart I-6. Chart I-5Marginal Propensity To Spend Among Chinese Households And Enterprises
Marginal Propensity To Spend Among Chinese Households And Enterprises
Marginal Propensity To Spend Among Chinese Households And Enterprises
Chart I-6Chinese Stocks Had Been Languishing Till Late Outside New Economy Ones
Chinese Stocks Had Been Languishing Till Late Outside New Economy Ones
Chinese Stocks Had Been Languishing Till Late Outside New Economy Ones
In a nutshell, the Chinese economy will likely eventually experience a robust expansion later this year but the near-term outlook for global risk assets and commodities remains risky. As to EM risk assets, the key risk to our stance is a FOMO-driven rally buoyed by the “visible hand” of governments. Ms. Mea: What is your interpretation of the latest policy push in China for higher share prices? Is it also a part of the “visible hand” of government? Don’t you think this could create another strong multi-month run like it did in early 2015? Answer: Yes, this is one of many instances of the “visible hand” of governments around the world. It is not clear why Beijing is boosting investor sentiment and explicitly promoting higher share prices given how badly similar efforts in 2015 ultimately ended. At the moment, we can only speculate that one or several of the following reasons are behind this move: Beijing is preparing for an escalation in the US-China geopolitical confrontation ahead of the US presidential elections. This latter is highly probable in our opinion.1 To limit the impact of this confrontation on their economy, they want to ensure that the stock market remains in an uptrend. The same can be said for the US authorities. Apparently, the “visible hands” of both Washington and Beijing have and will continue to push share prices higher in their domestic markets. Robust equity markets will become a prominent feature of the geopolitical confrontation between the US and China. In the long run, however, this is a very negative phenomenon for the world because the two of the largest and most prominent stock markets could increasingly be driven by the “visible hand” of their governments rather than by fundamentals. As a result, equity markets could regularly send wrong price signals and will no longer serve as an efficient mechanism of capital allocation. Chart I-7Foreign Inflows Into China Have Accelerated This Year
Foreign Inflows Into China Have Accelerated This Year
Foreign Inflows Into China Have Accelerated This Year
Beijing has been luring foreign investors to buy onshore stocks and bonds and this strategy has become more vital in expectation of an escalation in the US-China confrontation. Chart I-7 shows that net inflows into onshore stocks and bonds have been surging. The more US investors buy into mainland markets, the more these investors will exercise pressure on the current and future US administrations to go soft on China. Like those US companies relying on Chinese demand, large US investment funds will have a notable exposure to Chinese financial markets and will accordingly lobby the White House and Congress to take a less adversarial stance toward China. This will reduce the maneuvering room of US politicians in this geopolitical confrontation. Finally, it is also possible that these latest media reports encouraging a bull market in China were not initiated by leaders in Beijing but were in fact spurred by mid-level bureaucrats. If that is the case, a full-blown mania akin to the one in 2015 will not be repeated and the latest frenzy surrounding Chinese stocks could end up being the final surge before a correction sets in. In brief, Chinese stocks, like other bourses worldwide, are in a FOMO-driven mania that might last for a while. Nevertheless, regardless of the direction of Chinese stocks in absolute terms, we reiterate our overweight stance on Chinese equities within the EM benchmark. Also, we have a strong conviction with respect to the merits of a long Chinese/short Korean stocks trade. Both these positions were initiated on June 18 before the latest surge in Chinese stocks. The “visible hands” of both Washington and Beijing have and will continue to push share prices higher in their domestic markets. Ms. Mea: What will it take for you to go long EM risk assets and currencies in absolute terms? Answer: EM equities, credit markets and currencies are driven by three, or more recently four, factors. We need to witness or foresee an imminent improvement in three out of four of these to go outright long. These factors include: (1) China’s business cycle and its impact on EM via global trade; (2) each individual EM country’s domestic fundamentals (inflation/deflation, balance of payments, return on capital, domestic economic cycles, monetary and fiscal policies, health of the banking system, domestic politics, etc.); (3) global risk-on and risk-off cycles that drive portfolio flows into EM. The direction of the S&P500 is an important trendsetter for these risk-on and risk-off cycles; (4) swings in geopolitical confrontation between the US and China. The first element – China’s impact on EM – is becoming positive. There could be a minor setback in mainland business cycles in the near term, but this should be used as a buying opportunity. As to structural problems in China like credit/money and property bubbles as well as the misallocation of capital, ongoing money and credit growth acceleration will fill in holes and kick the can down the road. That said, those structural problems will become even more challenging in the years to come. In short, Beijing is making credit, money and property bubbles even bigger. The second factor – domestic fundamentals in EM ex-China, Korea and Taiwan – remain downbeat. The COVID-19 outbreak has been out of control in a number of EM economies (Chart I-8). In addition, outside of China, Korea and Taiwan, EM fiscal stimulus has not been as large as in DM economies. Critically, the monetary transmission mechanism has been broken in several developing economies. In particular, central banks’ rate cuts have not translated to lower lending rates in real terms (Chart I-9). Chart I-8The COVID-19 Pandemic Has Not Peaked In Several Major EM Economies
The COVID-19 Pandemic Has Not Peaked In Several Major EM Economies
The COVID-19 Pandemic Has Not Peaked In Several Major EM Economies
Chart I-9Lending Rates Are Still High In EM ex-China, Korea And Taiwan
Lending Rates Are Still High In EM ex-China, Korea And Taiwan
Lending Rates Are Still High In EM ex-China, Korea And Taiwan
The basis is two-fold: First, banks saddled with non-performing loans are reluctant to bring down their lending rates and lend more; and second, the considerable decline in EM inflation has pushed up real lending rates (Chart I-9). The third variable driving EM financial markets – the S&P 500 – remains at risk of a material setback. If the S&P drops more than 10 or 15%, EM stocks, currencies and credit markets will also sell off markedly. Finally, there is the fourth aspect of the EM view – geopolitics – which could be critical in the coming months. The US-China confrontation will likely heighten leading up to the US elections. This will likely involve North and South Korea and Taiwan. Chart I-10EM ex-China, Korea And Taiwan: Stocks And Currencies
EM ex-China, Korea And Taiwan: Stocks And Currencies
EM ex-China, Korea And Taiwan: Stocks And Currencies
Chinese investable stocks as well as Korean and Taiwanese equities altogether make up 65% of the MSCI EM benchmark. Hence, a flareup in geopolitical tensions will weigh on these three bourses. Outside these markets, EM share prices and currencies have already rolled over (Chart I-10). In sum, out of the four factors listed above only the Chinese business cycle warrants an upgrade on overall EM. The other three drivers of the EM view are still negative. This keeps us on the sidelines for now. Importantly, we have been gradually moving our investment strategy from bearish to neutral on EM. Specifically, we: Took profits on the long EM currencies volatility trade on March 5. Took large profits on the long gold / short oil and copper trade on March 11. Booked gains on the short position in EM stocks on March 19. Recommended receiving long-term (10-year) swap rates (or buying local currency bonds while hedging the exchange rate risk) in many EMs on April 23. Upgraded EM sovereign credit from underweight and booked profits on our short EM corporate and sovereign credit / long US investment grade bonds strategy on June 4. The only asset class where we have not yet closed our shorts is EM currencies. In fact, we now recommend shifting our short in EM currencies (BRL, CLP, ZAR, TRY, KRW, PHP and IDR) from the US dollar to an equal-weighted basket of the Swiss franc, the euro and the Japanese yen. Unlike the March selloff, the dollar could depreciate even if the S&P 500 and global stocks drop. Ms. Mea: What is the rationale behind switching your short positions in EM currencies against the US dollar to short positions versus the Swiss franc, the euro and Japanese yen? Wouldn’t the selloff in global stocks drive the greenback higher? Answer: We have been bullish on the US dollar since 2011, consistent with our negative view on EM and commodities prices and recommendation of favoring the S&P 500 versus EM. What is making us question this strategy are the following, in order of importance: First, the Federal Reserve is monetizing US public and some private debt. The amount of US dollars is surging. Meanwhile, the pace of broad money supply growth is much more timid in the euro area, Switzerland and Japan. Broad money growth is 23% in the US, 9% in the euro area, 2.5% in Switzerland, 5% in Japan and 11% in China. This will reduce investors’ willingness to hold dollars as a store of value, incentivizing them to switch to other DM currencies. Second, the pandemic is out of control in the US and this will damage its near-term growth outlook. More fiscal stimulus and more debt monetization will be required to revive the economy. Third, the Fed will not hike interest rates even if inflation rises well above their 2% target in the next several years. This implies that the Fed will prefer to be behind the inflation curve in the years to come, which is bearish for the greenback. Finally, the yen and the euro as well as EM currencies are cheaper than the US dollar (Chart I-11 and Chart I-12). Chart I-11The US Dollar Is Expensive, The Yen Is Cheap
The US Dollar Is Expensive, The Yen Is Cheap
The US Dollar Is Expensive, The Yen Is Cheap
Chart I-12EM ex-China, Korea And Taiwan: Currencies Are Cheap
EM ex-China, Korea And Taiwan: Currencies Are Cheap
EM ex-China, Korea And Taiwan: Currencies Are Cheap
The broad trade-weighted US dollar has yet to break down as per the top panel of Chart I-13, but we are becoming nervous about it. Unlike the March selloff, the dollar could depreciate even if the S&P 500 and global stocks drop. Ms. Mea: That is interesting. Has there ever been an episode where the US dollar depreciated while the S&P 500 sold off? Answer: Yes, it occurred in late 2007 and H1 2008. The 2007-08 bear market in global stocks can be split into two periods. During the initial phase of that bear market, the US dollar depreciated substantially despite the drawdowns in global equity and credit markets (Chart I-14, top and middle panels). Chart I-13Trade-Weighted Dollar And Asian Currencies: At A Critical Juncture
Trade-Weighted Dollar And Asian Currencies: At A Critical Juncture
Trade-Weighted Dollar And Asian Currencies: At A Critical Juncture
Chart I-14In Late 2007 And H1 2008: The US Dollar Fell Amid An Equity Bear Market
In Late 2007 And H1 2008: The US Dollar Fell Amid An Equity Bear Market
In Late 2007 And H1 2008: The US Dollar Fell Amid An Equity Bear Market
EM stocks performed in line with DM ones during the first phase (Chart I-14, bottom panel). The economic backdrop was characterized by the US recession and US banks tightening credit. In fact, EM growth was still robust during that phase even though the US economy was shrinking. Remarkably, commodities prices were surging – oil reached $140 per a barrel and copper $4 per ton in June 2008. The second phase of that bear market commenced in autumn of 2008 when Lehman went bust. The orderly bear market in global stocks gave way to an acute phase – a crash in all global risk assets. Business activity collapsed worldwide and the US dollar surged. In the current cycle, the order will likely be the reverse of the 2007-08 bear market. March 2020 witnessed a crash in global risk assets and the global economy plunged similar to the second phase of the 2007-08 bear market while the US dollar surged. The second stage of this recession could resemble the first phase of the 2007-08 bear market. There will be neither worldwide lockdowns nor a crash in business activity. However, the level of activity might struggle to recover as rapidly as markets have priced in or there might be relapses in economic conditions in certain parts of the world. This is especially true for the US and other countries where the pandemic has not been effectively contained. On the whole, the second downleg in the S&P 500 and global stocks will be less dramatic but could last for a while and still be meaningful (more than 10-15%). Critically, unlike the March 2020 selloff, the greenback will likely struggle during this episode for the reasons we outlined above. Ms. Mea: What about overweighting EM equities and credit versus their DM peers? Will EM equities, credit and currencies underperform their DM peers in the potential selloff that you expect? Wouldn’t USD weakness help EM risk assets to outperform even in a broad risk selloff? Answer: Yes, we can see a scenario where EM stocks and credit markets perform in line or better than their DM peers in a potential selloff. The key is the dollar’s dynamics. If the dollar rebounds, EM stocks and credit markets will underperform their DM counterparts. If the dollar weakens during this selloff, EM stocks and credit will likely perform in line with or better than their DM peers. In sum, a technical breakdown in the broad trade-weighted dollar and a breakout in the emerging Asian currency index – both shown in Chart I-13 – would lead us to upgrade our EM allocation in both global equity and credit portfolios. For now, we are only switching our shorts in EM currencies from the US dollar to an equally-weighted basket of the Swiss franc, the euro and the Japanese yen. Ms. Mea: What are some of your other current observations on financial markets? Answer: The breadth and thrust of this global equity rally has already peaked and is weakening. It is just a matter of time before a narrowing breadth translates into lower aggregate stock indexes for both EM and DM equities as illustrated by our advance-decline lines in Chart I-15. Chart I-15EM and DM Equity Breadth Measures Have Rolled Over
EM and DM Equity Breadth Measures Have Rolled Over
EM and DM Equity Breadth Measures Have Rolled Over
Chart I-16Cyclicals And High-Beta Stocks Have Been Struggling
Cyclicals and High-Beta Stocks Have Been Struggling
Cyclicals and High-Beta Stocks Have Been Struggling
Consistently, there has already been a decoupling between various sectors and industries. The rally has been solely focused on tech and new economy stocks. Equity prices in China and Taiwan have been surging while the rest of the EM equity index has been languishing. In the DM equity space, global industrials, US high-beta stocks and micro caps have already rolled over (Chart I-16). Further, our Risk-On/Safe-Haven currency index is flashing red for EM equities (Chart I-17). Chart I-17A Red Flag For EM Equities?
A Red Flag For EM Equities?
A Red Flag For EM Equities?
Chart I-18Long Gold / Short Stocks
Long Gold / Short Stocks
Long Gold / Short Stocks
Finally, EM share prices have outperformed DM stocks since late May mostly due to the sharp rally in Chinese, Korean and Taiwanese stocks. Hence, the breadth of EM equity outperformance has been subdued. Ms. Mea: To wrap up our conversation, I want to ask you what is your strongest conviction trade for the coming months? Answer: Our strongest conviction trade is long gold / short global or EM stocks (Chart I-18). This trade will do well regardless of the direction of global share prices, the US dollar, and bond yields. Arthur Budaghyan Chief Emerging Markets Strategist arthurb@bcaresearch.com Footnotes 1 Please see Geopolitical Strategy Special Report "Watch Out For A Second Wave (Of US-China Frictions)," dated June 10, 2020, available at gps.bcaresearch.com Equities Recommendations Currencies, Credit And Fixed-Income Recommendations
BCA Research's China Investment Strategy service concludes that although the intensity of the PBoC’s monetary easing may start to taper in H2, the central bank is likely to stay on the easing course and keep liquidity conditions ample. Bank lending to the…
Dear Client, In lieu of our regular report next week, I will present our view on China’s economic recovery, geopolitical risks, and implications on financial markets in two live webcasts. The webcasts will take place next Wednesday, July 15 at 10:00AM EDT (English) and at 9:00PM EDT (Mandarin). Best regards, Jing Sima, China Strategist Highlights China’s economic recovery continues through June, but the pace of its demand-side recovery has been more muted compared to the V-shaped rebound in 2009. The intensity of the PBoC’s monetary easing may start to taper in H2, but the central bank is likely to stay on the easing course and keep liquidity conditions ample. Bank lending to the corporate sector should increase further in H2. Chinese stocks rallied through last week’s enactment of the new national security law for Hong Kong and the subsequently announced sanctions from the US government. The existing US sanctions should have limited impact on Hong Kong and mainland China’s economies and financial markets. We remain positive on Chinese stocks despite the recent rallies in China’s equity markets. Feature June’s official and Caixin manufacturing PMIs indicate that China’s economic recovery continues at a steady rate, with the production side of the economy picking up slightly faster than the demand side. The drag on China’s economic recovery from lackluster demand growth should be temporary. Unlike in 2015 when policy uncertainties hindered the recovery in both economic activity and stock prices, the Chinese government has been determined to support its economy and job market in the current cycle. The massive stimulus implemented since March has tremendously boosted activities in China’s construction sector. While households and the corporate sector remain reluctant to spend and to invest, their marginal propensity to spend usually catches up with credit growth with about a 6-9-month lag (Chart 1). The sharp pickup in credit growth should meaningfully support China’s economic rebound, while a better global growth outlook in H2 should also provide some modest tailwinds. On June 30, the PBoC announced a 0.25 percentage point cut to its relending rates for small and rural enterprises and to its general rediscount rate. While the scale of rate cuts in H2 will unlikely match that of Q1, China’s monetary and fiscal policy support will remain in place through the rest of the year. Chinese investable and domestic equities were some of the best performers among global asset classes in June, whereas they were the third-worst the month prior (Chart 2). In the first week of July, both Chinese investable and domestic stocks rallied even further. As we noted in our last week’s report,1 China’s stronger economic outlook, less uncertainty related to its domestic COVID-19 containment, and policy support should provide more room for Chinese stocks to trend upwards. Last week’s passing of the new national security law for Hong Kong and the subsequently announced sanctions from the US government, in our view, should have limited impact on investors’ sentiment for now. Chart 1China's Household And Corporate Marginal Propensities Lag The Credit Impulse By 6-9 Months
China's Household And Corporate Marginal Propensities Lag The Credit Impulse By 6-9 Months
China's Household And Corporate Marginal Propensities Lag The Credit Impulse By 6-9 Months
Chart 2Chinese Equities Are Taking Flight
China Macro And Market Review
China Macro And Market Review
Tables 1 and 2 present key developments in China’s economic and financial market performance in the past month, and we highlight several of these developments below: Table 1China Macro Data Summary
China Macro And Market Review
China Macro And Market Review
Table 2China Financial Market Performance Summary
China Macro And Market Review
China Macro And Market Review
China’s June official manufacturing PMI ticked up to 50.9 from 50.6 in the previous month. The Caixin manufacturing PMI came in at 51.2, beating the expectation of 50.5 and compared to 50.7 in May. Both suggest that China’s manufacturing sector continues to expand, however the pace of its demand-side recovery has been more muted compared to the V-shaped rebound in 2009 (Chart 3). Although the import and export subcomponents have fared better in June from the low levels in April and May, their readings in June were still below the 50 boom-bust line (Chart 4). Headwinds remain strong for global trade as the US and many of emerging economies are still struggling with the pandemic. Even without re-imposing lockdowns, the resurge in the number of new cases in the US may result in a drag on consumption and global trade. The IMF projects a 12% contraction in global trade in 2020. While the external demand may improve in H2, positive contribution to China's GDP growth from the net exports will be limited this year. Chart 3Current Recovery Lies Somewhere Between 2009 And 2015
Current Recovery Lies Somewhere Between 2009 And 2015
Current Recovery Lies Somewhere Between 2009 And 2015
Chart 4Demand-Side Recovery Remains Muted
Demand-Side Recovery Remains Muted
Demand-Side Recovery Remains Muted
The employment situation in the manufacturing sector has worsened since May, and has returned to contraction following a brief improvement in March and April (Chart 5). An estimated 8.7 million new graduates in 2020,2 a historical high number, will hit the job market in July and August. As such, China’s labor market will likely remain under significant pressure. Even though employment usually lags economic recoveries, depressed expectations on the job market will refrain policymakers from prematurely withdrawing stimulus measures. Small and micro enterprises are an important part of China’s private sector, which provides 80% of jobs in China. The manufacturing PMI of small enterprises fell below the 50 boom-bust line in June, reflecting a persistent weakness in this part of China’s economy. The recent relending and rediscount rate cuts suggest that the PBoC is committed to stay on the easing course. The intensity of monetary easing may start to taper in H2, but the central bank is likely to keep liquidity conditions ample and encourage banks to accelerate lending to the corporate sector. The contraction in Chinese producer prices deepened to -3.7% (year-over-year) in May. However, we think PPI deflation is likely to bottom in Q3. Both the purchasing and producer price subcomponents of the manufacturing PMI ticked up sharply in June, while the drawdown in industrial product inventory relative to new orders has accelerated (Chart 6). The ongoing accommodative policy should provide powerful tailwinds to both economic activity and the PPI in H2. The improvement in the PPI will help to boost industrial profits growth, which turned positive in May (year-over-year) for the first time this year. We expect year-to-date industrial profits to end the calendar year with a modest positive growth rate. Chart 5Labor Market Pressure Intensifies
Labor Market Pressure Intensifies
Labor Market Pressure Intensifies
Chart 6PPI Deflation Nears Its Bottom
PPI Deflation Nears Its Bottom
PPI Deflation Nears Its Bottom
China’s property market indicators have notably trended up in May, with year-over-year growth in housing demand normalizing to its pre-pandemic level (Chart 7A & Chart 7B). As the demand in housing rebounded faster than the supply, housing prices have correspondingly turned the corner in May after trending down for 6 consecutive months. Chart 7AHousing Prices Ticked Up Slightly Following A Sharp Fall In Q1
Housing Prices Ticked Up Slightly Following A Sharp Fall In Q1
Housing Prices Ticked Up Slightly Following A Sharp Fall In Q1
Chart 7BStrong Rebound In Property Investments
Strong Rebound In Property Investments
Strong Rebound In Property Investments
Chart 7B shows that housing investments and land purchases have also recovered to near their pre-pandemic levels. Financing restrictions for property developers that were put in place since 2018 have been loosened in H1, which helped to boost real estate investments. We expect the property sector financing conditions to remain accommodative through the rest of this year. Moreover, there is a possibility that the PBoC will lower the 5-year MLF (medium lending facility) rate in Q3. As downward pressures on China's labor market and household income growth intensify, the government is likely to lower the mortgage rate to ease payment constraints on households. Chart 8Chinese Stocks Rallied Through Frictions Over Hong Kong
Chinese Stocks Rallied Through Frictions Over Hong Kong
Chinese Stocks Rallied Through Frictions Over Hong Kong
Despite the passing of China’s new and controversial national security law for Hong Kong on June 30 and the subsequently announced sanctions from the US government, stock prices in both China’s onshore and offshore markets rallied (Chart 8). While we agree the US may impose further and more concrete sanctions on China during the months leading up to the November US presidential election, our preliminary assessment points to a limited economic cost on China from the existing US sanctions. The removal of Hong Kong’s special trade status will subject Hong Kong’s export goods to the same tariffs the US levies on Chinese exports. But the raised tariffs will barely make a dent in Hong Kong or mainland China’s export status quo. Hong Kong’s economy consists mainly of the financial, logistical and services sectors. The manufacturing sector only accounts for 1% of its overall economy. Chart 9 shows that Hong Kong’s exports to the US only accounted for around 1% of its total exports and 1.3% of its GDP in 2019. More importantly, of the $5 billion goods Hong Kong exports to the US, only 10% is actually produced in Hong Kong. Most of Hong Kong's exports to the US are goods produced in China that are re-exported through Hong Kong, which are already subject to the same tariffs as the goods China exports to the US directly.3 On the other hand, US exports to Hong Kong accounts for 2% of its total exports, with a trade surplus of about $30 billion in the past two years (Chart 9, bottom panel). The US trade surplus with Hong Kong has drastically reduced since the US-China trade war broke out in 2018, suggesting that the US has already imposed restrictions on its export goods to mainland China through Hong Kong. Moreover, the large trade surplus with Hong Kong as well as China’s commitment to the Phase One trade deal may be part of the reason President Trump is unwilling to impose more substantial sanctions on China right now. The US senate and house have also passed a bill which, if signed and implemented by President Trump, will allow the US government to levy any foreign financial institutions for knowingly conducting business with individuals who are involved in jeopardizing Hong Kong’s autonomy. Chinese banks with operations in the US will be mostly exposed to such sanctions. However, Chinese banks are largely domestic-focused with very low reliance on foreign-currency funding (Chart 10). Hence, the direct impact of a deteriorating operating environment in the US will be limited on Chinese banks. Chart 9Trade Sanctions On Hong Kong Exports Have A Minimum Impact On Its Local Economy
Trade Sanctions On Hong Kong Exports Have A Minimum Impact On Its Local Economy
Trade Sanctions On Hong Kong Exports Have A Minimum Impact On Its Local Economy
Chart 10Chinese Banking Sector Stock Performance Is Largely Driven By Domestic Policy Factors
Chinese Banking Sector Stock Performance Is Largely Driven By Domestic Policy Factors
Chinese Banking Sector Stock Performance Is Largely Driven By Domestic Policy Factors
Qingyun Xu, CFA Senior Analyst qingyunx@bcaresearch.com Jing Sima China Strategist jings@bcaresearch.com Footnotes 1 Please see China Investment Strategy Weekly Report "Upgrading Chinese Stocks To Overweight," dated July 1, 2020, available at cis.bcaresearch.com 2 iiMediaReport, Analysis report on current situation and development trend of Chinese employment entrepreneurship market in 2020. 3 Please see Nicholas Lardy, “Trump’s latest move on Hong Kong is bluster”. Peterson Institute For International Economies, dated June 1, 2020. Cyclical Investment Stance Equity Sector Recommendations
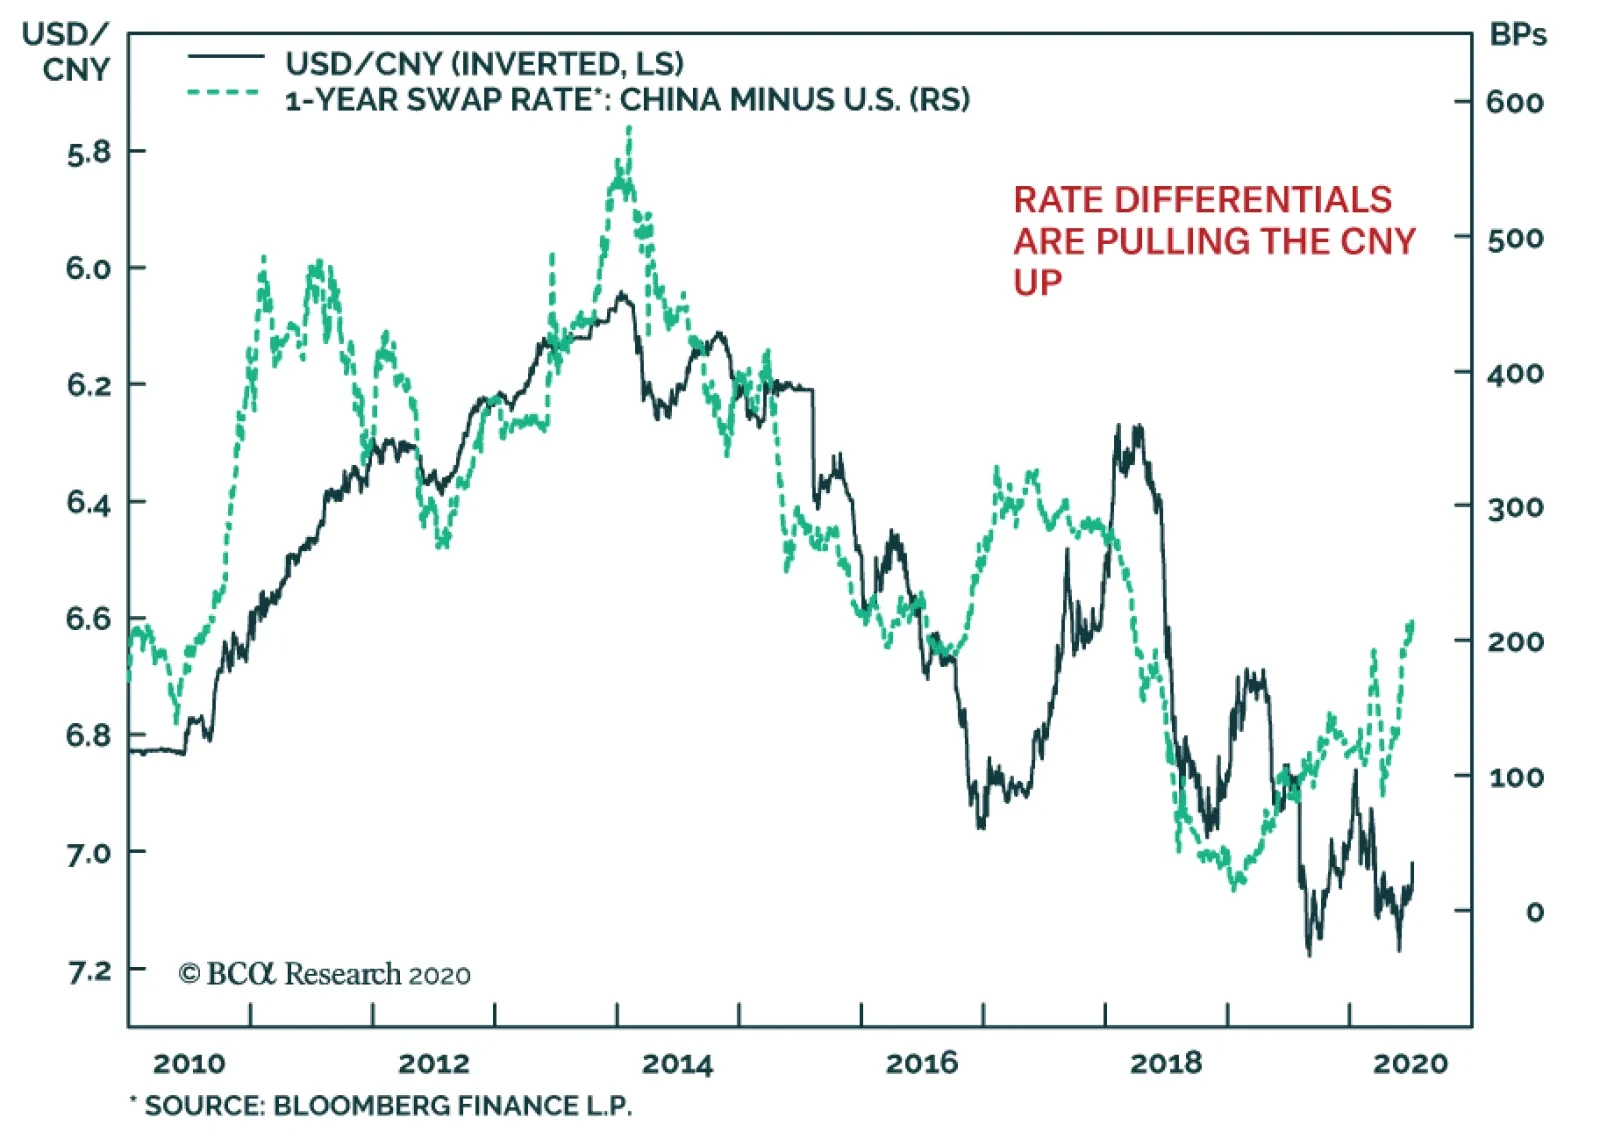
Since March 2018, the Chinese yuan has been driven by geopolitical forces, specifically, the evolution of tariffs imposed by the US on China’s exports. In recent weeks, financial variables seem once again to drive the CNY’s fluctuations. The muted US…