Asia
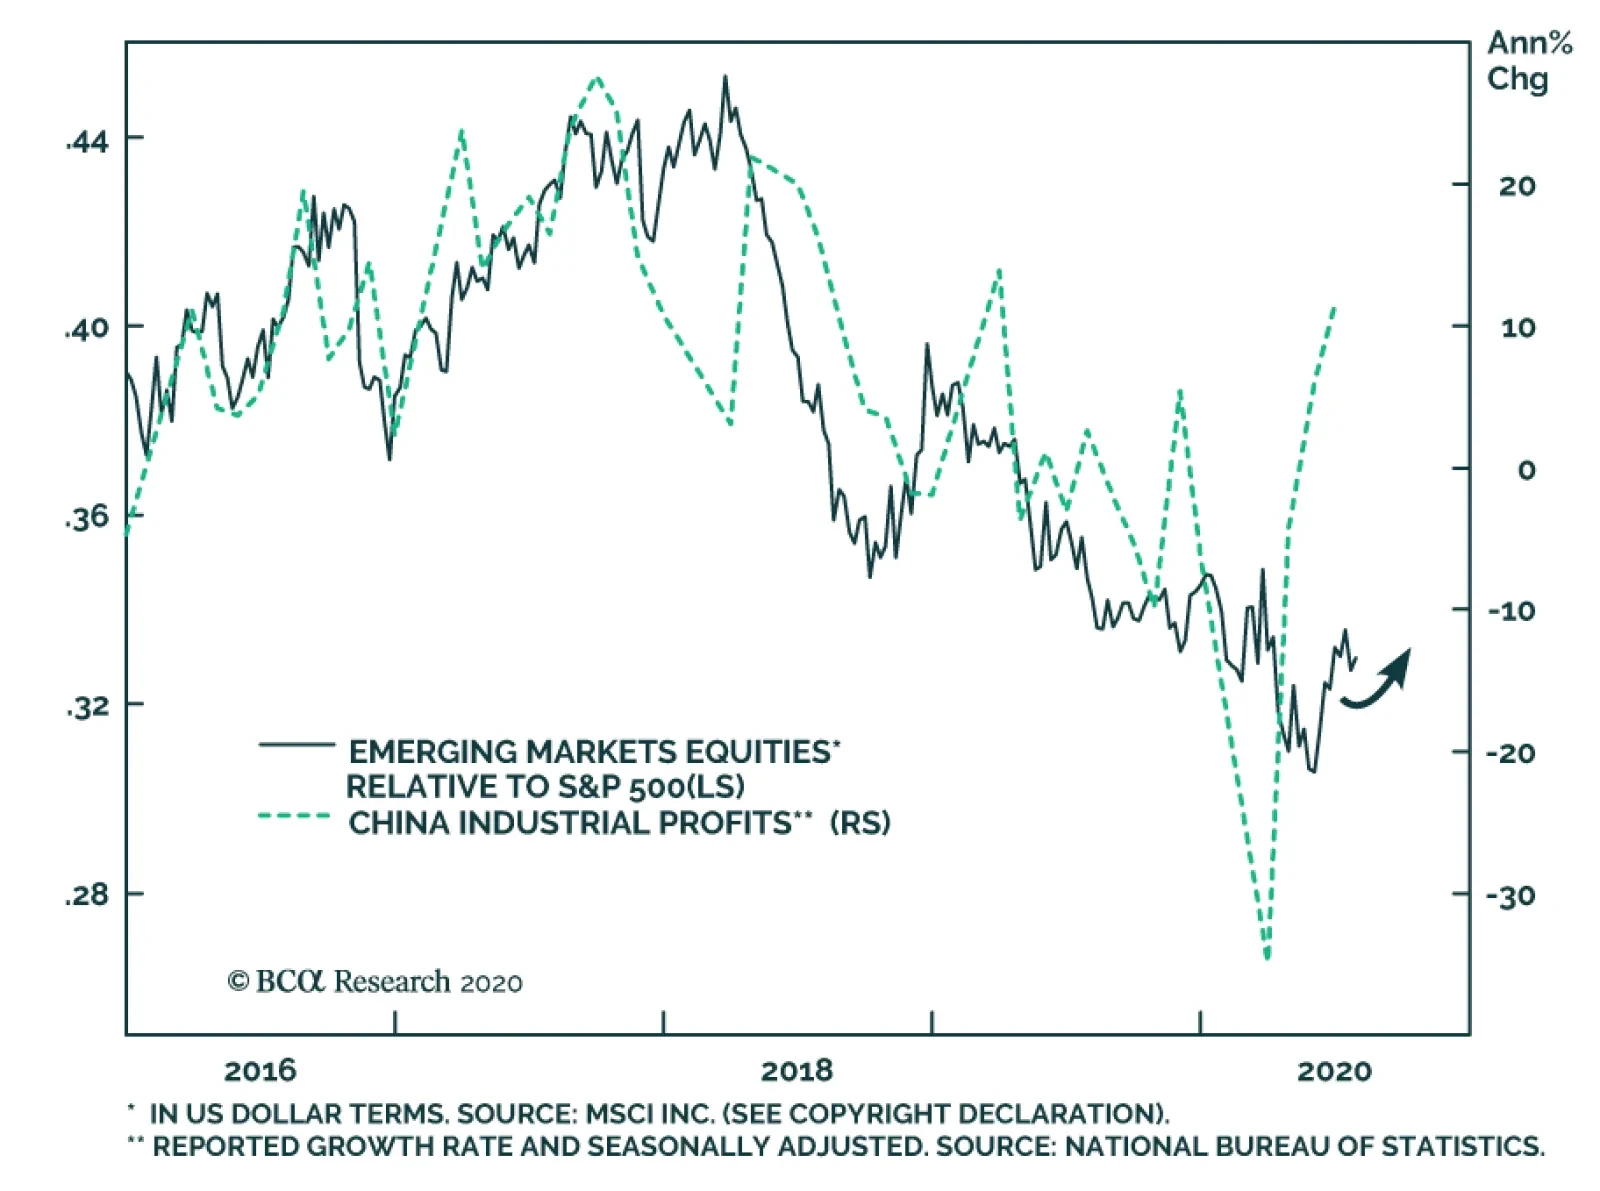
In June, China’s industrial profits growth continued to recover, rising from a 6% annual pace to an 11.5% one. For the past four and a half years, strengthening Chinese industrial profits growth aligns with an outperformance of EM equities relative to US…
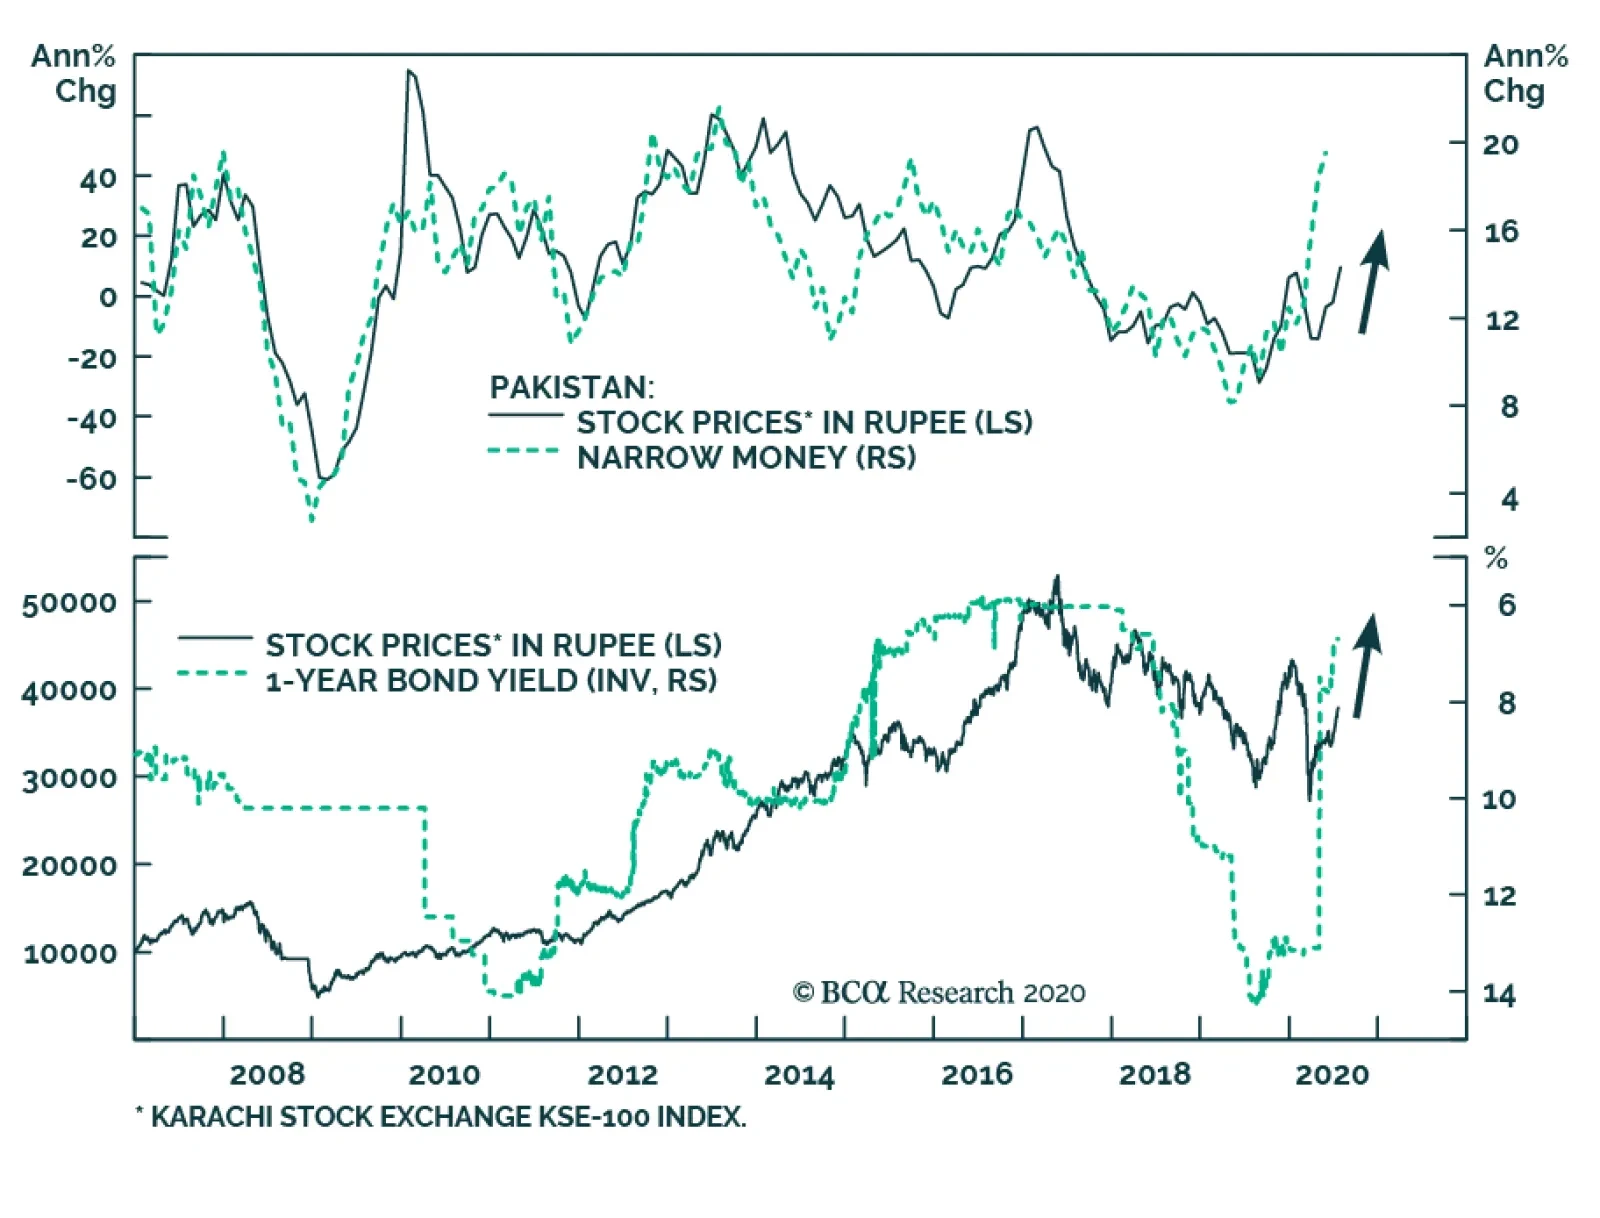
BCA Research's Emerging Markets Strategy service recommends buying Pakistani equities in absolute terms and overweighting this bourse within the emerging markets space. Pakistani stock prices in US dollar terms are currently 20% lower than their January…

Highlights The EU’s €750 billion fiscal package, along with another round of US stimulus likely exceeding $1 trillion, will support global oil demand. On the supply side, OPEC 2.0’s production discipline likely holds, and US shale output will remain depressed. These fundamentals, along with a weakening USD, will continue to support Brent prices, which are up 129% from their lows in April. China’s record-setting crude-oil-import surge during the COVID-19 pandemic – averaging 12.7mm b/d in 1H20, up 28.5% y/y – is at risk of slowing in 2H20, as domestic storage fills. Supply-side risks are acute: Massive OPEC 2.0 spare capacity – which could exceed 6mm b/d into 2021 – will tempt producers eager to monetize these to boost revenue. On the demand side, COVID-19 infection rates are surging in the US. Progress on vaccines notwithstanding, politically intolerable public-health risks in big consuming markets could usher in demand-crushing lockdowns again. Economic policy uncertainty remains elevated globally, but the balance of risks continues to favor the upside: We expect 2H20 Brent prices to average $44/bbl, and 2021 prices to average $65/bbl, unchanged from last month’s forecast. Feature We are marginally lifting our forecast of average 2020 Brent prices to $43/bbl, with 2H20 expected to average $44/bbl, and $65/bbl next year, unchanged from June. Marginal improvements to preliminary supply and demand estimates earlier in the COVID-19 pandemic support the thesis that fundamentals will not derail the massive oil-price rally that lifted Brent 129% from its April 21 low of $19.30/bbl. A weakening US dollar, and the expectation this trend will continue, also is supportive to commodities in general, oil in particular. As a result, we are marginally lifting our forecast of average 2020 Brent prices to $43/bbl, with 2H20 expected to average $44/bbl, and $65/bbl next year, unchanged from June (Chart of the Week). The three principal oil-market data providers – the US EIA, IEA and OPEC – raised demand estimates at the margin for 1H20, particularly for 2Q20, the nadir for global oil consumption. The EIA’s estimate for 2Q20 demand shows an upward revision of 550k b/d from last month’s estimate. On the supply side, the EIA estimates global output fell -8.1mm b/d in 2Q20, a -300k b/d downward revision vs. its estimate from last month (Chart 2). Chart of the WeekOil Price Rally Remains Intact
Oil Price Rally Remains Intact
Oil Price Rally Remains Intact
Chart 2OPEC 2.0, US Shale Production Cuts Deepen
OPEC 2.0, US Shale Production Cuts Deepen
OPEC 2.0, US Shale Production Cuts Deepen
We continue to expect the drawdown in storage levels to flatten – and then backwardate – the forward curves for Brent and WTI. After accounting for this better-than-expected fundamental performance, we now expect global supply to fall 5.9mm b/d in 2020 and to increase 4.2mm b/d in 2021. On the demand side, we now expect 2020 demand to fall 8.1mm b/d vs. 8.9mm b/d last month, and for 2021 demand to rise 7.8mm b/d vs 8.5mm b/d in June (Chart 3). This will keep the physical deficit we’ve been forecasting for 2H20 and 2021 in place, allowing OECD storage to fall to 3,026mm barrels by year-end and to 2,766mm barrels by the end of next year (Chart 4). Chart 3Supply-Demand Balances Tighten ...
Supply-Demand Balances Tighten ...
Supply-Demand Balances Tighten ...
Chart 4... Leading To Deeper Storage Draws ...
... Leading To Deeper Storage Draws ...
... Leading To Deeper Storage Draws ...
We continue to expect the drawdown in storage levels to flatten – and then backwardate – the forward curves for Brent and WTI (Chart 5). One caveat, though: We are watching floating storage levels closely, particularly in Asia: The current structure of the Brent forwards does not support carrying floating inventory, but it’s been slow moving lower (Chart 6). This could reflect a slowing in China’s crude-oil import surge, which hit record levels in May and June. Chart 5... And More Backwardation In Brent And WTI Forwards ...
... And More Backwardation In Brent And WTI Forwards ...
... And More Backwardation In Brent And WTI Forwards ...
Chart 6… Even As Floating Storage In Asia Remains Elevated
Balance Of Oil-Price Risk Remains To The Upside
Balance Of Oil-Price Risk Remains To The Upside
China’s Crude-Import Binge Ending? There is a non-trivial risk China’s crude-buying binge during the COVID-19 pandemic, which supported prices during the brief Saudi-Russian market-share war in March and the collapse in global demand in 2Q20, may have run its course (Chart 7).1 At the depths of the global pandemic in 2Q20, China’s year-on-year (y/y) crude imports surged 15%. According to Reuters, China’s crude oil imports totaled 12.9mm b/d in June, a record level for the second month in a row.2 Much of this was converted to refined products – chiefly gasoline and diesel fuel – as China’s demand recovered from the global pandemic (Chart 8). China’s 208 refineries can process 22.3mm b/d of crude, according to the Baker Institute at Rice University in Houston.3 Refinery runs in June were estimated at just over 14mm b/d by Reuters. Chart 7China's Crude Import Binge Stalls
China's Crude Import Binge Stalls
China's Crude Import Binge Stalls
Chart 8China's Refiners Lift Runs As Imports Surge
China's Refiners Lift Runs As Imports Surge
China's Refiners Lift Runs As Imports Surge
A reduction in China’s crude imports would force barrels to either remain on the water until refiners find a need for it, or demand for refined products increases in the region. China imports its oil into 59 port facilities, which can process ~ 16mm b/d. Storage is comprised of 74 crude oil facilities holding ~ 706mm barrels, and 213 refined-product facilities with capacity to hold ~ 357mm barrels of products (Map 1). By Reuters’s count, ~ 2mm b/d of crude went into storage in the January-May period, while close to 2.8mm b/d was stored in June. Official storage data is a state secret, so it is not possible to determine whether China’s crude and product storage is full. However, if crude oil imports remain subdued – and floating storage in Asia remains elevated – we would surmise the Chinese storage facilities are close to full. Additionally, any sharp and sustained increase in refined product exports would indicate storage is brimming. Map 1Baker Institute China Oil Map
Balance Of Oil-Price Risk Remains To The Upside
Balance Of Oil-Price Risk Remains To The Upside
A reduction in China’s crude imports would force barrels to either remain on the water until refiners find a need for it, or demand for refined products increases in the region. We expect the latter condition to obtain, in line with our expectation of a global recovery in demand, even though China remains out of sync with the rest of the world presently. China was the first state to confront the pandemic and first to emerge out of it; its trading partners still are in various stages of recovery (Chart 9). Chart 9China's Demand Recovery Likely Will Be Choppy
China's Demand Recovery Likely Will Be Choppy
China's Demand Recovery Likely Will Be Choppy
OPEC 2.0’s Remains Sensitive To Demand Fluctuations OPEC 2.0’s leaders – the Kingdom of Saudi Arabia (KSA) and Russia – also managed to secure additional “compensation” cuts from members that have missed their targets in previous months. The asynchronous recovery in global oil demand poses a unique problem for OPEC 2.0 this year and next. OPEC 2.0 will be easing production curtailments to 7.7mm b/d beginning in August from 9.6mm b/d in July, on the advice of its Joint Ministerial Monitoring Committee (JMMC). This is a decision that will be closely monitored, amid rising concern over the speed of demand recovery in the US and EM economies, due to mounting COVID-19 cases (Chart 10). The surge in US infections relative to its trading partners is of particular concern, given the size of US oil demand (Chart 11). In 2H20, we expect US demand will account for close to 20% of global demand, much the same level it was prior to the pandemic (Table 1). Chart 10COVID-19 Infections Surge In The US
Balance Of Oil-Price Risk Remains To The Upside
Balance Of Oil-Price Risk Remains To The Upside
Chart 11US COVID-19 Infections Are A Risk To Global Commodity Demand
Balance Of Oil-Price Risk Remains To The Upside
Balance Of Oil-Price Risk Remains To The Upside
Table 1BCA Global Oil Supply - Demand Balances (MMb/d, Base Case Balances)
Balance Of Oil-Price Risk Remains To The Upside
Balance Of Oil-Price Risk Remains To The Upside
OPEC 2.0’s leaders – the Kingdom of Saudi Arabia (KSA) and Russia – also managed to secure additional “compensation” cuts from members that have missed their targets in previous months, bringing the actual increase in production closer to 1-1.5mm b/d. Together, Iraq, Nigeria, Kazakhstan, and Angola, over-produced versus their May and June targets by ~ 760k b/d. In our balances estimates, as is our normal practice, we haircut these estimates and use a lower compliance level that those stated in the official OPEC 2.0 agreement. In the case of these producers, we assume they will compensate for ~ 70% of their overproduction, bringing the adjusted cuts to ~ 8.3mm b/d. This should be sufficient to maintain the current supply deficit in oil markets that continues to support Brent prices above $40/bbl. However, the reliance on laggards’ extra cuts to balance markets adds instability. There is a lot of supply on the sidelines from the OPEC 2.0 cuts and the restart of the Neutral Zone shared by Saudi Arabia and Kuwait. The JMMC is continually assessing supply-demand balances and remains focused on making sure the totality of the cuts does not fall on a small group of countries. It reiterated its position that “achieving 100% conformity from all participating Countries is not only fair, but vital for the ongoing rebalancing efforts and to help deliver long term oil market stability.” In June, OPEC 2.0’s overall compliance was 107% – mostly reflecting over-compliance from KSA, the UAE, and Kuwait.4 There is a lot of supply on the sidelines from the OPEC 2.0 cuts and the restart of the Neutral Zone shared by Saudi Arabia and Kuwait. The US EIA estimates that within the original OPEC cartel spare capacity will average close to 6mm b/d this year, the first time since 2002 that it has exceeded 5mm b/d. On top of this, there’s the looming downside risk of a new Iran deal if Democrats win the White House and Congress in US elections in November, and a possible restart of Libyan exports this year. Watch The DUCs In The US With WTI prices averaging $41/bbl so far in July, we continue to expect part of previously shut-in US production to come back on line in July, August and September. Nonetheless, the negative effect of the multi-year low rig count will be felt heavily in 4Q20 and 1Q21 and will push production lower. The rig count appears to be bottoming but is not expected to increase meaningfully until WTI prices move closer to $45-50/bbl. On average it takes somewhere between 9-12 months for the signal from higher prices to result in new oil production flowing to market in the US. As the rig count moves back up in 2021, its effect on production will be apparent only in late-2021. However, the massive inventory of drilled-but-uncompleted (DUC) wells in the main US tight-oil basins will provide a source of cheaper new supply, if WTI prices remain above $40/bbl. DUCs are 30-40% cheaper to complete compared to drilling a new well from start. We expect DUCs completion will begin adding to US crude output in 1Q21, and that this will continue to be a source of supply beyond 2021. Bottom line: Global economic policy uncertainty remains elevated, albeit off its recent highs (Chart 12). We expect this uncertainty to continue to wane, which will allow the USD to continue to weaken. This will spur global oil demand, and will augment the fiscal and monetary stimulus to the COVID-19 pandemic undertaken globally. Chart 12Global Policy Uncertainty Remains High, Which Could Support USD Demand
Balance Of Oil-Price Risk Remains To The Upside
Balance Of Oil-Price Risk Remains To The Upside
Nonetheless, the global recovery remains out of sync, which complicates OPEC 2.0’s production management, and markets’ estimation of supply-demand balances. Uneven success in combating the pandemic keeps the risk of lockdowns on the radar in the US. Policy is driving oil production at present, and, given the temptation to monetize spare capacity, the supply side remains a risk to prices. We continue to see upside risk dominating the evolution of prices and are maintaining our expectation Brent prices will average $44/bbl in 2H20 – lifting the overall 2020 average to $43/bbl – and $65/bbl next year. Our expectation WTI will trade $2-$4/bbl below Brent also remains intact. Robert P. Ryan Chief Commodity & Energy Strategist rryan@bcaresearch.com Hugo Bélanger Associate Editor Commodity & Energy Strategy HugoB@bcaresearch.com Fernando Crupi Research Associate Commodity & Energy Strategy FernandoC@bcaresearch.com Commodities Round-Up Energy: Overweight Canadian oil production averaged 4.6mm b/d in 2Q20 vs. 5.5mm b/d in 2Q19, based on EIA estimates. The lack of demand from US refiners – crude imports from Canada fell by 420k b/d y/y during the quarter – and close to maxed-out local storage facilities pushed prices below cash costs, forcing the shut-ins of more than 1mm b/d of crude production. Canadian energy companies started releasing their 2Q20 earnings this week and analysts expect the results to be one of the worst ever recorded, reflecting the extent of the pain producers felt during the COVID-19 shock. Base Metals: Neutral High-grade iron ore prices (65% Fe) were trading above $120/MT this week, on the back of forward guidance from the commodity’s top exporter, Brazilian miner Vale, which suggested exports will be lower than had been previously estimated this year, according to Fastmarkets MB, a sister service of BCA Research. This is in line with an Australian Department of Industry, Science, Energy and Resources analysis in June, which noted, “The COVID-19 pandemic appears to have affected both sides of the iron ore market: demand disruptions have run up against supply problems localised in Brazil, where COVID-19-related lockdowns have derailed efforts to recover from shutdowns in the wake of the Brumadinho tailings dam collapse” (Chart 13). Precious Metals: Neutral Our long silver position is up 17.5% since it was recommended July 2. We are placing a stop-loss on the position at $21/oz, our earlier target, given the metal was trading ~ $22/oz as we went to press. The factors supporting gold prices – chiefly low real rates in the US, a weakening dollar and global monetary accommodation, also support silver prices. However, silver also will benefit from the recovery in industrial activity and incomes we anticipate in the wake of global fiscal and monetary stimulus, which will drive demand for consumer products (Chart 14). Ags/Softs: Underweight Lumber prices have more than doubled since April lows. The uncertainty brought by the COVID-19 health emergency altered the perception of future housing demand and, by extension, lumber demand, to the point that mills responded by substantially decreasing capacity utilization rates. However, in the wake of global monetary and fiscal stimulus, housing weathered the storm better than expected. Furthermore, a surge in DIY projects from individuals working from home at a time of reduced supply contributed to the current state of market shortage. Chart 13Lower Supply Supports Iron Ore Prices
Lower Supply Supports Iron Ore Prices
Lower Supply Supports Iron Ore Prices
Chart 14Silver Favored Over Gold
Silver Favored Over Gold
Silver Favored Over Gold
Footnotes 1 In our reckoning, a non-trivial risk is something greater than Russian roulette odds – i.e., a 1-in-6 chance of an event occuring. Re the ever-so-brief Saudi-Russian market-share war, please see KSA, Russia Will Be Forced To Quit Market-Share War, which we published March 19, 2020. It is available at ces.bcaresearch.com. 2 Please see COLUMN-China's record crude oil storage flies under the radar: Russell published by reuters.com July 20, 2020. 3 The Baker Institute’s Open-Source Mapping of China's Oil Infrastructure was last updated in March 2020. The map is “a beta version and is likely missing some pieces of existing infrastructure. The challenge of China’s geographic expanse — it is roughly the same area as the U.S. Lower 48 — is compounded by a lack of transparency on the part of China’s government,” according to the Baker Institute. 4 In our supply-side estimates, we used IEA estimates of cuts for June this month. This doesn’t change the overall estimate of cuts from our earlier analysis; however, it slightly changes how the 9.7mm b/d was split between OPEC 2.0 members. the official eased cuts are 7.7mm b/d from 9.7mm b/d in May-June-July, but it actually is closer to 8.3mm b/d accounting for the compensation from the countries mentioned above. Investment Views and Themes Recommendations Strategic Recommendations Tactical Trades Trade Recommendation Performance In 2020 Q2
Balance Of Oil-Price Risk Remains To The Upside
Balance Of Oil-Price Risk Remains To The Upside
Commodity Prices and Plays Reference Table Trades Closed in 2020 Summary of Closed Trades
Balance Of Oil-Price Risk Remains To The Upside
Balance Of Oil-Price Risk Remains To The Upside
Pakistani stock prices in US dollar terms are currently 20% lower than their January high and 56% lower than their 2017 high (Chart I-1, top panel). Meanwhile, the government projected a contraction in real GDP during the fiscal year 2019-20 (ending on June 30), the first in 68 years. We believe stock prices have already priced in plenty of negatives, and that Pakistani equities are likely to move higher over the next six months. Strengthening the balance of payments (BoP) position and continuing policy rate cuts will increase investors’ confidence and benefit its stock market (Chart I-2). We also expect the Pakistani bourse to outperform the EM equity benchmark (Chart I-1, bottom panel). Chart I-1Pakistani Equities: More Upside Ahead
Pakistani Equities: More Upside Ahead
Pakistani Equities: More Upside Ahead
Chart I-2Monetary Easing Will Help Pakistani Equities
Monetary Easing Will Help Pakistani Equities
Monetary Easing Will Help Pakistani Equities
Chart I-3The Current Account Deficit Is Set To Shrink Further
The Current Account Deficit Is Set To Shrink Further
The Current Account Deficit Is Set To Shrink Further
Balance Of Payments Position Pakistan’s BoP position is set to improve. First, its trade deficit will shrink further, as Pakistan’s export will likely improve more than its imports (Chart I-3). The country’s total exports declined 6.8% year-on-year in June, which is a considerable improvement as compared to the massive 54% and 33% contractions that occurred in April and May, respectively. The country was on a strict lockdown for the whole month of April, which was then lifted in early May. As the number of daily new cases and deaths are falling, the country is likely to remain open, lowering the odds of a domestic supply disruption. In addition, as DM growth recovers, the demand for Pakistani products will improve as well. Europe and the US together account for about 54% of Pakistan’s exports. The government is keen to boost the performance of the domestic textile sector, which accounts for nearly 60% of the country’s total exports. The government will likely approve the industry’s request for supportive measures, including access to competitively priced energy, a lower sales tax rate, quick refunds, and a reduction of the turnover tax rate. Moreover, the government has prepared an incentive package for the global promotion of the country’s information technology (IT) sector, aiming to increase IT service exports from the current level of US$1 billion to US$10 billion by 2023. Currently, over 6,000 Pakistan-based IT companies are providing IT products and services to entities in over 100 countries worldwide. Regarding Pakistan’s imports, low oil prices will help reduce the country’s import bill year-on-year over the next six months. Second, remittance inflows – currently at 9% of GDP – have become an extremely important source of financing for Pakistan’s trade deficit. Even though about half of the remittances sent to Pakistan are from oil-producing regions like Saudi Arabia, UAE, Oman and Qatar, low oil prices may only have a limited impact on Pakistan’s remittance inflows. For example, when Brent oil prices fell to US$40 in early 2016, remittances sent to Pakistan in the second half of that year declined by only 1.9% on year-on-year terms. Over the first six months of this year, the remittances received by Pakistan still had a year-on-year growth of 8.7%. At the same time, the government has planned various measures to boost remittances. For example, a “national remittance loyalty program” will be launched on September 1, 2020, in which various incentives would be given to remitters. Third, Pakistan will receive considerable financial inflows this year, probably amounting to over US$12 billion1 from multilateral and bilateral sources. This will be more than enough to finance its current account deficit, which was at US$11 billion over the past 12 months. In April, the International Monetary Fund (IMF) approved the disbursement of about US$1.4 billion to Pakistan under the Rapid Financing Instrument designed to address the economic impact of the Covid-19 shock. The World Bank and the Asian Development Bank have also pledged around US$ 2.5 billion in assistance. The IMF and the Pakistani government are in talks about the completion of the second review for the Extended Fund Facility (EFF) program. If completed in the coming months, the IMF will likely disburse about US$1 billion to Pakistan in the second half of this year. In April, G20 countries also awarded Pakistan a suspension of debt service payments, valued at US$ 1.8 billion, which will be used to pay for Pakistan’s welfare programs. In early July, the State Bank of Pakistan (SBP) received a US$1 billion loan disbursement from China. This came after Beijing awarded Pakistan a US$300 million loan last month. The authorities plan to raise US$1.5 billion through the issuance of Eurobonds over the next 12 months. Other than the funds borrowed by the Pakistani government, net foreign direct inflows, mainly driven by phase II of the China-Pakistan Economic Corridor (CPEC), are set to continue to increase over the remainder of this year, having already grown 40% year-on-year during the first six months of this year. About 63% of that increase came from China. Meanwhile, as we expect macro dynamics to improve in the next six months, net portfolio investment is also likely to increase after having been record low this year (Chart I-4). In addition, as the geopolitical confrontation between the US and China is likely to persist over many years, both Chinese and global manufacturers may move their factories from China to Pakistan.2 Bottom Line: Pakistan’s BoP position will be ameliorating in the months to come. Lower Inflation And Monetary Easing Continuous monetary easing is very likely and will depend on the extent of the decline in domestic inflation. Both headline and core inflation rates seem to have peaked in January (Chart I-5). Significant local currency depreciation last year had spurred inflation in Pakistan. Then, early this year, supply disruptions and hoarding behaviors attributed to the pandemic have contributed to elevated inflation. Chart I-4Net Portfolio Investment Inflows Are Likely To Increase
Net Portfolio Investment Inflows Are Likely To Increase
Net Portfolio Investment Inflows Are Likely To Increase
Chart I-5Both Headline And Core Inflation Rates Will Likely Fall Further
Both Headline And Core Inflation Rates Will Likely Fall Further
Both Headline And Core Inflation Rates Will Likely Fall Further
A closer look at the inflation subcomponents shows that recreation and culture, communication, and education have already fallen well below 5% in the last month. Transport inflation came in negative at 4.4% in June. The inflation of non-perishable food items was still stubbornly high at 14.9% last month. Increasing the food supply and reducing hoarding will help ease that. This, along with a stable exchange rate and a negative output gap will cause a meaningful drop in inflation. As inflation drops, interest rates will be reduced to facilitate an economic recovery. While the current 7% policy rate is lower than headline inflation, and on par with core inflation, Pakistani interest rates remain much higher than those in many other emerging countries. Investment Recommendations We recommend buying Pakistani equities in absolute terms and continuing to overweight this bourse within the emerging markets space. The stock market will benefit from a business cycle recovery following the worst recession in history, worse than during the 2008 Great Recession (Chart I-6). Fertilizer and cement producers, which together account for nearly 30% of the overall stock market, will benefit from falling energy prices, a significant cut in interest rates and supportive government measures. The government recently approved subsidies to encourage fertilizer output. In the meantime, the country’s construction stimulus package and its easing of lockdown orders will help lift demand for cement over the second half of 2020. As a result, both fertilizer and cement output are set to increase (Chart I-7). Besides, a cheapened currency will limit fertilizer imports and help cement producers export their output, which will benefit their revenue. Chart I-6Manufacturing Activity In Pakistan Will Soon Rebound
Manufacturing Activity In Pakistan Will Soon Rebound
Manufacturing Activity In Pakistan Will Soon Rebound
Chart I-7Both Fertilizer And Cement Output Are Set To Increase
Both Fertilizer And Cement Output Are Set To Increase
Both Fertilizer And Cement Output Are Set To Increase
Banks account for about 22% of the overall stock market. Our stress test on the Pakistani banking sector shows it is modestly undervalued at present (Table I-1). Even assuming the worst-case scenario for non-performing loans (NPL), where the NPL ratio would rise to 17.5% from the current 6.6%, the resulting adjusted price-to-book ratio will be only 1.6. Table I-1Stress Test On Pakistani Banking Sector
Pakistani, Chilean & Czech Markets
Pakistani, Chilean & Czech Markets
Both in absolute terms, and relative to EM valuations, Pakistani stocks appear attractive (Charts I-8 and I-9). Finally, foreign investors have bailed out of Pakistani stocks and local currency bonds since 2018, as illustrated in Chart I-4 on page 4. Ameliorating economic conditions will lure foreign investors back. Chart I-8Pakistani Equities: Valuation Measures Are Attractive In Both Absolute Terms…
Pakistani Equities: Valuation Measures Are Attractive In Both Absolute Terms...
Pakistani Equities: Valuation Measures Are Attractive In Both Absolute Terms...
Chart I-9…And Relative To The EM Benchmark
...And Relative To The EM Benchmark
...And Relative To The EM Benchmark
For fixed-income investors, we recommend continuing to hold the long Pakistani local currency 5-year government bonds position, which has produced a 12% return since our recommendation on December 5th 2019. We expect interest rates to drop another 100 basis points (Chart I-5, bottom panel, on page 5). Ellen JingYuan He Associate Vice President ellenj@bcaresearch.com Footnotes 1 Regarding Pakistan’s net financial inflows this year, we estimated that net foreign investment inflows, net foreign portfolio inflows and net other financial inflows to be about US$ 1.5 billion, US$ 0.5 billion, and US$ 10.5 billion, respectively, based on past data and the six-month outlook of the country’s economy. 2 Please see the following articles: Chinese Companies to Relocate Factories to Pakistan Under CPEC Project Importers Survey Shows Production Leaving China for Vietnam, Pakistan, Bangladesh
Last Friday, my colleague Dhaval Joshi and I held a webcast discussing investment strategies. The topics of discussion included global equity valuations, mega-cap stocks leadership and the outlook for EM stocks, fixed-income and currencies. You can listen to the webcast recording by clicking here. An Opportunity In Pakistani Equities And Bonds Pakistani stock prices in US dollar terms are currently 20% lower than their January high and 56% lower than their 2017 high (Chart I-1, top panel). Meanwhile, the government projected a contraction in real GDP during the fiscal year 2019-20 (ending on June 30), the first in 68 years. We believe stock prices have already priced in plenty of negatives, and that Pakistani equities are likely to move higher over the next six months. Strengthening the balance of payments (BoP) position and continuing policy rate cuts will increase investors’ confidence and benefit its stock market (Chart I-2). We also expect the Pakistani bourse to outperform the EM equity benchmark (Chart I-1, bottom panel). Chart I-1Pakistani Equities: More Upside Ahead
Pakistani Equities: More Upside Ahead
Pakistani Equities: More Upside Ahead
Chart I-2Monetary Easing Will Help Pakistani Equities
Monetary Easing Will Help Pakistani Equities
Monetary Easing Will Help Pakistani Equities
Chart I-3The Current Account Deficit Is Set To Shrink Further
The Current Account Deficit Is Set To Shrink Further
The Current Account Deficit Is Set To Shrink Further
Balance Of Payments Position Pakistan’s BoP position is set to improve. First, its trade deficit will shrink further, as Pakistan’s export will likely improve more than its imports (Chart I-3). The country’s total exports declined 6.8% year-on-year in June, which is a considerable improvement as compared to the massive 54% and 33% contractions that occurred in April and May, respectively. The country was on a strict lockdown for the whole month of April, which was then lifted in early May. As the number of daily new cases and deaths are falling, the country is likely to remain open, lowering the odds of a domestic supply disruption. In addition, as DM growth recovers, the demand for Pakistani products will improve as well. Europe and the US together account for about 54% of Pakistan’s exports. The government is keen to boost the performance of the domestic textile sector, which accounts for nearly 60% of the country’s total exports. The government will likely approve the industry’s request for supportive measures, including access to competitively priced energy, a lower sales tax rate, quick refunds, and a reduction of the turnover tax rate. Moreover, the government has prepared an incentive package for the global promotion of the country’s information technology (IT) sector, aiming to increase IT service exports from the current level of US$1 billion to US$10 billion by 2023. Currently, over 6,000 Pakistan-based IT companies are providing IT products and services to entities in over 100 countries worldwide. Regarding Pakistan’s imports, low oil prices will help reduce the country’s import bill year-on-year over the next six months. Second, remittance inflows – currently at 9% of GDP – have become an extremely important source of financing for Pakistan’s trade deficit. Even though about half of the remittances sent to Pakistan are from oil-producing regions like Saudi Arabia, UAE, Oman and Qatar, low oil prices may only have a limited impact on Pakistan’s remittance inflows. For example, when Brent oil prices fell to US$40 in early 2016, remittances sent to Pakistan in the second half of that year declined by only 1.9% on year-on-year terms. Over the first six months of this year, the remittances received by Pakistan still had a year-on-year growth of 8.7%. At the same time, the government has planned various measures to boost remittances. For example, a “national remittance loyalty program” will be launched on September 1, 2020, in which various incentives would be given to remitters. Strengthening the balance of payments (BoP) position and continuing policy rate cuts will increase investors’ confidence and benefit its stock market. Third, Pakistan will receive considerable financial inflows this year, probably amounting to over US$12 billion1 from multilateral and bilateral sources. This will be more than enough to finance its current account deficit, which was at US$11 billion over the past 12 months. In April, the International Monetary Fund (IMF) approved the disbursement of about US$1.4 billion to Pakistan under the Rapid Financing Instrument designed to address the economic impact of the Covid-19 shock. The World Bank and the Asian Development Bank have also pledged around US$ 2.5 billion in assistance. The IMF and the Pakistani government are in talks about the completion of the second review for the Extended Fund Facility (EFF) program. If completed in the coming months, the IMF will likely disburse about US$1 billion to Pakistan in the second half of this year. In April, G20 countries also awarded Pakistan a suspension of debt service payments, valued at US$ 1.8 billion, which will be used to pay for Pakistan’s welfare programs. In early July, the State Bank of Pakistan (SBP) received a US$1 billion loan disbursement from China. This came after Beijing awarded Pakistan a US$300 million loan last month. The authorities plan to raise US$1.5 billion through the issuance of Eurobonds over the next 12 months. Other than the funds borrowed by the Pakistani government, net foreign direct inflows, mainly driven by phase II of the China-Pakistan Economic Corridor (CPEC), are set to continue to increase over the remainder of this year, having already grown 40% year-on-year during the first six months of this year. About 63% of that increase came from China. Meanwhile, as we expect macro dynamics to improve in the next six months, net portfolio investment is also likely to increase after having been record low this year (Chart I-4). In addition, as the geopolitical confrontation between the US and China is likely to persist over many years, both Chinese and global manufacturers may move their factories from China to Pakistan.2 Bottom Line: Pakistan’s BoP position will be ameliorating in the months to come. Lower Inflation And Monetary Easing Continuous monetary easing is very likely and will depend on the extent of the decline in domestic inflation. Both headline and core inflation rates seem to have peaked in January (Chart I-5). Significant local currency depreciation last year had spurred inflation in Pakistan. Then, early this year, supply disruptions and hoarding behaviors attributed to the pandemic have contributed to elevated inflation. Chart I-4Net Portfolio Investment Inflows Are Likely To Increase
Net Portfolio Investment Inflows Are Likely To Increase
Net Portfolio Investment Inflows Are Likely To Increase
Chart I-5Both Headline And Core Inflation Rates Will Likely Fall Further
Both Headline And Core Inflation Rates Will Likely Fall Further
Both Headline And Core Inflation Rates Will Likely Fall Further
A closer look at the inflation subcomponents shows that recreation and culture, communication, and education have already fallen well below 5% in the last month. Transport inflation came in negative at 4.4% in June. The inflation of non-perishable food items was still stubbornly high at 14.9% last month. Increasing the food supply and reducing hoarding will help ease that. This, along with a stable exchange rate and a negative output gap will cause a meaningful drop in inflation. As inflation drops, interest rates will be reduced to facilitate an economic recovery. While the current 7% policy rate is lower than headline inflation, and on par with core inflation, Pakistani interest rates remain much higher than those in many other emerging countries. Investment Recommendations We recommend buying Pakistani equities in absolute terms and continuing to overweight this bourse within the emerging markets space. The stock market will benefit from a business cycle recovery following the worst recession in history, worse than during the 2008 Great Recession (Chart I-6). Fertilizer and cement producers, which together account for nearly 30% of the overall stock market, will benefit from falling energy prices, a significant cut in interest rates and supportive government measures. The government recently approved subsidies to encourage fertilizer output. In the meantime, the country’s construction stimulus package and its easing of lockdown orders will help lift demand for cement over the second half of 2020. As a result, both fertilizer and cement output are set to increase (Chart I-7). Besides, a cheapened currency will limit fertilizer imports and help cement producers export their output, which will benefit their revenue. Chart I-6Manufacturing Activity In Pakistan Will Soon Rebound
Manufacturing Activity In Pakistan Will Soon Rebound
Manufacturing Activity In Pakistan Will Soon Rebound
Chart I-7Both Fertilizer And Cement Output Are Set To Increase
Both Fertilizer And Cement Output Are Set To Increase
Both Fertilizer And Cement Output Are Set To Increase
Banks account for about 22% of the overall stock market. Our stress test on the Pakistani banking sector shows it is modestly undervalued at present (Table I-1). Even assuming the worst-case scenario for non-performing loans (NPL), where the NPL ratio would rise to 17.5% from the current 6.6%, the resulting adjusted price-to-book ratio will be only 1.6. Table I-1Stress Test On Pakistani Banking Sector
Pakistani, Chilean & Czech Markets
Pakistani, Chilean & Czech Markets
Both in absolute terms, and relative to EM valuations, Pakistani stocks appear attractive (Charts I-8 and I-9). Finally, foreign investors have bailed out of Pakistani stocks and local currency bonds since 2018, as illustrated in Chart I-4 on page 4. Ameliorating economic conditions will lure foreign investors back. Chart I-8Pakistani Equities: Valuation Measures Are Attractive In Both Absolute Terms…
Pakistani Equities: Valuation Measures Are Attractive In Both Absolute Terms...
Pakistani Equities: Valuation Measures Are Attractive In Both Absolute Terms...
Chart I-9…And Relative To The EM Benchmark
...And Relative To The EM Benchmark
...And Relative To The EM Benchmark
For fixed-income investors, we recommend continuing to hold the long Pakistani local currency 5-year government bonds position, which has produced a 12% return since our recommendation on December 5th 2019. We expect interest rates to drop another 100 basis points (Chart I-5, bottom panel, on page 5). Ellen JingYuan He Associate Vice President ellenj@bcaresearch.com Chile: Not Out Of The Woods Copper prices have staged an impressive rally in the past four months, but the performance of Chilean markets remains lackluster (Chart II-1). While the red metal has broken above its January highs, Chile’s equities and currency are still trading 25% and 5% below their January peak, respectively. The government’s mismanagement of the pandemic has reignited and heightened the existing socio-political discontent, thus increasing the fragility of the situation. We therefore recommend that investors maintain a cautious stance on Chilean assets. As for dedicated EM portfolios, we recommend moving this bourse from neutral to underweight: First, the lockdowns resulting from the pandemic have revealed the precarious financial condition of low and middle-class households. The lack of savings among these groups prevented workers from self-isolating for more than a couple of weeks. The urge for them to return to work enabled the outbreak to escalate in May. Consequently, these social groups have suffered from infections, and Chile has rapidly become one of the worst affected countries in the world in terms of per-capita COVID-19 cases and deaths. Chart II-2 shows that, as a share of total population, Chile tops the region in terms of cummulative cases and deaths. Moreover, Chile has the eighth highest COVID-19 infections per capita in the world, even though its testing rate per capita is lower than that of Europe and the US. Chart II-1Chilean Markets Have Been Much Weaker Than Copper
Chilean Markets Have Been Much Weaker Than Copper
Chilean Markets Have Been Much Weaker Than Copper
Chart II-2The Pandemic Has Hit Chile Hard
The Pandemic Has Hit Chile Hard
The Pandemic Has Hit Chile Hard
Chart II-3The Economy Is In The Doldrums
The Economy Is In The Doldrums
The Economy Is In The Doldrums
Given the wide spread of the virus, Chile has implemented harsher quarantine measures than the rest of the region, which means that the economic reopening and recovery will start from a lower level of activity. The inability of President Pinera’s administration to protect low and middle-class households from being exposed to the virus has renewed a nation-wide distrust in the government. According to Cadem, one of the country’s most cited polling companies, President Pinera’s approval rating has fallen back to just 17%, not far from the lows seen during last year’s violent social unrest. In sum, these recent events have confirmed our major theme for Chile, discussed in our December Special Report. It reads as follows: Chile’s political elite has been greatly underestimating the depth and gravity of the popular frustration and has been reluctant to address the issue in a meaningful way. Consequently, Chile is set to experience a renewal in protests and a rise in political volatility as the date of the referendum on the Constitution, which is scheduled to take place in October, nears. Second, Chile is experiencing its worst recession in modern history. Chart II-3shows that the economy was already in a slump at the beginning of the year, and the economic lockdown has caused double-digit contractions in many sectors. Further, business confidence never fully recovered from last year’s social protests and has been plummeting deeper since the start of the pandemic (Chart II-3, bottom panel). Chart II-4Banks' NPLs Are Set To Rise
Banks' NPLs Are Set To Rise
Banks' NPLs Are Set To Rise
While President Pinera’s decision to prioritize small and medium-sized businesses (SMEs) has been popular among the middle class, the reality is that Chile remains a highly oligopolistic market, dominated by large companies. The failure to support these businesses will prevent a revival in business sentiment, hiring and investment and, hence, prolong the economic downtrend. This unprecedent economic contraction has caused a rapid surge in non-performing loans (NPLs), which will hurt banks’ capital profits and tighten lending standards. NPLs will rise much further given the record depth of this recession (Chart II-4). Moreover, bank stocks compose 25% of the MSCI Chile index, so a hit to banking profitability will exert downward pressure on the equity index. Third, even though fiscal and monetary stimuli have been large and were implemented rapidly, they are probably insufficient to produce a quick recovery. The government first announced a fiscal plan between March 19 and April 8 worth US$ 17 billion (or 6% of GDP), the third largest in the region. However, it is still quite small compared to that of OECD members. Excluding liquidity provisions for SMEs and tax reductions, the size of new government spending in 2020 is only 3.5% of GDP. On June 14, the government devised another fiscal plan, worth US$ 12 billon (or 5% of GDP). However, it will be spread out over the next 24 months – only 1.5% of GDP of additional stimulus will be injected over the next 12 months. This extra kick in spending seems too small given the depth of the recession. In terms of monetary policy, the Chilean central bank has already reached the limits of its orthodox toolkit. The monetary authorities have cut the policy rate by 125 basis points since November of last year, but they have reached the constitutional technical minimum of 0.5%. The central bank is now using alternative tools to stimulate the economy, such as offering cheap lending to SMEs and a US$ 8 billion quantitative easing program for buying financial institutions’ bonds, as the Constitution forbids the purchasing of government and non-financial corporate debt. In a nutshell, the overall efficiency of these monetary policies will be subdued as the main drags on the economy are downbeat business and consumer confidence stemming from ongoing socio-political tensions, not high interest rates. Chile is shrouded in a cloud of political uncertainty. Monetary policy has reached its limits, and fiscal stimulus is insufficient for now. Fourth, higher copper prices will help on the margin, but will not bail out the Chilean economy. Even with the latest rally in copper prices, Chilean copper exports will continue contracting in US$ terms. The latest increase in prices will be more than offset by output cuts caused by social distancing rules and reduced staff in mines all over the country. Bottom Line: Chile is shrouded in a cloud of political uncertainty. Monetary policy has reached its limits, and fiscal stimulus is insufficient for now. Investment recommendations Chart II-5Our CLP vs. USD Trade
Our CLP vs. USD Trade
Our CLP vs. USD Trade
Continue shorting the CLP relative to a basket of the CHF, EUR and JPY. We closed our short CLP/USD on July 9th with a 29% profit (Chart II-5) and began shorting it versus an equal-weighted basket of the CHF, EUR and JPY. Within an EM equity portfolio, downgrade Chilean stocks from neutral to underweight. An ailing economy and political uncertainty will divert capital from the country despite attractive equity valuations. For an EM local bond portfolio, we are also downgrading Chile from neutral to underweight, as the risk of renewed currency depreciation is too large to ignore and downside in yields is limited due to the zero bound. Juan Egaña Research Associate juane@bcaresearch.com The Czech Republic: Pay Rates And Go Long The Currency An opportunity to bet on higher longer-term interest rates and on a stronger currency has emerged in the Czech Republic (Chart III-1). Consumer price inflation is above the central bank’s 2% target and will continue to rise, which will necessitate higher interest rates (Chart III-2). The latter will lead to currency appreciation. Chart III-1Pay Rates And Go Long CZK vs. USD
Pay Rates And Go Long CZK vs. USD
Pay Rates And Go Long CZK vs. USD
Chart III-2Inflation Is Above The CB Bands
Inflation Is Above The CB Bands
Inflation Is Above The CB Bands
The Czech authorities’ strong fiscal and monetary support of the economy amid the COVID recession will keep both labor demand and, thereby, wages supported. In turn, core inflation will likely prove resilient in the near term and will rise over the coming 12-18 months, putting upward pressure on long-term interest rates. First, Prime Minister Andrej Babis is determined to promote a rapid economic recovery, as there are upcoming elections scheduled for next year. In early July, the government approved another spending program that will in part finance infrastructure projects and promote job creation in the non-manufacturing sector. The bill is expected to boost infrastructure spending by 140 billion koruna (or 2.5% of GDP) in 2020, and is part of a multi-decade national investment plan to increase domestic productivity. In particular, the construction sector will benefit from a massive uplift in domestic capex that will go towards upgrading the transport network. This will produce a job boom in the construction industry which should mitigate the employment losses in manufacturing and tourism. Second, shortages continue to persist in the labor market. Our labor shortage proxy is at an all-time high, suggesting that labor shortages will continue to facilitate faster wage growth (Chart III-3). Interestingly, Chart III-4 suggests that overall job vacancies have plateaued but have not dropped. This signifies pent-up demand for labor. Critically, this hiring challenge is likely to make industrial firms reluctant to shed workers amid the transitory pandemic-induced manufacturing downturn. Chart III-3Labor Shortages = Wages Higher
Labor Shortages = Wages Higher
Labor Shortages = Wages Higher
Chart III-4Job Vacancies Are Holding Up
JOB VACANCIES ARE HOLDING UP...
JOB VACANCIES ARE HOLDING UP...
Either way, competition for labor in manufacturing and other sectors will keep a firm bid on both wages and unit labor costs in the medium to long term (Chart III-5). Third, low real interest rates will promote domestic credit growth (Chart III-6), helping support final domestic demand which, in turn, will lift inflation. Chart III-5Structural Pressure On Labor Costs
...STRUCTURAL PRESSURE ON LABOR COSTS
...STRUCTURAL PRESSURE ON LABOR COSTS
Chart III-6Low Rates Will Bolster Domestic Demand
Low Rates Will Bolster Domestic Demand
Low Rates Will Bolster Domestic Demand
Similarly, residential real estate prices and rents will continue to grow at a hefty pace due to low borrowing costs and residential property shortages. Core inflation will likely prove resilient in the near term and will rise over the coming 12-18 months, putting upward pressure on long-term interest rates. Finally, core inflation measures are hovering well above the 2% target and the upper band of 3% (Chart III-2 on page 13). As such, the Czech National Bank (CNB) is likely to hike interest rates sooner rather than later. Critically, inflation is acute across various parts of the economy. Specifically, service price inflation is likely to continue rising in the wake of announced price hikes in public services, such as transport. These are being devised by local authorities to counteract a loss in tax revenue. Altogether, easy fiscal policy (infrastructure spending) will support labor demand, wage growth and final domestic demand, in turn heightening inflationary pressures. Unlike its counterparts in the EU, the CNB is more sensitive to price increases due to the relatively higher starting point of inflation in the Czech economy. As such, the central bank will be the first to hike interest rates among its EU counterparts, tolerating the currency appreciation that will come with it. The basis is Czech domestic demand and income growth will be robust. Investment Recommendation Czech swap rates are currently pricing a rise of only 55 bps in interest rates over the next 10 years. As a result, we recommend investors pay 10-year swap rates (see the top panel of Chart III-1 on page 13). We also recommend going long the Czech koruna versus the US dollar. Unlike the Czech central bank, the US Federal Reserve will keep interest rates very low for too long. In short, the Fed will fall well behind the curve, while the CNB will hike earlier. Rising Czech rates versus US rates favor the koruna against the dollar. This is a structural position that will be held for the next couple of years. It is also consistent with the change in our view on the USD, which has gone from positive to negative in our report from July 9. Andrija Vesic Associate Editor andrijav@bcaresearch.com Footnotes 1 Regarding Pakistan’s net financial inflows this year, we estimated that net foreign investment inflows, net foreign portfolio inflows and net other financial inflows to be about US$ 1.5 billion, US$ 0.5 billion, and US$ 10.5 billion, respectively, based on past data and the six-month outlook of the country’s economy. 2 Please see the following articles: Chinese Companies to Relocate Factories to Pakistan Under CPEC Project Importers Survey Shows Production Leaving China for Vietnam, Pakistan, Bangladesh Equities Recommendations Currencies, Credit And Fixed-Income Recommendations
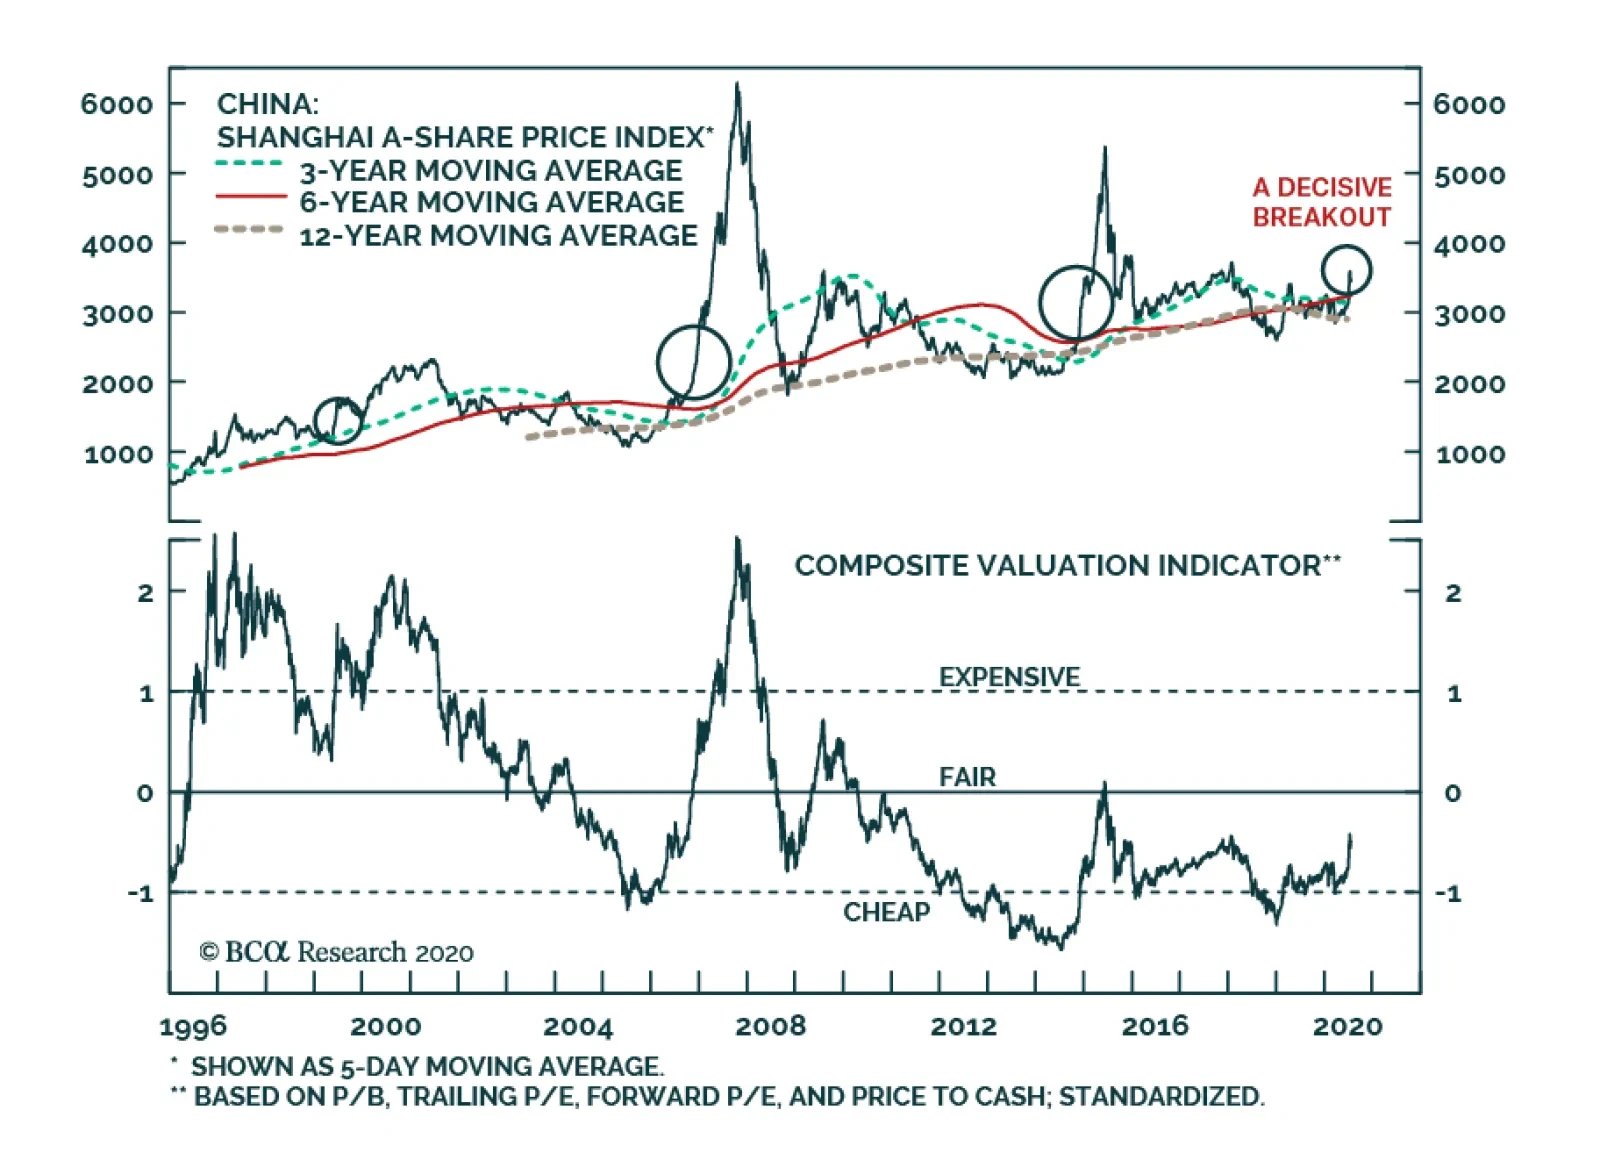
BCA Research's China Investment Strategy service believes that both A-Shares and investable bourses still have room for upside in the ongoing bull market. Chinese bull markets typically last 2-2.5 years and involve three phases. The length and boundaries…
Highlights Chinese stocks are still in the “public participation phase” of a cyclical bull market and have not yet reached the “excess phase.” Economic fundamentals should provide support for more upside in Chinese stock prices in the next 6 to 12 months. Even if Chinese stocks evolve into a boom-bust cycle reminiscent of 2014-15, near-term technical price corrections should provide good buying opportunities. We remain overweight Chinese equities in both absolute and relative terms, and recommend investors increase their exposure to beaten-down cyclically-geared stocks, particularly in China’s domestic market. Feature Chinese stocks rallied by 15% and 13% in the onshore and offshore markets, respectively, in the first 10 days of July. However, both markets gave up almost half of their gains in the third week of the month. The above-expectation Q2 GDP growth figure, which was released last Thursday, only exacerbated the market selloffs. This month’s rollercoaster ride in Chinese equities reminds investors of the boom-bust stock market cycle in 2014-2015, and raises the inevitable question: is it too late to buy or is it too early to sell Chinese stocks? We believe Chinese stocks are still at an early stage of a cyclical bull market. While the recent near-vertical escalation in equity prices was clearly overdone, any near-term technical corrections will provide good buying opportunities. Three Phases Of A Bull Market Chinese bull markets typically last 2-2.5 years and involve three phases.1 The length and boundaries of each phase in a bull run are often blurred and are best identified in hindsight. However, this framework helps put the ongoing market rally in both A shares and investable stocks into perspective. In our view, the A share market is currently in the early stage of the “public participation phase”, whereas investable stocks seem to be halfway through (Chart 1A and 1B). Chart 1AA Shares In Early Stage Of The “Public Participation Phase (PPP)”
A Shares In Early Stage Of The "Public Participation Phase (PPP)"
A Shares In Early Stage Of The "Public Participation Phase (PPP)"
Chart 1BChinese Investable Shares May Be Halfway Through PPP
Chinese Investable Shares May Be Halfway Through PPP
Chinese Investable Shares May Be Halfway Through PPP
We think that the current bull market started in January 2019, following a bear market from 2016 to 2018. We upgraded Chinese stocks from neutral to cyclically overweight in April 2019, which was a couple of months into the “accumulation phase” of the bull market underway. The accumulation phase is the start of an uptrend, typically after a bear market, when smart money begins to buy stocks; fundamentals still look bleak and valuations are at exceptionally depressed levels. Chart 2China’s Economy Should Be On Track To A Cyclical Upturn
Chinese Stocks: Stay Invested
Chinese Stocks: Stay Invested
The public participation phase typically exhibits a massive increase in trading volumes and explosive growth in new investor accounts. This phase begins when the market is already off the bottom and negative sentiment begins to wane on signs of economic improvement (Chart 2). As the bull trend is clearly established, technical and trend traders also begin to pile in, generating a self-feeding cycle. The market begins to feel overheated, making value investors uncomfortable, but valuations are not yet extreme (Chart 3). This phase tends to last longer than the other two stages in a bull market primary trend. The expansion of multiples remains the dominant driver for the broad market while earnings struggle (Chart 4). Chart 3Valuations In A Shares Are Not Too Extreme
Valuations In A Shares Are Not Too Extreme
Valuations In A Shares Are Not Too Extreme
For investable shares, we believe that the bull market is probably more than halfway through the public participation phase (Chart 5). The market has decisively broken out of its key technical resistance and entered into expensive territory (Chart 6). Still, neither A-share nor investable markets seem to be in the “excess phase” as witnessed in 2015 (Table 1). Chart 4Market Returns Between Multiples And Earnings Growth: Chinese A Shares
Market Returns Between Multiples And Earnings Growth: Chinese A Shares
Market Returns Between Multiples And Earnings Growth: Chinese A Shares
Chart 5Market Returns Between Multiples And Earnings Growth: Chinese Investable Shares
Market Returns Between Multiples And Earnings Growth: Chinese Investable Shares
Market Returns Between Multiples And Earnings Growth: Chinese Investable Shares
Chart 6Valuations In Chinese Investable Shares Are Becoming Expensive, But Not Too Stretched
Valuations In Chinese Investable Shares Are Becoming Expensive, But Not Too Stretched
Valuations In Chinese Investable Shares Are Becoming Expensive, But Not Too Stretched
Table 1Multiples In Chinese Stocks Are Not Yet In The “Excess Phase”
Chinese Stocks: Stay Invested
Chinese Stocks: Stay Invested
China's short and volatile stock market history provides some classic examples of equity boom-bust cycles. The massive bull market in Chinese A shares between 2013 and 2016 fits the three phases perfectly: stock prices jumped by a whopping 93% in the three phases of the bull market between early 2013 and May 2015. The bull market eventually marched onto the excess phase in the first half of 2015 and reached the ultimate top in May 2015 with a trailing P/E of 25 and price-to-book of over 3. Bottom Line: Both the A-share and investable bourses still have room for upside in the ongoing bull market. Remain overweight on both investable and domestic shares, but domestic stocks have more latitude for rally as China’s economy and earnings continue to recover. Pullbacks Not Enough To Turn Bearish On July 1 we upgraded our tactical (0 to 3 months) call on Chinese stocks and initiated long Chinese domestic and investable stock trades relative to global benchmarks. While it is impossible to predict whether the current market will supercharge into a boom-bust cycle as seen in 2014-15, we intend to keep the trades given our conviction that cyclically there is still upside to Chinese stock prices. To turn cyclically bearish on Chinese shares, the following conditions need to develop: First, the broad market should reach an overvalued extreme, at which point gravity would set in. Some sectors and small-cap names, particularly in the ChiNext board, are currently stretched (Chart 7). However, overall market valuations still appear reasonable, based on our composite valuation indicator. Historically, major peaks in the market occurred when the valuation indicator reached much higher levels. Further, cyclically-adjusted equity risk premiums (ERPs) in both Chinese onshore and offshore stocks are materially higher than their historical means (Chart 8). This suggests investors have already priced in extremely high uncertainties surrounding the Chinese economy. Perhaps overdone, in our view. As China's economy continues to recover, their ERPs should shrink, pushing stock prices higher. Chart 7A Structural Bull Run In Chinese Tech Stocks
A Structural Bull Run In Chinese Tech Stocks
A Structural Bull Run In Chinese Tech Stocks
Chart 8Equity Risk Premium In Chinese Stocks Are Extremely High And Will Likely Shrink, Pushing Stock Prices Higher
Equity Risk Premium In Chinese Stocks Are Extremely High And Will Likely Shrink, Pushing Stock Prices Higher
Equity Risk Premium In Chinese Stocks Are Extremely High And Will Likely Shrink, Pushing Stock Prices Higher
Secondly, liquidity should tighten. An important liquidity source is margin lending, which has gone up exponentially since late June and invited regulatory attention (Chart 9). Instead of waiting for overleverage in the market to form a momentum like in the 2014 cycle, Chinese regulators seem to be more vigilant and restrictive this time. By acting early and removing some steam from recent market velocity, a healthier secular bull market can develop. China’s overall monetary conditions are another important source of liquidity. If the policy stance turns from easing to tightening before the economy fully recovers, then it will lead to a compression in multiples in the equity market before stock prices can gain support from an earnings recovery. Historically, Chinese authorities tend to maintain an easing stance for at least three quarters following a nadir in the economy (Chart 10). The track record of Chinese policymakers suggests that the PBoC will likely keep monetary policy accommodative through the end of this year. Chart 9Chinese Authorities Have Been Cracking Down On Overleverage Early In This Bull Run
Chinese Authorities Have Been Cracking Down On Overleverage Early In This Bull Run
Chinese Authorities Have Been Cracking Down On Overleverage Early In This Bull Run
Chart 10Easy Policy Should Sustain Through End Of 2020
Easy Policy Should Sustain Through End Of 2020
Easy Policy Should Sustain Through End Of 2020
Finally, the economy should weaken significantly, which would elevate the equity risk premium and threaten the earnings outlook. A second wave of COVID-19 would have to be severe enough to substantially impact China’s economic recovery, however, the pandemic situation in China seems to be contained and earnings recovery is on course (Chart 11, 12A, 12B, and 12C). Additionally, a major pandemic-triggered shock would only force Chinese authorities to up their ante on reflation and revive domestic demand, which could benefit stocks. Chart 11COVID-19 Virus Spread Has Been Largely Contained Within China
COVID-19 Virus Spread Has Been Largely Contained Within China
COVID-19 Virus Spread Has Been Largely Contained Within China
Chart 12AA Share Prices Are Not Too Far Ahead Of Earnings Recovery
A Share Prices Are Not Too Far Ahead Of Earnings Recovery
A Share Prices Are Not Too Far Ahead Of Earnings Recovery
Bottom Line: Chinese equities will likely experience technical corrections in the near term, but the downside risks are not enough to turn bearish. Chart 12BChinese Investable Stock Prices Seem A Bit Ahead Of Its Own Historical Performance…
Chinese Investable Stock Prices Seem A Bit Ahead Of Its Own Historical Performance...
Chinese Investable Stock Prices Seem A Bit Ahead Of Its Own Historical Performance...
Chart 12C…But Still Not Too Expensive Compared With Global Benchmarks
...But Still Not Too Expensive Compared With Global Benchmarks
...But Still Not Too Expensive Compared With Global Benchmarks
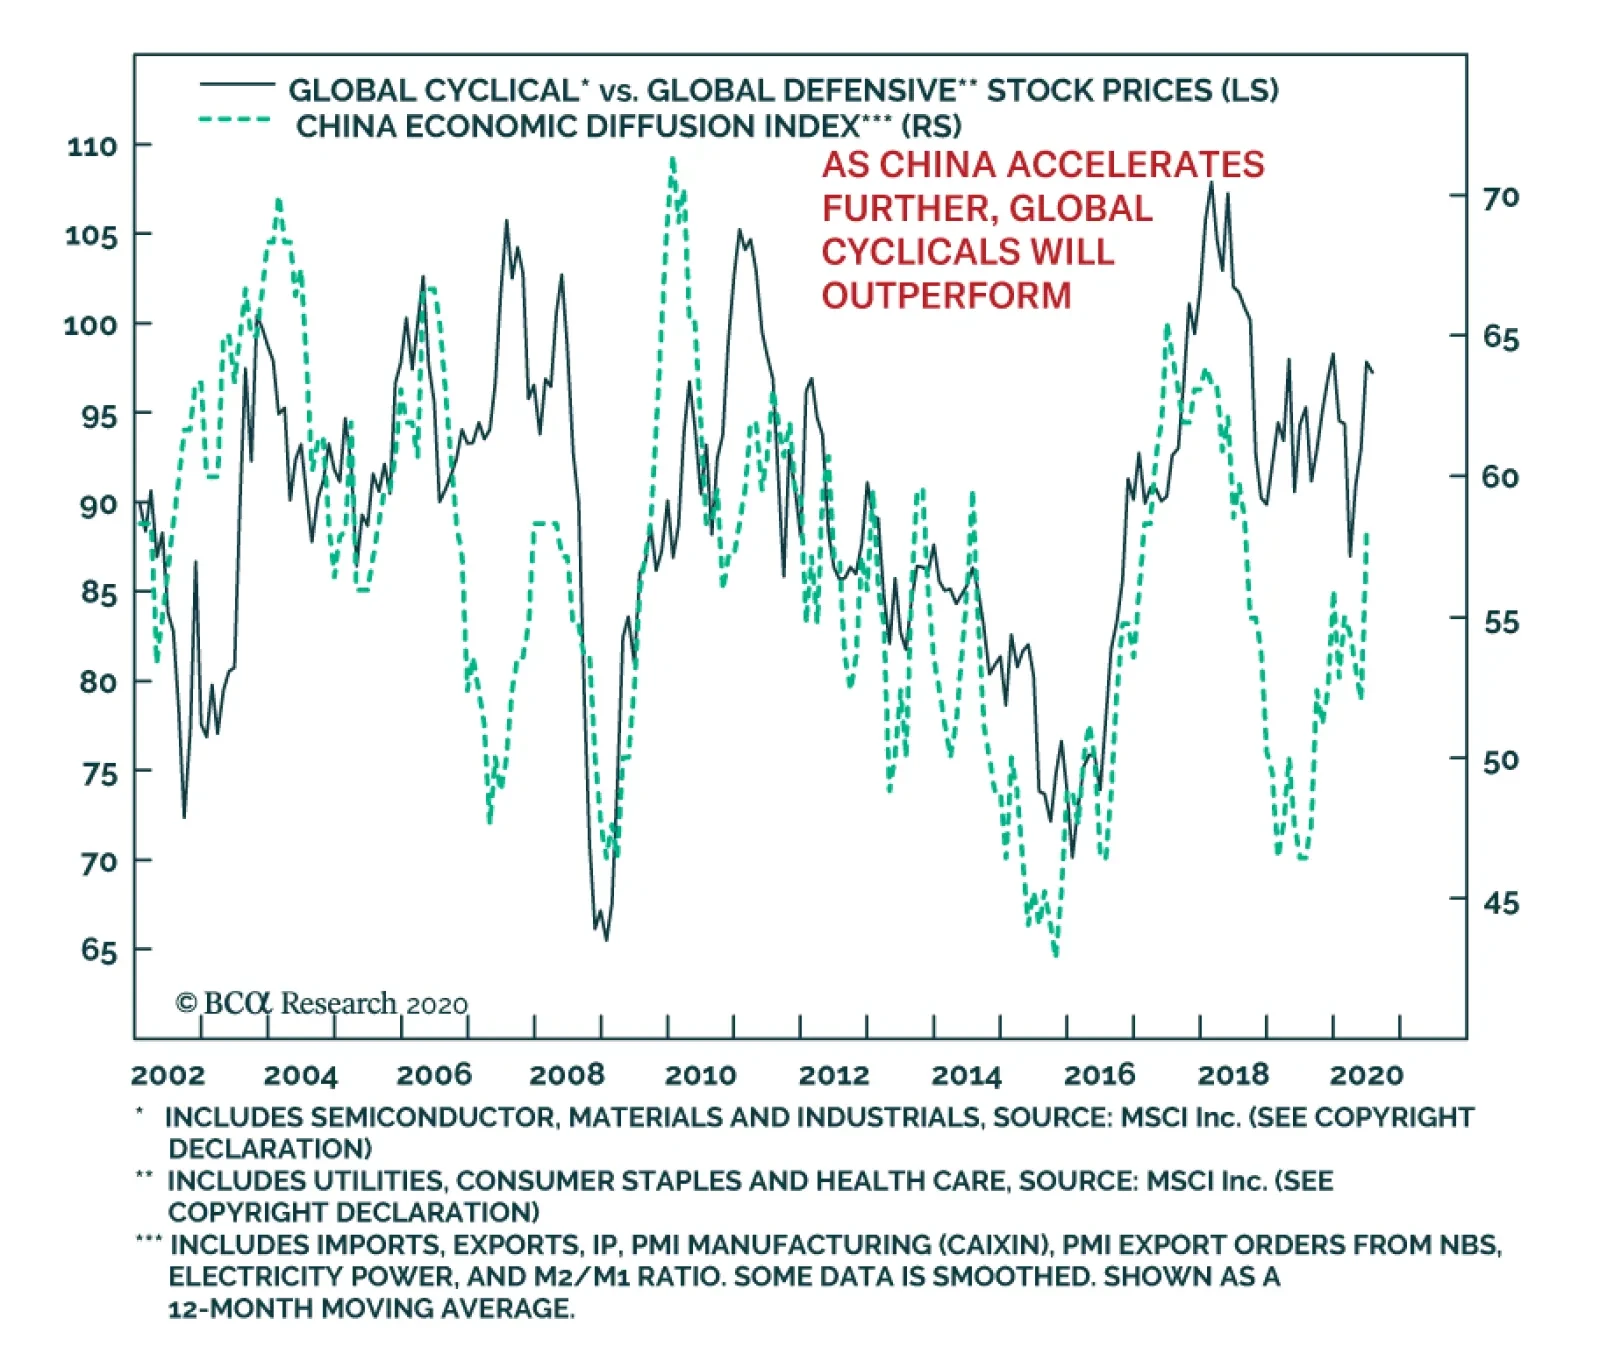
Investment Conclusions Regardless of the direction of Chinese stocks in absolute terms, we recommend investors overweight equities within a global equity portfolio (Chart 13). Investors should also tilt their exposure to battered cyclicals, particularly in China’s domestic stock market (Chart 14). We favor consumer discretionary, materials and industrials in the next 6 to 12 months. Chart 13We Remain Overweight On Chinese Stocks
We Remain Overweight On Chinese Stocks
We Remain Overweight On Chinese Stocks
Chart 14Cyclical Stocks Are Likely To Prevail Over Defensives
Cyclical Stocks Are Likely To Prevail Over Defensives
Cyclical Stocks Are Likely To Prevail Over Defensives
Chinese equity prices have run ahead of economic fundamentals and setbacks will be likely in the near term. Still, these setbacks are buying opportunities and we recommend buying on the dip if Chinese equities, in either onshore or offshore markets, were to fall by 5% to 10% from current levels. However, consecutive selloffs accumulating to a 15% or greater fall in Chinese stock prices within a short period of time (e.g. 2 to 3 weeks) would prompt us to close our long Chinese equity trades. Historically, when the prices of Chinese equities fell by such a magnitude, the selloffs tended to trigger panic among China’s massive retail investors and, in turn, form a self-reinforcing downward spiral and push Chinese stocks into a prolonged bear market (Chart 15). Chart 15Oversized Selloffs Historically Tend To Push Chinese Stocks Into Prolonged Bear Markets
Oversized Selloffs Historically Tend To Push Chinese Stocks Into Prolonged Bear Markets
Oversized Selloffs Historically Tend To Push Chinese Stocks Into Prolonged Bear Markets
Jing Sima China Strategist jings@bcaresearch.com Footnotes 1 Please see China Investment Strategy Weekly Report "Three Phases Of A Bull Market," dated April 22, 2015, available at cis.bcaresearch.com Cyclical Investment Stance Equity Sector Recommendations
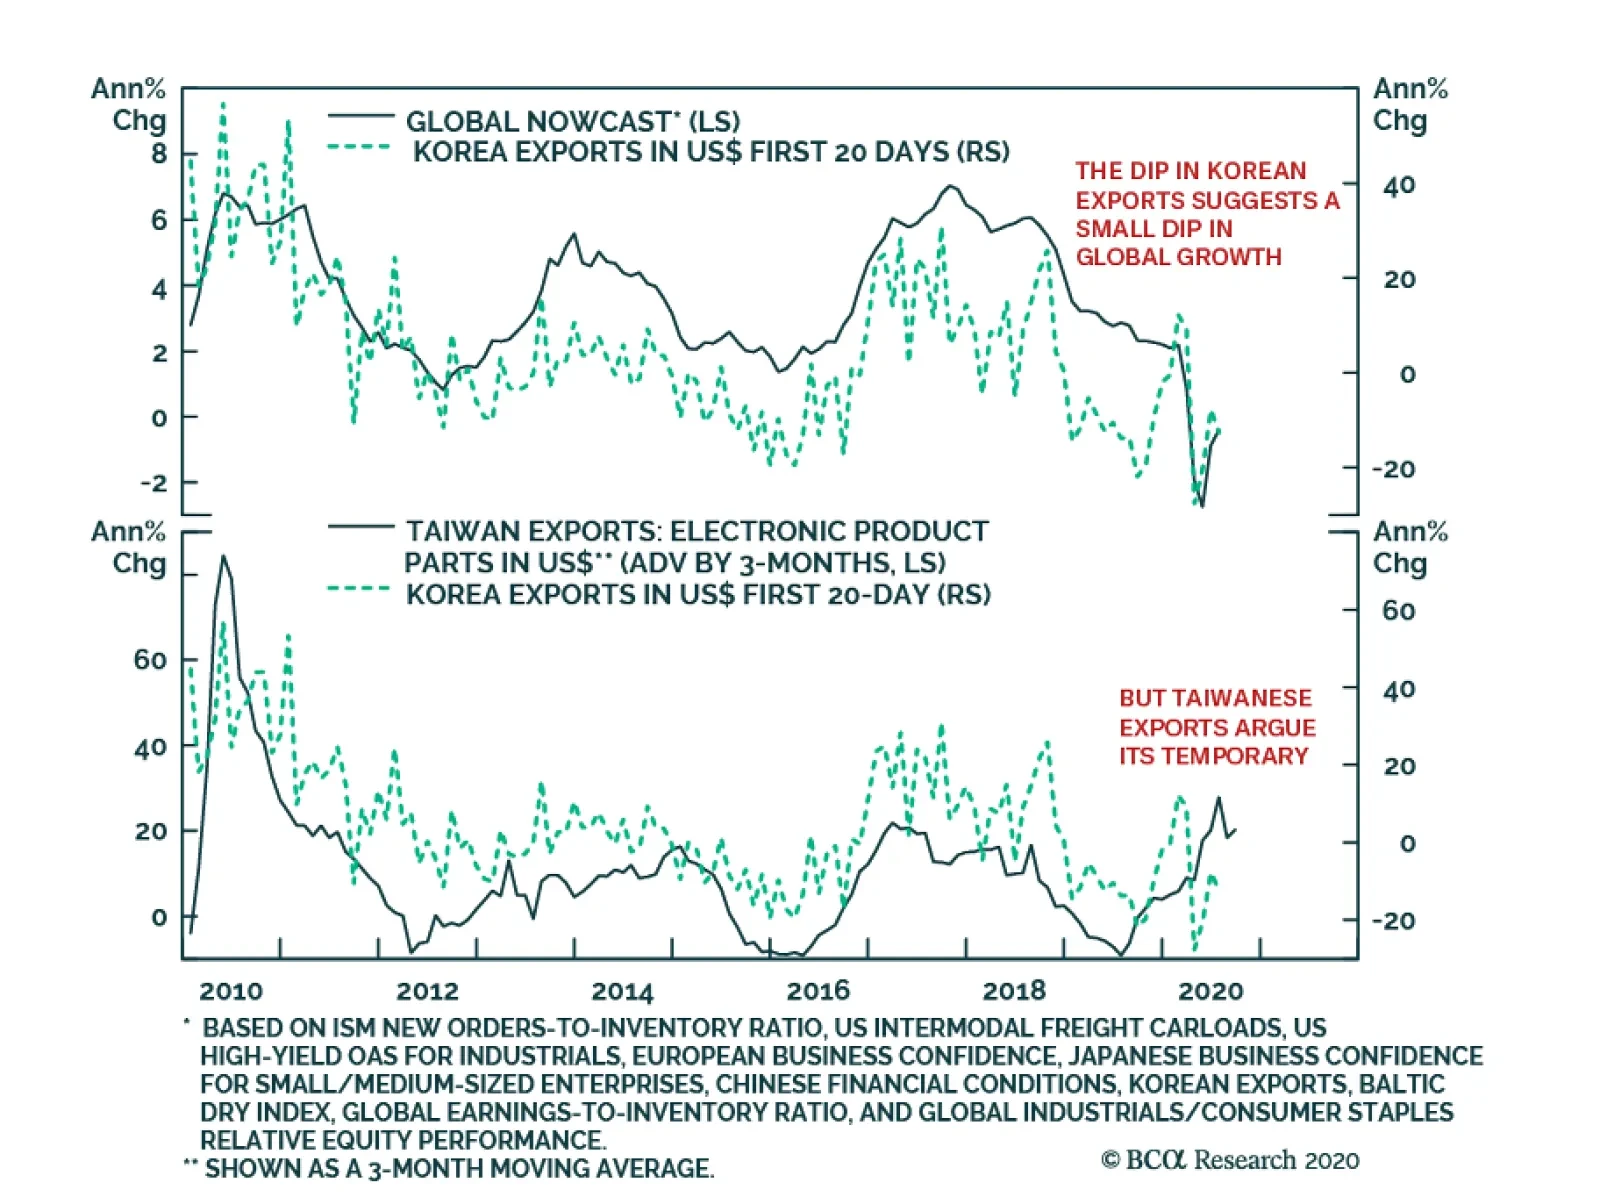
South Korea's exports for the first 20 days of July fell by -12.8% year-on-year, representing a deterioration compared to last month's -7.5% contraction. On the positive side, the contraction in exports per working day is tapering off. The slowdown in the…
At first glance, China’s GDP growth in Q2 was a positive surprise, rising 11.5% on a quarterly, seasonally adjusted rate, well above expectations of 9.6%. Moreover, while the year-to-date data continues to show a contraction in output, this decline is of…
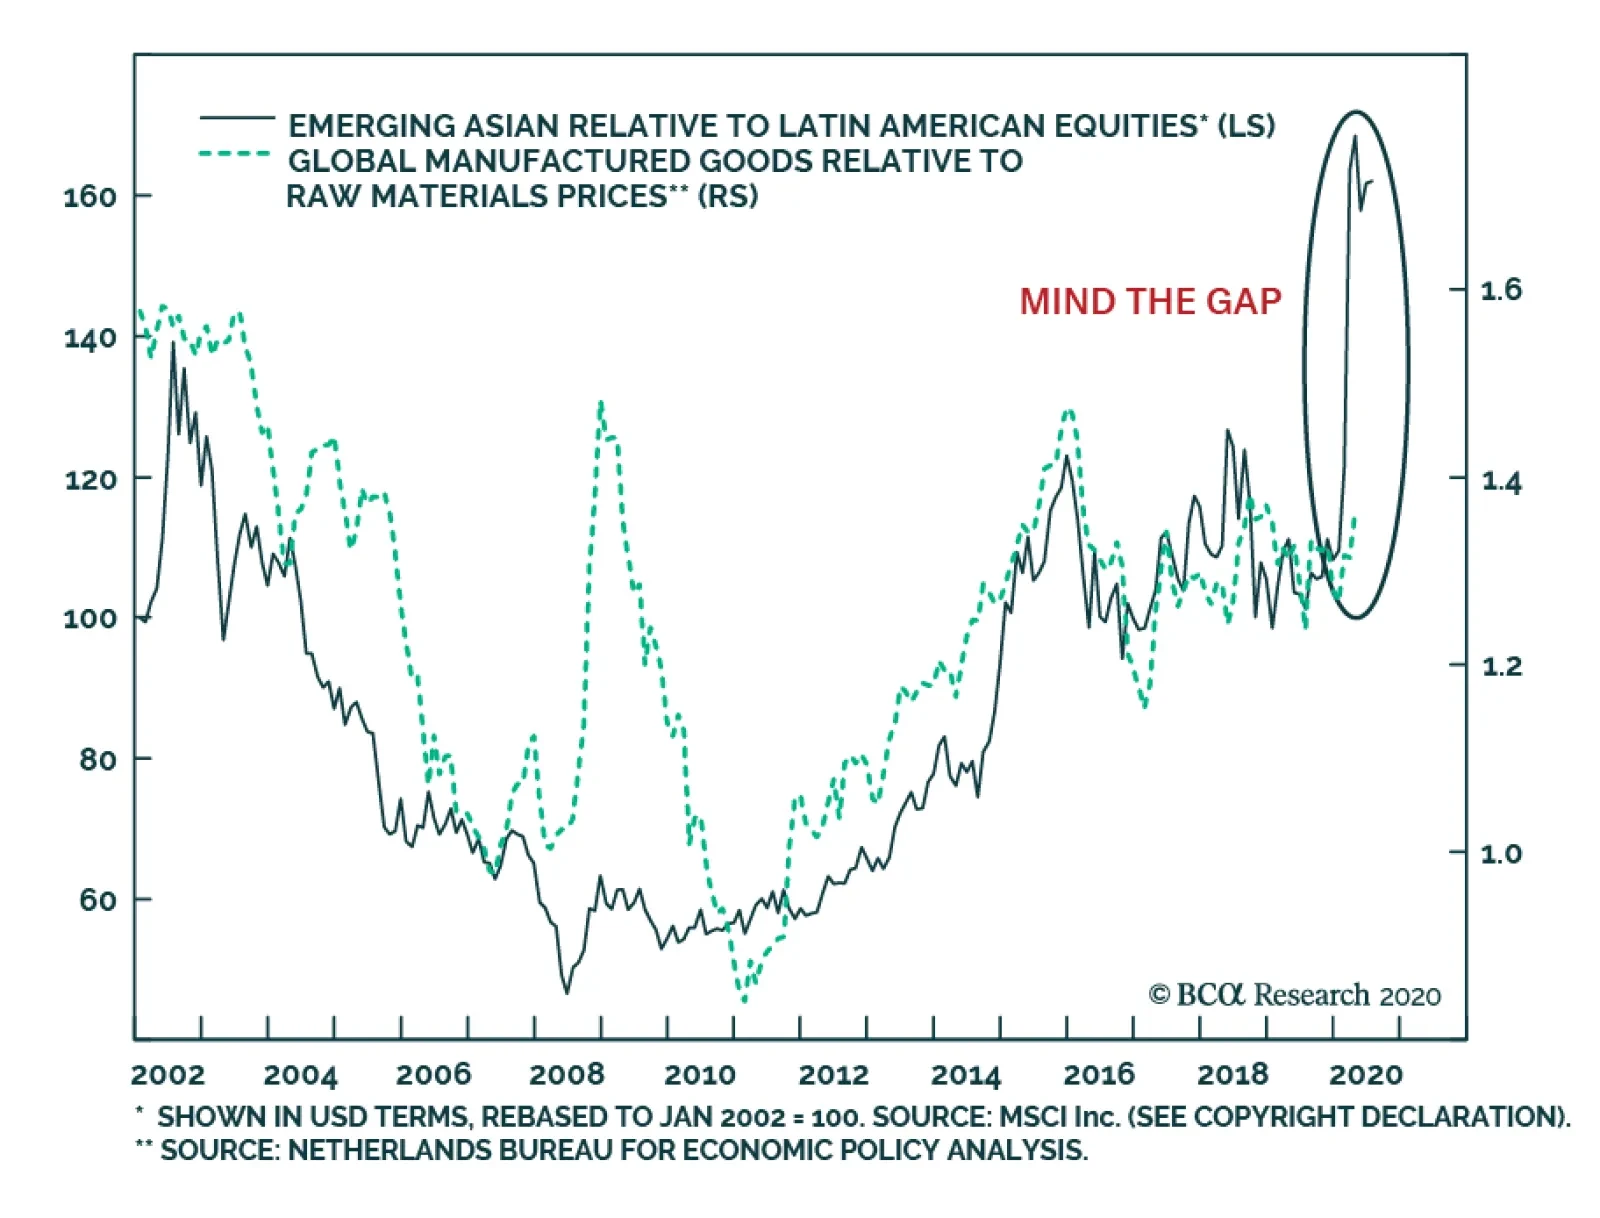
Asian equities have recently rallied in a parabolic fashion relative to their Latin American counterparts thanks to Asia’s comparatively large weighting in tech stocks, along with its lower count of COVID-19 cases. This extraordinary outperformance of Asia…