Asia

China’s economic recovery has been gathering steam, and policymakers have become reasonably confident about the growth outlook. In fact, transaction activity in the property market has recovered to year-ago levels, auto sales and construction starts have bottomed following a 18 to 20-month contraction (Chart I-1). In line with this economic revival, authorities issued a statement following last week’s Politburo meeting contending that monetary policy should aim “to maintain adequate growth of money supply and credit.” This statement is a change in the monetary policy stance in May when the stated objective was to “significantly accelerate the growth rate of broad money supply and total social financing relative to last year.” This change in language highlights that authorities have become more comfortable with the recovery and are now becoming a bit concerned about amplifying credit and property market excesses. In short, there will be no additional stimulus forthcoming, but policy tightening is not in the cards. Policymakers will therefore be in a wait-and-see mode for now, monitoring how economic conditions improve as the enacted stimulus works its way into the economy. Odds are high that the business cycle recovery will continue in China for now. Chart I-2 shows that the amount of credit and fiscal stimulus has been considerable, and that broad money and bank assets impulses remain in uptrend. All these should support the recovery into early next year. Chart I-1China: A Cyclical Recovery Is Underway
China: A Cyclical Recovery Is Underway
China: A Cyclical Recovery Is Underway
Chart I-2China: The Stimulus Will Continue Working Its Way Into Economy
China: The Stimulus Will Continue Working Its Way Into Economy
China: The Stimulus Will Continue Working Its Way Into Economy
As to the risks to Chinese growth emanating from depressed demand in the rest of the world, they are not substantial. First, global demand has already bottomed. Second, China’s total exports account for 17% of GDP, while investment expenditures and consumer spending account for 42% and 38% of GDP, respectively (Chart I-3). Hence, rising capital expenditures and household spending will offset the drag from exports. Finally, China exports many household and medical goods that are currently in very high demand worldwide due to the lockdowns and the pandemic. As a result, Chinese exports have recently done a bit better than global shipments in volume terms (Chart I-4). Chart I-3China Is Not Very Reliant On Exports
China Is Not Very Reliant On Exports
China Is Not Very Reliant On Exports
Chart I-4Chinese Exports Are Doing A Better Than Global Shipments
Chinese Exports Are Doing A Better Than Global Shipments
Chinese Exports Are Doing A Better Than Global Shipments
As to domestic growth drivers, output has been rising faster than consumer demand. Furthermore, capital spending and production by state-owned enterprises has been much stronger than that of private enterprises. However, with the stimulus in full force, both consumer demand and private investment will pick up in the second half of this year. An Equity Market Dichotomy On the surface, the strong rally in Chinese equity indexes has validated the economic recovery thesis. However, a closer examination of the equity performance of various equity sectors reveals that the rebound in cyclical sectors has been rather tame and that the large gains in the equity indexes have been primarily due to tech and new economy businesses, benefiting from working and shopping from home, and to health care stocks (Chart I-5). Chart I-6 illustrates that industrials, materials, autos and real estate stocks are only modestly above their March lows. More importantly, large bank stocks trading in Hong Kong are reaching new lows in absolute terms (Chart I-6, bottom panel). Chart I-5Dichotomy Between Old And New Economy Stocks
Dichotomy Between Old And New Economy Stocks
Dichotomy Between Old And New Economy Stocks
Chart I-6China: Cyclicals Stocks And Banks
China: Cyclicals Stocks And Banks
China: Cyclicals Stocks And Banks
Is such lackluster performance by Chinese cyclical stocks a warning sign to its business cycle recovery? Not necessarily. In our opinion, poor performance of cyclical stocks and banks in China reflects the long-term ramifications of repeated episodes of credit frenzy. A credit-driven growth recovery is always a double-edged sword for both borrowers and creditors. Companies that borrow and invest in new projects accumulate debt. Critically, it is unclear whether these investments will produce new recurring cash flows that would allow the debtors to service their debt. Hence, many companies that take on more debt and invest in financially non-viable projects undermine shareholder value. China has again doubled down on the same policies it has been deploying since the 2008 Lehman crisis. Namely, it has encouraged another boom in money and credit creation, as well as in infrastructure investment. Another outcome of this is that excess money creation leaks into the property market, further fueling the real estate bubble. As for banks, if debtors are unable to service their debt, bank shareholders will be at risk too. This does not mean that banks will be liquidated, but that their shareholders will be diluted. It is critical to put this round of stimulus into perspective: it comes amid already elevated debt levels, following a decade-long credit frenzy and a two decade-long capital spending boom (Chart I-7). Therefore, we doubt that the latest round of investments will be able to substantially increase shareholder value. On the whole, we believe the rally in Chinese stocks outside secular growth plays – such as Alibaba, Tencent – is cyclical not structural. The basis is that while more credit produces a cyclical recovery, it often undermines shareholder value. Chart I-6 on page 4 illustrates that Chinese cyclical stocks and bank share prices have been flat-to-down in the past 10 years despite recurring stimulus. Finally, the near-term risks for Chinese stocks do not stem from the domestic economy, but from geopolitics and a correction in US FAANG stocks. President Trump may escalate the confrontation with China in order to “rally the nation behind the flag” if his polling does not improve ahead of the November elections. Chart I-8 illustrates that the Americans’ view of China has deteriorated significantly in recent years. This might be exploited by President Trump to boost his re-election chances. A heightened confrontation could produce a correction in Chinese stocks. Chart I-7China Credit Excesses Are Getting Larger
China Credit Excesses Are Getting Larger
China Credit Excesses Are Getting Larger
Chart I-8Americans’ Perception Of China Has Deteriorated In Recent Years
China, Indonesia And Turkey
China, Indonesia And Turkey
Also, if the FAANG mania is either paused or reversed, then Chinese tech and mega-cap stocks will correct, pulling down the broad Chinese equity indexes. Bottom Line: The current round of stimulus in China has made the credit, money and property excesses even larger. As we have written over the years, easy money and credit generally fuel a misallocation of capital. Ultimately, this slows productivity growth on the macro level and destroys shareholder value on the company level. Nevertheless, given that the cyclical recovery in China will endure for now, we continue overweighting Chinese investable stocks within an EM equity portfolio. Finally, we are closing our short CNY/long USD position given the change in our USD outlook on July 9. This position has produced a 4.2% loss since its initiation on December 9, 2015. A Stress Test For Bank Stocks Chart I-9China: Small and Medium Banks Versus Large 5 Ones
China: Small and Medium Banks Versus Large 5 Ones
China: Small and Medium Banks Versus Large 5 Ones
Small banks, not large ones, have been leading the massive money and credit boom for the past 10 years. Chart I-9 demonstrates that the risk-weighted assets of smaller banks have risen much faster, and are presently larger, than those of large banks. We have performed a new stress test for both the Big Five and small & medium listed banks. Concerning large banks, our base-case scenario calls for risk-weighted non-performing assets to rise to 13% of total. Accordingly, their equity will be diluted by 46% if they were to provision for these losses (Table I-1). Consequently, the true (adjusted) price-to-book (PBV) ratio will be 1.1. Assuming that the fair value of these large banks corresponds to a PBV ratio of one, then Big Five banks remain moderately (10%) overpriced. For small banks, our baseline scenario assumes a risk-weighted non-performing asset ratio of 13%. If these banks were to provision for these write offs, their equity will be diluted by 61%, pushing the adjusted PBV ratio to 2 (Table I-2). If we use a PBV fair value ratio of 1.3, then small and medium listed banks are substantially overpriced. Table I-1Stress Test Of 5 Large Banks
China, Indonesia And Turkey
China, Indonesia And Turkey
Table I-2Stress Test Of The Other 25 Listed Medium & Small Banks
China, Indonesia And Turkey
China, Indonesia And Turkey
Chart I-10Favor Large 5 Banks Over Small And Medium Ones
Favor Large 5 Banks Over Small And Medium Ones
Favor Large 5 Banks Over Small And Medium Ones
Bottom Line: Chinese banks stocks could rebound, but their structural outlook has deteriorated further following another round of credit binge. Among banks stocks, we reiterate our strategy of favoring large banks over smaller ones (Chart I-10). Arthur Budaghyan Chief Emerging Markets Strategist arthurb@bcaresearch.com Lin Xiang, CFA Research Analyst linx@bcaresearch.com
China: The Recovery And Equity Dichotomy China’s economic recovery has been gathering steam, and policymakers have become reasonably confident about the growth outlook. In fact, transaction activity in the property market has recovered to year-ago levels, auto sales and construction starts have bottomed following a 18 to 20-month contraction (Chart I-1). In line with this economic revival, authorities issued a statement following last week’s Politburo meeting contending that monetary policy should aim “to maintain adequate growth of money supply and credit.” This statement is a change in the monetary policy stance in May when the stated objective was to “significantly accelerate the growth rate of broad money supply and total social financing relative to last year.” This change in language highlights that authorities have become more comfortable with the recovery and are now becoming a bit concerned about amplifying credit and property market excesses. There will be no additional stimulus forthcoming, but policy tightening is not in the cards. In short, there will be no additional stimulus forthcoming, but policy tightening is not in the cards. Policymakers will therefore be in a wait-and-see mode for now, monitoring how economic conditions improve as the enacted stimulus works its way into the economy. Odds are high that the business cycle recovery will continue in China for now. Chart I-2 shows that the amount of credit and fiscal stimulus has been considerable, and that broad money and bank assets impulses remain in uptrend. All these should support the recovery into early next year. Chart I-1China: A Cyclical Recovery Is Underway
China: A Cyclical Recovery Is Underway
China: A Cyclical Recovery Is Underway
Chart I-2China: The Stimulus Will Continue Working Its Way Into Economy
China: The Stimulus Will Continue Working Its Way Into Economy
China: The Stimulus Will Continue Working Its Way Into Economy
As to the risks to Chinese growth emanating from depressed demand in the rest of the world, they are not substantial. First, global demand has already bottomed. Second, China’s total exports account for 17% of GDP, while investment expenditures and consumer spending account for 42% and 38% of GDP, respectively (Chart I-3). Hence, rising capital expenditures and household spending will offset the drag from exports. Finally, China exports many household and medical goods that are currently in very high demand worldwide due to the lockdowns and the pandemic. As a result, Chinese exports have recently done a bit better than global shipments in volume terms (Chart I-4). Chart I-3China Is Not Very Reliant On Exports
China Is Not Very Reliant On Exports
China Is Not Very Reliant On Exports
Chart I-4Chinese Exports Are Doing A Better Than Global Shipments
Chinese Exports Are Doing A Better Than Global Shipments
Chinese Exports Are Doing A Better Than Global Shipments
As to domestic growth drivers, output has been rising faster than consumer demand. Furthermore, capital spending and production by state-owned enterprises has been much stronger than that of private enterprises. However, with the stimulus in full force, both consumer demand and private investment will pick up in the second half of this year. An Equity Market Dichotomy Chart I-5Dichotomy Between Old And New Economy Stocks
Dichotomy Between Old And New Economy Stocks
Dichotomy Between Old And New Economy Stocks
On the surface, the strong rally in Chinese equity indexes has validated the economic recovery thesis. However, a closer examination of the equity performance of various equity sectors reveals that the rebound in cyclical sectors has been rather tame and that the large gains in the equity indexes have been primarily due to tech and new economy businesses, benefiting from working and shopping from home, and to health care stocks (Chart I-5). Chart I-6 illustrates that industrials, materials, autos and real estate stocks are only modestly above their March lows. More importantly, large bank stocks trading in Hong Kong are reaching new lows in absolute terms (Chart I-6, bottom panel). Chart I-6China: Cyclicals Stocks And Banks
China: Cyclicals Stocks And Banks
China: Cyclicals Stocks And Banks
Is such lackluster performance by Chinese cyclical stocks a warning sign to its business cycle recovery? Not necessarily. In our opinion, poor performance of cyclical stocks and banks in China reflects the long-term ramifications of repeated episodes of credit frenzy. A credit-driven growth recovery is always a double-edged sword for both borrowers and creditors. Companies that borrow and invest in new projects accumulate debt. Critically, it is unclear whether these investments will produce new recurring cash flows that would allow the debtors to service their debt. Hence, many companies that take on more debt and invest in financially non-viable projects undermine shareholder value. China has again doubled down on the same policies it has been deploying since the 2008 Lehman crisis. Namely, it has encouraged another boom in money and credit creation, as well as in infrastructure investment. Another outcome of this is that excess money creation leaks into the property market, further fueling the real estate bubble. As for banks, if debtors are unable to service their debt, bank shareholders will be at risk too. This does not mean that banks will be liquidated, but that their shareholders will be diluted. It is critical to put this round of stimulus into perspective: it comes amid already elevated debt levels, following a decade-long credit frenzy and a two decade-long capital spending boom (Chart I-7). Therefore, we doubt that the latest round of investments will be able to substantially increase shareholder value. On the whole, we believe the rally in Chinese stocks outside secular growth plays – such as Alibaba, Tencent – is cyclical not structural. The basis is that while more credit produces a cyclical recovery, it often undermines shareholder value. Chart I-6 on page 4 illustrates that Chinese cyclical stocks and bank share prices have been flat-to-down in the past 10 years despite recurring stimulus. Finally, the near-term risks for Chinese stocks do not stem from the domestic economy, but from geopolitics and a correction in US FAANG stocks. President Trump may escalate the confrontation with China in order to “rally the nation behind the flag” if his polling does not improve ahead of the November elections. Chart I-8 illustrates that the Americans’ view of China has deteriorated significantly in recent years. This might be exploited by President Trump to boost his re-election chances. A heightened confrontation could produce a correction in Chinese stocks. Chart I-7China Credit Excesses Are Getting Larger
China Credit Excesses Are Getting Larger
China Credit Excesses Are Getting Larger
Chart I-8Americans’ Perception Of China Has Deteriorated In Recent Years
China, Indonesia And Turkey
China, Indonesia And Turkey
Also, if the FAANG mania is either paused or reversed, then Chinese tech and mega-cap stocks will correct, pulling down the broad Chinese equity indexes. Bottom Line: The current round of stimulus in China has made the credit, money and property excesses even larger. As we have written over the years, easy money and credit generally fuel a misallocation of capital. Ultimately, this slows productivity growth on the macro level and destroys shareholder value on the company level. Small banks, not large ones, have been leading the massive money and credit boom for the past 10 years. Nevertheless, given that the cyclical recovery in China will endure for now, we continue overweighting Chinese investable stocks within an EM equity portfolio. Finally, we are closing our short CNY/long USD position given the change in our USD outlook on July 9. This position has produced a 4.2% loss since its initiation on December 9, 2015. A Stress Test For Bank Stocks Chart I-9China: Small and Medium Banks Versus Large 5 Ones
China: Small and Medium Banks Versus Large 5 Ones
China: Small and Medium Banks Versus Large 5 Ones
Small banks, not large ones, have been leading the massive money and credit boom for the past 10 years. Chart I-9 demonstrates that the risk-weighted assets of smaller banks have risen much faster, and are presently larger, than those of large banks. We have performed a new stress test for both the Big Five and small & medium listed banks. Concerning large banks, our base-case scenario calls for risk-weighted non-performing assets to rise to 13% of total. Accordingly, their equity will be diluted by 46% if they were to provision for these losses (Table I-1). Consequently, the true (adjusted) price-to-book (PBV) ratio will be 1.1. Assuming that the fair value of these large banks corresponds to a PBV ratio of one, then Big Five banks remain moderately (10%) overpriced. For small banks, our baseline scenario assumes a risk-weighted non-performing asset ratio of 13%. If these banks were to provision for these write offs, their equity will be diluted by 61%, pushing the adjusted PBV ratio to 2 (Table I-2). If we use a PBV fair value ratio of 1.3, then small and medium listed banks are substantially overpriced. Table I-1Stress Test Of 5 Large Banks
China, Indonesia And Turkey
China, Indonesia And Turkey
Table I-2Stress Test Of The Other 25 Listed Medium & Small Banks
China, Indonesia And Turkey
China, Indonesia And Turkey
Chart I-10Favor Large 5 Banks Over Small And Medium Ones
Favor Large 5 Banks Over Small And Medium Ones
Favor Large 5 Banks Over Small And Medium Ones
Bottom Line: Chinese banks stocks could rebound, but their structural outlook has deteriorated further following another round of credit binge. Among banks stocks, we reiterate our strategy of favoring large banks over smaller ones (Chart I-10). Arthur Budaghyan Chief Emerging Markets Strategist arthurb@bcaresearch.com Lin Xiang, CFA Research Analyst linx@bcaresearch.com Indonesia: Struggling To Recover Indonesian stocks and the rupiah have rebounded in line with global risk assets. However, the rebound might be waning. The rupiah has begun weakening anew against the US dollar despite a major weakness in the latter. Relative to EM, Indonesian equities are underperforming again (Chart II-1). Chart II-1Indonesian Stocks Are Underperforming EM Again
Indonesian Stocks Are Underperforming EM Again
Indonesian Stocks Are Underperforming EM Again
Crumbling Economic Activity And Insufficient Stimulus Indonesia is experiencing its worst recession since the Asian Crisis in 1997. Consumer income has dwindled and consumer confidence collapsed (Chart II-2, top panel). In turn, passenger car and truck sales have contracted by 90% and 84%, respectively, from a year ago (Chart II-2, second and third panel). Meanwhile, domestic cement consumption plunged by 17% (Chart II-2, bottom panel). In the meantime, the Coronavirus pandemic is not subsiding and will continue weighing on the Indonesian economy. The authorities have been attempting to prop up domestic demand. Yet the total fiscal stimulus announced so far – which amounts to $48 billion or 4.3% of GDP – is unlikely to be enough, given the harsh nature of this recession. For instance, the commercial banks loan impulse has already dipped to -2.7% of GDP (Chart II-3, top panel). Provided that demand for credit stays weak and banks continue to be reluctant to lend, the credit impulse will drop even further. As a result, the negative credit impulse will offset the fiscal thrust. Chart II-2Indonesia: Domestic Demand Collapsed
Indonesia: Domestic Demand Collapsed
Indonesia: Domestic Demand Collapsed
Chart II-3Indonesia: Lending Rates Are High
Indonesia: Lending Rates Are High
Indonesia: Lending Rates Are High
On the monetary policy front, Bank Indonesia (BI) has been aggressively cutting its policy rate and injecting banking system liquidity into the market. The BI has been also purchasing government bonds on the secondary and primary markets, de facto conducting quantitative easing. Still, the ongoing monetary easing has not translated into lower lending rates for the real economy. In particular, although the BI lowered its policy rate by 200 basis points since July 2019, bank lending rates have only fallen by 100 basis points (Chart II-3, middle panel). This is a major sign that the monetary transmission mechanism is broken. Furthermore, the commercial banks’ lending rate, in real (inflation-adjusted) terms, remains elevated (Chart II-3, bottom panel). This is severely hurting credit demand (Chart II-3, top panel). The deflationary pressures on the Indonesian economy are intensifying. As a result, the deflationary pressures on the Indonesian economy are intensifying. The top panel of Chart II-4 shows that the GDP deflator is flirting with deflation. Meanwhile, both core and headline inflation have undershot the central bank’s target (Chart II-4, bottom panel). Bottom Line: Very low inflation and crumbling real growth have caused nominal GDP growth to drop below borrowing rates (Chart II-5). This is hitting borrowers’ ability to service their debt and is leading to swelling non-performing loans (NPLs). Chart II-4Indonesia Is Facing Very Low Inflation
Indonesia Is Facing Very Low Inflation
Indonesia Is Facing Very Low Inflation
Chart II-5Indonesia: Nominal GDP Growth Is Well Below Lending Rates
Indonesia: Nominal GDP Growth Is Well Below Lending Rates
Indonesia: Nominal GDP Growth Is Well Below Lending Rates
Bank Stocks Remain At Risk The outlook for bank stocks that make up 48% of the Indonesia MSCI equity index is bleak. Chart II-6 shows that non-performing loans and special-mention loans (which are composed of doubtful loans) were rising before the pandemic shock. This has forced commercial banks to boost their bad loans provisioning, which has hurt their profitability. Additionally, Indonesian commercial banks’ net interest margins (NIM) have been falling sharply (Chart II-7). This has occurred because, on the revenues side, interest earnings have mushroomed as debtors have halted their interest payments while, on the expenditures side, commercial banks were forced to keep on paying interests to depositors. To protect their profitability, commercial banks have kept their lending rates stubbornly high. However, doing so will end up backfiring – as elevated lending rates punish borrowers and end up causing NPLs to rise, leading to more profit weakness. Chart II-6Indonesia: Bad Loans Are On The Rise
Indonesia: Bad Loans Are On The Rise
Indonesia: Bad Loans Are On The Rise
Chart II-7Indonesia: Banks' Net Interest Margins Are Falling
Indonesia: Banks' Net Interest Margins Are Falling
Indonesia: Banks' Net Interest Margins Are Falling
Crucially, Bank Central Asia and Bank Rakyat – which now account for a whopping 37% of the Indonesia MSCI market cap – are vulnerable. Both commercial banks are heavily exposed to state-owned enterprises (SOE) and small and medium (SME) companies. Particularly, 40% of Bank Central Asia’s loan book is linked to SOEs and government-led projects across electricity, ports, airports and cement among other sectors. Meanwhile, 68% of Bank Rakyat’s loan book is leveraged to the SME sector and 20% to large companies, including SOEs. Worryingly, both SOEs and SMEs have been undergoing stress. Their profitability and debt servicing ability were questionable even before the COVID-19 pandemic. State-Owned Enterprises (SOEs): The debt servicing ability for these companies has deteriorated. The debt-to-EBITDA ratio has risen considerably while the EBITDA coverage of interest expenses is set to fall from already low levels (Chart II-8). Small & Medium Enterprises (SME): The debt serviceability of the top 40% of the MSCI-listed small cap stocks is also deteriorating. The top panel of Chart II-9 shows that these companies’ debt-to-EBITDA has risen substantially, and that the EBITDA-to-interest expense ratio has plunged (Chart II-9, bottom panel). Chart II-8Indonesian SOEs: Weak Debt Servicing Capacity
Indonesian SOEs: Weak Debt Servicing Capacity
Indonesian SOEs: Weak Debt Servicing Capacity
Chart II-9Indonesian SMEs: Weak Debt Servicing Capacity
Indonesian SMEs: Weak Debt Servicing Capacity
Indonesian SMEs: Weak Debt Servicing Capacity
Chart II-10Indonesia Equities: Banks, Non-Financials And Small Caps
Indonesia Equities: Banks, Non-Financials And Small Caps
Indonesia Equities: Banks, Non-Financials And Small Caps
All in all, both Bank Central Asia and Bank Rakyat are set to experience a considerable new NPL cycle emanating from the poor profitability of SOEs and SMEs. Importantly, Bank Central Asia and Bank Rakyat’s respective NPLs at 1.3% and 2.6% were relatively low at the start of this year and have much room to rise. Neither are their valuations appealing. At a price-to-book value of 4.4 Bank Central Asia is expensive. As for Bank Rakyat while its multiples are not as high as Bank Central Asia’s (which is trading at a price-to-book value of 1.8), it is not particularly cheap either, considering its enormous exposure to Indonesia’s struggling SME sector. Bottom Line: The outlook for bank stocks is murky (Chart II-10). Apart from banks, the rest of the Indonesian stock market has been performing very poorly and there is no obvious evidence that this will change (Chart II-10, bottom two panels). Investment Conclusions Continue underweighting the Indonesian stock market. Bank stocks remain at risk. Moreover, there is evidence that retail investors have been active in the stock market as of late. When the stock market does relapse, retail investors will likely rush to sell their holdings, thereby magnifying the equity selloff. Dedicated EM local currency bonds and credit portfolios should continue underweighting Indonesia. Investors in Indonesia’s corporate US dollar bonds should tread carefully as the largest issuers are those SOEs that have experienced deteriorating creditworthiness. Chart II-11Return On Capital Drives EM Currencies
Return On Capital Drives EM Currencies
Return On Capital Drives EM Currencies
If the US dollar continues to depreciate, the rupiah could stabilize and rebound but it will underperform other EM and DM currencies. Return on capital (ROC) is the ultimate driver of EM currencies. Given the magnitude of the recession Indonesia is in and the slow recovery it will experience, its ROC will remain weak. This will weigh on the rupiah (Chart II-11). We continue shorting the rupiah against an equally weighted basket of the euro, Swiss franc and Japanese yen. Ayman Kawtharani Editor/Strategist ayman@bcaresearch.com Turkey: The Ramifications Of A Money Plethora Turkey is facing another currency turmoil. At the core of significant currency depreciation pressures is an overflow of money. Chart III-1 demonstrates that narrow money (M1) and broad money (M3) are booming at 90% and 50%, respectively, from a year ago. These measures exclude foreign currency deposits. Bank loan annual growth has surged to 45% and commercial bank purchases of government bonds are skyrocketing (Chart III-2). Chart III-1Turkey's Money Overflow
Turkey's Money Overflow
Turkey's Money Overflow
Chart III-2Rampant Credit Creation By Commercial Banks
Rampant Credit Creation By Commercial Banks
Rampant Credit Creation By Commercial Banks
In turn, the Central Bank of Turkey’s (CBRT) funding of commercial banks has surged (Chart III-3). By providing ample liquidity the CBRT has enabled commercial banks to engage in a credit frenzy and levy of government debt. The latter has capped local currency bond yields at a time when the private sector and foreign investors have been reluctant to finance the government bond given its current yields. At the core of significant currency depreciation pressures is an overflow of money. Consistent with this expanding money bubble, inflation in Turkey remains in a structural uptrend (Chart III-4). Core and service sector consumer price inflation is close to 12% and will rise even further due to the overflow of money in the economy. Besides, residential property prices are already soaring, in local currency terms, as residents are fleeing from liras. Chart III-3Central Bank's Funding Of Banks
Central Bank's Funding Of Banks
Central Bank's Funding Of Banks
Chart III-4Structurally Rising Inflation
Structurally Rising Inflation
Structurally Rising Inflation
Still, the central bank refuses to acknowledge these inflationary pressures and to tighten its policy stance. Monetary authorities remain well behind the inflation curve. The policy rate, in real terms (deflated by core CPI), is -2%. In the past, when real policy rates have dropped to this level, the exchange rate has often tumbled, as in 2011, 2013, 2015 and 2018 (Chart III-5). Chart III-5Numerous Headwinds For The Lira
Numerous Headwinds For The Lira
Numerous Headwinds For The Lira
In regard to balance of payments, the current account deficit is widening again due to the plunge in exports and tourism revenues and the recovering imports (Chart III-5, bottom panel). Historically, a widening current account deficit has weighed on the currency. Lastly, the central bank is not in the position to defend the exchange rate much longer. Not only has it depleted its own reserves but it has also used up $70 billion of commercial banks deposits and entered a $55 billion foreign exchange swap. Hence, its is massively short on US dollars. Bottom Line: As part of our broader currency strategy, on July 9, we replaced our short Turkish lira versus the US dollar position with a short in TRY versus a basket of the euro, CHF and JPY. This switch has proved to be very profitable and we continue recommending it. Consequently, investors should continue underweighting Turkish stocks, local currency bonds and credit markets relative to their EM counterparts. Fixed-income investors should consider betting on higher inflation expectations, i.e. going long domestic inflation adjusted yields and shorting nominal yields. Andrija Vesic Associate Editor andrijav@bcaresearch.com Footnotes Equities Recommendations Currencies, Credit And Fixed-Income Recommendations
BCA Research's China Investment Strategy service concludes that a buildup in industrial inventory may temporarily slow down China’s commodity imports over the next month or two. Both the production and demand subcomponents of the PMI improved in July, but…
Highlights A buildup in industrial inventory may temporarily slow down China’s commodity imports over the next month or two. Last week’s Politburo meeting stated that policy supports will remain in place for 2H20, despite a rising policy rate. We think the policy rate normalization will not imminently reverse the credit impulse; strong bank lending growth will be sustained and fiscal support will likely accelerate through Q3. The liquidity-driven hype in Chinese equities may be waning, but improving economic fundamentals should support a continued bull run (in both absolute and relative terms) for the rest of this year. Feature July’s official PMI indicates that China's economic recovery remains two-tracked, with a rebound in the supply side outpacing demand and investment outpacing consumption. This uneven improvement in the economy may lead to some inventory buildup in July and August. Nevertheless, both production and demand have grown steadily and should continue to pick up in the rest of the year, ahead of other major economies.1 The annual mid-year Politburo meeting last week indicates that the monetary and fiscal policies will remain accommodative through the end of 2020. Chinese policymakers also emphasized the importance of reviving domestic demand and consumption in H2. While we have seen a rising interbank rate since late April, the current growth in credit should be sustained at least through Q3. Moreover, we expect fiscal spending to accelerate in H2 and boost infrastructure investment growth even higher. The authorities’ stringent regulations on equity margin lending may curb speculation in the financial markets. However, stronger economic fundamentals in the second half of 2020 bodes well for China’s equity performance, particularly for cyclical stocks on a 6-12 month time horizon. Tables 1 and 2 present key developments in China’s economic and financial market performance over the past month, and we highlight several developments below: Table 1China Macro Data Summary
China Macro And Market Review
China Macro And Market Review
Table 2China Financial Market Performance Summary
China Macro And Market Review
China Macro And Market Review
Chart 1Export Growth Has Been Beating Expectations (And Our Model)
Export Growth Has Been Beating Expectations (And Our Model)
Export Growth Has Been Beating Expectations (And Our Model)
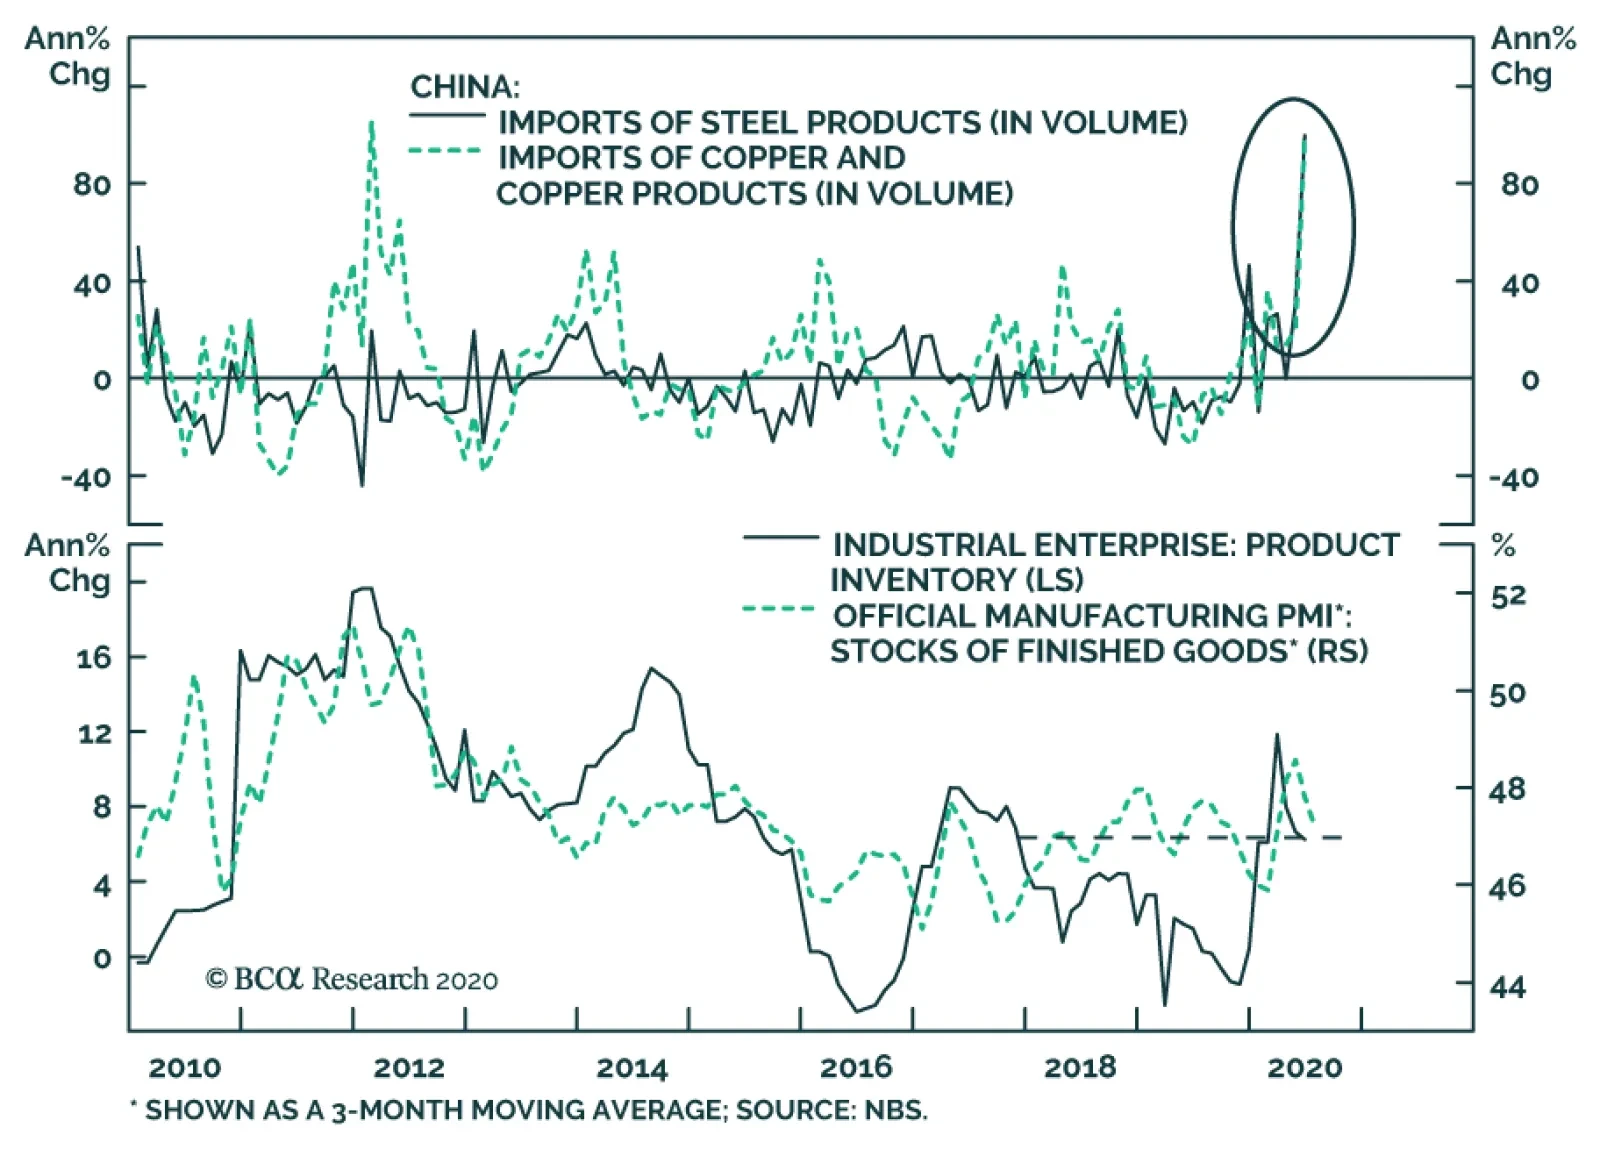
China’s official manufacturing PMI rose to 51.1 in July, beating the market consensus. The export order subcomponent of the PMI rebounded substantially last month, although it remains below the 50 percent boom-bust threshold (Chart 1). Recent high-frequency data in the US suggests that America’s economic and consumption recovery may be stalling.2 While weak economic improvement in major global economies will be a drag on external demand for consumer and capital goods, we expect that China’s export growth will continue to be supported by the pandemic-related need for medical supplies. Both the production and demand subcomponents of the PMI improved in July, but the demand side was outpaced by the supply side. This has led to a significant uptick in the finished-goods inventory subcomponent, which is the first advance in four months (Chart 2). The acceleration in post-lockdown construction activity in Q2 and exceptionally low commodity prices have driven up China’s imports of major commodities, such as steel, copper and crude oil. In turn, industrial inventories remained at their highest levels since late 2017 (Chart 3). This suggests that an inventory destocking and delay in construction activity in the flood-stricken southern part of China may hold back commodity import growth in August and possibly September. Chart 2Faster Production Rebound Leads To A Pickup In Inventory
Faster Production Rebound Leads To A Pickup In Inventory
Faster Production Rebound Leads To A Pickup In Inventory
Chart 3High Product Inventories May Curb Commodity Imports In Q3
High Product Inventories May Curb Commodity Imports In Q3
High Product Inventories May Curb Commodity Imports In Q3
Chart 4Chinese Demand For Commodities Remains Strong
Chinese Demand For Commodities Remains Strong
Chinese Demand For Commodities Remains Strong
Despite this, any moderation in China’s imports should be temporary. Industrial profit growth sprung back sharply in June. Rejuvenated growth in China’s industrial profits is crucial for fixed-asset investment and demand for durable goods, which would allow imports of commodities to remain robust in most of H2 this year (Chart 4). Statements from the mid-year Politburo meeting highlighted that “monetary policy will be more flexible and targeted in 2H20; and that the PBoC will focus on guiding the loan primary rate (LPR) lower to reduce financing costs for enterprises, particularly to the manufacturing sector and the SMEs.” Since late April, the 3-month SHIBOR (the de facto policy rate) has been rising, though it remains at a historic low. Our take is that the authorities intend to normalize liquidity conditions in the interbank system, at least for the time being, to curb financial institutions’ speculative activities (Chart 5). Even though the rising policy rate has pushed up both government and corporate bond yields, it does not necessarily lead to an imminent tightening in credit growth. Instead, we expect bank lending and fiscal spending to accelerate. Even if the 3-month SHIBOR decisively bottomed in April, the momentum in credit growth should continue through Q3 and possibly peak in October (Chart 6). Our view is based on the following: Chart 5Policymakers May Be Trying To Curb "Animal Spirits"...
Policymakers May Be Trying To Curb "Animal Spirits"...
Policymakers May Be Trying To Curb "Animal Spirits"...
Chart 6...Without Stopping Capitals From Flowing To The Real Economy
...Without Stopping Capitals From Flowing To The Real Economy
...Without Stopping Capitals From Flowing To The Real Economy
The rising policy rate and corporate bond yields do not seem to affect the amount of corporate bonds being issued. Moreover, corporate bond issuance as a share of total social financing has been flat since 2016 and remains small relative to bank lending (Chart 7, top and middle panels) On the other hand, the local government bonds’ share of total social financing has been rising since 2016 (Chart 7, middle panel). Since the amount of local government bonds issued is set at the annual National People’s Congress, a rising policy rate and bond yields have little effect on this segment of total social financing. Last week’s Politburo meeting called for local governments to speed up their special purpose bonds (SPB) issuance and complete the 3.75 trillion yuan annual quota by the end of October. The government bond issuance in July was dominated by special COVID-19 relief treasury bonds (STB), therefore, the SPB issuance will be concentrated in August to October. Based on our estimates, the average SPB issuance may reach 500 billion yuan per month in August through October, a more than 30% increase from the average monthly issuance in H1 this year. The largest share in total social financing is bank lending, which has not correlated with the policy rate since 2016 (Chart 7, bottom panel). Instead, bank loan growth and lending rates are affected by the LPR, which rate policymakers vow to guide further downwards (Chart 8). Additionally, the PBoC signaled that bank lending in 2020 is targeted at 20 trillion yuan. This leaves the second half of 2020 with a minimum of 40% of the target, or 8 trillion yuan of newly increased bank lending. To complete this annual target, according to our calculations, the growth rate of bank lending in 2H20 will need to reach at least 13% on an annual basis. This would equal to the annual growth in bank lending seen in H1. Chart 7Fiscal Support Will Accelerate
Fiscal Support Will Accelerate
Fiscal Support Will Accelerate
Chart 8Bank Loans Should Accelerate Too When Lending Rates Are Lower
Bank Loans Should Accelerate Too When Lending Rates Are Lower
Bank Loans Should Accelerate Too When Lending Rates Are Lower
China’s domestic and investable stocks dropped by 2% and 4%, respectively, from their peaks in early July, a technical correction that was mainly driven by market concerns that Chinese policymakers will withdraw stimulus too soon. China’s policymakers have indeed tightened interbank liquidity conditions and adopted more stringent measures to curb speculative behavior in the financial markets. However, we think the strong credit growth and fiscal stimulus will continue in the second half of the year, and will provide substantial support to boost China’s economic growth. As shown in Chart 9 (top panel), there has not been a steady correlation between China’s policy rate and equity performance. Rather, economic fundamentals are still the main driver for stock performance on a cyclical basis (6-12 month) (Chart 9, bottom panel). The multiples in Chinese stocks are not too elevated compared with their global peers (Chart 10A,10B, and 10C). Moreover, Chinese cyclical stocks have outperformed defensives, enhancing our cyclical bullish view on stocks in both absolute and relative terms (Chart 11). Chart 9Chinese Equity Performances Are More Correlated With Economic Fundamentals Than Policy Rate
Chinese Equity Performances Are More Correlated With Economic Fundamentals Than Policy Rate
Chinese Equity Performances Are More Correlated With Economic Fundamentals Than Policy Rate
Chart 10AChinese A Shares Are Not Too Decoupled From Economic Fundamentals
Chinese A Shares Are Not Too Decoupled From Economic Fundamentals
Chinese A Shares Are Not Too Decoupled From Economic Fundamentals
Chart 10BChinese Offshore Stocks Are More Driven By Multiple Expansions...
Chinese Offshore Stocks Are More Driven By Multiple Expansions...
Chinese Offshore Stocks Are More Driven By Multiple Expansions...
Chart 10C...But Still Not As Much As Their Global Peers
...But Still Not As Much As Their Global Peers
...But Still Not As Much As Their Global Peers
Chart 11Cyclical Stocks Are Having The Upper Hand
Cyclical Stocks Are Having The Upper Hand
Cyclical Stocks Are Having The Upper Hand
Qingyun Xu, CFA Senior Analyst qingyunx@bcaresearch.com Jing Sima China Strategist jings@bcaresearch.com Footnotes 1Please see Global Investment Strategy Outlook "Third Quarter 2020 Strategy Outlook: Navigating The Second Wave," dated June 30, 2020, available at gis.bcaresearch.com 2Please see Daily Insights "A Bumpy Recovery, But Stocks Have Room To Run," dated July 31, 2020, available at bcaresearch.com Cyclical Investment Stance Equity Sector Recommendations
Dear Client, There will be no Weekly Report on August 10, as the US Equity Strategy team will be on vacation for the week. Our regular publication schedule will resume on Monday August 17, 2020 with a Special Report by my colleague Chester Ntonifor, BCA’s Chief FX Strategist on the interplay of the style bias and the US Dollar. We trust that you will find this Report both informative and insightful. Kind Regards, Anastasios Feature Before getting to our analysis on why cyclicals will best defensives, we want to address our definition of cyclicals and defensives, where we think tech stands and why, discuss what our current positioning is and what time horizon we are targeting for this portfolio bent. Cyclicals And Defensives Definition Table 1 is a stripped down version of our current recommendations table and shows that our cyclicals definition is one of deep cyclicals including industrials, materials, energy and the information technology sector. Utilities, consumer staples, health care and telecom services (which is currently categorized as a GICS2) comprise our defensives universe. Table 1US Equity Strategy's Cyclicals Vs. Defensives Current Recommendations
Top 10 Reasons To Start Nibbling On Cyclicals At The Expense Of Defensives
Top 10 Reasons To Start Nibbling On Cyclicals At The Expense Of Defensives
Tech Is Still Cyclical Importantly, we still consider the tech sector a deep cyclical and not a safe haven sector. While the COVID-19 fallout has acted as an accelerant especially to a faster absorption of goods and services of the tech titans, that is not a de facto change in the behavior of these still cyclical stocks. As a reminder tech stocks have 60% export exposure or 20 percentage points higher than the broad market. The implication is that US tech trends should follow the ebbs and flows of the global economy. Contrary to popular belief that technology equities behaved defensively recently, empirical evidence gives credence to our hypothesis that technology stocks remain cyclical: from the Feb 19 SPX peak until the March trough the IT sector underperformed all four defensive sectors (Chart of the Week). In marked contrast, tech has left in the dust defensive sectors since the March bottom, cementing its cyclical status. Chart of the WeekTech Remains A Cyclical Sector
Tech Remains A Cyclical Sector
Tech Remains A Cyclical Sector
Current Positioning With regard to our broader technology positioning, we are currently neutral the S&P tech sector, overweight the S&P internet retail index (which Amazon dominates) that sits under the S&P consumer discretionary sector and underweight the S&P interactive media & services index (which includes Alphabet and Facebook) that falls under the newly formed S&P communications services sector. Thus, our broadly defined tech sector exposure remains neutral. Meanwhile, last week we boosted the S&P materials sector to overweight and that move pushed our cyclicals/defensives bent marginally to preferring deep cyclicals to defensives (please see market cap weights in Table 1). Timing Is Key This portfolio bent may run into some near-term trouble as we expect a flare up of (geo)political risks (please see here and here), but once the election uncertainty lifts, hopefully in late-November/early-December, from that point onward and on a 9-12 month time horizon cyclicals should really start to flex their muscles versus defensives. The purpose of this Special Report is to identify the top ten drivers of the looming cyclicals versus defensives outperformance phase on a cyclical time horizon. What follows is one page one chart per key reason, in no particular order of importance. 1.) Dollar The Reflator Time and again we have highlighted the boost that internationally exposed sectors get from a weakening greenback. Cyclicals are the primary beneficiaries of such a backdrop as a lot of these deep cyclical companies garner over 50% of their sales from abroad. We recently updated in a Special Report the breakdown of GICS1 sectors’ foreign sourced revenues and more importantly their performance during US dollar bear markets. Cyclicals clearly have the upper hand. Chart 1 shows this tight inverse correlation, irrespective of what USD index we use. Finally, looking ahead a falling greenback will act as a relative profit reflator (US dollar shown inverted, bottom panel, Chart 1), especially given that most of the defensive sectors are landlocked in the US and do not get a P&L fillip from positive translation gains. Chart 1CHART 1
CHART 1
CHART 1
2.) Global Growth Recovery Not only does the debasing of the US dollar bode well for Income Statement (I/S) relative translation gains, but also serves as a tonic to global growth. In other words, a final demand recovery is in the works on the back of a pending virtuous cycle: a depreciating dollar lifts global growth, and an increase in trade brings more US dollars in circulation further weakening the greenback (top panel, Chart 2). Our Global Trade Activity Indicator also corroborates the USD message and underscores a global growth recovery into 2021 (second panel, Chart 2). Tack on the meteoric rise in the G10 economic surprise index (third panel, Chart 2) and factors are falling into place for a synchronized global economic recovery including a V-shaped US rebound from the depths of the recession in Q2 (ISM manufacturing survey shown advanced, bottom panel, Chart 2). Chart 2CHART 2
CHART 2
CHART 2
3.) US Capex To The Rescue The latest GDP report made for grim reading. US capex collapsed 27% last quarter in line with the fall it suffered in Q1/2009. Not even bulletproof software investment escaped unscathed and contracted for the first time in seven years, albeit modestly. However, if the looming recovery resembles the GFC episode when real non-residential investment soared 40 percentage points from that nadir in the subsequent five quarters, then a slingshot rebound will ensue by the end of 2021. Importantly, our US capex indicator has an excellent track record in leading the relative share price ratio and confirms that a capex trough is already in store, tracing out the bottom hit during the Great Recession (top panel, Chart 3). Regional Fed surveys also signal that a capex boom looms in the coming quarters (middle panel, Chart 3). And, so do cheery CEOs that expect a sizable investment recovery in the next six months, according to the Conference Board survey (bottom panel, Chart 3). All of this is a harbinger of a cyclicals outperformance phase at the expense of defensives. Chart 3CHART 3
CHART 3
CHART 3
4.) Chinese Capex On The Upswing (Fiscal Easing) Across the pacific, Chinese excavator sales have gone vertical. While we take Chinese data with a grain of salt, Komatsu hydraulic excavator demand growth in China has averaged 45% on a year-over-year basis in the quarter ending in June. This Japanese company’s data, which has been unaffected by the US/Sino trade war, corroborates the Chinese official statistics (top panel, Chart 4). Infrastructure spending is also on the rise in China following an abrupt halt in projects started early in 2020. This revving of the investment spending engine is bullish for the broad commodity complex including US cyclicals (bottom panel, Chart 4). Chart 4CHART 4
CHART 4
CHART 4
5.) Chinese Monetary Easing None of the above investment recovery would have been possible had the Chinese authorities not opened up the liquidity spigots. Monetary easing via the sinking reserve-requirement-ratio (RRR) has been instrumental in engineering an economic rebound (RRR shown inverted, third panel, Chart 5). The credit-easing channel has been also important in funneling cash toward investment, and the climbing Li Keqiang index is evidence that sloshing liquidity is being put to good use (bottom & second panels, Chart 5). Finally, Chinese loan demand data also confirms that an economic recovery is in the offing and heralds a US cyclicals versus defensives portfolio tilt (top panel, Chart 5). Chart 5CHART 5
CHART 5
CHART 5
6.) Firming Financial Market Data (Chinese And EM Equity Market Outperformance) Typically, financial market data are early in sniffing out a turn in economic data. This anticipatory nature of financial markets is currently signaling that EM in general and Chinese economic growth in particular will make a significant comeback in the coming quarters. Importantly, Chinese bourses and the MSCI EM equity index (in USD) have recently started to outperform the ACWI and the SPX (Chart 6). Both of these equity markets are more cyclically exposed than the defensive US and global indexes because of the respective sector composition and have paved the way for a sustainable rise in the US cyclicals/defensives share price ratio (Chart 6). Chart 6CHART 6
CHART 6
CHART 6
7.) Transition From Deflation To Inflation Similarly to the EM and Chinese equity market outperformance of their DM peers, commodity prices are putting in a bottom and forecasting a brighter global trade backdrop for the rest of the year (top panel, Chart 7). The depreciating US dollar is also underpinning the commodity complex and this should serve as a catalyst for an exit from the recent global disinflationary backdrop, especially corporate wholesale price deflation. Domestically, the prices paid subcomponent of the ISM manufacturing survey is firming and projecting that relative pricing power will favor cyclicals versus defensives (bottom panel, Chart 7). Chart 7CHART 7
CHART 7
CHART 7
8.) Profit Expectations Have Turned The Corner Sell-side extreme pessimism has given way to mild optimism as depicted by the now positive relative Net Earnings Revisions (NER) ratio (third panel, Chart 8). Importantly, despite the spike in the relative NER ratio, the bar has not risen enough both on a relative profit growth and revenue growth basis in order to short circuit the recovery in the relative share price ratio (second & bottom panels, Chart 8). Chart 8CHART 8
CHART 8
CHART 8
9.) Alluring Valuations The relative Valuation Indicator remains below the neutral zone offering a cushion to investors that are contending to execute a cyclicals versus defensives portfolio bent (Chart 9). Chart 9CHART 9
CHART 9
CHART 9
10.) Enticing Technicals Lastly, cyclicals are still unloved compared with defensives as our relative Technical Indicator (TI) highlights in Chart 10. In fact, our relative TI also hovers below the neutral zone, near a level that has marked previous playable recovery rallies (bottom panel, Chart 10). Chart 10CHART 10
CHART 10
CHART 10
But Monitor Three Key Risks Over the coming 12 to 18 months, investors should prepare their portfolios for an outperformance phase of cyclical sectors relative to defensives. Nonetheless, we are closely monitoring a number of key risks that can put our view offside. First, the relentless rise of ex-Vice President Biden in the polls on PREDICTIT, the rapidly increasing probability of a “Blue Sweep” in the upcoming elections, and the non-negligible risk of a contested election (as discussed in a joined Special Report with our sister Geopolitical Strategy service last week), all pose a short-term threat to the benign election backdrop priced into stocks. Were a risk-off phase to materialize in the next three months, as we expect, then cyclicals would take the back seat versus defensives, at least temporarily (bottom panel, Chart 11). Second, what worries us most is that Dr. Copper and crude oil (another global growth barometer), especially compared with gold, have yet to confirm the global growth recovery. In other words, the fleeting oil-to-gold and copper-to-gold ratios underscore that the liquidity-to-growth handoff has gone on hiatus. While we are not ready to throw in the towel yet, these relative commodity signals are disconcerting, and were they to deteriorate further, they would definitely undermine our optimistic view on global growth (top and second panels, Chart 11). Finally, it is disquieting that our relative profit growth models have no pulse. They represent a significant risk to the relative earnings-led rebound which the rest of the indicators we track are anticipating (third panel, Chart 11). Chart 11Three Key Risks We Are Monitoring
Three Key Risks We Are Monitoring
Three Key Risks We Are Monitoring
Bottom Line: On balance, a looming global growth recovery and pending global capex upcycle, a softening US dollar, commodity price inflation and Chinese monetary easing will more than offset the trifecta of rising election-related risks, the current unresponsiveness of our relative profit growth models and the lack of confirmation of a liquidity-to-growth transition. This will pave the way for a cyclicals outperformance phase at the expense of defensives. Anastasios Avgeriou US Equity Strategist anastasios@bcaresearch.com
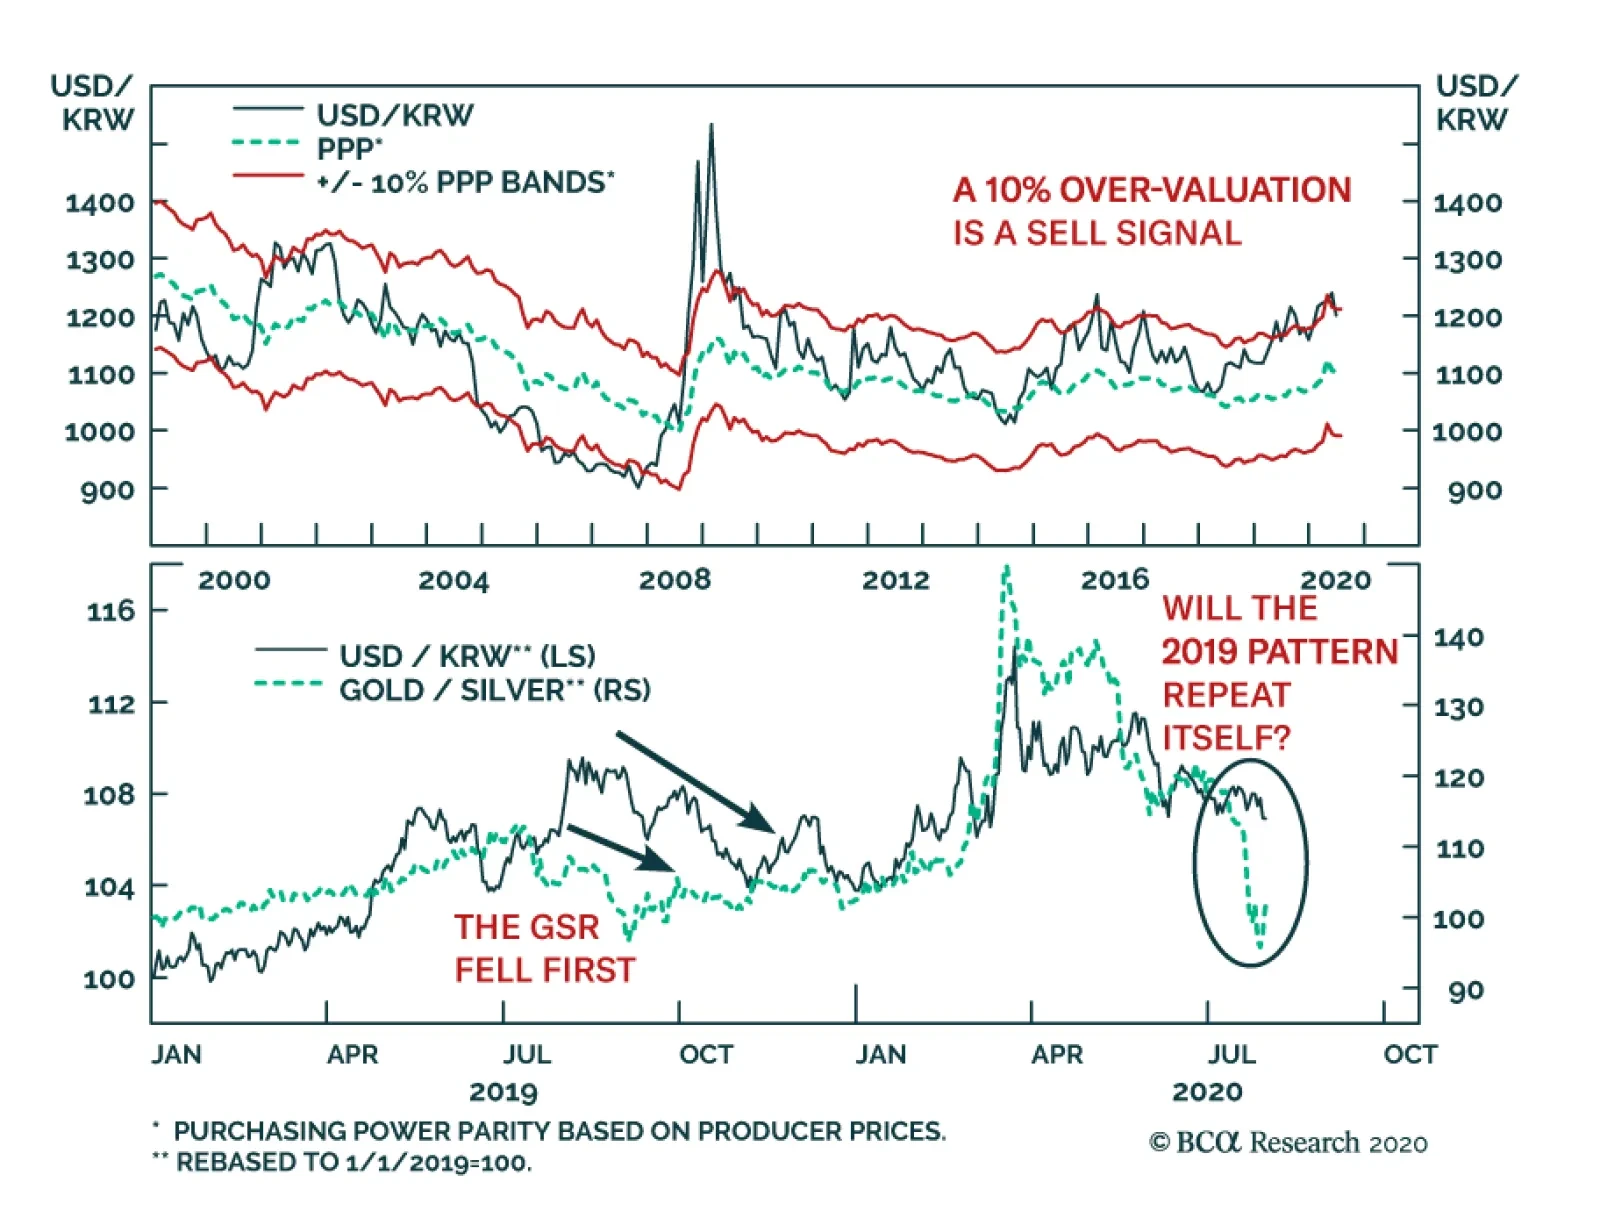
Selling USD/KRW is an attractive trade. The KRW is cheap. USD/KRW trades 10% above it purchasing-power-parity equilibrium. Since the GFC, a 10% premium has created a reliable entry point to sell USD/KRW. This time will not be different. Korea runs a…
Highlights The tech sector faces mounting domestic political and geopolitical risks. We fully expected stimulus hiccups but believe they will give way to large new fiscal support, given that COVID-19 is weighing on consumer confidence. Europe’s relative political stability is a good basis for the euro rally but any comeback in opinion polling by President Trump could give dollar bulls new life. DXY is approaching a critical threshold below which it would break down further. The US could take aggressive actions on Russia and Iran, but China and the Taiwan Strait remain the biggest geopolitical risk. Feature Near-term risks continue to mount against the equity rally, even as governments’ combined monetary and fiscal policies continue to support a cyclical economic rebound. Chart 1Tech Bubble Amid Tech War
Tech Bubble Amid Tech War
Tech Bubble Amid Tech War
Testimony by the chief executives of Facebook, Apple, Amazon, and Alphabet to the US House of Representatives highlighted the major political risks facing the market leaders. There are three reasons not to dismiss these risks despite the theatrical nature of the hearings. First, the tech companies’ concentration of wealth would be conspicuous during any economic bust, but this bust has left pandemic-stricken consumers more reliant on their services. Second, acrimony is bipartisan – conservatives are enraged by the tendency of the tech companies to side with the Democratic Party in policing the range of acceptable political discourse, and they increasingly agree with liberals that the companies have excessive corporate power warranting anti-trust probes. Executive action is the immediate risk, but in the coming one-to-two years congressional majorities will also be mustered to tighten regulation. Third, technology is the root of the great power struggle between the US and China – a struggle that will not go away if Biden wins the election. Indeed Biden was part of the administration that launched the US’s “Pivot to Asia” and will have better success in galvanizing US diplomatic allies behind western alternatives to Chinese state-backed and military-linked tech companies. US tech companies struggle to outperform Chinese tech companies except during episodes of US tariffs, given the latter firms’ state-backed turn toward innovation and privileged capture of the Chinese domestic market (Chart 1). The US government cannot afford to break up these companies without weighing the strategic consequences for America’s international competitiveness. The attempt to coordinate a western pressure campaign against Huawei and other leading Chinese firms will continue over the long run as they are accused of stealing technology, circumventing UN sanctions, violating human rights, and compromising the national security of the democracies. China, for its part, will be forced to take counter-measures. US tech companies will be caught in the middle. Like the threat of executive regulation in the domestic sphere, the threat of state action in the international sphere is difficult to time. It could happen immediately, especially given that the US is having some success in galvanizing an alliance even under President Trump (see the UK decision to bar Huawei) and that President Trump’s falling election prospects remove the chief constraint on tough action against China (the administration will likely revoke Huawei’s general license on August 13 or closer to the election). Massive domestic economic stimulus empowers the US to impose a technological cordon and China to retaliate. Combining this headline risk to the tech sector with other indications that the equity rally is extended – the surge in gold prices, the fall in the 30-year/5-year Treasury slope – tells us that investors should be cautious about deploying fresh capital in the near term. Republicans Will Capitulate To New Stimulus Just as President Trump has ignored bad news on the coronavirus, financial markets have ignored bad news on the economy. Dismal Q2 GDP releases were fully expected – Germany shrank by 10.1% while the US shrank by 9.5% on a quarterly basis, 32.9% annualized. But the resurgence of the virus is threatening new government restrictions on economic activity. US initial unemployment claims have edged up over the past three weeks. US consumer confidence regarding future expectations plummeted from 106.1 in June to 91.5 in July, according to the Conference Board’s index. Chart 2Global Instability Will Follow Recession
A Tech Bubble Amid A Tech War (GeoRisk Update)
A Tech Bubble Amid A Tech War (GeoRisk Update)
Setbacks in combating the virus will hurt consumers even assuming that governments lack the political will to enforce new lockdowns. The share of countries in recession has surged to levels not seen in 60 years (Chart 2). Financial markets can look past recessions, but the pandemic-driven recession will result in negative surprises and second-order effects that are unforeseen. Yes, fresh fiscal stimulus is coming, but this is more positive for the cyclical outlook than the tactical outlook. Stimulus “hiccups” could precipitate a near-term pullback – such a pullback may be necessary to force politicians to resolve disputes over the size and composition of new stimulus. This risk is immediate in the United States, where House Democrats, Senate Republicans, and the White House have hit an all-too-predictable impasse over the fifth round of stimulus. The bill under negotiation is likely to be President Trump’s last chance to score a legislative victory before the election and the last significant legislative economic relief until early 2021. The Senate Republicans have proposed a $1.1 trillion HEALS Act in response to the House Democrats’ $3.4 trillion HEROES Act, passed in mid-May. As we go to press, the federal unemployment insurance top-up of $600 per week is expiring, with a potential cost of 3% of GDP in fiscal tightening, as well as the moratorium on home evictions. Congress will have to rush through a stop-gap measure to extend these benefits if it cannot resolve the debate on the larger stimulus package. If Democrats and Republicans split the difference then we will get $2.5 trillion in stimulus, likely by August 10. Compromise on the larger package is easy in principle, as Table 1 shows. If the two sides split the difference between their proposals in a commonsense way, as shown in the fourth and fifth columns of Table 1, then the result will be a $2.5 trillion stimulus. This estimate fits with what we have published in the past and likely meets market expectations for the time being. Table 1Outline Of Fifth US COVID Stimulus Package (Estimate)
A Tech Bubble Amid A Tech War (GeoRisk Update)
A Tech Bubble Amid A Tech War (GeoRisk Update)
Whether it is enough for the economy depends on how the virus develops and how governments respond once flu season picks up and combines with the coronavirus to pressure the health system this fall. A back-of-the-envelope estimate of the amount of spending necessary to keep the budget deficit from shrinking in the second half of the year comes much closer to the House Democrats’ $3.4 trillion bill (Table 2), which suggests that what appears to be a massive stimulus today could appear insufficient tomorrow. Nevertheless, $2.5 trillion is not exactly small. It would bring the US total to $5 trillion year-to-date, or 24% of GDP! Table 2Reducing The Budget Deficit On A Quarterly Basis Will Slow Economy
A Tech Bubble Amid A Tech War (GeoRisk Update)
A Tech Bubble Amid A Tech War (GeoRisk Update)
While a compromise bill should come quickly, the Republican Party is more divided over this round of stimulus than earlier this year. Chart 3US Personal Income Looks Good Compared To 2008-09
US Personal Income Looks Good Compared To 2008-09
US Personal Income Looks Good Compared To 2008-09
First, there is some complacency due to the fact that the economy is recovering, not collapsing as was the case back in March. Our US bond strategist, Ryan Swift, has shown that US personal income is much better off, thus far, than it was in the months following the 2008 financial crisis, even though the initial pre-transfer hit to incomes is larger (Chart 3). Second, the Republican Party is reacting to growing unease within its ranks over the yawning budget deficit, now the largest since World War II (Chart 4). Chart 4If Republicans React To Deficit Concerns They Cook Their Own Goose
If Republicans React To Deficit Concerns They Cook Their Own Goose
If Republicans React To Deficit Concerns They Cook Their Own Goose
Chart 5Consumer Confidence Sends Warning Signal To Republicans
A Tech Bubble Amid A Tech War (GeoRisk Update)
A Tech Bubble Amid A Tech War (GeoRisk Update)
If Republicans are guided by complacency and fiscal hawks, they will cook their own goose. A failure to provide government support will cause a financial market selloff, will hurt consumer confidence, and will put the final nail in the coffin of their own chance of re-election as well as President Trump’s. Consumer confidence tracks fairly well with presidential approval rating and election outcomes. A further dip could disqualify Trump, whereas a last-minute boost due to stimulus and an economic surge could line him up for a comeback in the last lap (Chart 5). These constraints are obvious so we maintain our high conviction call that a bill will be passed, likely by August 10. But at these levels on the equity market, we simply have no confidence in the market gyrations leading up to or following the passage of the bill. Our conviction level is on the cyclical, 12-month horizon, in which case we expect US and global stimulus to operate and equities to rise. Bottom Line: Political and economic constraints will force Republicans to join Democrats and pass a new stimulus bill of about $2.5 trillion by around August 10. This is cyclically positive, but hiccups in getting it passed, negative surprises, and other risks tied to US politics discourage us from taking an overtly bullish stance over the next three months. Yes, US-China Tensions Are Still Relevant Chart 6Chinese Politburo"s Bark Worse Than Bite On Stimulus
Chinese Politburo"s Bark Worse Than Bite On Stimulus
Chinese Politburo"s Bark Worse Than Bite On Stimulus
Financial markets have shrugged off US-China tensions this year for understandable reasons. The pandemic, recession, and stimulus have overweighed the ongoing US-China conflict. As we have argued, China is undertaking a sweeping fiscal and quasi-fiscal stimulus – despite lingering hawkish rhetoric – and the size is sufficient to assist in global economic recovery as well as domestic Chinese recovery. What the financial market overlooks is that China’s households and firms are still reluctant to spend (Chart 6). China’s Politburo's late July meetings on the economy are frequently important. Initial reports of this year’s meet-up reinforce the stimulus narrative. Hints of hawkishness here and there serve a political purpose in curbing market exuberance, both at home and in the US election context, but China will ultimately remain accommodative because it has already bumped up against its chief constraint of domestic stability. Note that this assessment also leaves space for market jitters in the near-term. The phase one trade deal remains intact as President Trump is counting on it to make the case for re-election while China is looking to avoid antagonizing a loose cannon president who still has a chance of re-election. As long as broad-based tariff rates do not rise, in keeping with Trump’s deal, financial markets can ignore the small fry. We maintain a 40% risk that Trump levels sweeping punitive measures; our base case is that he goes to the election arguing that he gets results through his deal-making while carrying a big stick. At the same time, our view that domestic stimulus removes the economic constraints on conflict, enabling the two countries to escalate tensions, has been vindicated in recent weeks. Chinese political risk continues on a general uptrend, based on market indicators. The market is also starting to price in the immense geopolitical risks embedded in Taiwan’s situation, which we have highlighted consistently since 2016. While North Korea remains on a diplomatic track, refraining from major military provocations, South Korean political risk is still elevated both for domestic and regional reasons (Chart 7). Chart 7China Political Risk Still Trending Upward
China Political Risk Still Trending Upward
China Political Risk Still Trending Upward
The market is gradually pricing in a higher risk premium in the renminbi, Taiwanese dollar, and Korean won, and this pricing accords with our longstanding political assessment. The closure of the US and Chinese consulates in Houston and Chengdu is only the latest example of this escalating dynamic. While the US’s initial sanctions on China over Hong Kong were limited in economic impact, the longer term negative consequences continue to build. Hong Kong was the symbol of the Chinese Communist Party’s compatibility with western liberalism; the removal of Hong Kong’s autonomy strikes a permanent blow against this compatibility. China’s decision to go forward with the imposition of a national security law in Hong Kong – and now to bar pro-democratic candidates from the September 6 Legislative Council elections, which will probably be postponed anyway – has accelerated coalition-building among the western democracies. The UK is now clashing with China more openly, especially after blocking Huawei from its 5G system and welcoming Hong Kong political refugees. Australia and China have fought a miniature trade war of their own over China’s lack of transparency regarding COVID-19, and Canada is implicated in the Huawei affair. Even the EU has taken a more “realist” approach to China. Across the Taiwan Strait, political leaders are assisting fleeing Hong Kongers, crying out against Beijing’s expansion of control in its periphery, rallying support from informal allies in the US and West, and doubling down on their “Silicon Shield” (prowess in semiconductor production) as a source of protection. Intel Corporation’s decision to increase its dependency on TSMC for advanced microchips only heightens the centrality of this island and this company in the power struggle between the US and China. China cannot fulfill its global ambitions if the US succeeds in creating a technological cordon. Taiwan is the key to China’s breaking through that cordon. Therefore Taiwan is at heightened risk of economic or even military conflict. The base case is that Beijing will impose economic sanctions first, to undermine Taiwanese leadership. The uncertainty over the US’s willingness to defend Taiwan is still elevated, even if the US is gradually signaling a higher level of commitment. This uncertainty makes strategic miscalculations more likely than otherwise. But Taiwan’s extreme economic dependence on the mainland gives Beijing a lever to pursue its interests and at present that is the most important factor in keeping war risk contained. By the same token, Taiwanese economic and political diversification increases that risk. A “fourth Taiwan Strait crisis” that involves trade war and sanctions is our base case, but war cannot be ruled out, and any war would be a major war. Thus investors can safely ignore Tik-Tok, Hong Kong LegCo elections, and accusations of human rights violations in Xinjiang. But they cannot ignore concrete deterioration in the Taiwan Strait. Or, for that matter, the South and East China Seas, which are not about fishing and offshore drilling but about China’s strategic depth and positioning around Taiwan. Taiwan is at heightened risk of economic or military conflict. The latest developments have seen the CNY-USD exchange rate roll over after a period of appreciation associated with bilateral deal-keeping (Chart 8). Depreciation makes it more likely that President Trump will take punitive actions, but these will still be consistent with maintaining the phase one deal unless his re-election bid completely collapses, rendering him a lame duck and removing his constraints on more economically significant confrontation. We are perilously close to such an outcome, which is why Trump’s approval rating and head-to-head polling against Joe Biden must be monitored closely. If his budding rebound is dashed, then all bets are off with regard to China and Asian power politics. Chart 8A Warning Of Further US-China Escalation
A Warning Of Further US-China Escalation
A Warning Of Further US-China Escalation
Bottom Line: China’s stimulus, like the US stimulus, is a reason for cyclical optimism regarding risk assets. The phase one trade deal with President Trump is less certain – there is a 40% chance it collapses as stimulus and/or Trump’s political woes remove constraints on conflict. Hong Kong is a red herring except with regard to coalition-building between the US and Europe; the Taiwan Strait is the real geopolitical risk. Maritime conflicts relate to Taiwan and are also market-relevant. Europe, Russia, And Oil Risks Europe has proved a geopolitical opportunity rather than a risk, as we have contended. The passage of joint debt issuance in keeping with the seven-year budget reinforces the point. The Dutch, facing an election early next year, held up the negotiations, but ultimately relented as expected. Emmanuel Macron, who convinced German Chancellor Angela Merkel to embrace this major compromise for European solidarity, is seeing his support bounce in opinion polls at home. He is being rewarded for taking a leadership position in favor of European integration as well as for overseeing a domestic economic rebound. His setback in local elections is overstated as a political risk given that the parties that benefited do not pose a risk to European integration, and will ally with him in 2022 against any populist or anti-establishment challenger. We still refrain from reinitiating our long EUR-USD trade, however, given the immediate risks from the US election cycle (Chart 9). We will reevaluate if Trump’s odds of victory fall further. A Biden victory is very favorable for the euro in our view. Chart 9EUR-USD Gets Boost From EU Solidarity
EUR-USD Gets Boost From EU Solidarity
EUR-USD Gets Boost From EU Solidarity
We are bullish on pound sterling because even a delay or otherwise sub-optimal outcome to trade talks is mostly priced in at current levels (Charts 10A and 10B). Prime Minister Boris Johnson has the raw ability to walk away without a deal, in the context of strong domestic stimulus, but the long-term economic consequences could condemn him to a single term in office. Compromise is better and in both parties’ interests. Chart 10APound Sterling A Buy Over Long Run
Pound Sterling A Buy Over Long Run
Pound Sterling A Buy Over Long Run
Chart 10BPound Sterling A Buy Over Long Run
Pound Sterling A Buy Over Long Run
Pound Sterling A Buy Over Long Run
Two other risks are worth a mention in this month’s GeoRisk Update: Chart 11Russia: GeoRisk Indicator Russian Bonds May Face Sanctions
Russia: GeoRisk Indicator Russian Bonds May Face Sanctions
Russia: GeoRisk Indicator Russian Bonds May Face Sanctions
Russia: In recent reports we have maintained that Russian geopolitical risk is understated by markets. Domestic unrest is rising, the Trump administration could impose penalties over Nordstream 2 or other issues to head off criticism on the campaign trail, and a Biden administration would be outright confrontational toward Putin’s regime. Moscow may intervene in the US elections or conduct larger cyber attacks. US sanctions could ultimately target trading of local currency Russian government bonds, which so far have been spared (Chart 11). Iran: The jury is still out on whether the recent series of mysterious explosions affecting critical infrastructure in Iran are evidence of a clandestine campaign of sabotage (Table 3). The nature of the incidents leaves some room for accident and coincidence.1 But the inclusion of military and nuclear sites in the list leads us to believe that some degree of “wag the dog” is going on. The prime suspect would be Israel and/or the United States during the window of opportunity afforded by the Trump administration, which looks to be closing over the next six months. Trump likely has a high tolerance for conflict with Iran ahead of the election. Even though Americans are war-weary, they will rally to the president’s defense if Iran is seen as the instigator, as opinion polls showed they did in September 2019 and January of this year. Iran is avoiding goading Trump so far but if it suffers too great of damage from sabotage then it may be forced to react. The dynamic is unstable and hence an oil price spike cannot be ruled out. Table 3Wag The Dog Scenario Playing Out In Iran
A Tech Bubble Amid A Tech War (GeoRisk Update)
A Tech Bubble Amid A Tech War (GeoRisk Update)
Chart 12Oil Supply Risks Stem From Iran/Iraq, But COVID Threat To Demand Persists
Oil Supply Risks Stem From Iran/Iraq, But COVID Threat To Demand Persists
Oil Supply Risks Stem From Iran/Iraq, But COVID Threat To Demand Persists
Oil markets have the capacity and the large inventories necessary to absorb supply disruptions caused by a single Iranian incident (Chart 12). Only a chain reaction or major conflict would add to upward pressure. This would also require global demand to stay firm. The threat from COVID-19 suggests that volatility is the only thing one can count on in the near-term. Over the long run we remain bullish crude oil due to the unfettered commitment by world governments to reflation. Bottom Line: The euro rally is fundamentally supported but faces exogenous risks in the short run. We would steer clear of Russian currency and local currency bonds over the US election campaign and aftermath, particularly if Trump’s polling upturn becomes a dead cat bounce. Iran is a “gray swan” geopolitical risk, hiding in plain sight, but its impact on oil markets will be limited unless a major war occurs. Investment Implications The US dollar is at a critical juncture. Our Foreign Exchange Strategist Chester Ntonifor argues that if the DXY index breaks beneath the 93-94 then the greenback has entered a structural bear market. The most recent close was 93.45 and it has hovered below 94 since Monday. Failure to pass US stimulus quickly could result in a dollar bounce along with other safe havens. Over the short run, investors should be prepared for this and other negative surprises relating to the US election and significant geopolitical risks, especially involving China, the tech war, and the Taiwan Strait. Over the long run, investors should position for more fiscal support to combine with ultra-easy monetary policy for as far as the eye can see. The Federal Reserve is not even “thinking about thinking about raising rates.” This combination ultimately entails rising commodity prices, a weakening dollar, and international equity outperformance relative to both US equities and government bonds. Matt Gertken Vice President Geopolitical Strategy mattg@bcaresearch.com Footnotes 1 See Raz Zimmt, "When it comes to Iran, not everything that goes boom in the night is sabotage," Atlantic Council, July 30, 2020. Section II: Appendix : GeoRisk Indicator China
China: GeoRisk Indicator
China: GeoRisk Indicator
Russia
Russia: GeoRisk Indicator
Russia: GeoRisk Indicator
UK
UK: GeoRisk Indicator
UK: GeoRisk Indicator
Germany
Germany: GeoRisk Indicator
Germany: GeoRisk Indicator
France
France: GeoRisk Indicator
France: GeoRisk Indicator
Italy
Italy: GeoRisk Indicator
Italy: GeoRisk Indicator
Canada
Canada: GeoRisk Indicator
Canada: GeoRisk Indicator
Spain
Spain: GeoRisk Indicator
Spain: GeoRisk Indicator
Taiwan
Taiwan: GeoRisk Indicator
Taiwan: GeoRisk Indicator
Korea
Korea: GeoRisk Indicator
Korea: GeoRisk Indicator
Turkey
Turkey: GeoRisk Indicator
Turkey: GeoRisk Indicator
Brazil
Brazil: GeoRisk Indicator
Brazil: GeoRisk Indicator
Section III: Geopolitical Calendar
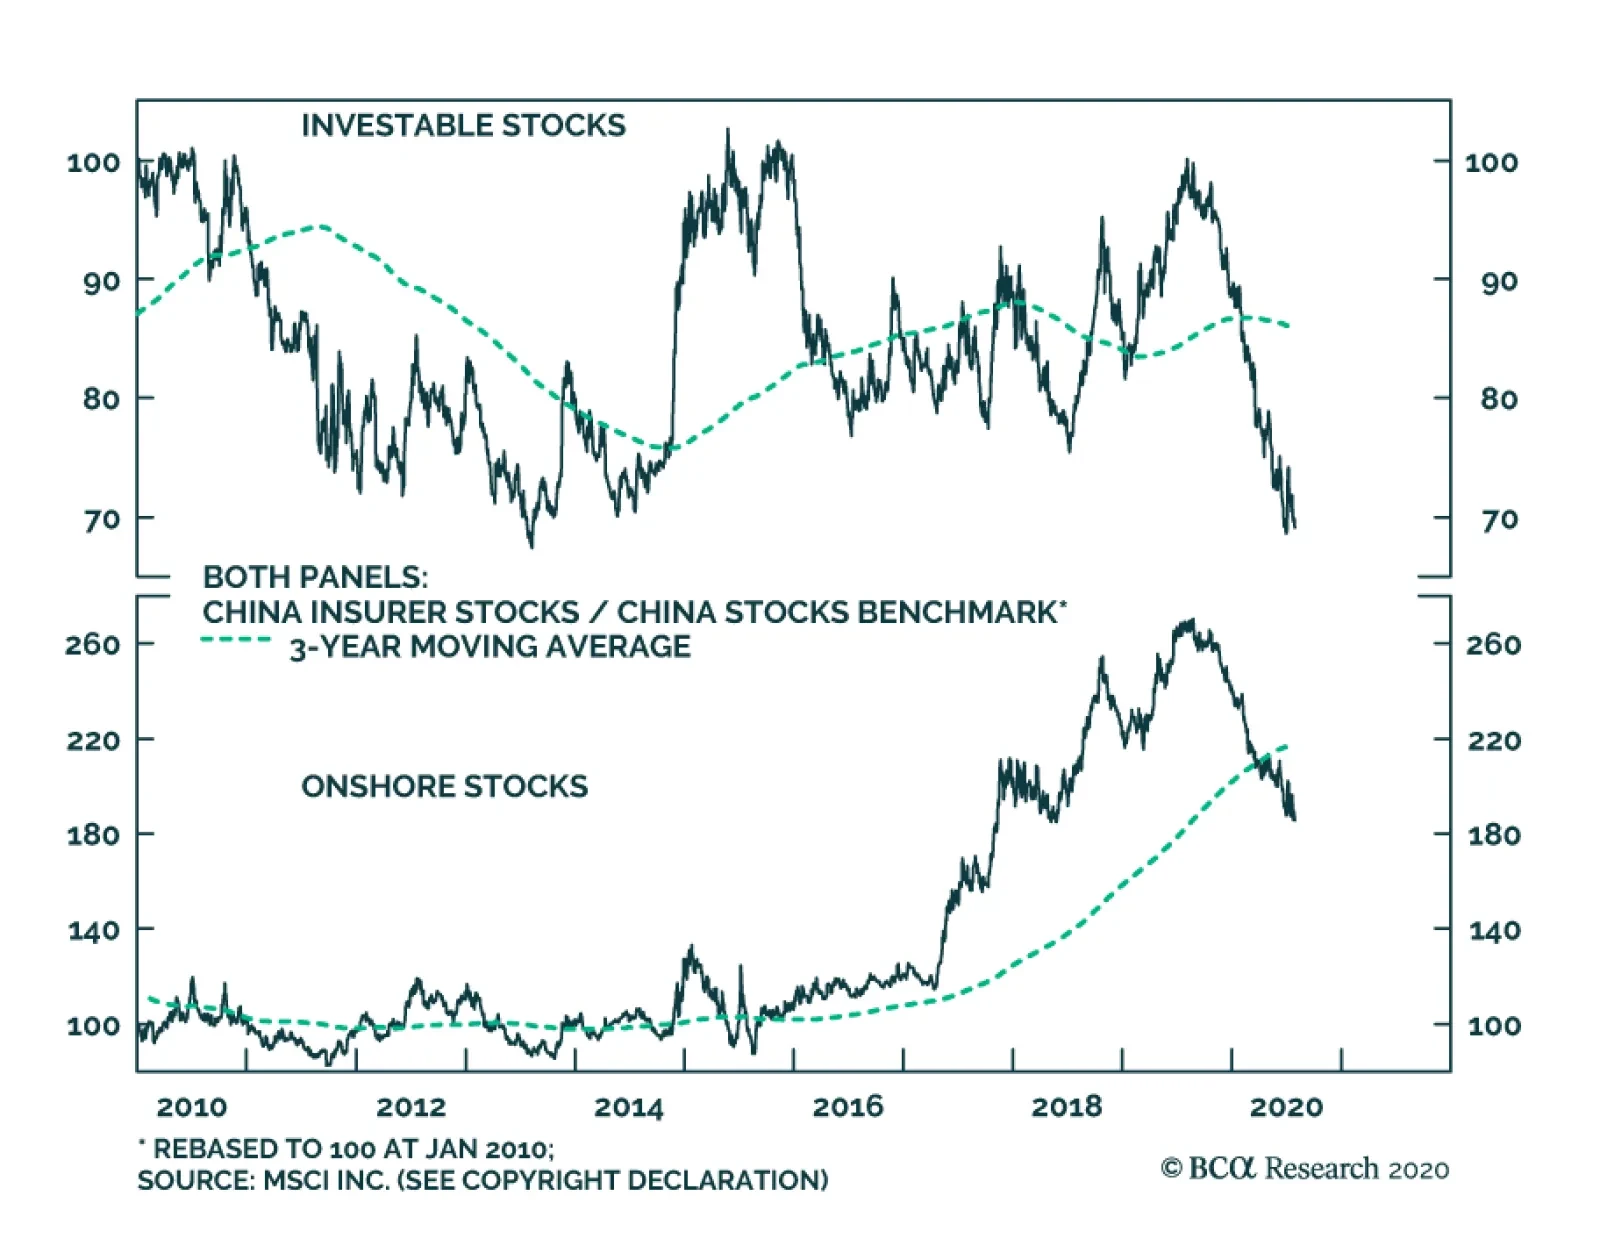
BCA Research's China Investment Strategy & Emerging Markets Strategy services recommend going long Chinese insurance stocks in absolute terms. They also recommend accumulating and overweighting Chinese healthcare stocks on a 15% correction. China’s…
Highlights China’s healthcare expenditure is projected to rise due to the increasing affluence and rapid aging of its population. The desire to access healthcare services beyond the basic coverage provided by the public health insurance will increasingly prompt people to purchase health insurance products from private insurers. We recommend going long Chinese insurance stocks in absolute terms. We also recommend accumulating and overweighting Chinese healthcare stocks on a 15% correction. Feature The aging population and the rapidly expanding middle class in China entail that healthcare expenditures will remain on a secular growth trajectory. The COVID-19 outbreak will function as a catalyst for the rapid transformation of China's healthcare system. In fact, many game changing trends in global healthcare systems will probably be attributed to the COVID-19 pandemic. Healthcare Expenditures: Still Low Health expenditures per capita in China grew substantially over the same period of time, but their level is still below those in most countries. Chart 1Chinese Healthcare Expenditure Will Grow 10% CAGR
Chinese Healthcare Expenditure Will Grow 10% CAGR
Chinese Healthcare Expenditure Will Grow 10% CAGR
Health expenditures in China have grown considerably since the economic reforms started in 1978. Between 1978 and 2018, total health expenditures in China grew at a compound annual growth rate (CAGR) of 17% in nominal terms, higher than the 15% growth in nominal GDP (Chart 1, top panel). Notwithstanding the rapid expansion of China’s healthcare market, expenditures remained at a modest 6.4% of China’s GDP in 2018 (Chart 1, bottom panel), far below the OECD average of 9%. Health expenditures per capita in China grew substantially over the same period of time, but their level is still below those in most countries. In 2017, health expenditures per capita in China were $841 in PPP (purchasing power parity) terms, ranking 92nd worldwide. Japan, by comparison, ranks 18th with $4,550, and Korea ranks 31th with $3,000, both in PPP terms (Chart 2). Chart 2China Ranks Low In Health Expenditure Per Capita Worldwide
China: Healthcare Now And Beyond
China: Healthcare Now And Beyond
Healthcare Capacity And Healthy China 2030 Chart 3China Healthcare Capacities Are Rising Fast
China Healthcare Capacities Are Rising Fast
China Healthcare Capacities Are Rising Fast
Access to adequate healthcare is crucial to social and economic development, as healthy human capital fosters productivity and economic growth. In China, healthcare capacity is still subdued. After the pandemic, authorities will divert resources to this sector to ensure it expands quickly. In 2018, the number of physicians and nurses per 1000 Chinese people was 2.6 and 2.9, respectively (Chart 3), far below the OECD average of 3.5 physicians and 8.8 nurses per 1,000 people. Hospital beds per 1000 people is 4.3 in China, compared to an average of 4.7 across OECD countries. In Japan and Korea, the measure is much higher, at 13.1 and 12.3 beds per 1,000 people, respectively (Chart 3, bottom panel). China released the Healthy China 2030 (HC 2030) blueprint in 2016, covering public health services, environmental management, the medical industry, and food and drug safety. The five specific goals of this blueprint are to improve the population’s health, control against major risks, increase the capacity of healthcare services, grow the scale of the healthcare industry, and improve the health service system generally. This program has set targets for health service capacity, including an increase in the number of doctors, nurses and beds per 1,000 people to 3, 4.7 and 6, respectively, by the year 2030. The blueprint also aims to further ease the financial burden imposed on the population by the cost of healthcare and medical treatments. Currently, in China, 29% of health costs are paid by individuals; HC 2030 recommends a reduction to 25%. We will discuss these objectives in the next section. Healthcare Financing: A Looming Funding Crunch The aging population, along with its rising income, will drive up health expenditures in the years to come. Chart 4China Elderly Population Will Rise Significantly
China Elderly Population Will Rise Significantly
China Elderly Population Will Rise Significantly
There are currently more than 167 million people over the age of 65 in China. By this measure, China is already the largest eldercare market in the world in terms of the absolute number of elderly people. What is more, China’s elderly population is growing rapidly and is expected to reach almost 200 million by 2025 (Chart 4). The aging population, along with its rising income, will drive up health expenditures in the years to come. As health expenditures grow, so will investment opportunities. Global healthcare systems can generally be classified into the three categories shown in Table 1. China’s health insurance system more closely resembles Germany’s national social health insurance system than the US commercial health insurance model. China’s healthcare system and insurance scheme is illustrated in Table 2. Table 1Overview Of Major Healthcare Systems Worldwide
China: Healthcare Now And Beyond
China: Healthcare Now And Beyond
Table 2Main Features Of China's Three Basis Social Health Insurance Schemes
China: Healthcare Now And Beyond
China: Healthcare Now And Beyond
In 2000, just over 20% of Chinese citizens had healthcare coverage. The SARS outbreak in 2003 was a wake-up call for Chinese leaders. Thanks to heavy government subsidies and political commitments, China achieved universal health insurance coverage in 2011, when nearly 95% of its 1.4 billion people had health insurance. This represents the largest and fastest expansion of insurance coverage in human history. Chart 5Individuals Health Expenditures Remain High
Individuals Health Expenditures Remain High
Individuals Health Expenditures Remain High
However, the government-sponsored health insurance plan provides for only basic coverage. Government budgetary spending accounted for 28% of total health expenditures in 2018 and the population’s out-of-pocket costs amounted to 29%, such that the remaining 43% was covered by the public social health insurance contributions (Chart 5). China’s health insurance is supervised at the national level and guided by the principle that all citizens are entitled to receive basic healthcare. Nevertheless, local governments are ultimately responsible for funding and offering these health services. This leads to unevenly distributed healthcare capacities across different provinces, as more resources are concentrated in wealthier jurisdictions. People can only receive a reimbursement for healthcare costs from their province of residence, as indicated on their hukou registration documents. Migrant urban professionals and laborers have to return to the place of their household registration to access healthcare. Chinese policy makers have been working on reforming the reimbursement system now for many years. As of the end of 2019, 3.95 million people have benefited from inter-provincial health insurance settlements. Relying heavily on local government contributions to healthcare expenditures is the primary reason why government spending on healthcare is relatively low, at only 1.7% of GDP and 7% of total general (central and local) government spending1 (Chart 6). Government expenditures on social security (which includes contributions to social health insurance, pension, unemployment and work injury insurance) make up 12% of overall government spending.1 The outbreak of COVID-19 sounded the alarm across Chinese society. Building a comprehensive and effective healthcare system with adequate capacity will become one of the most important priorities over the coming decade. The people’s well-being will be critical to social stability as its increasingly affluent population is asking for better healthcare services. Chart 6Government Spending In Healthcare
Government Spending In Healthcare
Government Spending In Healthcare
Chart 7China: A Rapidly Aging Population
China: A Rapidly Aging Population
China: A Rapidly Aging Population
However, the overall sustainability of the current healthcare financing scheme is questionable. Chart 7 shows the old age-dependency ratio, defined as the ratio of older dependents (people over the age of 64) to the working-age population (25 to 64-year old). The ratio is expected to increase from the current 19% to 30% in 2030. This means a decreasing contribution to social insurance budgets from the working population and an increase in healthcare spending on seniors. What makes the situation worse is the opacity of the National Social Security Fund (SSF). The SSF manages money reserved for pension and insurance disbursements related to medical, unemployment and injury needs for future use. Of the 2.6 trillion RMB under SSF management, at the end of 2019, over 90% are invested domestically. The fund’s average 10-year investment return is close to 6%, which is lower than the average nominal GDP growth rate of 11%, over the same period. With declining revenues from workforce contributions and rising healthcare costs, the ability of the social security system to finance proper healthcare service provisions is endangered. Furthermore, the replenishing of the SSF, so far, has depended on central government contributions and asset transfers from state-owned enterprises to the SSF. Bottom Line: As demand for healthcare services increases, the current public scheme for financing healthcare is going to be increasingly unable to cover the costs. Private Health Insurance Private health insurance offers a more extensive level of protection than the state-based coverage. Currently, most private health insurance plans provide supplementary insurance products to complement public health insurance plans. Supplementary insurance and critical illness products are the most popular because the public insurance systems cannot fully cover the cost of catastrophic illnesses. The private health insurance industry has been thriving in recent years and is expected to continue growing because of increased consumer awareness. The written premiums attributed to health insurance registered a compound annual growth rate of 36% between 2013 and 2019 (Chart 8). However, penetration into China’s health insurance market remains far behind that of more developed markets, signaling huge growth potential. One measure of insurance industry penetration is insurance depth. It is defined as the percentage of the GDP attributed to the total written premium for insurance. China’s insurance depth is currently 0.7% for health insurance and 4.2% for overall insurance (Chart 9), whereas the overall insurance depth is 11% in South Korea, 9% in Japan, and 7% in the US. Chart 8Health Insurance Premiums Are Skyrocketing
Health Insurance Premiums Are Skyrocketing
Health Insurance Premiums Are Skyrocketing
Chart 9China: Health Insurance Penetration
China: Health Insurance Penetration
China: Health Insurance Penetration
Faced with financial strains and a growing demand for healthcare services, the government is supporting private healthcare providers by relaxing regulatory restrictions and offering tax incentives to Chinese consumers when they buy health insurance. Private health insurance offers the growing middle-income class a more extensive level of protection than the state-based coverage. In regard to insurance companies’ asset management, the regulators raised the equity investment cap for all insurers earlier this month from 30% to 45% of total assets. In May of this year, regulators also allowed insurers to invest in the secondary capital bonds issued by banks, as well as in perpetual bonds. This expanded investment opportunity should help insurers diversify their investment portfolios and therefore increase the efficacy of their asset/liability management (ALM). Bottom Line: Private health insurance offers the growing middle-income class a more extensive level of protection than the state-based coverage. This underdeveloped private insurance market presents substantial opportunities. Investment Conclusions As China’s population ages, incomes rise and private healthcare services expand, investment opportunities will also increase. In short, the growth trajectory of China’s healthcare sector warrants investors’ attention. To play on this healthcare theme in China, we are initiating two strategic investment positions: First, go long Chinese insurance companies in absolute terms. Chinese insurer stocks have rallied in absolute terms since March lows, but then lagged relative to the benchmark (Chart 10 & 11); Chart 10Chinese Insurance Stocks: Rising In Absolute Terms...
Chinese Insurance Stocks: Rising In Absolute Terms...
Chinese Insurance Stocks: Rising In Absolute Terms...
Chart 11…But Underperforming The Benchmark
...But Underperforming The Benchmark
...But Underperforming The Benchmark
Double-digit CAGR of insurance premiums entails a steady asset expansion (Chart 8 on page 8). High and steady growth at a time of a low discount factor warrants high equity multiples. The private insurance industry’s gross profit margin proxy, calculated as insurance premiums minus insurance payments, divided by insurance premiums, amount to a whopping of 67%, with health insurance at 65% and life insurance at 87% (Chart 12). The equity valuations are reasonable. Unlike the tech and media sectors of the new economy, that have sky-high multiples, the trailing price to earnings ratio for insurers is still 8.8, 45% lower than the 10-year average. (Chart 13). Chart 12Chinese Insurance Companies: Outstanding Gross Profit Margins
Chinese Insurance Companies: Outstanding Gross Profit Margins
Chinese Insurance Companies: Outstanding Gross Profit Margins
Chart 13Attractive Valuations
Attractive Valuations
Attractive Valuations
Insurance company assets will be better managed going forward due to the new asset/liability management (ALM) requirements imposed by the regulators. The ALM requirements were announced in March 2018 and then fully implemented in July 2019. The rules introduced quantitative risk-adjusted measurements to help insurers more accurately capture the risk of duration mismatch, negative spread and liquidity strain. The CBIRC regularly evaluates and ranks the competence of insurers’ ALM against peers. The key risk to shareholders of insurance companies is the credit risk of their portfolio. 39% of insurance sector portfolios are invested in other investments, which include long-term equity investments, project-based debt schemes, trust plans and asset management (Chart 14). Credit risks stemming from credit claims and asset management products warrant careful investor consideration. Chart 14Investment Portfolio Of The Insurance Industry
China: Healthcare Now And Beyond
China: Healthcare Now And Beyond
Chart 15Healthcare Stocks Have Rallied Massively...
Healthcare Stocks Have Rallied Massively...
Healthcare Stocks Have Rallied Massively...
Second, accumulate Chinese healthcare stocks on a 15% correction in absolute terms (Chart 15). While we believe that healthcare stocks are in a secular bull market, they have already rallied a lot since recent lows, and they are pricing in a lot of short-term good news. Chinese investable healthcare stocks registered 55% returns since the outbreak of COVID-19. The trailing P/E ratio reached 51, a decade high since 2010 (Chart 16). We are reluctant to buy and overweight this sector now and would wait for a better entry point. Chart 16...And Are Now Too Expensive
...And Are Now Too Expensive
...And Are Now Too Expensive
Lin Xiang, CFA Research Analyst LinX@bcaresearch.com Footnotes 1Does not include quasi-fiscal (off-balance sheet) government spending.