Asia
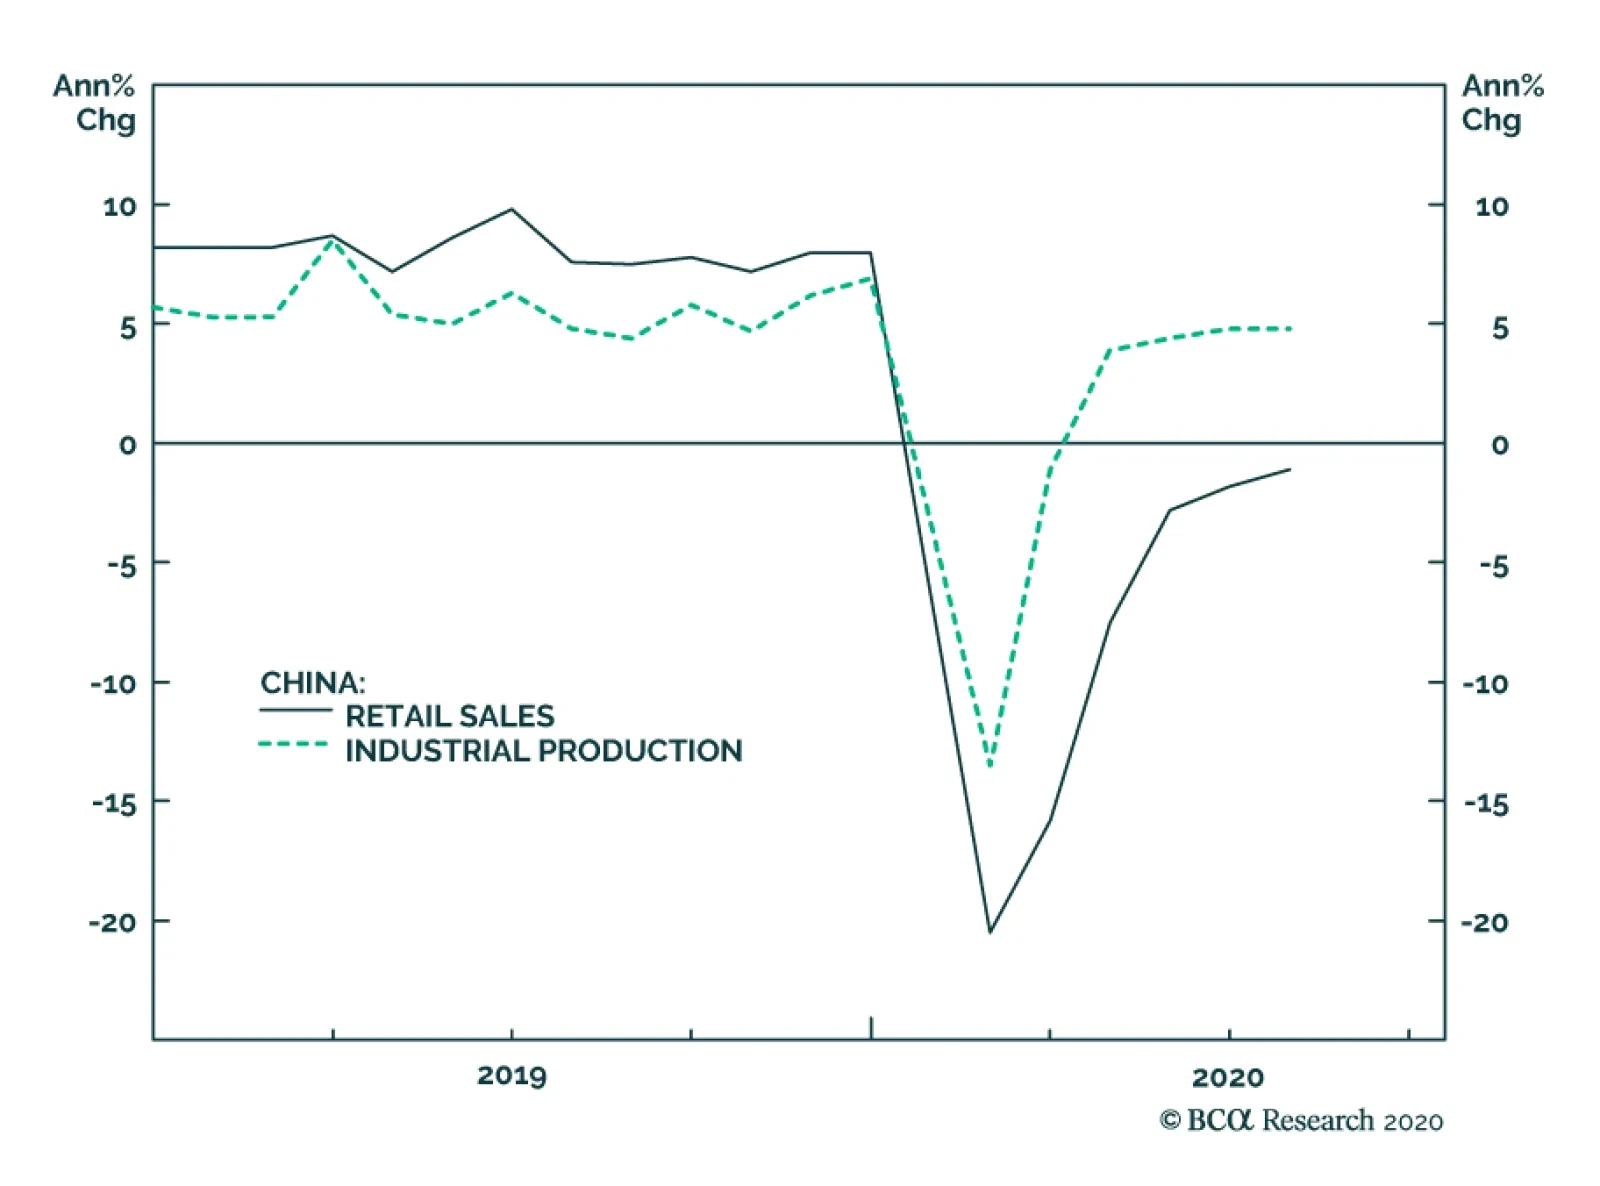
Chinese investment and retail sales data surprised slightly on the downside in July. Retail sales, for example, fell by 1.1% year-on-year, better than the 1.8% decline in June, but below the consensus expectation of +0.1%. The unemployment rate -– which the…

Highlights The strong rally in certain mega-cap stocks has masked the muted revival in the broad equity universe. Limited fiscal stimulus and a broken monetary transmission mechanism herald lackluster economic and profit recoveries. While dedicated EM equity investors should for now maintain an underweight position in India within an EM equity portfolio, they should consider upgrading this bourse on potential near-term underperformance. Absolute-return investors should consider buying this bourse on a setback in the coming months. Fixed-income investors should continue receiving 10-year swap rates but use any rupee selloff to rotate into cash bonds. Feature Indian share prices have staged a remarkable comeback following the financial carnage in March. However, the outlook for the economy and for corporate profits does not justify the current level of share prices. While this thesis is applicable to most markets around the world, the gap between share prices and economic activity is even larger in India. Chart I-1Loans To Companies Are Muted In India
Loans To Companies Are Muted In India
Loans To Companies Are Muted In India
In particular: The credit and liquidity crunch has been more acute in India than in many other EM and DM economies. Bank loan growth has surged in many countries as companies have borrowed to avoid a liquidity crunch due to a plunge in sales. However, in India bank loans to companies been shown little improvement (Chart I-1). This means that enterprises in India have not been able to draw on bank loans – to the same extent as they have done elsewhere – to attenuate a liquidity crunch stemming from revenue contraction. As a result, Indian enterprises have retrenched more in terms of both employment and capital spending, and their rebound has been more muted. As an example, the global manufacturing and non-manufacturing PMIs have risen above the 50 line but the same measures in India remain below the 50 line (Chart I-2). India’s employment index from the Manpower group has fallen to a record low as of early July (Chart I-3). As a result, household nominal income growth – which was slumping before the pandemic – has fallen much further. Chart I-2India Is Lagging In Global Recovery
India Is Lagging In Global Recovery
India Is Lagging In Global Recovery
Chart I-3India: Employment Conditions Are Very Poor
India: Employment Conditions Are Very Poor
India: Employment Conditions Are Very Poor
Passenger car and commercial vehicle sales have plummeted (Chart I-4). Corporate investment expenditure and production have crashed. Manufacturing output, capital goods production and imports all plummeted in March and April and rebounded only mildly in June (Chart I-5). Chart I-4India: Discretionary Spending Is Slow To Recover...
India: Discretionary Spending Is Slow To Recover...
India: Discretionary Spending Is Slow To Recover...
Chart I-5...As Are Production And Investment
...As Are Production And Investment
...As Are Production And Investment
Table I-1India: Share Of Each Equity Sector In Profits & Market Cap
Strategy For Indian Equities And Fixed-Income
Strategy For Indian Equities And Fixed-Income
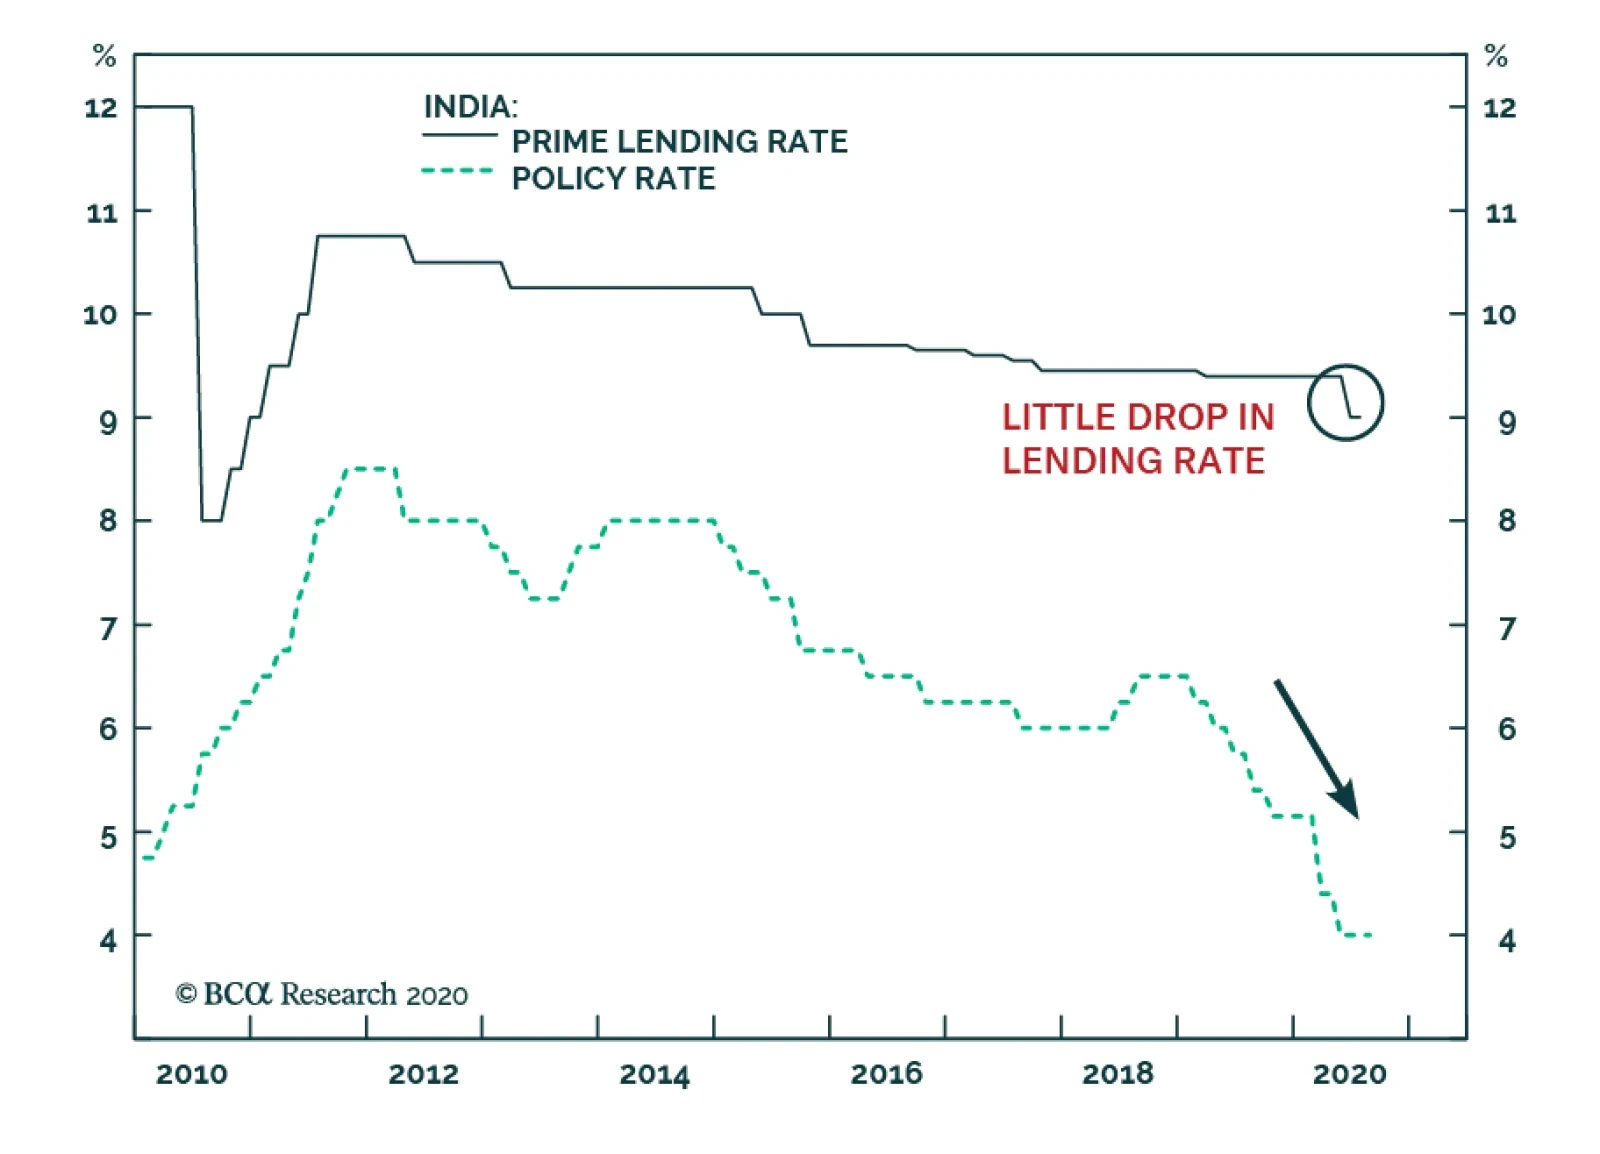
Economic activity will improve gradually but the level of activity will remain below the pandemic level for some time. As a result, corporate profits will be slow to revive. Odds are that it will take more than one and half years before the EPS of listed companies reach their 2019 level. This is especially true for severely hit sectors – financials, industrials, materials, and consumer discretionary stocks – which together account for 44% of listed companies’ profits. The sectors less affected by the pandemic recession – namely, consumer staples, information technology and health care – together account for 30% of corporate profits (Table I-1). A Breakdown In The Monetary Transmission Mechanism Impediments to rapid economic recovery are the modest fiscal stimulus and a breakdown in the monetary transmission mechanism. While India announced a large fiscal stimulus, much of this is made up of loan guarantees. Some measures like central bank purchases of government bonds also do not represent actual fiscal spending. Chart I-6 illustrates that government spending has risen only moderately and it has been offset by the drop in the credit impulse. Provided that the credit impulse will remain weak due to reasons we discuss below, the aggregate stimulus will not be sufficient to produce a robust and rapid recovery. The outlook for the economy and for corporate profits does not justify the current level of share prices. Critically, the monetary policy transmission mechanism was impaired even before the pandemic broke out in India, and the situation has gotten worse since March. Even though the Reserve Bank of India (RBI) has been reducing its policy rate, the prime lending rate has dropped very modestly (Chart I-7). Indian commercial banks which are saddled with non-performing loans (NPLs) have been reluctant to reduce their lending rates. Chart I-6Drag From Credit Impulse Has Offset Fiscal Stimulus
Drag From Credit Impulse Has Offset Fiscal Stimulus
Drag From Credit Impulse Has Offset Fiscal Stimulus
Chart I-7India: Very Little Decline In Prime Lending Rate
India: Very Little Decline In Prime Lending Rate
India: Very Little Decline In Prime Lending Rate
Even though AAA local currency corporate bond yields have dropped, BBB corporate bond yields remain above 10% (Chart I-8). This compares with 5-year government bond yields of 5%. Critically, in real (inflation-adjusted) terms, borrowing costs remain elevated (Chart I-9). Such elevated real borrowing costs will continue to hinder credit demand. Chart I-8Corporate Bond Yields Remain Elevated
Corporate Bond Yields Remain Elevated
Corporate Bond Yields Remain Elevated
Chart I-9Borrowing Costs In Real Terms Are Restrictive
Borrowing Costs In Real Terms Are Restrictive
Borrowing Costs In Real Terms Are Restrictive
Finally, banks might be reluctant to originate much credit because of the rise in NPLs and the uncertainty over the extension of government guarantees on pandemic-induced NPLs and their own recapitalization programs. Bottom Line: Limited fiscal stimulus and a broken monetary transmission mechanism herald lackluster economic and profit recoveries. Beyond Mega Caps The strong rally in certain mega-cap stocks has masked the muted revival in the broad equity universe. The MSCI equity index has rallied by 50% since its late March lows and stands only 7% below its pre-pandemic highs in local currency terms. Yet, the MSCI equal-weighted index and small caps are, in local currency terms, still 15% and 16% below their pre-pandemic highs, respectively (Chart I-10). The performance of the overall equity index has been exaggerated by the rally in Reliance Industries’ share price as well as information technology stocks, consumer staples and health care. The 150% surge in Reliance Industries stock price since late March lows is due to company-specific rather than macro factors. This company presently accounts for 15% of the MSCI India index. The monetary policy transmission mechanism was impaired even before the pandemic broke out in India. In addition, info technology, consumer staples and health care (including sales of personal care products and medicine) have benefited due to the pandemic. By contrast, equity sectors leveraged to the business cycle in general and discretionary spending in particular have all underperformed. Importantly, bank share prices have been devasted due to poor economic growth and rising NPLs. India’s mega-cap stocks that have led the rally since March lows are expensive, as anywhere else. Finally, India’s equal-weighted equity index has failed to meaningfully outperform the EM equal-weighted index after underperforming severely in late 2019 and Q1 2020 (Chart I-11). Chart I-10Muted Revival In Broader Equity Universe
Muted Revival In Broader Equity Universe
Muted Revival In Broader Equity Universe
Chart I-11India Relative To EM: Little Outperformance
India Relative To EM: Little Outperformance
India Relative To EM: Little Outperformance
Bottom Line: The advance in Indian share prices has been amplified by the rally in large-cap stocks. Meanwhile, the equal-weighted and small-cap indexes have done considerably worse reflecting the downbeat economic conditions. Equity Valuations And Strategy Chart I-12Indian Equity Valuations Are Elevated On A Market-Cap Basis...
Indian Equity Valuations Are Elevated On A Market-Cap Basis...
Indian Equity Valuations Are Elevated On A Market-Cap Basis...
As discussed earlier, India’s equity market leaders like information technology, consumer staples and health care are already expensive, trading at a trailing P/E ratio of 23, 47 and 33, respectively. The rest of the equity market is not expensive, but its profit outlook is mediocre. As to other valuation metrices, the market seems to be moderately expensive both on an absolute basis and versus the EM equity benchmark: The 12-month forward P/E ratio is 22.5, the highest in the decade (Chart I-12, top panel). Relative to the EM benchmark, on the same measure is trading at 50% premium (Chart I-12, bottom panel). Based on the equal-weighted equity index – i.e. stripping out the effect of large-cap stocks on the index, Indian equities are overvalued in absolute terms (Chart I-13, top panel). On this equal-weighted measure, Indian stocks are currently trading at a 35% premium versus their EM peers (Chart I-13, bottom panel). The cyclically-adjusted P/E ratio is close to the historical mean (Chart I-14, top panel). Chart I-13...And On An Equal-Weighted Basis
...And On An Equal-Weighted Basis
...And On An Equal-Weighted Basis
Chart I-14Cyclically-Adjusted P/E Ratio
Cyclically-Adjusted P/E Ratio
Cyclically-Adjusted P/E Ratio
However, the CAPE ratio is agnostic to corporate earnings on a cyclical horizon. It assumes corporate profits will revert to their long-term rising trend (Chart I-14, bottom panel). This is not assured in the next six months in our opinion. Hence, a lackluster profits recovery – profits disappointments – is a risk to the performance of India’s bourse in the coming months. Equity Strategy: Weighing pros and cons, we recommend that dedicated EM equity investors maintain an underweight position in India within an EM equity portfolio. However, they should consider upgrading this bourse on potential near-term underperformance. The strong rally in certain mega-cap stocks has masked the muted revival in the broad equity universe. Absolute-return investors should consider buying this bourse on a setback in the coming months. Odds are that the index could drop up to 15% in US dollar terms triggered by a potential global risk-off phase and domestic profit disappointments. Currency And Fixed-Income Chart I-15Consumer Inflation Is Not A Problem In India
Consumer Inflation Is Not A Problem In India
Consumer Inflation Is Not A Problem In India
We have been recommending receiving 10-year swap rates in India since April 23 and this recommendation remains intact. As argued above, the economic recovery will be gradual, and the output gap will remain negative for some time. Consequently, wages and inflation will likely surprise on the downside. Even though headline and core inflation rates have recently picked up, this has been due to a rise in food prices, transportation and personal care products (Chart I-15). Hence, there are not genuine inflationary pressures in India and the RBI will be making a mistake if it stops easing due to rises in headline or core CPI readings. Food prices have been rising for a while due to supply shocks. Importantly, the rise in food prices should not be interpreted as genuine inflation. Meanwhile, personal care products include gold jewelry and this CPI sub-component has therefore been rising due to the surge in gold prices (Chart I-15, bottom panel). Finally, transport costs have been on the rise due to supply chain bottlenecks in India as a result of COVID-19 and due to the rise in global oil prices. The broken monetary transmission mechanism means that the RBI will have to cut rates by much more. The fixed-income market is not discounting rate cuts. There is value in long-term rates in India. The yield curve is very steep – the spread between 10-year and 1-year swap rates is 92 basis points. In addition, 10-year government bond yields are currently yielding 522 basis points above 10-year US Treasurys. We are not particularly concerned about public debt. Central government debt was at 52% of GDP before the recession and total public debt (including both central and state governments) was 80% of GDP. The same ratios are much higher in many other EM and DM economies. Chart I-16India's Stock-To-Bond Ratio Is At A Critical Resistance
India's Stock-To-Bond Ratio Is At A Critical Resistance
India's Stock-To-Bond Ratio Is At A Critical Resistance
Finally, the rupee could correct as the US dollar rebounds from oversold levels, but foreign investors should use that setback in India’s exchange rate to rotate from receiving rates to buying 10-year government bonds outright, i.e., taking on currency risk. The RBI has been accumulating foreign exchange reserves, meaning it has been preventing the currency from appreciating. The current account is balanced and the financial/capital account has passed its worse phase. India will continue to attract foreign capital due to its long-term appeal and higher-than-elsewhere interest rates. Domestic investors should favor bonds over stocks in the near term (Chart I-16). Bottom Line: Continue betting on lower interest rates in India. Fixed income investors should switch from receiving rates to buying 10-year government bonds on a correction in the rupee in the coming months. Dedicated EM local currency bond portfolios should continue overweighting India. Arthur Budaghyan Chief Emerging Markets Strategist arthurb@bcaresearch.com Ayman Kawtharani Editor/Strategist ayman@bcaresearch.com Footnotes
Highlights The strong rally in certain mega-cap stocks has masked the muted revival in the broad equity universe. Limited fiscal stimulus and a broken monetary transmission mechanism herald lackluster economic and profit recoveries. While dedicated EM equity investors should for now maintain an underweight position in India within an EM equity portfolio, they should consider upgrading this bourse on potential near-term underperformance. Absolute-return investors should consider buying this bourse on a setback in the coming months. Fixed-income investors should continue receiving 10-year swap rates but use any rupee selloff to rotate into cash bonds. Feature Indian share prices have staged a remarkable comeback following the financial carnage in March. However, the outlook for the economy and for corporate profits does not justify the current level of share prices. While this thesis is applicable to most markets around the world, the gap between share prices and economic activity is even larger in India. Chart I-1Loans To Companies Are Muted In India
Loans To Companies Are Muted In India
Loans To Companies Are Muted In India
In particular: The credit and liquidity crunch has been more acute in India than in many other EM and DM economies. Bank loan growth has surged in many countries as companies have borrowed to avoid a liquidity crunch due to a plunge in sales. However, in India bank loans to companies been shown little improvement (Chart I-1). This means that enterprises in India have not been able to draw on bank loans – to the same extent as they have done elsewhere – to attenuate a liquidity crunch stemming from revenue contraction. As a result, Indian enterprises have retrenched more in terms of both employment and capital spending, and their rebound has been more muted. As an example, the global manufacturing and non-manufacturing PMIs have risen above the 50 line but the same measures in India remain below the 50 line (Chart I-2). India’s employment index from the Manpower group has fallen to a record low as of early July (Chart I-3). As a result, household nominal income growth – which was slumping before the pandemic – has fallen much further. Chart I-2India Is Lagging In Global Recovery
India Is Lagging In Global Recovery
India Is Lagging In Global Recovery
Chart I-3India: Employment Conditions Are Very Poor
India: Employment Conditions Are Very Poor
India: Employment Conditions Are Very Poor
Passenger car and commercial vehicle sales have plummeted (Chart I-4). Corporate investment expenditure and production have crashed. Manufacturing output, capital goods production and imports all plummeted in March and April and rebounded only mildly in June (Chart I-5). Chart I-4India: Discretionary Spending Is Slow To Recover...
India: Discretionary Spending Is Slow To Recover...
India: Discretionary Spending Is Slow To Recover...
Chart I-5...As Are Production And Investment
...As Are Production And Investment
...As Are Production And Investment
Table I-1India: Share Of Each Equity Sector In Profits & Market Cap
Strategy For Indian Equities And Fixed-Income
Strategy For Indian Equities And Fixed-Income
Economic activity will improve gradually but the level of activity will remain below the pandemic level for some time. As a result, corporate profits will be slow to revive. Odds are that it will take more than one and half years before the EPS of listed companies reach their 2019 level. This is especially true for severely hit sectors – financials, industrials, materials, and consumer discretionary stocks – which together account for 44% of listed companies’ profits. The sectors less affected by the pandemic recession – namely, consumer staples, information technology and health care – together account for 30% of corporate profits (Table I-1). A Breakdown In The Monetary Transmission Mechanism Impediments to rapid economic recovery are the modest fiscal stimulus and a breakdown in the monetary transmission mechanism. While India announced a large fiscal stimulus, much of this is made up of loan guarantees. Some measures like central bank purchases of government bonds also do not represent actual fiscal spending. Chart I-6 illustrates that government spending has risen only moderately and it has been offset by the drop in the credit impulse. Provided that the credit impulse will remain weak due to reasons we discuss below, the aggregate stimulus will not be sufficient to produce a robust and rapid recovery. The outlook for the economy and for corporate profits does not justify the current level of share prices. Critically, the monetary policy transmission mechanism was impaired even before the pandemic broke out in India, and the situation has gotten worse since March. Even though the Reserve Bank of India (RBI) has been reducing its policy rate, the prime lending rate has dropped very modestly (Chart I-7). Indian commercial banks which are saddled with non-performing loans (NPLs) have been reluctant to reduce their lending rates. Chart I-6Drag From Credit Impulse Has Offset Fiscal Stimulus
Drag From Credit Impulse Has Offset Fiscal Stimulus
Drag From Credit Impulse Has Offset Fiscal Stimulus
Chart I-7India: Very Little Decline In Prime Lending Rate
India: Very Little Decline In Prime Lending Rate
India: Very Little Decline In Prime Lending Rate
Even though AAA local currency corporate bond yields have dropped, BBB corporate bond yields remain above 10% (Chart I-8). This compares with 5-year government bond yields of 5%. Critically, in real (inflation-adjusted) terms, borrowing costs remain elevated (Chart I-9). Such elevated real borrowing costs will continue to hinder credit demand. Chart I-8Corporate Bond Yields Remain Elevated
Corporate Bond Yields Remain Elevated
Corporate Bond Yields Remain Elevated
Chart I-9Borrowing Costs In Real Terms Are Restrictive
Borrowing Costs In Real Terms Are Restrictive
Borrowing Costs In Real Terms Are Restrictive
Finally, banks might be reluctant to originate much credit because of the rise in NPLs and the uncertainty over the extension of government guarantees on pandemic-induced NPLs and their own recapitalization programs. Bottom Line: Limited fiscal stimulus and a broken monetary transmission mechanism herald lackluster economic and profit recoveries. Beyond Mega Caps The strong rally in certain mega-cap stocks has masked the muted revival in the broad equity universe. The MSCI equity index has rallied by 50% since its late March lows and stands only 7% below its pre-pandemic highs in local currency terms. Yet, the MSCI equal-weighted index and small caps are, in local currency terms, still 15% and 16% below their pre-pandemic highs, respectively (Chart I-10). The performance of the overall equity index has been exaggerated by the rally in Reliance Industries’ share price as well as information technology stocks, consumer staples and health care. The 150% surge in Reliance Industries stock price since late March lows is due to company-specific rather than macro factors. This company presently accounts for 15% of the MSCI India index. The monetary policy transmission mechanism was impaired even before the pandemic broke out in India. In addition, info technology, consumer staples and health care (including sales of personal care products and medicine) have benefited due to the pandemic. By contrast, equity sectors leveraged to the business cycle in general and discretionary spending in particular have all underperformed. Importantly, bank share prices have been devasted due to poor economic growth and rising NPLs. India’s mega-cap stocks that have led the rally since March lows are expensive, as anywhere else. Finally, India’s equal-weighted equity index has failed to meaningfully outperform the EM equal-weighted index after underperforming severely in late 2019 and Q1 2020 (Chart I-11). Chart I-10Muted Revival In Broader Equity Universe
Muted Revival In Broader Equity Universe
Muted Revival In Broader Equity Universe
Chart I-11India Relative To EM: Little Outperformance
India Relative To EM: Little Outperformance
India Relative To EM: Little Outperformance
Bottom Line: The advance in Indian share prices has been amplified by the rally in large-cap stocks. Meanwhile, the equal-weighted and small-cap indexes have done considerably worse reflecting the downbeat economic conditions. Equity Valuations And Strategy Chart I-12Indian Equity Valuations Are Elevated On A Market-Cap Basis...
Indian Equity Valuations Are Elevated On A Market-Cap Basis...
Indian Equity Valuations Are Elevated On A Market-Cap Basis...
As discussed earlier, India’s equity market leaders like information technology, consumer staples and health care are already expensive, trading at a trailing P/E ratio of 23, 47 and 33, respectively. The rest of the equity market is not expensive, but its profit outlook is mediocre. As to other valuation metrices, the market seems to be moderately expensive both on an absolute basis and versus the EM equity benchmark: The 12-month forward P/E ratio is 22.5, the highest in the decade (Chart I-12, top panel). Relative to the EM benchmark, on the same measure is trading at 50% premium (Chart I-12, bottom panel). Based on the equal-weighted equity index – i.e. stripping out the effect of large-cap stocks on the index, Indian equities are overvalued in absolute terms (Chart I-13, top panel). On this equal-weighted measure, Indian stocks are currently trading at a 35% premium versus their EM peers (Chart I-13, bottom panel). The cyclically-adjusted P/E ratio is close to the historical mean (Chart I-14, top panel). Chart I-13...And On An Equal-Weighted Basis
...And On An Equal-Weighted Basis
...And On An Equal-Weighted Basis
Chart I-14Cyclically-Adjusted P/E Ratio
Cyclically-Adjusted P/E Ratio
Cyclically-Adjusted P/E Ratio
However, the CAPE ratio is agnostic to corporate earnings on a cyclical horizon. It assumes corporate profits will revert to their long-term rising trend (Chart I-14, bottom panel). This is not assured in the next six months in our opinion. Hence, a lackluster profits recovery – profits disappointments – is a risk to the performance of India’s bourse in the coming months. Equity Strategy: Weighing pros and cons, we recommend that dedicated EM equity investors maintain an underweight position in India within an EM equity portfolio. However, they should consider upgrading this bourse on potential near-term underperformance. The strong rally in certain mega-cap stocks has masked the muted revival in the broad equity universe. Absolute-return investors should consider buying this bourse on a setback in the coming months. Odds are that the index could drop up to 15% in US dollar terms triggered by a potential global risk-off phase and domestic profit disappointments. Currency And Fixed-Income Chart I-15Consumer Inflation Is Not A Problem In India
Consumer Inflation Is Not A Problem In India
Consumer Inflation Is Not A Problem In India
We have been recommending receiving 10-year swap rates in India since April 23 and this recommendation remains intact. As argued above, the economic recovery will be gradual, and the output gap will remain negative for some time. Consequently, wages and inflation will likely surprise on the downside. Even though headline and core inflation rates have recently picked up, this has been due to a rise in food prices, transportation and personal care products (Chart I-15). Hence, there are not genuine inflationary pressures in India and the RBI will be making a mistake if it stops easing due to rises in headline or core CPI readings. Food prices have been rising for a while due to supply shocks. Importantly, the rise in food prices should not be interpreted as genuine inflation. Meanwhile, personal care products include gold jewelry and this CPI sub-component has therefore been rising due to the surge in gold prices (Chart I-15, bottom panel). Finally, transport costs have been on the rise due to supply chain bottlenecks in India as a result of COVID-19 and due to the rise in global oil prices. The broken monetary transmission mechanism means that the RBI will have to cut rates by much more. The fixed-income market is not discounting rate cuts. There is value in long-term rates in India. The yield curve is very steep – the spread between 10-year and 1-year swap rates is 92 basis points. In addition, 10-year government bond yields are currently yielding 522 basis points above 10-year US Treasurys. We are not particularly concerned about public debt. Central government debt was at 52% of GDP before the recession and total public debt (including both central and state governments) was 80% of GDP. The same ratios are much higher in many other EM and DM economies. Chart I-16India's Stock-To-Bond Ratio Is At A Critical Resistance
India's Stock-To-Bond Ratio Is At A Critical Resistance
India's Stock-To-Bond Ratio Is At A Critical Resistance
Finally, the rupee could correct as the US dollar rebounds from oversold levels, but foreign investors should use that setback in India’s exchange rate to rotate from receiving rates to buying 10-year government bonds outright, i.e., taking on currency risk. The RBI has been accumulating foreign exchange reserves, meaning it has been preventing the currency from appreciating. The current account is balanced and the financial/capital account has passed its worse phase. India will continue to attract foreign capital due to its long-term appeal and higher-than-elsewhere interest rates. Domestic investors should favor bonds over stocks in the near term (Chart I-16). Bottom Line: Continue betting on lower interest rates in India. Fixed income investors should switch from receiving rates to buying 10-year government bonds on a correction in the rupee in the coming months. Dedicated EM local currency bond portfolios should continue overweighting India. Arthur Budaghyan Chief Emerging Markets Strategist arthurb@bcaresearch.com Ayman Kawtharani Editor/Strategist ayman@bcaresearch.com Footnotes Equities Recommendations Currencies, Credit And Fixed-Income Recommendations
BCA Research's Emerging Markets Strategy team in the newly published report on India argued that limited fiscal stimulus and a broken monetary transmission mechanism herald a lackluster economic recovery. The monetary policy transmission mechanism was…
BCA Research's China Investment Strategy service is sticking to its strategic and cyclical overweight view on Chinese equities despite President Trump's opening a new front in the Sino-US tech war by banning China-based apps like TikTok. The impact on both…
Dear Client, In lieu of our regular report next week, we are sending you a Special Report from my colleague Chester Ntonifor, Foreign Exchange Strategist. Chester will share his outlook on the Hong Kong Dollar. I hope you will find his report insightful. Please note that next week’s report will be published on Friday, August 21. Best regards, Jing Sima, China Strategist Highlights President Trump's ban of China-based apps marks a new front in the Sino-US tech war. There is no change in our strategic views. The impact on both China’s aggregate economic growth outlook and the financial markets should be limited on a cyclical basis. Consider overweight Chinese offshore ex-TMT stocks and onshore semiconductor stocks within a global equity portfolio, against a backdrop of escalating hostilities in the tech sphere. Feature Chart 1Five Chinese Companies Are Mentioned In The New "Clean Network" Initiative
Five Chinese Companies Are Mentioned In The New "Clean Network" Initiative
Five Chinese Companies Are Mentioned In The New "Clean Network" Initiative
Geopolitical risks again stirred up volatility last week in China’s equity markets. President Trump issued two executive orders to take effect in 45 days, banning US transactions with the Chinese-owned social media apps TikTok and WeChat. Shares in Tencent, the China-based Internet giant that owns WeChat, have plummeted by 11% in China’s offshore market following the ban announcement (Chart 1). The event underscores that technology is at the root of a power struggle between the US and China. The struggle will likely be exploited by Trump as the US presidential election nears and Trump’s polling numbers lag. However, we remain constructive on Chinese stocks over the next 6 to 12 months. Although the latest development remains highly fluid, the tensions should not have a material impact on the cyclical outlook for China’s aggregate economy or financial markets. This will be the case as long as the situation does not degenerate into an outright tariff increase on Chinese export goods or other strategic actions with the potential to cause major economic damage. Given rising downside risks to Chinese tech company stocks in the near term, we recommend investors hold a neutral position on Chinese tech giant company equities versus their global peers. Instead, investors should overweight Chinese “old economy” stocks as well as sectors that are greatly benefited from policy support. We initiate two trades today: long MSCI China ex-TMT versus MSCI Global ex-TMT;1 and long domestic semiconductor stocks versus global semiconductor benchmark. A New Front In Tech War It is likely that the US will implement the ordered bans in some way. Banning TikTok wasn’t a surprise because the US had amply signaled its displeasure with the app in preceding months. The social media company has rapidly gained US market share and hence access to American users’ data. Its parent company ByteDance is based in Beijing and therefore subject to China’s cybersecurity laws, a major source of bilateral tensions. The company originated in a Chinese acquisition of an American company, another irritant for the Trump administration. The US is now pressuring TikTok’s US operations to sell the app to an American-based company such as Microsoft. Regarding Trump’s executive order on WeChat and Tencent, it is not clear what “transactions” with Tencent will be disallowed from the US market.2 Additionally, US officials later appeared to backpedal and limit the scope of the executive order on Tencent to only the WeChat app. We have a few preliminary observations on the evolving situation: It is unknown how far the executive action will go regarding Tencent. The Internet titan gets less than 5% of its revenues from outside China, according to its 2019 financial statement. However, Tencent has many prominent investments in the US gaming and music industries. The US Commerce Department has 45 days to interpret and enforce the directive. The vague language in the executive order provides the US with enough legal space to deprive Tencent of US technologies in those sectors, and would severely curtail Tencent’s online gaming business, which is its main engine of growth. The bans underscore the US administration’s intention to extend tech hostilities with China by denying Chinese tech companies the access to compete and expand globally. Last week, Secretary of State Mike Pompeo announced a five-pronged “Clean Network” initiative that would scrub Chinese companies from US telecommunications networks entirely.3 China, for its part, has been progressively banning US social media giants since 2009. China has not announced any retaliatory actions since the executive orders were issued. Top Chinese policymakers seem to have shifted gears from a tit-for-tat retaliation to a carefully calibrated diplomatic reaction that does not ramp up tensions further. Moreover, there is a sizeable contingent of top Chinese policymakers pushing for reconciliation with the US. We think that China’s senior leaders prefer to dial down the current conflict and take a wait-and-see approach until after the US presidential election in November. Nevertheless, the next two to three months will be unpredictable as the election nears and Trump’s polling numbers lag behind his rival Joe Biden. Bottom Line: China’s leading Internet and tech companies are embroiled in a US-China feud. Pressures will likely intensify with other tech companies potentially also targeted. For now, stay neutral on leading Chinese tech company stocks within a global equity portfolio. Stick With The Knowns Chinese tech company stock prices will likely be extremely volatile in the short run. Nevertheless, we are staying the course with our constructive cyclical view on overall Chinese stocks and we do not recommend any one-way bets on the market during the next two to three months. China’s financial markets have been shaken by negative surprises relating to frictions with the US. However, investors cheer on even the slightest easing of tensions between the two countries. Last Friday’s volatile trading was a good example: initial confusion over the ban’s scope in Trump’s order led to a more than 10% plunge in Tencent stock during morning trading in the Hong Kong market, but the losses were cut in half after the US indicated the ban only affected the WeChat app. Chart 2Chinese Tech Company Stocks Rallied Through Most Of The Trade War
Chinese Tech Company Stocks Rallied Through Most Of The Trade War
Chinese Tech Company Stocks Rallied Through Most Of The Trade War
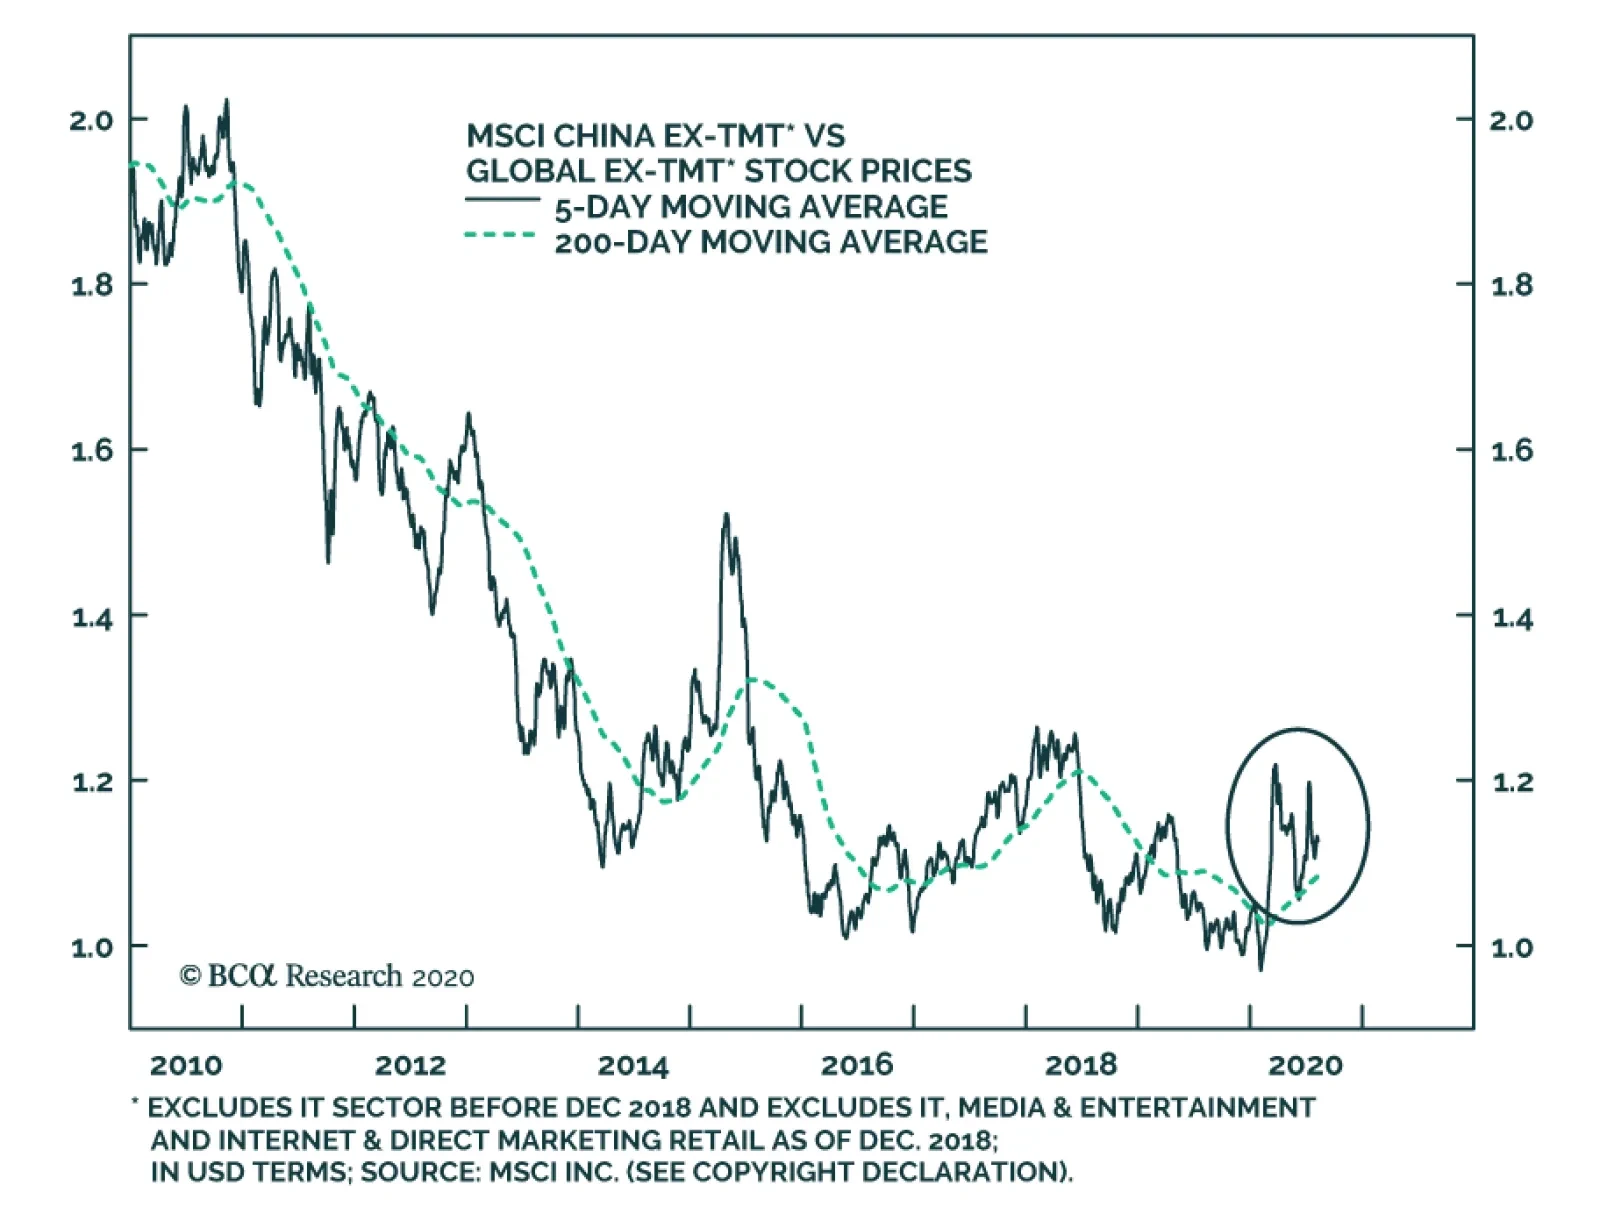
Economic policy support from the Chinese government and “national team” can also distort the short-term price trend in tech equities. These stocks have risen by more than 20% in both the onshore and offshore markets since the beginning of 2018, despite the deteriorating US-China relationship (Chart 2). While we are neutral on tech company stocks, we recommend overweight Chinese “old economy” stocks and remain constructive on domestic sectors that are beneficiaries of government policy support. We are initiating two trades: long MSCI China ex-TMT versus MSCI Global ex-TMT; and long domestic semiconductor stocks versus global semiconductor benchmark. The reflationary efforts since early this year facilitated a strong rebound in China’s industrial sector activities and profits (Chart 3). In turn, China’s ex-tech "old economy" stocks have outperformed relative to their global peers. Even though the handful of tech titans account for roughly 35% of the investable market capitalizations, MSCI China stock prices excluding tech titans have decisively broken out of their 200-day moving average, which suggests there is still sufficient support to our constructive view on the overall investable index (Chart 4). Chart 3Investors Have Been Focusing On China's Stimulus And Economic Recovery
Investors Have Been Focusing On China's Stimulus And Economic Recovery
Investors Have Been Focusing On China's Stimulus And Economic Recovery
Chart 4Chinese "Old Economy" Stocks Have Prevailed Of Late
Chinese "Old Economy" Stocks Have Prevailed Of Late
Chinese "Old Economy" Stocks Have Prevailed Of Late
Our cyclical overweight view on China’s domestic stocks also remains unchanged. The domestic market is much more sensitive to the trend in monetary conditions, credit growth and economic cycles than the investable market. As we pointed out in last week’s report,4 monetary conditions are accommodative and credit and economic growth remain in an uptrend. This underscores that China’s domestic stocks have more upside potential than investable stocks, even in an escalating geopolitical risk environment. Chart 5Chinese Semis Are On Fire
Chinese Semis Are On Fire
Chinese Semis Are On Fire
Lastly, more pressure from the US and the West to curb the advancement of Chinese technology will only encourage the leadership to double down on supporting state-led technology programs. This argues for a more bullish view on Chinese tech companies that focus on the domestic market, at least on a cyclical basis (Chart 5). Last week the State Council updated its policy, supporting two strategically important sectors: integrated circuits and software. The central government has had policies in place to support these two sectors since 2000 and updates its support policies every decade or so. Last week's updated version will allow chip companies to enjoy even more tax exemptions and favorable financing than the first set of support policies. China has clearly stepped up its promotion of self-sufficiency and redoubled its efforts to thwart any pressures meant to restrain its technological progress. As pointed out by our Geopolitical Strategy team,5 the U.S. and its allies control 95% of the global semiconductor market (Chart 6). Nonetheless, China is the world’s largest importer, accounting for about one-third of global semiconductor sales, making it the largest consumer of semiconductors (Chart 7). Chart 6China’s Chip Makers Are Still Small Fry
Sticking With Chinese “Old Economy” Stocks In A Widening Tech War
Sticking With Chinese “Old Economy” Stocks In A Widening Tech War
Chart 7China Accounts For 60% Of Global Semiconductor Demand
Sticking With Chinese “Old Economy” Stocks In A Widening Tech War
Sticking With Chinese “Old Economy” Stocks In A Widening Tech War
Chart 8Made In China 2025 Targets
Sticking With Chinese “Old Economy” Stocks In A Widening Tech War
Sticking With Chinese “Old Economy” Stocks In A Widening Tech War
In brief, China relies a lot on imported semiconductors and is working to mitigate this dangerous vulnerability. The Made in China 2025 program estimates that China will produce 70% of its demand for integrated circuits by 2030 (Chart 8). Bottom Line: China’s domestic industrial sector will continue to recover in the next 6 to 12 months. The nation’s semiconductor industry will get a boost from recently shored-up government policy supports. Overweight these sectors in the face of expanding tensions from the US tech war against China. Jing Sima China Strategist jings@bcaresearch.com Footnotes 1TMT stocks include information technology prior to December 2018, and include media & entertainment and internet & direct marketing retail sectors after December 2018. 2Please see the orders: https://www.whitehouse.gov/presidential-actions/executive-order-addressing-threat-posed-tiktok/ and https://www.whitehouse.gov/presidential-actions/executive-order-addressing-threat-posed-wechat/ 3https://www.state.gov/announcing-the-expansion-of-the-clean-network-to-safeguard-americas-assets/ 4Please see China Investment Strategy Weekly Report "China Macro And Market Review," dated August 5, 2020, available at cis.bcaresearch.com 5Please see China Investment Strategy Special Report "U.S.-China: The Tech War And Reform Agenda," dated December 12, 2018, available at cis.bcaresearch.com Cyclical Investment Stance Equity Sector Recommendations
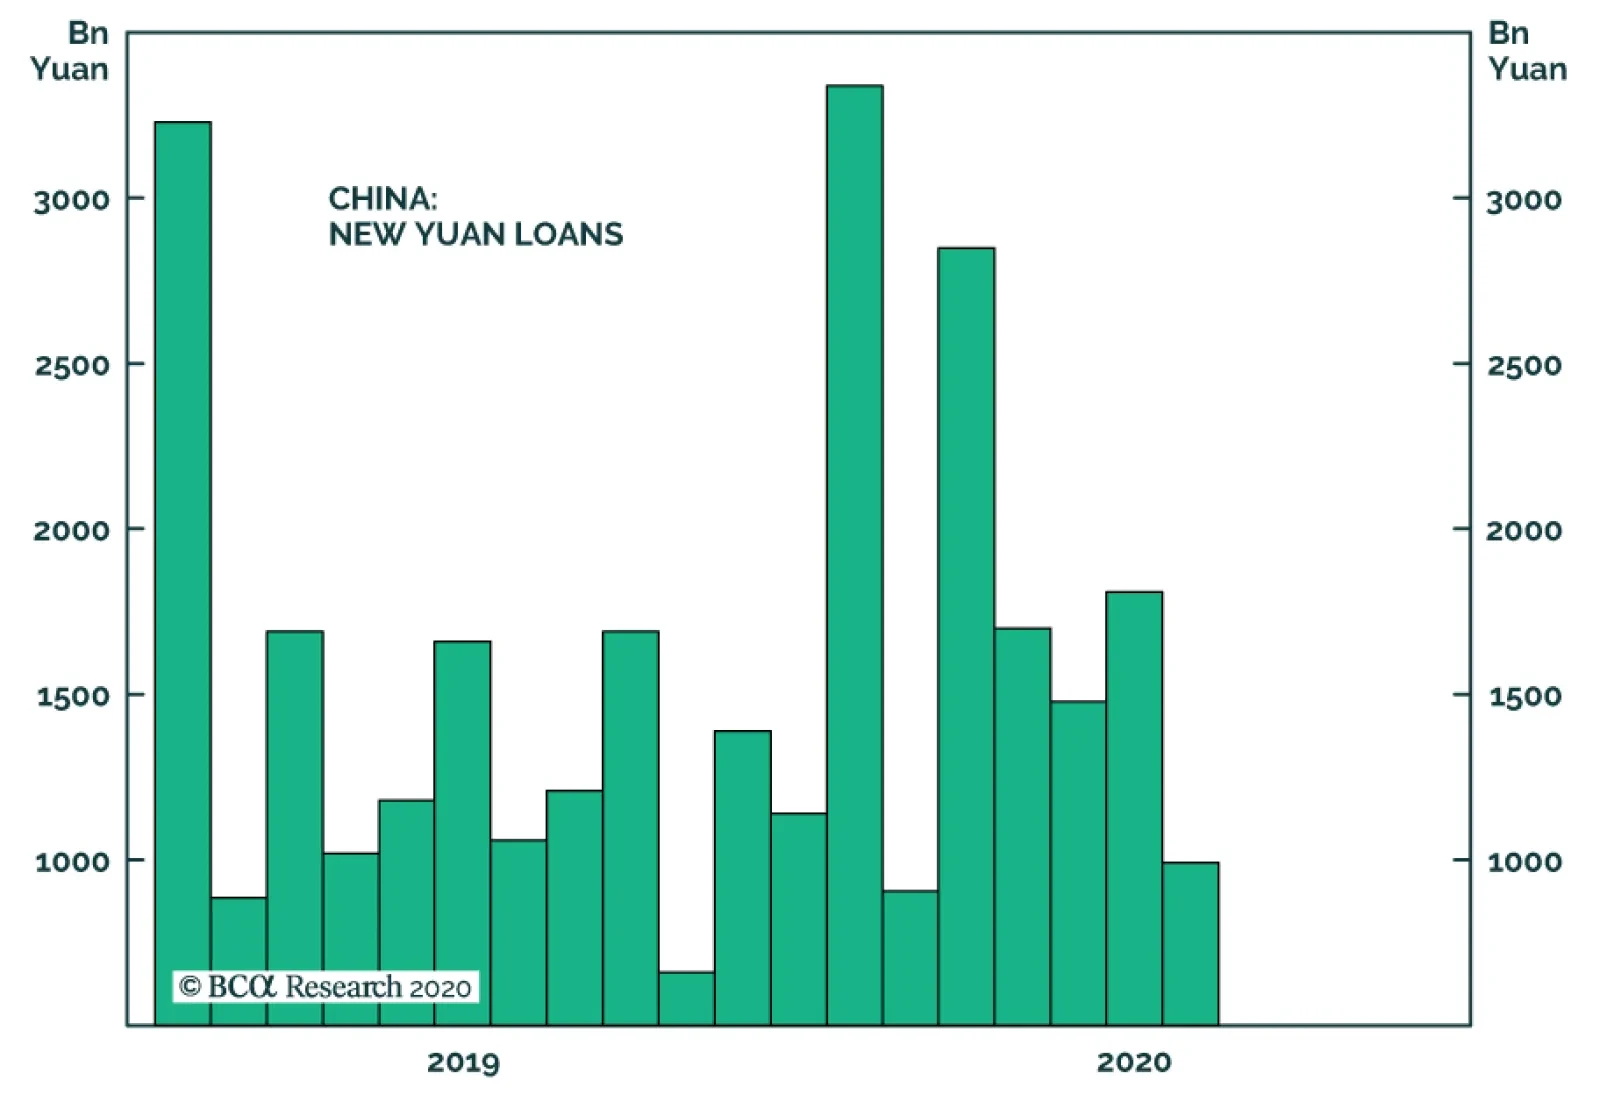
New Yuan loans in China came in at only CNY 992.7 billion in July, well below levels seen since policymakers opened the stimulus floodgates in March. However, it would be premature to suggest that this dip in lending signals a shift toward a more…
The biggest developments overnight Sunday were geopolitical. President Donald Trump signed an executive order to provide more relief to Americans. Then China fired a new salvo in the geopolitical war with the US. In a nutshell, both parties are aggressively…
China’s trade data for July released last Friday was mixed. On the positive front, export growth in USD terms accelerated to 7.2% from 0.5% as economic re-opening among trade partners continues to boost the demand from Chinese goods. Exports to the US,…
Chart II-1Indonesian Stocks Are Underperforming EM Again
Indonesian Stocks Are Underperforming EM Again
Indonesian Stocks Are Underperforming EM Again
Indonesian stocks and the rupiah have rebounded in line with global risk assets. However, the rebound might be waning. The rupiah has begun weakening anew against the US dollar despite a major weakness in the latter. Relative to EM, Indonesian equities are underperforming again (Chart II-1). Crumbling Economic Activity And Insufficient Stimulus Indonesia is experiencing its worst recession since the Asian Crisis in 1997. Consumer income has dwindled and consumer confidence collapsed (Chart II-2, top panel). In turn, passenger car and truck sales have contracted by 90% and 84%, respectively, from a year ago (Chart II-2, second and third panel). Meanwhile, domestic cement consumption plunged by 17% (Chart II-2, bottom panel). In the meantime, the Coronavirus pandemic is not subsiding and will continue weighing on the Indonesian economy. The authorities have been attempting to prop up domestic demand. Yet the total fiscal stimulus announced so far – which amounts to $48 billion or 4.3% of GDP – is unlikely to be enough, given the harsh nature of this recession. For instance, the commercial banks loan impulse has already dipped to -2.7% of GDP (Chart II-3, top panel). Provided that demand for credit stays weak and banks continue to be reluctant to lend, the credit impulse will drop even further. As a result, the negative credit impulse will offset the fiscal thrust. Chart II-2Indonesia: Domestic Demand Collapsed
Indonesia: Domestic Demand Collapsed
Indonesia: Domestic Demand Collapsed
Chart II-3Indonesia: Lending Rates Are High
Indonesia: Lending Rates Are High
Indonesia: Lending Rates Are High
On the monetary policy front, Bank Indonesia (BI) has been aggressively cutting its policy rate and injecting banking system liquidity into the market. The BI has been also purchasing government bonds on the secondary and primary markets, de facto conducting quantitative easing. Still, the ongoing monetary easing has not translated into lower lending rates for the real economy. In particular, although the BI lowered its policy rate by 200 basis points since July 2019, bank lending rates have only fallen by 100 basis points (Chart II-3, middle panel). This is a major sign that the monetary transmission mechanism is broken. Furthermore, the commercial banks’ lending rate, in real (inflation-adjusted) terms, remains elevated (Chart II-3, bottom panel). This is severely hurting credit demand (Chart II-3, top panel). As a result, the deflationary pressures on the Indonesian economy are intensifying. The top panel of Chart II-4 shows that the GDP deflator is flirting with deflation. Meanwhile, both core and headline inflation have undershot the central bank’s target (Chart II-4, bottom panel). Bottom Line: Very low inflation and crumbling real growth have caused nominal GDP growth to drop below borrowing rates (Chart II-5). This is hitting borrowers’ ability to service their debt and is leading to swelling non-performing loans (NPLs). Chart II-4Indonesia Is Facing Very Low Inflation
Indonesia Is Facing Very Low Inflation
Indonesia Is Facing Very Low Inflation
Chart II-5Indonesia: Nominal GDP Growth Is Well Below Lending Rates
Indonesia: Nominal GDP Growth Is Well Below Lending Rates
Indonesia: Nominal GDP Growth Is Well Below Lending Rates
Bank Stocks Remain At Risk The outlook for bank stocks that make up 48% of the Indonesia MSCI equity index is bleak. Chart II-6 shows that non-performing loans and special-mention loans (which are composed of doubtful loans) were rising before the pandemic shock. This has forced commercial banks to boost their bad loans provisioning, which has hurt their profitability. Additionally, Indonesian commercial banks’ net interest margins (NIM) have been falling sharply (Chart II-7). This has occurred because, on the revenues side, interest earnings have mushroomed as debtors have halted their interest payments while, on the expenditures side, commercial banks were forced to keep on paying interests to depositors. To protect their profitability, commercial banks have kept their lending rates stubbornly high. However, doing so will end up backfiring – as elevated lending rates punish borrowers and end up causing NPLs to rise, leading to more profit weakness. Chart II-6Indonesia: Bad Loans Are On The Rise
Indonesia: Bad Loans Are On The Rise
Indonesia: Bad Loans Are On The Rise
Chart II-7Indonesia: Banks' Net Interest Margins Are Falling
Indonesia: Banks' Net Interest Margins Are Falling
Indonesia: Banks' Net Interest Margins Are Falling
Crucially, Bank Central Asia and Bank Rakyat – which now account for a whopping 37% of the Indonesia MSCI market cap – are vulnerable. Both commercial banks are heavily exposed to state-owned enterprises (SOE) and small and medium (SME) companies. Particularly, 40% of Bank Central Asia’s loan book is linked to SOEs and government-led projects across electricity, ports, airports and cement among other sectors. Meanwhile, 68% of Bank Rakyat’s loan book is leveraged to the SME sector and 20% to large companies, including SOEs. Worryingly, both SOEs and SMEs have been undergoing stress. Their profitability and debt servicing ability were questionable even before the COVID-19 pandemic. State-Owned Enterprises (SOEs): The debt servicing ability for these companies has deteriorated. The debt-to-EBITDA ratio has risen considerably while the EBITDA coverage of interest expenses is set to fall from already low levels (Chart II-8). Small & Medium Enterprises (SME): The debt serviceability of the top 40% of the MSCI-listed small cap stocks is also deteriorating. The top panel of Chart II-9 shows that these companies’ debt-to-EBITDA has risen substantially, and that the EBITDA-to-interest expense ratio has plunged (Chart II-9, bottom panel). Chart II-8Indonesian SOEs: Weak Debt Servicing Capacity
Indonesian SOEs: Weak Debt Servicing Capacity
Indonesian SOEs: Weak Debt Servicing Capacity
Chart II-9Indonesian SMEs: Weak Debt Servicing Capacity
Indonesian SMEs: Weak Debt Servicing Capacity
Indonesian SMEs: Weak Debt Servicing Capacity
Chart II-10Indonesia Equities: Banks, Non-Financials And Small Caps
Indonesia Equities: Banks, Non-Financials And Small Caps
Indonesia Equities: Banks, Non-Financials And Small Caps
All in all, both Bank Central Asia and Bank Rakyat are set to experience a considerable new NPL cycle emanating from the poor profitability of SOEs and SMEs. Importantly, Bank Central Asia and Bank Rakyat’s respective NPLs at 1.3% and 2.6% were relatively low at the start of this year and have much room to rise. Neither are their valuations appealing. At a price-to-book value of 4.4 Bank Central Asia is expensive. As for Bank Rakyat while its multiples are not as high as Bank Central Asia’s (which is trading at a price-to-book value of 1.8), it is not particularly cheap either, considering its enormous exposure to Indonesia’s struggling SME sector. Bottom Line: The outlook for bank stocks is murky (Chart II-10). Apart from banks, the rest of the Indonesian stock market has been performing very poorly and there is no obvious evidence that this will change (Chart II-10, bottom two panels). Investment Conclusions Continue underweighting the Indonesian stock market. Bank stocks remain at risk. Moreover, there is evidence that retail investors have been active in the stock market as of late. When the stock market does relapse, retail investors will likely rush to sell their holdings, thereby magnifying the equity selloff. Chart II-11Return On Capital Drives EM Currencies
Return On Capital Drives EM Currencies
Return On Capital Drives EM Currencies
Dedicated EM local currency bonds and credit portfolios should continue underweighting Indonesia. Investors in Indonesia’s corporate US dollar bonds should tread carefully as the largest issuers are those SOEs that have experienced deteriorating creditworthiness. If the US dollar continues to depreciate, the rupiah could stabilize and rebound but it will underperform other EM and DM currencies. Return on capital (ROC) is the ultimate driver of EM currencies. Given the magnitude of the recession Indonesia is in and the slow recovery it will experience, its ROC will remain weak. This will weigh on the rupiah (Chart II-11). We continue shorting the rupiah against an equally weighted basket of the euro, Swiss franc and Japanese yen. Ayman Kawtharani Editor/Strategist ayman@bcaresearch.com