Asia
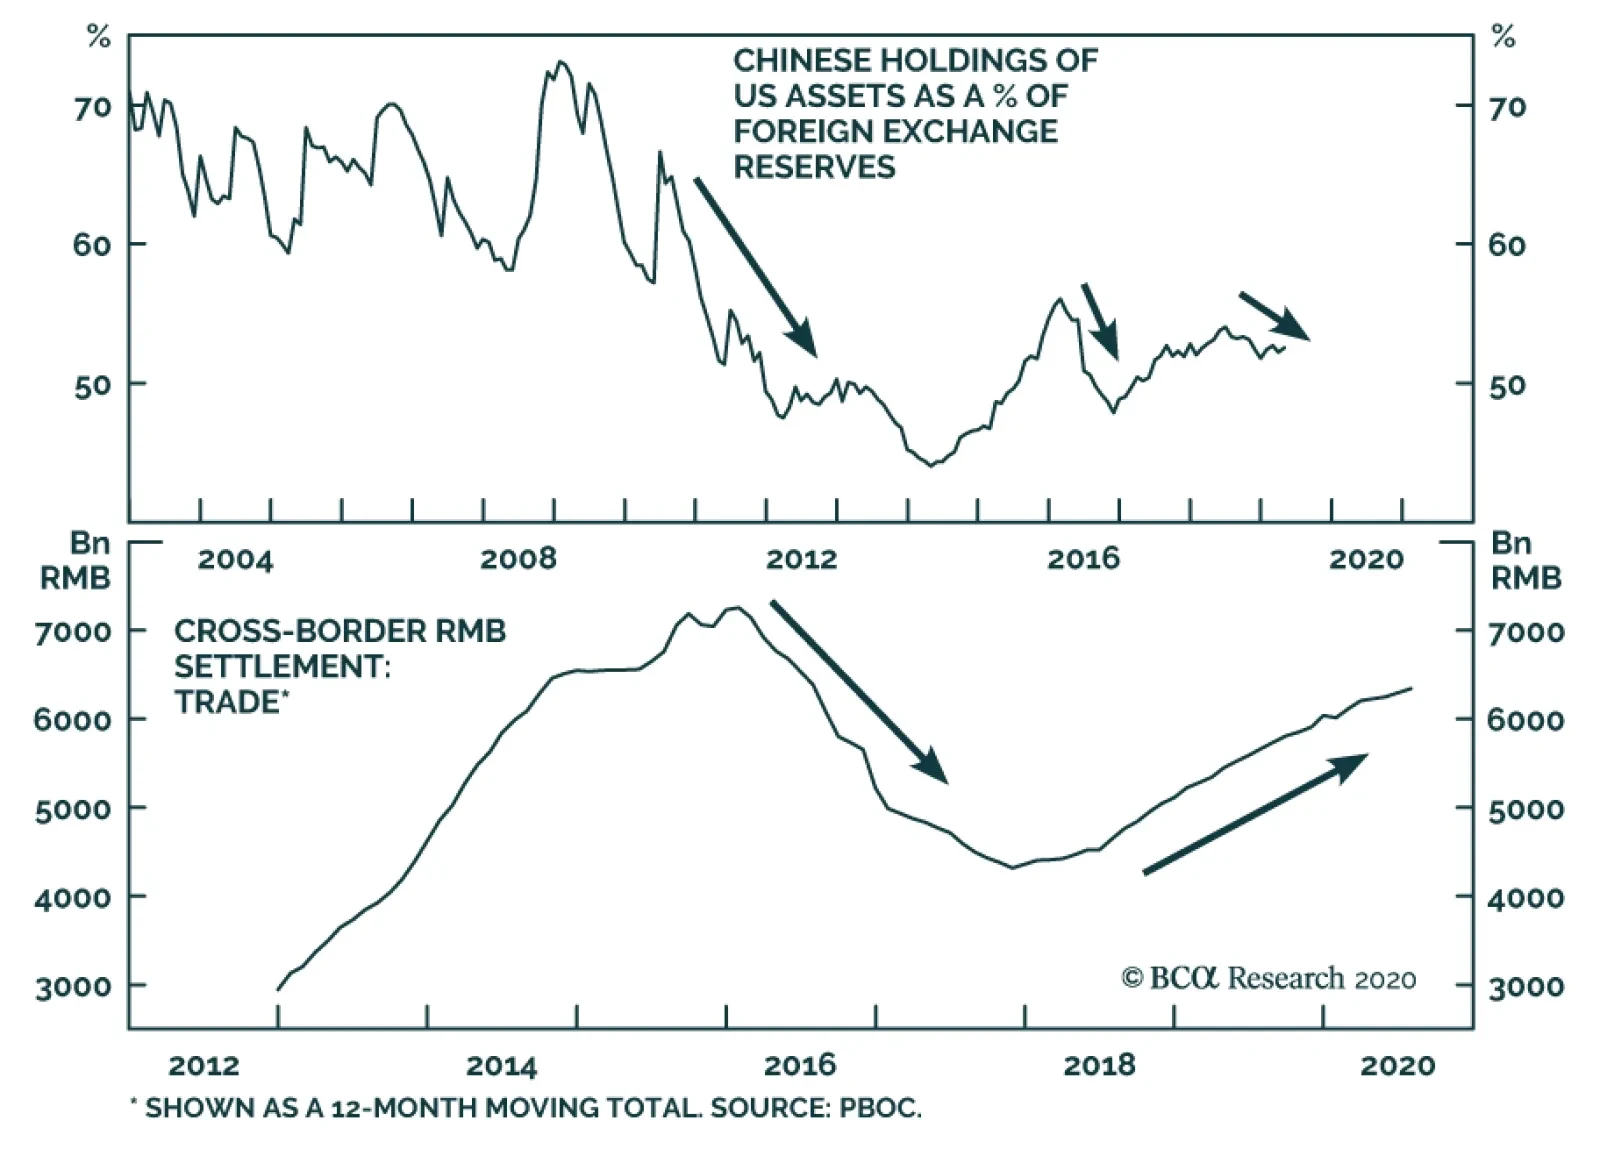
Since 2018, China has been promoting its own domestic cross-border interbank settlement system (CIPS). It is not BCA Research's baseline view that the US will cut off Chinese banks entirely from access to the US Clearing House Interbank Payments System…
BCA Research's Foreign Exchange Strategy service examines various options available to the HKMA to adjust the HKD peg. On sensible option would be to peg the HKD to the Chinese RMB. The Hong Kong economy is now heavily tied to the Chinese economy, with…
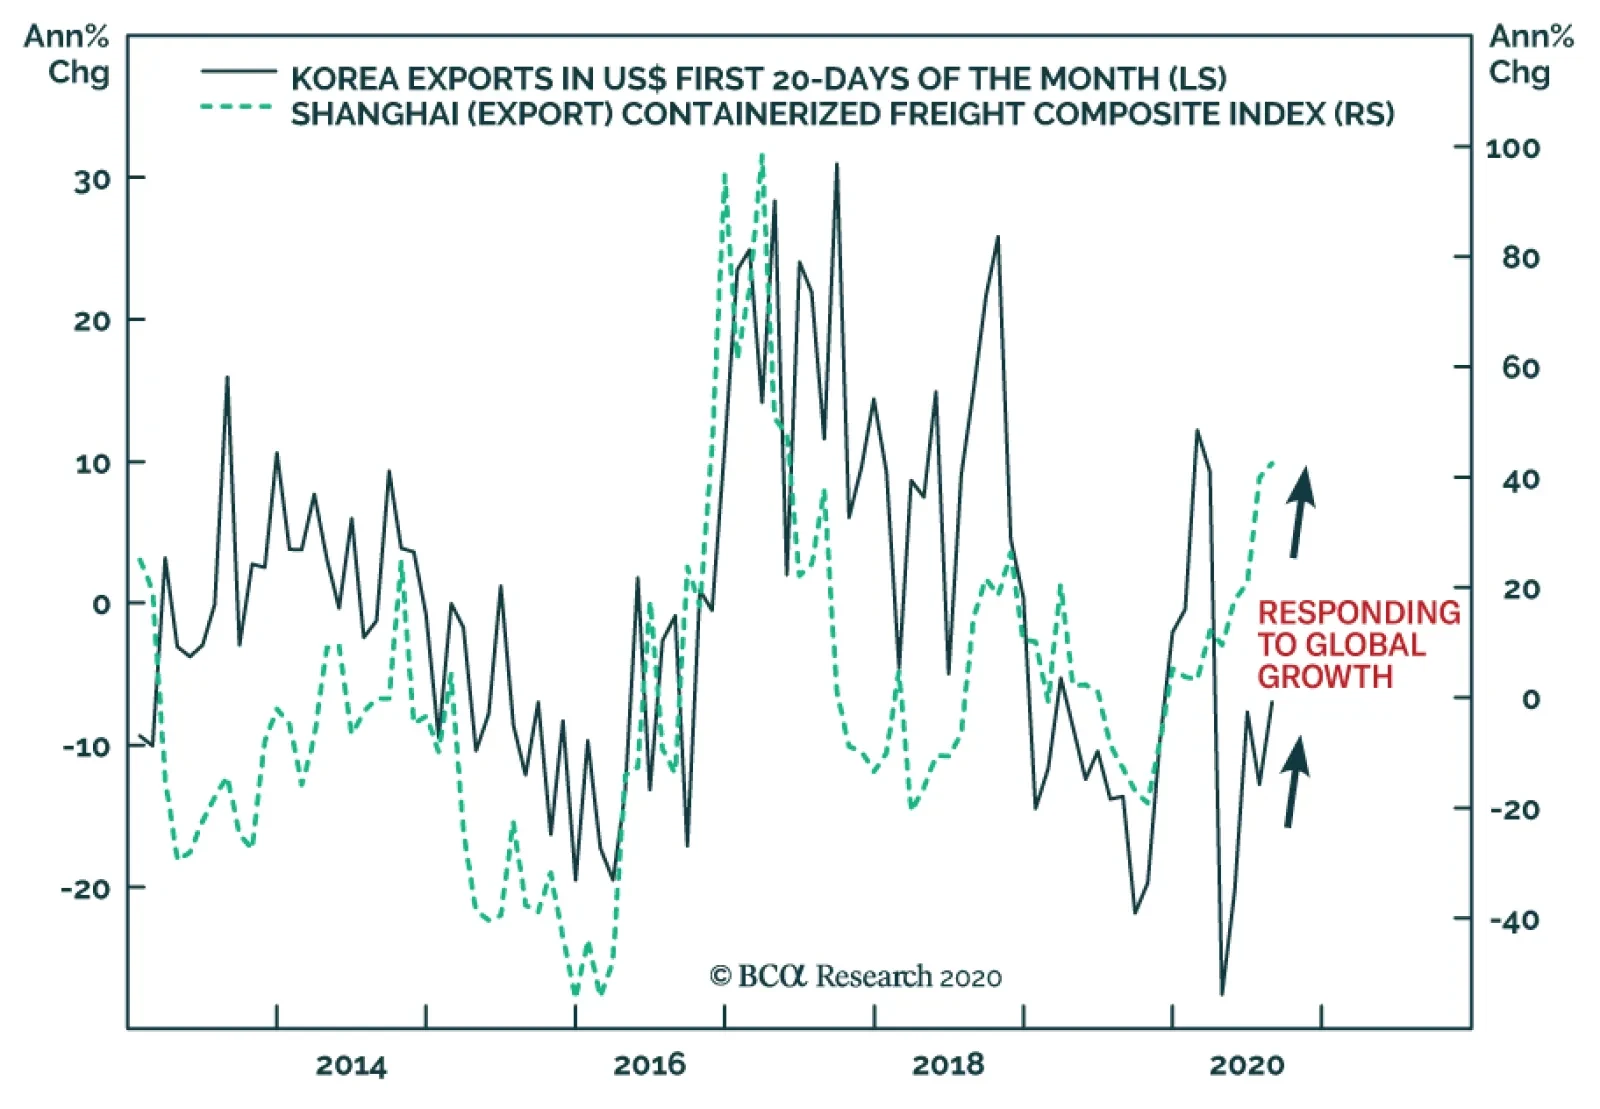
The Shanghai Container Freight Index reached its highest level in 6 years. Some of the strength in China’s container trade can be assigned to idiosyncratic factors. For example, household goods demand in the US and EU is strong, and retailers in those markets…

Highlights The stock market can apparently ignore the intensifying US-China conflict as long as massive monetary and fiscal stimulus continues. Hence the ongoing “stimulus hiccup” is a big problem. Ultimately a stimulus bill will pass, but risks are rising that it will come too late or fall short in size. The longer the negotiations drag on, the more likely that the absence of fiscal support, the spiraling US-China conflict, US political instability, and other risks will take center stage and upset the equity rally. Assuming a new stimulus package will ultimately pass, it will fuel Trump’s tentative comeback in opinion polls, increasing the risk that the revolution in the global trading system gets a new lease on life. Thus volatility is likely to rise from here until the US succession is settled. Stay long JPY-USD and health stocks in the near term and bullion in the long term. Feature Two of the key views we have hammered since May are coming to fruition: Stimulus Hiccup: The White House and Congress are struggling to get a new relief bill passed. We have argued that the next round of fiscal stimulus would face execution risks that would cause equity volatility to rise again, which is now occurring (Chart 1). Ultimately we expect the Republican Senate to capitulate to a major new stimulus bill. But the very near term is murky and the negotiations pose a clear and present danger to an equity market that has now surpassed its pre-COVID-19 highs (Chart 2). Chart 1Volatility Is Bottoming, Will Rise Ahead Of US Election
Volatility Is Bottoming, Will Rise Ahead Of US Election
Volatility Is Bottoming, Will Rise Ahead Of US Election
Chart 2Markets Recovered, Near-Term Risk To Downside
Markets Recovered, Near-Term Risk To Downside
Markets Recovered, Near-Term Risk To Downside
US-China Conflict: The White House has revoked Chinese tech giant Huawei’s general license, leaving the company in thrall to periodic Commerce Department allowances that will impede business. It has also expanded punitive measures to a slew of subsidiaries and Chinese software companies like TikTok (ByteDance) and WeChat (Tencent). We have argued that President Trump’s electoral vulnerability and economic stimulus in both countries lowered the bar to conflict and decoupling. Both countries have an interest in reducing their interdependency and the COVID-19 crisis has given them an opportunity to make structural changes that were previously more difficult. Neither the US tech sector, nor China-exposed US stocks, nor Taiwanese equities are pricing this monumental geopolitical risk at present (Chart 3). Combining these two views results in a dangerous outlook for global risk assets in the near term. The reason we argued that US-China tensions would escalate to the point of disrupting markets this year was that we viewed domestic stimulus as lowering the economic and financial bar that prevented conflict. Hence US and Chinese confrontational steps could go farther than the market expected and eventually something would snap (Chart 4). Chart 3Market Ignores US-China Escalation
Market Ignores US-China Escalation
Market Ignores US-China Escalation
Chart 4US And Global Stimulus Enable US-China Fight
Trade War Sans Stimulus Is Unsustainable
Trade War Sans Stimulus Is Unsustainable
Yet today tensions are escalating despite the failure to arrange a new jolt of domestic stimulus. This is true on both sides, as China is also seeing a deceleration in stimulus provision, mainly on the monetary side, that we also expect to be temporary but nevertheless has negative implications in the near term. The longer fresh stimulus is delayed, the more likely that markets will respond to the historic breakdown in US-China relations, US political instability, and other risks to corporate earnings and the economic recovery. Constraints On Politicians Support Cyclical Recovery To be sure, there is evidence that politicians are aware of their limits and already heading back to the negotiating table. Even with talks ongoing, the risks of delayed stimulus or Chinese retaliation are substantial. First, the White House, House Democrats, and Senate Republicans are continuing to negotiate despite being on recess while hosting national party conventions this week and next. House members are rushing back to Washington to vote on measures to boost the US postal service amid a controversy over how to handle mail-in voting for the election amid the pandemic. This has opened a pathway for stimulus talks to get back on track. It could result in a “skinny” stimulus bill quickly, or otherwise new developments could lead to the roughly $2.5 trillion blowout that we expect based on the two sides splitting the difference on most issues (Table 1). Table 1Stimulus Bill Will Hit $2.5 Trillion If Democrats And Republicans Split The Difference
Trade War Sans Stimulus Is Unsustainable
Trade War Sans Stimulus Is Unsustainable
Chart 5Trump’s Reelection Bid Stands On The Economy
Trade War Sans Stimulus Is Unsustainable
Trade War Sans Stimulus Is Unsustainable
Second, the US and China are arranging to keep talking. Ostensibly they are checking up on the status of the Phase One trade deal. The Trump administration cannot easily walk away from this deal– unless Trump irredeemably becomes a lame duck making a desperate bid to turn the tables on the Democrats. To do so would hurt Trump’s credibility on renegotiating US trade deals and likely trigger a selloff in the stock market that could set back the economic recovery and remove the last leg that his reelection bid stands on (Chart 5). The Chinese, for their part, have stuck with the deal despite US punitive measures because they do not want to provoke Trump, lest he attempt to inflict maximum damage on their economy in his final months or in a second presidential term. The renminbi is not depreciating relative to the dollar, suggesting that the tenuous truce is intact for now (Chart 6). Chart 6Renminbi Signals Phase One Trade Deal Intact ... For Now
Renminbi Signals Phase One Trade Deal Intact ... For Now
Renminbi Signals Phase One Trade Deal Intact ... For Now
Yet The Market May Sell Before Politicians Soften Their Line Nevertheless in the very near term investors have very low visibility on what happens next. Congress could still fumble and cause greater doubts. It could easily fail to reach a new stimulus deal until after September 8 when the Senate returns or September 14 when the House returns. President Trump’s executive orders, and negotiating gestures from Republicans, are a tenuous bridge for markets as they fall far short of even the Republicans’ $1 trillion asking price. The stock market will plunge if the talks collapse, but it will also drop if the stimulus falls short. The market may have to sell off to force politicians to provide stimulus and temper strategic competition. Trump’s complicated attempt to extend relief via executive orders, and/or a skinny deal that does not include direct rebates to households and funding for state and local governments, would be inadequate for the needs of the economy (Chart 7). It is imperative for Senate Republicans to capitulate and come closer to the Democrats $2.4 trillion standing offer (down from $3.4 trillion) – but it is possible they could miscalculate and fail to compromise. Democrats will not cave because they ultimately benefit at the ballot box if stimulus flops and financial turmoil returns. Chart 7US Economy Needs Extended Period Of Fiscal Support
US Economy Needs Extended Period Of Fiscal Support
US Economy Needs Extended Period Of Fiscal Support
On the China front, it is not guaranteed that China will refrain from retaliation against tech companies like Apple that depend on China for their operations. The market is betting that a rally entirely based on the tech sector can be sustained even in the face of an expanding tech war between the world’s biggest economies (Chart 8). Yet China suffers an economic and strategic blow from the US imposition of a technological cordon and Xi Jinping could decide to retaliate immediately. He could come to believe that the risk of not retaliating – which would entail continuing economic recovery and possibly Trump’s reelection on an anti-China platform – is greater than the risk of retaliation and financial turmoil. He has the ability to stimulate the domestic economy and benefits if he sets a precedent that American presidents lose if they attack China. China may not turn to Taiwan immediately, but since 2016 we have highlighted that Taiwan, not Hong Kong, is the major geopolitical risk stemming from the US-China crisis. Saber-rattling, cyber-rattling, and punitive economic measures are picking up in the Taiwan Strait and could lead to a global geopolitical crisis at any time. Here, too, the base case is that China will remain in a holding pattern until after the US election. It also should use economic sanctions long before it resorts to the final military option (Chart 9). But there is a large risk of miscalculation as the US seeks to cut off Taiwan semiconductor trade with China while Taiwan reduces its economic dependency on the mainland and tightens its defense relations with the United States. The Trump administration presents a window of opportunity so the risks are elevated in the lead up to and aftermath of the US election. Chart 8Tech Bubble Amid Tech War An Obvious Danger
Tech Bubble Amid Tech War An Obvious Danger
Tech Bubble Amid Tech War An Obvious Danger
Chart 9China's Economic Card May Be Only Thing Preventing War
China's Economic Card May Be Only Thing Preventing War
China's Economic Card May Be Only Thing Preventing War
We do not view Chinese economic sanctions on Taiwan as a tail risk but rather as our base case. Of course, we eschew conspiracy theories and usually seek to curb enthusiasm over war risks, as with Sino-Indian saber-rattling. But Taiwan is the epicenter of the political, military, and technological struggle between Washington and Beijing. War is a tail-risk, but even minor clashes would have a major impact on global financial markets. Other Risks Come To Forefront Amid Stimulus Hiccup Chart 10Trump’s Comeback Substantial If Stimulus Passes, Pandemic Subsides
Trade War Sans Stimulus Is Unsustainable
Trade War Sans Stimulus Is Unsustainable
The longer stimulus is delayed, the more likely that other risks will rise to the forefront and trouble the equity market. The US election does not offer much upside for markets at this point. Other risks stem from Iran and Russia. In the US election, President Trump is beginning to make a comeback in the opinion polling (Chart 10). Trump’s approval rating benefits from signing off on deals, so a final stimulus bill from Congress is essential. But a stimulus bill, a continued rollover in new cases of COVID-19, and a revival of support among his base would improve his odds of winning. Former Vice President Joe Biden is not polling much better against Trump than former Secretary of State Hillary Clinton did back in 2016 (Chart 11). Biden’s momentum in national opinion polling has been arrested, especially in battleground states, and the lower end of the “band of uncertainty” around the polling also suggests that Trump is within striking distance (Chart 12). Chart 11Biden Polling About Same As Hillary Versus Trump
Trade War Sans Stimulus Is Unsustainable
Trade War Sans Stimulus Is Unsustainable
Chart 12Trump Still Within Striking Distance Of Biden
Trade War Sans Stimulus Is Unsustainable
Trade War Sans Stimulus Is Unsustainable
Our election model suggests that Trump has a 42% chance of winning, which is higher than our subjective 35% (Chart 13). We will upgrade if a stimulus bill is agreed. A Trump comeback may be received well by US equity markets – as it prevents tax hikes, re-regulation, higher minimum wages, and a federal push to revive labor unions, all promoted by Biden and the Democrats. But then again, Biden’s agenda is more reflationary, whereas Trump faces obstacles in a still-Democratic House, leaving global trade as the path of least resistance – which is market-negative. The dollar may bounce on the prospect of a Trump second term (Chart 14). Tech stocks, Chinese currency, and other cyclicals, such as the euro and European stocks, will suffer a setback if Trump is reelected. Chart 13We Give Trump 35% Odds, Quant Model Shows Upside At 42%
Trade War Sans Stimulus Is Unsustainable
Trade War Sans Stimulus Is Unsustainable
Lesser risks, still notable, include Iran and Russia. Chart 14Trump Could Trigger Near-Term Dollar Bounce
Trump Could Trigger Near-Term Dollar Bounce
Trump Could Trigger Near-Term Dollar Bounce
We have maintained that the US and Iran are in a bull market of geopolitical tensions and that this could result in crisis around the election. The US’s decision on August 20 unilaterally to maintain the expiring international conventional arms embargo on Iran is a clear trigger for a military incident. The macro and market implications are different and less dire than with a US-China crisis. But oil price volatility would rise due to regional instability, President Trump’s reelection bid could benefit, and that would carry the implication of expanding trade war with China. Meanwhile our expectation of sharply rising Russian geopolitical risk is materializing both within Russia and in relations with Europe, which is preparing sanctions over the suppression of dissent within both Russia and its satellite state Belarus. Russia is capable of interfering in the US election while a Democratic victory would likely lead to a US policy offensive against Russia. Investors must look beyond the short term. If stimulus is passed, the stock market will go up, but the US and China will be further enabled and ultimately their strategic showdown will cap the gains by harming the tech sector. Meanwhile, if the stimulus fails, then the market will plunge. Investment Takeaways At present the stock market seems prepared for Trump to remain in the White House – or for Republicans to retain the Senate. The market’s YTD profile matches that of past elections that result in gridlock, as opposed to the Democratic “clean sweep” scenario that we have flagged as the likeliest outcome (Chart 15). However, this profile will change, the market will correct, if Trump does not sign a new relief act. Assuming stimulus ultimately passes, markets will cheer and Trump’s comeback in the polls will get a boost. He could still lose the election, given fundamental political and economic weaknesses captured in our state-by-state quantitative model above. But the election itself would be more closely fought – with a contested outcome more likely to occur and roil markets. Finally a Trump victory would give a new mandate to the US-China breakdown and the revolution in the global trading system, which is ultimately negative for risk assets and the cyclical recovery. Hence our confidence that the next few months will be marked by volatility. Ultimately geopolitical and macro fundamentals are negative for the dollar even if Trump provides the occasion for a last gasp in the past decade’s dollar bull market. The US is monetizing its debt and flooding the world with dollar liquidity. Meanwhile China and other powers are diversifying away from the dollar and into gold, the euro, the yen, and other reserve currencies over the long run (Chart 16). Chart 15Dollar Outlook Bearish In Medium Term
Dollar Outlook Bearish In Medium Term
Dollar Outlook Bearish In Medium Term
Chart 16Stock Market Preparing For Trump Win And More Gridlock?
Stock Market Preparing For Trump Win And More Gridlock?
Stock Market Preparing For Trump Win And More Gridlock?
The great US fiscal debate is over, regardless of Trump or Biden, as populism has made austerity impracticable and massive twin deficits will ensue. Thus we remain long gold and the Japanese yen. We have refrained from re-initiating our long EUR-USD trade given our expectation of stimulus hiccups and US-China tensions, but will reconsider if and when these hurdles are cleared. Our strategic portfolio continues to expect a global recovery over the next twelve months and beyond but tactically we are positioned against downside risks. Matt Gertken Vice President Geopolitical Strategy mattg@bcaresearch.com
Dear clients, The Foreign Exchange Strategy will take a summer break next week. We will resume our publication on September 4th. Best regards, Chester Ntonifor, Vice President Foreign Exchange Strategy Feature The economy of Hong Kong SAR1 has been held under siege by two tectonic forces. With the highest share of exports-to-GDP in the world, and at very close proximity to China, the epicenter of the pandemic shock, economic growth has been knocked down hard. The second shock to Hong Kong’s economy has been political instability. The extradition bill that was proposed in February 2019, followed by the enactment of the national security law this past June, has been accompanied by cascading street-wide protests and social unrest. The spirit of the bill is that crimes committed in Hong Kong can be trialed in China. The US has moved to impose sanctions on Hong Kong, as it no longer sees the city-state as autonomous, the latest of which is revoking its extradition treaty with the former colony. Some commentators have defined this as the end of the one country, two systems socio-economic model that has been in place since the handover from British rule in 1997. From a currency perspective, these shocks put in question the sustainability of the Hong Kong dollar (HKD) peg. Historically, currency pegs more often than not fail, especially in the midst of both geopolitical and economic turmoil. This was the story of the Asian Financial crisis in the late 1990s, and the Mexican peso crisis earlier that decade. Is the Hong Kong dollar destined for the same fate? If so, what are the potential adjustments in the exchange rate? Finally, what indicators can investors look to as a guide for any pending adjustment? A Historical Perspective Chart 137 Years Of Stability
37 Years Of Stability
37 Years Of Stability
The HKD is no stranger to shifting exchange-rate regimes. Over the last 170 years, it has been linked to the Chinese yuan, backed by silver, pegged to the British pound, free-floating, and, since 1983, tied to the US dollar. Therefore, a bet on the unsustainability of the peg is historically justified. That said, the stability of the peg to the US dollar has survived 37 years of economic volatility, suggesting the Hong Kong Monetary Authority (HKMA) has been able to successfully navigate a post-Bretton Woods currency era (Chart 1). Beginning as a bi-metallic monetary regime in the early 19th century, the HKD was initially linked to gold and silver prices, akin to the commodity–monetary standard that dominated that era. When Britain colonized Hong Kong in 1841, and as new trade alliances developed, the drawbacks of the bi-metallic monetary standard became apparent. As bilateral trade boomed, adjustments to imbalances (surpluses or deficits) could not occur through the exchange rate since it was fixed. Therefore, they had to occur through the real economy. This led to very volatile and destabilizing domestic prices. The stability of the peg to the US dollar has survived 37 years of economic volatility. Most Anglo-Saxon countries finally converted from bi-metallic exchange rates to the gold standard in the late 1800s, and strong ties to China dictated that Hong Kong naturally adopted the silver dollar in 1863. However, the silver system had the same drawbacks as the bi-metallic standard. Specifically, when your money supply is fixed, any increase in output leads to “few dollars chasing many goods.” This is synonymous with falling prices, just as “many dollars chasing few goods” is synonymous with rising inflation. The petri dish for this phenomenon was the post-World War I construction boom. A fixed money supply under the gold (and silver) standard meant rapidly falling prices globally. By the late 1920s, most countries had overvalued exchange rates relative to gold (and silver), that exerted powerful deflationary forces on their domestic economies. This forced most Western governments to debase fiat money vis-à-vis gold to stop price deflation. Correspondingly, China had to abandon the silver standard in November 1935, with Hong Kong shortly following suit. At the time of debasement, the United Kingdom was the leading economic power. As a colony, it made sense for the Hong Kong government to link the HKD to the British pound. The established rate was GBP/HKD 16, giving birth to the currency board system (Chart 2). Meanwhile, as a trading hub, a peg with an international currency made sense. The problems there were two-fold. First, the pound was still gold-linked. And second, Britain’s subsequent decline in economic power was accompanied by a series of sudden and dramatic devaluations in the pound, which was hugely disruptive to Hong Kong’s financial system. By 1972, the British government decided to float the pound, which effectively ended the GBP/HKD peg. Chart 2A History Of The HKD Peg
A History Of The HKD Peg
A History Of The HKD Peg
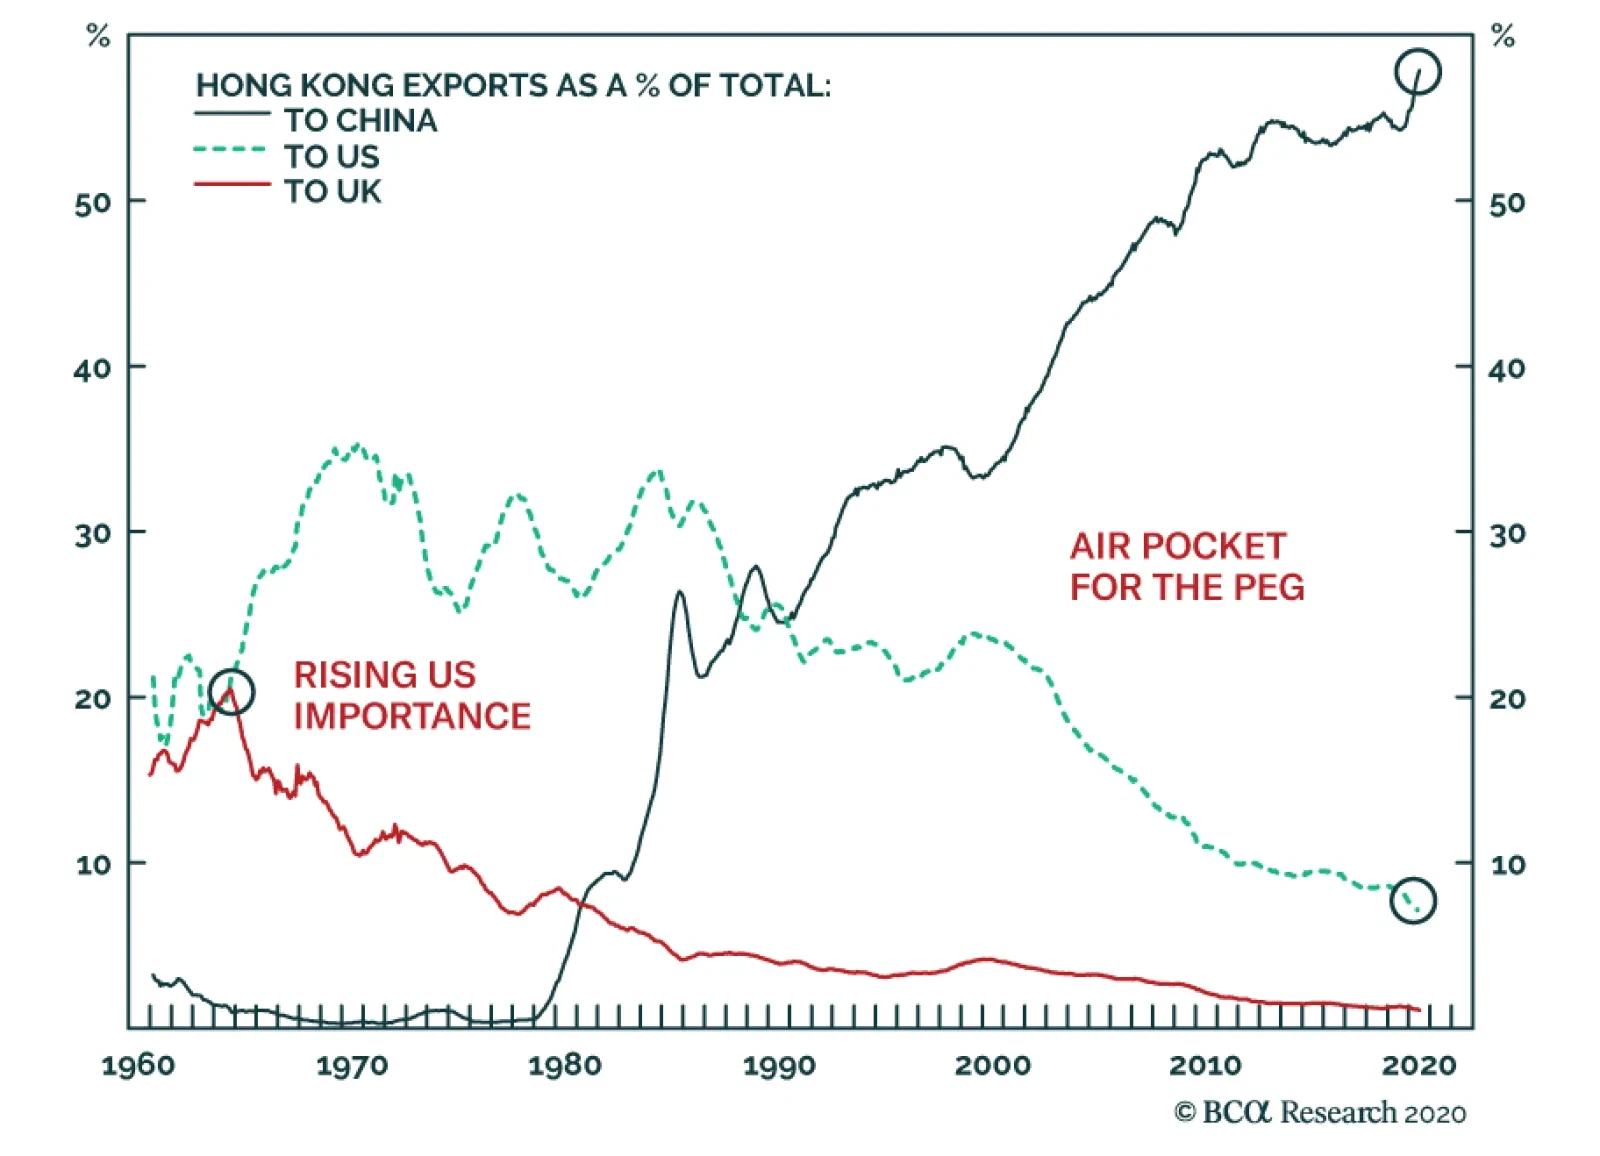
In July 1972, the authorities made the decision to peg the Hong Kong dollar to the US dollar at USD/HKD 5.65, which was another policy mistake. The switch made sense given the rising economic power of the US, as well as rising trade links (Chart 3). However, the dollar was also under a crisis of confidence following the Nixon devaluation in 1971. In February 1973, the HKD was freely floated. Chart 3The Peg Is Usually Against The Dominant Economic Power
The Peg Is Usually Against The Dominant Economic Power
The Peg Is Usually Against The Dominant Economic Power
Counter-intuitively, the free-floating era for HKD was arguably the most volatile for its domestic economy. For one, discipline in monetary policy was gone. Money and credit growth exploded, inflation hit double-digits, home prices soared and the trade balance massively deteriorated. Political instability was also rife, given the uncertainty surrounding the end of British claims on the island. As the dialogue included China’s reclaim of political control over Hong Kong, there was uncertainty over the rule of law. This cocktail of political and economic uncertainty led to a 33% depreciation in the HKD between mid-1980 and October 1983. Panicked policymakers returned to the US dollar peg. Paul Volcker, then Federal Reserve chairperson, was establishing himself as the world’s most credible central banker, having dropped US inflation from almost 15% in 1980 to below 3% by 1983. Economic and financial links with the US also justified a peg. In August of 1983, the authorities announced a USD/HKD fixed rate of 7.80, which has remained in place since. The Current Peg: Advantages And Disadvantages Chart 4Fiscal Prudence In Hong Kong
Fiscal Prudence In Hong Kong
Fiscal Prudence In Hong Kong
The advantage of the HKD peg is that the choice of the nominal anchor, the US dollar, renders it credible. First, the US dollar is an international reserve currency dominating international trade, which helps to facilitate settlements while instilling confidence among transacting participants. As a financial hub, this is crucial for Hong Kong. Meanwhile, such an anchor imposes fiscal discipline, since government deficits cannot be monetized by money printing. In the case where the government tries to be profligate, the rise in inflation will lower real rates and lead to capital outflows. This will force the HKMA to sell US dollars and absorb local currency. In the extreme case, the central bank can run out of reserves, causing the peg to collapse. Indeed, over the past several years, government debt in Hong Kong has been close to nil (Chart 4). The drawback of a fixed exchange rate regime is that a country or a region relinquishes control over independent monetary policy. In the case of Hong Kong, this means that interest rates are determined by the actions of the US Fed. Such a marriage was justified when the business cycles between the two economies were in sync, but in times of economic divergences, the fixed exchange rate leads to economic volatility. Chart 5Currency Peg And Internal Devaluation
Currency Peg And Internal Devaluation
Currency Peg And Internal Devaluation
Chart 6Hong Kong Interest Rates In The Late 90's
Hong Kong Interest Rates In The Late 90's
Hong Kong Interest Rates In The Late 90's
This divergence was clearly evident in the 1990s, as falling interest rates in the US supercharged a housing and stock market bubble in Hong Kong. When the Asian crisis finally came around in 1997, the lack of exchange-rate flexibility led to a vicious internal devaluation (Chart 5). A prolonged period of high unemployment and stagnant wages was needed for Hong Kong to finally improve its competitiveness. Most importantly, in 1998, in the depths of the Asian financial crisis, the peg attracted a concerted attack from speculators who believed a devaluation of the Hong Kong dollar alongside other regional currencies was inevitable. Their assault inflicted considerable pain, driving short-term HKD interest rates (Chart 6) and wiping out over a quarter of the local stock market in a matter of weeks. At the time, the Hong Kong government was successful in fending off the speculative attacks by intervening massively in both the foreign exchange and equity markets. Is An Adjustment Pending? If So, When? Chart 7USD/HKD And Interest Rate Spreads
USD/HKD And Interest Rate Spreads
USD/HKD And Interest Rate Spreads
As the above narrative suggests, the HKD is no stranger to socio-economic shocks and speculative attacks, and it has, more recently, weathered them pretty well. The more immediate question is whether the shift in the political landscape could be potent enough to crack the peg this time around. While plausible, it is unlikely for a few reasons. First, the HKD continues to trade on the stronger side of the peg as US interest rates have collapsed, wiping off any positive carry that would have catalyzed outflows. Fluctuations in the USD/HKD within the 7.75-7.85-band track the Libor-Hibor spread pretty closely (Chart 7). A currency board has unlimited ability to defend the strong side of the peg, since it can print currency and absorb foreign reserves (print HKDs and use these to buy USDs in this case). On the weak side, these foreign exchange reserves are drawn down. Therefore, any threat to the peg should be preceded by consistent trading on the weaker side, questioning the HKMA’s ability to keep selling FX reserves to defend the peg. Fluctuations in the USD/HKD within the 7.75-7.85-band track the Libor-Hibor spread pretty closely. Second, the Hong Kong peg remains extremely credible, since the entire monetary base is backed over two times by FX reserves (Chart 8). Even as a percentage of broad money supply, Hong Kong reserves are ample and very high by historical standards (Chart 8, bottom panel). Meanwhile, since 1983, the currency board system has undergone a number of reforms and modifications, allowing it to adapt to the changing macro environment. This represents a powerful insurance policy for the HKMA’s ability to defend the currency peg, significantly enhancing the system’s credibility. Chart 8Ample Foreign Exchange Reserves
Ample Foreign Exchange Reserves
Ample Foreign Exchange Reserves
Chart 9Hong Kong Runs Recurring Surpluses
Hong Kong Runs Recurring Surpluses
Hong Kong Runs Recurring Surpluses
Third, ever since the peg was instituted, Hong Kong has mostly run budget surpluses. As a result, government debt in Hong Kong is almost non-existent, as we illustrate above. This has removed any incentive to monetize spending, which remains an open argument in the US, Japan or even the euro area. One of our favored metrics on the health of a currency is the basic balance, and on this basis, Hong Kong scores much more favorably than the US. While Hong Kong has transitioned from being a goods exporter to that of services, it remains extremely competitive, with a healthy current account surplus of 5% of GDP (Chart 9). These recurring surpluses have propelled Hong Kong to one of the biggest creditors in the world, with a net international investment position that is a whopping 430% of GDP and rising (Chart 10). Chart 10Hong Kong Is A Net Creditor To The World
The Hong Kong Dollar Peg And Socio-Economic Debate
The Hong Kong Dollar Peg And Socio-Economic Debate
Fourth, over the past few years, productivity in Hong Kong has outpaced that of the US and most of its trading partners (Chart 11). This has lifted the fair value of the currency tremendously. This means it is more like that when the peg adjusts, the outcome will be HKD appreciation. On a real effective exchange rate basis, the HKD is not that overvalued compared to the US dollar, after accounting for the massive increase in relative productivity (Chart 12). It is notable that during the Asian financial crisis, currencies like the Thai bhat were massively overvalued, which is why the adjustment was back down toward fair value. Chart 11Hong Kong Is Highly Productive
Hong Kong Is Highly Productive
Hong Kong Is Highly Productive
Chart 12Trade-Weighted HKD Is Slightly Expensive
Trade-Weighted HKD Is Slightly Expensive
Trade-Weighted HKD Is Slightly Expensive
Fifth, there is a strong incentive for both Beijing and Hong Kong to defend the peg, because the relevance of Hong Kong is no longer as a shipping port, but as a financial center. The peg reduces volatility, as transactions are essentially dollarized. The relevance of Hong Kong in Asia can be seen by looking at the market capitalization of the Hang Seng index compared to that of the Topix index in Tokyo or the Shanghai Composite index. Any escalation in the US-China trade war, especially in the technology sphere, will only lead to more listings on the Hong Kong stock exchange. Equity flows through the HK-Shanghai and HK-Shenzhen stock connect program are rising, suggesting the market still considers Hong Kong an important intermediary in doing business with China (Chart 13). On the political front, the most potent risk is that the US Treasury moves to unilaterally limit access to US dollars by Hong Kong banks. While this was discussed by President Trump’s top advisers, it was also dismissed as unwise due to the potential shock to the global financial system. Meanwhile, with massive swap lines with the Fed, Hong Kong’s international banks can always draw on US liquidity. Tariffs on Hong Kong goods are another option, but this again will not really deal a severe blow to the peg, since Hong Kong mainly re-exports, with very little in the way of domestic goods exports (Chart 14). Chart 13Hong Kong Is An Important Financial Center
Hong Kong Is An Important Financial Center
Hong Kong Is An Important Financial Center
Chart 14Hong Kong Is Partially Insulated From Tariffs
Hong Kong Is Partially Insulated From Tariffs
Hong Kong Is Partially Insulated From Tariffs
Property Market Blues The property market is the one area in Hong Kong where a sanguine view is difficult to paint. Hong Kong is one of the most unaffordable cities on the planet, and high income inequality has been a reason behind resident angst. The gini coefficient, a measure of inequality in a society, is more elevated in Hong Kong compared to Singapore, China or even South Africa. After years of loose monetary policy, property prices in Hong Kong have completely decoupled from fundamentals. Housing is even more unaffordable now than it was back in 1997, and domestic leverage is very high. With such a high debt stock, even a gradual uptick in interest rates will have a significant impact on the debt service burden (Chart 15). Stocks and real estate prices are positively correlated, suggesting deleveraging pressures will likely be quite high if both unravel (Chart 16). Chart 15High Debt Service Burden##br## In Hong Kong
High Debt Service Burden In Hong Kong
High Debt Service Burden In Hong Kong
Chart 16Hong Kong Stocks Are Tied To The Property Market
Hong Kong Stocks Are Tied To The Property Market
Hong Kong Stocks Are Tied To The Property Market
However, there are offsetting factors. First, it is unlikely that interest rates in Hong Kong (or anywhere in the developed world for that matter) will rise anytime soon. COVID-19 has provided “carte blanche” in terms of global stimulus. More importantly, the US is at the forefront of this campaign, meaning interest rates in Hong Kong will remain low for a while. Second, in recent history, Hong Kong has proven that it has the resilience to handle volatility in the property markets. During the Asian crisis, property prices fell by 60%, yet no bank went bust. Share prices also collapsed but are much higher today, suggesting the drop was a buying opportunity. And with such a low government debt burden, any systemic threat to banks will nudge the authorities to bail out important companies and sectors. In terms of asset markets, the performance of the Hang Seng index relative to the S&P 500 is purely a function of interest rates. The US stock market is dominated by technology and healthcare that do well when interest rates fall, while banks and real estate dominate the Hong Kong market. So rising rates hurt the US stock market much more than Hong Kong (Chart 17). Meanwhile, the recent turmoil has made Hong Kong assets very cheap relative to its sister-city, Singapore (Chart 18). This suggests that a lot of the potential equity outflows have already occurred, based on today’s situation. Chart 17Interest Rates And The Hong Kong Stock Market
Interest Rates And The Hong Kong Stock Market
Interest Rates And The Hong Kong Stock Market
Chart 18Hong Kong Has Cheapened Relative To Singapore
Hong Kong Has Cheapened Relative To Singapore
Hong Kong Has Cheapened Relative To Singapore
The Future Of The Peg A peg to the Chinese RMB makes sense. The Hong Kong economy is now heavily tied to the Chinese economy, with over 50% of exports going to China (previously mentioned Chart 3). However, that will sound the death knell for Hong Kong’s status as a financial center, since the US dollar remains very much a reserve currency. There is also a risk that if Beijing uses RMB depreciation as a weapon in a blown-out confrontation with the US in the coming years, it will threaten the sustainability of the HKD peg, since it could inflate asset bubbles. What is more likely is that the option of re-pegging to the RMB comes many years down the road, when the yuan has become a fully convertible currency. The recent turmoil has made Hong Kong assets very cheap relative to its sister-city, Singapore. There is the option to assume another currency board akin to Singapore. This option makes sense, since this would give the HKMA scope to link to cheaper currencies, such as the yen and euro. Such an overhaul will require significant technical expertise and political will from both Beijing and Hong Kong. It is not very clear what the cost/benefit outcome would be of this initiative, but it is worth considering since the RMB itself is managed against other currencies. Finally, there is always the option to fully float the peg, but this is likely to increase volatility. As well, for policymakers, it makes sense to continue pegging the exchange rate to the US dollar as it depreciates against major currencies, since it ends up easing financial conditions for Hong Kong concerns. Chester Ntonifor Foreign Exchange Strategist chestern@bcaresearch.com Footnotes 1 Special Administrative Region of the People's Republic of China Trades & Forecasts Forecast Summary Core Portfolio Tactical Trades Limit Orders Closed Trades
Highlights The strength in global semiconductor sales in recent months has been due to one-off factors stemming from pandemic-related lockdowns. As the one-off demand surge subsides, global semiconductor sales will decline modestly toward the end of this year. In the near term, global semiconductor stock prices are vulnerable due to overbought conditions, excessive valuations and demand disappointment. The global semiconductor industry is at the epicenter of the US-China confrontation, and more US restrictions on chips sales to China are probable. This is another risk for this sector's share prices. Nevertheless, the structural outlook for global semiconductor demand is constructive. Its CAGR may rise from 3% during 2014-2019 to 5% during 2020-2024. Feature Investor euphoria has taken hold of semiconductor stocks. Global semiconductor stock prices have skyrocketed by 68% from March lows and 96% from December 2018 lows. Meanwhile, global semiconductor sales during March-June rose only by 5% from a year ago. As a result, the ratio of market cap for global semiconductor stocks relative to global semiconductor sales has reached its highest level since at least the inception of data in 2003 (Chart 1). Chart 1Global Semiconductor Sector: Market Cap-To-Sales Ratio Has Surged
Global Semiconductor Sector: Market Cap-To-Sales Ratio Has Surged
Global Semiconductor Sector: Market Cap-To-Sales Ratio Has Surged
With semi equity multiples very elevated, their share prices have become even more sensitive to global semiconductor demand growth. Hence, the focus of this report is to try to gauge the strength of global semiconductor demand, both in the near term and structurally. Near-term semiconductor stock prices could disappoint due to weak chip demand from the smartphone sector and diminishing purchases of personal computers (PCs) and servers. However, structurally, we are positive on global semiconductor demand, which is underpinned by the continuing rollout of 5G networks and phones, a wider adoption of data centers, and further technological advancements in artificial intelligence (AI), cloud computing, edge computing and smaller nodes for chip manufacturing (Box 1). Box 1 Key Technologies Underpinning Potential Global Semiconductor Demand AI refers to the simulation of human intelligence in machines, for example, computers that play chess and self-driving cars. The goals of AI include learning, reasoning and perception. Cloud computing is the delivery of computing services – including servers, storage, databases, networking, software, analytics and intelligence – over the Internet (“the cloud”) to offer faster innovation, flexible resources and economies of scale. Edge computing is a form of distributed computing, which brings computation and data storage closer to where it is needed, to improve response times and save bandwidth. Technology node refers to the width of line that can be processed with a minimum width in the semiconductor manufacturing industry, such as technology nodes of 10 nanometers (nm), 7nm, 5nm and 3nm. The smaller the nodes are, the more advanced they are. Near-Term Headwinds Chart 2World Semiconductor Sales Diverged From The Global Business Cycle
World Semiconductor Sales Diverged From The Global Business Cycle
World Semiconductor Sales Diverged From The Global Business Cycle
Semiconductor demand worldwide grew by 6% year-on-year in the first half of this year. There has been a remarkable divergence between world semiconductor sales and the global business cycle (Chart 2). The divergence between semiconductor sales and economic activity was most striking in the US and China. Semiconductor sales in China rose by 5% year-on-year in Q12020, and in the US they grew by 29% year-on-year in Q22020, despite a contraction in their aggregate demand during the same period. By contrast, Q2 annual growth of semiconductors sales was -2.2% for Japan, -17% for Europe and 1.8% for Asia ex. China and Japan (Chart 3). The reasons why the US and China posted a surge in semiconductor demand while Europe and Japan experienced a contraction in domestic semiconductor sales are as follows: Most data center investment is occurring in the US and China. Chart 4 shows that 40% of global hyperscale data centers are operating in the US, much larger than any other countries/regions. China, in turn, ranked second, with a global share of 8%. Chart 3Strong Semiconductor Sales In The US And China, But Not Elsewhere
Strong Semiconductor Sales In The US And China, But Not Elsewhere
Strong Semiconductor Sales In The US And China, But Not Elsewhere
Chart 4The US Has The Most Global Hyperscale Data Centers
Global Semiconductor Stocks: A Hiatus Is Overdue In A Structural Bull Market
Global Semiconductor Stocks: A Hiatus Is Overdue In A Structural Bull Market
Demand contraction in Europe and Japan is due to semiconductor demand in these regions mainly originating from the automobile sector, where production was severely hit by the global pandemic. About 37% of European semiconductor sales were from last year’s automotive market. We believe the divergence between global economic activity and semiconductor sales, as demonstrated by Chart 2 on page 3, has been due to one-off factors, as the global pandemic lockdowns have spurred semiconductor demand. Such a one-off demand boost will likely dissipate in the coming months. Traditional PCs and tablets: There has been a surge in demand for traditional PCs1 and tablets in the past six months. This was due to the significant increase in online activities, such as working from home, education, e-commerce, gaming and entertainment. Data from the International Data Corporation (IDC) has revealed that shipments of traditional PCs and tablets in volume terms had a strong year-on-year growth of 11.2% and 18.6%, respectively, in the period of April-June (Chart 5). Looking forward, even renewed lockdowns will not lead to a similar rush to buy these products. Many households are already equipped to work from home and for other online activities. With many countries gradually opening their economies, such demand will diminish. The traditional PC and tablet sectors together account for about 13% of global chip demand (Chart 6). Chart 5Personal Computers Sales Have Surged Amid Lockdowns
Personal Computers Sales Have Surged Amid Lockdowns
Personal Computers Sales Have Surged Amid Lockdowns
Chart 6The Breakdown Of Global Semiconductor Sales By Type Of Usage
Global Semiconductor Stocks: A Hiatus Is Overdue In A Structural Bull Market
Global Semiconductor Stocks: A Hiatus Is Overdue In A Structural Bull Market
Chart 7Server Sales Have Surged Amid Lockdowns
Server Sales Have Surged Amid Lockdowns
Server Sales Have Surged Amid Lockdowns
Server demand: Another major semiconductor demand contribution in Q2020 was from the server sector, which spiked by 21% year-on-year (Chart 7). The surge in online activities triggered a strong demand for cloud services and remote work applications, both of which require computer servers to run on. However, demand from the server sector is also set to diminish in 2H2020 and Q1 2021. Provided the inventories at major data center operators, including Microsoft, Google and Amazon, remain at high levels,2 global cloud service providers will likely reduce their orders of servers next quarter.3 Enterprises will also likely cut their investment in computer servers in 2H2020, as many of them had already increased their purchases of servers to prepare employees and business processes for remote working. We expect global server demand growth to soften in 2H2020. The Digitimes Research forecasted a 5.6% quarter-on-quarter contraction in 3Q2020 and a further cut in global sever shipment in the 4Q2020.2 The global server sector accounts for about 10% of global chip demand and, together with PCs and tablets, they make for 23% (please refer to Chart 6 on page 5). Further, the smartphone sector – accounting for 27% of global semiconductor demand – will continue struggling in H2 this year. The global total smartphone demand has been hit severely, as households delayed their new smartphone purchases. According to Canalys’ data, global smartphone shipments dropped by 13% and 14% year-on-year in Q1 and Q2, respectively. The strength in global semiconductor sales in recent months has been due to one-off factors stemming from the lockdowns. Chart 8Global Smartphone Shipments Will Likely Remain Weak In 2020H2
Global Smartphone Shipments Will Likely Remain Weak In 2020H2
Global Smartphone Shipments Will Likely Remain Weak In 2020H2
We expect smartphone shipments to continue contracting over the next three-to-six months (Chart 8). We believe global consumers will remain cautious in their spending on discretionary goods, such as smartphones, due to lowered incomes and increased job uncertainty. The IDC also forecasted that global smartphone shipments would not grow until 1Q2021.4 The Chinese smartphone sales showed a considerable weakness in July, with a 35% year-on-year contraction, which is much deeper than the 20% decline in H1 this year. 5G smartphone shipments also slowed last month, with a 21% drop from the previous month. Bottom Line: The strength in global semiconductor sales in recent months has been due to one-off factors stemming from the lockdowns. As this one-off demand subsides, global semiconductor sales will decline modestly toward the end of this year. Given the overbought conditions and the elevated equity valuations, global semiconductor stocks are currently vulnerable to near-term disappointments in semiconductor demand. At The Epicenter Of The US-China Rivalry Semiconductors are at the epicenter of the US-China confrontation. Ultimately, the US-China contention is about future technological dominance. That is access to technology and the capability to develop new technologies. The global semiconductor industry is at the epicenter of the US-China confrontation. China currently accounts for about 35% of the global semiconductor demand. US restrictions on semi producers worldwide to supply semiconductors to Chinese buyers constitute a major risk to semiconductor stock prices. On August 17, the US announced fresh sanctions that restrict all US and foreign semiconductor companies from selling chips developed or produced using US software or technology to Huawei, without first obtaining a license. In May, the US had already limited companies, such as the Taiwan Semiconductor Manufacturing Company (TSMC), from making and supplying Huawei with its self-designed chips. In addition, the US recently threatened bans on Chinese-owned apps TikTok and WeChat, and signaled that it could soon restrict Alibaba’s operations in the US. Chart 9Global Semi Companies' Sales To China Are Substantial
Global Semiconductor Stocks: A Hiatus Is Overdue In A Structural Bull Market
Global Semiconductor Stocks: A Hiatus Is Overdue In A Structural Bull Market
The global semiconductor sector is highly vulnerable to further escalation in the tension between these two superpowers. Major global semiconductor companies’ sales are heavily exposed to China, and their revenue from China ranges from 16% to 50% of total (Chart 9). We have been puzzled why global semi share prices have been rallying in spite of US limitations on semiconductor shipments to Huawei and its affiliated entities. One explanation could be that the Chinese companies that are not affiliated with Huawei are able to import semiconductors and then supply them to Huawei. If this is true, the US will have no other choice but to limit all semiconductor sales to China. This will be devastating for global semi producers given their large exposure to China. In anticipation of US punitive policies limiting its access to semiconductors, China had boosted its semiconductor imports over the past 12 months (Chart 10, top panel). Chinese imports of integrated circuits rose by 12% year-on-year in 1H2020, which is much higher than the 5% year-on-year increase in Chinese semiconductor demand during the same period (Chart 10, bottom panel). This gap suggests the country had restocked its semiconductor inventories. China has particularly restocked its imports of non-memory chips with imports of processor & controller and other non-memory chips in H1, surging by 30% and 20%, respectively, in US dollar terms (Chart 11). For memory chips, the contraction in Chinese imports was mainly due to a decline in global memory chip prices. Chart 10China Had Likely Restocked Its Semi Inventories
China Had Likely Restocked Its Semi Inventories
China Had Likely Restocked Its Semi Inventories
Chart 11Strong Chinese Imports In Non-Memory Chips
Strong Chinese Imports In Non-Memory Chips
Strong Chinese Imports In Non-Memory Chips
Bottom Line: The global semiconductor industry is at the epicenter of the US-China confrontation, and more restrictions on sales to China are probable. In turn, the restocked semiconductor inventory in China raises the odds of weakening mainland semiconductor import demand in H2 of this year. Structural Tailwinds Table 1Global Semiconductor Demand CAGR Forecast Over 2020-2024 By Device
Global Semiconductor Stocks: A Hiatus Is Overdue In A Structural Bull Market
Global Semiconductor Stocks: A Hiatus Is Overdue In A Structural Bull Market
We are optimistic on structural global semiconductor demand. Its nominal CAGR may rise from 3% during 2014-2019 to 5% during 2020-2024 in US dollar terms. Table 1 shows our demand growth forecasts for global chips in the main consuming sectors over the next five years. The major contributing sectors during 2020-2024 will be 5G smartphones, servers, industrials, electronics and automotive manufacturing. The underlying driving forces are the continuing rollout of 5G networks and phones, the development of data centers, and further technological advancements in AI, cloud computing and edge computing. Currently, the world is still in the early stages of 5G network development. AI, cloud computing and edge computing are constantly evolving. With increasing adoption of 5G smartphones, computer servers and IoT devices, global semiconductor demand is in a structural uptrend (Box 2). Box 2 Key Components For The Virtual World In Development Data centers and cloud computing allow data to be stored and applications to be running off-premises and to be accessed remotely through the internet. Edge computing allows data from Internet of things (IoT) devices to be analyzed at the edge of the network before being sent to a data center or cloud. IoT devices contain sensors and mini-computer processors that act on the data collected by the sensors via machine learning. The IoT is a growing system of billions of devices — or things — worldwide that connect to the internet and to each other through wireless networks. AI technology empowers cloud computing, edge computing and IoT devices. 5G is at the heart of the IoT industry transformation, making a world of everything connected possible. 5G Smartphone Currently, China is the world’s largest 5G-smartphone consumer and the leading 5G-adopter in the world. According to Digitimes Research, global 5G smartphone shipments will reach over 250 million units in 2020, with 170 million (68%) in China and only 80 million units in the world ex. China. Looking forward, 5G smartphone shipments are set to accelerate worldwide over the coming years. Chart 125G Phone Shipments In China Will Continue To Rise
5G Phone Shipments In China Will Continue To Rise
5G Phone Shipments In China Will Continue To Rise
The 5G phone shipments in China will continue to rise. The 5G phone sales penetration rate in China is likely to rise from 60% in July to 95% by the end of 2022. In such a case, we estimate that the monthly Chinese 5G phone shipments will increase from the current 16 million units to about 25-30 million units in 2022 (Chart 12). In the rest of the world, the 5G smartphone adoption pace will also likely speed up over the next five years. The 5G phone selling prices in the world outside China will drop, as more models are introduced and become more affordable. 5G smartphone prices have already fallen in China and will inevitably fall elsewhere. Chinese 5G smartphone producers will ship their low-priced 5G phones overseas, putting pressure on other producers to lower their prices. The 5G infrastructure development is accelerating in China and will accelerate in the rest of the world. Both China and South Korea have been very aggressive in their respective 5G network development. As of the end of June, China's top three carriers: China Mobile, China Unicom, and China Telecom – which together serve more than 1.6 billion mobile users in the country – had installed 400,000 5G base stations against an annual target of 500,000. In comparison, as of April 2020, American carriers had only put up about 10,000 5G base stations.5 As the US is competing with China on the 5G front, the country will likely boost its investment in 5G network development aggressively over the next five years in order to catch up to, or even exceed, China. Importantly, the 5G smartphone has more silicon content than 4G smartphones. More silicon content means higher semiconductor value. Rising 5G smartphone sales and higher silicon content together will more than offset the loss in semiconductor sales due to falling global 4G smartphone shipments. Based on our analysis, we expect a CAGR growth of 4% in semiconductor demand from the global smartphone sector over the next five years, slightly lower than the 5% in previous five years (Table 1 on page 10). This also takes into consideration that the 5G network will be more difficult and more expensive to develop than the 4G network. Servers Global server shipment growth will be highly dependent on both the pace and the scale of data center development (Box 3). Data centers account for over 60% of global server demand. The future growth of data centers is promising. The global trend of data localization6 due to the concerns of data privacy and national security will also bolster a boom of data centers over the next five years. A growing number of countries are adopting data localization requirements, such as China, Russia, Indonesia, Nigeria, Vietnam and some EU countries. While the Chinese data center market is expected to expand by a CAGR of about 28% over 2020-2022,7 a report recently released by Technavio forecasted the global data center industry’s CAGR at over 17% during 2019-2023. We forecast that the global semiconductor demand from servers will grow at a CAGR of 12% over 2020-2024. Box 3 Data Centers There are four main types of data centers – enterprise data centers, managed services data centers, colocation data centers, and cloud data centers. Data centers can have a wide range of number of servers. Corporate data centers tend to have either 200 (small companies), or 1000 servers (large companies). In comparison, a hyperscale data center usually has a minimum of 5,000 servers linked with an ultra-high speed, high fiber count network. Outsourcing and a move towards the cloud are driving the growth of the hyperscale data center. Instead of companies investing in physical hardware, they can rent server space from a cloud provider to both save their data and reduce costs. Amazon, Microsoft, Google, Apple and Alibaba are all top global cloud service providers. The more hyperscales to be built up, the higher the demand for servers. In 2019, about 13% of the total number of data centers in China were of the hyperscale and large-scale varieties. The plan of new infrastructure development announced earlier this year by Beijing was aiming to increase the number of hyperscale and large-scale data centers in China. Among current data centers either under construction or to be developed in the near future, 36% of them are hyperscale and large-scale data centers. IoTs Technological advancements in AI, cloud computing and edge computing, in combination with 5G network development, will facilitate the IoTs adoption. According to the GSMA,8 46 operators in 24 markets had launched commercially available 5G networks by 30 January 2020. It forecasted that global IoT connections will be increased from 12 billion mobile devices in 2019 to 25 billion in 2025 with a CAGR at 13%.9 IoTs chips include the Artificial Intelligence of Things (AIoT) – a powerful convergence of AI and the IoT. IoTs is an interconnected network of physical devices. Every device in the IoT is capable of collecting and transferring data through the network. Looking forward, global demand of AI chips and IoT chips will have significant potential to grow with creation of “smarter manufacturing”, “smarter buildings”, “smarter cities”, etc. AI applications can be used in manufacturing processes to render them smarter and more automated. Productivity will be enhanced as machines achieve significantly improved uptime while also reducing labor costs. There are plenty of upsides in industrial semiconductor demand (Chart 13). We expect the CAGR of industrial electronics to increase from 3.4% during 2014-2019 to 8% during 2020-2024. AI applications can create smart buildings by increasing connectivity across enterprise assets, enabling home network infrastructure (e.g., routers and extenders) and employing home-security devices (e.g., cameras, alarms and locks). AI applications can be used to create smart cities. A smart city is an urban area that uses different types of IoT electronic sensors to collect data. Insights gained from that data are used to manage assets, resources and services efficiently; in return, that data is used improve operations across the city. China has already developed about 750 trial sites of smart cities with different degrees of smartness in the past decade. As AI and 5G technology advances, the existing smart cities’ “smartness” will be upgraded and new trial smart cities will be implemented. Based on IDC data, China’s investment in smart cities will rise at a CAGR of 13.5% over 2020-2023 (Chart 14). Globally, the U.S., Japan, European countries and other nations are also actively developing smart cities. According to a new study conducted by Grand View Research, the global smart cities market size is expected to grow at a CAGR of 24.7% from 2020 to 2027.10 Chart 13Plenty Of Upside In Industrial Semiconductor Demand
Plenty Of Upside In Industrial Semiconductor Demand
Plenty Of Upside In Industrial Semiconductor Demand
Chart 14China’s Investment In Smart Cities Will Continue To Grow
Global Semiconductor Stocks: A Hiatus Is Overdue In A Structural Bull Market
Global Semiconductor Stocks: A Hiatus Is Overdue In A Structural Bull Market
Automotive We expect the global automotive chip market to grow at a CAGR of 9% during 2020-2024, as in 2014-2019. The increase in consumption of semiconductors by the auto industry will continue to be driven by the market evolution toward autonomous, connected, electric and shared mobility. Most new vehicles now include some level of advanced driver assist systems (ADAS), such as adaptive cruise control, automatic brakes, blind spot monitoring, and parallel parking. The whole industry is progressing toward fully autonomous vehicles in the coming years. Increasing adoption of automotive chips and recovering car sales will revive automotive chip sales. In addition, rising penetration of new energy vehicles (NEVs) is beneficial to semiconductor sales, as NEVs contain higher semiconductor content than conventional vehicles. Conventional vehicles contain an average of a $330 value of semiconductor content while hybrid electric vehicles can contain up to $1,000 and $3,500 worth of semiconductors.11 Regarding other sectors, we are also positive on structural demand of storage and consumer electronics. AI applications generate vast volumes of data—about 80 exabytes per year, which is expected to increase by about tenfold to 845 exabytes by 2025.12 In addition, developers are now using more data in AI and deep learning (DL) training, which also increases storage requirements. With massive potential demand for storage, we estimate a CAGR of 7% over 2020-2024 (Table 1 on page 10). A recent report from ABI Research predicts that the COVID-19 pandemic will increase global sales of wearables (such as a Fitbit or Apple Watch) by 29% to 30 million shipments of the devices this year. With contribution from wearables, we expect global semiconductor demand from the consumer sector to grow at a CAGR of 3% over 2020-2024, the same rate as in the previous five years. Bottom Line: Continuing rollout of 5G networks and phones, development of data centers, and further technological advancements in AI and cloud computing will provide tailwinds to structural global semiconductor demand, accelerating its CAGR growth from 3% during 2014-2019 to 5% during 2020-2024. Valuations And Investment Conclusions Most global semiconductor stocks are currently over-hyped. Critically, both DRAM and NAND prices have been deflating since January, reflecting weak demand for memory chips. Yet, share prices of memory producers have rallied (Chart 15). Overall, global semiconductor stock prices have diverged from their sales and profits. Overall, global semiconductor stock prices have diverged from their sales and profits (Chart 16). Chart 15Falling Memory Prices Pose Risk To Memory Stocks
Falling Memory Prices Pose Risk To Memory Stocks
Falling Memory Prices Pose Risk To Memory Stocks
Chart 16Global Semiconductor Stocks Have Deviated From Profits
Global Semiconductor Stocks Have Deviated From Its Profits
Global Semiconductor Stocks Have Deviated From Its Profits
Consequently, the multiples of semiconductor stocks have spiked to multi-year highs (Chart 17). Even after adjusting for negative US real bond yields, valuations of semiconductor stocks are not cheap. Chart 18 illustrates the equity risk premium for global semiconductor stocks is at the lower end of its range of the past 10 years. The ERP is calculated as forward earnings yield minus 10-year US TIPS yields. It is impossible to time a correction or know what the trigger would be (US-China tensions have been our best guess). Nevertheless, we do not recommend chasing semiconductor stocks higher due to their overstretched technicals and valuations on the one hand and potential weakening demand in H2 on the other. Chart 17Global Semiconductor Stocks: Elevated Valuations
Global Semiconductor Stocks: Elevated Valuations
Global Semiconductor Stocks: Elevated Valuations
Chart 18Equity Risk Premium For Global Semi Stocks Is Historically Low
Equity Risk Premium For Global Semi Stocks Is Historically Low
Equity Risk Premium For Global Semi Stocks Is Historically Low
In addition, the ratio of global semi equipment stock prices relative to the semi equity index correlates with absolute share prices of global semi companies. This is because equipment producers are higher-beta as they outperform during growth accelerations and underperform during growth slumps. The basis is that semi manufacturers have to purchase equipment if there is actual strong demand coming up and vice versa. The recent underperformance by global semi equipment stocks relative to the semi equity index might be an early sign of a potential reversal in semi share prices in absolute terms (Chart 19). Chart 19A Signal Of A Potential Reversal In Semi Share Prices
A Signal Of A Potential Reversal In Semi Share Prices
A Signal Of A Potential Reversal In Semi Share Prices
Meanwhile, we believe the subsector- memory chip stocks - will outperform the overall semiconductor index amidst the potential correction, because they have lagged and are less over-extended. Finally, we remain neutral on Taiwanese and Korean bourses within the EM equity space for now. Escalation in US-China confrontation, as well as their exposure to semiconductors, put these bourses at near-term risk. That said, we are reluctant to underweight these markets because fundamentals in EM outside North Asia remain challenging. Ellen JingYuan He Associate Vice President ellenj@bcaresearch.com Footnotes 1Traditional PCs are comprised of desktops, notebooks, and workstations. 2Global server shipments to contract 5.6% sequentially in 3Q2020, says Digitimes Research 3Global server shipments forecast to increase by 5% this year: TrendForce 4IDC Expects Worldwide Smartphone Shipments to Plummet 11.9% in 2020 Fueled by Ongoing COVID-19 Challenges 5America does not want China to dominate 5G mobile networks 6“Data localization” can be defined as the act of storing data on a device that is physically located within the country where the data was created. Data localization requirements are governmental obligations that explicitly mandate local storage of personal information or strongly encourage local storage through data protection laws that erect stringent legal compliance obligations on cross-border data transfers. 7The big data center industry ushered in another outbreak 8The GSMA represents the interests of mobile operators worldwide, uniting more than 750 operators with almost 400 companies in the broader mobile ecosystem, including handset and device makers, software companies, equipment providers and internet companies, as well as organizations in adjacent industry sectors. 9GSMA: 5G Moves from Hype to Reality – but 4G Still King 10Smart Cities Market Size Worth $463.9 billion By 2027 11The Automotive Semiconductor Market – Key Determinants of U.S. Firm Competitiveness 12AI is data Pac-Man. Winning requires a flashy new storage strategy.
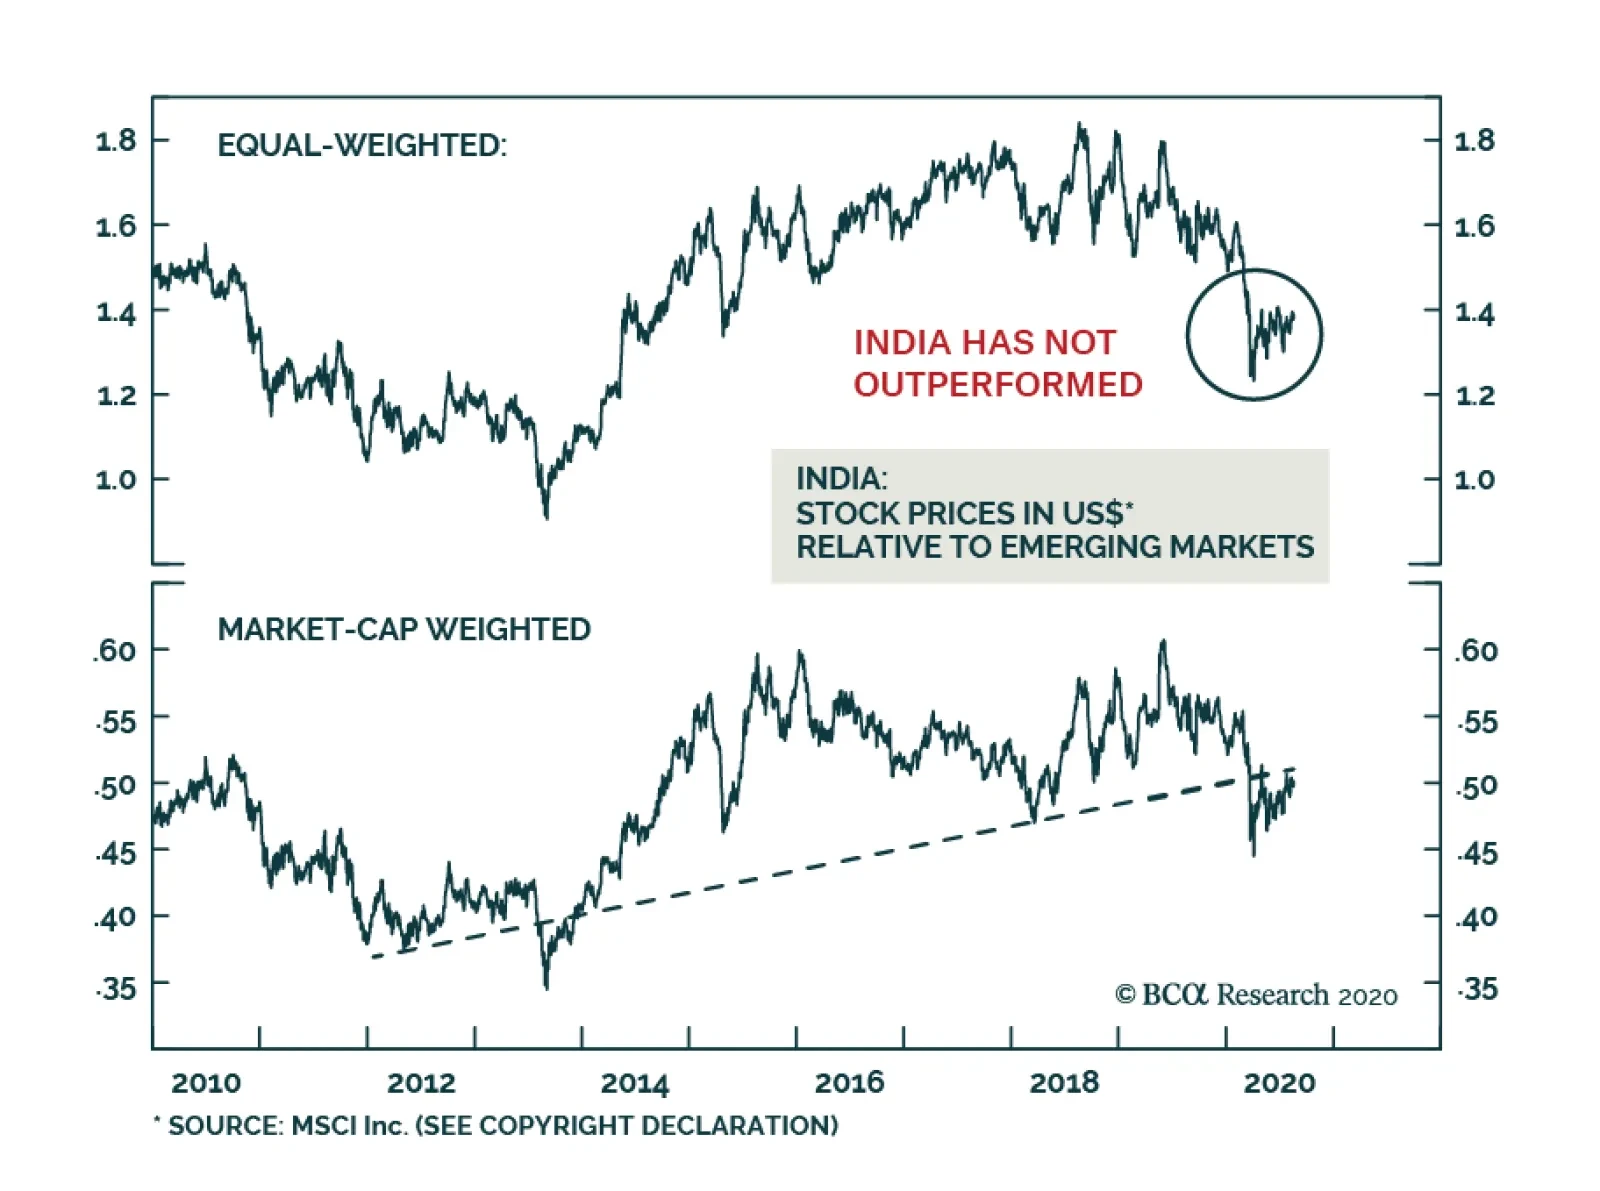
BCA Research's Emerging Markets Strategy service recommends that dedicated EM equity investors maintain an underweight position in India within an EM equity portfolio. The strong rally in certain mega-cap stocks has masked the muted revival in the broad…
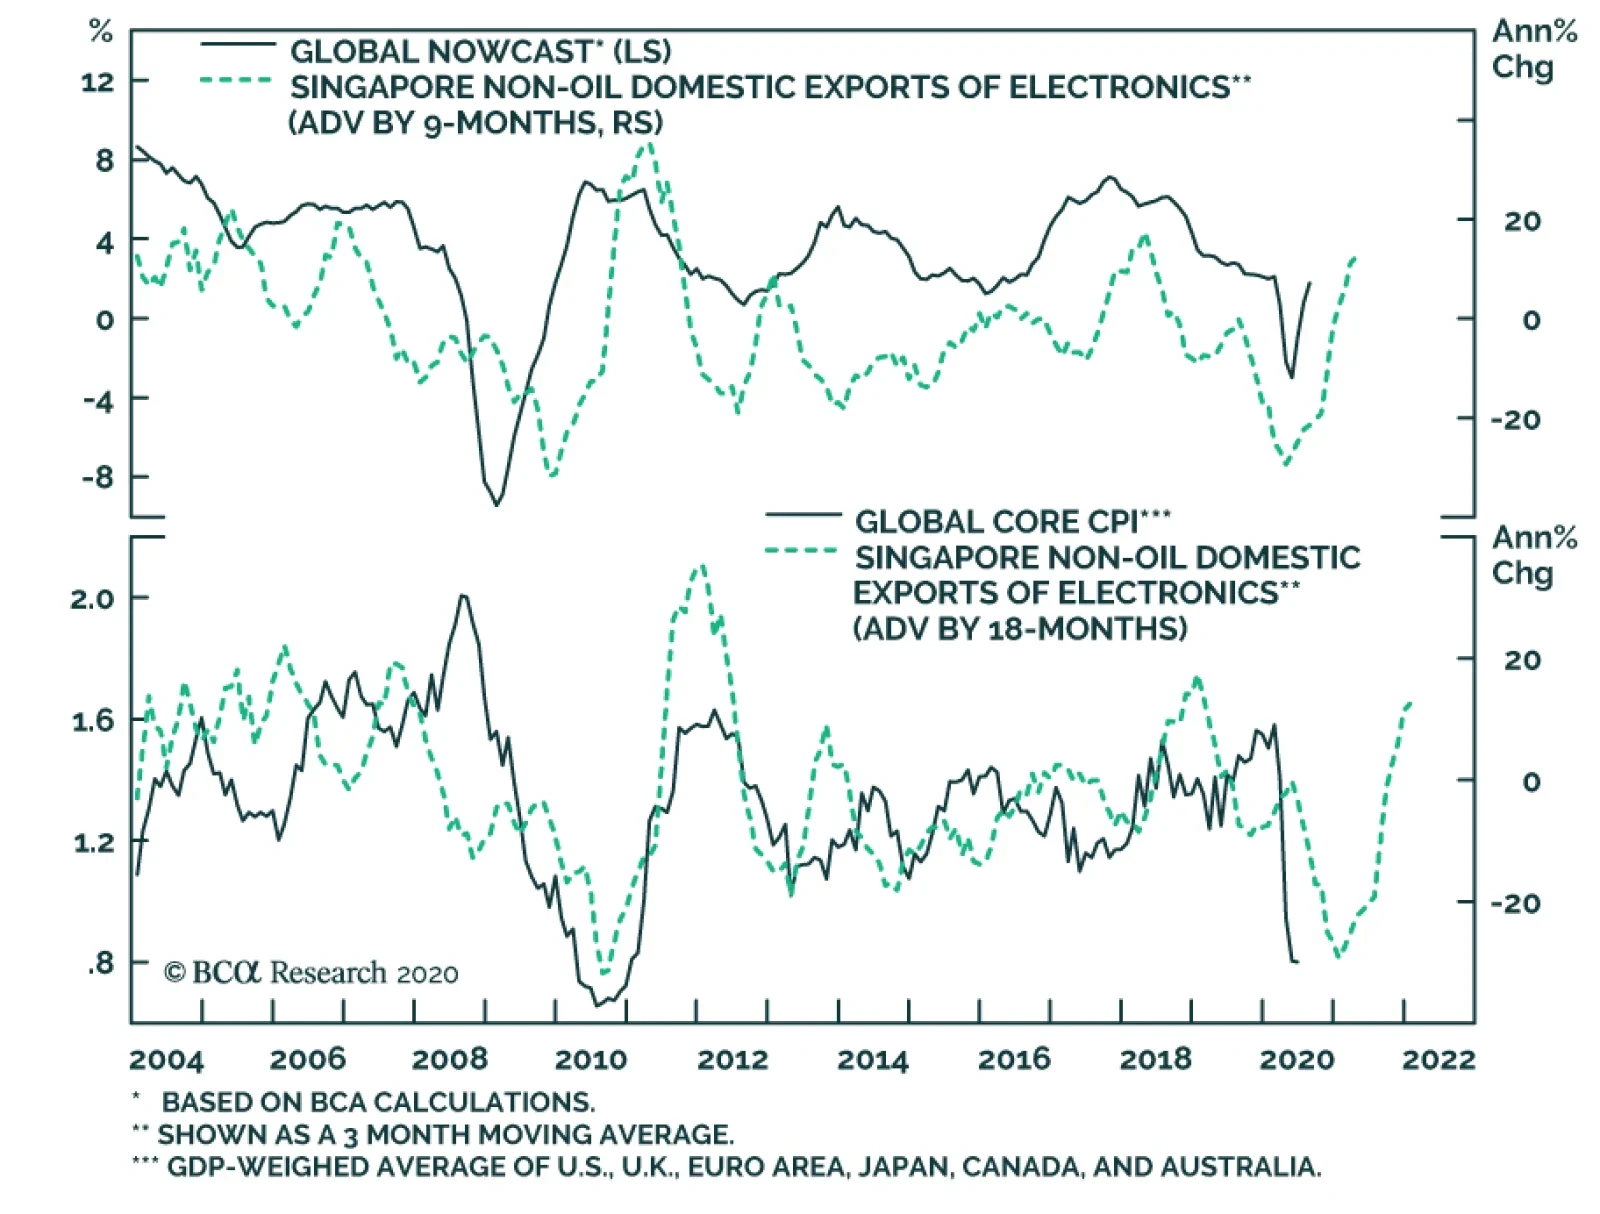
The growth rate of Singapore’s non-oil domestic exports slowed in July to a 6% annual rate. However, this is a noisy series; the trend in the growth rate of exports continues to improve. The trend in Singapore’s exports of electronics good has been…