Asia
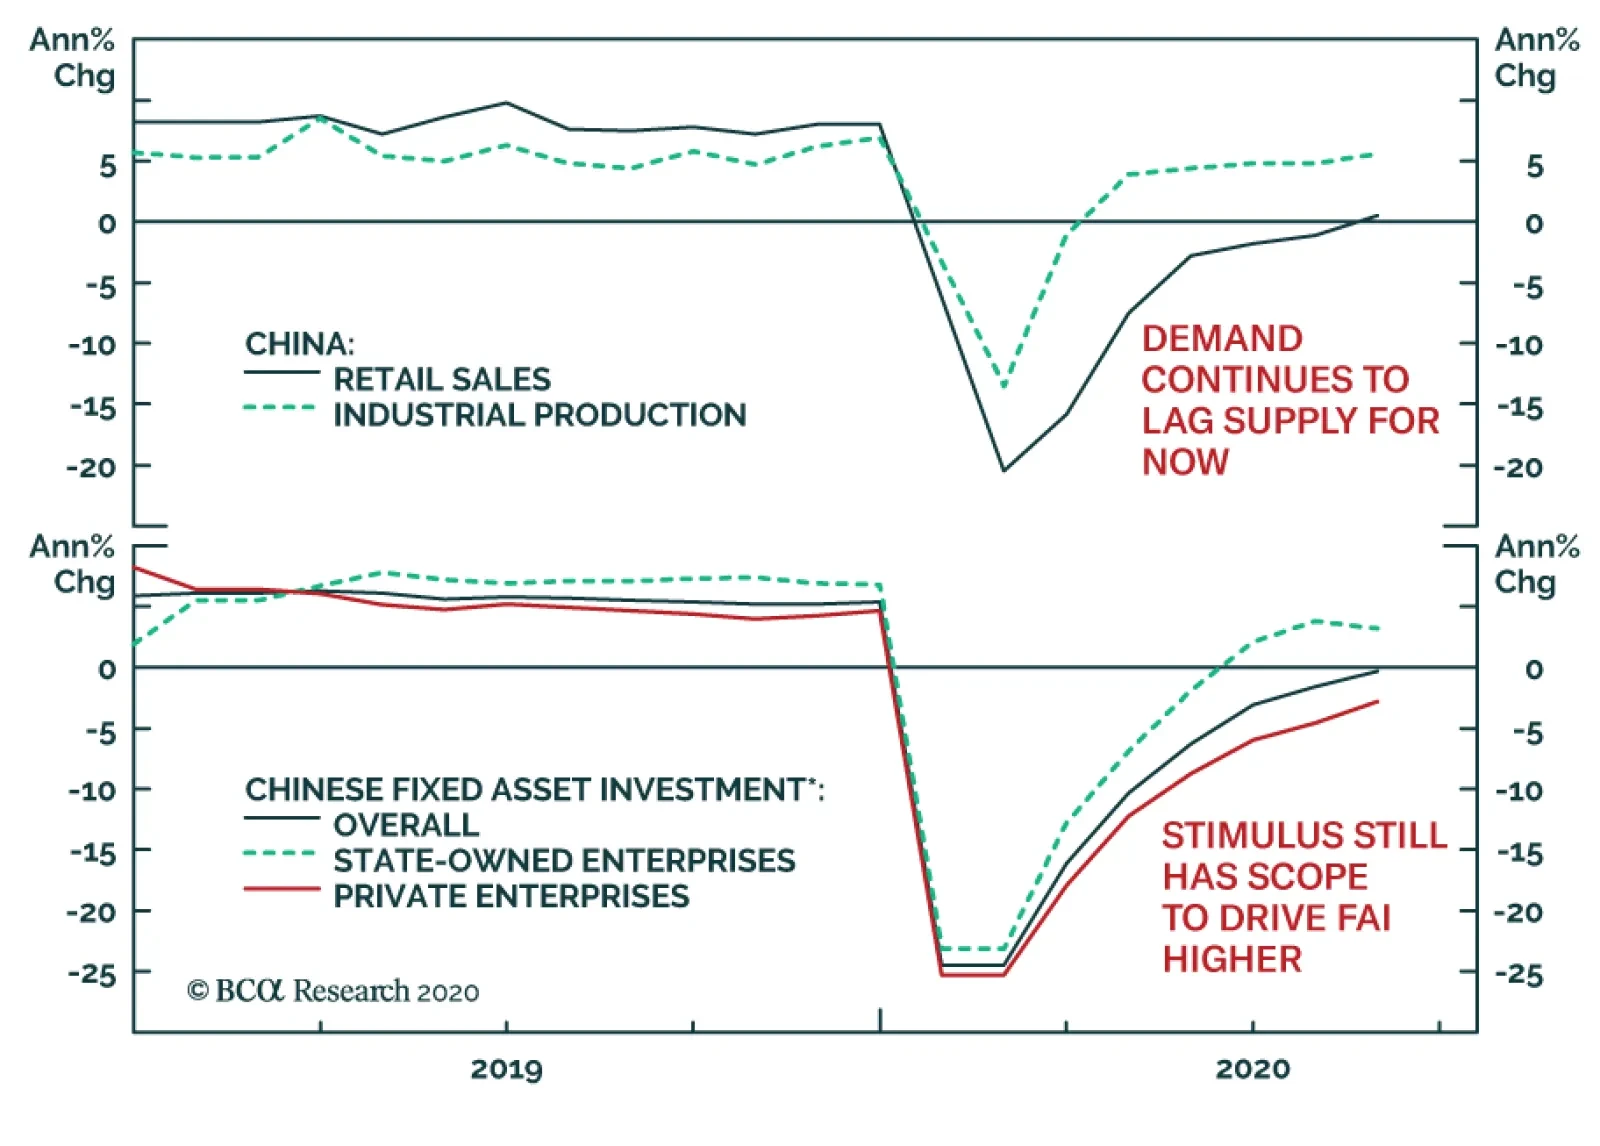
In August, China’s industrial production strengthened further, rising to 5.6% year-on-year and beating consensus expectations of 5.1%. Fixed-asset investment also picked up, moving up from -1.6% to -0.3% year-on-year. While private capex continues to…
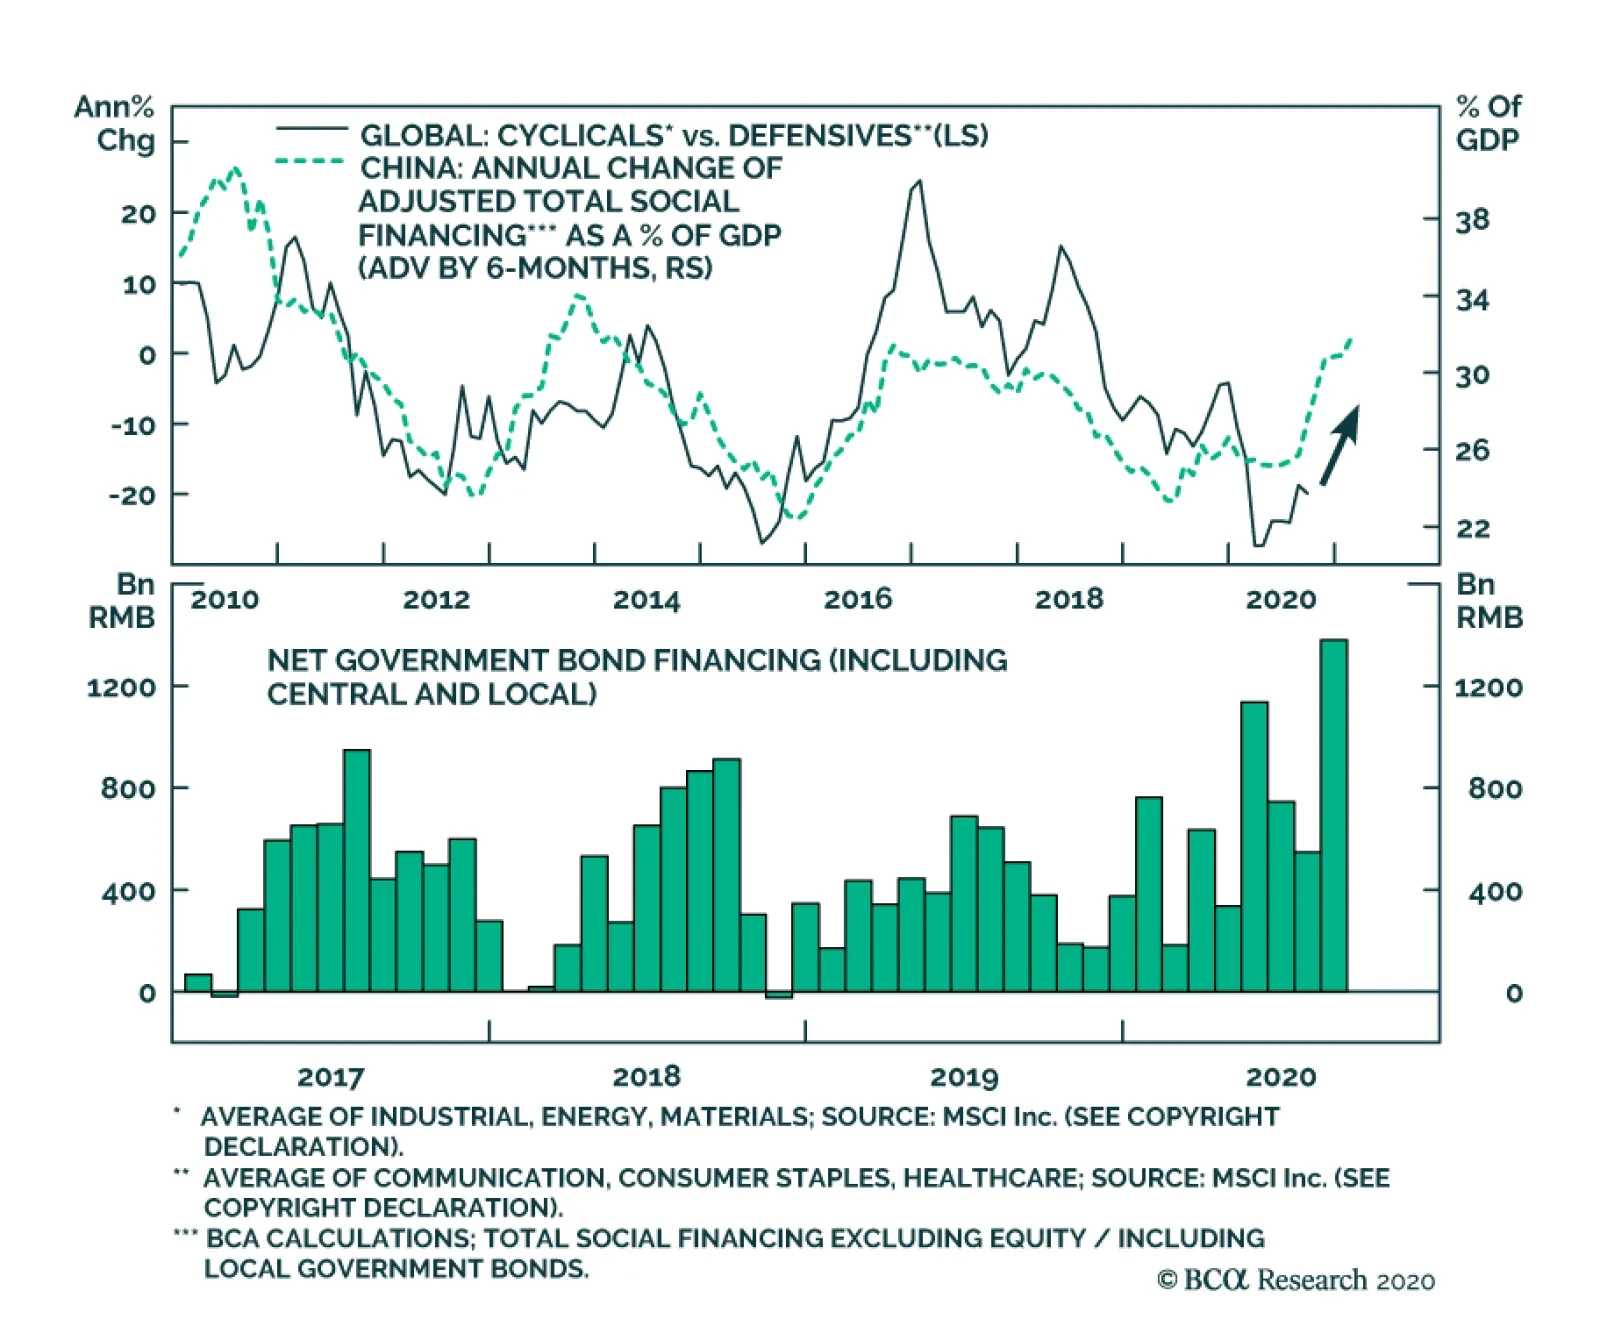
In August, China’s credit trends continued to point to a positive outcome for the global industrial cycle. While new loans only met expectations of CNY 1.28 trillion, total social financing (TSF) blew past expectations of CNY 2.59 trillion by rising by…

Highlights China’s surge in refined copper imports allows it to cover a structural short position it has in this critical commodity – mostly in its unrefined state – and ensures the stimulus being deployed to revive its economy ahead of the 100th anniversary of the founding of the Communist Party in July will not falter due to a lack of basic raw materials (Chart of the Week). We expect continued resilience in commodities generally into 2021 – particularly in base metals, iron ore and crude oil – as markets realize China’s Communist Party is intent on showcasing its brand of policy-driven, vertically integrated capitalism as the engine of its robust economic growth. As with oil, we expect copper demand will benefit from a weaker USD and stronger global trade. The odds of a COVID-19 vaccine being available by year-end or early 2021 remain favorable, which also will support a revival in demand.1 We are keeping our COMEX copper forecast at $3.00/lb at end-2020, and expect 2021 to finish at $3.15/lb. We would not be surprised by higher prices, and are, therefore, getting long December 2021 COMEX copper at tonight's close. Feature The surge in refined copper imports hedged Chinese firms against supply disruptions caused by the pandemic and reduced availability of scrap copper on global markets this year. COVID-19 may have derailed the Communist Party’s realization of the “Chinese Dream” this year, wherein the leadership vowed real per-capita GDP would double in the decade ending in 2020, but it is unlikely to diminish the celebration of the Party’s 100th anniversary in July.2 Chart of the WeekVol Falls As Know Unknowns Are Resolved
Vol Falls As Know Unknowns Are Resolved
Vol Falls As Know Unknowns Are Resolved
The global commodity-demand destruction caused by the COVID-19 pandemic depressed the prices of commodities generally, particularly those which China is structurally short – e.g., copper, iron ore, oil and natural gas. As terrible as the pandemic has been in human terms, it has allowed Chinese firms and the State Reserve Bureau to sharply increase imports of refined copper, which rose 34% in the January-to-July period to 2.5mm MT amid such low prices, which bottomed at $2.10/lb in late March and now are trading above $3.00/lb.3 China accounts for more than 50% of global refined copper consumption and ~ 40% of refined production (Chart 2).4 Chart 2China Dominates Metals Consumption
China's Copper Buying Spree Heralds Communist Party's Centenary Celebrations
China's Copper Buying Spree Heralds Communist Party's Centenary Celebrations
The surge in refined copper imports hedged Chinese firms against supply disruptions caused by the pandemic and reduced availability of scrap copper on global markets this year. Global copper ore and concentrate supply fell ~ 3% y/y in 2Q20, led by a 28% decline in Peru’s mine production, according to the World Bureau of Metal Statistics (Chart 3). This was a result of containment policies that limited mining activities to slow the pandemic’s spread in Latin America. In Chile, COVID-19 cases stabilized in recent months at around 100 per million people (Chart 4). In Peru, cases have been declining since August, but from an elevated level. Supply is expected to recover rapidly as these economies reopen, but further mine disruptions remain a risk. Chart 3Peru's Copper Ore Supplies Recovering
Peru's Copper Ore Supplies Recovering
Peru's Copper Ore Supplies Recovering
Chart 4COVID-19 Copper Supply Risks Falling
COVID-19 Copper Supply Risks Falling
COVID-19 Copper Supply Risks Falling
Commodity-Demand Indicators Move Higher we expect the effect of expansionary monetary and fiscal policies globally will continue to show up in our indicators and for the US dollar to resume its downward trajectory. Global central banks and government stimulus unleashed in the wake of the COVID-19 pandemic, combined with a depreciating US dollar, pushed our commodity-demand indicators higher over the last few months (Chart 5). This supported copper prices, which are up 42% since their March 23 low. Moreover, the pickup in economic activity in China’s major trading partners provided further support to copper demand, given that ~ 17% of China’s copper consumption comes from exports of products containing copper (Chart 6).5 Chart 5Commodity Demand Is Reviving
Commodity Demand Is Reviving
Commodity Demand Is Reviving
Chart 6Expect Chinese Employment Gains As Economy Continues To Recover
Expect Chinese Employment Gains As Economy Continues To Recover
Expect Chinese Employment Gains As Economy Continues To Recover
For the balance of 2H20, we expect the effect of expansionary monetary and fiscal policies globally will continue to show up in our indicators and for the US dollar to resume its downward trajectory. These are key factors driving our positive view on metal – especially copper – prices. Communist Party’s 100th Anniversary Will Boost Commodity Prices China’s buying spree for commodities it is structurally short – particularly copper, iron ore and oil – minimizes the risk fiscal and monetary stimulus deployed to revive its economy will be derailed this year or next. This is particularly important next year: We expect stimulus will continue and will be hitting the economy full force in time for the Communist Party’s centennial celebrations in July. For the infrastructure and construction spending that will be spurred by the massive stimulus, this is critical to spurring employment – a key goal of the Party’s domestic harmony focus – domestic manufacturing, services, and exports (Chart 6).6 This will keep demand for copper – and commodities generally – strong into 2021, as markets realize China’s Communist Party is intent on showcasing its brand of policy-driven, vertically integrated capitalism as the engine of its world-beating economic performance. And, because stocks of critical commodities are increasing as stimulus is hitting the domestic economy next year, the risk of massively inflating prices while the county is celebrating the Party’s centennial in July – as happened following the Global Financial Crisis (GFC) – is minimized, but not completely eliminated (Chart 7). Chart 7COMEX Stocks Will Move To China
COMEX Stocks Will Move To China
COMEX Stocks Will Move To China
That said, we still expect copper to move higher next year. In our modeling of prices, we note world PMIs, EM FX rates, the USD, also drive copper prices, in addition to those factors discussed above specific to China. We expect COMEX high-grade copper prices to end 2020 at $3.00/lb, and to average $3.11/lb next year (Chart 8). On the back of this expectation, we are getting long December 2021 COMEX copper at tonight’s close, expecting 2021 to end at $3.15/lb. Chart 8Copper Prices Expected To Increase
Copper Prices Expected To Increase
Copper Prices Expected To Increase
Risks To Our Copper View Geopolitical risks remain the chief threat to our bullish copper view. The US Presidential election campaign rhetoric, in particular, has turned bellicose vis-à-vis China, with President Donald Trump threatening to “decouple” economically from China if he is reelected.7 These sorts of pronouncement threaten to escalate what could now be considered a trade dispute to an all-out trade war, particularly if it includes sanctions against US firms investing in manufacturing and services in China, as Trump promises. At the limit, this would put a long-term bid under the USD, and reverse the nascent recovery in commodity demand resulting from a weaker dollar. Outright military confrontation between the US and China also is a risk, particularly as tensions in the South China Sea and the Asia-Pacific region continue. The most likely confrontation would be an escalation of hostilities resulting from a naval or aerial face-off, the number of which has been steadily increasing. The threat of a second wave of COVID-19 also remains a risk, particularly if it results in another round of lockdowns globally. That said, we believe the odds of this are very low, as the capacity to absorb another shutdown in economic activity in DM and EM economies likely has been exhausted by measures already implemented this year. It is highly unlikely any economy can afford another round of economic shutdown without triggering an economic depression. Bottom Line: China’s surge in refined copper imports allows it to cover its structural short position in the commodity, and, equally importantly, to ensure an expected revival of economic activity into 2021 – when the Communist Party celebrates its 100th anniversary – will not falter because it lacks basic raw materials. We are keeping our COMEX copper forecast at $3.00/lb at end-2020, and expect 2021 prices to average $3.11/lb. On the back of this expectation, we are getting long December 2021 COMEX copper at tonight’s close. Robert P. Ryan Chief Commodity & Energy Strategist rryan@bcaresearch.com Hugo Bélanger Associate Editor Commodity & Energy Strategy HugoB@bcaresearch.com Commodities Round-Up Energy: Overweight Brent prices dipped below $40/bbl for the first time since mid-June. Prior to this move, prices had been stable in a narrow range around $43/bbl since mid-June. Pessimism is increasing re the outlook for demand, as Saudi Arabia reduced its official selling prices (OSPs) for crude delivered to Asian buyers by $1.40/bbl. The negative sentiment was exacerbated by the selloff in tech stocks that began last Thursday. WTI net speculative positions are down to 20% of total open interests vs. 22% in July, as hedge funds exit oil markets. Base Metals: Neutral The LMEX index is up 4% over the past four weeks, supported by higher metals’ consumption and imports in China. Moreover, mobility trends in Europe, Japan, and the US have begun to turn up again in recent weeks based on Apple mobility data. The recovery in China’s economic activity remains the main pillar of our base metals outlook. However, Europe, Japan, and the US still represent a non-negligible share of global metal demand (e.g. ~ 24% copper consumption). Hence, the recent uptick in mobility data is constructive for base metal prices. Precious Metals: Neutral Gold prices are down 2% since last week, pressured by a slight increase in the US dollar and real rates. The divergence in COVID-19 cases between the US and Europe increases the risk of a short-term bounce higher if this leads to the US economy outperforming that of the EU (Chart 9). Still, mounting geopolitical risks ahead of the US election, lower-for-longer interest rates, and a resumption of the downward trend in the USD over the medium term should support gold later this year. Ags/Softs: Underweight Soybean prices remain steady, near 2-year highs. The USDA crop progress report listed 55% of soybeans in good or excellent condition for the week ending September 6, 2020. This is a substantial deterioration compared to 66% in those categories last week and 73% at the beginning of August. Corn futures were supported by similar weak supply fundamentals. The USDA reported 55% of corn crops in good or excellent condition against 62% the previous week. Going forward, it will be important to monitor the DXY as it has been strengthening since the beginning of September and could be a headwind to these commodity prices if it breaks to the upside (Chart 10). Chart 9EU Cases Are Rising
EU Cases Are Rising
EU Cases Are Rising
Chart 10US DXY Strengthening
US DXY Strengthening
US DXY Strengthening
Footnotes 1 Please see Lower Vol As OPEC 2.0 Gains Control, published September 3, 2020, for additional discussion of vaccine availability. 2 Please see Iron Ore, Steel Poised For Rally, which we published February 13, 2020, for a discussion of the commodity-market implications of China’s dual policy goals of doubling GDP between 2010 and 2020 and preparing for the celebration of the 100th anniversary of the founding of the Chinese Communist Party in 1921. It is available at ces.bcaresearch.com. 3 Please see China's July refined copper imports surge 90% on year boosted by open arbitrage published by S&P Global Platts September 1, 2020. 4 China also accounts for close to 50% of copper ore imports, according to he Observatory of Economic Complexity (OEC). 5 Please see The Impact of the COVID-19 Pandemic on World Copper Supply, published by the International Copper Study Group on May 21, 2020. 6 For an update of the stimulus measures and China’s economic performance, please see China Macro And Market Review published September 9, 2020, by our China Investment Strategy colleagues. It is available at cis.bcaresearch.com. 7 Please see Trump threatens to ‘decouple’ U.S. economy from China, accuses Biden of ‘treachery’ published by marketwatch.com September 7, 2020. Investment Views and Themes Recommendations Strategic Recommendations Tactical Trades Trade Recommendation Performance In 2020 Q2
Lower Vol As OPEC 2.0 Gains Control
Lower Vol As OPEC 2.0 Gains Control
Commodity Prices and Plays Reference Table Trades Closed in 2020 Summary of Closed Trades
Lower Vol As OPEC 2.0 Gains Control
Lower Vol As OPEC 2.0 Gains Control
BCA Research's China Investment Strategy service concludes that the fundamentals are supportive of a positive cyclical view on Chinese stocks. Despite some pullbacks in the prices of Chinese stocks of late, we do not think that the cyclical upturn in…
Highlights Bangladesh’s balance of payments (BoP) is a key pillar for the country’s financial markets and economy. The country’s BoP will deteriorate going forward. That, coupled with ongoing public debt monetization, will pose major risks to the currency in the next 6-12 months. The central bank will have to defend the exchange rate by selling its foreign exchange reserves and/or hiking policy rates. As a result, liquidity conditions will tighten, hurting the equity market, as it will disproportionally hinder commercial banks and credit flow into the economy. We recommend investors avoid this bourse or underweight it relative to the EM equity benchmark. Feature Chart 1Bangladesh's BoP: A Pillar For Markets
Bangladesh's BoP: A Pillar For Markets
Bangladesh's BoP: A Pillar For Markets
Bangladesh’s balance of payments (BoP) is a key pillar for the country’s financial markets and economy. Essentially, the central bank has been de facto targeting a stable exchange rate as it works to smooth out all material currency fluctuations. Specifically, when a BoP surplus exerts upward pressure on the exchange rate, the central bank accumulates foreign exchange (FX) reserves and reduces interest rates in order to cap currency appreciation. Easing monetary policy and liquidity expansion, in turn, pushes share prices higher (Chart 1). Worryingly, the improvement in Bangladesh’s BoP that has occurred over the past 18 months has now peaked. A decidedly worsening BoP position, coupled with ongoing public debt monetization by the central bank and commercial banks, will pose major risks to the currency in the next 6-12 months. To defend the exchange rate, the central bank will likely sell its FX reserves and will, thereby, shrink the commercial banks’ excess reserves at the central bank, as well as curtail growth in money supply. Such liquidity tightening is a bad omen for the stock market. All in all, we find the risk/reward profile of this stock market currently poor. We therefore recommend equity investors avoid this bourse for now, and dedicated EM equity portfolios to underweight it. The Balance Of Payments: Deterioration Ahead Chart 2Current Account Deficit Is Set To Widen Sharply
Current Account Deficit Is Set To Widen Sharply
Current Account Deficit Is Set To Widen Sharply
Odds are that Bangladesh’s balance of payments surplus has peaked and will soon begin to deteriorate: Current Account: The current account deficit – which has already rolled over – will widen further (Chart 2, top panel). Remittances Remittances into Bangladesh, which amount to a whopping $20 billion annually (or 6% of GDP), are set to drop dramatically (Chart 2, second panel). Crucially, they have been rising markedly due to various factors that will prove to be temporary and will quickly dissipate. First, the Bangladesh government introduced a 2% incentive to encourage Bangladeshi nationals working abroad to send money back home. This has triggered a one-off boost in remittances, as these workers rushed to send back savings. The government has extended this incentive to this fiscal year (July 2020-June 2021). However, it will be less effective as it is highly likely that Bangladeshi foreign workers have already sent most of their savings back when the incentive was originally introduced. Furthermore, global employment will remain weak for some time. Thus, sooner rather than later, the one-off effect of this policy will subside. Second, the official reported value of remittances into the country has been artificially boosted during the pandemic. Particularly, Bangladeshi workers abroad have been forced to send money via official/banking means instead of transporting physical cash while travelling. The official banking channel is easily accounted for in official data, as opposed to physical cash. Third, around 58% of remittances into Bangladesh emanate from GCC countries. These oil-driven economies have been severely struck by two deflationary events: the crude oil price collapse and the pandemic. In turn, GCC businesses have laid-off a massive number of foreign workers, which has forced many Bangladeshi workers to transfer their entire savings back home (Chart 3, top and mid panels). All in all, we find the risk/reward profile of this stock market currently poor. Chart 3Unsustainable And One-Off Rise In Remittances
Unsustainable And One-Off Rise In Remittances
Unsustainable And One-Off Rise In Remittances
There is ample evidence that foreign workers from Bangladesh have been brutally affected by layoffs in GCC states. For instance, several GCC governments have asked the Bangladeshi government to take back undocumented Bangladeshi workers. In turn, the government has set up programs to help receive thousands of workers returning home. As GCC economies struggle to recover fully, Bangladeshi citizens will no longer enjoy the same access to the GCC labor market for the foreseeable future. Indeed, the number of new foreign workers from Bangladesh (of which, most end up in GCC states) has virtually fallen to zero in June and will not rebound to pre-pandemic levels any time soon (Chart 3, bottom panel). All in all, remittances into Bangladesh will fall a great deal in the coming months and will not likely go back to their pre-pandemic levels any time soon. Exports Bangladesh is heavily reliant on textile exports. The latter account for around 70% of the country’s total export earnings. Furthermore, around 60% of the nation’s overall exports are destined to Europe, and 15% to the US. Worryingly, the outlook for Bangladesh’s textile industry is fraught with challenges, both cyclically and structurally. Cyclically, despite recent improvement (Chart 4), demand for apparel in both the US and the euro area will likely be subdued and remain below pre-pandemic levels. Chart 4Subdued DM Demand For Apparels
Subdued DM Demand For Apparels
Subdued DM Demand For Apparels
The basis is that the global pandemic is far from over and continues to evolve idiosyncratically. In turn, renewed social distancing measures (restricting movement and encouraging people to continue working from home) will temper demand for apparels/clothing. Structurally, Bangladesh’s textile industry is falling behind its main competitors, as cheap wages alone are no longer enough to boost textile exports. According to LankaBangla Asset Management, Bangladesh suffers from a lack of technological innovation, poor infrastructure, rising utility costs and inadequate port capacity.1 Indeed, this nation has been losing market share to other Southeast Asian countries. The top panel of Chart 5 illustrates that Bangladesh’s exports of apparels have massively underperformed those of Vietnam in value terms. Finally, the EU and Vietnam signed a comprehensive Free Trade Agreement on February 12, which went into effect on August 1. The agreement drops tariffs significantly on Vietnam’s exports to the EU. That will allow Vietnam to take substantial market share from Bangladesh’s EU market (Bangladesh’s largest textile buyer). Imports Bangladesh’s imports have been contracting less severely than exports, and this will continue to be the case going forward. First, the government announced an expansionary budget for the July 2020-June 2021 fiscal year that entails 9% growth. Higher government expenditures will, in turn, feed into somewhat stronger imports (Chart 6). Chart 5Bangladesh Textile Industry Is Falling Behind Its Competitors
Bangladesh Textile Industry Is Falling Behind Its Competitors
Bangladesh Textile Industry Is Falling Behind Its Competitors
Chart 6Bangladesh: Rising Government Expenditures Will Boost Imports
Bangladesh: Rising Government Expenditures Will Boost Imports
Bangladesh: Rising Government Expenditures Will Boost Imports
Second, basic goods such as food, medicine, and petroleum account for 30% of Bangladesh’s total imports. Such essential goods imports will remain necessary, regardless of the direction of Bangladesh’s business cycle. Therefore, they will keep Bangladesh’s overall import bill somewhat strong relative to exports. Financial account: To fund its current account deficit, Bangladesh relies on foreign financial inflows. Their outlook is uncertain, however: Private-sector foreign funding Net FDI inflows into Bangladesh have relapsed (Chart 7, top panel). Meanwhile, external borrowing by non-financial companies was already contracting in March 2020 and is unlikely to recover briskly (Chart 7, bottom panel). Crucially, FDI inflows into Bangladesh’s private sector will remain weak, as foreign businesses will likely invest elsewhere in Asia For instance, Bangladesh failed to attract a single company out of the 30 Japanese companies relocating from China. Instead, 15 companies relocated to Vietnam, six to Thailand, four to Malaysia and three to the Philippines. This highlights how unfriendly the Bangladesh business environment is Finally, public governance is deteriorating in Bangladesh. The Awami League (the ruling party) has been busy cracking down on all form of dissent and courting Islamist organizations for legitimacy. The league has also been targeting minorities, journalists, and bloggers. All in all, the government is more concerned with staying in power, and has failed to address the basic needs of its citizens and pressing economic issues. This will be a major reason why FDI to the private sector will remain structurally subdued. The current account deficit is set to deteriorate significantly. Public-sector funding With private-sector foreign funding subdued, Bangladesh has been increasingly relying on public-sector foreign funding to reduce the current account deficit (Chart 8). Chart 7Outlook For Private-Sector Foreign Funding Is Gloomy
Outlook For Private-Sector Foreign Funding Is Gloomy
Outlook For Private-Sector Foreign Funding Is Gloomy
Chart 8Public-Sector Foreign Funding Will Not Keep Rising Indefinitely
Public-Sector Foreign Funding Will Not Keep Rising Indefinitely
Public-Sector Foreign Funding Will Not Keep Rising Indefinitely
Bangladesh has already received almost $4 billion in funding from international organizations due to the COVID-19 pandemic.2 Therefore, further significant borrowing from such organizations is not in the cards for now. As to bilateral borrowing from countries, Bangladesh has been actively signing infrastructure deals with China. However, most of these deals seem to have gone unimplemented. For instance, of the $24 billion-dollar worth of infrastructure projects, Bangladesh signed with China in 2016, only five projects worth about $1 billion were implemented by December 2019. Furthermore, many of these agreements expire this year and it is unclear whether they will be renegotiated. Most of these projects were not implemented due to Bangladesh’s regulatory hurdles. Bangladesh is now seeking a $6.4-billion infrastructure loan from China. If financing is undertaken and projects are implemented faster than before, this will constitute a major risk to our downbeat analysis on the BoP. The motive behind a faster implementation of these projects funded by China going forward lies in the ongoing and rising tensions between China and India, which could encourage the former to pour money into Bangladesh to bring it closer to its orbit and away from India’s. Doing so would provide China with greater presence in the Bay of Bengal, which directly threatens India’s national and geopolitical interests. Bottom Line: The current account deficit is set to deteriorate significantly. Meanwhile, private-sector funding is very subdued and the outlook for public-sector funding is uncertain. As and when public-sector foreign financial inflows slow, the BoP will deteriorate and that will put depreciation pressure on the currency. Will A Worsening BoP Lead To Monetary Tightening? In the context of improving BoP dynamics, the central bank has not only reduced its policy rate but has also injected large amounts of liquidity by lending to commercial banks and by purchasing government bonds (Chart 9, top panel). Banks have also been purchasing government debt securities (Chart 9, middle panel). The purchases of government debt securities by Bangladesh Bank (BB) and commercial banks have, in turn, led to a considerable acceleration in broad money supply despite weak loan growth (Chart 9, bottom panel). Yet, the deteriorating BoP position along with public debt monetization is a perfect cocktail for currency weakness (Chart 10). Importantly, the BoP does not necessarily need to dip into negative territory for the Bangladeshi taka (BDT) to depreciate. It suffices for the BoP to deteriorate marginally for the currency to weaken (middle panel of Chart 1 on page 2). Chart 9Public Debt Monetization By Central Bank & Commercial Banks
Public Debt Monetization By Central Bank & Commercial Banks
Public Debt Monetization By Central Bank & Commercial Banks
Chart 10Bangladesh: Central Bank Liquidity Injections Is Currency Bearish
Bangladesh: Central Bank Liquidity Injections Is Currency Bearish
Bangladesh: Central Bank Liquidity Injections Is Currency Bearish
In turn, as the currency begins to depreciate, BB will have to defend the exchange rate given to its objective of securing a stable exchange rate. The central bank will have to sell its foreign exchange reserves and/or hike policy rates as well as reduce its purchases of government bonds. The outcome will be rising interest rates and worsening liquidity conditions. While monetary tightening would eventually stabilize the currency, this policy setting will hurt the equity market, as it will disproportionally hinder commercial banks and credit flow in the economy. Crucially, financials make up about 22% of the Dhaka Stock Exchange index. While monetary tightening would eventually stabilize the currency, this policy setting will hurt the equity market. Non-performing loans (NPLs) of commercial banks will soar amid sluggish growth and higher borrowing costs (Chart 11). Also, given that the central bank tends to cap commercial banks’ lending rates, higher short rates will cause commercial banks’ net interest rate margins to fall significantly. This is negative for banks’ share prices (Chart 12). Chart 11Bangladesh: A New Cycle Of Rising Non-Performing Loans Is In The Cards
Bangladesh: A New Cycle Of Rising Non-Performing Loans Is In The Cards
Bangladesh: A New Cycle Of Rising Non-Performing Loans Is In The Cards
Chart 12Bangladesh: Compressing Net Interest Rate Margins Are Negative For Bank Stocks
Bangladesh: Compressing Net Interest Rate Margins Are Negative For Bank Stocks
Bangladesh: Compressing Net Interest Rate Margins Are Negative For Bank Stocks
Investment Recommendations Bangladesh’s BoP dynamics are set to deteriorate significantly, which is bearish for the currency. Depreciation pressure on the currency will force the central bank to intervene by selling its FX reserves and/or to hike interest rates. Such monetary and liquidity tightening is negative for share prices (Chart 10, bottom panel). Chart 13Underweight Bangladesh Equities Relative To EM
Underweight Bangladesh Equities Relative To EM
Underweight Bangladesh Equities Relative To EM
We recommend investors underweight this bourse relative to the EM equity benchmark (Chart 13). In terms of absolute performance, the risk-reward is unattractive. Moreover, as with other markets there are signs of frenzy and aggressive retail trading in Bangladesh. Like any retail frenzy, this will likely end with a major downleg in this bourse in the coming months. Ayman Kawtharani Editor/Strategist ayman@bcaresearch.com Footnotes 1 Please refer to COVID-19 Impact on Bangladesh Economy, June 7, 2020 – LankaBangla Asset Management. 2 Bangladesh this year alone received $1.2 billion from the ADB, $1.3 billion from the World Bank, a $730-million loan from the IMF, and $500 million from the AIIB. It has also received loans from the Japan International Cooperation Agency and the Islamic Development Bank, among other organizations and countries.
Highlights Economic data in August point to a faster recovery in demand than in production. The service-sector recovery is picking up speed; consumption growth remains negative, but will benefit from a steady rebound in the service sector. The strong upward momentum in China’s stock prices, on the other hand, has lost some steam since the second half of July. Policy supports and improving economic fundamentals still warrant a constructive stance on Chinese stocks over the coming 6 to 12 months. Feature Both soft and hard data released over the past couple of weeks indicate that China’s economic recovery remains on track. August’s official PMI new orders sub-index continued to advance, and the official non-manufacturing PMI made the largest month-to-month improvement since March when the Chinese economy reopened. Hard economic data, such as exports and sales of homes, cars and retail goods, show that both external and domestic demand growth is strengthening. Chart 1Chinese Stocks Taking A Breather From July's Rally, Despite Improving Economic Fundamentals
Chinese Stocks Taking A Breather From July's Rally, Despite Improving Economic Fundamentals
Chinese Stocks Taking A Breather From July's Rally, Despite Improving Economic Fundamentals
Despite the economic improvement, the July rally in Chinese stocks faltered in August and into the first week of September. Although stock prices are still 12-15% higher than the end of June and continue to outperform global benchmarks, they are slightly below their mid-July peak in absolute terms (Chart 1). The pause in China’s stock market was inevitable because of the stunning pace of acceleration in early July, which saw margin lending rise to explosive levels that invited Chinese policymakers to cool the market. Last week’s corrections in the high-flying US tech stock prices also dragged down some of the Chinese tech sector's top performers. US sanctions targeting China’s tech companies may exacerbate downward pressure on the sector’s performance. Therefore, we continue to recommend that investors hold a neutral position for the next three months on Chinese tech stocks, in both absolute and relative terms. The outlook for China’s economic growth and monetary conditions supports our constructive view on the overall Chinese stocks, over a cyclical (6 -12 months) horizon. In the near term, we prefer offshore stocks outside of the tech sphere, and prefer onshore semiconductor stocks within a global semi equity portfolio. China’s “old economy” sectors, such as industrials and materials, will continue to benefit from the ongoing massive stimulus. Furthermore, the semiconductor sector has become China’s new poster child, as the country ramps up longer-term, earnings-friendly policy supports to develop its domestic semiconductor industry and counter the Trump administration’s restrictions.1 Table 1China Macro Data Summary
China Macro And Market Review
China Macro And Market Review
Table 2China Financial Market Performance Summary
China Macro And Market Review
China Macro And Market Review
Tables 1 and 2 present key developments in China’s economic and financial market performance in the past month, and we highlight several aspects below: China’s NBS manufacturing PMI was essentially unchanged in August (51 vs. 51.1 in July), but details of the survey imply that what has underpinned an industrial sector improvement this year remains in place. Although the production sub-index slowed, the new orders component increased, indicating that demand is strengthening relative to supply (Chart 2). The export orders component of the manufacturing PMI and the newly released trade data are both improving, suggesting that external demand is also holding up (Chart 2, bottom panel). The steel industry’s PMI fell to 47 in August from 49.2. As noted in last month’s China Macro And Market Review,2 the consistent outperformance in production recovery relative to demand since Q1 has led to an inventory buildup and a pullback in production. Inventory destocking will likely impede China’s imports of major commodities until the laggard recovery in industrial demand sustainably outpaces production (Chart 3). Chart 2Demands Are Improving On Both Domestic And External Fronts...
Demands Are Improving On Both Domestic And External Fronts...
Demands Are Improving On Both Domestic And External Fronts...
Chart 3...But Inventory Buildup Is Temporarily Impeding Production And Imports
...But Inventory Buildup Is Temporarily Impeding Production And Imports
...But Inventory Buildup Is Temporarily Impeding Production And Imports
Chart 4Accelerating Service Sector Recovery Should Give A Boost To Consumption
Accelerating Service Sector Recovery Should Give A Boost To Consumption
Accelerating Service Sector Recovery Should Give A Boost To Consumption
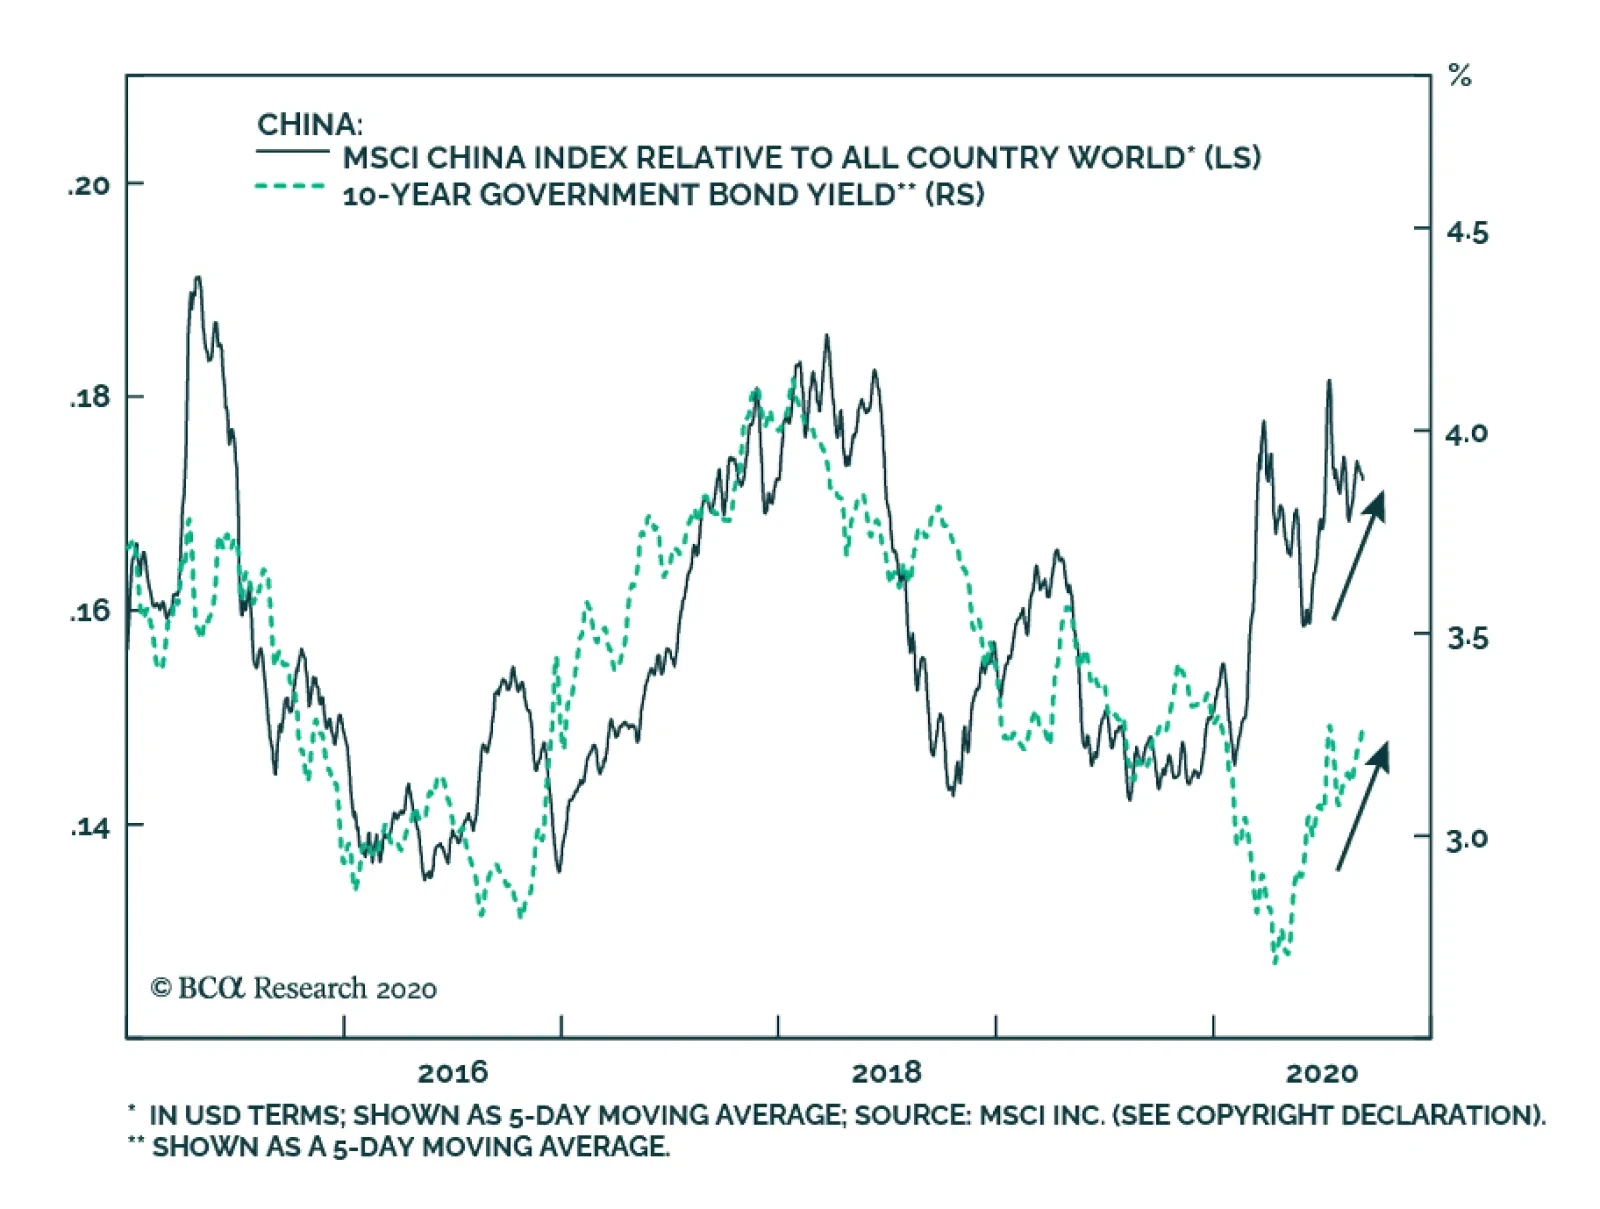
Despite a minor drop in the construction PMI sub-index due to heavy rains and floods in China’s central provinces, the acceleration in service activities pushed the non-manufacturing PMI to its highest level since early 2018 (Chart 4). China’s domestic COVID-19 infection rate remains low, giving rise to a rebound in service sector’s activities, such as tourism, catering, sports and entertainment. The resumption rate of theater operations reached 88% by the end of August. While the year-over-year growth rate in total retail sales of consumer goods remains negative, household purchases from larger enterprises registered a 2.2% increase in July (Chart 4, bottom panel). The normalization of activities in the service sector, coupled with the upcoming holiday season in September/October, will further support China’s household consumption recovery. China’s central bank and housing authorities have reportedly rolled out new rules to curb borrowing among overly indebted property developers. We do not expect the new directions to have a significant impact on our near-term outlook for real estate activities. Bank loans account for less than 15% of Chinese property developers’ funds, compared with down payments at 35%. Therefore, strong housing demand should more than offset any potential pullback in bank lending to property developers (Chart 5). Despite some pullbacks in the prices of Chinese stocks of late, we do not think that the cyclical upturn in Chinese stocks has run its course. Even though the PBoC seems to have normalized its post-COVID 19 monetary policy, monetary conditions remain very accommodative and fiscal stimulus will accelerate the pace of credit expansion through Q3.3 Continued money creation should prop up both China’s economic recovery and stock outperformance, in absolute terms and relative to global benchmarks. In addition, 10-year government bond yields rose 15bps in the past month and are now 66bps above their April low. The mounting bond yields on the back of an improved economic outlook, coupled with the continued outperformance in Chinese cyclical stocks over defensives, also support our constructive view on Chinese stocks on a 6-to-12 month basis (Chart 6). Chart 5Demand Should Continue Driving Property Sector Growth
Demand Should Continue Driving Property Sector Growth
Demand Should Continue Driving Property Sector Growth
Chart 6Fundamentals Are Supportive Of A Positive Cyclical View On Chinese Stocks
Fundamentals Are Supportive Of A Positive Cyclical View On Chinese Stocks
Fundamentals Are Supportive Of A Positive Cyclical View On Chinese Stocks
Chinese tech company stocks suffered losses last week due to selloffs in the global equity market led by US tech stocks. Technology is at the root of the ongoing US-China struggle, which we discussed in our weekly report on Aug 12.4 Given that the MSCI China index is heavily weighted towards some of China’s tech giants (e.g.: Alibaba, Tencent and Baidu), Chinese investable stocks are more vulnerable to both gyrations in the US tech sector and the escalating tech war between the US and China. As such, we continue to recommend that investors overweight investable stocks that are exposed to China’s “old economy” sectors. An acceleration in China’s demand-side recovery and a normalization of service activities will bode well for the performance of cyclical sectors, such as industrials and materials (Chart 7). In addition, we continue to overweight Chinese onshore semiconductor stocks relative to their global peers. Despite some volatility in recent weeks, we believe the structural upcycle in the Chinese onshore semi sector will continue, driven by Chinese policymakers’ ramped-up policy initiatives to support the nation’s domestic semiconductor research and production (Chart 8). Some of the fiscal and monetary incentives such as multi-year tax exemptions and cheaper bank credits will boost the sector’s longer-term growth prospects, whereas policies like government funding support and prioritized initial public offerings will push up the sector’s near-term multiple expansion. Chart 7Stick To "Old Economy" Chinese Stocks For The Time Being
Stick To "Old Economy" Chinese Stocks For The Time Being
Stick To "Old Economy" Chinese Stocks For The Time Being
Chart 8Chinese Semis On A Policy-Driven Structural Upturn
Chinese Semis On A Policy-Driven Structural Upturn
Chinese Semis On A Policy-Driven Structural Upturn
Qingyun Xu, CFA Senior Analyst qingyunx@bcaresearch.com Jing Sima China Strategist jings@bcaresearch.com Footnotes 1, 4Please see China Investment Strategy Weekly Report "Sticking With Chinese “Old Economy” Stocks In A Widening Tech War," dated August 12, 2020, available at cis.bcaresearch.com 2, 3Please see China Investment Strategy Weekly Report "China Macro And Market Review," dated August 5, 2020, available at cis.bcaresearch.com Cyclical Investment Stance Equity Sector Recommendations
China’s NBS PMI painted a picture of a bifurcated economy in August. While the Composite PMI rose to 54.5 from 54.1, the Manufacturing index softened slightly to 51 from 51.1. Nonetheless, the Non-Manufacturing gauge rose to 55.2 from 54.2. Meanwhile, the…
Highlights US-China relations in 2020 consist of a gentleman’s agreement to keep the Phase One trade deal in place and aggressive maneuvering in every other policy area. Stimulus is unlikely to be curtailed in the US or China yet, which means brinkmanship will eventually lead to a negative surprise for markets. But it is just as unlikely to come after the election as before. Joe Biden would only initially benefit Chinese equities – trade and tech conflict is a secular trend. North Korea is not a red herring, but South Korea is still a geopolitical investment opportunity more than a risk, especially relative to Taiwan. Feature Chart 1US Power Struggle Raises Risk To Rally
US Power Struggle Raises Risk To Rally
US Power Struggle Raises Risk To Rally
The “everything is awesome” rally continues, with US tech stocks unfazed by rising domestic and international risks. However, according to The Lego Movie 2, everything is not that awesome. The Treasury market smells trouble and long-dated yields remain subdued, despite a substantial new dose of monetary policy dovishness (Chart 1, top panel). In the near term we agree with the bears and remain tactically long 10-year Treasuries. Global policy uncertainty remains extremely elevated despite dropping off a bit from the heights of the pandemic lockdowns. US uncertainty, which is now rising relative to global, will climb through November and possibly all the way through Inauguration Day on January 20 (Chart 1, bottom panels). A contested election is not a low-probability event now that President Trump is making a comeback in the election race. President Trump’s comeback could generate a counter-trend bounce in the US dollar (Chart 2A). His comeback is not based in online betting odds but in battleground opinion polls (Chart 2B). Former Vice President Joe Biden is currently polling the same against Trump as Hillary Clinton did in 2016. Chart 2ATrump Staging A Comeback, But US Consumers Flagging
Trump Staging A Comeback, But US Consumers Flagging
Trump Staging A Comeback, But US Consumers Flagging
Chart 2BTrump Staging A Comeback, But US Consumers Flagging
The Trump-Xi Gentleman’s Agreement - GeoRisk Update
The Trump-Xi Gentleman’s Agreement - GeoRisk Update
Why should Trump be less negative for the greenback than Biden? First, Trump is a protectionist who would turn to aggressive foreign and trade policy when it became clear that most of his other legislative priorities would not make it past the Democratic House of Representatives. Unilateral, sweeping tariffs against China, and possibly the EU and various other nations, would weigh on global trade and economic recovery and hence support the dollar. Second, Trump’s populism means he would pursue growth at all costs, which means that US growth would increase relative to that of the rest of the world. Democrats, by contrast, would raise taxes and regulations that would have to be offset by new spending, weighing on growth at least at first. Thus Trump would inject animal spirits into the US economy while dampening those spirits abroad; Biden would do the opposite. The dollar may not rally sustainably, but it would be flat or fall less rapidly than if Biden and the Democrats reduced trade risks abroad while deterring domestic private investment. It is not yet clear that Trump’s comeback will have legs. The nation is still in thrall to the pandemic, recession, and social unrest, which undermine a sitting president. US consumer confidence has fallen, as anticipated (Chart 2, bottom panel). Trump should still be seen as an underdog despite his incumbent status. A Trump comeback could precipitate a counter-trend bounce in the US dollar. Nevertheless, our quantitative election model gives Trump a 45% chance of victory, up from 42% last month. Florida has shifted back into the Republican column – albeit as a “toss up” state with a roughly even chance of going either way (Chart 3). The shift reflects improvement in state leading economic indexes as a result of the V-shaped recovery in the economy thus far. Chart 3Trump Nearly Regains Florida In Our Quantitative Election Model, Odds Of Victory 45%
The Trump-Xi Gentleman’s Agreement - GeoRisk Update
The Trump-Xi Gentleman’s Agreement - GeoRisk Update
Assuming Trump signs a new relief bill in September, which is working its way through Congress as we speak, we will upgrade our subjective odds from 35% to something closer to our quantitative model (and the market consensus). While Trump is less negative for the dollar than Biden, the dollar may fall anyway, at least beyond any near-term bounce. First, monetary policy is ultra-dovish. As we go to press, Fed Chairman Jerome Powell has given a sneak preview of the Fed’s strategic review of monetary policy at the Kansas City Fed’s annual Jackson Hole summit (this time hosted in cyberspace instead of Wyoming). Powell met expectations that the Fed will adopt average inflation targeting. Inflation will be allowed to overshoot the 2% inflation target to compensate for periods of undershooting. Maximum employment will be the goal rather than an attempt to prevent excessive deviation from the Fed’s estimates of neutral unemployment. This means US growth and inflation will push real rates lower and weaken the dollar. Moreover, as mentioned, Trump’s big spending would eventually drive investors away from the dollar, especially in the context of global economic recovery. Trump, like Biden, would refuse to impose fiscal austerity amid high unemployment. The one area where he would be able to compromise with House Democrats would be spending bills, as in his first term. The US budget deficit and trade deficit would remain very large, showering the world with dollar liquidity. Risk-on currencies will attract buyers in a new global business cycle. Republicans and Democrats have released their policy platforms following their national conventions. We will revisit these platforms in detail in a future report. The Democratic platform is the one that matters most because the Democrats are more likely to win full control of Congress and thus be capable of enacting their preferred policies. Their platform is reflationary, but in seeking to rebalance the economy to reduce financial and social disparities through more progressive tax policy it would offset some of the fiscal spending. Biden would also moderate foreign policy and trade policy, launching a new dialogue with China to manage tensions. The dollar would fall faster in this environment. Bottom Line: President Trump is staging a comeback in the election campaign. If the comeback receives a boost from fiscal stimulus, Trump could pull off a Harry Truman-style surprise victory. This would precipitate a bounce in the US dollar in the near term. Over the medium term, the dollar should continue falling due to US debt monetization and global recovery. The Trump-Xi Gentleman’s Agreement Has Two Months Left Financial markets have largely ignored US-China strategic tensions this year because the two countries are puffing themselves up with monetary and fiscal stimulus. Going forward, either the stimulus will falter, or the US-China conflict will escalate to the point of triggering a negative surprise for markets. Chart 4US-China: Embracing While Struggling
US-China: Embracing While Struggling
US-China: Embracing While Struggling
China is unlikely to pull back on stimulus measures. It cannot do so when unemployment has spiked and the economy is experiencing the weakest growth in over 40 years. Authorities said as much during the annual July Politburo meeting on the economy (a meeting that has often marked turning points in policy), when they pledged to maintain accommodative policy and to speed up local government issuance of special bonds. Money supply is growing briskly. The market is validating the signal from China’s easy monetary policies and robust credit expansion. Our China Play Index – which consists of the Australian dollar, iron ore prices, Brazilian equities, and Swedish equities – continues to rally smartly, breaking above its 2019 peaks (Chart 4, top panel). The risk to this view is that the People’s Bank of China may not provide additional monetary easing in the near term, as the Politburo signaled that monetary policy would be more flexible and targeted in the second half of the year. The three-month Shanghai interbank rate has been rising since April. Politically, Chinese authorities would benefit from releasing negative news or statements that would undermine President Trump’s reelection campaign. However, Beijing would not make consequential moves merely to spite Trump. Its primary interest lies in its own stability. Credit growth will continue growing at its current clip through most of the rest of the year and fiscal spending will expand, particularly to support infrastructure projects. The US Congress is also likely to add more stimulus before the election, as noted above. Thus with both countries stimulating, the risk is that they escalate their strategic confrontation to the point that it causes a negative surprise in financial markets. Will this occur? The US-China relationship in 2020 has been characterized by (1) a gentleman’s agreement to adhere to the Phase One trade deal, which was reaffirmed by top negotiators this week; (2) an aggressive pursuit of national interest in every other policy area. Beijing accelerated its power grab in Hong Kong; the US accelerated up its ban on Chinese tech. Chinese imports of US commodities are naturally much weaker than projected due to economic reality but neither side has an interest in exiting the deal. The renminbi continues to appreciate against the dollar on the back of Chinese and global recovery (Chart 4, second and third panels). Nevertheless a new burst of stimulus will lower the hurdle to President Trump taking additional punitive measures against China. The administration could have paused after its major decision to finalize its ban on business with Huawei and other tech firms, which ostensibly even extends to foreign firms that use US-designed parts in sales to China. It did not. Trump is maintaining the pressure with new sanctions over China’s militarization of the South China Sea. Washington is also likely to kick Chinese companies off US stock exchanges if they fail to meet transparency and accounting standards. Trump is not only burnishing his “tough on China” credentials against Democratic candidate Joe Biden – the US’s recent measures are unlikely to be repealed under either president in the coming years. Chart 5China Faces Internal And External Political Pressures
China Faces Internal And External Political Pressures
China Faces Internal And External Political Pressures
Therefore stimulus will enable US actions and Chinese reactions that will eventually trigger a pullback in financial markets. Chinese tech equities are reflecting this headwind. Equities ex-tech are likely to outperform (Chart 5, top panel). A Biden victory does not prevent Trump from taking punitive measures against China on his way out of office, to solidify his legacy as the Man Who Confronted China, so Chinese tech will remain at risk. Biden would be more favorable for emerging market equities because his administration would speed the dollar’s decline. A change of government in the US would temporarily disrupt the US’s overall policy assault against China. Biden’s foreign and trade policies would be more predictable and orthodox than Trump’s. Over a twelve month period, after a shot across the bow to warn that he is not a lightweight, Biden would probably attempt a diplomatic reset with China – a new round of engagement and dialogue that would support the Chinese equity rally. Eventually this reset would fail, however, and Biden would all the while be working up a coalition of democracies to pressure China to change its behavior – not only on trade but also on unions, carbon emissions, and human rights. Externally focused Chinese companies will remain exposed to the harmful secular trend of US-China power struggle regardless of the US election outcome. Coming out of the secretive leaders’ conclave at the Beidaihe resort in August, it is clear once again that Chinese domestic politics is not conducive to smooth US-China relations. Chinese political risk remains underrated. Our GeoRisk indicator is gradually picking up on this trend, and so are other quantitative political risk indicators such as that provided by GeoQuant (Chart 5, second panel). President Xi Jinping has been dubbed the “Chairman of Everything” due to his tendency to promote a neo-Maoist personality cult and thus shift Chinese governance from consensus-rule to personal rule. He is once again reportedly considering taking on the title of “Chairman” of the Communist Party, a position that only Mao Zedong has held.1 More importantly he is re-energizing his domestic anti-corruption campaign, i.e. political purge, this time against law enforcement. Xi had already seized control of China’s domestic security forces but controlling the police is even more critical in a period of high unemployment, slow growth, and social unrest (Chart 5, third panel). Xi’s attempt to re-consolidate power ahead of the Communist Party centennial in 2021 and especially the twentieth national party congress in 2022 is already under way. China’s domestic and international political environment is a risk for the renminbi, which we noted is rallying forcefully on the global rebound. We will not join this rally until the US election is decided at minimum. With the US posing a long-term threat, Beijing is speeding up its attempts to diversify away from the US dollar, both in trade settlements and foreign exchange reserves. Reliance on the dollar leaves Chinese banks and companies vulnerable to US financial sanctions, which have harmed US rivals like Russia and Iran. Over the long run there is a lot of upside for the yuan given its very low level of global penetration (about 2% of both SWIFT transactions and global foreign exchange reserves) and yet China’s very high share of global trade (about 15%). Cross-border settlements in RMB are recovering gradually after the steep drop-off following 2016. Beijing is also allowing foreign investors greater access to onshore financial markets where they will hold more and more RMB-denominated assets. However, the yuan will not become a reserve currency anytime soon given China’s state-controlled economy and closed capital account. We favor the euro, yen, and other G7 currencies as alternatives to the dollar. Hong Kong equities have suffered from the combination of Xi Jinping’s centralization of power and the US-China strategic conflict. The above analysis suggests that while they may get a temporary reprieve, the secular outlook is uninspiring. However, the Hong Kong monetary authorities are capable of managing the dollar peg. They have been able to manage dollar strength over the past decade, including the COVID-19 dollar run-up, and foreign exchange reserves are more than ample. By contrast, a sharp drop in the dollar can be handled even more easily by printing additional HKD. Eventually shifting to a trade basket, or a renminbi peg, is to be expected. The US election may support the Chinese equity rally if Biden wins, but tech equities should continue to underperform the rest of the bourse due to US grand strategy. Bottom Line: We prefer to play China’s growth recovery via outside countries that export into China, such as Sweden, Australia, and Brazil. The US election may support the Chinese equity rally if Biden wins, but tech equities should continue to underperform the rest of the bourse due to US grand strategy which will remain focused on constraining China’s tech ambitions. North Korea Is Not A Red Herring – But Taiwan Is Entirely Underrated The Taiwan Strait remains the chief geopolitical risk. Xi Jinping’s reassertion of Beijing’s supremacy within China’s sphere of influence has led to a backlash in Taiwanese politics and a confrontational posture across the Strait that is being expressed in saber-rattling and low-level economic sanctions that could easily escalate. Chart 6Taiwan Remains #1 Geopolitical Risk
Taiwan Remains #1 Geopolitical Risk
Taiwan Remains #1 Geopolitical Risk
Military exercises and jingoistic rhetoric are also heating up, not only directly relating to Taiwan but also in the neighboring South China Sea, which is critical to national security for all geopolitical actors in Northeast Asia. On August 26 Beijing testing two anti-ship ballistic missiles known as “aircraft carrier killers” in the South China Sea (the DF-21D and the DF-26B). We have long argued that the lack of clarity over whether the US would uphold its defense obligations to Taiwan makes the situation ripe for misunderstandings. The US Naval Institute has recently confirmed the validity of fears about a full-scale conflict in the near term.2 Neither Beijing nor Taipei nor Washington has crossed a red line. But China’s imposition of legislative dependency on Hong Kong highlights the incompatibility of the Communist Party’s governing model with western liberalism. The “one country, two systems” formulation has become unacceptable to the Taiwanese people, who want to preserve their autonomy indefinitely. The US ban on doing business with Huawei extends to foreign companies that use US parts or designs, squeezing Taiwanese companies (Chart 6, top panel). War is possible, but our base case still holds that the mainland will first use economic means. In particular it will impose economic sanctions, either precipitating or in response to a Fourth Taiwan Strait Crisis. The market continues to underrate the enormous risk to the Taiwanese dollar, as captured by the low level of our risk indicators (Chart 6, second panel). We continue to recommend shorting Taiwan relative to emerging markets. Taiwan is a short relative to South Korea, in particular, which stands to benefit from any negative turn of events in cross-strait relations. Korean equities are finally perking up, though the US tech war with China is weighing on the South Korean tech sector (Chart 7, top panel). We see this as a geopolitical opportunity given that both China and the US will need South Korean companies as they divorce each other. Korean political risk, however, may also be shifting from adequately priced to underrated. The risk premium has trended upward since President Trump’s diplomatic overture to leader Kim Jong Un stopped making progress (Chart 7, second and third panels). We have largely dismissed concerns about North Korea since the reduction of tensions in late 2017 due to our assessment that diplomacy would remain on track throughout Trump’s first term. This has proved to be the case, but it is still possible that North Korea could prove globally relevant before the US election. Chart 7North Korea A Non-Negligible Risk
North Korea A Non-Negligible Risk
North Korea A Non-Negligible Risk
The reason stems from rumors of Kim Jong Un’s health problems earlier this year. We noted at the time that it was suspicious that preparations for Kim’s sister, Kim Yo Jong, to take on greater responsibilities within the Politburo of the Worker’s Party seemed to predate reports of Kim Jong Un’s illness. For the North Korean state to continue to promote her implies that something may indeed be amiss. In fact, she has missed two Politburo meetings after her aggressive public relations campaign against South Korea was called off this summer. It is possible she got too much attention as the Number Two person in the regime. The South Korean National Intelligence Service is debating her status with the Defense Ministry and Unification Ministry. What is clear is that Kim Jong Un is preparing a new five-year economic plan, to be launched in January 2021, and that he is eager to share any blame for disastrous internal conditions in the country amid the global pandemic and recession. The market is typically correct not to hyperventilate over North Korean risks, but after 2016 North Korea is no longer a “red herring.” First, any domestic power struggle would occur at an immensely inconvenient time given the breakdown in US-China trust. Second, as the North manages any internal problems through its opaque and untested political process, it could be pressed into making a show of force that would either embarrass and antagonize President Trump, or provoke a forceful response from a future President Biden, given that North Korea in theory has the raw capability to deliver a crude nuclear weapon to the continental United States. If any US president makes a show of force, it will antagonize China and could lead to a major standoff. This would upset the markets at least temporarily. We are long Korean equities and would also look favorably on Korean tech. A geopolitical risk premium could temporarily undercut these stocks if North Korean diplomacy fails around the US election. But the risk is globally relevant only if Pyongyang somehow sparks a standoff between the US and China. Otherwise a major Korean peninsula crisis is far less of a concern than that of a crisis in the Taiwan Strait. Matt Gertken Vice President Geopolitical Strategy mattg@bcaresearch.com Footnotes 1Financial Times. 2 See Admiral James A. Winnefeld and Michael J. Morell, "The War That Never Was?" US Naval Institute Proceedings 146: 8 (August 2020), usni.org. Section II: GeoRisk Indicator China
China: GeoRisk Indicator
China: GeoRisk Indicator
Russia
Russia: GeoRisk Indicator
Russia: GeoRisk Indicator
UK
UK: GeoRisk Indicator
UK: GeoRisk Indicator
Germany
Germany: GeoRisk Indicator
Germany: GeoRisk Indicator
France
France: GeoRisk Indicator
France: GeoRisk Indicator
Italy
Italy: GeoRisk Indicator
Italy: GeoRisk Indicator
Canada
Canada: GeoRisk Indicator
Canada: GeoRisk Indicator
Spain
Spain: GeoRisk Indicator
Spain: GeoRisk Indicator
Taiwan
Taiwan: GeoRisk Indicator
Taiwan: GeoRisk Indicator
Korea
Korea: GeoRisk Indicator
Korea: GeoRisk Indicator
Turkey
Turkey: GeoRisk Indicator
Turkey: GeoRisk Indicator
Brazil
Brazil: GeoRisk Indicator
Brazil: GeoRisk Indicator
Section III: Geopolitical Calendar
Highlights Historically, soft-budget constraints have typically been followed by periods of poor equity market performance. Soft-budget constraints could produce two distinct economic scenarios: malinvestment or inflation. Both are negative for equity investors. Odds are that the US will continue to pursue easy money policies, sowing the seeds of US equity underperformance in the years ahead. In contrast to the US, EM (ex-China, Korea and Taiwan) are presently facing hard-budget constraints, which will weigh on their growth in the near term. However, forced restructuring could boost efficiency and productivity leading to their equity and currency outperformance in the coming years. Unlike other developing economies, China is not currently facing hard-budget constraints. However, the structural overhang from the past 10 years of soft-budget constraints is lingering on and in some cases is increasing. The Thesis The consensus in the investment industry is that cheap money and ample stimulus are good for share prices. We do not disagree with this thesis when it is applied to the near and medium-term equity strategy. However, excessive stimulus and easy money policies — we refer to these as soft-budget constraints — bode ill for share prices in the long run. The investment relevance of this thesis is as follows. Since March, the US has implemented the largest fiscal and central bank stimulus in the world and will likely continue doing so in the coming years (Chart I-1). Such soft-budget constraints will likely support the US economy for now. Nevertheless, they will also sow seeds of future US equity underperformance and currency depreciation. Conversely, many emerging economies (excluding China) have failed to provide sufficient fiscal and credit support to their economies (Chart I-2). The resulting hard-budget constraints will foreshadow their economic underperformance vis-à-vis the US in the coming months. Chart I-1Soft-Budget Policies Will Likely Become Structural In The US
Soft-Budget Policies Will Likely Become Structural In The US
Soft-Budget Policies Will Likely Become Structural In The US
Chart I-2EM Ex-China, Korea And Taiwan Are Facing Hard-Budget Constraints
EM Ex-China, Korea And Taiwan Are Facing Hard-Budget Constraints
EM Ex-China, Korea And Taiwan Are Facing Hard-Budget Constraints
That said, hard-budget constraints will force companies in these EM economies into deleveraging, restructuring and improving efficiency. Ultimately, such hard-budget constraints will benefit EM shareholders in the long run. This thesis has been a key rationale behind our decision to close the short EM / long S&P 500 strategy on July 30, and to turn negative on the US dollar on July 9. In the months ahead, we will be looking for an opportunity to upgrade EM equities to overweight versus the S&P500. BOX 1 Gauging Budget Constraints In our opinion, the best way to gauge budget constraints for the real economy is by monitoring changes in the money supply. This is due to the following reasons: First, net changes in the money supply account for all net loan origination. Second, the money supply also reflects the monetization of public and private debt by the central bank and commercial banks. When a central bank and commercial banks acquire a security from or lend to a non-bank entity, they create new money “out of thin air”. No one needs to save for the central bank and commercial banks to lend to or purchase a security from a non-bank. In short, savings versus spending decisions by economic agents (non-banks) do not change the stock of money supply. We have deliberated on these topics at length in past reports. Securities transactions among non-banks do not create new or destroy existing deposits, i.e., they have no impact on the money supply. Rather, these constitute an exchange of securities and existing deposits between sellers and buyers. Provided these types of transactions do not expand the money supply, they do not, according to our framework, alter budget constraints. Finally, the broad money supply, not central bank assets, is the ultimate liquidity available to economic agents to purchase goods and services as well as invest in both real and financial assets. Commercial banks’ excess reserves at the central bank – a large item on the central bank balance sheet - do not constitute a part of the broad money supply. Empirical Evidence The following are examples of soft-budget constraints that were followed by periods of weakening productivity growth, diminishing return on capital and poor equity market performance: 1. China’s soft budget constraints in 2009-10 Due to the post-Lehman crisis stimulus, the change in broad money exploded above 40% of GDP (Chart I-3, top panel). The economy boomed from early 2009 until early 2011 as cheap and abundant money super-charged investment and consumption. Chart I-3China: Easy Money Presaged Falling Return On Assets And Equity Underperformance
China: Easy Money Presaged Falling Return On Assets And Equity Underperformance
China: Easy Money Presaged Falling Return On Assets And Equity Underperformance
However, Chinese share prices — the MSCI China Investable equity index excluding technology, media and telecom (TMT) — peaked in H1 2011 in absolute terms (Chart I-3, second panel). Relative to the global equity index excluding TMT, the Chinese investable stocks index began underperforming in late 2010 (Chart I-3, third panel). The basis for this equity underperformance was falling return on assets for non-financial companies due to capital misallocation, breeding inefficiencies and diminishing productivity gains (Chart I-3, bottom two panels). In China, the excessive stimulus of 2009 and 2010 and ensuing recurring rounds of soft-budget constraints put a floor under the economy but have destroyed shareholder value. 2. Money overflow in EM ex-China in 2009-10. China’s boom in 2009-10 produced a bonanza for other emerging economies. Not only Chinese imports from developing economies boosted the latter’s balance of payments and income but also international investors rushed into EM equity and fixed income. EM companies and banks took advantage of easy financing and their international borrowing skyrocketed. Finally, EM policy makers stimulated and domestic bank credit boomed. This period of soft-budget constraints led to complacency, lower productivity, falling return on capital and/or inflation in the following years (Chart I-4). Their financial markets performance in the 10 years that followed the soft-budget constraints in 2009-10 has been dismal. The share price index of EM ex-China, Korea and Taiwan as well as the total return on their currencies (including the carry) versus the US dollar have been in a bear market (Chart I-4, bottom two panels). 3. The credit and equity bubbles in Japan, Korea and Taiwan of the late 1980s Money and credit bubbles proliferated in Japan, Korea and Taiwan in the late 1980s (Chart I-5, Chart I-6 and Chart I-7). Chart I-4EM Ex-China, Korea And Taiwan: Easy Money In 2009-10 Sowed Seeds Of Bear Market
EM Ex-China, Korea And Taiwan: Easy Money In 2009-10 Sowed Seeds Of Bear Market
EM Ex-China, Korea And Taiwan: Easy Money In 2009-10 Sowed Seeds Of Bear Market
Chart I-5Japan: Easy Money Produced Equity Bubble And Lower Productivity Growth
Japan: Easy Money Produced Equity Bubble And Lower Productivity Growth
Japan: Easy Money Produced Equity Bubble And Lower Productivity Growth
Chart I-6Korea: Easy Money Produced Equity Bubble And Lower Productivity Growth
Korea: Easy Money Produced Equity Bubble And Lower Productivity Growth
Korea: Easy Money Produced Equity Bubble And Lower Productivity Growth
Chart I-7Taiwan: Easy Money Produced Equity Bubble And Lower Productivity Growth
Taiwan: Easy Money Produced Equity Bubble And Lower Productivity Growth
Taiwan: Easy Money Produced Equity Bubble And Lower Productivity Growth
Their productivity growth rolled over in the late 1980s amid easy money policies. Share prices deflated in Japan, Korea and Taiwan in the 1990s (please refer to the middle and bottom panels of Charts I-5, I-6 and I-7). Chart I-8ASEAN In 1990s: Soft-Budget Constraints Heralded Productivity Demise
ASEAN In 1990s: Soft-Budget Constraints Heralded Productivity Demise
ASEAN In 1990s: Soft-Budget Constraints Heralded Productivity Demise
4. The boom-bust cycle in emerging Asia ex-China in the 1990s Soft-budget constraints prevailed in many emerging Asian economies in the first half of the 1990s. Foreign money inflows and domestic bank credit produced an economic boom. The consequences of such soft-budget constraints were debt-financed malinvestment, falling return on assets and massive current account deficits (Chart I-8). All of these culminated in epic currency and banking crises. 5. The credit bubbles in the US and Europe leading to the 2008 crash Lax credit standards propelled credit and property booms in the US and Southern Europe in the period of 2002-2007. Broad money ballooned in the euro area and swelled in the US (please refer to Chart I-1 on page 2). These property bubbles unraveled in 2007-08. These are well known, and we will not delve into the details. Soft-Budget Constraints Lead To Malinvestment Or Inflation Soft-budget constraints could produce two distinctive economic scenarios – malinvestment or inflation. Both are negative for equity investors. The malinvestment scenario occurs when easy money propels undisciplined capital spending. Easy and abundant money boosts medium-term growth and, thereby, creates the illusion of an economic miracle. The latter renders companies, creditors, investors and government officials complacent. Creditors lend a lot and do so based on optimistic assumptions while companies expand hastily and invest carelessly. The result is capital misallocation, i.e., companies pour money into projects that do not ultimately produce sufficient cash flow. Equity investors project high growth expectations into the future and bid up share prices. Government officials preside over an unsustainable growth trajectory overlooking lurking systemic risks and deteriorating economic fundamentals. Easy money and unlimited financing typically bode ill for efficiency and productivity— this is simply due to human nature. Companies neglect efficiency considerations and, as a result, productivity stagnates. Consequently, cost overruns and unprofitable investments suffocate corporate profits. Declining corporate earnings at a time of expanded capital base culminate in a collapse of return on capital. This is the crucial reason why share prices drop. As profits and return on capital decline, companies retrench by cutting costs and halting investment spending. Defaults mushroom, leading creditors to cut new financing. The inflation scenario transpires when easy money boosts consumption more than investment. Easy money and unlimited financing lift household income and consumption. This can arise from a large fiscal stimulus or private sector's borrowing and spending. On the one hand, robust household income growth inevitably leads to higher wage growth expectations. On the other hand, limited investment brings about productivity stagnation. Mounting wages and languishing productivity growth lead to rising unit labor costs and, ultimately, result in a corporate profit margin squeeze. Faced with corporate profit margin shrinkage, companies either raise prices, i.e., pass through higher costs, or retrench by shedding labor and shrinking capital spending even further. The latter produces a widespread economic downturn, and stifles business profits and share prices. A symptom of higher inflation is a wider current account deficit. With an economy’s productive capacity lagging behind demand, the gap between the two can be filled in by imports. In addition, escalating domestic costs make a country less competitive, which inhibits exports and bloats imports. When a central bank is unwilling to tighten monetary policy meaningfully amid high and rising inflation and/or a widening current account deficit, it falls behind the inflation curve. This constitutes a very bearish backdrop for the exchange rate. Currency depreciation erodes the country’s equity returns in common currency terms versus other bourses. Can an economy with soft-budget constraints, i.e., booming money growth, avoid both malinvestment and inflation? Yes, it can if it is able to boost productivity growth so that it avoids systemic capital misallocation (i.e., investments produce reasonable returns to pay off to creditors and shareholders) and escapes higher inflation by expanding output faster to meet growing demand. However, achieving higher productivity growth amid soft-budget constraints is easier said than done. Bottom Line: The scenario of malinvestment has been playing out in China since 2009. Capital misallocation also occurred in the US and parts of Europe during the 2002-2007 credit boom, and took place in Japan, Korea and Taiwan in the late 1980s. Malinvestment, with some elements of inflation, occurred in emerging Asian countries prior the 1997-98 crises as well as in many EM economies like India, Indonesia and Brazil in 2009-2012. Investment Implications It is fair to say that the unprecedented economic downturn in the US warranted an exceptionally large stimulus. The question for the next several months and years is whether US authorities will: overstay easy policies and make soft-budget constraints a permanent feature of the US economy, or tighten policy earlier than warranted, or navigate policy perfectly so that the economy is neither too hot nor too cold. Our sense is that US authorities will overstay their easy money policies. If the US continues to pursue macro policies in the form of soft-budget constraints, will the nation experience malinvestment or inflation? Our sense is that the US will likely experience asset bubbles and inflation. As the Federal Reserve stays behind the inflation curve in the coming years, the US dollar will be in a multi-year downtrend. Hence, the strategy should be selling the greenback into rebounds. We switched our short positions in select EM currencies— such as BRL, CLP, ZAR, TRY, KRW, IDR and PHP —away from the US dollar to an equal-weighted basket of the euro, CHF and JPY on July 9. For now, EM currencies will lag DM currencies. US equity outperformance versus the rest of the world is in the late innings (Chart I-9). The pillars of US equity underperformance in common currency terms will be excessive US equity valuations, a potential new era of US return on capital underperforming the rest of the world and greenback depreciation. Chart I-9US Equity Outperformance Is In Very Late Stages
US Equity Outperformance Is In Very Late Stages
US Equity Outperformance Is In Very Late Stages
The top panel of Chart I-10 illustrates that the difference between US investors owning international stocks and non-US investors holdings of US equities is at a record low. This reveals that both US and foreign investors currently "over-own" US stocks versus non-US equities. Perfect timing of a structural trend reversal is impossible, but we believe US equity outperformance will discontinue before year-end. That was the rationale behind terminating our short EM / long S&P 500 strategy and upgrading EM equity allocation from underweight to neutral. In contrast to the US, EM (ex-China, Korea and Taiwan) are presently facing hard-budget constraints which will weigh on their economic performance in the near term. This is why we are not rushing to upgrade EM stocks and currencies to overweight. However, the lack of cheap money will force these EM countries and their companies to do the right things: deleverage households and companies, clean up and recapitalize their banking systems and undertake corporate restructuring. Ultimately, hard-budget constraints will likely sow the seeds of high productivity and, with it, equity and currency outperformance in the years to come. China is a tricky case. On a positive note, it has not stimulated as much during the pandemic as it did in 2009. Besides, policymakers are now aware of the ills that come with soft-budget constraints and have been working hard to address these. Critically, the Chinese population, businesses and the authorities are all united in the nation’s confrontation with the US. Complacency in this context is not a major risk and the focus on efficiency and productivity will be razor sharp. On the negative side, the credit, money and property bubbles that had not been dealt with before the pandemic are now increasing with the stimulus. Continued malinvestment and falling return on capital in China’s old economy sectors is signified by the very poor performance of China’s cyclical “old economy” stocks (Chart I-11, top panel). In turn, bank share prices are making new cyclical lows underscoring their worsening structural outlook (Chart I-11, bottom panel). Chart I-10Global Equity Investors Over-Own US Stocks Versus International Ones
Global Equity Investors Over-Own US Stocks Versus International Ones
Global Equity Investors Over-Own US Stocks Versus International Ones
Chart I-11Chinese Equities: "Old Economy" Cyclicals And Banks Are Dismayed By Structural Malaises
Chinese Equities: "Old Economy" Cyclicals And Banks Are Dismayed By Structural Malaises
Chinese Equities: "Old Economy" Cyclicals And Banks Are Dismayed By Structural Malaises
Weighing the pros and cons, we infer that the cyclical recovery in China has further to run. This will support China’s growth and equity outperformance for now. That is why we continue to recommend overweighting China within an EM equity portfolio. However, as the credit and fiscal impulses fade starting in H1 next year, structural malaises will resurface posing risks to China’s equity outperformance. Arthur Budaghyan Chief Emerging Markets Strategist arthurb@bcaresearch.com Footnotes Equities Recommendations Currencies, Credit And Fixed-Income Recommendations
Dear clients, China Investment Strategy will take a summer break next week. We will resume our publication on September 9th. Best regards, Jing Sima, China Strategist Highlights The threat of US sanctions has sparked fears of disconnecting Chinese financial institutions from US dollar access, driving urgency to accelerate the RMB internationalization process. China’s RMB internationalization process suffered from a sizable setback in 2016, but the trend has reversed in 2018. Since then China has shifted the strategy to broaden and enhance the RMB’s market demand and functions, as well as to establish systems to facilitate the strategy. In the foreseeable future, the RMB’s role in the global economy is far from challenging the US dollar as the world's dominant reserve currency; China's near-term goal to promote the use of the RMB beyond its borders is to minimize disruptions to China’s trade and investment activities threatened by US financial sanctions. Feature Since 2018 and in the wake of intensifying confrontations between the US and China, the Chinese government has shifted its strategy in promoting the internationalization of the RMB. Authorities have moved from a symbolic international recognition of the RMB to a more pragmatic approach of creating real market demand for the currency. Chart 1China Has Been Shedding USD Assets
China Has Been Shedding USD Assets
China Has Been Shedding USD Assets
It is not our baseline view that the US will take extreme measures and entirely cut off Chinese banks’ access to the US Clearing House Interbank Payments System (CHIPS) and the Society for Worldwide Interbank Financial Telecommunication (SWIFT). However, Beijing’s decoupling from the US dollar (USD) has been in process, diversifying its forex reserves away from the US dollar (USD) and increasing the use of the RMB in cross-border trade and investment (Chart 1). In the foreseeable future, it is neither possible nor is Chinese policymakers’ intention for the RMB to challenge the USD as the world's dominant reserve currency. Rather, we think that under the threat of US sanctions, the near-term goal is to minimize disruptions to China’s trade and investment activities. At the same time, the approach will make China “too big, too connected to fail” in the medium-to-long run and, therefore, minimize the potential for future threats of financial sanctions. China’s new approach to internationalize the RMB involves enhancing the currency’s three functions in the global market, and establishing and strengthening domestic systems to facilitate the enhancements: The RMB as an international settlement currency; The RMB as a commodity pricing currency; and The RMB as an international reserve currency. Most of these strategies still have a long way to go before having significant global market implications. However, these developments bear structural importance and investors should closely monitor them. RMB - An International Settlement Currency Chart 2Cross-Border RMB Settlement Is Picking Up
Cross-Border RMB Settlement Is Picking Up
Cross-Border RMB Settlement Is Picking Up
The RMB’s role in cross-border trade settlement suffered a major setback in 2016 when investor confidence plummeted following a rapid devaluation in China’s currency and equities. The trend has reversed since 2018, partially due to the vigorous promotion of China’s domestic cross-border interbank settlement system (CIPS) (Chart 2). China established CIPS in 2015 after the US proposed to disconnect Russia from the SWIFT payment system.1 As of July 2020, the CIPS system had a total of 33 direct participants and 951 indirect participants, a 35% increase from 2018 with more than half of the participants outside China.2 According to the recently released PBoC RMB internationalization report, the CIPS system processed a total of 34 trillion yuan worth of cross-border RMB transactions in 2019, a 28% improvement from 2018 (Chart 3). Chart 3CIPS Has Been Steadily Expanding
The RMB Internationalization Scorecard
The RMB Internationalization Scorecard
Nevertheless, the RMB’s share of international payments remains far behind the USD, euro and yen, and the RMB's role in cross-border settlement is well below its 2016 peak (Chart 4A and 4B). The dollar's dominant status is not only supported by the US’ strong and open economy, but also by its deep, liquid and highly efficient financial markets, which are impossible for any currencies or payment systems to replicate in the near future. However, establishing domestic financial payment and information exchange systems will likely be a main countermeasure countries will rush to take, if the US launches sanctions to cut off large economies like Russia and China from the USD and/or global financial system. Chart 4AThe RMB’s Share Of International Payments Has Been Disproportional Compared To Its Share In Global Trade…
The RMB Internationalization Scorecard
The RMB Internationalization Scorecard
Chart 4B...And Well Below Its 2016 Peak
...And Well Below Its 2016 Peak
...And Well Below Its 2016 Peak
Chart 5Russia Has Largely Replaced USD Treasury Holdings With Gold
Russia Has Largely Replaced USD Treasury Holdings With Gold
Russia Has Largely Replaced USD Treasury Holdings With Gold
Russia is by far the largest and most globally integrated country that came close to being cut off from SWIFT, and Beijing has clearly learned from Russia’s experience and countermeasure strategies. The proposal to disconnect Russia from SWIFT following the 2014 Crimea crisis never materialized, but in light of the threats and US financial sanctions, Russia established the SPFS, a domestic financial information exchange system to facilitate bank payments. The SPFS is far from the complete emancipation of SWIFT and payments through the SPFS are mostly intra-Russian settlements. However, this active counter-sanction measure, coupled with the Russian central bank’s aggressive reduction of USD-denominated assets in its forex reserves, seems to have achieved positive results (Chart 5). Three years after the establishment of SPFS, the US and Europe no longer target Russian bank payment functions in their further financial sanctions against Russia.3 In response to a US threat to impose economic sanctions against companies and banks dealing with Iran, Europe created a special financial settlement platform called Instrument in Support of Trade Exchanges (INSTEX) in 2019. Although none of the alternative systems can challenge the role of the US CHIPS or SWIFT systems, the trend of establishing and accelerating alternatives will incrementally diminish the effectiveness of such harsh financial actions by the US. RMB - An International Commodity Pricing Currency Table 1China Dominates Global Demand For Many Commodities
The RMB Internationalization Scorecard
The RMB Internationalization Scorecard
We believe that the most important breakthrough in the RMB internationalization process in the past five years has been the strategic shift to promote the RMB’s pricing function. China is the largest trading partner of a growing number of countries with tightly linked supply chains. This generates a natural demand for RMB settlement in bilateral trade. More importantly, China’s dominance in global demand for bulk commodities gives the country an advantage in pricing power (Table 1). In March 2018, China established a RMB-denominated crude oil futures market in Shanghai, which has grown into the third-largest oil exchange market after WTI and Brent. Its cumulative turnover in two years reached nearly 30 trillion yuan with overseas customers in 19 countries and regions.4 Given the success of the Shanghai crude oil futures market, the Chinese government has been vigorously promoting the expansion of the RMB pricing function from crude oil to natural gas, iron ore, soybeans, corn and other bulk commodities. Going forward, we expect the RMB internationalization process to continue to develop through pricing and trading bulk commodities in Chinese currency. This will lead to a higher correlation between the RMB and the currencies of some of China's Asian neighbors and commodity trade partners, and thus expand and strengthen the "RMB currency bloc" (Chart 6A and 6B). Chart 6AThe RMB Currency Bloc May Expand From Manufacturing Ecosystem...
The RMB Currency Bloc May Expand From Manufacturing Ecosystem...
The RMB Currency Bloc May Expand From Manufacturing Ecosystem...
Chart 6B...To Commodity Supply Chain
...To Commodity Supply Chain
...To Commodity Supply Chain
RMB - An International Reserve Currency The role of the RMB among official reserve managers, although still dismal compared to the USD and Euro, has accelerated since 2018. Its global share has doubled from Q4 2016 when the IMF began to include holdings of RMB in its currency composition of official foreign exchange reserves (COFER) (Chart 7). Shares of the USD- and Euro-denominated reserves have remained unchanged or declined during the same period. Among private investors, foreign investment in RMB-denominated assets has been the main source of China’s financial account surplus (Chart 8). China has hastened the opening of its onshore financial market to foreign institutional investors. In the past two years, major global stock and bond indexers –including MSCI, the S&P Dow Jones Indices, the FTSE Russell, and the Bloomberg Barclays Global Aggregate Index – have added A-shares and onshore bonds to their flagship benchmarks. This means that foreign institutional investors have significantly boosted their allocation of RMB-denominated stocks and bonds (Chart 8, bottom panel). Financial assets, such as domestic RMB stocks, bonds, and loans and deposits held by foreign entities, climbed by 26.7% in 2019 over 2018. At the same time, China's domestic financial markets have gradually liberalized and even removed investment quotas for overseas institutional investors. Foreign investors currently account for 5.5% and 2.6% of the market value in Chinese equities and bonds, up from 3% and 2% in 2018, respectively. Chart 7The RMB Share In Global Reserves Remains Dismal, But Has Nearly Doubled Since 2016
The RMB Internationalization Scorecard
The RMB Internationalization Scorecard
Chart 8China Has Been Rapidly Expanding The Scope Of Foreign Participants In Its Onshore Financial Markets
China Has Been Rapidly Expanding The Scope Of Foreign Participants In Its Onshore Financial Markets
China Has Been Rapidly Expanding The Scope Of Foreign Participants In Its Onshore Financial Markets
Bottom Line: The internationalization of the RMB will likely continue to accelerate in the face of decoupling from the US. It is a long process, but China will take advantage of its dominance in global demand to foster the RMB's role in both pricing and settlement in cross-border commodity trade. At the same time, China is rapidly expanding the scope of foreign participants in the country's onshore financial markets, by allowing more foreign banks and financial institutions to enter the market, and broadening the channels for the RMB’s international circulation. Jing Sima China Strategist jings@bcaresearch.com Footnotes 1SWIFT is a system that provides information on international payments and calculations. The system unites more than 11,000 banking and financial institutions in 210 countries and the bank card payment function supported by the SWIFT system reflects a country's financial security. 2China Cross-Border Interbank Payment System release, July 31st, 2020. 3Xu Wenhong, The SWIFT System: A Focus on the U.S.–Russia Financial Confrontation, Russian International Affairs Council, February 3, 2020. 4Based on data from Shanghai International Energy Exchange. Cyclical Investment Stance Equity Sector Recommendations