Geopolitics

Highlights OPEC 2.0 agreed to cut output by another 500k b/d at its Vienna meeting last week, bringing the total official cuts by the producer coalition to 1.7mm b/d. Saudi Arabia added 400k b/d of additional voluntary cuts, bringing its total cuts to almost 900k b/d vs. its October 2018 production level. We think the market will tighten, as a result, and are getting long 2H20 Brent vs. short 2H21 Brent; this is the backwardation trade that worked well this year, producing an average return of 180%. There was no extension of OPEC 2.0 output cuts beyond end-March, although an extraordinary meeting of the coalition was scheduled for March 5, 2020. Anti-government civil unrest in Iraq and Iran has resulted in the killing of hundreds of protesters in both countries by state security forces. The unrest raises the threat of disruptions to oil supplies from Iraq and to ships transiting the Strait of Hormuz. Clashes between pro-Iranian protesters and Iraqi nationalists in Baghdad prompted a visit to the city by Iran’s top military commander, Qassem Soleimani, over the weekend. Soleimani reportedly is participating in talks to find a new prime minister for Iraq. Soleimani’s visit drew criticism from Grand Ayatollah Ali al-Sistani, the most prominent Shia religious leader in Iraq. Feature OPEC 2.0’s deepening of production cuts to 1.7mm b/d will be largely ceremonial, unless free riders in the producer coalition – led by the Kingdom of Saudi Arabia (KSA) and Russia – fully comply with the new levels agreed last week in Vienna (Chart of the Week).1 Contrary to our expectation, the production cuts were not extended beyond end-March, although an extraordinary meeting of the coalition was scheduled for March 5, 2020, in Vienna to review market conditions prior to the deal’s expiry.2 The market was not expecting anything other than symbolism in the just-concluded discussions among OPEC 2.0 members regarding production cuts. The bulk of the cuts in the coalition’s production are the result of US sanctions against Venezuela and Iran, which have removed ~ 1.8mm b/d from the market and KSA's cuts, which will total ~ 900k b/d following OPEC 2.0's Vienna meeting. We believe this will lead to a tighter market, and will steepen the backwardation in the Brent forward curve. We are, therefore, recommending a longer 2H20 Brent position vs. a short 2H21 Brent position. The sanctions-induced cuts are squeezing the economies of both Venezuela and Iran, which, in the case of the latter, is producing a blowback on Iraq. Chart of the WeekOPEC 2.0 Raises Output Cuts To 1.7mm b/d In Vienna
Iraq, Iran Violence Raises Gulf Oil Supply Threat Level
Iraq, Iran Violence Raises Gulf Oil Supply Threat Level
Iran Fights To Maintain Influence In Iraq Following an unexpected increase in gasoline prices last month, violent anti-government protests erupted around Iran, which provoked a deadly crackdown by the state. The ongoing unrest has resulted in the death of hundreds of protesters, which, by the US’s estimate, stand at more than 1,000. This claim was refuted by Iranian officials.3 It is impossible to overstate the importance of maintaining freedom of navigation through the Strait of Hormuz. The unrest that followed the gasoline price hike was the deadliest since that country’s Islamic Revolution in 1979, according to the New York Times. The Times reported that the Islamic Revolutionary Guards Corps opened fire on protestors calling for the removal of leadership, killing scores.4 Protests also erupted in states closely aligned with Iran in the past couple of months – i.e., Lebanon, Iraq.5 For the oil market, Iraq matters most: It is difficult to overstate the importance of keeping Iraq’s 4.7mm b/d of crude oil production flowing to global markets. Likewise, it is impossible to overstate the importance of maintaining freedom of navigation through the Strait of Hormuz, which connects the Persian Gulf with the Arabian Sea and the rest of the world’s oil-consuming markets (Map 1). Map 1The Persian Gulf And Strait of Hormuz
Iraq, Iran Violence Raises Gulf Oil Supply Threat Level
Iraq, Iran Violence Raises Gulf Oil Supply Threat Level
More than 20% of the world’s crude oil and condensates supplies transit the Strait on any given day (Chart 2). The anti-government protests in Iraq and Iran raise the threat level to production in Iraq, and attacks on shipping transiting the Strait of Hormuz by the latter, or a direct confrontation with the US and its Gulf allies. Our colleagues in BCA Research’s Geopolitical Strategy (GPS) are following the evolution of events in Iran and Iraq closely. Following is their assessment of what led to the most recent unrest in Iraq.6 Chart 2Violence Again Threatens Gulf Oil Supply
Iraq, Iran Violence Raises Gulf Oil Supply Threat Level
Iraq, Iran Violence Raises Gulf Oil Supply Threat Level
Chart 3AFertile Ground For Unrest In Iraq
Iraq, Iran Violence Raises Gulf Oil Supply Threat Level
Iraq, Iran Violence Raises Gulf Oil Supply Threat Level
Deadlock In Iraq While both the grievances and demands of the protesters in Lebanon and Iraq are similar, the unrest in Iraq is of much greater consequence from a global investor’s perspective. The trigger was the removal of the highly revered Lieutenant General Abdul-Wahab al-Saadi from his position in the Iraqi army by Prime Minister Adel Abdul-Mahdi.7 The popular general was unceremoniously transferred to an administrative role in the Ministry of Defense. Iraqi protesters are united in their economic grievances, frustrated at a political and economic system that is unwilling to translate economic gains to improved livelihoods for its people. The sacking of al-Saadi – considered a neutral figure – was interpreted as evidence of Iranian influence and the greater sway of the Iran-backed Popular Mobilization Forces (PMF), an umbrella organization of various paramilitary groups. Iraqis all over the country responded by attacking the Iranian consulate in Karbala and offices linked to Iranian-backed militias. Iraqi protesters are united in their economic grievances, frustrated at a political and economic system that is unwilling to translate economic gains to improved livelihoods for its people. The May 2018 parliamentary elections, which ushered in Prime Minster Abdul-Mahdi, failed to generate much improvement. The country continues to be plagued by high unemployment, corruption, and an utter lack of basic services (Charts 3A & 3B). This has ultimately resulted in a lack of confidence in Iraqi leadership who are being increasingly perceived as benefiting from the status quo at the expense of the populace. Chart 3BFertile Ground For Unrest In Iraq
Iraq, Iran Violence Raises Gulf Oil Supply Threat Level
Iraq, Iran Violence Raises Gulf Oil Supply Threat Level
Most importantly, the ruling elite has failed to respond to key trends that emerged in last year’s parliamentary elections. The extremely low voter turnout reveals that Iraqis are disenchanted with the government's ability to meet their needs. Meanwhile the success of Shia cleric Moqtada al-Sadr’s Sairoon coalition – running on a platform stressing non-sectarianism and national unity – in securing the largest number of seats highlights the desire for a reduction of foreign interference (both Iranian as well as US/Saudi) in domestic politics. Neither the US nor Saudi Arabia have an appetite to step in and provide the support necessary to counteract Iran. Moreover, Iran and its proxies in Iraq will not back down easily. Thus, the ongoing protests are to a great extent the result of the new government’s failure to heed the warnings brought about by the 2018 election and protests. They have served to deepen the rift between the rival Shia blocs, particularly those Iraqi nationalists who deeply resent the intrusion of Iran into its political structures. Iraq is in a state of deadlock. That said, Iran is unlikely to stand by idly as its influence wanes. As a result, we are likely to witness greater unrest as the rift between the two Shia blocs intensifies. Neither the US nor Saudi Arabia have an appetite to step in and provide the support necessary to counteract Iran. Moreover, Iran and its proxies in Iraq will not back down easily. At the same time, the geographical spread of the protest movement demonstrates that Iraqis are fed up with the current system.8 This points to greater instability in Iraq as no side is backing down and the only foreign power willing and able to interfere is Iran. US Sanctions Continue To Pressure Iran The Trump administration’s crippling “maximum pressure” sanctions have sent Iran’s Economy reeling. The Trump administration continues to enforce its “maximum pressure” sanctions, which have reduced Iranian oil exports from 1.8 million barrels per day at their recent peak to 100,000 barrels per day in November (Chart 4). These are crippling sanctions that have sent Iran’s economy reeling. Chart 4Iran Remains Under “Maximum Pressure”
Iraq, Iran Violence Raises Gulf Oil Supply Threat Level
Iraq, Iran Violence Raises Gulf Oil Supply Threat Level
Iran’s Supreme Leader Ayatollah Ali Khamenei has ruled out negotiations with Trump. They would be unpopular at home without a major reversal on sanctions from Trump (Chart 5). Chart 5 Major US Reversal Prerequisite For Iran Talks
Iraq, Iran Violence Raises Gulf Oil Supply Threat Level
Iraq, Iran Violence Raises Gulf Oil Supply Threat Level
Trump presumably aims to avoid an oil shock ahead of the election. The US and its allies have visibly shied away from conflict in the wake of Iran’s provocations, including the spectacular attack on eastern Saudi Arabia's oil infrastructure that knocked 5.7 million barrels of oil per day offline in September. However, this does not mean the odds of war are zero. Opinion polls show that the Iranian public primarily blames the government for the collapsing economy. The Americans or the Iranians could miscalculate. Both sides might think they can improve their standing at home by flexing military muscle abroad. Iran is a rational actor and would not normally court American airstrikes or antagonize a potentially lame duck president. Yet it is under extreme pressure due to the sanctions, as the riots and protests following the gasoline price hikes indicate. Iran also faces significant unrest in its sphere of influence, as discussed above. Opinion polls show that the Iranian public primarily blames the government for the collapsing economy, and yet that American sanctions are siphoning off some of this anger (Chart 6). This could tempt Iran’s leaders to continue staging provocations in the Strait of Hormuz or elsewhere in the region, perhaps with attacks on US assets or those of its GCC allies. Chart 6Iranians Blame Tehran, Tehran Blames America
Iraq, Iran Violence Raises Gulf Oil Supply Threat Level
Iraq, Iran Violence Raises Gulf Oil Supply Threat Level
Hardline Iranian military leaders and politicians currently receive the most favor in polling, while the reformist President Rouhani – undercut by the American withdrawal from the 2015 deal – is among the least popular. Elections for the Majlis, or Parliament, in February will likely reverse the reformist turn in Iranian politics that began in 2012. The regime stalwarts are gearing up for the supreme leader’s succession in the coming years. While a Democratic White House could restore the 2015 deal Trump unilaterally abrogated, that ship may have sailed. Trump, under impeachment, could seek to distract the public. This was Bill Clinton’s tactic with Operations Infinite Reach, Desert Fox, and Allied Force in 1998-99. These operations were minor and not comparable to a conflict with Iran. However, Trump may be emboldened. On paper the US Strategic Petroleum Reserve – along with OPEC and other petroleum reserves and spare capacity – could cover most major oil-shock scenarios. A supply outage the size of the Abqaiq attack in September would have to persist for four months to cause enough price pressure to harm the US economy and decrease Trump’s chances of winning re-election. The simulations in Chart 7 overstate the gasoline price impact by assuming that global strategic oil reserves remain untapped, along with spare capacity. Chart 7Desperation Could Force Iran To Take Excessive Risks
Iraq, Iran Violence Raises Gulf Oil Supply Threat Level
Iraq, Iran Violence Raises Gulf Oil Supply Threat Level
Thus while the Iranians may take excessive risks, the Trump administration may not refrain this time from airstrikes. Bottom Line: While the Middle East is always full of risks to oil supply, Iran’s vulnerability and Trump’s status at home make the situation unusually precarious. We continue to believe an historic oil-supply disruption is a fatter tail risk than investors realize, or are pricing in currently. Market Round-Up Energy: Overweight Following the long-awaited OPEC 2.0 meeting held last week, the group “surprised” the market by announcing it will deepen its production cut by ~ 500k b/d, pushing the total cut to 1.7mm b/d. The bulk of the additional adjustments comes from Saudi Arabia (Chart of the Week). Importantly, the group emphasizes the importance of full compliance by every member – this would imply a ~225k b/d reduction from Iraq alone. We remain overweight oil in 2020. Base Metals: Neutral Copper prices rose sharply over the past week, reaching $2.71/lb at Tuesday's close, a level last seen in July 2019. US-China trade optimism last Friday sparked the rally. Copper’s physical market remains tight, inventories are low globally, and demand is set to rebound on the back of major central banks’ accommodative monetary policy. Even so, sentiment and positioning remain weak (Chart 8). We expect this to reverse, further supporting prices over the short term. Precious Metals: Neutral Risk-on sentiment following President Trump’s upbeat comments on US-China trade negotiations pushed gold prices down by $18/oz last Friday – one of the largest single-day declines YTD. Precious metals markets continue to follow the ups and downs of trade-war headlines and global growth-related news. Nonetheless, our fair-value model suggests gold is fairly priced at ~ $1,465/oz (Chart 9). Any significant drop below that level would provide an entry opportunity for investors to add gold as a portfolio hedge in 2020. Ags/Softs: Underweight The USDA released its final crop progress update on Monday. Corn was 8% behind full harvest, with North Dakota remaining the laggard with only 43% of the corn picked. Markets ignored this as March Corn futures slid close to 1.5% on a weekly basis. Chinese purchases of at least five bulk cargo shipments of U.S. soybeans lifted prices above $9/bu on Tuesday in anticipation of the USDA monthly crop production report. Wheat prices were flat on a weekly basis, as traders awaited results of an Egyptian purchase tender on Tuesday. Chart 8Copper Sentiment And Positioning Remain Weak
Copper Sentiment And Positioning Remain Weak
Copper Sentiment And Positioning Remain Weak
Chart 9Gold Fair Value Is ~ 5/oz
Gold Fair Value Is ~ $465/oz
Gold Fair Value Is ~ $465/oz
Robert P. Ryan Chief Commodity & Energy Strategist rryan@bcaresearch.com Footnotes 1 Please see On OPEC 2.0’s Agenda In Vienna: More Production Cuts, Longer Deal, published December 5, 2019. We noted most of the production cuts that matter to the market already are in place – i.e., Saudi Arabia’s over-compliance of ~ 400k b/d, along with Venezuela’s and Iran’s involuntary production cuts of ~ 1.8mm b/d resulting from US sanctions, as of October 2019. Under the amended production cuts, KSA agreed to remove close to 170k b/d more, lifting its total official voluntary quota and over-compliance, which brings its total cuts to close to 900k b/d. The total OPEC 2.0 additional cuts come to just over 500k b/d. Based on media reports going into the Vienna meeting last week, it would appear Russia prevailed on the producer coalition in its effort to keep the expiry of the production deal at end-March. However, the March 5 extraordinary meeting of the coalition states indicates KSA was successful in keeping the discussion re extending the deal alive. 2 In our current modeling, we assume the original 1.2mm b/d of cuts will remain in place to year-end 2020. We will be updating our balances and price forecasts in next week’s Commodity & Energy Strategy. 3 Please see U.S. says Iran may have killed more than 1,000 in recent protests, published by uk.reuters.com December 5, 2019. Iranian leaders blamed “thugs” aligned with the US and rebels for the violence, and, in a separate report citing an Amnesty International claim that 143 protesters were killed, said “several people, including members of the security forces, were killed and more than 1,000 people arrested.” Please see Iran says hundreds of banks were torched in 'vast' unrest plot published November 27, 2019, by uk.reuters.com. The size of the price increase is difficult to ascertain: The government says gasoline costs were increased by 50% with a goal of raising $2.55 billion/year, while other reports claim the hike amounted to as much as 300% in different parts of the country last month. 4 Please see With Brutal Crackdown, Iran Is Convulsed by Worst Unrest in 40 Years, published by the New York Times December 1, 2019. 5 The extent to which these states are entwined with Iran recently came to light via a cache of leaked Iranian diplomatic cables obtained by The Intercept, a not-for-profit news organization established by Pierre Omidyar, a founder of eBay. The cables were published jointly by The Intercept and the New York Times November 19, 2019. Please see The Iran Cables: Secret Documents Show How Tehran Wields Power in Iraq, published by the Times. The article claims “The unprecedented leak exposes Tehran’s vast influence in Iraq, detailing years of painstaking work by Iranian spies to co-opt the country’s leaders, pay Iraqi agents working for the Americans to switch sides and infiltrate every aspect of Iraq’s political, economic and religious life.” 6 This analysis in the remainder of this report is an abridged version of original work published by BCA Research’s GPS service in reports entitled Iraq's Challenge To Iran Is Underrated and 2020 Key Views: The Anarchic Society published November 8 and December 6, 2019. We believe events over the past week and weekend warrant this in-depth examination of the ongoing unrest and instability in Iraq and Iran. Both reports are available at gps.bcaresearch.com. 7 Lt. Gen. Abdul-Wahab al-Saadi was recognized and respected among Iraqis for fighting terrorism and his role in ridding the country of the Islamic State. The Iran-backed Popular Mobilization Forces were uneasy with Saadi’s close relationship with the US military. His abrupt removal was likely a result of the Iraqi government’s growing concern over al-Saadi’s popularity and rumors of a potential military coup. 8 Protests are occurring in all regions in Iraq. They are supported by Grand Ayatollah Ali al-Sistani. This is a significant development from the 2018 protests which were mainly concentrated in Iraq’s southern region. Investment Views and Themes Recommendations Strategic Recommendations Tactical Trades TRADE RECOMMENDATION PERFORMANCE IN 2019 Q3
Iraq, Iran Violence Raises Gulf Oil Supply Threat Level
Iraq, Iran Violence Raises Gulf Oil Supply Threat Level
Commodity Prices and Plays Reference Table Trades Closed in 2019 Summary of Closed Trades
Iraq, Iran Violence Raises Gulf Oil Supply Threat Level
Iraq, Iran Violence Raises Gulf Oil Supply Threat Level
China’s current economic slowdown predates the trade war and is due to its domestic financial deleveraging campaign that began in early 2017. The trade war exacerbated an existing downward trend in the economy, but was not the cause of it. In 2020, we…
The 2019 UK General Election result offers four possible medium-term outcomes for UK exposed investments: Conservatives win 340 seats or more: This comfortable majority for the Conservatives is medium-term positive for UK exposed investments, as prime minister Johnson would not be dependent on the 20 or so hard Brexit extremists to pass any free trade deal (FTA) through parliament. Albeit the markets are already pricing the Conservatives to win 337-343 seats. Conservatives win 320-340 seats: This marginal majority for the Conservatives is medium-term risky for UK exposed investments, because the hard Brexit extremists would have disproportionate influence and leverage, keeping open the possibility of a hard Brexit on WTO terms after the standstill transition period ends on December 31 2020. Conservatives win 310-320 seats: This ‘marginally hung’ parliament is medium-term risky for UK exposed investments, as it is essentially no change from the current gridlocked parliament. Conservatives win less than 310 seats: This ‘comfortably hung’ parliament is medium-term positive for UK exposed investments, as it creates the possibility of the softest (or no) Brexit under a Labour-led minority government. At the same time, a minority government would be unable to pass its most contentious and supposedly ‘market unfriendly’ policies. If the result is 2. the marginal majority, and the market does not appreciate the risk, then it presents a sell opportunity. Conversely, if the result is 4. the comfortably hung parliament, and the market does not appreciate the upside, then it presents a buy opportunity. Fourth Time Lucky For The UK Pollsters? The 2019 UK General Election is the fourth major UK vote since 2015 in which the UK/EU relationship has featured front and centre. The first was the 2015 General Election, in which then prime minister David Cameron promised a referendum on EU membership, subject to the Conservative party winning an outright parliamentary majority, which it duly did. The second was the subsequent 2016 in/out EU referendum in which the UK voted to leave the EU. The third was the 2017 General Election called by prime minister May to bolster her Brexit negotiating position. But May’s plan backfired. She managed to lose the Conservative majority, her party’s Brexit negotiating position, and ultimately her job. So here we are at the fourth major UK vote in little over four years. Significantly, the pollsters got the 2015, 2016, and 2017 UK votes very wrong. In 2015, they predicted a hung parliament; but the actual outcome was a comfortable majority for the Conservatives, forcing Cameron to deliver his promise of an EU referendum. In the ensuing 2016 referendum, the pollsters predicted a narrow win for remain; the actual outcome was a narrow win for leave. Then in 2017, the pollsters predicted a very healthy vote share win for the Conservatives – and the spread betting markets priced the party to win 364-370 seats in the 650 seat UK parliament; but the actual outcome was 317 seats and a hung parliament – because the pollsters had underestimated the Labour vote by five percentage points. Today, just as in 2017, the pollsters are predicting a healthy vote share win and comfortable parliamentary majority for the Conservatives. At the time of writing (election eve) the spread betting markets are pricing the Conservative party to win 337-343 seats. When the election day exit poll comes out at 10pm UK time, we will get a good idea whether it is fourth time lucky for the pollsters. But irrespective of whether they are right or wrong, the immediate market reaction might still offer some medium-term investment opportunities. The Key Numbers… And Where The Immediate Market Reaction Could Be Wrong The Conservatives need a working majority – because having burnt their bridges with the DUP (Northern Ireland unionists), no other party is likely to support prime minister Johnson’s EU withdrawal agreement. Given that the speaker, deputy speakers, and Sinn Fein (Northern Ireland republicans) do not vote in the UK parliament, and depending on the number of seats that Sinn Fein win, the threshold for a working majority will be around 320 seats. This creates four potential outcomes for the markets: Conservatives win 340 seats or more: This comfortable majority for the Conservatives is medium-term positive for UK exposed investments, as Johnson would not be dependent on the 20 or so hard Brexit extremists to pass any free trade deal (FTA) through parliament. But as noted above, the markets are already pricing the Conservatives to win 337-343 seats. Conservatives win 320-340 seats: This marginal majority for the Conservatives is medium-term risky for UK exposed investments, because the hard Brexit extremists would have disproportionate influence and leverage, keeping open the possibility of a hard Brexit on WTO terms after the standstill transition period ends on December 31 2020. Conservatives win 310-320 seats: This ‘marginally hung’ parliament is medium-term risky for UK exposed investments, as it is essentially no change from the current gridlocked parliament. Conservatives win less than 310 seats: This ‘comfortably hung’ parliament is medium-term benign for UK exposed investments, as it creates the possibility of the softest (or no) Brexit under a Labour-led minority government. At the same time, a minority government would be unable to pass its most contentious and supposedly ‘market unfriendly’ policies. Of these four possibilities, if the immediate market reactions to 2. the marginal majority, or 4. the comfortably hung parliament do not appreciate the risk and upside respectively, then they will create sell and buy opportunities for UK exposed investments. What Are The UK Exposed Investments? The most obvious UK exposed investment is the pound, which is still trading at a near 10 percent discount versus the euro and the dollar, based on the pre-referendum relationship with real interest rate differentials (Chart I-1 and Chart I-2). However, the extent to which that discount can narrow depends on how much worse off (if at all) the UK economy finds itself in its new trading relationships with the EU and the rest of the world compared with full membership of the EU. Chart I-1The Pound Is Cheap Versus The Euro
The Pound Is Cheap Versus The Euro
The Pound Is Cheap Versus The Euro
Chart I-2The Pound Is Cheap Versus The Dollar
The Pound Is Cheap Versus The Dollar
The Pound Is Cheap Versus The Dollar
In this regard, the best outcomes are a rapidly negotiated and maximally-aligned FTA with the EU, or the softest (or no) Brexit. Meaning that the aforementioned possibilities 1. or 4. – a comfortable Conservative win or a comfortably hung parliament – are the best outcomes for the UK economy, and therefore for the pound. To the extent that the Bank of England policymakers recognise this, the same conclusion applies to the direction of UK gilt yields, and therefore inversely to UK gilt prices. Turning to the stock market, the FTSE100 is categorically not a UK exposed investment – because it comprises multinationals with minimal exposure to the UK economy. If anything, the FTSE100 is an anti-UK exposed investment. This is because sales and profits are denominated in international currencies, and if these non-pound currencies weaken versus the pound (meaning the pound strengthens) it weighs down the pound-denominated FTSE100 versus other markets (Chart I-3). In fact, the ‘real’ UK stock market is the more UK focussed FTSE250 (Chart I-4), or the FTSE Small Cap index (Chart I-5). Chart I-3When The Pound Strengthens, The FTSE 100 Underperforms
When The Pound Strengthens, The FTSE 100 Underperforms
When The Pound Strengthens, The FTSE 100 Underperforms
Chart I-4The 'Real' UK Stock Market Is The FTSE 250, Not The FTSE 100
The 'Real' UK Stock Market Is The FTSE 250, Not The FTSE 100
The 'Real' UK Stock Market Is The FTSE 250, Not The FTSE 100
Chart I-5Small Caps Are Exposed To The UK Economy
Small Caps Are Exposed To The UK Economy
Small Caps Are Exposed To The UK Economy
In terms of equity sectors, the least exposed to the UK economy are the multinationals with international currency earnings. As well as the obvious oil and gas, resources, and healthcare sectors, it includes the global banks and clothing and apparel (Chart I-6). Chart I-6Clothing Is Not Exposed To The UK Economy
Clothing Is Not Exposed To The UK Economy
Clothing Is Not Exposed To The UK Economy
The sectors most exposed to the UK economy are the homebuilders (Chart 7), real estate (Chart 8), and general retailers (Chart 9). All of these, plus the FTSE250 and FTSE Small Cap, and of course the pound, can outperform in the medium term in the aforementioned possibilities 1. and 4. – a comfortable win for the Conservatives or a comfortably hung parliament. But they will face pressure in possibilities 2. and 3. – a marginal win for the Conservatives or a marginally hung parliament. Chart I-7Homebuilders Are Exposed To The UK Economy
Homebuilders Are Exposed To The UK Economy
Homebuilders Are Exposed To The UK Economy
Chart I-8Real Estate Is Exposed To The UK Economy
Real Estate Is Exposed To The UK Economy
Real Estate Is Exposed To The UK Economy
Chart I-9General Retailers Are Exposed To The UK Economy
General Retailers Are Exposed To The UK Economy
General Retailers Are Exposed To The UK Economy
Fractal Trading System* This week's recommended trade is long nickel / short gold, the reverse of the successful trade we recommended on October 3. Back then the nickel price had become technically extended due to scares about an Indonesian export ban. And as predicted, the price subsequently collapsed (by 30 percent) to the point where the price has now become technically depressed. Accordingly, this week's recommendation is long nickel / short gold setting a profit target of 10 percent with a symmetrical stop-loss. The rolling 1-year win ratio stands at 64 percent.
A UK Election Special (Again)
A UK Election Special (Again)
When the fractal dimension approaches the lower limit after an investment has been in an established trend it is a potential trigger for a liquidity-triggered trend reversal. Therefore, open a countertrend position. The profit target is a one-third reversal of the preceding 13-week move. Apply a symmetrical stop-loss. Close the position at the profit target or stop-loss. Otherwise close the position after 13 weeks. Use the position size multiple to control risk. The position size will be smaller for more risky positions. * For more details please see the European Investment Strategy Special Report “Fractals, Liquidity & A Trading Model,” dated December 11, 2014, available at eis.bcaresearch.com. Dhaval Joshi Chief European Investment Strategist dhaval@bcaresearch.com Fractal Trading Model
A UK Election Special (Again)
A UK Election Special (Again)
A UK Election Special (Again)
A UK Election Special (Again)
Cyclical Recommendations Structural Recommendations
A UK Election Special (Again)
A UK Election Special (Again)
A UK Election Special (Again)
A UK Election Special (Again)
A UK Election Special (Again)
A UK Election Special (Again)
A UK Election Special (Again)
A UK Election Special (Again)
Trades Closed Trades Asset Performance Currency & Bond Equity Sector Country Equity Indicators Bond Yields Chart II-1Indicators To Watch - Bond Yields
Indicators To Watch - Bond Yields
Indicators To Watch - Bond Yields
Chart II-2Indicators To Watch - Bond Yields
Indicators To Watch - Bond Yields
Indicators To Watch - Bond Yields
Chart II-3Indicators To Watch - Bond Yields
Indicators To Watch - Bond Yields
Indicators To Watch - Bond Yields
Chart II-4Indicators To Watch - Bond Yields
Indicators To Watch - Bond Yields
Indicators To Watch - Bond Yields
Interest Rate Chart II-5Indicators To Watch - Interest Rate Expectations
Indicators To Watch - Interest Rate Expectations
Indicators To Watch - Interest Rate Expectations
Chart II-6Indicators To Watch - Interest Rate Expectations
Indicators To Watch - Interest Rate Expectations
Indicators To Watch - Interest Rate Expectations
Chart II-7Indicators To Watch - Interest Rate Expectations
Indicators To Watch - Interest Rate Expectations
Indicators To Watch - Interest Rate Expectations
Chart II-8Indicators To Watch - Interest Rate Expectations
Indicators To Watch - Interest Rate Expectations
Indicators To Watch - Interest Rate Expectations
Highlights We expect tensions from the Sino-US trade war to marginally ease in 2020, in the run-up to the US presidential election. The “Phase One” trade deal will likely be signed with a good possibility of some tariff rollbacks. Chinese policymakers will roll out more stimulus to secure an economic recovery in 2020, and external demand will improve. But we expect growth in both the domestic economy and exports to only modestly accelerate. During the next 6 to 12 months, investors should remain bullish on both Chinese A shares and investable stocks, while keeping in mind that relative outperformance, particularly for A-shares, could be frontloaded in the first half of the year. Despite sharply rising amount of defaults, Chinese onshore bonds are priced at a much higher premium than warranted by their default risk. We continue to favor Chinese onshore corporate bonds in both absolute terms and in relative to duration-matched government bonds. Feature BCA Research recently published its special year end Outlook report for 2020, which described the macro themes that are likely to drive global financial markets over the coming year. In this week’s China Investment Strategy report we elaborate on the Outlook, by reviewing our four key themes for China in the year ahead. Key Theme #1: Tension From The Trade War With The US Will Ease In 2020 Despite the harsh rhetoric and threats of retaliation from both the US and China, we expect that the real risks to the global economy from the Sino-US trade war will decline in 2020. In trade negotiations next year, both President Trump and President Xi will need to adjust to their respective constraints. Both President Trump and President Xi will need to adjust to their respective constraints next year. Trump must sustain a strong domestic economy to increase his re-election odds. He will cater to the US economy and financial markets, by trying to de-escalate trade tensions and keeping negotiations going with China. This means he is likely to hold off on tariffs on China, and quite possibly even agree to roll back tariffs to August 2019 or April 2019 levels (Chart 1). Chart 1Some Tariff Rollback Is Possible
Some Tariff Rollback Is Possible
Some Tariff Rollback Is Possible
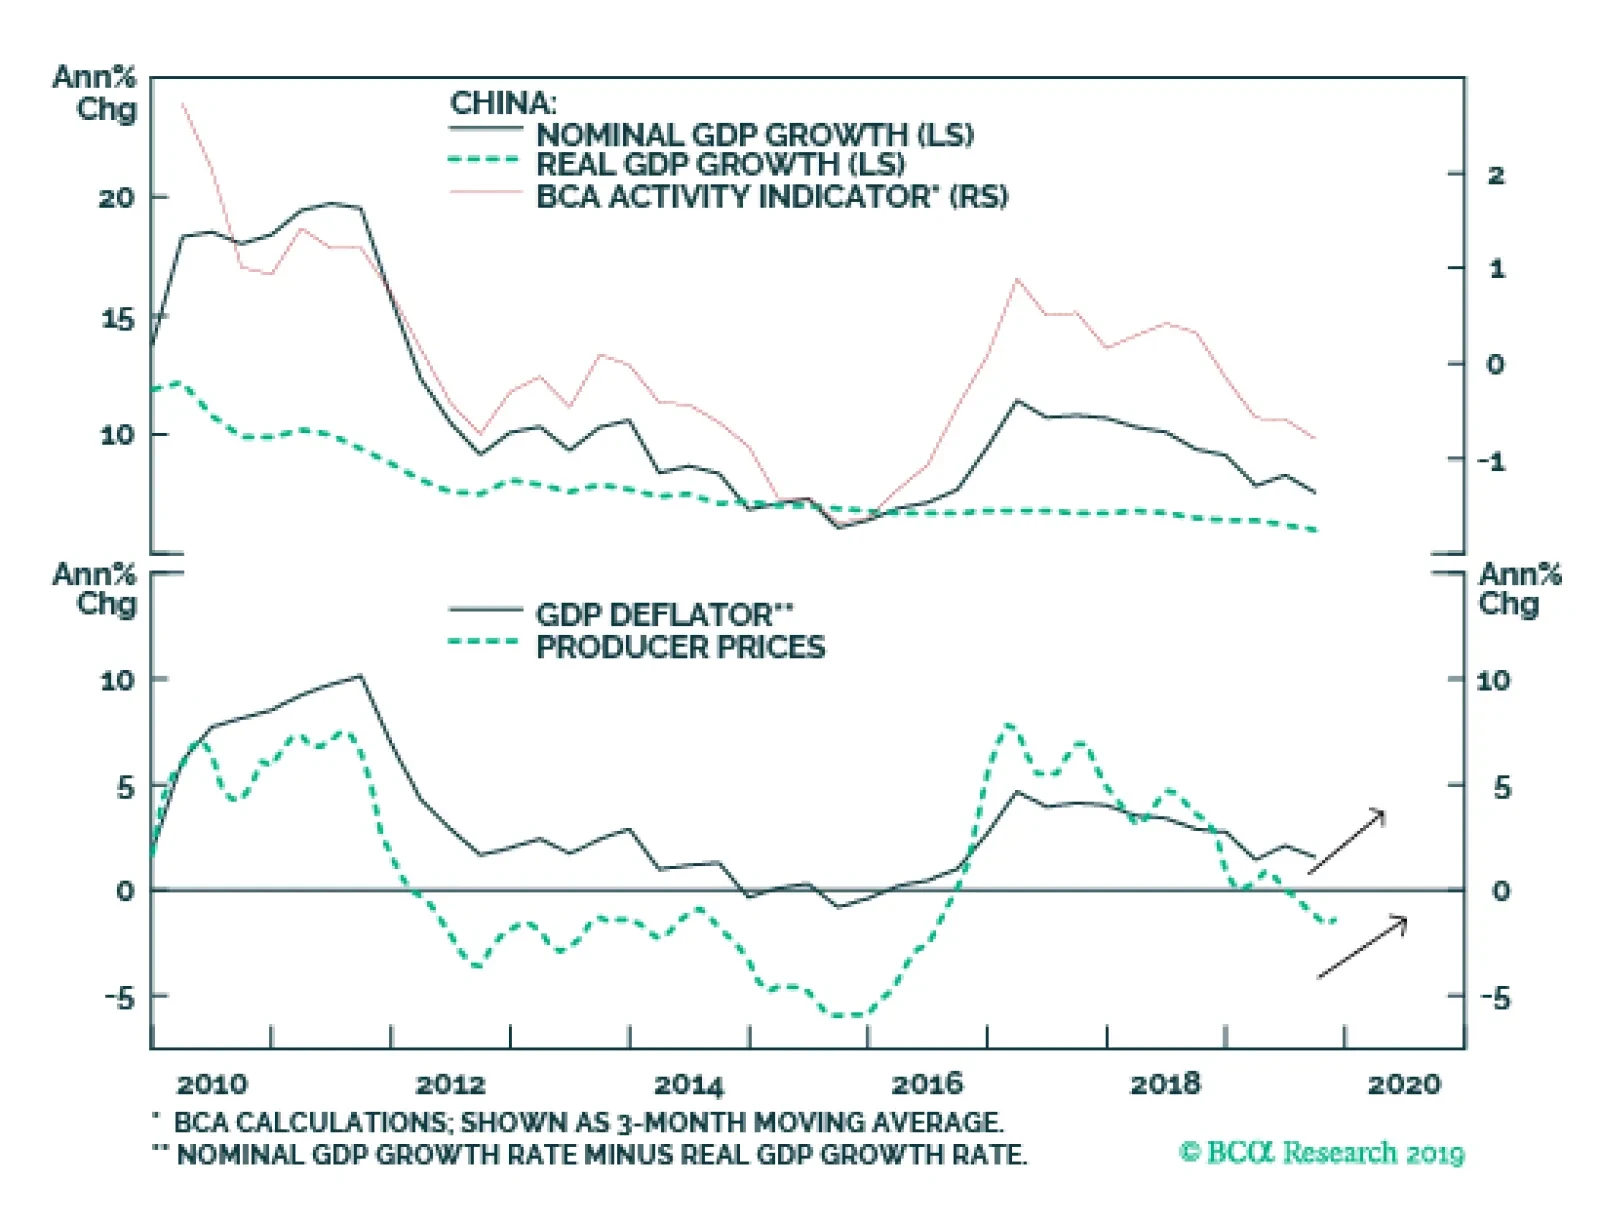
President Xi also faces economic constraints as the Chinese economy is on an unsure footing. The buildup in leverage in the non-financial sector over the past decade has prevented Chinese policymakers from aggressively stimulating the economy by relying on the old debt-oriented policies. Chinese policymakers are concerned about employment stability.1 The private sector, which accounts for 80% of all job creation in China, has been disproportionally hit by the trade war and tariffs compared to the more domestically oriented state-owned enterprises. These economic constraints suggest that it is in China’s best interest to avoid any further friction with the US. Therefore, the “Phase One” trade deal will likely be signed, with a good possibility of some tariff rollbacks. Trade talks will continue in the run-up to the US presidential election, and any escalation will probably occur in non-trade, non-tariff areas. This means that policy uncertainty surrounding the Sino-US trade war will decline in 2020. Bottom Line: We expect tensions from the Sino-US trade war to marginally ease in 2020. However, the risk to this base case view is high and geopolitical uncertainty remains elevated, as suggested by our Geopolitical Strategy team.2 Trade war tensions could re-emerge, which potentially could end the global business cycle and equity bull market. Key Theme #2: Stimulus Versus Shock: Approaching An Inflection Point We presented some simple “arithmetic” in May showing that in order for investors to be bullish on Chinese stocks, the impact of China’s reflationary efforts needed to more than offset the negative shock to the economy from tariffs.3 In other words, a bullish Chinese equity scenario required Stimulus – Shock > 0. In terms of China’s real economy, 2019 essentially panned out to be a Stimulus – Shock =0 scenario, with a “half strength” reflationary response (measured by its credit impulse) barely offsetting the trade shock to the economy (Chart 2). So far on an aggregate level, the shock from tariffs on China’s economy has had a limited direct impact. This is because exports to the US account for only 3.6% of China’s aggregate economy, whereas domestic capex accounts for more than 40% (Chart 3). Our calculation suggests a 10% annualized decline in export growth to the US would shave off 0.4 percentage points from China’s nominal GDP growth. Chart 2This Year, Measured Stimulus Has Just Offset Shocks To The Economy
This Year, Measured Stimulus Has Just Offset Shocks To The Economy
This Year, Measured Stimulus Has Just Offset Shocks To The Economy
Chart 3Domestic Demand Much More Important Than Exports To The US
Domestic Demand Much More Important Than Exports To The US
Domestic Demand Much More Important Than Exports To The US
Additionally, evidence suggests that a large portion of China’s exports to the US has been rerouted through peripheral countries, such as Taiwan and Vietnam (Chart 4). This fact explains why China’s exports have been in-line with the trend of global trade this year (Chart 5). Chart 4Chinese Exports Finding Alternative Routes To The US...
Chinese Exports Finding Alternative Routes To The US...
Chinese Exports Finding Alternative Routes To The US...
Chart 5...And Total Exports Have Been Holding Up
...And Total Exports Have Been Holding Up
...And Total Exports Have Been Holding Up
Chart 6China's Economic Slowdown Predates The Trade War
China's Economic Slowdown Predates The Trade War
China's Economic Slowdown Predates The Trade War
It is important for investors to remember that China’s current economic slowdown predates the trade war and is due to its domestic financial deleveraging campaign that began in early 2017. The trade war exacerbated an existing downward trend in the economy, but was not the cause of it (Chart 6). In 2020, while we expect a ceasefire in the trade war and a potential rollback of tariffs would ease the shock to China’s economy, we also believe that more pro-growth policy support is underway.4 From an investment perspective, this means both China’s economic conditions and corporate earnings will improve, supporting a bullish cyclical outlook for China-related assets. Still, several reasons point to the overall scale of stimulus being less than that of 2015-16, and the upside to China’s export growth will likely be limited given elevated geopolitical uncertainties. Therefore, it is unrealistic to expect a material acceleration in Chinese economic growth in 2020: China is still falling short of its target to double urban income by 2020. Chart 7A 6% Growth Next Year May Just Make The Cut
A 6% Growth Next Year May Just Make The Cut
A 6% Growth Next Year May Just Make The Cut
Next year will mark the final year for Chinese policymakers to accomplish the goal of “Doubling GDP by 2020”. Without the recent upward revision to the level of its 2018 nominal GDP by 2.1%, China's economy would have to expand by at least 6.1% in 2020 to achieve the goal. The upward revision allows a lower economic growth rate in 2020 to reach the goal (Chart 7). China is still falling short of its target to double urban income by 2020 (Chart 8). While keeping economic growth and employment stable remains a top priority, the recent slight improvement in employment should provide some relief to Chinese policymakers (Chart 9). Chart 8China Is Falling Short Of Urban Income Target...
China Is Falling Short Of Urban Income Target...
China Is Falling Short Of Urban Income Target...
Chart 9...But There Is Some Relief In The Labor Market
...But There Is Some Relief In The Labor Market
...But There Is Some Relief In The Labor Market
Monetary policy will remain accommodative, with room for further cuts to interest rates and the reserve requirement ratio (RRR). Nonetheless, we think Chinese policymakers will only allow monetary policy to loosen incrementally and modestly, while keeping a lid on corporate leverage. According to a recent article published by Yi Gang, the governor of China’s central bank, the PBoC will be keen to avoid another boom-bust cycle.5 Fiscal stimulus will continue to take the center stage in supporting growth in 2020, as noted in our November 20th China Investment Strategy Weekly.6 We expect that the National People’s Congress in March 2020 will approve higher quotas on issuing local government bonds, and loosened capital requirements will likely further boost local governments’ infrastructure project funding and expenditures. Transportation and urban development infrastructure projects will likely to continue receiving the most policy support in 2020. Other areas such as environmental protection, education, and social security will continue to be the Chinese government’s focus. These areas are unlikely to translate into immediate economic growth, but will improve China’s long-term economic and social structures. In contrast, compared to the 2015-2016 cycle, housing construction will receive less fiscal support (Chart 10). Overall, we expect the Chinese government to set next year’s real GDP growth target between 5.5 - 6.0%, a half of a percentage point lower than the growth target for 2019. Despite slower real output growth, nominal GDP and economic conditions will bottom in the first quarter of 2020, subsequently pushing up core inflation and reversing an ongoing deflation in the industrial sector (Chart 11). Chart 10Transportation And Urban Development Projects Are Again In Favor
2020 Key Views: Four Themes For China In The Coming Year
2020 Key Views: Four Themes For China In The Coming Year
Chart 11Nominal Output Will Tick Up Soon
Nominal Output Will Tick Up Soon
Nominal Output Will Tick Up Soon
Bottom Line: Chinese policymakers will roll out more stimulus to secure an economic recovery in 2020, and external demand will improve. But we expect growth in both the economy and export to only modestly accelerate. Key Theme #3: Improved Earnings Outlook Supports A Cyclically Bullish View On Chinese Stocks A combination of further policy support, improved earnings and decreased trade tensions should provide tailwinds to Chinese stocks in 2020. Chinese stocks will outperform the global benchmark over a cyclical time horizon (6- to 12-months), for the following reasons: Valuations are depressed relative to global averages: the forward P/E ratios of both China’s onshore A-shares and offshore investable stocks are well below the global benchmark (Chart 12). While the forward P/E ratio of the A-share index is hovering around 12 times, the investable market has particularly suffered a setback from uncertainties surrounding the trade war. Even taking into account that structural weakness in the Chinese corporate earnings growth justifies for a lower multiple than the global average, both Chinese onshore and offshore stocks are offering even deeper discounts than their peaks in 2018, compared to global benchmarks. Chart 12Valuations Of Chinese Stocks Are Depressed
Valuations Of Chinese Stocks Are Depressed
Valuations Of Chinese Stocks Are Depressed
Chart 13Chinese Corporate Earnings Closely Track Economic Conditions
Chinese Corporate Earnings Closely Track Economic Conditions
Chinese Corporate Earnings Closely Track Economic Conditions
Both the economy and earnings growth will improve: We expect the Chinese economy to bottom in the first quarter of 2020. Given the close correlation between the coincident economic activity and earnings cycle, we expect earnings to also improve in 2020 (Chart 13). Improved corporate earnings next year will be the catalyst for the currently cheap multiples in Chinese stocks to re-rate, and re-approach their early 2018 high. Our Earnings Recession Probability Model shows that the probability of an upcoming earnings recession has dropped to 35% from its peak of 85% in early 2019 (Chart 14). Additionally, Chart 15 highlights that the 12-month forward EPS momentum has turned modestly positive. Chart 14Probability Of An Upcoming Earnings Recession Has Significantly Dropped
Probability Of An Upcoming Earnings Recession Has Significantly Dropped
Probability Of An Upcoming Earnings Recession Has Significantly Dropped
Chart 1512-Month Forward EPS Momentum Has Turned Modestly Positive
12-Month Forward EPS Momentum Has Turned Modestly Positive
12-Month Forward EPS Momentum Has Turned Modestly Positive
There are, however, a few caveats to our bullish cyclical view on Chinese stocks. First, while it is not our base case view, geopolitical risks, particularly the Sino-US trade war, could end the global business cycle and equity bull market in 2020. Within the context of falling global stocks, we think Chinese domestic A shares would passively outperform global benchmarks, as A shares are mostly driven by China’s domestic credit and economic growth, and are less sensitive to trade frictions. But investable stocks would clearly underperform in this scenario. The odds are decent that all of the outperformance of Chinese stocks in 2020 will be frontloaded in the first half of the year. Secondly, the odds are decent that all of the outperformance of Chinese stocks in 2020 will be frontloaded in the first half of the year. We expect credit growth, infrastructure spending and the economy to improve in the first quarter. If the “Phase One” trade deal is also signed during that period, onshore A shares and investable stocks will significantly outperform their global counterparts in the first and possibly the early part of the second quarter. However, in the second half of next year, if the Chinese economy stabilizes but stimulus does not ramp up further, then the upside potential in both bourses may be capped as investors will question whether Chinese stocks will continue to gain ground in relative terms. We will closely monitor Chinese credit growth and trade negotiations throughout 2020 to determine if there is more eventual upside potential to economic growth, and thus Chinese earnings prospects, than we currently believe. While we recommend a cyclically bullish stance towards Chinese stocks for next year, our tactical (i.e. 0-3 month) stance remains neutral. We expect to align our tactical and cyclical stances soon, and are awaiting confirmation of a hard data improvement alongside a breakout of key technical conditions to do so.7 Bottom Line: During the next 6 to 12 months, investors should remain bullish on both Chinese A shares and investable stocks within a global equity portfolio. However, investors should also keep in mind that the relative outperformance, particularly for the A-share market, could be frontloaded in the first half of 2020. Key Theme #4: We Continue To Favor Chinese Onshore Bonds, Despite Default Concerns Chart 16Global Investors Are Piling Into The Chinese Bond Market
Global Investors Are Piling Into The Chinese Bond Market
Global Investors Are Piling Into The Chinese Bond Market
Despite sharply rising defaults, Chinese onshore bonds are still priced at a much higher premium than warranted by their default risk. This view is increasingly shared by global investors, as evident in the capital flows into China’s onshore bond market (Chart 16). While the total amount of bond defaults in the first eleven months of 2019 was an astonishing 120.4 billion yuan, they account for only half percent of China’s total onshore bonds issued. A 0.5 percent default rate is in line with global ex-US, and 160 bps below the default rate in the US (Chart 17). Yet, Chinese corporate bond spreads are about 150-175 bps higher than their US counterparts, an overpriced risk premium in our view (Chart 18). Recently, despite mounting defaults, China’s corporate bond spreads have continued to narrow. This suggests that investors do not expect the record-high level of defaults in the past two years to damage China’s corporate sector in the near future. Moreover, China’s monetary policy remains ultra-loose, liquidity conditions have been largely stable, RMB devaluation and capital outflows have both been under control, and the Chinese economy is expected to bottom in the next quarter. Chart 17Chinese Default Rate Well Below Global Average
Chinese Default Rate Well Below Global Average
Chinese Default Rate Well Below Global Average
Chart 18The Risk Premium Assigned To Chinese Corporate Bonds Seems Overdone
The Risk Premium Assigned To Chinese Corporate Bonds Seems Overdone
The Risk Premium Assigned To Chinese Corporate Bonds Seems Overdone
Bottom Line: We continue to favor Chinese onshore corporate bonds in both absolute terms, and in relative to duration-matched government bonds. Jing Sima China Strategist jings@bcaresearch.com Footnotes 1 “China to take multi-pronged measures to keep employment stable,” State Council Executive Meeting, December 4, 2019. 2 Please see Geopolitical Strategy Special Report "2020 Key Views: The Anarchic Society," dated December 6, 2019, available at gps.bcaresearch.com 3 Please see China Investment Strategy Weekly Report "Simple Arithmetic," dated May 15, 2019, available at cis.bcaresearch.com. 4, 6, 7 Please see China Investment Strategy Weekly Report "Questions From The Road: Timing The Turn," dated November 20, 2019, available at cis.bcaresearch.com. 5 https://www.chainnews.com/articles/745634370915.htm Cyclical Investment Stance Equity Sector Recommendations
Our sister BCA Geopolitical Strategy Service has introduced a Presidential Election Model that uses political and economic variables to predict the Electoral College vote on the state-by-state level. The model would have predicted the past five elections correctly on an out-of-sample basis, and even the controversial win of George W. Bush over Al Gore in 2000. As of the latest available data, the model predicts that the Republicans will lose Michigan and Wisconsin (critical victories in 2016). Wisconsin, Pennsylvania, and New Hampshire become borderline or “toss-up” states: the probability of a Republican win in these states is 48.77%, 50.17%, and 46.90%, respectively. Even the smallest change in our model inputs can shift these states to either party. According to the model, President Trump is also at the lowest level of approval and weakest state-by-state economy that he can afford. If one of these factors stabilizes below today’s level, Trump will lose his reelection bid. Bottom Line: Quantitative modeling, entirely independent of our qualitative assessment, suggests that Trump is favored to win the 2020 election. However, he is skating on very thin ice with regard to key cyclical variables such as state-level economic performance and popular approval rating.
BCA’s Geopolitical Strategy's 2020 US Presidential Election Model
BCA’s Geopolitical Strategy's 2020 US Presidential Election Model
It is too soon to declare that Trump’s presidency is finished. On the contrary he is slightly favored to win reelection. President Trump’s low approval rating does not prohibit him from reelection. While historically low, it is also historically stable. If…
If Chinese growth can stabalize, then Europe’s economy can recover and European political risk will be a “red herring” in 2020, as it was in 2019. Euro Area break-up risk has subsided after a series of challenges in the wake of the sovereign debt…
Highlights US politics are the chief source of global geopolitical risk over the coming year – and likely beyond. President Trump’s reelection remains our base case – the sitting president rarely loses if the economy is expanding. Yet the risk of a Democratic victory is high – Trump’s low approval rating, impending impeachment trial, and various policy troubles threaten his reelection bid. Trump’s tactics and the Democrats’ turn to the progressive left pose threats to BCA Research’s cyclically bullish house equity view. Feature If a time-traveler had accosted you in the fall of 2014 and told you that Donald Trump, the host of the reality TV show The Apprentice, would be the next American president, would you have believed him? What if the time-traveler had gone on to say that President Trump’s unconventional behavior would get him into hot water and that in 2020 he would become the first president in US history to be impeached and removed from office? Granting the premise, the second proposition is easier to imagine. And yet Trump is highly unlikely to be removed from office. He is in fact favored to be reelected. Just as his victory in 2016 proved more likely than the consensus held at the time, so his reelection in 2020 is more likely than the consensus holds today. The reason comes down to political constraints. First, the bar for removal in the Senate is very high. Second, it is easier for a sitting president to get reelected than it is for the opposition to convince voters to start over with something entirely different. Especially if the economy is in decent shape. In what follows we present our quantitative 2020 election model and our qualitative, constraints-based analysis of the election and likely market responses. Trump's fate is only one factor. But US politics is the chief source of market-relevant global political risk over the next 12-24 months. Not A Lame Duck (Yet) After a harrowing year in which global manufacturing slumped due to China’s tight credit policy and Trump’s trade war, the probability of a US recession is now – tentatively – subsiding (Chart 1). This is good news for Trump, whose presidency is hanging by a thread. Chart 1Recession Averted? Or Trump's Death Knell?
Recession Averted? Or Trump's Death Knell?
Recession Averted? Or Trump's Death Knell?
Chart 2Bookies Expect A Democrat Victory
US Election 2020: Civil War Lite
US Election 2020: Civil War Lite
Betting markets like PredictIt.org suggest that Democrats are slightly more likely than Republicans to win the White House next November (Chart 2). The narrow spread is appropriate given that the balance of evidence is fairly even. However, if there is to be a tilt, it should go the opposite way, i.e. toward Republicans as the incumbent party. The history of US elections since 1860 shows a strong tendency for the incumbent party to hold the White House when the sitting president is running at the head of the ticket. This is especially true when there has not been a recession during the president’s four-year term. It is even true when the ruling party has lost seats in preceding congressional elections, as occurred in 2018 and as is often the case (Chart 3). Other than recession, the biggest exception to the sitting president’s victory – especially in modern times – is when a major scandal has occurred, as with Gerald Ford in 1976. This is clearly relevant to today. In these rare cases the incumbent president’s and incumbent party’s historic reelection rates are both 50/50. The implication of Chart 3 is that Trump’s odds, from a historical point of view, are slightly above 50%. Of course, history does not afford an example of a first-term president being impeached, acquitted, and running for election again.1 Yet this is the most likely outcome today, as there is not an overwhelming popular demand to remove Trump from office. Despite the revelations and public hearings in the impeachment inquiry so far, support for removal stands at 47%, while opposition to removal stands at 45% (Chart 4). In other words, there is no majority in favor of removal, but only a narrow plurality. Removal – nullifying an election result – requires more. Chart 3History Says Trump More Likely To Win Than Not
US Election 2020: Civil War Lite
US Election 2020: Civil War Lite
Chart 4No Consensus On Removal From Office
US Election 2020: Civil War Lite
US Election 2020: Civil War Lite
The spread is conspicuously close to the 46%-to-48% popular vote spread for Trump and Hillary Clinton, respectively, in 2016. The impeachment is not a tsunami of public opposition to the administration. It is a bare-knuckle power struggle: Trump tried to have his top rival investigated and tarred with corruption allegations, the Democrats are retaliating by trying to remove Trump prior to the election. Support for removal will fluctuate, but it will take more than 47% of the population to generate a 67-vote supermajority against Trump in a Republican-held Senate. Republican senators would be taking a grave risk in voting against their base when they have the option of deferring to voters in just 11 months’ time. Both Richard Nixon and Bill Clinton were in their second terms when Congress began moving articles of impeachment: the public had no other recourse in the event that they committed “high crimes and misdemeanors.” Trump is in his first term and is due for the public’s verdict shortly. Nixon resigned when it became clear that grassroots Republicans had lost faith in him and the Senate would not acquit. Trump’s political base has not yet lost faith – his approval among Republicans is still 90%, higher than the average of Republican presidents and at the high end of his term in office (Chart 5). When it comes to the final vote, some Republican senators may defect, but it would take 20 to remove Trump from office. This will require a Nixon-like hemorrhage of support. Remarkably Trump’s general approval rating has not been affected by the impeachment inquiry (Chart 6). His approval rating is still comparable to President Barack Obama’s rating at this stage in his first term (as well as Ronald Reagan’s). While Trump is highly unlikely to break above 50%, he is emphatically not a lame duck … at least not yet. Presidential approval tends to rise as the opposition nomination is settled and the election approaches. If Trump’s approval revives to the 46% of the popular vote he won in 2016, then he remains competitive in the swing states where the election will be fought and won. Chart 5Trump’s Political Base Geared Up For Battle
US Election 2020: Civil War Lite
US Election 2020: Civil War Lite
Chart 6A Precarious Approval Rating
US Election 2020: Civil War Lite
US Election 2020: Civil War Lite
What about the Republicans’ heavy losses in the midterm elections and special elections since 2016? Haven’t national voting trends already condemned Trump and the Republicans to a loss in 2020? Not necessarily. Democrats lost elections more dramatically in 2009-11 than Republicans lost in 2017-19 – both in voter support and turnout (Table 1) – and yet President Obama secured the victory in 2012. Presidential elections are a different beast. Table 1Democrats Suffered More Post-2008 Than Republicans Post-2016 … Yet Obama Won Reelection
US Election 2020: Civil War Lite
US Election 2020: Civil War Lite
Chart 7GOP Governorships At Low End Of Rising Trend
US Election 2020: Civil War Lite
US Election 2020: Civil War Lite
The same goes for Republican losses in recent gubernatorial races. In Kentucky the incumbent governor was a Republican and lost; in Louisiana the incumbent governor was a Democrat and won. The catch is that the number of Republican governors was extremely elevated prior to 2018. Recent losses have merely brought the Republicans back to the bottom of their upward channel as a share of the nation’s 50 governors (Chart 7). Thus while the interim elections are a warning sign to Trump and the GOP, they are not a death knell – as long as the economy rebounds and President Trump’s approval rises as the election approaches. Bottom Line: Trump is not a lame duck yet. His administration is embattled and the impeachment process could permanently damage his standing. But so far his general approval rating and the specific impeachment polling suggest that he will stay in office and remain competitive in the 2020 race. If the election were today he would almost surely lose, but a lot can change in 12 months. If the economy avoids recession, then investors should take reelection as their base case. Cyclical Constraints Will Prevail A recession is the surest way to render a president a lame duck. It does not have to be a technical recession. The contraction in the manufacturing sector – and corresponding cutbacks in lending in the manufacturing-heavy and electorally vital Midwest – are extremely threatening to a president who promised to revive manufacturing and trade (Chart 8). Incumbency, economic growth, failed impeachment, and partial policy victory are enough to win the key swing states. Having declared that “trade wars are good and easy to win,” President Trump will not be able to hide from a deeper slowdown in the industrial heartland. State-level wage growth is positive, but swing states, particularly Trump swing states, are seeing a sharp drop-off from the highs prior to the trade war (Chart 9). The solution is the trade ceasefire being pursued with China. Trump is now in the position of the Federal Reserve Chairman: he can no longer afford to hike (tariff) rates, and the equity market may force him to cut, as long as he can reasonably hope to improve the economy. If the economy is lost, the trade war is back on. Chart 8An Urgent Need For A Trade Ceasefire
An Urgent Need For A Trade Ceasefire
An Urgent Need For A Trade Ceasefire
Chart 9Trump Swing States Took A Hit From The Trade War
Trump Swing States Took A Hit From The Trade War
Trump Swing States Took A Hit From The Trade War
Chart 10Buttigieg And Warren More Favorable Than Others
US Election 2020: Civil War Lite
US Election 2020: Civil War Lite
Are incumbency, economic growth, failed impeachment, and partial policy victories enough to get Trump over the line in the key swing states?2 Subjectively, we think so. The Democrats have to win all of the states they won in 2016 plus Michigan and Florida (or two other states in place of Florida, such as Wisconsin and Pennsylvania). President Trump can afford to lose Michigan and one other state (but not Florida). This assessment has little to do with the Democratic presidential nominee – as yet unknown – and everything to do with whether the incumbent president or party has been fundamentally discredited. Democratic candidates like Senator Elizabeth Warren and Mayor Pete Buttigieg are generally more competitive than consensus holds. Warren, for instance, is one of the few candidates in recent elections who has a net positive favorability rating (Chart 10). But her favorability is not enough to overturn a sitting president – that will most likely require a shock that renders the status quo intolerable. The cyclical constraints on Trump and his opponents are thus clear. What of the structural constraints? Trump’s 2016 victory is often attributed to long-running structural trends in the US such as deindustrialization, immigration, and racial attitudes. The Democrats’ “blue wall” in the Rust Belt crumbled because Trump courted the working-class voter there and/or stoked racial anxieties. The implication, however, is that Trump still has an advantage in these swing states. Older voters and especially white voters have drifted toward Republicans for several years – the trend was interrupted only by the Great Recession, which saw a surge in Democratic support that has now subsided (Chart 11). Chart 11Old And White People Drifting To GOP Over Time ... Excepting The Great Recession
US Election 2020: Civil War Lite
US Election 2020: Civil War Lite
While the white share of the swing states is falling over time, that trend is not sufficient to prevent Trump from winning the Electoral College in the year 2020. Instead the rapidly changing racial and ethnic composition of society should be seen as motivating the attitudes that Trump exploits. Trump’s electoral strategy of maximizing white turnout and support for the Republican Party, which we dubbed “White Hype” in 2016, is still the only way for him to achieve a popular vote victory in 2020, and hence the clearest pathway for him to achieve an Electoral College victory (Chart 12). Needless to say, tensions and controversies over race and immigration will swell in the coming year. Chart 12Electoral College Scenarios Show Trump Win Still Possible
US Election 2020: Civil War Lite
US Election 2020: Civil War Lite
Chart 13Swing State Turnout Follows Unemployment
US Election 2020: Civil War Lite
US Election 2020: Civil War Lite
By the same token, demographic change means that the Democrats can theoretically win by performing no better than they did in 2016 in terms of voter turnout and support rates (see the “Status Quo” scenario in Chart 12). This is a low hurdle for Democrats – suggesting once again that the election will be extremely close, that Trump can win only through the Electoral College (not the popular vote), and that the election outcome will ultimately swing on the cyclical factors outlined above, particularly the state of the economy. A final word about voter turnout. The greatest electoral risk to President Trump is an increase in voter turnout among traditionally low turnout groups that heavily favor the Democratic Party, such as young people and minorities. Given the surge in turnout for the 2018 midterm elections, and the extremely controversial and heated environment surrounding Trump’s presidency, there is considerable reason to suspect that 2020 will be a high-turnout election. Other things being equal, this would likely penalize Trump’s reelection prospects. However, it is important to recognize that voter turnout in swing states is fairly well correlated with the unemployment rate (Chart 13). Depending on the state, surges in turnout occurred in 1992, in the wake of recession; 2004, in the wake of recession, terrorism and war; and 2008, in the wake of the great financial crisis. The exception is Pennsylvania, where a surge in white voter turnout helped Trump pull off a surprise win in the state. Turnout is the hardest political variable to predict, so it is not clear whether Trump’s scandals and impeachment will do the trick. But an increase in the unemployment rate would virtually destroy Trump’s bid, being negatively correlated with presidential approval and positively correlated with voter turnout. Bottom Line: Trump’s executive powers give him the potential to achieve some additional policy victories that could boost his approval rating – namely a trade ceasefire with China that simultaneously improves the economic outlook. Meanwhile structural factors such as demographics do not forbid Trump from winning the Electoral College – on the contrary, aging and the decline in the white share of the population mean that Trump’s electoral strategy could succeed again in 2020, but will be much harder to pull off after 2020. Introducing … BCA’s Geopolitical Strategy 2020 US Presidential Election Model The BCA Geopolitical Strategy Presidential Election Model is a state-by-state model that uses political and economic variables to predict the Electoral College vote. What differentiates our model from that of others is that it attempts to predict the probability of the incumbent party winning the Electoral College votes in each of the 50 states. The model would have predicted the past five elections correctly on an out-of-sample basis, even the controversial win of George W. Bush over Al Gore in 2000. Why do we predict the electoral vote rather than the popular vote? First, the winner of the presidential election is determined by the Electoral College, not the popular vote. Second, in recent history, two candidates who lost the popular vote (George W. Bush in 2000 and Donald Trump in 2016) won the election. It is possible that we will see a similar result in 2020, given President Trump’s low national popularity yet distinctive policy pitch for the Midwestern states (e.g. economic patriotism, hardline on immigration). With only minor exceptions, electoral votes are allocated based on a winner-take-all process, as opposed to proportionately to the popular vote. Hence the best way to forecast the presidential election winner is to predict the probability of winning each state, i.e. receiving all the electoral votes assigned to each state.3 Due to the data availability of our input variables, our sample size includes nine elections (1984 to 2016) across 50 states, making for a total of 450 observations. We designed the model to be as succinct as possible. It includes four explanatory variables: A weighted average of the Federal Reserve Bank of Philadelphia State Leading Index, from the beginning of the previous presidential term until September of the election year. The state leading indexes predict the 6-month growth rate of the state coincident indexes, which include nonfarm payroll employment, average hours worked in manufacturing by production workers, the unemployment rate, and wage and salary disbursements deflated by the consumer price index (U.S. city average).4 Chart 14Voters Make Up Their Minds Ahead Of Time
US Election 2020: Civil War Lite
US Election 2020: Civil War Lite
We use a weighted average of all the monthly forecasts in the presidential term preceding an election, where later months are weighted more heavily than earlier months. Our sample includes 6-month growth rates up to and including September of the election year, which means it includes a rough forecast of the direction of the state’s economy in Q1 of the new president’s term. Since we weigh recent months more heavily, our model assigns more importance to forward-looking factors. It is sufficient to end our calculations of the average state leading indexes in September of the election year. First, the October data comes out in early November, just days before the election, which would be an insufficient lead-time for our final forecast. Second, most voters make their decision at least one month in advance of the election and last-minute changes in economic forecasts will likely not influence their decision (Chart 14). The incumbent party’s margin of victory in the previous presidential election in each state. This is measured as the incumbent party vote share minus the non-incumbent party vote share. Simply put, if the incumbent party failed to secure a solid win in a given state in the previous election, the probability of securing a solid win in the current election is much smaller. Average national approval level of the incumbent president in July of the election year. We tested the correlation between presidential approval in every month leading up to the election versus the election outcome and found that July approval levels have the second-highest correlation with the popular vote and Electoral College vote (Chart 15). Average October approval levels have slightly higher correlation with election outcomes, but not sufficiently so to sacrifice three months of lead-time. A “time for change” variable. This is a categorical variable indicating whether the incumbent party has been in the White House for one or more terms. Academic literature shows that a party that has occupied the White House for two terms or more is much less likely to win an election than a party that is running for a second term.5 Chart 15Voters Mostly Decided By July
US Election 2020: Civil War Lite
US Election 2020: Civil War Lite
The output of our model is the probability of an incumbent win in each state. There are two ways of aggregating these probabilities to produce a national-level outcome: Allocate the number of Electoral College votes won by the incumbent proportionally to their probability of victory in each state, and then sum them up across all states. This method would smooth out potential errors in our forecast. The Republican Party is expected to win with 279 Electoral College votes in 2020. Assume a probability threshold of 50%: any state with an incumbent win that is at least 50% likely is fully assigned to the incumbent. While this method could significantly sway our forecast towards one of the parties because of small changes in probability, it is closer to the political reality. Even the smallest majority in a given state will (usually) result in the winning candidate getting all of the state’s Electoral College votes. We therefore adopt this method in our aggregation.6 Our model performs well in back tests: it correctly predicted every election in in-sample tests and every election from 2000 to 2016 in out-of-sample tests (Chart 16). Chart 16BCA Research Geopolitical Strategy Election Model: Back Tests Accurate
US Election 2020: Civil War Lite
US Election 2020: Civil War Lite
Chart 17 shows our initial 2020 prediction. Overall, the Republican Party is expected to win 279 Electoral College votes, a 25-vote decrease from its 2016 result. Chart 17Trump Narrowly Slated To Win 2020 With 279 Electoral College Votes
US Election 2020: Civil War Lite
US Election 2020: Civil War Lite
As of the latest available data, our model predicts that the Republicans will lose Michigan and Wisconsin (critical victories in 2016). Wisconsin, Pennsylvania, and New Hampshire become borderline or “toss-up” states: the probability of a Republican win in these states is 48.77%, 50.17%, and 46.90%, respectively. Even the smallest change in our inputs can shift these states to either party. The two inputs that can affect our forecast are the state leading index and President Trump’s approval level, since the other two inputs – the time for change variable and last election’s margin of victory – are fixed. Table 2 shows the predicted Electoral College votes for the Republican Party for various scenarios of these two variables. According to the model, President Trump is currently at the lowest level of approval and weakest state-by-state economy that he can afford. If one of these factors stabilizes below today’s level, Trump will lose his reelection bid. Table 2Small Decline In State Economies Could Ruin Trump’s 2020 Bid
US Election 2020: Civil War Lite
US Election 2020: Civil War Lite
In the worst-case scenario for Trump – if his approval and the state leading indexes drop to the lowest levels they have touched in Trump’s presidency – the Republican Party will only manage to secure 230 Electoral College votes. The opposite, optimistic scenario would see them winning with 329 votes. An interesting takeaway from our model is that it captures the increase in American political polarization that has been widely observed by scholars. The 2020 forecast shows that many states will be won or lost by the incumbent party with extreme certainty (0% or 100%). Results of in-sample predictions show that this trend has been increasing since 1992 (Chart 18, top panel), which is also in line with our own measure of polarization (Chart 18, bottom panel). Since the results are based on in-sample estimations, the coefficients remain constant, so the differences in the results can be attributed to the underlying data. The impression of ever-intensifying polarization in the US is correct. What does this mean for Trump? He cannot be written off simply because he has a relatively low approval rating. Structural political factors that propelled him to the White House are still in place. His approval and the economy must deteriorate to change this base case. The chief risk to our model is the accuracy and interpretation of presidential approval polling. While polling data always has a margin of error, it is possible that approval polling is underestimating Trump’s support, particularly on the state level, as was witnessed in 2016 (Chart 19). Chart 18Rising Polarization – It’s Empirical
US Election 2020: Civil War Lite
US Election 2020: Civil War Lite
Chart 19State-Level Polling Still A Risk
State-Level Polling Still A Risk
State-Level Polling Still A Risk
We have a high degree of confidence in professional pollsters, who have also made improvements since 2016. But asking Americans whether they “approve” of the unorthodox Trump may be a different proposition than in the past, disguising voting intentions to some degree. By choosing the level of Trump’s approval in our model (see Appendix), we are guarding against overstating his support and not allowing much room for any dampening effects or self-censorship, which is thus a risk to our model. Bottom Line: Quantitative modeling, entirely independent of our qualitative assessment, suggests that Trump is favored to win the 2020 election. However, he is skating on very thin ice with regard to key cyclical variables such as state-level economic performance and popular approval rating. If his approval level suffers from a slowing economy, or scandal and impeachment, then he will lose the critical toss-up states and the White House. Investment Conclusions In this report we have outlined a case where President Trump, despite his extreme unorthodoxy in general, and acute vulnerability at this moment in time, is still the most likely winner of the 2020 election. Elections are a Bayesian process in which investors should establish a clear prior, or starting place, and update their probabilities according to reliable data streams. This report establishes our prior and our key data streams. So what? Does it matter if Trump is reelected? Is it relevant to investors? From a bird’s eye view, Trump has made a few decisions that clearly distinguish his term in office from that of previous presidents. First, Trump replaced Janet Yellen with Jerome Powell at the Federal Reserve. It is debatable whether or how this affected the normalization of monetary policy. What is clear is that Trump made a change at the helm while pushing through highly stimulative fiscal policy. Fed hikes contributed to a rise in bond yields and an increase in market volatility, and the Fed was ultimately forced to adjust. Trump has vociferously criticized the Fed and demanded ever-lower rates. Second, by embracing sweeping Republican tax reform, Trump initiated pro-cyclical fiscal stimulus that widened the US’s monetary and economic divergence from the rest of the world, while exacerbating the US’s long-term fiscal woes. Third, by adopting protectionist trade policy to confront China’s mercantilism, Trump rattled global sentiment and contributed to a manufacturing recession. As long as our view remains correct, investors will have a base case that is cyclically bullish. Of these three macro developments, the only one that the election could substantially change is trade policy – and yet the Democrats are also taking a more hawkish approach to China. On the fiscal front, the Democrats will raise taxes, but they will not impose austerity – instead they propose large expansions of entitlements that the populace increasingly demands. Populist social spending combined with geopolitical struggle with China ensures that the deficit/GDP ratio will go up regardless of the party in power. From a market point of view, the historical record suggests that presidential elections – specifically elections that lead to gridlock between the White House and Congress, since we do not expect the Democrats to lose the House of Representatives – usually see a rising US stock market beforehand and a higher degree of volatility afterwards (Chart 20). Relative to developed market equities, US stocks typically underperform, and only resume their rise in the second half of the following year (i.e. 2021). Comparing Trump to other first-term presidents, it is clear that his “pluto-populism” (populism plus tax cuts for the rich) has exerted a reflationary effect on the equity market (Chart 21). As long as the data show that he has a fair chance of reelection, investors will have a base case that is cyclically bullish, despite the volatility to come from the Democrats’ taxation and regulation proposals. Chart 20Equity Outcomes Surrounding US Presidential Votes
Equity Outcomes Surrounding US Presidential Votes
Equity Outcomes Surrounding US Presidential Votes
Chart 21Trump A Reason To Be Bullish
Trump A Reason To Be Bullish
Trump A Reason To Be Bullish
What is most striking about Trump’s presidency is the low real total return on US Treasuries. This is despite his aggressive foreign and trade policy, which has motivated safe-haven flows into Treasuries this year (Chart 22). The bottom line is that the output gap is closed, the labor market is tight, and fiscal policy is expansive, putting upward pressure on yields. Given that Trump needs to cultivate a China ceasefire and economic improvement for reelection, this trend should continue until the next recession looms. Chart 22Trump Marks End Of Bull Market In Bonds
Trump Marks End Of Bull Market In Bonds
Trump Marks End Of Bull Market In Bonds
The risk, however, is that Trump’s precarious China negotiations fall through, or that his scandals cause a permanent downshift in his approval rating, rendering him a lame duck. Not only would this free him of the election constraint that currently forces him to pursue pro-market policies, but it would also make a Democratic victory more likely. The Democratic nomination, meanwhile, could easily produce a progressive populist in the figure of Elizabeth Warren, who is still a frontrunner in the Democratic nomination. A bear market could develop quite easily if a normal equity market correction, which improves the odds of a Democratic victory becomes entangled in expectations that Warren is set to win the nomination. If the opposition can summon enough votes to unseat an incumbent president, chances are that the circumstances will include a “blue wave” that also sees the Democrats take the Senate. This would institute another sweeping change to American policy, this time in a direction that is unfriendly to corporate profits. As the probability of such a scenario rises, the equity market will have to discount it. Expectations of a Trump victory will spur the market upward – but investors should be wary. If this very long bull market has continued all the way to November 3, 2020, and President Trump is confirmed in office, the positive stock market reaction will likely provide an excellent time for booking profits and reducing risk. In a second term, Trump will be unshackled from his electoral constraints – very much unlike a first-term Democrat. This would free him to pursue his trade wars with fewer inhibitions – against China but also likely against Europe. A continuation of the trade war has important impacts across the full slate of global assets, as outlined in Chart 23, which depicts the movement of assets on days in which US equities reacted negatively to trade war developments. Chart 23A Trump Second Term Means Trade War With Fewer Constraints
US Election 2020: Civil War Lite
US Election 2020: Civil War Lite
With 11 months to go, we are a world away from the election. The party nomination process, or third-party candidates, could overturn all expectations. But if there is one certainty, it is that polarization and political risk will rise in the coming 12-24 months. The losing side of the population will have deep heartburn. A crisis of legitimacy could easily haunt the next administration. There could be hanging chads, vote recounts, faithless electors, or contested results. The outcome of the election could turn upon unprecedented developments in the Electoral College, Supreme Court, or even in cyberspace. If the Democrats win, redistribution will amplify partisanship. If Trump wins, inequality will rise. There is no easy way forward for the United States. Matt Gertken Vice President Geopolitical Strategist mattg@bcaresearch.com Ekaterina Shtrevensky Research Analyst ekaterinas@bcaresearch.com Appendix 1: The Approval Question: Level Or Change? Chart 24Trump’s Historically Low Approval Rating
US Election 2020: Civil War Lite
US Election 2020: Civil War Lite
The chief risk to our model is the interpretation of the presidential approval rating and its impact on the election. President Trump’s approval rating is notoriously low compared to the average president (Chart 24). While many authors use approval rating (or popularity) in their models, some argue that it is not the approval level, but the change in approval leading up to the election that matters.7 Consider the following: if President Trump’s approval increases from today’s level of 43% by 5%, he would be at the same level of approval as the average president if their approval were to drop by 5%. A model based on approval level would place these two presidents equally, while a model based on the change in approval would favor Trump. So which one is correct? We compare the incumbent’s popular vote in post-WWII elections with four different “variations” of incumbent president approval: the average level in July of the election year (as in our model); the deviation of the average October level from the election-year average, the change during the last two years of the term; and the range throughout the entire term. Directionally, the results are as expected. Level and change in approval are positively correlated with the popular vote, while a less stable approval (higher range) is negatively correlated (Chart 25A). We also find that approval level has the best fit with the election outcome, followed by the change in approval in the two years leading up to the election. However, if we restrict the sample size to the range of elections used in our model, 1984 to 2016, we find that the change in approval has a much better fit than the level (Chart 25B). In other words, in modern elections the presidential candidate’s momentum matters more in the final outcome. Chart 25AHigh, Rising, And Stable Approval Ratings …
US Election 2020: Civil War Lite
US Election 2020: Civil War Lite
Chart 25B… Help Presidents Win Elections
US Election 2020: Civil War Lite
US Election 2020: Civil War Lite
We tested each variation of approval as an input in our model instead of the July approval level. Table 3 summarizes the results. Trump wins in all four versions. Table 3All Measures Of Approval Favor Trump In 2020
US Election 2020: Civil War Lite
US Election 2020: Civil War Lite
Our current model penalizes Trump the most, while the model based on approval range favors him. This makes sense, given that President Trump’s approval is relatively low but very stable (Chart 26). Chart 26Trump Approval Very Low … And Very Stable
US Election 2020: Civil War Lite
US Election 2020: Civil War Lite
We will continue to use approval level in our model to generate updated predictions, given that this measure has the best long-term historical fit with the election outcome. However, given that President Trump is performing relatively well on these other measures of approval, there is upside risk to his 2020 performance. Appendix 2: A Word About The Probit Model Table 4 presents the regression coefficients of our model. Since this is a probit model, the coefficients cannot be directly interpreted as they would in an ordinary regression. The coefficients in a probit regression model measure the change in the Z-score associated to each independent variable for a one-unit change in that variable. Table 4BCA 2020 US Presidential Election Model Statistics
US Election 2020: Civil War Lite
US Election 2020: Civil War Lite
The sign of the coefficient corresponds to the direction of change in probability. So increases in the state leading index, presidential approval, or the incumbent’s margin of victory in the last election increase the probability of the incumbent winning a state. Of course, the latter variable is fixed and will not change until the election. At the same time, having occupied the White House for two terms or more decreases the probability of an incumbent win. But this is not the case in the current election. Footnotes 1 Andrew Johnson, the first to be impeached, did not run in 1868; Ulysses Grant bowed out after two terms in 1876, amid the “Great Barbecue” scandal; Warren Harding died before the election of 1924, amid the infamous “Teapot Dome” scandal; Harry Truman stepped down amid scandal after two terms in 1952; Richard Nixon resigned before the election of 1976; Bill Clinton was impeached and hit the two-term limit before the election of 2000. For these examples, and the electoral impact of great scandals in general, please see Allan J. Lichtman, Predicting The Next Presidency: The Keys To The White House 2016 (Rowman and Littlefield, 2016). 2 Trump’s policy record contains one major legislative victory, the Tax Cut and Jobs Act of 2017, along with a number of works in progress. The Republicans’ failed attempt to repeal and replace the Affordable Care Act (Obamacare) exacted an opportunity cost: it deprived Trump and the GOP Congress of time needed to legislate a southern border wall, while mobilizing the opposition for all subsequent elections. As for other policies, the renegotiation of NAFTA is only a partial success as the USMCA has not been ratified. The promised infrastructure package will become a campaign pledge for the second term. We expect some kind of North Korea deal. 3 To this end, we use a probit model, where the dependent variable is stated as 1 = incumbent party won all Electoral College votes in this state, or 0 = incumbent party did not win any Electoral College votes in this state. This model allows us to measure the probability that a state with certain characteristics will fall into one of these two categories. 4 “The leading index for each state predicts the six-month growth rate of the state’s coincident index. In addition to the coincident index, the models include other variables that lead the economy: state-level housing permits (1 to 4 units), state initial unemployment insurance claims, delivery times from the Institute for Supply Management (ISM) manufacturing survey, and the interest rate spread between the 10-year Treasury bond and the 3-month Treasury bill.” See the Federal Reserve Bank of Philadelphia, www.philadelphiafed.org. 5 Alan I. Abramowitz, “Forecasting the 2008 Presidential Election with the Time-for-Change Model,” Political Science and Politics, Vol. 41, No. 4 (Oct., 2008), pp. 691-695. 6 We also assume that the Democrats always win the District of Columbia. 7 Please see Michael S. Lewis-Beck, Charles Tien, “Forecasting presidential elections: When to change the model,” International Journal of Forecasting, Volume 24, Issue 2, April–June 2008, Pages 227-236, and Mark Zandi, Dan White, Bernard Yaros, “2020 Presidential Election Model,” Moody’s Analytics, September 2019.
Highlights The Fed is the usual culprit for killing business cycles — but the Fed is on hold. This makes geopolitics the likeliest candidate to kill the cycle. The key geopolitical risks are US political turmoil, China’s economic policy, and the US-Iran confrontation. Nevertheless, policymakers are adjusting to the threat of recession, which points to a continuation of this long-in-the-tooth expansion. The US-China talks will be driven by Trump’s need for an economic boost ahead of the US election. If the economy or Trump’s approval rating fails anyway, then all bets are off. Go long gold as a strategic hedge. Feature Great power struggle, or “multipolarity,” continues to be our mega-theme in 2020. The world does not operate like a normal society, with a single government that possesses a monopoly on the use of force and ensures stability. Nations are individualistic, armed, and dangerous, creating what scholar Hedley Bull once called “The Anarchical Society.” This is not pure chaos, but rather a community of nations that lacks a clear and undisputed leader. Hence, quarrels break out often. Updating our geopolitical power index shows that the rise of China remains the most disruptive trend in global politics (Chart 1). The gap between the US and China has closed until recently, with China’s downshift in growth rates, but American fear is just being awakened (Chart 2). Given that Beijing threatens the US’s military and technological dominance over the long run, Washington will continue to develop a containment policy. Chart 1China's Geopolitical Rise Is Disruptive
2020 Key Views: The Anarchic Society
2020 Key Views: The Anarchic Society
Chart 2China-US Power Gap Is Narrowing
2020 Key Views: The Anarchic Society
2020 Key Views: The Anarchic Society
China is too big to quarantine, especially for a relatively unpopular first-term American president who eschews international coalition-building. The European Union’s decline in relative power is more marked than that of the United States, but China does not pose as much of a security threat to Europe. This trend exacerbates the already serious divergence in the trans-Atlantic alliance – which will worsen if Trump wins on November 3, 2020. Hence, globalization faces persistent challenges, as indicated by the falling import share of global output (Chart 3). This multi-decade process has peaked, creating a headwind for trade-exposed firms over the long run. What about the next 12 months? Will geopolitics kill the bull market? Not necessarily. Just as central bankers have cut interest rates to guard against deflationary risks (Chart 4), so the key governments are adjusting policies to avoid recessionary risks, especially with the memory of 2008 still fresh. Simply put: The Fed is on pause, Trump wants to be reelected, and China cannot afford a hard landing. Chart 3Globalization Faces Challenges
2020 Key Views: The Anarchic Society
2020 Key Views: The Anarchic Society
Chart 4Policymakers Are Reacting To Deflationary Risks
2020 Key Views: The Anarchic Society
2020 Key Views: The Anarchic Society
Clearly the risks to this view are elevated. The chief ones: (1) President Trump becomes a lame duck, cannot run on an economic platform, and thus makes a desperate attempt to win as a “war president” (2) Xi Jinping overestimates his advantage, in domestic or foreign policy, and makes a policy mistake (3) the US-Iran conflict spirals out of control due to Iran’s economic vulnerability. Other risks, such as Brexit, pale by comparison. Fear And Loathing On The Campaign Trail It is too soon to declare that Trump’s presidency is finished. On the contrary he is slightly favored to win reelection: • The Senate is unlikely to remove him from office. Republican support for the president is well above average despite evidence that Trump tried to get Ukrainian officials to investigate his political rival (Chart 5). The implication is that a year from now Democrats will have suffered a policy failure while Trump will have been cleared of charges. Chart 5Trump Still Popular Among Republicans
2020 Key Views: The Anarchic Society
2020 Key Views: The Anarchic Society
• The odds of recession in the coming year are low. The US voter is buffered by rising real incomes and wages and high net wealth (Chart 6). To unseat a sitting president requires a recessionary backdrop that fundamentally discredits him and his party – not just slowing growth. Chart 6Pocketbook Voter Theory To The Test
2020 Key Views: The Anarchic Society
2020 Key Views: The Anarchic Society
• Trump’s low approval rating does not prohibit him from reelection. While historically low, it is also historically stable. Our quantitative election model – which predicts Trump will win the Electoral College with 279 votes by clinging onto Pennsylvania – shows that Trump’s victory margin would increase if we looked not at the average level of his approval but at its change, momentum, or low range (i.e. stability). Table 1 shows the results of all four variations of his approval rating, with ascending chances of winning key swing states. Table 1All Measures Of Trump’s Approval Rating Get Him 270 Electoral College Votes
2020 Key Views: The Anarchic Society
2020 Key Views: The Anarchic Society
Trump’s odds of winning will affect the US equity market throughout the year. As long as he remains competitive, i.e. neither scandal nor the economy cause his approval rating to break down, he will have reason to temper his policies to cater to US financial markets. Foreign and trade policies are Trump’s only ways to improve the economy and voter support. Trump’s only remaining way to boost the economy and improve voter support lies in foreign policy and trade policy. Specifically, he will stop increasing tariffs on China – and maybe even roll back tariffs to August 2019 or even April 2019 levels (Chart 7) – at least as long as the manufacturing recession persists. Chart 7Some Tariff Rollback Is Possible
2020 Key Views: The Anarchic Society
2020 Key Views: The Anarchic Society
China is unlikely to implement painful structural changes when Trump could be gone in 12 months’ time. Strategic tensions outside of trade will undermine any ceasefire. Hence economic policy uncertainty will remain elevated even though it will drop off from recent peaks. Assuming the electoral constraint prevents Trump from levying sweeping tariffs on China or Europe, he will be limited to other foreign and trade policies to try to boost his approval rating or fire up his base: • We expect a third summit with Kim Jong Un of North Korea. Trump is rumored to be considering some troop reduction in exchange for progress on denuclearization (neither of which would be irreversible). • Otherwise Trump could turn to saber-rattling, since Pyongyang is threatening to resume long-range tests and the economic consequences of another round of “fire and fury” would be limited. • Trump could also rattle the saber against Iran, Venezuela, or other rogue states. If Trump becomes uncompetitive in the election, then the market will sell off. The market will have to price not only policy discontinuity (e.g. higher taxes), but also the chance of a progressive-populist taking the White House. Moreover, if a Democrat is able to unseat an incumbent president, the Democrats will take the Senate as well. Trump is a known unknown; this scenario would be an unknown unknown. The Democratic Party’s primary election will consume the first half of the year. It culminates in the Democratic National Convention, strategically chosen to take place in Milwaukee, Wisconsin on July 13-16. Wisconsin is one of three critical swing states. Will former Vice President Joe Biden win the nomination? A high conviction is not warranted. Biden is clearly the frontrunner, but we think a progressive can pull it off. A simulation of the Democratic Convention “pledged delegates,” based on November polling in the first four primary elections, shows Biden far short of a majority (Chart 8). He needs to outperform his polls, but this will be difficult given that he is well-known, has not performed well in debates, and will have Mayors Pete Buttigieg and Michael Bloomberg nipping at his heels in the Midwest and Northeast, respectively. Chart 8Do Not Discount A Progressive Win
2020 Key Views: The Anarchic Society
2020 Key Views: The Anarchic Society
Over time, candidates will drop out, so it is more informative to look at the “centrist” candidates as a whole compared to the “progressives.” Here the early primary polling suggests that the progressives will come closest to victory (Chart 9). Chart 9Progressives Come Closest To Victory
2020 Key Views: The Anarchic Society
2020 Key Views: The Anarchic Society
The trend within the party is to move to the left. Senators Elizabeth Warren and Bernie Sanders are tied as voters’ second choice – even Buttigieg supporters are split between Biden and Warren (Chart 10). What is unknown is whether Warren (or Sanders) can consolidate the progressive vote faster than Biden (or Buttigieg) consolidates the centrist vote. Chart 10If Biden Falters, Progressives Are Next In Line
2020 Key Views: The Anarchic Society
2020 Key Views: The Anarchic Society
Chart 11Structural Imbalances Give Rise To Populism
2020 Key Views: The Anarchic Society
2020 Key Views: The Anarchic Society
Trends pointing toward a progressive victory may not at first trouble the market, but any signs that a progressive is pulling ahead decisively will force investors to sharply upgrade the probability that he or she will win the White House. This will cause equity volatility, which could become self-reinforcing. A progressive nominee would force investors to recognize that populism and political risk are here to stay – which is our expectation given that they are motivated by polarization, inequality, and other structural imbalances in the United States (Chart 11). Left-wing or progressive populism is far more negative for corporate earnings than Trump’s right-wing or “pluto-populism.” Sanders or Warren present the worst case for investors because they favor trade protectionism in addition to higher taxes and minimum wages. Most presidents achieve their chief legislative priority in their first term and there is no reason to assume a progressive presidency would be any different. The implication is higher corporate taxes as well as individual taxes to pay for a sweeping expansion of the social safety net – positive for the economy perhaps but negative for corporate earnings. Chart 12A Progressive Win Threatens Key Sectors
2020 Key Views: The Anarchic Society
2020 Key Views: The Anarchic Society
An extensive re-regulation of the US economy would occur regardless, since it falls under executive authority. It would affect the key equity sectors in the US bourse, technology and health (Chart 12), as well as energy and financials. The choice of a centrist Democrat like Biden (or Buttigieg) would be the least negative outcome for US equities of all the Democrats. The market would probably cheer a Trump versus Biden matchup for this reason. Biden favors higher taxes and regulation but is an establishment politician and known quantity. However, even Biden will be pulled to the left by the current within his party once in office; and Buttigieg will govern to the left of Biden. Trump’s reelection would spur a relief rally in US equities, but it would be short-lived. He would solidify low taxes and deregulation and would have a real chance of passing an infrastructure package. But he would also curtail labor force growth with his border wall and double down on trade protectionism – likely against Europe as well as China this time. His unpredictable and aggressive tendencies would be turbo-charged by a new popular mandate. We expect to cut back on risk exposure upon Trump’s reelection, assuming the bull market has survived to return him to office. A Democratic victory would mark another reversal in US policy orientation. Given our view that the White House call is also the Senate call, this would be the third time since 2008 that the country has witnessed a total reversal. Domestic American political risk will not end with the election: a legitimacy crisis could follow a narrow election, and institutional erosion continues regardless. It is too soon to call peak polarization, as the election will result in either a left-wing government bent on redistributing wealth or a right-wing Trump administration that exacerbates inequality. A centrist "return to normalcy" is possible with a Biden or Buttigieg victory. This reinforces our constructive cyclical view. Bottom Line: The chief risk from US politics in 2020 is Trump becoming a lame duck and resorting to belligerent foreign policy to try to win back voters through a rally around the flag. The chief risk of the Democratic nomination, and the general election, is a left-wing populist winning the White House. Any Democratic victory would likely bring the Senate, removing a key constraint. Over time the median voter is moving to the left. The Man Who Changed China Chart 13Xi Is Purging Misallocated Capital
2020 Key Views: The Anarchic Society
2020 Key Views: The Anarchic Society
Xi Jinping undoubtedly represents a “new era” in China – a reassertion of Communist Party rule. The party faced a crisis of legitimacy amid the Great Recession and Arab Spring and was determined to regain political, economic, and social control. Xi had previously been anointed but was all too happy to take on the role of neo-Maoist strongman. Yet Xi’s playbook is close to that of President Jiang Zemin’s: centralize the party, repress dissent, modernize the military, restructure banks and the economy, upgrade the country’s science and technology, and expand China’s global influence. The difference is that while Jiang rode the high tide of globalization, Xi is riding the receding tide. Jiang culled two-thirds of the country’s state-owned enterprises, laying off over 40 million people, confident that a surge of new growth would ensue. Xi is also cracking down – allowing bankruptcies to purge misallocated capital (Chart 13) – but with a large debt load and shrinking labor force, he needs the state sector to put a floor under growth rates. The takeaway is that Xi will act pragmatically to boost growth when China’s stability is threatened, as he did in 2015-16. The trade war has already forced him to backtrack on the 2017-18 deleveraging campaign and stimulate the economy. The combined fiscal and credit impulse amounts to 6.6% of GDP from trough to now, and it hasn’t peaked. The implication is that Chinese growth – and global growth – will pick up from here (Chart 14). Chinese authorities are still trying to contain the growth in leverage, which has kept this year’s stimulus in check. But the chief banking regulator has also stated that as long as the macro-leverage ratio is not growing faster than 10%, this goal is met (Chart 15). Chart 14Chinese Growth Will Pick Up
2020 Key Views: The Anarchic Society
2020 Key Views: The Anarchic Society
Chart 15China Says Leverage Already Contained
2020 Key Views: The Anarchic Society
2020 Key Views: The Anarchic Society
The economy has not yet durably bottomed, so the state will continue adding support. The coming year is the third and final year of the “Three Battles” – against poverty, pollution, and systemic risk – as well as the final year of the thirteenth five-year plan. Beijing is falling short on its targets for real urban per capita income (Chart 16) and poverty elimination (Chart 17). A last-minute rush to meet these targets is likely and will require more fiscal stimulus. Chart 16Beijing Falls Short Of Urban Income Target...
2020 Key Views: The Anarchic Society
2020 Key Views: The Anarchic Society
Chart 17...And Poverty Target
2020 Key Views: The Anarchic Society
2020 Key Views: The Anarchic Society
This is not an argument for a blowout credit splurge. China is saving dry powder for a further escalation in the US containment strategy and a worse economic downturn. Do not expect a blowout Chinese credit splurge. The core constraint on policy is unemployment. Stimulus efforts have created a bottom in the employment component of the manufacturing PMI as well as a notable uptick in the demand for urban labor (Chart 18). To withdraw stimulus now – or tighten policy – would be to trigger a relapse in an economy that is ultimately at risk of a debt-deflation trap. Chart 18Chinese Stimulus Shows Up In Employment
2020 Key Views: The Anarchic Society
2020 Key Views: The Anarchic Society
Chart 19A Banking Crisis Is A Risk To The Chinese Economy
2020 Key Views: The Anarchic Society
2020 Key Views: The Anarchic Society
Tougher controls on credit and shadow banking have seen an uptick in corporate defaults and bank failures. With the government deliberately imposing pain on bloated sectors of the economy, financial turmoil could spread. Newspaper mentions of defaults, layoffs, and bankruptcies have only slightly subsided since stimulus efforts began (Chart 19). If bank failures spiral out of control, the economy will tank. The state will have to fight fires. Tariffs have accelerated the trend of firms relocating out of China, which began because of rising wages and a darkening business environment (Chart 20). A questionable trade ceasefire will not reverse the process as American and Asian companies are seeking a lasting solution, which requires them to set up shop elsewhere. China will want to mitigate the process, first by stabilizing domestic growth, and second by accepting Trump’s tactical trade retreat. Xi is also trying to avoid diplomatic isolation by courting trade partners other than the US, since the ceasefire is unreliable and the US containment strategy is presumed to continue. This involves outreach to the rest of Asia, Russia, and Europe, and even to distrustful neighbors like Japan and India. Europe is the swing player. China’s Asian neighbors, and Australia and New Zealand, have reason to fear Beijing’s growing clout and seek the US’s security umbrella. Russia and China are informal allies. But the European public is not interested in the new cold war – China does not threaten Europe from next door, like Russia does, and the Trump administration is threatening Europe with both trade war and Middle Eastern instability. European leaders are happy to take the market share that the US is leaving, as is clear from direct investment (Chart 21). Only a concentrated US diplomatic effort can address this divergence, which is not forthcoming in 2020. Chart 20Firms Are Relocating Out Of China
2020 Key Views: The Anarchic Society
2020 Key Views: The Anarchic Society
Chart 21Europe Exploits US-China Rift
2020 Key Views: The Anarchic Society
2020 Key Views: The Anarchic Society
A new Democratic administration, or a change in Trump strategy in the second term, could eventually produce a multilateral western coalition demanding that China open up and liberalize parts of its economy. But Europe will need to be convinced of the underlying reality that China is doubling down on the state-led industrial policies that provoked the Americans to begin with. Beijing is after economic self-sufficiency, indigenous innovation, and leadership in high-tech production and new frontiers. Its official research and development budget is not its only means for achieving this end (Chart 22) – it also has state-backed acquisitions and cyber campaigns. Germany and Europe have begun scrutinizing Chinese investment, separately from the United States. Chart 22Beijing Is After Economic Self-Sufficiency
2020 Key Views: The Anarchic Society
2020 Key Views: The Anarchic Society
The danger to China – and the world – is that Xi Jinping might overplay his hand. He could overtighten money, credit, or property regulations and spoil the economy when global growth is vulnerable. His anti-corruption campaign is a telling reminder of his heavy hand in domestic affairs (Chart 23). Chart 23Xi Jinping Risks Overplaying His Hand
2020 Key Views: The Anarchic Society
2020 Key Views: The Anarchic Society
Chart 24China Needs To Calm Things Down
2020 Key Views: The Anarchic Society
2020 Key Views: The Anarchic Society
He could also suppress protesters in Hong Kong and rattle sabers over Taiwan or the South China Sea in a way that undermines the trade ceasefire. Or he could fail to bring the North Koreans to heel. These strategic tensions are significant only insofar as they undermine the trade ceasefire or provoke US-China saber-rattling. Failing to act as an honest broker in the Iran crisis would also irk Europeans and give them an excuse to side with the US. Bottom Line: China will continue modestly stimulating the economy next year to achieve a durable stabilization in growth. The risk of debt-deflation and rising unemployment ultimately necessitates this policy. Beijing can accept Trump’s tariff rollback for the sake of stability – China’s policy uncertainty relative to the rest of the world is off the charts and Beijing has an interest in calming things down (Chart 24). Yet Beijing will double down on indigenous innovation, while courting the rest of the world so as to preempt criticism and isolate the Americans. The risk is that Xi proves too heavy-handed when it comes to domestic leverage, the tech grab, strategic disputes, or trade talks with Washington. The Strait Of Hormuz Risk Chart 25US-Iran Conflict Still Unresolved
2020 Key Views: The Anarchic Society
2020 Key Views: The Anarchic Society
In a special report earlier this year entitled “The Polybius Solution” we argued that while the US-China conflict is the major long-term geopolitical conflict, the US-Iran showdown could supersede it in the short term. This remains a risk for 2020, as the Trump administration’s confrontation with Iran is fundamentally unresolved (Chart 25). The Trump administration is still enforcing “maximum pressure” sanctions, which have reduced Iranian oil exports from 1.8 million barrels per day at their recent peak to 100,000 barrels per day in November (Chart 26). These are crippling sanctions that have sent Iran’s economy reeling. Chart 26Iran Remains Under
2020 Key Views: The Anarchic Society
2020 Key Views: The Anarchic Society
Iran’s Supreme Leader Ayatollah Ali Khamenei has ruled out negotiations with Trump. They would be unpopular at home without a major reversal on sanctions from Trump (Chart 27). Chart 27Major US Reversal Prerequisite For Iran Talks
2020 Key Views: The Anarchic Society
2020 Key Views: The Anarchic Society
Trump presumably aims to avoid an oil shock ahead of the election. The US and its allies have visibly shied away from conflict in the wake of Iran’s provocations, including the spectacular attack on eastern Saudi Arabia that knocked 5.7 million barrels of oil per day offline in September. However, this does not mean the odds of war are zero. The Americans or the Iranians could miscalculate. Both sides might think they can improve their standing at home by flexing their muscles abroad. Iran is a rational actor and would not normally court American airstrikes or antagonize a potentially lame duck president. Yet it is under extreme pressure due to the sanctions. It faces significant unrest both at home and in its sphere of influence (Iraq and Lebanon). Opinion polls show that the public primarily blames the government for the collapsing economy, and yet that American sanctions are siphoning off some of this anger (Chart 28). This could tempt the leaders to continue staging provocations in the Strait of Hormuz or elsewhere in the region. Chart 28Iranians Blame Tehran, Tehran Blames America
2020 Key Views: The Anarchic Society
2020 Key Views: The Anarchic Society
Hardline military leaders and politicians currently receive the most favor in polling, while the reformist President Rouhani – undercut by the American withdrawal from the 2015 deal – is among the least popular (Chart 29). The Majlis (parliament) elections in February will likely reverse the reformist turn in Iranian politics that began in 2012. The regime stalwarts are gearing up for the supreme leader’s succession in the coming years. While a Democratic White House could restore the 2015 deal, that ship may have sailed. Chart 29Rouhani And Reformists In Trouble
2020 Key Views: The Anarchic Society
2020 Key Views: The Anarchic Society
A historic oil supply disruption is a fatter tail risk than investors realize. Chart 30The Iranians May Take Excessive Risk
2020 Key Views: The Anarchic Society
2020 Key Views: The Anarchic Society
Trump, under impeachment, could seek to distract the public. This was Bill Clinton’s tactic with Operations Infinite Reach, Desert Fox, and Allied Force in 1998-99. These operations were minor and not comparable to a conflict with Iran. However, Trump may be emboldened. On paper the US strategic petroleum reserve (along with OPEC and other petroleum reserves) could cover most major oil shock scenarios. According to Hugo Bélanger, Senior Analyst at BCA Research Commodity & Energy Strategy, a supply outage the size of the Abqaiq attack in September would have to persist for four months to cause enough price pressure to harm the US economy and decrease Trump’s chances of winning reelection. The simulations in Chart 30 overstate the gasoline price impact by assuming that global oil reserves remain untapped. Thus while the Iranians may take excessive risks, the Trump administration may not refrain this time from airstrikes. Bottom Line: While the Middle East is always full of risks to oil supply, Iran’s vulnerability and Trump’s status at home make the situation unusually precarious. A historic oil supply disruption is a fatter tail risk than investors realize. Europe Is A Price Taker, Not A Price Maker Just as the US and China have a shared incentive to avoid tariff-induced recession, so the UK and EU have a shared incentive to prevent a shock reversion to basic WTO tariffs. The December 31, 2020 deadline for the UK-EU trade deal, like the various deadlines for Brexit itself, can be delayed. Even Prime Minister Boris Johnson has proved unwilling to exit without a deal and even a hung parliament has proved capable of preventing him from doing so. The negotiation of a trade deal – which is never easy and always drags on – will be a lower-order risk in the wake of the past two years’ Brexit-induced volatility. Johnson will not be held hostage by hardline Brexiters given that Brexit itself will be complete. If our view on Chinese growth is correct, then Europe’s economy can recover and European political risk will be a “red herring” in 2020, as it was in 2019. Instead the EU presents an opportunity. Chart 31Euro Area Breakup Risk Has Subsided
2020 Key Views: The Anarchic Society
2020 Key Views: The Anarchic Society
Euro Area break-up risk has subsided after a series of challenges in the wake of the sovereign debt crisis (Chart 31). There is not a basis for a reversal of this trend, at least not until a full-blown recession afflicts the continent. The rise in anti-establishment parties coincided with a one-off surge in migration that is finished – and successful populists from Greece to Italy have moderated on euro membership once in power. Germany is entering a profound transition driven by de-globalization and tensions with the United States. It is more likely to have an early election than the consensus holds. But it is fundamentally stable and supportive of European integration. In fact the great debate about fiscal policy poses an upside risk over the long run both for European equities and the European project. We remain optimistic on French structural reforms even though President Emmanuel Macron must overcome significant public opposition. An eerie quiet hangs over Russia, making it one of our “Black Swan” risks for 2020. Oil prices are not very high, which discourages foreign adventures, and President Vladimir Putin has spent his fourth term trying to consolidate international gains and improve domestic stability. But approval of the government is weak, the job market is deteriorating, and social unrest is cropping up. There is plenty of room to ease monetary and fiscal policy, but a sharp downturn could provide the basis for an aggressive foreign policy action to shore up regime support. The US election also presents the risk of renewed US-Russian tensions, whether over election interference or a Democratic victory. Investment Conclusions Geopolitics is the likeliest candidate to derail the global bull market in 2020. Nevertheless, policymakers are adjusting to their constraints. Trump and Xi are negotiating a ceasefire and a disorderly Brexit is off the table. Even Trump’s impeachment shows that the US system of checks and balances remains intact. After all, there is nothing to prevent removal from office if Trump further antagonizes public opinion and the Republican Senate. This means that policy uncertainty will decline on the margin in 2020, even as it remains elevated due to the danger of the underlying events. The nature of US economic imbalances suggests that the policy discontinuity of a Democratic victory on November 3, 2020 would be better for the economy (via household consumption) than it would be for corporate earnings. Policy continuity with the Trump administration suggests the opposite. On a sectoral basis we recommend going long US energy large cap stocks and short info-tech and communications. Energy has limited downside even if a progressive wins whereas tech has limited upside even if Trump wins. The BCA Research House View expects the US dollar to weaken as global growth rebounds, stocks to outperform bonds and cash, and developed market equities to outperform those of the United States. But a Republican victory in November would push against these trends as it is more bullish for the greenback and for US equities relative to global. As a play on the global growth rebound we expect, we recommend going long industrial metals. Like our colleagues at BCA Research Commodity & Energy Strategy, we are initiating this as a tactical trade but it may become strategic. We are reinitiating a tactical long Korea / short Taiwan equity trade. Taiwanese political risk is understated ahead of January’s election and the island is the epicenter of the US-China cold war. We are restoring our long gold trade as a strategic hedge. Populism and de-globalization are potentially inflationary, but they are also linked with great power competition which will increase the frequency of geopolitical crises. In either case, gold is the right safe haven to own. Matt Gertken Vice President Geopolitical Strategist mattg@bcaresearch.com
Highlights Chile is undergoing a paradigm shift from a neoliberal economic model to a Welfare State. It will not be a smooth transition, as the political and business elites are resisting such a transformation. Indeed, protesters will continue to renounce the status quo until their demands are satisfied. Hence, the clash between these two predispositions will ensure that political volatility persists and financial markets continue selling off. Feature Chart I-1The CLP Is Not Very Cheap
The CLP Is Not Very Cheap
The CLP Is Not Very Cheap
The current socio-political turmoil in Chile has taken the world by surprise. What seemed to be a periodical increase of 3.75% of public transport fares in October ended up being the trigger for the country’s longest and most violent uprising in 30 years. These protests have had a drastic effect on Chilean markets: Equities are down 8% in local currency terms and the peso has depreciated 9% versus the dollar since October 21st. Will the selloff in Chilean markets continue? Are the Chilean peso and equities cheap enough for value investors to step in? Odds are that the protests will endure, and financial markets remain at risk. According to the Real Effective Exchange Rate (REER) based on unit labor costs – our most favored currency valuation measure – the peso is only slightly cheap (Chart I-1). Yet, odds are that the peso will undershoot and will approach one and a half or two standard deviations below its fair value due to collapsing growth on the back of ongoing protests and political uncertainty, a rising risk premium on Chilean assets, as well as a further decline in copper prices. This entails another 12-15% depreciation versus the USD in the coming months. Investment conclusions for equities and fixed-income markets are presented at the end of this report. Politicians Are Playing With Fire In an attempt to quell protesters, the government and the opposition have scheduled a referendum in April for a new Constitution. While it might be tempting to interpret this positively, odds are that it will be insufficient to calm protesters and allow the authorities to regain control over the situation. The government will ultimately meet the popular demands of protesters, albeit not immediately. We expect Chile to move towards a Welfare State-style of government, but not towards Socialism. It seems Chile's political elite is still underestimating the depth and gravity of the popular frustration. By setting a national vote five months away (with a subsequent election in November of next year), the government and the opposition are not dealing with the issues “head on.” This will test the patience of the protesters and risks continued violence on the streets. Hence, we expect the protest to linger at least until the referendum in April. Consequently, the selloff in financial markets will persist. The Roots Of Public Discontent It is important to note that the current uprising is not against President Sebastián Piñera specifically but against the entire political class, including the opposition. National polls from CADEM, one of Chile’s most respected polling companies, suggest voters disapprove of both Piñera’s party and the center-left opposition. In a survey conducted in April of this year (several months before the protests began), there were only two political parties with a net positive approval rating: Renovación Nacional (Piñera’s party) and Revolución Democrática, which was founded by students in the wake of the 2011 national protests. Since then, the President’s approval rating has fallen from 36% to 12%. It is therefore safe to assume the President’s party currently has a net disapproval rating. This means that the only party that Chileans view in a positive light is one led by students – not politicians. This nationwide distrust in the political and economic elites is evidenced by the historically low voter turnout of 49% in the 2017 general election. Voters have become increasingly frustrated at politicians in the past decade as their main demands have not been addressed. These include the provision of an effective social safety net and programs as well as more inclusive economic growth. The roots of the discontent are income inequality, a poor social security net and stagnating median incomes. Income Inequality Chart I-2GINI Coefficient Across Various Nations
GINI Coefficient Across Various Nations
GINI Coefficient Across Various Nations
Income Distribution: Although Chile has made some progress over the past 20 years in terms of reducing its Gini coefficient, income inequality remains very high. Chart I-2 shows that even though the Gini coefficient has drifted lower it remains high. A falling/low Gini coefficient entails diminishing/ low inequality. Among OECD nations, Chile currently stands as one of the most unequal countries in terms of income distribution (Chart I-3), only surpassed by South Africa. Moreover, it also ranks as the fourth country with the highest P90/P10 disposable income ratio, which is defined as the ratio of the top 10% of the income distribution (wealthiest individuals) versus the bottom 10% (poorest individuals) (Chart I-4). According to CADEM, Chileans cite income inequality as the number one reason for the civil unrest. Chart I-3Chile: High Income Inequality Relative To Other Nations
Chile: A Paradigm Shift
Chile: A Paradigm Shift
Chart I-4Disposable Income Is Highly Concentrated In Chile
Chile: A Paradigm Shift
Chile: A Paradigm Shift
Tax policy: Chile has the lowest corporate tax rate in Latin America (Chart I-5A). This has made the country an attractive destination for large international conglomerates, as well as incentivized investment by domestic corporations. Yet, it has also exacerbated income inequality and capped the government’s capacity to fund social programs and education. Moreover, even though the top personal marginal tax rate in the country is in line with those in the rest of Latin America, it still falls short compared to the OECD average (Chart I-5B). Overall, Chile has low tax rates for individuals and corporations. Low tax rates are typically correlated with a higher degree of income and wealth inequality, as public investment in social services is sacrificed at the expense of shareholders/business owners. Chart I-5AChile: Low Corporate Tax Rates
Chile: A Paradigm Shift
Chile: A Paradigm Shift
Chart I-5BChile: High Incomes Are Not Taxed Heavily
Chile: A Paradigm Shift
Chile: A Paradigm Shift
Oligopolies versus SMEs: Even though Chile is perceived to be a very business friendly economy, the country still lacks a high level of competition that is present in many OECD countries. In particular, small and medium enterprises (SMEs) are disfavored against large businesses. SMEs in Chile suffer from high interest rates on their loans relative to large firms and from excessive regulatory burdens (Chart I-6). Likewise, government support for new and existing companies is quite dismal. Among OECD members, Chile has the second-lowest direct government funding and tax incentives for businesses. These barriers to new businesses have allowed large domestic and international companies to dominate the marketplace and accumulate wealth at the expense of small businesses and individual entrepreneurs. The latter has contributed to the discontent with the economic and political elites. Chart I-6Small And Medium Businesses Are In An Inferior Position
Chile: A Paradigm Shift
Chile: A Paradigm Shift
Chart I-7Workers' Share Of Income Is Depressed
Workers' Share Of Income Is Depressed
Workers' Share Of Income Is Depressed
Employees’ share of national income: The share of wages and salaries of national income has been between 36-40% while operating profits have hovered around 50% (Chart I-7, top panel). By comparison, in the US, wages and salaries make up 54% of GDP, while corporate profits amount to just 24% (Chart I-7, bottom panel). Such a small share of the pie going to employees in Chile explains the popular discontent against the economic elite. Lack Of A Social Safety Net Over the past few weeks, Chilean protesters’ key demands have been a restructuring of social security programs, more investment in healthcare and increased funding for public primary and secondary education. Essentially, Chileans want the state to play a larger role in securing basic social services. Pension System: Once highly praised by institutions such as the IMF and World Bank as well as many renowned economists as a revolutionary system to guarantee pensions with a minimal impact on public finances, Chile's problematic pension system is currently one of the most dire economic issues facing the country. Mandatory pension contribution rates are among the lowest in the world. New retirees are facing the consequences of a fully employee-based contribution plan, under which the government claimed people would be able to retire with a very high share of their salary. However, average retirees are currently receiving monthly pension payments equivalent to or less than the minimum wage. Among OECD nations, Chile currently stands as one of the most unequal countries in terms of income distribution, only surpassed by South Africa. Low government spending on social programs: Government expenditures on social programs as a percentage of GDP is among the lowest in the OECD. Moreover, Chile ranks at the bottom in terms of cash transfers as a percentage of disposable income (Chart I-8). The OECD defines cash transfers as the agglomeration of social payments such as unemployment insurance, pension benefits, education transfers and health subsidies. Chile also lags both advanced and developing economies when it comes to public spending on healthcare, pensions, education and unemployment benefits (Chart I-9). This has created a system in which lower- and middle-income employees must pay out-of-pocket for basic social services. In short, Chileans are protesting due to a lack of financial security. Chart I-8Chileans Don’t Receive Help From The Government
Chile: A Paradigm Shift
Chile: A Paradigm Shift
Chart I-9Public Expenditure On Social Programs
Chile: A Paradigm Shift
Chile: A Paradigm Shift
Stagnating Income Growth Real GDP per capita has been stagnating in Chile in recent years – its growth rate falling to its lowest level since the mid-1980s (Chart I-10). Real income per-capita growth is contingent on labor productivity growth, which has been consistently decelerating for two decades. The drop in productivity growth can be attributed to two factors. First, small and medium firms tend to be snubbed in favor of large domestic and international firms, as we discussed above. Yet SMEs have been successful in generating higher productivity growth than large ones (Chart I-11). The lack of preferential regulatory treatment and more expensive financing for SMEs has hindered their expansion and development, capping overall productivity growth. Importantly, SMEs employ 65% of the labor force, and their subdued expansion has resulted in weaker income growth across the nation. Chart I-10Labor Productivity Has Been Decelerating
Labor Productivity Has Been Decelerating
Labor Productivity Has Been Decelerating
Chart I-11Small Firms Are The Most Productive
Small Firms Are The Most Productive
Small Firms Are The Most Productive
Chart I-12Real Capex Has Stagnated
Real Capex Has Stagnated
Real Capex Has Stagnated
Second, real gross fixed capital investment has been stagnant since 2014 (Chart I-12). Falling capital expenditures lead to lower productivity and therefore stagnant real income levels as technology and production processes become antiquated. Further, large bouts of immigration, particularly from Venezuela, have expanded the labor force and dampened wage growth among middle- and low-income workers. As a share of the population, foreign-born residents have risen from 2.3% in 2015 to 7% in 2019. This influx of new workers has also expanded non-formal employment. Notably, labor informality in Chile is presently 30% of employment. While these workers do not declare taxes on their income, their salaries tend to be lower than the minimum wage, and they do not qualify for social programs such as social insurance and healthcare. This has dampened employee income growth and promoted a sense of financial insecurity. Where Is Chile Headed? The government will ultimately meet the popular demands of protesters, albeit not immediately. We expect Chile to move towards a Welfare State-style of government, but not towards Socialism. Under a Welfare State system the government prioritizes the provision of a social security net, such as healthcare, state-funded education and generous pension benefits and unemployment insurance, while not interfering in the functioning of the economy and/or financial markets. Chile also lags both advanced and developing economies when it comes to public spending on healthcare, pensions, education and unemployment benefits. In the past decade, mandataries from both sides of the political spectrum – both the ruling and opposition parties – have been reluctant to finance a larger social security net. Yet Chile can actually afford to do so. First, Chile has a low tax burden as a percentage of GDP and has ample room to expand taxation (Chart I-13). Second, at 27% of GDP, Chile’s public debt is among the lowest in the world (Chart I-14). 40% of if its public debt is local currency and 42% is inflation-linked. Its fiscal overall and primary budget deficits are 2.2% and 1.2% of GDP, respectively. Chart I-13Chile's Government Budget Is Small
Chile's Government Budget Is Small
Chile's Government Budget Is Small
Chart I-14Chile: Gross Public Debt Is Minimal
Chile: Gross Public Debt Is Minimal
Chile: Gross Public Debt Is Minimal
Therefore, to finance these social policies, the government can raise marginal tax rates for wealthy individuals and large corporations, and it can issue more debt. Given the starting point of government debt is so low, Chile is not facing a fiscal crunch in the foreseeable future. In the meantime, without substantial reforms in social spending and the pension system, it will be difficult to pacify protesters. Investment Recommendations The peso: We continue recommending shorting the peso versus the US dollar. Chart I-15Chilean Equities: More Downside
Chilean Equities: More Downside
Chilean Equities: More Downside
Chart I-16Chilean Equities Are Inexpensive
Chilean Equities Are Inexpensive
Chilean Equities Are Inexpensive
Equities: Stay neutral on this bourse within an EM equity portfolio. While the outlook is still downbeat, it may be too late to move to underweight. Chilean equities in US$ terms have already broken below their 6-year and 12-year moving averages (Chart I-15). We argued in an October Report that the protests imply a structural de-rating for Chilean equities. Chilean stocks have always traded at a premium versus the EM aggregate, mainly due to the perceived socioeconomic stability of the country and the extreme orthodox liberal policies that were pursued in the past 30 years. According to our Cyclically-Adjusted P/E ratio, Chilean equities are inexpensive (Chart I-16). Another 16% drop in share prices in local currency terms will push this valuation ratio to one standard deviation and a 58% decline to two standard deviations below fair value. Chart I-17Take Profits On Swap Rates
Take Profits On Swap Rates
Take Profits On Swap Rates
Fixed income: Today we are closing our recommendation of receiving 3-year swap rates. The rationale is that as the peso continues to depreciate, it is likely that interest rates may rise further in the near term. This position was initiated on May 31st, 2018 and has produced a gain of 125 basis points (Chart I-17). Juan Egaña Research Associate juane@bcaresearch.com Arthur Budaghyan Chief Emerging Markets Strategist arthurb@bcaresearch.com Footnotes