Geopolitics

Feature “Bayesian: …statistical methods that assign probabilities or distributions to events…based on experience or best guesses before experimentation and data collection and that apply Bayes' theorem to revise the probabilities and distributions after obtaining experimental data.” — Merriam-Webster Dictionary Markets have reacted pretty rationally to the outbreak of the COVID-19 virus. Equities initially rebounded a few days ahead of the peak of new cases in China (Chart 1). But then, once the number of cases in the rest of the world started to accelerate, stock markets sold off again sharply. The MSCI All Country World Index is now down 13% from its peak on February 12. Recommended Allocation
Monthly Portfolio Update: A Classic Bayesian Dynamic
Monthly Portfolio Update: A Classic Bayesian Dynamic
Chart 1Markets Have Reacted In Line With New COVID-19 Cases
Monthly Portfolio Update: A Classic Bayesian Dynamic
Monthly Portfolio Update: A Classic Bayesian Dynamic
No one knows whether this episode will turn into an unprecedented pandemic, which will kill millions worldwide, last for months, and trigger a global recession. So it is the sort of environment in which Bayesian analysis becomes useful. Our “prior” for the probability of a full pandemic would be around 10-20%. If it doesn’t happen, an attractive buying opportunity for risk assets should present itself soon. But there could be further downside first, especially if the number of cases in major countries such as the US, Germany, and the UK were to accelerate significantly. There are some sign that Chinese activity is beginning to recover. There are some signs that Chinese activity is beginning to recover, as new cases of COVID-19 slow, thanks to the draconian measures taken by the authorities. Big Data can help analyze this. For example, live traffic statistics from TomTom show that by February 28, weekday road congestion in Shanghai was back to 50% of its normal level, compared to 19% on February 14 (Chart 2). The Chinese authorities have relaunched fiscal and monetary stimulus, causing short-term rates to fall to their lowest level since 2010 (Chart 3). Monetary policy has been upgraded from “prudent” to “flexible and moderate.” BCA Research’s China strategists believe there is even an increasing possibility of a stimulus overshoot in the next 6-12 months, as the authorities plan for the worst-case scenario but the economy rebounds.1 Chart 2Chinese People Getting Back On The Roads
Monthly Portfolio Update: A Classic Bayesian Dynamic
Monthly Portfolio Update: A Classic Bayesian Dynamic
Chart 3Chinese Stimulus Pushing Down Rates
Monthly Portfolio Update: A Classic Bayesian Dynamic
Monthly Portfolio Update: A Classic Bayesian Dynamic
In the short-term, it is clear that global growth will weaken, though quantifying this is hard. A 1% quarter-on-quarter decline in Chinese GDP in Q1 would bring growth down to 3.5% year-over-year. Our colleagues in BCA’s Global Investment Strategy estimate this would cause global growth to fall 0.8% below trend in Q1, mainly from a contraction in tourism, but that this would be largely made up in Q2, assuming that the epidemic is over by then (Chart 4).2 Could even a limited epidemic tip the world into recession? We doubt it. Consumer confidence remains strong in developed economies (Chart 5) and the virus is not yet serious enough to stop most consumers going out to spend. The global economy was in the process of bottoming out before COVID-19 hit (Chart 6) and there is little reason to think that we will not return to the status quo ante. Chart 4Global Growth To Slow In Q1, But Rebound In Q2
Monthly Portfolio Update: A Classic Bayesian Dynamic
Monthly Portfolio Update: A Classic Bayesian Dynamic
Chart 5Consumers Remain Confident
Monthly Portfolio Update: A Classic Bayesian Dynamic
Monthly Portfolio Update: A Classic Bayesian Dynamic
Chart 6Before COVID-19, Growth Was Bottoming Out
Monthly Portfolio Update: A Classic Bayesian Dynamic
Monthly Portfolio Update: A Classic Bayesian Dynamic
We see the two biggest risks being: 1) a rise in defaults in China, especially among smaller companies, that the government is unable or unwilling to prevent (Chart 7); and 2) a deterioration in the jobs market in the US, as companies start to postpone hiring, or lay off staff (Chart 8). We will watch these carefully over coming weeks. Chart 7Are Chinese Companies Vulnerable?
Monthly Portfolio Update: A Classic Bayesian Dynamic
Monthly Portfolio Update: A Classic Bayesian Dynamic
Chart 8Is The US Job Market Starting To Wobble?
Monthly Portfolio Update: A Classic Bayesian Dynamic
Monthly Portfolio Update: A Classic Bayesian Dynamic
Chart 9Markets Believe Trump Would Beat Sanders
Monthly Portfolio Update: A Classic Bayesian Dynamic
Monthly Portfolio Update: A Classic Bayesian Dynamic
There is one other risk that might give equity markets an excuse for a further sell-off: November’s US presidential election. The probability that Bernie Sanders wins the Democratic nomination has risen to 60% from 15% over the past two months. The consensus believes that Trump can easily defeat Sanders, which is why the President’s probability of being reelected has risen in tandem (Chart 9). But, if the economy starts to weaken and Trump’s approval rating slips, investors could become nervous about the likelihood of a market-unfriendly Sanders administration. We would not recommend long-term investors sell out of risk assets at this point. There could be an attractive buying opportunity over the next few weeks, and investors who have derisked should be looking for a reentry point. With US 10-year bonds yields at 1.2% and German yields at -60 basis points, it is hard to see much further upside for risk-free bonds. Equities should be able to outperform over the next 12 months, as growth rebounds following the COVID-19 episode. We have been recommending overweights in cash and gold, as hedges, since December, and these still make sense. However, if events over the coming weeks point to the risk of global pandemic being higher than we currently think, then investors should Bayesianally adjust and move more risk-off. Otherwise, a peak in COVID-19 cases ex-China should be a strong signal to buy risk assets again. Chart 10Why Should Long-Run Inflation Expectations Fall?
Monthly Portfolio Update: A Classic Bayesian Dynamic
Monthly Portfolio Update: A Classic Bayesian Dynamic
Fixed Income: US Treasurys have become investors’ safe haven of choice over the past few weeks. A marked drop in long-run inflation expectations (Chart 10), in particular, has pushed the 10-year yield to a record low. This seems somewhat illogical, since the Fed will announce this summer the results of its review of monetary policy, which is likely to lead to a more dovish long-term inflation target (perhaps a commitment to achieve 2% on average over the cycle). The market has also priced in at least three Fed rate cuts by year-end (Chart 11). The Fed will certainly cut rates if US growth falters as a result of COVID-19, but this is by no means a certainty. History shows that Treasury yields jumped sharply once previous viral outbreaks ended (Chart 12). We expect yields to be significantly higher in 12 months, and so are underweight duration and prefer TIPS over nominal bonds. Credit will continue to underperform in the risk-off phase, but some interesting opportunities should arise soon, especially among the lowest-rated credits and in the Energy sector. Chart 11Will The Fed Really Be This Accommodating?
Monthly Portfolio Update: A Classic Bayesian Dynamic
Monthly Portfolio Update: A Classic Bayesian Dynamic
Chart 12After Previous Virus Outbreaks, Rates Leapt
Monthly Portfolio Update: A Classic Bayesian Dynamic
Monthly Portfolio Update: A Classic Bayesian Dynamic
Equities: The sell-off has already put on fire sale some stocks most affected by the epidemic. For example, cruise lines are down by 40% over the past month or so, European oil stocks 25%, some luxury goods makers 30%, and airlines 30%. Opportunistic investors might want to buy a basket of the most oversold quality names. Our overweight on euro area stocks has not worked in the sell-off. But, as a cyclical, export-oriented market, we continue to expect Europe to outperform when global growth rebounds. Euro area banks, in particular, represent the best call option on a rise in bond yields, since their performance is highly correlated to the shape of the yield curve. We continue to have a somewhat cyclical tilt among our sector weightings (with overweights on, for example, Energy and Industrials), but may adjust this in our Quarterly Portfolio Outlook in early April if we decide to reduce risk. The sell-off has already put on fire sale some stocks most affected by the epidemic. Currencies: The dollar is a safe-haven currency and so, unsurprisingly, has benefitted from the rush to safety in recent weeks. However, it remains overvalued (Chart 13), and interest rate differentials would move further against it if the Fed does cut rates, since other major developed central banks have much less room to move (Chart 14). This suggests that it will probably resume the weakness it experienced from August to December last year as soon as global growth rebounds. Chart 13Dollar Is Overvalued...
Monthly Portfolio Update: A Classic Bayesian Dynamic
Monthly Portfolio Update: A Classic Bayesian Dynamic
Chart 14...And Interest Differentials Have Moved Against It
Monthly Portfolio Update: A Classic Bayesian Dynamic
Monthly Portfolio Update: A Classic Bayesian Dynamic
Chart 15Metals Prices Stabilized In Recent Weeks
Monthly Portfolio Update: A Classic Bayesian Dynamic
Monthly Portfolio Update: A Classic Bayesian Dynamic
Commodities: Industrial metals fell sharply on the outbreak of COVID-19 in China, but have bottomed in line with the stabilization of the situation in that country (Chart 15). Gold has worked predictably as the best hedge in the sell-off. While it is starting to look technically overbought and would be hurt by a rise in bond yields (Chart 16), for prudent investors it remains a useful hiding place amid heightened risk and ultra-low interest rates. Oil is the commodity that has fallen the most surprisingly, with Brent close to the low it reached during the sell-off in December 2018 (Chart 17). It is much less dependent on Chinese demand than metals are, and so is maybe pricing in a global recession – as well as questioning the commitment of OPEC to cut production further. This would suggest upside to the oil price if global growth turns out not to be so bad, oil demand continues to pick up, and supply remains constrained. Chart 16How Much Could Gold Overshoot?
Monthly Portfolio Update: A Classic Bayesian Dynamic
Monthly Portfolio Update: A Classic Bayesian Dynamic
Chart 17Oil Discounting A Global Recession
Monthly Portfolio Update: A Classic Bayesian Dynamic
Monthly Portfolio Update: A Classic Bayesian Dynamic
Garry Evans, Senior Vice President Chief Global Asset Allocation Strategist garry@bcaresearch.com Footnotes 1 Please see China Investment Strategy Weekly Report, “China: Back To Its Old Economic Playbook?” dated 26 February 2020, available at cis.bcaresearch.com 2 Please see Global Investment Strategy Weekly Report, “Market Too Complacent About The Coronavirus,” dated 21 February 2020, available at cis.bcaresearch.com GAA Asset Allocation
Highlights We spent last week meeting with clients in South Africa, who maintained their equanimity despite the spread of the coronavirus: Maybe it was because there were not yet any reported cases close to home, but investors discussed the global outbreak dispassionately. We repeated our view that a US recession is not imminent, ex-a significantly adverse exogenous event: Tight monetary policy is a necessary precondition of a recession, and there’s no reason to expect that the Fed will make any move to remove accommodation in 2020. Investors were open to our view that the US economy is subject to upward inflation pressures, even if the time is not yet ripe for them to manifest themselves: Excess global capacity is still thwarting goods inflation, but it appears to be on its way to being absorbed. In the meantime, the Fed is deliberately encouraging the economy to run hot. Inflation just might surprise investors who have been lulled to sleep by its post-crisis absence. The presidential election is a hot topic in South Africa, too: The Democratic nomination appears to be Bernie Sanders’ to lose, and he has more of a chance in the general election than investors might expect. Feature We spent last week meeting with clients in South Africa. They expressed considerably more optimism about financial markets and the global economy than they did on our previous visit in January 2019, though we all conceded that the coronavirus outcome was unknowable. We discussed a wide range of topics, with COVID-19, recession prospects, the inflation outlook, and November’s election coming up in nearly every meeting. A summary of our discussions, organized by topic, follows below. Coronavirus Impressions We discussed the coronavirus at the beginning of every meeting, albeit after acknowledging that no one can know for sure how it will unfold. We discussed the virus’ potential outcomes, our base-case expectation, and the news and data we’re monitoring to track its course. Everyone is familiar by now with the best- and worst-case scenarios, and the continuum of possibilities in between, so we will not rehash them here. The main variables we have been watching – infection, mortality and recovery rates – are also surely familiar. From a review of those metrics within China – the daily rate of new incidences inside and outside of Hubei province (Chart 1), mortality (Chart 2) and recovery rates (Chart 3) within and without Hubei – there is good reason to conclude that China is gaining the upper hand, having sharply limited the virus’ spread beyond Hubei, and steadily slowing its spread in the epicenter. Chart 1Stringent Quarantine Measures Seem To Have Gotten Some Traction
Road Trip
Road Trip
Chart 2Mortality Rates Are Inconclusive, ...
Road Trip
Road Trip
Chart 3... But Recovery Rates Are Encouraging
Road Trip
Road Trip
Unfortunately, however, other countries cannot perfectly replicate China’s template for corralling the virus, as their governments have considerably less ability to limit their citizens’ movements. It is a lot easier to impose and enforce a quarantine or other emergency restrictions in China than it is in any other major country. It is important, then, to consider not just the number of countries to which the virus spreads, but the characteristics of the countries themselves. In this sense, Italy and Iran may offer some insight. The Italians reacted swiftly and decisively when the first cluster emerged in northern Italy. They drew a circle with a large radius around the cluster, restricted movement in and out of that circle, and sharply limited activities within it. Carnival celebrations in Venice were called off, and Sunday’s slate of matches in Italy’s Serie A professional soccer league were cancelled (subsequent matches are being played in empty stadiums). Although the number of reported infections in Italy has been rising, and infections have begun to pop up in western and central Europe, Italian officials appear to have both the ability and the will to contain it. The Iranian experience contrasts with Italy’s. In Iran, the mortality rate (deaths divided by confirmed cases) is roughly five times greater than it has been everywhere else the virus has erupted. That seems improbably high, and our best guess is that the infections denominator is being undercounted. A country that cannot provide a reliable count (or a reasonably accurate estimate) of infections presumably lacks the public health infrastructure to contain the virus. We conclude that it matters where the infections occur – the wealthy countries of western Europe, North America, Asia and Oceania likely have a better chance of bringing the virus to heel than developing countries. Our interactions in South Africa, among the wealthiest countries in the developing world, may further reinforce the point. In several meetings, clients asked what entering the country was like. I told them that when I arrived at the Johannesburg airport on the morning of Sunday the 23rd, all passengers from international destinations had to pass by a screener who pointed a clunky object shaped like a radar gun in the vicinity of their nose and forehead. Several planes had landed just before mine and the passport control line wound around three or four times, affording repeated opportunities to look over the radar-gun employee’s shoulder at the images on her screen. They appeared to be simple black-and-white video of the arriving passengers without any color imagery to indicate body temperature ranges. The clients uniformly laughed at that detail, exclaiming that of course the screening was ineffectual. They then soberly conceded that Africa is especially vulnerable to an outbreak. If the coronavirus or another severe adverse exogenous event doesn't do it, it will take restrictive monetary policy to induce a recession. Infections outside of China are rising with no end yet in sight (Chart 4), but the news isn’t all bad. There are some promising treatment developments that may yield effective therapies, either from the conventional drug that worked wonders on an infected patient in Washington State and is now being tested on infected groups in China, or from antibody-based therapies of the type that were successfully deployed against Ebola. Our own views are conditional upon COVID-19’s evolution, but our current base case is that it is more likely to produce a soft patch within the context of a global expansion, and a correction within the context of a continuing equity bull market, than it is to trigger a recession or a bear market. Chart 4Now It's The Rest Of The World's Turn
Road Trip
Road Trip
Recession Prospects Chart 5Necessary, If Not Sufficient
Necessary, If Not Sufficient
Necessary, If Not Sufficient
Nearly every client asked us about the prospects for a US recession. We discussed how the negative term premium had made the yield curve more prone to invert, thereby diluting its predictive value, and asserted our view that restrictive monetary conditions are a necessary precondition of recessions (Chart 5). We touched on the rest of the points covered in last week’s report, which argued that a strong near-term outlook for consumption, dependable government spending and a post-trade-tensions recovery in investment would keep the US out of recession over a 12-month horizon. But we spent the most time outlining what we see as the most likely route to the next recession. Expansions don’t die of old age, they die because the Fed murders them, and we told our clients that we expect that maxim will be especially apropos in this cycle. Investors should therefore focus on the factors that will prod the Fed to embark on a tightening cycle with the express intent of reining in an overheating economy. We see two main catalysts: concern that inflation may get away from the Fed on the upside (discussed in the following section), and/or concern that there are unsustainable excesses in either the economy or financial markets. Chart 6The Real Economy Isn't Close To Overheating
The Real Economy Isn't Close To Overheating
The Real Economy Isn't Close To Overheating
We contend that there are currently no signs of excesses in the real economy. Its most cyclical elements, which have driven overheating in the past, have not gotten back to their mean level, much less the red-line levels that have been associated with previous business cycle peaks (Chart 6, top panel). Proportional spending on consumer durables remains around the bottom of its 60-year range (Chart 6, second panel), investment in non-residential structures is quite low relative to history and comfortably in the middle of its post-1990-91-recession range (Chart 6, fourth panel), and residential investment is sitting at the level that previously marked business-cycle troughs (Chart 6, bottom panel). The only cyclical activity that looks a little frisky is equipment and software spending (Chart 6, third panel), which has the best chance of enhancing productivity and thereby yielding ongoing dividends. Financial market excesses are in the eye of the beholder, and reasonable people can disagree about their existence. The promiscuous application of the word “bubble” to anything and everything market related, however, has become as familiar and tiresome as rappers’ boasts of their prowess. The S&P 500’s steady climb higher doesn’t begin to approach the manic paths of prior decades’ hot assets (Chart 7). The key takeaway is that the economic or financial overheating likely to trigger the expansion’s ultimate denouement is yet to arrive. Until it does, the Fed will have no reason to intervene to stop it. Chart 7Which One Of These Is Not Like The Others?
Which One Of These Is Not Like The Others?
Which One Of These Is Not Like The Others?
Inflation Prospects Many clients asked about inflation prospects before we could bring up the subject, a notable turnabout from our last visit thirteen months ago, when our arguments for accelerating wage gains met mostly with indifference. We were happy to oblige, as inflation occupies an essential place in our base-case cyclical scenario. Tight monetary policy is a necessary precondition for an endogenously occurring recession. Ex-a severe exogenous shock, like a global pandemic, the expansion cannot end without tight monetary conditions, and the Fed won’t knowingly impose them unless it is concerned that inflation is getting away from it on the upside. Q: Why has there been no whiff of US inflation in the last eleven years? A: Because the negative US output gap rendered it impossible until 2018. We are not daunted by inflation’s post-crisis hibernation. Meaningful price increases at the level of the entire economy cannot occur when an economy has a negative output gap (aggregate demand persistently falls short of economic capacity) unless its currency is sliding and it imports a lot of goods and services. From that perspective, inflation has only been possible in the US since 2018, because it didn’t close its output gap until 2017, according to estimates from both the IMF and the CBO. 2018 was the year that the US embarked on an unprecedented macroeconomic experiment (Chart 8), injecting fiscal stimulus amounting to one half of the economy’s long-run capacity (about 100 basis points) at a time when it was already operating at full capacity (2-2.25%). If corporations and other businesses viewed the surge in aggregate demand as a one-off event that couldn’t be replicated in the future, they would likely choose not to invest in additional capacity to meet it. The net result was demand in excess of supply in 2018 and in 2019, when an additional 50 basis points of stimulus was deployed. Inflation did not break out in either year, but negative output gaps in the rest of the developed world provided the US with the convenient out of importing other countries’ excess capacity. Chart 82018's Unprecedented Macroeconomic Experiment May Yet Produce Inflation
2018's Unprecedented Macroeconomic Experiment May Yet Produce Inflation
2018's Unprecedented Macroeconomic Experiment May Yet Produce Inflation
The Bank of Canada estimated that Canada closed its output gap in 2018, and the IMF estimates that Europe’s output gap has now closed (Chart 9, top panel), and while even Japan has made a lot of progress on narrowing its output gap (Chart 9, bottom panel). Goods inflation is largely globally determined, and with excess capacity being absorbed around the world, it’s possible that the conditions that would allow for higher goods prices could soon lock into place. Services inflation, a predominantly domestic phenomenon, is poised to rise thanks to the tight-as-a-drum labor market. Just when inflation will rear its ugly head is uncertain, however, as it is a lagging indicator that often doesn’t peak, until a recession has nearly ended, or trough for nearly three years after a recession begins (Chart 10). Chart 9The Slack Is Being Absorbed
The Slack Is Being Absorbed
The Slack Is Being Absorbed
Chart 10It May Take A Long Time For 2018's Seeds To Germinate
Road Trip
Road Trip
We find supply and demand arguments compelling, and the excess-supply constraint on global goods inflation has quietly been easing. The bottom line is that we think the US economy harbors upward inflation pressures, though it is highly unlikely that they will manifest themselves this year. That will give the Fed free rein to allow the economy to run hot across all of 2020, in service of its primary goal of pushing inflation expectations higher, and the labor market as well, in service of its secondary goal of spreading the benefits of easy policy more evenly across the economy. The upshot is that the longer inflation remains outwardly dormant, the harder it will be to root it out once it eventually does begin to bloom. The World Is Watching American Voters As an indication of the anticipation surrounding November’s election, South African investors, who recognized Bernie Sanders’ name, asked about it in every meeting. We laid out our geopolitical strategists’ views, augmented in places by our own, on the key issues as follows: Presidential elections are referendums on the incumbent party. An incumbent president running for re-election has a sizable built-in advantage. In the postwar era, only major economic, social or international shifts have been sufficient to erode that advantage. Incumbents lose when a recession occurs near an election, but the president has to be considered a favorite if the expansion continues. The president may be an especially poor front-runner. Donald Trump personifies variability. That’s a great trait to have as an underdog, because a wide dispersion of individual outcomes broadens the range of possible competitive outcomes, but it’s a vulnerability for a favorite. It is nearly impossible for a golfer with a two-stroke lead ahead of the final par-four eighteenth hole to lose if s/he conservatively plays for par. It seems to us that the president is not wired to play conservatively, and our geopolitical strategists currently give him just a 55% chance of re-election. Bernie Sanders is not unelectable. Our geopolitical strategists note that the median voter is moving to the left, and that Sanders is many Biden supporters’ second choice. He may not be anathema to the broader public in the general election, and his leveling platform may play well in the Rust Belt states that are poised to decide the election once again. A Sanders administration would not transform America into France, but it would chip away at corporate profits. Our personal view is that a President Sanders would not mark the end of the US as a beacon of free enterprise. The Constitution was designed to obstruct dramatic changes, and his ability to pass major legislative initiatives is likely exaggerated. We think he could make his influence felt much more directly in the bureaucratic and regulatory spheres, where a president can act virtually unimpeded. A Sanders administration would be a devoted and presumably activist friend of labor, and a tenacious foe of corporate concentration. An administration that energetically champions organized labor and vigorously enforces anti-trust statutes would exert downward pressure on corporate profit margins. Bullish Or Bearish Borrowing a line from longtime Street economist and strategist Ed Yardeni, our mandate is bullish or bearish, not good or bad. We are charged with making objective decisions about what is most likely to occur in markets, not to daydream about what we would most like to happen. Our base-case scenario turns on our expectation that accommodative monetary policy will remain in place until well into 2021, and will continue to be effective in forestalling defaults and inflating asset valuations. It may not be the most comforting basis for being long risk assets, and we make no implied endorsement of its quality, but if we think it’s going to continue to work beyond the edge of the visible horizon, then we have to reiterate our recommendation that investors should remain at least equal weight equities in multi-asset portfolios, and at least equal weight credit in fixed income portfolios. Austrian adherents and self-styled monetary policy experts can howl about moral hazard and manipulation all they want, but we have to invest in the backdrop that we have, not the backdrop that we want. We do not yet see the approach of a catalyst that will prevent life insurers, pension funds, endowments and other investors who need yield from continuing to go further out the risk curve in search of it. And we don’t yet see the approach of a catalyst that will prevent equity investors from continuing to bid multiples higher. We remain constructive over the cyclical twelve-month timeframe. Doug Peta, CFA Chief US Investment Strategist dougp@bcaresearch.com
Highlights It is too soon to bottom feed with fears of a global pandemic and “socialist” boom in the United States. China’s government will do “whatever it takes” to stimulate the economy – but animal spirits need to revive for it to work. European political risk and policy uncertainty are clearly on the rise, albeit from low levels. Bernie Sanders could become the presumptive nominee for president on Super Tuesday – if Biden fails to make a comeback. The market is underrating the Sanders risk to US equities – particularly tech and health. Assuming pandemic fears subside, the Fed put, the China put, and the Trump reflation put will fuel risk-on sentiment in H2 2020. Feature Chart 1Risk-Off Mood Dominates Markets...
Risk-Off Mood Dominates Markets...
Risk-Off Mood Dominates Markets...
Financial markets awoke to the confluence of negative news this year on February 20. The S&P 500 has fallen 8.0% from this year’s peak while the 10-year US Treasury yield dove to 1.33%. Gold reached the highest level since 2013. The yield curve inverted again (Chart 1). It is too soon to buy into the equity selloff. Fear of the coronavirus is spreading, not abating, while Vermont Senator Bernie Sanders – a democratic socialist who would turn the regulatory pen against corporations – is running away with the Democratic Party’s nomination for US president. Chart 2...Amid Fears Over Coronavirus And Sanders
...Amid Fears Over Coronavirus And Sanders
...Amid Fears Over Coronavirus And Sanders
The market selloff is well correlated with fear of the coronavirus, but there is also some correlation with Sanders’s success (Chart 2). This should intensify if Sanders becomes the presumptive nominee following “Super Tuesday,” March 3, by which time 39% of the Democratic Party delegates will have been chosen. Sanders poses a more systemic risk to corporate profits than the virus as he emblematizes a generationally driven sea change looming over US national policy: a shift from capital to labor. A greater tightening of financial conditions would prompt the Federal Reserve to cut interest rates, possibly as soon as its meeting on March 17-18. But the Fed is not yet signaling cuts. Also, cuts may not pacify the market as easily this time as in the last major pullback in Q4 2018. Tightening monetary policy was the culprit for that selloff and therefore the Fed’s policy reversal on January 4, 2019 gave the market just what it needed to rally. Today the Fed has no control over the causes: virus fears and “socialism.” President Trump is manifestly uneasy as the virus spreads. Anything that weakens the US manufacturing sector is a direct threat to his reelection, regardless of how he spins it. The statewide coincident indicators provided by the Philadelphia Fed show that Pennsylvania’s economy is deteriorating, while a relapse in Michigan will push it into the Democratic camp according to our quantitative election model. This would leave Trump with only Wisconsin standing between him and the shame of a one-term presidency (Chart 3). Chart 3Trump’s Narrow Victory At Risk Of Virus-Induced Slowdown
GeoRisk Update: Leap Year, Or Steep Year?
GeoRisk Update: Leap Year, Or Steep Year?
What can Trump do to feed the markets and economy some good news? Not much. The Democrats control the House of Representatives and will refuse any fiscal stimulus unless a total collapse is occurring, in which case Trump is doomed anyway. Given the strong dollar, the Fed’s reluctance to cut rates, and Trump’s paternalist proclivities, we can fully envision him attempting to strong-arm the Treasury Department into intervening against the dollar. But intervention would have a fleeting impact without Fed cooperation – and again, the economic crisis required for the Fed to intervene decisively would likely seal Trump’s fate regardless. What remains for Trump is his ability to enact surprise “rate cuts” of his own via tariff rollback on China. This is fully within his power. All he has to do is hold a phone conference with Xi Jinping and then declare that China is complying with the “phase one” trade deal in good faith and therefore deserves assistance amid the coronavirus economic shock. But the impact of a positive tariff surprise would be limited. And such rate cuts are likely to be reactive rather than proactive, as with the Fed. We shifted to a cautious, neutral stance on global risk assets on January 24 and we maintain that position. China is stimulating the economy, meaning that the dominant trend in H2 should be a global “risk on.” Thus we are keeping our China and emerging market trades open. But volatility will likely remain elevated through March, at minimum, given the toxic combination of a slowing global economy and an increasingly likely Sanders nomination. China Stimulus: "Whatever It Takes" Chart 4Xi Administration Is Getting Out The Big Guns
Xi Administration Is Getting Out The Big Guns
Xi Administration Is Getting Out The Big Guns
One near certainty of the coronavirus outbreak is that it will catalyze greater economic stimulus in China. Last year we argued that the trade war had derailed Beijing’s financial deleveraging agenda and hence that the risk of a stimulus overshoot was greater than an undershoot. The Xi Jinping administration limited the degree of reflation for most of the year, but by autumn it was incontrovertible: stabilizing growth and the labor market had taken priority over deleveraging. Local government bond issuance picked up and the government relaxed its grip on informal lending and the shadow banks (Chart 4). Now, with the coronavirus outbreak, the Xi administration is getting out the big guns. The People’s Bank of China has cut key interest rates below where they stood in 2015-16, the last major bout of stimulus (Chart 5), as our China Investment Strategy has noted. Beijing officials have announced they will dial up fiscal policy to build infrastructure and boost purchases of homes and cars. President Xi Jinping has personally assured the world that China will meet its economic growth target for the year. Compared with the 6.1% real GDP growth achieved in 2019, our China Investment Strategy believes a conservative estimate is 5.6% for 2020. Assuming China’s real GDP growth slows to 3.5% in Q1 on a year-over-year basis, China would need at least 6.3% average real growth year-over-year for the next three quarters to hit its target. This growth rate would be 0.3 percentage points higher than in the second half of 2019. Credit expansion and government spending in the next six-to-12 months would need to outpace that of last year. Will the government succeed in firing up demand? If getting back to work results in further outbreaks, then China may see greater difficulty in using its old-fashioned stimulus tools. Moreover Chinese households and corporates are more indebted than ever and have suffered a series of blows in recent years that have weighed on animal spirits: a political purge, slowing trend growth, corporate deleveraging, trade war, and now the virus. It is essential for consumer confidence and the velocity of money to keep recovering (Chart 6). Our Emerging Markets Strategy rightly insists that without a revival in animal spirits, stimulus will be pushing on a string. Chart 5Key Chinese Interest Rates Now Below 2015-16 Levels
Key Chinese Interest Rates Now Below 2015-16 Levels
Key Chinese Interest Rates Now Below 2015-16 Levels
Chart 6Animal Spirits A Precondition For Chinese Recovery
Animal Spirits A Precondition For Chinese Recovery
Animal Spirits A Precondition For Chinese Recovery
Yet it is also true that most of the negative shocks were policy decisions, especially deleveraging and trade war. With these decisions reversed – and likely to stay that way for at least this year – there is no reason to assume a priori that animal spirits will remain depressed. Furthermore, we see little room for the Xi administration to revert to tightening measures until a general economic recovery is well advanced. As we highlighted in our annual strategic outlook, it is necessary to stabilize the economy ahead of the 100th anniversary of the Communist Party in 2021 and – more importantly – the leadership reshuffle to take place in 2022. Chinese consumer confidence and the velocity of money need to recover for stimulus to have an impact. On a side note, Hong Kong is also implementing stimulus measures. This is positive for the city-state in the short run but it is unlikely to revive its fortunes over the long run. What made Hong Kong special was its position as a well-governed ally of the West during the heyday of globalization and the backdoor to mainland China during its rapid, catch-up phase of industrialization. Now globalization is slowing, Beijing is tightening central control, and the West has lost the appetite to defend its influence in Hong Kong. This influence is part and parcel with Hong Kong’s freedoms and privileges. This means that while the country’s equities can see a cyclical improvement we are structurally negative. Bottom Line: We are maintaining our cyclically constructive outlook on global growth and risk assets, as our view on China’s “Socialism Put” has been reinforced. We are keeping open our China Play Index and other EM trades. However, near-term risks are extremely elevated and our cyclical view could change quickly if the virus fear factor proves insurmountable for China and the global economy. China Sneezes, Europe Catches A Cold … And Its Immune System Is Weak Chart 7Our European GeoRisk Indicators Are Springing Back
Our European GeoRisk Indicators Are Springing Back
Our European GeoRisk Indicators Are Springing Back
The European economy was on track to rebound in 2020 prior to the coronavirus, but only tentatively, as sentiment and manufacturing were fragile. The virus struck at the heart of demand for European exports, China, and now is hitting European demand directly via the outbreak in Italy and across the continent. As fear of the virus spreads country by country, households and corporations will cut back on activity. It could take weeks or even months to resume business as usual. And it will take 6-12 months for China’s stimulus to kick in fully and lift demand for European goods. European political risk is thus no longer slated to remain subdued. Our indicators already show it is springing back. The most significant player is Germany, but Italy is the weakest link in the Euro Area, and non-negligible risks are affecting France, Spain, and the United Kingdom (Chart 7). German political risk will be highly market-relevant between now and the federal election slated for October 2021. De-globalization is a structural headwind for the German economy and Chancellor Angela Merkel’s attempt to stage manage a smooth succession has collapsed. The Christian Democratic Union is now plunging into a truly competitive leadership contest that will keep uncertainty elevated, at least until the aftermath of the election. Friedrich Merz is the leading contender (Chart 8) and is attempting to rope more conservative voters back into the Christian Democratic fold so that they do not stray into the populist Alternative für Deutschland (AfD). While a similar dynamic led the British Conservative Party into Brexit, German politics are less polarized than British politics. The Christian Democrats are nowhere near being overtaken by the far right. First, the CDU is still the most popular party and its closest competitors are the Green Party and the Social Democrats, while the AfD polls at 13.3% support and is opposed by all other parties. The AfD’s popularity, while growing, is still very small. Second, a majority of the public still approves of Merkel (Chart 9), signaling a tailwind for centrists within and without her party. Chart 8Merz Is The Top Contender In Germany’s Leadership Contest
GeoRisk Update: Leap Year, Or Steep Year?
GeoRisk Update: Leap Year, Or Steep Year?
Third, the German public is still the most supportive of the euro and EU, for the obvious reason that its economic success is integrally bound up in the union (Chart 10A). Nor is Germany alone, since the only country that looks truly concerning by these measures is Italy and even Italy’s populists remain engaged in the European project (Chart 10B). Chart 9Merkel's Popularity A Sign Of German Centrism
Merkel's Popularity A Sign Of German Centrism
Merkel's Popularity A Sign Of German Centrism
Chart 10ASupport For The Euro Still Strong (But Watch Italy) (I)
Support For The Euro Still Strong (But Watch Italy) (I)
Support For The Euro Still Strong (But Watch Italy) (I)
Chart 10BSupport For The EU Still Strong (But Watch Italy) (II)
Support For The EU Still Strong (But Watch Italy) (II)
Support For The EU Still Strong (But Watch Italy) (II)
Immediate economic challenges favor Merz’s bid to lead the party. However, if they do not give way to an economic rebound by fall 2021 (i.e. if Chinese and global growth worsen in the lead-up to the general election), then these challenges will undercut the Christian Democrats’ bid to remain in power regardless of whether Merz or a more dovish chancellor-candidate emerges from Merkel’s exit. The Green Party offers a viable alternative to lead the next government. Chart 11Coronavirus Will Weigh On France's Tourism Sector And Macron's Popularity
Coronavirus Will Weigh On France's Tourism Sector And Macron's Popularity
Coronavirus Will Weigh On France's Tourism Sector And Macron's Popularity
In the short run, Germany can ease fiscal policy marginally to help offset the current slowdown. But a game changer in fiscal policy will require either for the current economy to collapse or a resolution to the succession crisis. Finance Minister Olaf Scholz, of the Social Democrats, has just proposed a significant revision to the schuldenbremse, or “debt brake,” which keeps budget deficits pinned above -0.35% of GDP. He would allow Germany’s state and local governments to suspend the debt brake temporarily so as to boost fiscal spending to mitigate the slowdown. A formal suspension requires a constitutional change that would in turn require a two-thirds vote in both houses of the legislature. There are enough votes in the Bundestag and possibly in the Bundesrat but it requires the economic shock to get bigger first so as to force the conservatives to capitulate and court the help of smaller parties. Otherwise Scholz is making an election gambit to distinguish the Democratic Socialists from the fiscally conservative Christian Democrats. In the meantime, limited moves to loosen the belt are perfectly countenanced by existing law which allows for deviations from the debt brake during recessions and emergencies. France is also seeing a spike in political risk. President Emmanuel Macron has slogged through the massive labor strikes against his pension reform, as we expected. The reform would streamline a complex web of pension programs into a single national program, providing incentives for workers to work longer without making spending cuts. It will likely pass into law through his En Marche party’s control of the National Assembly. However, Macron’s political capital is spent and his party is expected to sustain heavy losses in municipal elections from March 15-22. The service-oriented economy will also suffer a blow from reduced tourism amid the coronavirus scare (Chart 11), further eroding Macron’s already low popularity. The loss of influence at home will reinforce Macron’s pivot to foreign policy. Macron can play the leader of Europe at a time when the UK is leaving and Germany is consumed with a leadership contest. In this role he will clash with the UK over Brexit and the US over trade – but this can only go so far given the need to sustain the French economy. Negotiations with the UK will involve brinkmanship but will result in a delay of the end-of-year deadline, or a deal, given the fragile economic backdrop affecting all players. Economic constraints also imply that negotiations with the US will not spiral into a major confrontation unless and until Trump is reelected. Therefore Macron’s gaze will turn to security and immigration, challenges that have the potential to fuel anti-establishment sentiment that could hurt him in the French election of 2022 and undermine his vision of a more integrated Europe. While terrorism has abated for the time being (Chart 12), the trend cannot be guaranteed. The Middle East is extremely unstable amid the global slowdown, virus, drop in oil prices, and general destabilization emanating from the underlying US-Iran conflict. Immigration is also starting to rise again, particularly along the western North African route into Spain and France that bypasses the fighting in Libya (Chart 13). Chart 12A Pickup In Terrorism Would Fuel Populist Sentiment...
A Pickup In Terrorism Would Fuel Populist Sentiment...
A Pickup In Terrorism Would Fuel Populist Sentiment...
Turkey’s foreign policy confrontation with the West threatens an increase in immigration in the east as well as a Turkish client-state in western Libya that France fears could become a militant safe haven. Chart 13...As Would An Increase In Immigration
...As Would An Increase In Immigration
...As Would An Increase In Immigration
France is therefore taking a harder line with Turkey and providing maritime assistance to Greece (see Chart 13 above). The Mediterranean is becoming a geopolitical hot spot that could lead to negative surprises – and not only for Turkish assets. European populism is under control for now but a new wave of immigration would spark a new wave of populism that would increase policy uncertainty and the risk premium in equities. Italy has shifted from being an overstated to an understated political risk. Chart 14Italian Right-Wing Parties Are Gaining Strength
Italian Right-Wing Parties Are Gaining Strength
Italian Right-Wing Parties Are Gaining Strength
Politically, Italy remains the weakest link in Europe – and this long-term risk is now becoming more pressing. Support for the euro and EU is among the weakest (see Chart 10 above). The ruling coalition is rickety and groping toward an election, with a popular referendum on the electoral law dated March 29. The country is poorly equipped to handle the virus outbreak. The virus will also call attention to the porous borders, fueling anti-establishment sentiment – after all the anti-establishment League is still the top party in polls while the right-wing Brothers of Italy’s support is surging (Chart 14). This is the case even though immigration into Italy is under control at the moment, particularly with renewed fighting in Libya discouraging flows through the central North African route. In short a full-fledged recession will unleash the furies in Italian politics and the country has shifted from being an overstated to an understated political risk. Bottom Line: The UK-EU trade talks threaten volatility for the pound this year, on top of the key continental risks: succession crisis in Germany, the potential for Macron’s centrist political movement to falter in France, and the possible election of a right-wing anti-establishment government emerging in Italy. Populist sentiment can emerge from the economic slowdown even if terrorism and immigration remain contained, but the recent uptick in immigration and new sources of instability in the Middle East, North Africa, and the Mediterranean show clouds gathering on the horizon. The Euro Area’s fiscal thrust is expected to be a measly 0.015% of potential GDP in 2020. The trends above suggest that this number could increase substantively, albeit reactively, due to fiscal easing in Germany and several other states along with France’s lack of real cuts in its pension reform. United States: Can A Northern Progressive Win In The South? In February 1980, Democratic presidential contender Jimmy Carter won the New Hampshire primary with 51% of the vote. Carter would go on to become the first Democrat from the Deep South to win the presidency since Woodrow Wilson. His triumph in New Hampshire proved, as he said, “that a progressive southerner can win in the North.” Fast forward to February 2020 and Vermont Senator Bernie Sanders, the most left-wing candidate vying for the nomination, is attempting to perform the equally dazzling feat of winning a primary election in the conservative southern state of South Carolina. If Sanders pulls it off then it will trigger an earthquake. For a progressive who can win in the South is likely to score big on Super Tuesday, March 3, and if Sanders pulls that off then he will become the country’s first “socialist” presumptive nominee for president (Chart 15). This would be a huge upset, primarily for former Vice President Joe Biden, who has long led the opinion polls in South Carolina and recently has even rebounded. Biden expects strong support from the African American community – which is staunchly Democratic, moderate in ideology, and favorable toward Biden due to his close association with former President Barack Obama. The problem is that Biden’s latest rebound in the polls may be too little, too late. He made more gaffes in the debate performance and, most importantly, Sanders’s polling has improved among African Americans (Chart 16). Chart 15A Sanders Win In The South Will Help Him Score Big On Super Tuesday
GeoRisk Update: Leap Year, Or Steep Year?
GeoRisk Update: Leap Year, Or Steep Year?
Chart 16Sanders’s Polling Has Improved Among African-Americans
GeoRisk Update: Leap Year, Or Steep Year?
GeoRisk Update: Leap Year, Or Steep Year?
Sanders performed well with almost every demographic in Nevada – if he can do well among blacks, and in the south as well as the north and west, then his ability to unify the party will be incontrovertible and moderate Democratic primary voters looking for a winner will start to resign themselves to his nomination. What is more likely is that Biden wins in South Carolina, declares himself the “comeback kid,” and prolongs the uncertainty regarding the Democratic nomination. Chart 17A Biden Win In Texas Would Reenergize The Establishment
GeoRisk Update: Leap Year, Or Steep Year?
GeoRisk Update: Leap Year, Or Steep Year?
If South Carolina propels Biden to a strong performance on Super Tuesday, particularly a win in Texas, it could usher in a new phase of the primary election since it would suggest the possibility that the establishment has not lost the nomination and is striking back against Sanders (Chart 17). Failing that, any “Never Sanders” movement will face an uphill battle. After March 3, about 39% of the Democratic Party’s delegates will be “pledged,” or committed, to one of the candidates. Two weeks later, fully 61.5% of delegates will be chosen. Which means that the best chance for a conservative counter-revolution against Sanders comes over the next three weeks. Regardless of South Carolina, Biden’s structural limitation on Super Tuesday is the well-known phenomenon of vote-splitting. Five centrist candidates are dividing the moderate vote, leaving Sanders to engross the 40%-45% of the vote that is progressive all to himself.1 This is a compelling reason to believe that Sanders will continue to amass the most delegates. What would change the equation would be a mustering of the centrists under a single competitive candidate. The latter requires candidates to be forced out of the race through defeat or to drop out of the race willingly for the good of the party. If Mayor Pete Buttigieg or Senator Amy Klobuchar should fall short of the 15% to qualify for delegates in South Carolina, they would need to bow out of the race (they might be persuaded by promises of high appointments). Most importantly, if Biden should squander South Carolina then he would need to take one for the team and drop out, passing the baton to Bloomberg. It will be hard for any one of these politicians to quit unless it is coordinated with the others; he or she would have to forgo any hopes of emerging at the top of the ticket at a contested Democratic National Convention in July. If coordination fails, the centrist vote will become even more fragmented when Mayor Michael Bloomberg finally appears on the ballot on March 3. Last week we argued that if Sanders cannot clinch the nomination by winning a majority of the delegates by June, then he needs to win a commanding plurality of the delegates so that moderate unpledged delegates are forced to capitulate and vote for him at the Democratic National Convention. We argued that for this to happen he needs, at minimum, to improve upon his score in 2016, which was 43% of the popular vote and 40% of the delegate count. Otherwise, a sequential voting procedure among roughly equally weighted blocs will likely lead to his defeat, as the two other factions of the party (establishment Washington insiders like Biden and centrist Washington outsiders like Bloomberg) view Sanders-style socialism as their least preferred option. Is this 40%+ threshold enough? Nobody knows. Clearly it is harder to win the nomination with 40% of the delegates than with 49%, even if you are in first place. But if Sanders leads by double digits in terms of the share of delegates, has captured 43%+ of the popular vote, and has won the big swing state primaries across regions, then it will be hard for Democratic delegates to conclude that he is not the most competitive in the general election. Currently Sanders is slated to win California, Michigan, Wisconsin, Pennsylvania, Ohio, and possibly Texas. This is a strong argument for moderate unpledged delegates to swing behind him. It is even compelling for some of the Democratic Party’s “super delegates,” at least those who are wavering. Otherwise these party elders would break up an enormous amount of momentum in the name of a less popular Democratic candidate – and strengthen Trump. Bottom Line: Super delegates will vote as political actors facing constraints inherent in their situation. If the situation is that Sanders has won 43% of the vote, leads the next candidate by double digits, has won the most primary elections, and has won in the major states, including the swing states, then it will be a compelling constraint on voting against him. Investment Conclusions The daily new cases of the coronavirus outside China continues to surge, creating near-term headwinds for global risk assets. Ultimately the negative shock of the virus may be overstated, but we remain on the sidelines of any near-term equity rally due to the confluence of a global demand shock and a US socialism boom. With manufacturing already vulnerable, the coronavirus, insofar as it causes a harder hit to global and hence American manufacturing, is a threat to Trump’s reelection odds. This is true regardless of who takes the Democratic nomination. It is also true notwithstanding that pandemic risks may ultimately fuel xenophobic sentiment. Trump cannot argue his way out of rising unemployment in the Rust Belt. The market is underrating the Sanders risk to health care and technology stocks. This means that Sanders has a greater chance of winning the White House than the consensus holds. Financial markets should continue to discount his rising odds, at least until it becomes clear either that he is falling short of a strong plurality or that the global economy is shaking off its jitters. As the financial market stumbles Sanders will get more steam than other candidates, while Trump’s odds will suffer, which is a potentially self-reinforcing dynamic. Looking at the correlations between different candidates and US equity sectors, the market is underrating the Sanders risk to health care and technology stocks (Table 1). Sanders poses a threat to regulation in these spheres even if the Democrats do not take a majority in the Senate. And they are likely to take the Senate and have a one-seat majority in the event that they prove capable of ousting Trump (via the vice president). Table 1The Market Is Underrating The Sanders Risk To US Equities
GeoRisk Update: Leap Year, Or Steep Year?
GeoRisk Update: Leap Year, Or Steep Year?
Ultimately Trump’s reelection also represents a threat to the tech sector, due to a “Phase Two” trade war, but the initial market reaction is likely to be risk-on. Assuming our base case that the virus fear eventually subsides, people get back to work, the world economy regains its footing, and monetary and fiscal stimulus get pumping (especially in China), the swing state economies may well be banging by November. In that context, the three pillars of our bullish 12-month view will be restored: the Fed put, the China put, and Trump’s reelection as a “buy the rumor, sell the news” phenomenon. Matt Gertken Vice President Geopolitical Strategist mattg@bcaresearch.com Footnotes 1 This assumes Senator Elizabeth Warren of Massachusetts continues to fall short of the 15% threshold qualifying a candidate to receive pledged delegates to the Democratic National Convention. Appendix Germany
Germany: GeoRisk Indicator
Germany: GeoRisk Indicator
France
France: GeoRisk Indicator
France: GeoRisk Indicator
Italy
Italy: GeoRisk Indicator
Italy: GeoRisk Indicator
Spain
Spain: GeoRisk Indicator
Spain: GeoRisk Indicator
UK
UK: GeoRisk Indicator
UK: GeoRisk Indicator
Canada
Canada: GeoRisk Indicator
Canada: GeoRisk Indicator
China
China: GeoRisk Indicator
China: GeoRisk Indicator
Taiwan
Taiwan: GeoRisk Indicator
Taiwan: GeoRisk Indicator
Korea
Korea: GeoRisk Indicator
Korea: GeoRisk Indicator
Russia
Russia: GeoRisk Indicator
Russia: GeoRisk Indicator
Brazil
Brazil: GeoRisk Indicator
Brazil: GeoRisk Indicator
Turkey
Turkey: GeoRisk Indicator
Turkey: GeoRisk Indicator
Section III: Geopolitical Calendar
Highlights Expect more volatility in the near-term. The roughly 45% odds of a total US policy reversal in the November election are higher than the market expects. A “Gray Swan” event in the election would be a tie in the Electoral College at 269 versus 269 votes. While Trump would win in this scenario, the process is arcane and the election’s legitimacy would be challenged. Feature Constraints suggest the Democratic Primary nomination will go to a moderate candidate, but only if Bernie Sanders falls short of a strong plurality (~40%) of the vote. Currently, Sanders has momentum, so the risk is that he wins just such a plurality. The world remains spellbound by the risk that the coronavirus outbreak in China will cause a substantial slowdown with knock-on effects. We maintain a cautious stance toward risk assets in the near term in order to get clarity that the virus is indeed being contained. Our latest analysis of the virus impact can be found here and here. Our analysis of the impact on Chinese politics and policy — and forthcoming economic stimulus — can be found here and here. Meanwhile we continue to focus on the US election cycle — which threatens additional volatility both in the immediate term and in Q4. An Electoral College Tie?!? Our expectation that President Trump is slightly favored to win the election hasn’t changed, but our quantitative election model continues to signal that the race is “too close to call.” Specifically it awards Trump with the narrowest possible Republican victory in November. It suggests the president will lose Maine, Michigan, and Pennsylvania, yet keep Wisconsin (Chart 1). Chart 1Our Quant Model Signals That The Race Is "Too Close To Call"
An Electoral College Tie?!?
An Electoral College Tie?!?
The intriguing thing about this combination of states is that it would produce an Electoral College tie, with the Republicans and Democrats each winning 269 votes! While the model generally should not be read so literally — the correct reading is “too close to call” — nevertheless a tie combination is not far-fetched and therefore constitutes a “Gray Swan” risk for this year: a high impact event whose probability is not all that low. The demographic data that we use to project the size and composition of the American voting public in 2020 — provided by the Center for American Progress and a coalition of high-powered Washington think tanks — provides at least one specific election scenario in which such a tie would result. This is a scenario in which the voter turnout and party support rates remain the same as in 2016 yet the elevated 5.7% of votes that went to third party candidates that year reverts back to its historical mean of 1.7%, where it stood in the 2012 election (Chart 2).1 A repeat of the 2016 election with third-party mean-reversion is not implausible. In 2020, President Trump still has a relatively weak approval rating, while none of the Democratic candidates is particularly charismatic or inspiring for key voting groups like African-Americans. (Charisma or a special demographic advantage are factors that could increase Democratic turnout and support from Hillary Clinton’s 2016 levels.) This year’s contest is a “closed election” with an incumbent president running, while 2016 was an “open election” in which voters had greater ability or willingness to flirt with parties outside the Republican-Democratic duopoly. Democratic candidate Hillary Clinton polled as the least favorable candidate in history at that time, with the sole exception of her rival, Republican candidate Donald Trump. The economy was also soft. A symbolic or strategic vote for the Libertarian Party or Green Party seemed a better option for about 6% of voters. Trump would be re-elected in the event of a tie. How is the presidency decided in the event of a tie? The House of Representatives votes to choose the president, albeit with each state only getting one vote. Currently Republicans have a majority in more congressional state delegations than Democrats — even if Pennsylvania is allotted to the latter (Chart 3). As a result President Trump would be re-elected. Chart 2A Tie In The Electoral College Is A "Gray Swan" Risk
An Electoral College Tie?!?
An Electoral College Tie?!?
Chart 3Trump Would Be Re-Elected In The Event Of A Tie
An Electoral College Tie?!?
An Electoral College Tie?!?
Needless to say, the American public is not familiar with the details of the twelfth amendment governing this process and there would be much heartburn from the losing party. The Democrats would highlight the popular vote (which Trump is highly likely to lose in most scenarios) and the “unrepresentative” nature of both the Electoral College and the House voting procedure. Such complaints would be ineffectual but the outcome would trigger a “legitimacy crisis” that would weaken the government’s mandate and exacerbate the country’s extreme polarization. Partisanship and polarization would also shoot through the roof if extremely thin margins of victory resulted in contested election results. Indeed the outcome of the election may not be clear on November 3. The 2000 election, the last time prior to 2016 that the Electoral College and popular vote produced different results, is the obvious example. President George W. Bush won by carrying Florida with 537 votes, but only after the Supreme Court intervened to put a stop to the contested recounting process in the state. President Trump won the critical swing states of the 2016 election by larger margins than that, but they were still thin and his net negative approval rating suggests thin margins could occur again in 2020 (Chart 4). Democratic contender Al Gore did not concede the election till a month later — would populist candidates like President Trump or Senator Bernie Sanders concede their loss? What would they do if the voting system somehow malfunctioned? The reporting debacle at the Democratic Party’s Iowa Caucus this month should serve as a reminder that voting systems are vulnerable to flaws and failures. Chart 4Trump’s Thin Margins In Swing States Could Occur Again In 2020
An Electoral College Tie?!?
An Electoral College Tie?!?
Even more controversial and polarizing, the Electoral College could swing because of the rogue actions of individuals. There can be no confidence in any prediction of a 269-269 Electoral College tie because college members are not always legally bound to vote for the candidate who carried the state they represent. “Faithless electors” are those who vote according to conscience rather than the strict mandate of their state. There were seven faithless electors in 2016, five of whom defected from Clinton and two of whom defected from Trump. In an election with tight margins in the Electoral College, it is conceivable that half of the population could be deprived of its democratic rights by the actions of a few individuals. There is a justification for the independence of electors but the point is that if they swung the election the results would be illegitimate in the eyes of around half of the country. In sum, the US election is shaping up to be extremely close, which means that frictions in the electoral system are likely to emerge. Thin and contested vote margins — or constitutional yet “unrepresentative” solutions to disputes — may deprive the government of legitimacy in the eyes of many and prolong America’s crisis of polarization. While financial markets expect a clear answer on November 3, they may not get it. Uncertainty may go up instead of down. Extreme polarization also has negative effects like abrupt vacillations in national policy — see the Iraq War, the 2015 Iranian nuclear pact, and domestic issues like the debt ceiling and the Affordable Care Act. Polarization can produce a self-feeding spiral that harms institutions and reduces predictability over the long run. Bottom Line: Can the equity market rally through contested elections and crises of legitimacy? Yes. It may even cheer a hamstring government for a while. But prolonged uncertainty — or social instability — would weigh on business and consumer sentiment. Update On The Democratic Primary: The Lead-Up To Super Tuesday Chart 5Bloomberg May Supplant Biden As Pro-Establishment Front Runner
An Electoral College Tie?!?
An Electoral College Tie?!?
With the ninth Democratic Party primary debate concluding, the race for the nomination has blown open. Our view has been that a centrist or moderate candidate is most likely to emerge as the nominee and that former Vice President Joe Biden’s true testing ground would be in the South: South Carolina and Super Tuesday. Biden’s performance in Iowa and New Hampshire — where he angrily called a voter a “lying, dog-faced, pony soldier” — has been disastrous. Opinion polls suggest that New York City Mayor Michael Bloomberg may supplant him as the pro-establishment front runner (Chart 5). Bloomberg, however, has only just entered the race and has just suffered a hit from the combined onslaught of all the candidates at the ninth debate in Las Vegas. We need to see the votes — not just the money — to assess whether he can replace Biden (not to mention South Bend Mayor Pete Buttigieg and Minnesota Senator Amy Klobuchar) as the leading moderate candidate. Super Tuesday is critical for Bloomberg as well as for the other candidates who qualify for delegates and stay in the race after the Nevada Caucus on February 22 and South Carolina primary on February 29. With the roughly 55% share of votes going to moderates, Vermont Senator Bernie Sanders is benefiting from the ability to monopolize the remaining 45% of the vote for himself. That is, if Elizabeth Warren keeps failing to qualify. The problem for him is that his support could end up getting capped at around 25-30%, based on his performance thus far in Iowa, New Hampshire, and polling in Nevada, which is very different from 2016 when he divided the vote with Hillary Clinton alone (Chart 6). Chart 6Sanders’s Share Could Get Capped At 25-30%
An Electoral College Tie?!?
An Electoral College Tie?!?
The question is whether Sanders can beat Warren definitively and sustain the momentum — which is very strong at the moment (Chart 7). He has tapped into the anti-establishment vein of the populace that propelled Trump to the Republican nomination in 2016. Chart 7Can Sanders Sustain The Strong Momentum?
An Electoral College Tie?!?
An Electoral College Tie?!?
Party elites will not be able to reject Sanders if he wins a commanding plurality of the vote. Sanders is, thus far in the polling, more competitive for the nomination than Bloomberg (Chart 8), and more competitive than any candidate other than Biden when head-to-head against Trump (Chart 9). This is a tailwind in an election in which voters prioritize beating Trump: the more capable of doing so, the more momentum, the more capable of doing so. Chart 8Sanders Is Thus Far More Competitive Than Bloomberg
An Electoral College Tie?!?
An Electoral College Tie?!?
Chart 9Sanders Is More Competitive Than Other Dem Candidates Vs. Trump, Except Biden
An Electoral College Tie?!?
An Electoral College Tie?!?
There won’t be much clarity on the nomination process till after Super Tuesday at earliest. What is clear is that while Sanders may win a plurality of delegates (Chart 10), the moderates will take the nomination if they can coalesce around a candidate in time (Chart 11). Chart 10Sanders Likely To Win A Plurality Of Delegates …
An Electoral College Tie?!?
An Electoral College Tie?!?
Chart 11… Unless Moderates Coalesce Around One Candidate
An Electoral College Tie?!?
An Electoral College Tie?!?
Chart 12Super Delegates Could Tip The Scales Against Sanders, But Risk Sowing Discord
An Electoral College Tie?!?
An Electoral College Tie?!?
It matters whether Sanders wins a commanding plurality of the vote and the proportionately allocated “unpledged delegates” to the Democratic convention. We benchmark his performance at 40%+, keeping in mind the 43% of the popular vote for the nomination that Sanders won in 2016. If he can win this large of a share of the Democratic Party voters, and stay well ahead of his second-ranked competitor due to vote splitting, then it will be hard for the party elites and elders to reject him. The so-called automatic delegates or “super delegates” can join in the second round of voting at the Democratic National Convention, and they would hesitate about a Sanders nomination and would be numerous enough to tip the scales against him (Chart 12). But to do so they would have to send 40%+ of their voters home aggrieved, which would be undemocratic and un-strategic for the party as it would cause a split in July just when it needed to band together to try to beat Trump. Game theory can help to illuminate the constraints of the primary if Sanders fails to win a strong plurality.2 What follows is a simple demonstration to provide a framework for understanding the voting procedure of the Democratic primary elections as a whole, and specifically multiple rounds of voting at a contested convention. Let us assume that the Democratic Party can be divided into three roughly equally popular voting groups for the primary contest: E = The Establishment = Biden, Klobuchar R = Reformers = Buttigieg, Bloomberg A = Anti-Establishment = Sanders, Warren The preferences of the groups are as follows: Establishment: E, R, A. The establishment cannot tolerate losing power to left-wing populism. Reformers: R, E, A. The reformers believe the establishment is out of date but favor gradual change rather than revolution and would prefer the establishment over a radical candidate. Anti-Establishment: A, R, E. The anti-establishment would prefer a populist, but would accept a reformer, as long as he is not the establishment. If the front runner is Sanders, he will lose the first round of voting, as E + R > A. In the second round, if the choice is Biden, Biden will be rejected: R + A > E. Therefore a reformer wins. This is still the outcome if Biden is the front runner in the first round, since Biden would lose (R + A > E) but then his voters would have to help a reformer win (R + E > A). Or, if Bloomberg were put up in the second round instead of Biden, the reformer still would win since R + A > E. Only if Bloomberg began the first round as a front runner would the outcome change. The first round he would lose because E + A > R. And then in the second round Biden would win because E + R > A. In the above voting sequence, neither the establishment nor the reformist voters would have an incentive to vote strategically — both would vote straightforwardly — since both rank the anti-establishment as their least preferred option. Super Tuesday will be critical in seeing if Sanders’s trajectory points toward a strong plurality. Therefore if Sanders cannot get a large enough plurality to win outright — large enough to compel unpledged candidates to join his coalition to win a majority of delegates — then he becomes the victim of a rational decision making process that works against him. The foregoing is a simple demonstration of the way the voting procedure will hurt a weak front runner — and elect someone other than an anti-establishment candidate — if the primary is conceived of as a simple sequential voting procedure, or if it comes to a contested election. But it is still possible that we could have the nomination decided by Sanders outperforming and clinching a majority in the primary elections, or in a brokered deal in June. Or another candidate, a moderate, could become the front runner and clinch the nomination while other moderate candidates are winnowed. Bottom Line: The Sanders risk to the equity market is immediate because he could win a strong plurality of delegates that could then create a dynamic that enables him to clinch the nomination. But if he falls short of a strong plurality then a reformer or establishment Democrat is favored. Super Tuesday will be critical in seeing if his trajectory points toward such a strong plurality. Matt Gertken Vice President Geopolitical Strategist mattg@bcaresearch.com Footnotes 1 See Robert Griffin, Ruy Teixeira, and William H. Frey, "America's Electoral Future: Demographic Shifts and the Future of the Trump Coalition," Center for American Progress, April 2018. 2 See Steven J. Brams, Game Theory And Politics (Dover, 2004).
Highlights Analyses on Asian semis, Argentina and Russia are available on pages 7, 12 and 14, respectively. The most likely trajectory for Chinese growth will be as follows: the initial plunge in business activity will be succeeded by a rather sharp snap-back due to pent-up demand. However, that quick rebound will probably be followed by weaker growth. Financial markets will soon focus on growth beyond the temporary rebound. In our opinion, it will be weaker than markets are currently pricing. Thus, risks for EM risk assets and currencies are skewed to the downside. A major and lasting selloff in EM stocks will only occur if EM corporate bond yields rise. In this week’s report we discuss what it will take for EM corporate credit spreads to widen. Feature The downside risks to EM risk assets and currencies are growing. We continue to recommend underweighting EM equities, credit and currencies versus their DM counterparts. Today we are initiating a short position in EM stocks in absolute terms. Chart I-1 illustrates that the total return index (including carry) of EM ex-China currencies versus the US dollar has failed to break above its 2019 highs, and has rolled over decisively. In contrast, the trade-weighted US dollar has exhibited a bullish technical configuration by rebounding from its 200-day moving average (Chart I-2). Odds are the dollar will make new highs. An upleg in the greenback will foreshadow a relapse in EM financial markets. Chart I-1EM Ex-China Currencies Have Been Struggling Despite Low US Rates
EM Ex-China Currencies Have Been Struggling Despite Low US Rates
EM Ex-China Currencies Have Been Struggling Despite Low US Rates
Chart I-2The US Dollar Remains In A Bull Market
The US Dollar Remains In A Bull Market
The US Dollar Remains In A Bull Market
Growth Trajectory After The Dust Settles The evolution of the coronavirus remains highly uncertain and unpredictable. As with any pandemic or virus outbreak, its evolution will be complex with non-trivial odds of a second wave. Even under the assumption that the epidemic will be fully contained by the end of March, its economic impact on the Chinese and Asian economies will likely be greater than global financial markets are currently pricing. As investors come to the realization that this initial pick-up in economic activity after the virus outbreak will be followed by weaker growth, the odds of a selloff in equities and credit markets will rise. In our January 30 report titled Coronavirus Versus SARS: Mind The Economic Differences, we argued that using the framework from the SARS outbreak to analyze the current epidemic is inappropriate. First, only a small portion of the Chinese economy was shut down in 2003, and for a brief period of time. The current closures and limited operations are much more widespread and likely more prolonged. Table I-1China’s Importance Now And In 2003
EM: Growing Risk Of A Breakdown
EM: Growing Risk Of A Breakdown
Second, China accounts for a substantially larger share of the global economy today than it did in 2003 (Table I-1). Hence, the global business cycle is presently much more sensitive to demand and production in the mainland than it was during the SARS outbreak. Global financial markets have rebounded following the initial selloff in late January on expectations that the Chinese and global economies will experience a V-shaped recovery. In last week’s report, we discussed why the odds favor a tepid recovery for the Chinese business cycle and global trade. The main point of last week’s report was as follows: with the median company and household in China being overleveraged, any reduction in cash flow or income will undermine their ability to service their debt and will dent their confidence for some time. Hence, consumption, investment and hiring over the next several months will be negatively affected, even after the outbreak is contained. This in turn will diminish the multiplier effect of policy stimulus in China. Chart I-3Our Expectations Of China’s Business Cycle
EM: Growing Risk Of A Breakdown
EM: Growing Risk Of A Breakdown
The most likely pattern for Chinese growth will likely resemble the trajectory demonstrated in Chart I-3. It assumes the plunge in business activity will be succeeded by a rather sharp snap-back due to pent-up demand. However, that snap-back will likely be followed by weaker growth, for reasons discussed in last week’s report. Equity and credit markets in Asia and worldwide have been sanguine because they have so far focused exclusively on expectations of a sharp rebound. As investors come to the realization that this initial pick-up in economic activity will be followed by weaker growth, the odds of a selloff in equities and credit markets will rise. Bottom Line: The most likely trajectory for Chinese and Asian growth will be as follows: the initial plunge in business activity will be succeeded by a rather sharp snap-back due to pent-up demand. However, that quick rebound will probably be followed by weaker growth. Financial markets are not pricing in this scenario. Thus, risks are skewed to the downside for EM risk assets and currencies. The Missing Ingredient For An Equity Selloff The missing ingredient for a selloff in EM equities is rising EM corporate bond yields. Chart I-4 illustrates that bear markets in EM stocks typically occur when EM US dollar corporate bond yields are rising. Hence, what matters for the direction of EM share prices is not risk-free rates/yields but EM corporate borrowing costs. Chart I-4The Destiny Of EM Equities Is DependEnt On EM Corporate Bond Yields
The Destiny Of EM Equities is DependEnt On EM Corporate Bond Yields
The Destiny Of EM Equities is DependEnt On EM Corporate Bond Yields
EM (and US) corporate bond yields can rise under the following circumstances: (1) when US Treasury yields are ascending more than corporate credit spreads are tightening; (2) when credit spreads are widening more than Treasury yields are falling; or (3) when both government bond yields and corporate credit spreads are increasing simultaneously. Provided the backdrop of weaker growth is bullish for government bonds, presently corporate bond yields can only rise if credit spreads widen by more than the drop in Treasury yields. In short, the destiny of EM equities currently relies on corporate spreads. A major and lasting selloff in EM stocks will only occur if their respective corporate bond yields rise. From a historical perspective, EM and US corporate credit spreads are currently extremely tight (Chart I-5). A China-related growth scare could trigger a widening in EM corporate credit spreads. As this occurs, corporate bond yields will climb, causing share prices to plummet. EM corporate spreads have historically been correlated with EM exchange rates, the global/Chinese business cycle, and commodities prices (Chart I-6). The Chinese property market plays an especially pivotal role for the outlook of EM corporate spreads. Chart I-5EM And US Corporate Spread Remain Tame
EM And US Corporate Spread Remain Tame
EM And US Corporate Spread Remain Tame
Chart I-6EM Corporate Spreads Inversely Correlate With EM Currencies And Commodities Prices
EM Corporate Spreads Inversely Correlate With EM Currencies And Commodities Prices
EM Corporate Spreads Inversely Correlate With EM Currencies And Commodities Prices
First, offshore bonds issued by mainland property developers account for a large share of the EM corporate bond index. Chart I-7China Property Market Will Continue Disappointing
China Property Market Will Continue Disappointing
China Property Market Will Continue Disappointing
Second, swings in China’s property markets often drive the mainland’s business cycle and its demand for resources, chemicals and industrial machinery. In turn, Chinese imports of commodities affect both economic growth and exchange rates of EM ex-China. Finally, the latter two determine the direction of EM ex-China corporate spreads. China’s construction activity and property developers were struggling before the coronavirus outbreak (Chart I-7). Given their high debt burden, the ongoing plunge in new property sales and their cash flow will not only weigh on their debt sustainability but also force them to curtail construction activity. The latter will continue suppressing commodities prices. The sensitivity of EM corporate spreads to these variables have in recent years diminished because of the unrelenting search for yield by global investors. As QE policies by DM central banks have removed some $9 trillion of high-quality securities from circulation, the volume of securities available in the markets has shrunk. This has distorted historical correlations of EM corporate spreads with their fundamental drivers – namely, China’s construction activity, commodities prices, EM exchange rates and the global trade cycle. Nonetheless, EM corporate credit spreads’ sensitivity to these variables has diminished, but has not vanished outright. If EM currencies depreciate meaningfully, commodities prices plunge and China’s growth and the global trade cycle disappoint, odds are that EM corporate spreads will widen. Given that credit markets are already in overbought territory, any selloff could trigger a cascading effect, resulting in meaningful credit-spread widening. Bottom Line: A major and lasting selloff in EM stocks will only occur if their respective corporate bond yields rise. The timing is uncertain, but the odds of EM corporate credit spreads widening are mounting as Chinese growth underwhelms, commodities prices drop and EM currencies depreciate. If these trends persist, they will push EM shares prices over the cliff. As to today’s recommendation to short the EM stock index, we anticipate at least a 10% selloff in EM stocks in US-dollar terms. For currency investors, we are maintaining our shorts in a basket of EM currencies versus the dollar. This basket includes the BRL, CLP, COP, ZAR, KRW, IDR and PHP. Arthur Budaghyan Chief Emerging Markets Strategist arthurb@bcaresearch.com Are Semiconductor Stocks Facing An Air Pocket? Global semiconductor share prices have continued to hit new highs, even though there has not been any recovery (positive growth) in global semiconductor sales or in their corporate earnings (EPS). The coronavirus outbreak and the resulting delay in 5G phone sales in China in the first half of 2020 will trigger a pullback in semiconductor equities. Global semiconductor sales bottomed on a rate-of-change basis in June, but their annual growth rate was still negative in December. In the meantime, global semi share prices have been rallying since January 2019. This divergence between stock prices and revenue of global semiconductor stocks is unprecedented (Chart II-1). Chart II-1Over-Hyped Global Semi Share Prices
Global Semiconductor Market: Sales & Share Prices Over-Hyped Global Semi Share Prices
Global Semiconductor Market: Sales & Share Prices Over-Hyped Global Semi Share Prices
Odds are that global semi stocks in general, and Asian ones in particular, will experience a pullback in the coming weeks. The coronavirus outbreak will likely dampen expectations related to the speed of 5G adoption and penetration in China. Critically, China accounted for 35% of global semiconductor sales in 2019, versus 19% for the US and 10% for the whole of Europe. In brief, semiconductor demand from China is now greater than the US and European demand combined. Furthermore, the latest news that the US administration is considering changing its regulations to prevent shipments of semiconductor chips to China’s Huawei Technologies from global companies - including Taiwan's TSMC - could hurt chip stocks further. Since Huawei Technologies is the global leader in 5G networks and smartphones, the ban, if implemented, will instigate a sizable setback to 5G adoption in China and elsewhere. Table II-1Industry Forecasts Of The 2020 Global 5G- Smartphone Shipments
EM: Growing Risk Of A Breakdown
EM: Growing Risk Of A Breakdown
Our updated estimate of global 5G smartphone shipments is between 160 million and 180 million units in 2020, which is below the median of industry expectations of 210 million units (Table II-1). The key reasons why the industry’s expectations are unreasonably high, in our opinion, are as follows: Chinese demand for new smartphones will likely stay weak (Chart II-2). The mainland smartphone market has become extremely saturated, with 1.3 billion units having been sold in just the past three years – nearly equaling the entire Chinese population. Chinese official data show that each Chinese household owned 2.5 phones on average in 2018, and that the average household size was about three persons (Chart II-3). This suggests that going forward nearly all potential phone demand in China is for replacement phones, and that there is no urgent need for households to buy new phones. Chart II-2Chinese Smartphone Demand: Further Decline In 2020
Chinese Smartphone Demand: Further Decline In 2020
Chinese Smartphone Demand: Further Decline In 2020
Chart II-3Chinese Households: No Urgent Need For A New Phone
Chinese Households: No Urgent Need For A New Phone
Chinese Households: No Urgent Need For A New Phone
The Chinese government’s boost to 5G infrastructure investment will likely increase annual installed 5G base stations from 130,000 units last year to about 600,000 to 800,000 this year. However, the total number of 5G base stations will still only account for about 7-9% of total base stations in China in 2020. Hence, geographical coverage will not be sufficiently wide enough to warrant a very high rate of 5G smartphone adoption and penetration. From Chinese consumers’ perspectives, a 5G phone in 2020 will be a ‘nice-to-have,’ but not a ‘must-have.’ Given increasing economic uncertainty and many concerns related to the use of 5G phones, mainland consumers may delay their purchases into 2021 when 5G phone networks will have more geographic coverage. The number of 5G phone models on the market is expanding, but not that quickly. Consumers may take their time to wait for more models to hit the market before making a 5G phone purchase. For example, Apple will release four 5G phone models, but only in September 2020. Moreover, the price competition between 5G and 4G phones is getting increasingly intense. Smartphone producers have already started to cut prices of their 4G phones aggressively. For example, the price of Apple’s iPhone XS, released in September 2018, has already dropped by about 50% in China. Outside of China, 5G infrastructure development will be much slower. The majority of developed countries will likely give in to pressure from the US and limit their use of Huawei 5G equipment. This will delay infrastructure installation and adoption of 5G throughout the rest of the world because Huawei has the leading and cheapest 5G technology. In 2019, China accounted for about 70% of worldwide 5G smartphone shipments. We reckon that in 2020 Chinese 5G smartphone shipments will be between 120 million and 130 million units. Assuming this accounts for about 70-75% of the world shipment of 5G phones this year, we arrive at our estimate of global 5G smartphone shipments of between 160 million and 180 million units. We agree that 5G technology is revolutionary. Nevertheless, we still believe global semi share prices are presently overhyped by unreasonably optimistic 2020 projections. Overall, investors are pricing global semi stocks using the pace and trajectory of 4G smartphones adoption. However, in 2020 the number and speed of 5G phone penetration will continue lagging that of 4G ones when the latter were introduced in December 2013 (Chart II-4). We agree that 5G technology is revolutionary, and its adoption and penetration will surge in the coming years. Nevertheless, we still believe global semi share prices are presently overhyped by unreasonably optimistic 2020 projections (Chart II-5). Chart II-4China 5G-Adoption Pace: Slower Than The Case With 4G
China 5G-Adoption Pace: Slower Than The Case With 4G
China 5G-Adoption Pace: Slower Than The Case With 4G
Chart II-5Net Earnings Of Global Semi Sector: Too Optimistic?
Net Earnings Of Global Semi Sector: Too Optimistic?
Net Earnings Of Global Semi Sector: Too Optimistic?
Investment Implications Global semi stocks’ valuations are very elevated, as shown in Chart II-6 and Chart II-7. Besides, semi stocks are overbought, suggesting they could correct meaningfully if lofty growth expectations currently baked into their prices do not materialize in the first half of this year. Chart II-6Global Semi Stocks Valuations: Very Elevated
Global Semi Stocks Valuations: Very Elevated
Global Semi Stocks Valuations: Very Elevated
Chart II-7Global Semi Stocks’ Valuations: Very Elevated
Global Semi Stocks Valuations: Very Elevated
Global Semi Stocks Valuations: Very Elevated
The coronavirus outbreak and the resulting delay in 5G phone sales in China in the first half of 2020, along with US pressure on global semi producers not to sell to Huawei, will likely trigger a pullback in semiconductor equities. We recommend patiently waiting for a better entry point for absolute return investors. Within the EM equity universe, we have not been underweight Asian semi stocks because of our negative outlook for the overall EM equity benchmark. The Argentine government will drag out foreign debt negotiations with the IMF and foreign private creditors to secure a more favorable settlement. We remain neutral on Taiwan and overweight Korea. The reason is that DRAM makers such as Samsung and Hynix have rallied much less than TSMC. Besides, geopolitical risks in relation to Taiwan in general and TSMC in particular are rising, warranting a more defensive stance on Taiwanese stocks relative to Korean equities. Ellen JingYuan He Associate Vice President ellenj@bcaresearch.com Argentina’s Eternal Tango With Foreign Creditors Chart III-1Downside Risks To Bond Prices
Downside Risks to Bond Prices
Downside Risks to Bond Prices
Our view remains that debt negotiations will be drawn-out because the Argentine government is both unwilling and lacks the financial capacity to service public foreign debt. The administration’s recent attitude toward foreign creditors and the IMF have startled markets: sovereign Eurobond bond prices have tanked (Chart III-1). The reasons why the Fernandez administration will play tough ball with creditors and the IMF are as follows: The country’s foreign funding and the public sector debt situations are precarious. Hence, the lower the recovery rate they negotiate with creditors, the more funds will be available to expand social programs and secure domestic political support. Given Fernandez’s and Peronist’s voter base, the government is inclined to please the population at expense of foreign creditors. Moreover, Alberto Fernandez is facing increasing scrutiny from radical Peronists, who want to dissolve the debt altogether. Vice-president Fernandez de Kirchner stated that Argentina should not pay international agents until the economy escapes a recession. To further add to creditors’ frustration, the government has yet to announce a comprehensive economic plan to revive the economy and service outstanding debt. The public foreign currency debt burden is unsustainable – its level stands at $250 billion, about 4 times larger than exports. The country is still in a recession, and economic indicators do not show much improvement. Committing to fiscal austerity to service foreign debt would entail further economic suffering for Argentine businesses and households, something Fernandez rejected throughout his campaign. The authorities are singularly focused on reviving the economy: government expenditures have grown by over 50% annually under the current administration (Chart III-2). Crucially, Argentina has already achieved a large trade surplus and its current account balance is approaching zero (Chart III-3). Assuming exports stay flat, the economy can afford to maintain its current level of imports. This makes the authorities less willing to compromise and more inclined to adopt a tough stance in debt negotiations. Chart III-2Peronist Government Has Again Boosted Fiscal Spending
Peronist Government Has Again Boosted Fiscal Spending
Peronist Government Has Again Boosted Fiscal Spending
Chart III-3Argentina: Current Account Is Almost Balanced
Argentina: Current Account Is Almost Balanced
Argentina: Current Account Is Almost Balanced
The risk of this negotiation strategy is that the nation will not be able to raise foreign funding for a while. Nevertheless, the country is currently de facto not receiving any external financing. Hence, this risk is less pressing. Moreover, the administration has already delayed all US$ bond payments until August. This allows them to extend negotiations with creditors over the next six months, thereby increasing uncertainty and further pushing down bond prices. A lower market price on Argentine bonds is beneficial for the government’s negotiation strategy as it implies lower expectations for foreign creditors. Thus, the Fernandez administration’s strategy will be to play hardball and draw-out negotiations as long as possible. We expect Argentina to reach a settlement with creditors no earlier than in the third quarter of this year and at recovery rates below current prices of the nation’s Eurobonds. Russian financial assets will be supported due to improving public sector governance, accelerating domestic demand growth and healthy macro fundamentals. Bottom Line: The government will drag out foreign debt negotiations with the IMF and foreign private creditors to secure a more favorable settlement. Continue to underweight Argentine financial assets over the next several months. Juan Egaña Research Associate juane@bcaresearch.com Russia: Harvesting The Benefits Of Macro Orthodoxy Russian financial markets have shown resilience in face of falling oil prices. This has been the upshot of the nation’s prudent macro policies in recent years. We have been positive on Russia and overweight Russian markets over the past two years and this stance remains intact. Going forward, Russian financial assets will be supported due to improving public sector governance, accelerating domestic demand growth and healthy macro fundamentals: Fiscal policy will be relaxed substantially – both infrastructure and social spending will rise. Specifically, the Kremlin is eager to ramp up the national projects program. This is bullish for domestic demand. Russia’s public finances are currently in a very healthy state. Public debt (14% of GDP) is minimal and foreign public debt (4% of GDP) is tiny. The overall fiscal balance is in large surplus (2.7% of GDP). The current account is also in surplus. Hence, a major boost in fiscal spending will not undermine Russia’s macro stability for some time. As a major sign of policy change, President Putin has sidelined or reduced the authority of policymakers who have been advocating tight fiscal policy. This policy change has been overdue as fiscal policy has been unreasonably tight for longer than required (Chart IV-1). Chart IV-1Russia: Government Spending Has Been Extremely Weak
Russia: Government Spending Has Been Extremely Weak
Russia: Government Spending Has Been Extremely Weak
Importantly, the recent changes at the highest levels of government are also positive for governance and productivity. The new Prime Minister Mishustin has earned this appointment for his achievements as the head of the federal tax authority. He has restructured and reorganized the tax department in a way that has boosted its efficiency/productivity substantially and increased tax collection. By promoting him to the head of government, Putin has boosted Mishustin’s authority to reform the entire federal governance system. Given his record of accomplishment, odds are that the new prime minister will succeed in implementing some reforms and restructuring. Thereby, productivity growth that has been stagnant in Russia for a decade could revive modestly. Also, Putin was reluctant to boost infrastructure spending as he was afraid of money being misappropriated without a proper monitoring system. Putin now hopes Mishustin can introduce an efficient governance system of fiscal spending to assure infrastructure projects can be realized with reasonably minimal losses. As to monetary policy, real interest rates are still very high. The prime lending rate is 10%, the policy rate is 6% and nominal GDP growth is 3.3% (Chart IV-2). Weak growth (Chart IV-3) and low inflation will encourage the central bank to continue cutting interest rates. Chart IV-2Russia: Interest Rates Remain Excessively High
Russia: Interest Rates Remain Excessively High
Russia: Interest Rates Remain Excessively High
Chart IV-3Russia's Growth Is Very Sluggish
Russia's Growth Is Very Sluggish
Russia's Growth Is Very Sluggish
Finally, the economy does not have any structural excesses and imbalances. The central bank has done a good job in cleansing the banking system and the latter is in healthy shape. Bottom Line: The ruble will be supported by improving productivity, cyclical growth acceleration and a healthy fiscal position. We continue recommending overweighting Russian stocks, local currency bonds and sovereign credit relative to their respective EM benchmarks. Last week, we also recommended a new trade: Short Turkish bank stocks / long Russian bank stocks. The main risk to the absolute performance of Russian markets is another plunge in oil prices and a broad selloff in EM. On November 14, 2019 we recommended absolute return investors to go long Russian local currency bonds and short oil. This strategy remains intact. Finally, we have been recommending the long ruble / short Colombian peso trade since May 31, 2018. This position has generated large gains and we are reiterating it. Arthur Budaghyan Chief Emerging Markets Strategist arthurb@bcaresearch.com Footnotes Equities Recommendations Currencies, Credit And Fixed-Income Recommendations
Highlights Duration: Bond yields will stay low until the daily number of new COVID-19 cases falls to zero, at which point a sell-off is likely. We therefore recommend maintaining below-benchmark portfolio duration on a 6-12 month horizon. Rising odds of a Bernie Sanders presidential win could prevent bond yields from rising at all this year. We may adjust our recommendations in the coming months if this risk increases. Spread Product: Investors should maintain an overweight allocation to spread product versus Treasuries, with a preference for high-yield. Accommodative monetary conditions will ensure that the supply of credit remains ample for some time yet. This will keep defaults low and spreads tight. Monetary Policy: The Fed is in no rush to tighten policy, but has also set a high bar for further cuts. Investors should short August 2020 fed funds futures. Yields Will Move Higher … But Not Yet Chart 1A Peak In New Cases?
A Peak In New Cases?
A Peak In New Cases?
Uncertainty about the economic impact of the coronavirus – now officially called COVID-19 – is the cloud that continues to hang over financial markets. Last week, bond yields fell when a change in the definition of what constitutes a confirmed infection caused the number of reported cases to spike. However, even after revisions, the daily number of new cases looks like it may have peaked (Chart 1). The end result is that the 10-year Treasury yield sits at 1.58%, not far from where it was last week (Chart 2). Notably, the 10-year yield continues to shrug off the notable improvement in US economic data (Chart 2, bottom panel), taking its cues instead from COVID-19 headline risk. Even if the downtrend in new COVID-19 cases continues, it is too soon to be looking for higher bond yields. For one thing, the most up-to-date economic data releases were collected during January, before the outbreak. Weaker readings during the next 1-2 months are assured, and investors may not look through the weakness given that many were already skeptical about the prospects for global economic recovery. Our read of the data is that global growth was in the process of bottoming when COVID-19 struck. We therefore expect global growth to move higher once the virus’ impact abates. In terms of timing, using the 2003 SARS outbreak as a comparable, we expect bonds to remain bid until the daily number of new cases falls to zero, at which point a sell-off is likely. Yields continue to shrug off improvements in economic data. It’s not just the long-end of the curve that has responded to COVID-19. The front-end has also moved to price-in high odds of a rate cut in the coming months. Specifically, the overnight index swap curve is priced for a 42 bps decline in the fed funds rate during the next 12 months (Chart 2, panel 2), and the fed funds futures market is pricing a 74% chance of a rate cut by the end of the summer. As we discussed last week, given that any economic impact from COVID-19 will be temporary, we think the bar for a Fed rate cut this year is quite high.1 As such, our Golden Rule of Bond Investing dictates that investors should keep portfolio duration low on a 12-month horizon.2 We also recommend shorting August 2020 fed funds futures, a trade that will earn 23 bps of unlevered return if the Fed stands pat between now and August (Chart 2, panel 3). Turning to corporate credit, we see that, so far, COVID-19’s impact on spreads has been minor. The investment grade corporate bond index spread is only 3 bps wider than at the start of the year, and the junk index spread is only 8 bps wider (Chart 3). Value remains stretched in the investment grade space, but high-yield spreads look quite attractive. The sell-off in the energy sector has boosted the high-yield index spread considerably (Chart 3, bottom 2 panels). We view this as a medium-term buying opportunity for junk. Once the COVID outbreak abates and global growth ticks higher, the oil price is bound to increase, leading to some tightening in energy spreads. Chart 2Bond Yields Driven By COVID
Bond Yields Driven By COVID
Bond Yields Driven By COVID
Chart 3HY More Attractive Than IG
HY More Attractive Than IG
HY More Attractive Than IG
Will Bonds Feel The Bern? Beyond COVID-19, there is one more risk on the horizon this year. Specifically, the risk that Bernie Sanders is elected President in November. This outcome is far from certain. Sanders is currently leading all other candidates in the Democratic Primary, but fivethirtyeight.com’s model puts the odds of a brokered convention at 38%.3 This means that the race is still wide open and might only be settled at the convention in July. But given Sanders’ lead, it is worth considering the bond market implications if he were to become the next President. The most obvious implication is that risk assets (equities and corporate spreads) would respond to Sanders’ agenda of wealth redistribution by selling off. This could spur a flight-to-quality into government bonds, causing Treasury yields to fall. However, that flight-to-quality won’t occur if markets also start to price-in the long-run implications of Sanders’ agenda. I.e. the fact that the redistribution of wealth from capital to labor would lower the economy’s marginal propensity to save, and likely raise inflation expectations, leading to higher interest rates. It’s important to note that there are a lot of hurdles to overcome before Sanders’ full policy agenda is implemented. First he must secure the Democratic nomination, then defeat Donald Trump in the general election. Even after that, he will still need to convince the House and Senate to pass non-watered down versions of his proposals. With such a long road ahead, we don’t think Sanders’ momentum will push bond yields higher in 2020. Rather, the risk is that Sanders’ rise keeps bond yields low in 2020 as risk assets sell off. If Bernie Sanders looks poised to win the nomination, we will consider reducing our 6-12 month allocation to spread product and increasing our recommended portfolio duration. The outlook for the Democratic Primary should become clearer after Super Tuesday on March 3. If Sanders looks poised to win the nomination we will consider reducing our recommended 6-12 month allocation to spread product and increasing our recommended portfolio duration. Bottom Line: Bond yields will stay low until the daily number of new COVID-19 cases falls to zero, at which point a sell-off is likely. We therefore recommend maintaining below-benchmark portfolio duration on a 6-12 month horizon. Rising odds of a Bernie Sanders presidential win could prevent bond yields from rising at all this year. We may adjust our recommendations in the coming months if this risk increases. Investors should maintain an overweight allocation to spread product versus Treasuries, with a preference for junk. Though the credit cycle is far from over (see next section), we may reduce our recommended allocation to spread product versus Treasuries if Sanders’ election chances rise. Bank Lending Standards Won’t Push Credit Spreads Wider In 2020 The net change in commercial & industrial (C&I) bank lending standards, as reported in the Fed’s quarterly Senior Loan Officer Survey, is a vitally important indicator for the credit cycle. Easing lending standards tend to coincide with a low default rate and falling credit spreads, while tightening lending standards usually coincide with spread widening and a rising default rate. With that in mind, it is mildly concerning that bank lending standards have been fluctuating around neutral levels for quite some time, and have in fact tightened in two of the past five quarters (Chart 4). In this week’s report we consider whether tighter bank lending standards could pose a risk to our overweight spread product view in 2020. Chart 4Bank Lending Standards And Monetary Variables
Bank Lending Standards And Monetary Variables
Bank Lending Standards And Monetary Variables
Bank lending standards are such an important credit cycle variable because they tell us about the supply of credit. A corporate default only occurs when credit supply is lower than the amount required for that firm’s survival. On a macro scale, we can think of two main reasons why lenders might restrict the credit supply: They perceive the monetary environment as restrictive. That is, they worry about higher interest rates and slower growth in the future. They perceive corporate balance sheets as being in poor health. That is, they worry that firms won’t be sufficiently profitable to make good on their debts. We find that monetary indicators do a very good job of predicting when lending standards will tighten. Looking back at the past two cycles, lending standards didn’t tighten until after: The yield curve inverted (Chart 4, panel 2). The real fed funds rate was above its estimated equilibrium level (Chart 4, panel 3). Inflation expectations were at or above target levels (Chart 4, bottom panel). Presently, all three of these monetary indicators are supportive. Some portions of the yield curve have been inverted at various times during the past year. But in general, the inversion signal from the yield curve has not been as strong as it was when lending standards tightened in prior cycles. For instance, the 3-year/10-year Treasury slope has not inverted this cycle, and it currently sits at +20 bps (Chart 4, panel 2). Further, the real fed funds rate is below most estimates of its neutral level and the Fed is signaling that it will keep it there for a long time yet. This dovish posture is justified by inflation expectations that remain well below target. It is conceivable that, despite the accommodative monetary environment, banks might be so concerned about poor balance sheet health that they are becoming more cautious with their lending. However, a survey of corporate health metrics doesn’t point to an imminent tightening of bank lending standards either (Chart 5). Chart 5Bank Lending Standards And Corporate Balance Sheet Variables
Bank Lending Standards And Corporate Balance Sheet Variables
Bank Lending Standards And Corporate Balance Sheet Variables
In past cycles, tighter bank lending standards were preceded by: A trough in gross leverage (pre-tax profits over total debt) (Chart 5, panel 2). A peak in interest coverage (Chart 5, panel 3). Negative pre-tax profit growth (Chart 5, panel 4). A peak in profit margins (Chart 5, bottom panel). Currently, gross leverage is the only one of the above four variables that is clearly sending a negative signal. As for the other three, interest coverage and profit margins are barely off their cyclical highs, and profit growth has been fluctuating around zero for three years. If global growth rebounds during the next 12 months, as we expect, then profit growth will also move modestly higher. Bottom Line: Neither monetary nor balance sheet variables point to an imminent tightening of bank lending standards. We expect that the supply of credit will remain ample in 2020, keeping the default rate low and credit spreads tight. A Note On Falling C&I Loan Demand In addition to questions about lending standards, the Fed’s Senior Loan Officer Survey also asks banks to report whether they are seeing stronger or weaker demand for C&I loans. In response, banks have reported weaker C&I loan demand for six consecutive quarters, ending in Q4 2019. Historically, it is unusual for C&I loan demand to fall without a concurrent tightening in lending standards (Chart 6). Chart 6Explaining Weakening Loan Demand
Explaining Weakening Loan Demand
Explaining Weakening Loan Demand
We also see the impact of weaker loan demand in the hard data. C&I loan growth has been falling since early 2019 (Chart 6, panel 2) and net corporate bond issuance had been on a sharp downtrend since 2015, before moving higher last year (Chart 6, bottom panel). So what’s going on with C&I loan demand? We can think of two reasons why firms might seek out less credit. First, they may face a dearth of investment opportunities, or alternatively, they might perceive some benefit from carrying less debt on their balance sheets. On the first point, we find that new orders for core capital goods do a very good job explaining the swings in C&I lending (Chart 7). Specifically, we see that the global growth slowdown of 2015/16 drove both investment spending and C&I lending lower. Then, both series recovered in 2017/18 before moving down again during last year’s slowdown. Surveys about firms’ capital spending plans also dropped last year, consistent with the deceleration in C&I lending, but remain at high levels (Chart 7, bottom three panels). All of this suggests that C&I loan growth will recover this year as global growth improves and the investment landscape brightens. Capital goods new orders do a good job explaining C&I lending. Corporate bond issuance has followed a different path from C&I lending during the past few years. Specifically, bond issuance slowed in 2015/16 as investment spending dried up. But it did not recover in 2017/18 the way that investment spending and C&I lending did. This appears to be a result of the 2018 corporate tax cuts and repatriation holiday. Chart 8 shows that the Financing Gap – the difference between capex spending and retained earnings – plunged in 2018 because firms suddenly received a huge influx of retained earnings. The influx came in part from the lower tax rate, but mostly from repatriated cash that had been stranded overseas. Simply, firms didn’t need to issue bonds to finance their investment plans in 2018 because they had a lot more cash on hand. Chart 7C&I Lending Follows ##br##Investment
C&I Lending Follows Investment
C&I Lending Follows Investment
Chart 8A Negative Financing Gap Limits The Need For Debt
A Negative Financing Gap Limits The Need For Debt
A Negative Financing Gap Limits The Need For Debt
What about the possibility that firms are demanding less debt because they are trying to clean up their balance sheets? Beyond a few anecdotes, we don’t see much support for this idea. In fact, an equity index of firms with low debt/asset ratios has been underperforming an index of firms with high debt/asset ratios (Chart 9). This suggests that there is currently little reward for firms that are paying down debt. Chart 9Firms Not Rewarded For Healthy Balance Sheets
Firms Not Rewarded For Healthy Balance Sheets
Firms Not Rewarded For Healthy Balance Sheets
Bottom Line: Weaker demand for C&I loans is a result of the recent global growth downturn and decline in investment spending. It is not a harbinger of the end of the credit cycle. Loan demand should improve as global growth rebounds this year. Ryan Swift US Bond Strategist rswift@bcaresearch.com Footnotes 1 Please see US Bond Strategy Weekly Report, “How Are Inflation Expectations Adapting?”, dated February 11, 2020, available at usbs.bcaresearch.com 2 For further details on our Golden Rule of Bond Investing please see US Bond Strategy Special Report, “The Golden Rule of Bond Investing”, dated July 24, 2018, available at usbs.bcaresearch.com 3 https://projects.fivethirtyeight.com/2020-primary-forecast/?ex_cid=rrpromo Fixed Income Sector Performance Recommended Portfolio Specification
Highlights Provided that the coronavirus outbreak is contained, global growth should accelerate over the course of 2020. Stocks usually rise when the economy is strengthening. But could this time be different? We explore five scenarios in which the stock market could decouple from the economy: 1) The economy holds up, but stretched valuations bring down equities, especially high-flying growth stocks; 2) Bond yields rise in response to faster growth, hurting equities in the process; 3) A strong US economy lifts the value of the dollar, denting multinational profits and tightening financial conditions abroad; 4) Faster wage growth cuts into corporate profits; and 5) Redistributionist politicians seek to shift income from capital to labor. We are not too concerned about the first four scenarios, but we do worry about the fifth, especially now that betting markets are giving Bernie Sanders a nearly 50% chance of becoming the Democratic nominee. Matters should be clearer by mid-March, by which time more than 60% of Democratic delegates will have been awarded. If Bernie Sanders does emerge as the nominee at that point, we will consider trimming back our bullish cyclical bias towards stocks. Coronavirus: A Break In The Clouds? Chart 1Coronavirus Remains Mostly Contained To China
Will The Stock Market Decouple From The Economy?
Will The Stock Market Decouple From The Economy?
Investors continue to grapple with two distinct narratives about how the coronavirus outbreak is unfolding. On the pessimistic side, some contend that the true number of infections in China is much higher than the Chinese authorities are disclosing. How else, they ask, can one explain why the government has taken the extreme step of imposing some form of quarantine on 400 million of its own people? More optimistic observers argue that the Chinese government is simply being proactive. While the number of cases in Hubei province spiked yesterday, this was due to a loosening in the definition for what constitutes a confirmed infection. Whereas previously a positive laboratory test was required, now a positive imaging-based clinical examination will suffice. Under the new definition, the number of newly confirmed cases fell from 6,528 on February 11th to 4,273 on February 12th. Under the old definition, newly diagnosed cases peaked on February 2nd (Chart 1). The revised definition adopted in Hubei brought the mortality rate in the province down to 2.7%. The mortality rate observed in the rest of China is 0.5%. The share of all cases in China originating in Hubei also rose to 81%. Even before the rule change, the share of cases diagnosed in Hubei had risen from 52% on January 26th to 75% on February 11th. This suggests progress in limiting the outbreak to the province. Critically, the number of cases in the rest of the world remains low. In the US, a total of 13 cases have been confirmed as of February 12th, just two more than the 11 reported on February 2nd. The Exception To The Rule? Provided that the coronavirus outbreak is contained, global growth should bounce back forcefully in the second quarter. If that were to occur, history suggests that equities will continue to rally, while bond prices will fall (Chart 2). But could history fail to repeat itself? In this week’s report, we explore five scenarios in which that may happen. Scenario 1: Stretched valuations bring down equities, especially high-flying growth stocks Stocks have moved up considerably since their December 2018 lows. This suggests that investors have become more confident about the economic outlook. Nevertheless, while most investors may no longer be worried about an imminent recession, they do not foresee a sharp acceleration in global growth either. This is evidenced by the fact that cyclical stocks have generally underperformed defensives (Chart 3). Oil prices have also languished, while copper prices are back near a 2.5-year low (Chart 4). Chart 2Stocks Usually Outperform Bonds When Global Growth Is Accelerating
Stocks Usually Outperform Bonds When Global Growth Is Accelerating
Stocks Usually Outperform Bonds When Global Growth Is Accelerating
Chart 3Cyclicals Have Failed To Outperform Defensives
Cyclicals Have Failed To Outperform Defensives
Cyclicals Have Failed To Outperform Defensives
At the broad index level, global equities trade at 16.7-times forward earnings. Conceptually, the inverse of the PE ratio – the earnings yield – should serve as a reasonable guide for the total real return that equities will deliver over the long haul.1 At 6%, the global earnings yield still points to decent returns for global stocks. Relative to bonds, the case for owning stocks is even more compelling. The equity risk premium, which one can compute as the earnings yield minus the real bond yield, remains well above its historic average (Chart 5). Chart 4Commodity Prices Have Taken It On The Chin
Commodity Prices Have Taken It On The Chin
Commodity Prices Have Taken It On The Chin
Chart 5Relative Valuations Favor Equities
Relative Valuations Favor Equities
Relative Valuations Favor Equities
That said, there are pockets where valuations have gotten stretched. US equities trade at 19.5-times forward earnings compared to 14.1-times in the rest of the world. Growth stocks, in particular, have gotten very expensive (Chart 6). The five largest stocks in the S&P 500 (Apple, Microsoft, Amazon, Alphabet, and Facebook) now account for 18% of the index, the same share that the top five stocks (Microsoft, Cisco, GE, Intel, and Exxon) commanded in 2000. The big risk for stocks is that wages go up not because the overall size of the economic pie is growing, but because policies are implemented that shift a bigger share of the pie from capital to labor. Despite the similarities between today and the dotcom era, there are a few critical differences – most of which make us less worried about the current state of affairs. First, while tech valuations are currently stretched, they are not in bubble territory. The NASDAQ Composite trades at 30-times trailing earnings. At its peak in March 2000, the tech-heavy index traded at more than 70-times earnings (Chart 7). Chart 6Growth Stocks Have Become Expensive Relative To Value Stocks
Growth Stocks Have Become Expensive Relative To Value Stocks
Growth Stocks Have Become Expensive Relative To Value Stocks
Chart 7Not Yet Partying Like 1999
Not Yet Partying Like 1999
Not Yet Partying Like 1999
Second, IPO activity has also been more muted today than during the dotcom boom (Chart 8). Only 110 companies went public last year, with the gain on the first day of trading averaging 24%. In 1999, 476 companies went public. The average first day gain was 71%. Meanwhile, companies continue to buy up their shares. The buyback yield stands at 3%, twice as high as in the late 1990s. Third, there is no capex overhang like in the late 1990s (Chart 9). This reduces the odds of a 2001-recession scenario where falling equity prices prompted companies to pare back capital expenditures, leading to rising unemployment and even lower equity prices. Chart 8IPO Activity Is Muted Today Compared To The Late 1990s
IPO Activity Is Muted Today Compared To The Late 1990s
IPO Activity Is Muted Today Compared To The Late 1990s
Chart 9No Capex Boom This Time
No Capex Boom This Time
No Capex Boom This Time
Scenario 2: Bond yields rise in response to faster growth, hurting equities in the process The period between November 2018 and September 2019 was an odd one for the stock-to-bond correlation. If one looks at daily data, stocks did best when bond yields were rising. Yet, for the period as a whole, stocks finished higher while bond yields finished lower (Chart 10). Chart 10Daily Changes: S&P 500 Vs. 10-Year Treasury Yield
Will The Stock Market Decouple From The Economy?
Will The Stock Market Decouple From The Economy?
How can one explain this seeming paradox? The answer is that the underlying trend in bond yields was squarely to the downside last year. While yields did rise modestly on days when equities rallied, yields fell sharply on days when equities swooned. If one zooms out, one sees the underlying trend, whereas if one zooms in, one only sees the wiggles around the trend. Bond yields trended lower last year because the Fed and most other central banks were delivering one dose of dovish medicine after another. This year, however, the Fed is on hold, and while a few central banks may still cut rates, global monetary policy is unlikely to become much looser. This means that bond yields are likely to drift higher if economic growth surprises on the upside. Will rising bond yields sabotage the stock market? We do not think so. Stocks crashed in late 2018 because investors became convinced that US monetary policy had turned restrictive after the Fed had raised rates by a cumulative 200 basis points over the prior two years. The fact that the Laubach-Williams model, one of the most widely followed models of the neutral rate, showed that real rates had moved above their equilibrium level did not help sentiment (Chart 11). Chart 11The Fed Will Keep Policy Easy For The Time Being
The Fed Will Keep Policy Easy For The Time Being
The Fed Will Keep Policy Easy For The Time Being
Chart 12Stocks Do Well When Earnings And Growth Surprise On The Upside
Stocks Do Well When Earnings And Growth Surprise On The Upside
Stocks Do Well When Earnings And Growth Surprise On The Upside
Today, real rates are about 100 basis points below the Laubach-Williams estimate. This will not change anytime soon, given that the Fed is likely to remain on hold at least until the end of the year. So long as rates stay put, monetary policy will remain accommodative, allowing the economy to grow at a solid pace. Granted, rising long-term bond yields will reduce the present value of future cash flows, thus potentially hurting stocks. However, as we discussed three weeks ago, the discount rate is not the only thing that affects equity valuations.2 The expected growth rate of earnings matters too. As Chart 12 shows, global equity returns are highly sensitive to earning revisions. While earnings may disappoint in the first quarter due to the economic damage from the coronavirus, they should bounce back during the remainder of this year. This should pave the way for higher equity prices. Scenario 3: A strong US economy lifts the value of the dollar, denting multinational profits and tightening financial conditions abroad The US is a fairly closed economy. Imports and exports account for only 14.6% and 11.7% of GDP, respectively. In contrast, the US stock market is very exposed to the rest of the world. S&P 500 companies derive over 40% of their sales from abroad. As such, changes in the value of the dollar tend to have a bigger impact on Wall Street than on Main Street. Estimating the degree to which a stronger dollar reduces S&P 500 profits is no easy task. Direct estimates that measure the currency translation effect on overseas profits from a stronger dollar tend to yield fairly modest results, typically showing that a 10% appreciation in the trade-weighted dollar reduces S&P 500 profits by about 2%. These estimates, however, generally do not take into account feedback loops between a strengthening dollar and global financial conditions (Chart 13). According to the Bank of International Settlements, $12 trillion of dollar-denominated debt has been issued outside the US. A stronger dollar makes it more challenging to service this debt, which can put a significant strain on borrowers. As a result, a vicious cycle can erupt where a stronger dollar leads to tighter financial conditions, which in turn lead to weaker global growth and an even stronger dollar. Chart 13A Strong US Dollar Could Tighten Global Financial Conditions, Leading To Lower Equity Prices, Especially In EM
A Strong US Dollar Could Tighten Global Financial Conditions, Leading To Lower Equity Prices, Especially In EM
A Strong US Dollar Could Tighten Global Financial Conditions, Leading To Lower Equity Prices, Especially In EM
Such an outcome cannot be dismissed, especially if the spread of the coronavirus fuels significant foreign inflows into the safe-haven US Treasury market. Nevertheless, we continue to see it as a low-probability event given the tailwinds to global growth, including the lagged effects of last year’s decline in bond yields, an improvement in the global manufacturing inventory cycle, diminished Brexit and trade war risks, and ongoing policy stimulus out of China. In fact, one can more easily envision the opposite outcome – a virtuous cycle of dollar weakness, leading to easier global financial conditions, stronger growth, and ultimately, an even weaker dollar (Chart 14). In such an environment, earnings growth is likely to accelerate (Chart 15). Chart 14The Dollar Is A Countercyclical Currency
The Dollar Is A Countercyclical Currency
The Dollar Is A Countercyclical Currency
Chart 15The Virtuous Cycle Of Dollar Easing
The Virtuous Cycle Of Dollar Easing
The Virtuous Cycle Of Dollar Easing
Scenario 4: Faster wage growth cuts into corporate profits Labor compensation is the largest expense for most companies. Thus, it stands to reason that faster wage growth could depress earnings, and by extension, share prices. Although this is possible conceptually, in practice, it happens less often than one might guess. Chart 16 shows that rising wage growth is positively correlated with earnings. The bottom panel of the chart explains why: Wages tend to rise most quickly when sales are growing rapidly. Strong demand growth adds to revenues, while allowing companies to spread fixed costs over a large amount of output. The resulting improvement in “operating leverage” helps buffer profit margins from higher wages. Scenario 5: Redistributionist politicians seek to shift income from capital to labor As long as wages are rising against a backdrop of fast sales growth, equities will fare well. The big risk for stocks is that wages go up not because the overall size of the economic pie is growing, but because policies are implemented that shift a bigger share of the pie from capital to labor. Bernie Sanders has promised to do just that. The S&P 500 has tended to increase when Sanders’ perceived chances of winning the Democrat nomination have risen (Chart 17). Investors have apparently concluded that Trump would clobber Sanders in a presidential race. Hence, the better Sanders performs in the primaries, the more likely Trump is to be re-elected. Chart 16Stocks Tend To Do Best When Wage Growth Is Rising
Stocks Tend To Do Best When Wage Growth Is Rising
Stocks Tend To Do Best When Wage Growth Is Rising
Chart 17The Sanders Effect On Stocks
The Sanders Effect On Stocks
The Sanders Effect On Stocks
Is this really a safe assumption? We are not so sure. Sanders has still beaten Trump in 49 of the last 54 head-to-head polls tracked by Realclearpolitics over the past 12 months. Sanders tends to appeal to white working class voters – the same demographic that propelled Trump into office. Sanders is also benefiting from a secular leftward shift in voter attitudes on economic issues. According to a recent Gallup poll, 47% of Americans believe that governments should do more to solve problems, up from 36% in 2010. Almost 40% of Americans have a positive view on socialism (Chart 18). Today’s youth in particular is enamored with left-wing ideology (Chart 19). Chart 18The US Is Moving To The Left
Will The Stock Market Decouple From The Economy?
Will The Stock Market Decouple From The Economy?
Chart 19Woke Millennials Cozying Up To Socialism
Will The Stock Market Decouple From The Economy?
Will The Stock Market Decouple From The Economy?
It’s not just the Democratic voters who are trending left. Some prominent Republicans are having second thoughts too. Tucker Carlson is probably the best leading indicator for where the Republican Party is heading. His attacks on “woke capitalism” have become a staple of his popular evening show.3 It is not surprising why many Republicans are having a change of heart. For decades, the Republican Party has been a cheap date for corporate interests: It has given businesses what they want – lower taxes, less regulation, etc. – without asking for much in return (aside from campaign contributions, of course). This has allowed corporations to focus on appealing to left-wing interests by taking increasingly strident positions on a variety of social issues. The fact that some of these positions – such as support for open-border immigration policies – are a boon for profits has only increased their appeal. The risk for corporations is that they end up with no real political support. If the Democrats move further to the left, “soak the rich” policies will become popular no matter how much virtue signaling corporate leaders deliver. Likewise, if Republicans abandon big businesses, today’s fat profit margins will become a thing of the past. When The Music Ends The current market climate resembles a Parisian ball on the eve of the French Revolution. The music is still playing, but the discontent among the commoners outside is growing. The question is when will this discontent boil over? Trump’s victory in 2016 represented a shot across the bow of the political establishment. Fortunately for corporate interests, aside from his protectionist impulses, Trump has been on their side. Bernie Sanders would not be so friendly. Matters should be clearer by mid-March. Super Tuesday takes place on March 3rd. By March 17th, more than 60% of Democratic delegates will have been awarded. If Bernie Sanders emerges as the likely nominee at that point, we will consider trimming back our bullish cyclical 12-month bias towards stocks. Peter Berezin Chief Global Strategist peterb@bcaresearch.com Footnotes 1 Please see Global Investment Strategy Special Report, “TINA To The Rescue?” dated August 23, 2019. 2 Please see Global investment Strategy Weekly Report, “Bond Yields: How High Is Too High?” dated January 17, 2020. 3 Ian Schwartz, “Tucker Carlson: Elizabeth Warren's "Economic Patriotism" Plan "Sounds Like Donald Trump At His Best," realclearpolitics, June 6, 2019. Global Investment Strategy View Matrix
Will The Stock Market Decouple From The Economy?
Will The Stock Market Decouple From The Economy?
MacroQuant Model And Current Subjective Scores
Will The Stock Market Decouple From The Economy?
Will The Stock Market Decouple From The Economy?
Strategic Recommendations Closed Trades
Highlights Geopolitical sparks in the Mediterranean point to the revival of realism or realpolitik in places where it has long been dormant. Europe is wary of Russia but will keep buying more of its natural gas. This will be a source of tension with the United States. Turkey is wary of Russia but will continue choosing pragmatic deals with Moscow that fly in the face of Europe and the United States. Turkey’s intervention in Libya is small but symbolic. Increases in foreign policy aggressiveness are negative signs for Turkey as they stem from domestic economic and political instability. Short Turkish currency, equities, and local government bonds. The recent increase in immigration into Europe will fuel another bout of populism if it goes unchecked. Feature “Multipolarity,” or competition among multiple powerful nations, is our overarching geopolitical theme at BCA Research. The collapse of the Soviet Union did not lead to the United States establishing a global empire, which might in theory have provided a stable and predictable trade and investment regime. The United States lashed out when attacked but otherwise became consumed by internal struggles: financial crisis and political polarization. Under two administrations the American public has demanded a reduced commitment to international affairs. Europe is even less likely to project power abroad – particularly after being thrown on the defensive by the Syrian and Libyan revolutions and ineffectual EU responses. Turkey’s aggressive foreign policy is a symptom of global multipolarity – which makes the world less predictable for investors. Emerging markets have risen in economic and military power relative to their developed counterparts. They demand a redistribution of global political power to set aright historical grievances and address immediate concerns, such as supply line insecurities, which increase alongside a rapidly growing economy. Multipolarity is apparent in Russia’s resurgence: pushing back on its borders with Europe and NATO, seeking a greater role in the Middle East and North Africa, interfering in US politics, and cementing its partnership with China. Multipolarity is equally evident when medium-sized powers – especially those that used to take orders from the US and Europe – seek to establish an independent foreign policy and throw off the shackles of the past. Turkey is just such a middle power. Strongman President Recep Tayyip Erdogan initially sought to lead Turkey into a new era of regional ascendancy. The Great Recession and Arab Spring intervened. Domestic economic vulnerabilities and regional instability have driven him to pursue increasingly populist and unorthodox policies that threaten the credit of the nation and security of the currency. A coup attempt in 2016 and domestic political losses in 2019 drove Erdogan further down this path, which includes aggressive foreign policy as well as domestic economic stimulus. The Anatolian peninsula has always stood at the crossroads of Europe and Asia, as well as Russia and Africa. Turkey’s efforts to change the regional status quo to its favor, increase leverage over its neighbors in Europe and the Middle East, and deal with Russia’s Vladimir Putin from a position of strength, are causing the geopolitics of the Mediterranean to heat up. It has now intervened in the Libyan civil war. In this special report, we focus on this trend and ask what it means for global investors. Unfinished Business In Libya Chart 1Haftar Is Weaponizing Libya’s Oil
The Geopolitics Of The Mediterranean
The Geopolitics Of The Mediterranean
As the Libyan conflict enters its sixth year this spring, the battle for control of the western bastion of Tripoli rages. Multiple efforts to mediate the conflict between Field Marshal Khalifa Haftar of the Libyan National Army (LNA) and Prime Minister Fayez al-Sarraj of the UN-recognized Government of National Accord (GNA) have failed. Ceasefire talks in Moscow, Rome, and Berlin have fizzled. Instead, fighting has finally hit oil production, with the state-run National Oil Corp (NOC) declaring force majeure on supplies on January 18. Tribal leaders who support Haftar have blockaded eastern ports (Chart 1). Previously the mutual dependence of the rival factions on oil revenues ensured production and exports went mostly undisturbed. LNA forces control nearly all key oil pipelines, fields, ports, and terminals in Libya. The exceptions are the Zawiyya and Mellitah terminals and offshore fields (Map 1). However the National Oil Company (NOC), headquartered in the GNA-controlled Tripoli, is the sole entity controlling operations and the sole marketer of Libyan oil. Map 1Libya’s Oil And Natural Gas Infrastructure: Monopolized By Haftar
The Geopolitics Of The Mediterranean
The Geopolitics Of The Mediterranean
General Haftar’s blockade – which has ground oil production to a halt – displays his ability to weaponize oil to obtain concessions from the Tripoli-based government. Tribal leaders behind the blockade are calling for a larger share of oil revenues, for which they are at the mercy of the LNA and NOC. With little progress in Haftar’s push to gain control of Tripoli, and Libya more generally, the conflict has reached a stalemate. Not one to back down, Haftar’s decision to cut off oil sales from the Tripoli government, which also cuts off revenues to his own parallel administration, is a brute attempt to force a settlement. Haftar’s gambit follows Turkey’s decision to intervene in Libya on behalf of Sarraj and the GNA. Turkey has deployed roughly 2,000 Syrian fighters, as well as 35 Turkish soldiers in an advisory capacity. Turkey apparently feared that Haftar, who has substantial backing from Egypt and the Gulf Arabs as well as Russia and France, was about to triumph, or at least force a settlement detrimental to Turkish interests. Bottom Line: Turkey’s decision to intervene in the Libyan civil war – while limited in magnitude thus far – raises the stakes of the conflict, which involves the EU, Russia, and the Arab states. It is a clear signal of the geopolitical multipolarity in the region – and a political risk that is flying under the radar amid higher profile risks in other parts of the world. Political Interests: Islamist Democracy Versus Arab Dictatorship The Libyan civil war is a proxy war between foreign nations motivated by conflicting economic and strategic interests in North Africa and the Mediterranean. But there is an ideological and political structure to the conflict that explains the alignment of the nations: Turkey is exporting democracy while the Arab states try to preserve their dictatorships. Haftar’s primary supporters include Egypt, the United Arab Emirates (UAE), and Saudi Arabia. These states see monarchy as the way to maintain stability in a region constantly on the edge of chaos. Islamist democracy movements, such as Egypt’s Muslim Brotherhood, pose a threat to their long-term authority and security. They try to suppress these movements and contain regimes that promote them or their militant allies. They are willing to achieve one-man rule by force and thus support military strongmen like Egypt’s Abdel Fattah el-Sisi and Libya’s General Haftar. On the other side of the conflict stand the backers of the GNA – Turkey and Qatar – which support political Islam and party politics (Chart 2). Turkey’s Erdogan and his Justice and Development Party (AKP) are sympathetic to Hamas in the Palestinian territories and Egypt’s Muslim Brotherhood. They want to ensure a lasting role for Islamic parties in the region, which strengthens their legitimacy. They do not want Libya’s Islamists to suffer the same fate as their affiliates in the Muslim Brotherhood – removal via a military coup. Chart 2Turkey Sees A Place For Political Islam
Turkey Sees A Place For Political Islam
Turkey Sees A Place For Political Islam
Chart 3Turkey Steps In Amid Qatar Embargo
The Geopolitics Of The Mediterranean
The Geopolitics Of The Mediterranean
The political conflict is mirrored in the Persian Gulf in the form of the air, land, and sea embargo imposed on Qatar in 2017 at the hands of the Saudis, Egyptians, and Emiratis. The Qatar crisis followed a 2014 diplomatic rift and the 2011 Arab Spring, when Qatar supported protesters and democracy movements against neighboring regimes. The embargo strengthened Turkey-Qatar relations, as Turkey stepped in to ensure that Qataris – who are heavily dependent on imports – would continue to receive essentials (Chart 3). Bottom Line: The alliances forged in the Libyan conflict reflect differing responses to powerful forces of change in the region. Established monarchies and dictatorships are struggling to maintain control of large youth populations and rapidly modernizing economies. Their response is to fortify the existing regime, suppress dissent, and launch gradual reforms through the central government. Their fear of Islamist movements makes them suspicious of Tripoli and the various Islamist groups allied with the GNA, and aligns them with Khalifa Haftar’s attempt to impose a new secular dictatorship in Libya. Meanwhile Turkey, with an active Islamist democracy, is seeking to export its political model, and Muslim Brotherhood-esque political participation, to gain influence across the region, including in Libya and North Africa. Economic Interests: The Scramble For Energy Sources Chart 4Europe Addicted To Russian Gas
The Geopolitics Of The Mediterranean
The Geopolitics Of The Mediterranean
The Libyan proxy war is also about natural resources, for all the powers involved. Turkey’s intervention reflects its supply insecurity and desire to carve a larger role for itself in the east Mediterranean economy. Turkey needs to secure cheap energy supplies, and also wants to make itself central to any emerging east Mediterranean natural gas hub that aims to serve Europe. Europe’s increasing dependency on natural gas imports to meet its energy demand, and Russia’s outsized role – supplying the EU with 40% of its needs – have encouraged a search for alternative suppliers (Chart 4). Israel is attempting to fill that role with resources discovered offshore in the eastern Mediterranean. Given its strategic location, Turkey hopes to become an energy hub. First, it is cooperating with the Russians. Presidents Putin and Erdogan inaugurated the Turkish Stream pipeline (TurkStream) at a ceremony in Istanbul on January 8. The pipeline will transport 15.75 billion cubic meters (Bcm) of Russian natural gas to Europe via Turkey. This is part of Russia’s attempt, along with the Nord Stream 2 pipeline, to bypass Ukraine and increase export capacity, strengthening its dominance over Europe’s natural gas market (Map 2). Map 2Russia’s Latest Pipelines Bypass Ukraine
The Geopolitics Of The Mediterranean
The Geopolitics Of The Mediterranean
Europe and its allies are wary of Russian influence, but the EU is not really willing to halt business with Russia, which is a low-cost and long-term provider free from the turmoil of the Middle East. Despite the significant growth in US natural gas supplies, the relatively higher cost makes Russian supplies comparatively more attractive (Chart 5). Chart 5Russian Gas Is Competitive In European Markets …
The Geopolitics Of The Mediterranean
The Geopolitics Of The Mediterranean
Chart 6… As US Attempts To Gain Market Share
The Geopolitics Of The Mediterranean
The Geopolitics Of The Mediterranean
The result will be tensions with the United States, which expects the Europeans to honor the security relationship by buying American LNG (Chart 6) and will always abhor anything resembling a Russo-European alliance. American legislation signed on December 20 would impose sanctions on firms that lay pipes for Nord Stream 2 and TurkStream. Second, Turkey wants to become central to eastern Mediterranean energy development. A series of offshore discoveries in recent decades has sparked talk of cooperation among potential suppliers (Table 1). There is a huge constraint on developing the fields quickly, as there is no export route currently available for the volumes that will be produced. While the reserves are not significant on a global scale, their location so close to Europe, and growing needs in the Middle East, has generated some interest. Table 1Recent East Mediterranean Discoveries Are Relatively Small, But Geopolitically Attractive
The Geopolitics Of The Mediterranean
The Geopolitics Of The Mediterranean
However, Europe and Israel – the status quo powers – threaten to marginalize Turkey in this process: A meeting of the energy ministers of Egypt, Cyprus, Greece, Israel, Italy, the Palestinian territories, and Jordan in Cairo last July resulted in the creation of the Eastern Mediterranean Gas Forum to promote regional energy cooperation. Turkey – along with Lebanon and Syria – was excluded. Turkey seeks access to natural resources – and to prevent Israel, Egypt, and Europe from excluding it. The EastMed Pipeline deal – signed by Greece, Cyprus, and Israel on January 2 – envisages a nearly 2,000 km subsea pipeline transporting gas from Israeli and Cypriot offshore fields to Cyprus, Crete and Greece, supplying Europe with 9-12 Bcm per year (Map 3). The project enjoys the support of the European Commission and the US as an attempt to diversify Europe’s gas supplies and boost its energy security.1 But it would also be an alternative to an overland pipeline on Turkish territory. Map 3The Proposed EastMed Pipeline Would Marginalize Turkey
The Geopolitics Of The Mediterranean
The Geopolitics Of The Mediterranean
Egypt has two underutilized liquefied natural gas plants – in Idku and Damietta – and has benefited from the 2015 discovery of the Zohr gas field. Egypt has recently become a net exporter of natural gas (Chart 7). It signed a deal with Israel to purchase 85.3 Bcm – $19.5 billion – of gas from Leviathan and Tamar fields over 15 years. Egypt sees itself as an energy hub if it can re-export Israeli supplies economically. Note that Russia and Turkey have some overlapping interests here. Russia does not want Europe to diversify, while Turkey does not want to allow alternatives to Russia that exclude Turkey. Thus maintaining the current trajectory of natural gas projects is not only useful for Russia’s economy (Chart 8) but also for Turkey’s strategic ambitions. Chart 7Egypt Also Aims To Become East Mediterranean Gas Hub
The Geopolitics Of The Mediterranean
The Geopolitics Of The Mediterranean
Of course, while Russian pipes are actually getting built, the EastMed pipeline is not – for economic as well as geopolitical reasons. Europe is currently well supplied and energy prices are low. At an estimated $7 billion, the cost of constructing the EastMed pipeline is exorbitant. Chart 8Maintaining Energy Dominance Advances Russia’s Strategic Ambitions Too
The Geopolitics Of The Mediterranean
The Geopolitics Of The Mediterranean
Still, Turkey must make its influence known now, as energy development and pipelines are necessarily long-term projects. The chaos in Libya presents an opportunity. Seizing on the Libyan GNA’s weakness, Turkey signed an agreement to provide for offshore maritime boundaries and energy cooperation as well as military aid. The EastMed pipeline, of course, would need to cross through Turkish and Libyan economic zones (see Map 3 above).2 Turkey is incapable of asserting its will militarily in the Mediterranean against powerful western naval forces. But short of war, it is capable of expanding its claims and leverage over regional energy and forcing the Israelis and Europeans to deal with it pragmatically and realistically rather than exclude it from their plans. Part of Turkey’s goal is to cement an alliance with Libya – at least a partitioned western Libyan government in any ceasefire brokered with Haftar and the Russians. Bottom Line: While Turkey and Russia support opposing sides in the Libyan conflict, both benefit from dealing directly with each other – bypassing the western powers, which are frustrated and ineffectual in Libya. Both would gain some direct energy leverage over Europe and both would gain some influence over any future eastern Mediterranean routes to Europe. In Libya, if either side triumphs and unites the country, it will grant its allies oil and gas contracts almost exclusively. But if the different foreign actors can build up leverage on opposing sides, they can hope to secure at least some of their interests in a final settlement. Turkey Needs Foreign Distractions The foregoing would imply that Turkey is playing the game well, except that its foreign adventures are in great part driven by domestic economic and political instability. After all, Turkey’s maritime claims are useless if they cannot be enforced, and offshore development and pipeline-building are at a low level given weak energy prices and slowing global demand. Economically, in true populist fashion, Erdogan has repeatedly employed money creation and fiscal spending to juice nominal GDP growth. The result is a wage-price spiral, currency depreciation, and current account deficits that exacerbate the problem. The poor economy has mobilized political opposition. Over the past year, for the first time since Erdogan rose to power in 2002, his Justice and Development Party is fracturing. Former Turkish deputy prime minister Ali Babacan, a founding member of the AKP, as well as former prime minister Ahmet Davutoglu, have both announced breakaway political parties that threaten to erode support for the AKP. Local elections in 2019 resulted in a popular rebuke in Istanbul. Thus Erdogan is distracting the public with hawkish or nationalist stances abroad that are popular at home. Turkey has taken a strident stance against the US and Europe, symbolized by its threats to loose Syrian refugees into Europe and its purchase of S400 missile defense from Russia despite being a NATO member. Military incursions in Syria aim to relocate refugees back to Syria (Chart 9). Chart 9Erdogan Is Distracting Turks With Popular Foreign Stances
The Geopolitics Of The Mediterranean
The Geopolitics Of The Mediterranean
Chart 10No Love Lost Toward The West
The Geopolitics Of The Mediterranean
The Geopolitics Of The Mediterranean
Turkish public opinion encourages close cooperation with Russia and a more aggressive stance against the West (Chart 10). This is a basis for Russia and Turkey to continue cutting transactional deals despite falling on opposite sides of conflicts in Syria, Libya, Iran, and elsewhere. Erdogan’s pretensions of reviving Ottoman grandeur in the Mediterranean fall in this context. Elections are not until 2023, but we expect Erdogan to continue using foreign policy as a distraction. The opposition is trying to unite behind a single candidate, which could jeopardize Erdogan’s grip on power. The insistence on stimulus at all costs means that Erdogan is not allowing the economic reckoning to occur now, three years before the election. He is trying to delay it indefinitely, which may fail. Libya may not get resolved, however. Allies of Haftar’s LNA – specifically Egypt, Saudi Arabia, and the UAE – will be motivated to intensify their support of him for fear that a loss would revive domestic interest in political Islam. Egypt especially fears militant proxies being unleashed from any base of operations there. The LNA currently serves as a buffer between Egypt and the militant actors in Libya. If Haftar is defeated, Egypt’s porous western border would provoke a harsh reaction from Cairo. The threat of a revival of Islamic State in Libya has united the Egyptian people – a critical variable in the administration’s vision of a stable country. That has provided Egypt’s Sisi an excuse to flex his muscles through military exercises. Neither Russia nor NATO will be moved to bring a decisive finish to the conflict, as neither wishes to invest too heavily in it. Bottom Line: Erdogan has doubled down on populism at home and abroad. His assertive foreign policy in Syria and now Libya may end up exacerbating economic and political pressures on the ruling party. What Is The Endgame In Libya? There are three possible scenarios to end the current stalemate between the Haftar’s forces and the internationally recognized GNA: Military: An outright military victory by either Haftar or Sarraj is highly unlikely. While Haftar’s forces enjoy military and financial support from the UAE, he lacks popular support in Tripoli – which has proved to be challenging to takeover. Similarly, Sarraj’s army is not strong enough to confront the eastern forces and reunify the country. The merely limited involvement of foreign actors – including Turkey – makes a military solution all the more elusive. The most likely path to a quick military victory comes if foreign actors disengage. This will only occur if they are punished for their involvement, and thus it requires a major neutral power, perhaps the United States, to change the calculus of countries involved. But the US is eschewing involvement and the Europeans have shown no appetite for a heavy commitment. Diplomatic: A negotiated settlement is eventually likely, given the loss of oil revenues. A ceasefire would assign some autonomy to each side of the country. Given Haftar’s ambitions of conquering the capital and becoming a strongman for the country as a whole, the diplomatic route will be challenging unless his Gulf backers grow tired of subsidizing him. Financial: Haftar could win by breaking the NOC’s monopoly on oil. In the past, the LNA failed at selling the oil extracted from infrastructure under its control. If Haftar manages to market the oil without the aid of the NOC then he will be able to guarantee a stream of revenue for his forces and at the same time starve the Tripoli government of financing. This would pose an existential risk for the GNA. The key challenge in this scenario is to obtain international backing for LNA sales of Libyan crude supplies. Libya’s partition into two de facto states is the likeliest outcome. Bottom Line: Unless one of the constraints on a military, diplomatic, or financial end to the conflict is broken, the current stalemate in the Libyan conflict will endure. A partition of Libya will be the practical consequence. Turkey hopes to boost its regional influence through Tripoli, and thus increase its leverage over Europe, but a heavy investment could result in fiscal losses or spiral into a broader regional confrontation. Investment Implications While it is not clear how long the current blockade on Libyan ports will last – or the associated over 1 million barrels per day loss of production – oil supplies will remain at risk so long as the conflict endures. However, unlike supplies in the Gulf or in Venezuela, Libyan crude is of the light sweet grade. There is enough global spare capacity – from US shales – to make up for the Libyan loss, at least over the short term. The fall in Libyan supplies is occurring against the backdrop of oil markets that have been beaten down by the decline in demand on the back of the coronavirus impact (Chart 11). The OPEC 2.0 technical panel recommended additional output cuts of 600 thousand barrels per day last week, and is waiting on a final decision by Russia. We expect the cartel to tighten supplies to shore up prices. The instability in Libya could also affect Europe through immigration. The conflict re-routes migrants through the western route and thus could result in an increased flow to Spain and Portugal, rather than Italy which was previously their landing pad (Chart 12). A meaningful pick up would have a negative impact on European domestic political stability, especially with Germany in the midst of a succession crisis and incapable of taking a lead role. Chart 11Libyan Blockade Comes Amid Demand Shock
Libyan Blockade Comes Amid Demand Shock
Libyan Blockade Comes Amid Demand Shock
Chart 12Refugees Will Favor Western Route Across The Mediterranean
Refugees Will Favor Western Route Across The Mediterranean
Refugees Will Favor Western Route Across The Mediterranean
Erdogan’s foreign adventurism, and aggression against the West, poses a risk for Turkish markets. We remain underweight Turkish currency and risk assets. Our Emerging Markets strategists expect foreign capital outflows from EM to weigh on Turkey’s currency, local fixed-income and sovereign credit relative to EM benchmarks. Go short the Turkish lira relative to the US dollar. Bottom Line: Historically, the Mediterranean was the world’s most important waterway. It was the “life line” of the British empire. The US succeeded the British as the guarantor of Suez and corralled both Turkey and Greece into a single alliance under the Truman Doctrine. This status quo held until the twenty-first century. Since 2000, Russia has revived, US foreign policy in the Middle East has become erratic, and the Europeans have lost clout. Turkey is seeking to carve a space for itself and challenge the settlements of the past, all the way back to the 1923 Treaty of Lausanne. Yet in the wake of the Great Recession its economy is unstable and its populist leaders are taking greater risks abroad. The result will be greater friction with Europe, or the Arab states, or both. Given Turkey’s mismanagement at home, and limited gains to be made in Syria or Libya, Turkish assets will be the first to suffer from negative surprises. Roukaya Ibrahim Editor/Strategist Geopolitical Strategy RoukayaI@bcaresearch.com Matt Gertken Vice President Geopolitical Strategist mattg@bcaresearch.com Footnotes 1 The Eastern Mediterranean Security and Energy Partnership Act of 2019 is an American bi-partisan bill the lends full support for the East Med pipelines and greater security cooperation with Israel, Cyprus, and Greece. The US Senate also passed an amendment to the National Defense Authorization Act last June which ended the arms embargo on Cyprus. 2 Turkey has also been engaging in drilling activities in disputed waters near Cyprus – which Ankara argues it is undertaking in order to protect Turkish-Cypriot claims – motivating EU economic sanctions in the form of travel bans and asset freezes on two Turkish nationals.
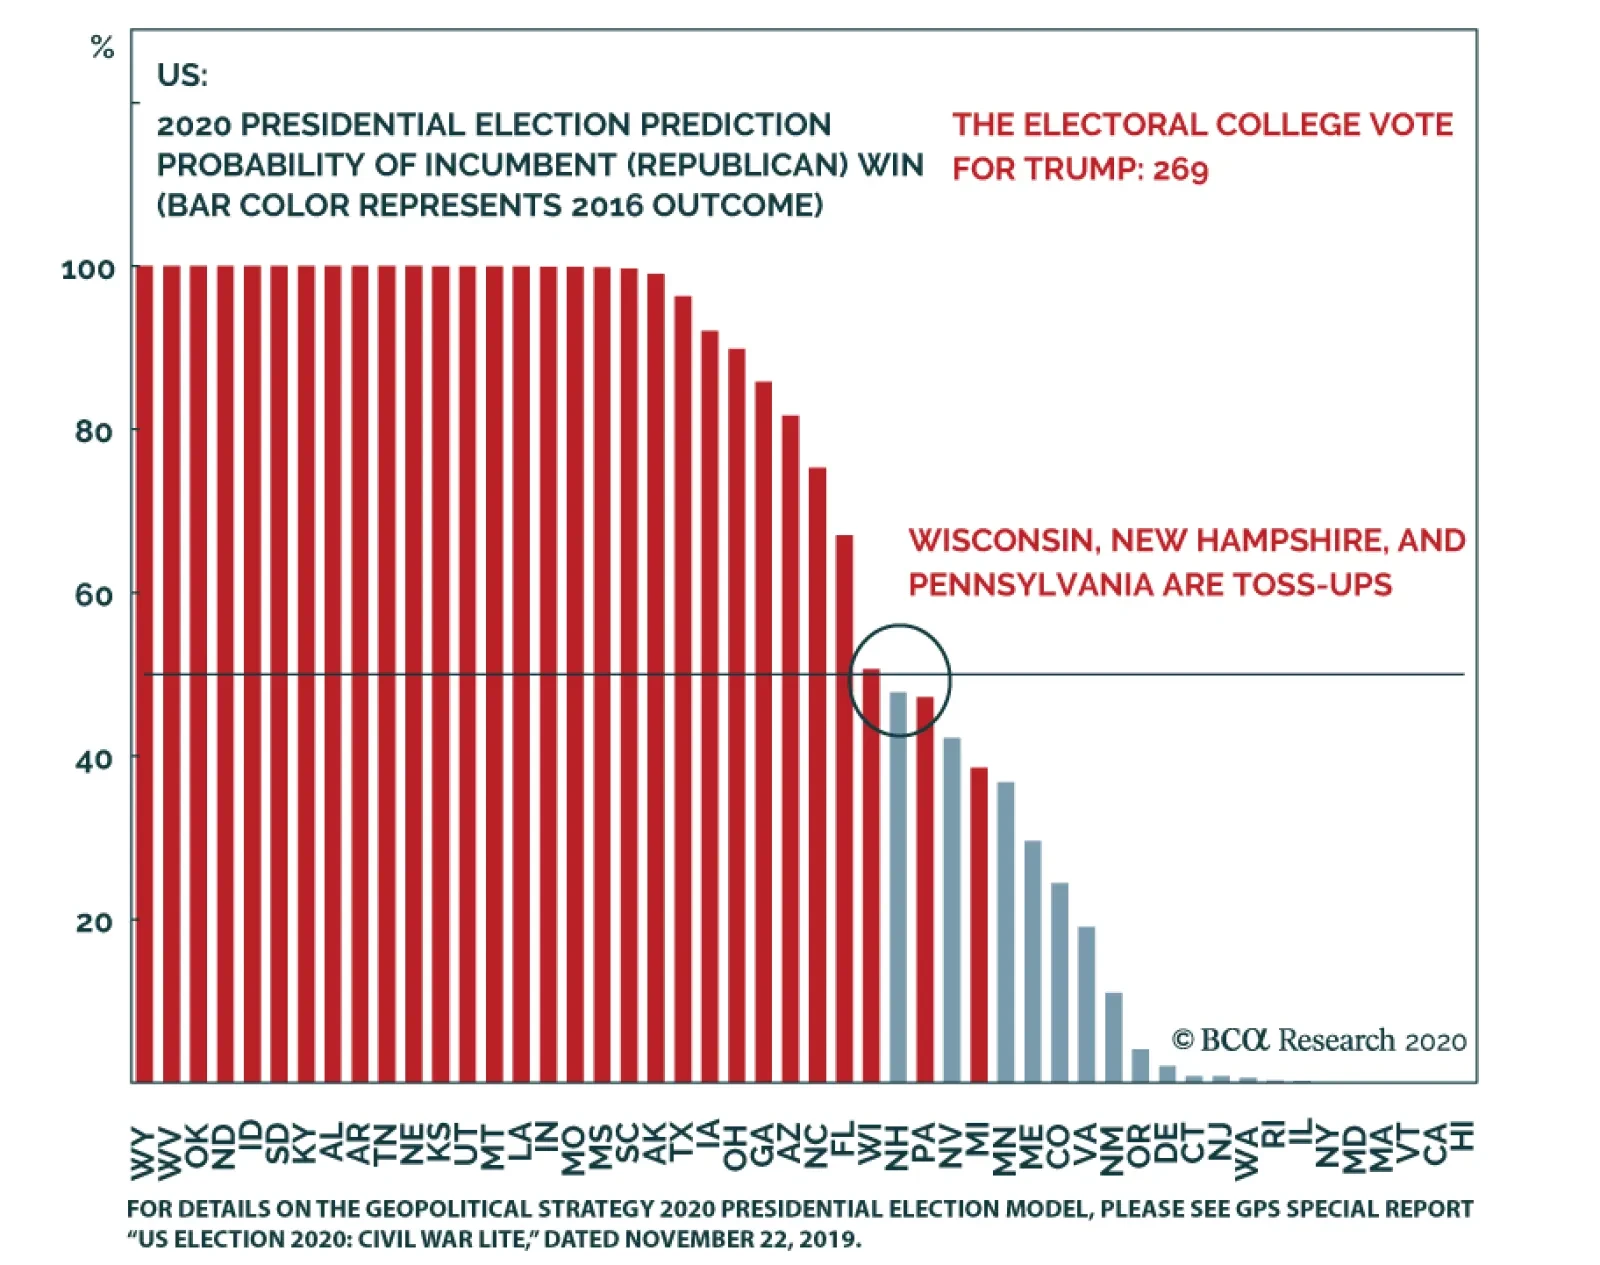
A key takeaway from the New Hampshire primary was its elevated turnout, the highest since 2008. If the coming states confirm this trend, it will suggest that the Democrats are highly mobilized. Another important inference is that the centrist/populist vote…
Highlights The coronavirus is likely to cut global growth in half (from 3.3% to 1.7%) during the first quarter of 2020. Investors should brace for a slew of profit warnings over the coming weeks from companies with significant operations in China. The near-term economic data is also likely to disappoint. Provided the virus is contained (admittedly a big if), economic activity should recover quickly in the second quarter, leaving global growth about 0.3 percentage points lower for the year as a whole. We should have a better sense of who the Democratic presidential candidate will be by mid-March, by which time more than 60% of the delegates will have been awarded. We continue to recommend an overweight stance on global equities over a 12-month horizon, but do not have a strong conviction about the near-term direction of global bourses given the risks around the virus and the Democratic nomination. Green Shoots Delayed Coming into 2020, we expected global growth to accelerate thanks to the lagged effects of last year’s decline in bond yields, an improvement in the global manufacturing inventory cycle, diminished Brexit and trade war risks, and ongoing policy stimulus out of China. Consistent with this prediction, the manufacturing ISM surged this week, with the forward-looking new orders-to-inventories ratio rising to the highest level in 10 months. The non-manufacturing ISM also surprised on the upside, as did factory orders in December. To top it off, ADP employment rose by 291k in January, well above the consensus estimate of 157k. In the euro area, the manufacturing and services PMIs were both revised higher in January. The future output component of the euro area manufacturing PMI rose to 59.8, the highest level since August 2018. The Swedbank Swedish manufacturing PMI jumped to 51.5, easily topping the consensus estimate of 47.6. We have generally found that the Swedish manufacturing PMI leads the global PMI by one or two months. Meanwhile, the UK composite PMI hit a 16-month high. The Coronavirus: Gauging The Economic Impact Unfortunately, the outbreak of the coronavirus is likely to depress global growth over the next couple of months, and possibly longer if the brewing crisis is not contained. During the SARS epidemic in 2003, Chinese growth fell from 10.8% in Q1 to 5.5% in Q2 on a seasonally-adjusted quarter-over-quarter annualized basis – a decline of 5.3 percentage points – only to snap back to 14.7% in Q3. Given that trend growth in China is currently about 5%-to-6%, growth could grind to a halt in the first quarter of this year, if the SARS experience is any guide. This would bring the year-over-year GDP growth rate down to 4%-to-4.5%. While zero growth on a quarter-over-quarter basis in Q1 may sound dire, keep in mind that this would simply leave real output at the same level as in Q4 of last year. Considering the disruptions presently facing the Chinese economy, a prediction of zero quarterly growth could actually prove to be too optimistic. The outbreak of the coronavirus is likely to depress global growth over the next couple of months, and possibly longer if the brewing crisis is not contained. China now accounts for 16% of global GDP on a US dollar basis, compared to 4% in 2003. Thus, a 5.5 percentage-point decline in Chinese growth would arithmetically shave about 0.16*5.5=0.9 percentage points off of global growth. In addition, there will be spillovers from weaker Chinese growth to the rest of the world. Global goods exports to China stand at about 2.5% of world GDP compared to 0.9% of GDP in 2003 (Chart 1). Chinese import growth is about twice as volatile as GDP growth (Chart 2). Thus, a 5.5 percentage-point decline in Chinese GDP in Q1 would reduce global exports to China by 2*0.055*2.5=0.27% of GDP. Chart 1Chinese Demand Has Expanded Over The Years
Chinese Demand Has Expanded Over The Years
Chinese Demand Has Expanded Over The Years
Chart 2Imports Are More Volatile Than Domestic Production
Imports Are More Volatile Than Domestic Production
Imports Are More Volatile Than Domestic Production
China’s service imports will also decline, mainly due to a sharp drop in Chinese tourists travelling abroad. Overseas spending by Chinese residents rose from 0.05% of world GDP in 2007 to 0.33% of GDP in 2018. If tourist arrivals end up falling by 70% during the first quarter, this would shave a further 0.7*0.33=0.23 percentage points from global growth. On top of all this, there will probably be some multiplier effects from weaker Chinese growth on domestic spending. For example, a decline in Chinese tourism will reduce the income of hotel proprietors and their employees, leading to lower outlays by local residents. For an economy such as Thailand, where Chinese tourist spending accounts for over 3% of GDP, this effect is likely to be substantial. We subjectively pencil in an additional 0.2 percentage-point hit to Q1 global growth from this multiplier effect. As Chart 3 shows, this gives a total hit to growth of 1.6% in Q1. Going into this year, the IMF expected global growth to average 3.3% in 2020. This implies that growth could fall by half the IMF’s projected pace in the first quarter before recovering during the rest of the year. Chart 3Chinese GDP Growth Will Plunge In Q1, But Should Recover In The Remainder Of 2020 Provided The Coronavirus Outbreak Is Contained
From China To Iowa
From China To Iowa
Uncertainties Abound These estimates are subject to a large margin of error. On the positive side, the impact on global growth might be mitigated by the fact that most of the categories (aside from tourism) in which the Chinese are cutting back spending are in the service sector, and hence have relatively low import content. In addition, China is likely to further bolster policy stimulus in response to the crisis. The People’s Bank of China has injected additional liquidity into money markets, cut the 7-day repo rate, and indicated that it will further lower lending rates. Regulators have delayed the introduction of new rules and regulations in the financial sector. We also expect the authorities to boost fiscal spending, especially on health care, where China lags behind most other countries (Chart 4). Chart 4China: Public Spending On Health Care Has Room To Catch Up
From China To Iowa
From China To Iowa
On the negative side, the rising share of services in the Chinese economy means that some of the spending lost in Q1 will not be recouped during the rest of the year (unlike in the case of durable goods, there is little pent-up demand for say, restaurant meals). There is also a risk that spending outside China will decline if confidence drops and people begin to hunker down and save more. This is a particular risk in Japan where at least 30 people have contracted the virus (compared to zero during the SARS outbreak) and consumer confidence remains weak following the consumption tax hike. Lastly, global supply chains that rely on Chinese-produced components could be severely disrupted, leading to a downdraft in global manufacturing output. Needless to say, the impact of the outbreak depends critically on how long the epidemic lasts and how broad-based it ends up being. Our baseline assumption is that the outbreak will subside by the end of March. If that happens, growth will rebound in the remainder of the year, as occurred during the SARS episode. This will limit the overall hit to growth in 2020 to about 0.3 percentage points. As of now, the news is mixed. While the total number of new infections has dipped over the past two days in Hubei, where the outbreak originated, the trend in the province still appears to be on the upside. More encouragingly, the number of new infections seems to be stabilizing elsewhere in China and remains at very low levels in the rest of the world (Chart 5). From a markets perspective, tracking the number of new infections is important because it helped mark a bottom in stocks during the SARS outbreak (Chart 6). Chart 5The Number Of New Cases Seems To Be Stabilizing Outside Of The Epicenter
From China To Iowa
From China To Iowa
Chart 6Stocks Bottomed As The SARS Infection Rate Was Peaking
Stocks Bottomed As The SARS Infection Rate Was Peaking
Stocks Bottomed As The SARS Infection Rate Was Peaking
If the coronavirus follows a limited transmission path like MERS did, which did not spread much beyond the Middle East and South Korea, then worries about a pandemic will quickly abate. However, it is too early to make such a confident pronouncement, especially since this particular virus appears to be spreading more easily than either MERS or SARS. As such, we regard the risks to our GDP growth projection as tilted to the downside. Meanwhile, another potential risk is rising to the fore… The Democrats' B-List The Democratic presidential nomination is turning out to be a battle among four B’s: Bernie, Biden, Buttigieg, and Bloomberg. The big story from the Iowa caucus is how well Pete Buttigieg did and how poorly Joe Biden performed. Both Biden and Buttigieg are moderates. However, Biden fares much better in head-to-head polls against Trump than other Democratic challengers, including Buttigieg (Chart 7). Hence, anything that hurts Biden helps Trump. Chart 7For Now, Biden Is Trump’s Biggest Threat
From China To Iowa
From China To Iowa
The impact on the stock market would be small if either Biden or Buttigieg were to end up in the White House next year. While both of these Democrats have expressed an interest in reversing at least part of the Trump tax cuts, neither would be as hawkish on trade as Trump. For investors, this makes it a bit of a wash. What would clearly hurt the stock market is if Bernie Sanders were to become the next US president. Sanders brings a lot of baggage to the race, including having campaigned for the far-left Socialist Workers Party in the 1980s, while also honeymooning in Moscow at a time when Soviets had thousands of nuclear missiles pointed at the US. Yet, despite his checkered past, the Vermont senator has still beaten Trump in 48 of the last 53 head-to-head polls tracked by Realclearpolitics over the past 12 months. The reality is that the US is moving leftward on a variety of cultural and economic issues (Chart 8). This is unlikely to change anytime soon given the firm grip the left has over academia and most of the media (Charts 9A & B). All this benefits leftist candidates such as Bernie Sanders and Elizabeth Warren. Chart 8The US Is Moving To The Left
From China To Iowa
From China To Iowa
Chart 9AMany More Democrats Than Republicans In US Colleges
From China To Iowa
From China To Iowa
Chart 9BThe Vast Majority Of Journalists Are Left-Leaning
From China To Iowa
From China To Iowa
Battle Of The Billionaires This brings us to Mike Bloomberg. According to PredictIt, Bloomberg is now the second most likely candidate to emerge as the Democratic nominee after Bernie Sanders (Chart 10). Bloomberg’s nationwide polling numbers are quite poor, but unlike the other candidates, he has enough wealth to stay in the race for as long as he wants to. Chart 10Bloomberg As The Dark Horse?
Bloomberg As The Dark Horse?
Bloomberg As The Dark Horse?
Bloomberg can also do something the other candidates cannot: stage an independent bid for the White House. Bloomberg’s allegiance to the Democratic Party is fairly tenuous. He governed New York City as a Republican, after all. If Bernie Sanders emerges as the Democratic nominee, Bloomberg could try to run up the middle as the “moderate choice.” Granted, Bloomberg has promised to support whoever the Democratic nominee ends up being. But here is the irony: the best thing that Bloomberg could do for Sanders is run as an independent. According to BCA’s geopolitical team, Bloomberg would take more voters from Trump than he would from Sanders.1 Whether Bloomberg will try to sabotage Trump in order to help Sanders remains to be seen. Ideologically, Bloomberg is probably closer to Trump than he is to Sanders. However, the two billionaires hate each other, and this could ultimately prove to be the deciding factor. Investment Conclusions The short-term outlook for risk assets remains murky. It is too early to relax about the coronavirus. Even if the outbreak is contained, a lot of economic damage has already been done. Investors should brace for a slew of profit warnings over the coming weeks from companies with significant operations in China. The near-term economic data is also likely to disappoint. Then there are the US elections. We bucked the consensus view in 2015/16 by predicting that Donald Trump would become President. At the moment, however, we do not have a strong feeling about the outcome of this year’s contest. This is in contrast to many market participants who see a Trump victory as a foregone conclusion. At a recent Goldman conference, 87% of attendees expected President Trump to be re-elected.2 Our conversations with clients have revealed a similar bias. The S&P 500 has moved in lockstep with Trump’s chances of being re-elected (Chart 11). If Trump’s prospects begin to fade, while Bernie Sanders wins in New Hampshire and Nevada and outperforms in South Carolina, risk assets could suffer. Chart 11An Uncanny Correlation
An Uncanny Correlation
An Uncanny Correlation
Why, then, not turn bearish on stocks now? One reason, as noted above, is that global growth should pick up later this year provided the coronavirus is contained. Stocks generally outperform bonds when growth is accelerating (Chart 12). Equity risk premia also remain quite high, which gives stocks a cushion of support (Chart 13). Chart 12Stocks Usually Outperform Bonds When Global Growth Is Accelerating
Stocks Usually Outperform Bonds When Global Growth Is Accelerating
Stocks Usually Outperform Bonds When Global Growth Is Accelerating
Chart 13Relative Valuations Favor Stocks
Relative Valuations Favor Stocks
Relative Valuations Favor Stocks
All this leaves us in the somewhat uncomfortable position of continuing to advocate an overweight stance towards equities over a 12-month horizon, without having a strong view about the short-term direction for global bourses. Matters should be clearer by mid-March. Super Tuesday takes place on March 3rd. By March 17th, more than 60% of the Democratic delegates will have been awarded (Appendix Table 1). There should also be more clarity on the coronavirus outbreak by then too. At that point, we will reassess both our short-term and medium-term views on equities and other assets. Peter Berezin Chief Global Strategist peterb@bcaresearch.com Appendix Table 1Next Stops For The Democrat Caravan
From China To Iowa
From China To Iowa
Footnotes 1 Please see Geopolitical Strategy Weekly Report, “After Iowa And Impeachment? Questions From The Road,” dated February 7, 2020. 2 Theron Mohamed, “A Goldman Sachs client poll finds 87% expect Trump to win the next election,” Business Insider (January 17, 2020). Global Investment Strategy View Matrix
From China To Iowa
From China To Iowa
MacroQuant Model And Current Subjective Scores
From China To Iowa
From China To Iowa
Strategic Recommendations Closed Trades