Geopolitics

Highlights Europe’s dirty little secret: Euro area debt is already mutualised. Investment implication: Overweight Italian BTPs, underweight German bunds, and overweight the euro on a structural (2-year plus) horizon. ESM plus ECB plus OMT equals a compromise solution to fund stimulus at a mutualised euro area interest rate. Investment implication: Overweight Italian BTPs, underweight German bunds on a cyclical (6-12 month) horizon. Spain’s high early peak in morbidity means that it has taken its pain upfront, at least compared to other countries. Investment implication: upgrade Spain’s IBEX to a tactical overweight – and remove it from the cyclical underweight basket. Feature Chart of the WeekThe Underperformances Of China, Italy And Spain Were A Mirror-Image Of Their Covid-19 Morbidity Curves
The Underperformances Of China, Italy And Spain Were A Mirror-Image Of Their Covid-19 Morbidity Curves
The Underperformances Of China, Italy And Spain Were A Mirror-Image Of Their Covid-19 Morbidity Curves
More About Morbidity Curves Most analyses of the pandemic tend to focus on the grim daily mortality statistics. Yet the key to the pandemic’s evolution is not its mortality rate, but rather its morbidity (severe illness) rate. This is because, without a vaccine, the total area underneath the morbidity curve is fixed. The cumulative number of people who will fall severely ill is pre-determined at the outset (Figures 1-3). Figure I-1The Area Under The Morbidity Curve Is Fixed, A High First Peak Means A Low Second Peak
Will Europe Unite Or Split?
Will Europe Unite Or Split?
Figure I-2A Low First Peak Means An Extended First Peak…
Will Europe Unite Or Split?
Will Europe Unite Or Split?
Figure I-3…Or A High Second Peak
Will Europe Unite Or Split?
Will Europe Unite Or Split?
Very optimistically assuming a Covid-19 morbidity rate of 1 percent, and that 65 percent of the population must get infected to exhaust the pandemic, we know that Covid-19 will ultimately make 0.65 percent of the population severely ill. Absent a vaccine, this number is set in stone. But the number of deaths is not set in stone. It depends on the availability of emergency medical treatment for those that are severely ill. For Covid-19 this means access to ventilation in an intensive care unit (ICU). Yet even the best equipped countries only have ICUs for 0.03 percent of the population. Therefore, the emergency treatment must be rationed either by supply or by demand. Without a Covid-19 vaccine, we cannot change the cumulative number of people who will become severely ill. Rationing by supply means that we must deny emergency treatment to the severely ill – not just Covid-19 patients but victims of, say, heart attacks or car crashes. Accept more deaths. Rationing by demand means that we must flatten the demand (morbidity) curve so that demand is always satisfied by the limited ICU supply. During the pandemics of 1918-19 and 1957, countries could ration emergency medical treatment by supply. Not in 2020. In an era of universal healthcare, everybody is entitled to, and expects to get, emergency medical care. Which means we must ration emergency medical treatment by demand. As such, we must analyse the 2020 response differently to the responses in 1918-19 and 1957. To repeat, without a vaccine, we cannot change the area under the morbidity curve. There is no way of escaping this truth. A low first peak requires a very elongated peak or a high second peak (Chart I-2). Conversely, countries that have suffered a high first peak will need a shorter peak and small (or no) second peak. Chart I-2Japan's Early Stabilisation Was A False Dawn
Japan's Early Stabilisation Was A False Dawn
Japan's Early Stabilisation Was A False Dawn
Turning to an equity market implication, the underperformances of highly cyclical and domestically exposed Spain and Italy have closely tracked their morbidity curves (Chart I-1). Given that both countries have suffered very high first peaks in morbidity, the strong implication is that they have taken their pain upfront – at least compared to other countries. In the case of Spain, the market is also technically oversold (see Fractal Trading System). Investment implication: upgrade Spain’s IBEX to a tactical overweight – and remove it from the cyclical underweight basket. How Europe Could Unite Europe is dithering on its fiscal response to the pandemic. Specifically, Germany and the Netherlands are pushing back against the concept of mutualised euro area debt in the form of ‘corona-bonds’. But a pandemic is an act of nature, an indiscriminate exogenous shock. What is the point of the economic and monetary union if Italy must fund its response to an act of nature at the Italian 10-year yield of 1.5 percent rather than the euro area 10-year yield of 0 percent? (Chart I-3 and Chart I-4) Chart I-3To Fight An Act Of Nature Why Should Italy Borrow At A Higher Rate...
To Fight An Act Of Nature Why Should Italy Borrow At A Higher Rate...
To Fight An Act Of Nature Why Should Italy Borrow At A Higher Rate...
Chart I-4...When It Could Borrow At A Lower Mutualised Rate?
...When It Could Borrow At A Lower Mutualised Rate?
...When It Could Borrow At A Lower Mutualised Rate?
The good news is there is a compromise solution to fund stimulus at a mutualised interest rate. It uses the euro area’s €500 billion bailout fund, the European Stability Mechanism (ESM). But the compromise solution carries two problems which need mitigation. First, ESM credit lines come with conditionality. Italy would rightly balk if it were shackled like Greece, Portugal, and Ireland were after the euro debt crisis. Luckily, the ESM is likely to regard the current ‘act of nature’ crisis very differently to the debt crisis and impose only minimum and appropriate conditionality – for example, that credit lines should be used for healthcare and social welfare spending. Second, ESM credit lines come with a stigma. Taking fright that Italy is tapping the ESM, the bond market might drive up the yields on Italian BTPs. If this pushed up Italy’s overall funding rate, it would defeat the purpose of using the ESM in the first place. ESM plus ECB plus OMT equals a compromise solution to borrow at a mutualised interest rate. The hope is that the bond market, realising that Italy is using the bailout facility to counter an act of nature, would not drive up BTP yields. But if it did, the ECB could counter this by buying BTPs. One option would be to use its Outright Monetary Transactions (OMT) facility. Set up during the euro debt crisis, the OMT’s specific function is to counter bond market attacks when they are not justified by the economic fundamentals. In other words, to prevent a liquidity crisis escalating into a solvency crisis. Thereby, ESM plus ECB plus OMT equals a compromise solution to fund stimulus at a mutualised euro area interest rate. Investment implication: Overweight Italian BTPs, underweight German bunds on a cyclical (6-12 month) horizon. Europe’s Dirty Little Secret Outwardly, Germany and the Netherlands are reluctant to go down the slippery slope to mutualised euro area debt. But here’s the dirty little secret they don’t want you to know. Euro area debt is already mutualised. The stealth mutualisation has happened via the Target2 banking imbalance which now stands at €1.5 trillion. This imbalance is an accounting identity showing that Italy is owed ‘German euros’ via its large quantity of bank deposits in German banks while Germany is symmetrically owed ‘Italian euros’ via its large effective holding of Italian government bonds. The imbalance is irrelevant if a German euro equals an Italian euro. But if Italy defaulted on its bonds – by repaying them in a reinstated and devalued lira – then Target2 means that Germany must pick up the bill (Chart I-5). Chart I-5Target2 Means That If Italy Defaults, Germany Picks Up The Bill
Will Europe Unite Or Split?
Will Europe Unite Or Split?
The Target2 imbalance is the result of the ECB’s QE program, in which the central bank has bought hundreds of billions of Italian bonds. If Italy repaid those bonds in a devalued lira, then the ECB would become insolvent, and the central bank’s remaining shareholders would have to plug the hole. The biggest shareholder would be Germany. Could Germany force Italy to repay its bonds in euros? No. According to a legal principle called ‘lex monetae’ Italy can repay its debt in its sovereign currency, whatever that is. Meanwhile, because of the fragility of the Italian banking system, the Italians who sold the bonds to the ECB deposited the cash in German banks. Legally, these depositors must be paid back in whatever is the German currency. Euro area debt is already mutualised. If euro area debt is already mutualised, why do policymakers continue to pretend that it isn’t? There are three reasons. First no policymaker would want to publicise that Germany is now on the hook if Italy left the euro. Second, no policymaker would want to publicise that the ECB has put Germany in this position (Chart I-6). Chart I-6ECB QE Has Created The Target2 Imbalance
ECB QE Has Created The Target2 Imbalance
ECB QE Has Created The Target2 Imbalance
Third, and most important, policymakers would point out that the mutualisation of debt only happens if the euro breaks up. They would argue that because the euro is irreversible, the debt is not mutualised. In fact, their argument is completely back to front. The truth is: Because euro area debt is now mutualised, the euro has become irreversible. Investment implication: Overweight Italian BTPs, underweight German bunds, and overweight the euro on a structural (2-year plus) horizon. Fractal Trading System* As already discussed, this week’s recommended trade is long Spain’s IBEX 35 versus the Euro Stoxx 600. The profit target is 3 percent with a symmetrical stop-loss. Meanwhile our other trade, long Australia versus New Zealand has moved into a 2 percent profit. The rolling 12-month win ratio now stands at 66 percent. Chart I-7IBEX 35 Vs. EUROSTOXX 600
IBEX 35 Vs. EUROSTOXX 600
IBEX 35 Vs. EUROSTOXX 600
When the fractal dimension approaches the lower limit after an investment has been in an established trend it is a potential trigger for a liquidity-triggered trend reversal. Therefore, open a countertrend position. The profit target is a one-third reversal of the preceding 13-week move. Apply a symmetrical stop-loss. Close the position at the profit target or stop-loss. Otherwise close the position after 13 weeks. * For more details please see the European Investment Strategy Special Report “Fractals, Liquidity & A Trading Model,” dated December 11, 2014, available at eis.bcaresearch.com. Dhaval Joshi Chief European Investment Strategist dhaval@bcaresearch.com Fractal Trading System Cyclical Recommendations Structural Recommendations Closed Fractal Trades Trades Closed Trades Asset Performance Currency & Bond Equity Sector Country Equity Indicators Bond Yields Chart II-1Indicators To Watch - Bond Yields
Indicators To Watch - Bond Yields
Indicators To Watch - Bond Yields
Chart II-2Indicators To Watch - Bond Yields
Indicators To Watch - Bond Yields
Indicators To Watch - Bond Yields
Chart II-3Indicators To Watch - Bond Yields
Indicators To Watch - Bond Yields
Indicators To Watch - Bond Yields
Chart II-4Indicators To Watch - Bond Yields
Indicators To Watch - Bond Yields
Indicators To Watch - Bond Yields
Interest Rate Chart II-5Indicators To Watch - Interest Rate Expectations
Indicators To Watch - Interest Rate Expectations
Indicators To Watch - Interest Rate Expectations
Chart II-6Indicators To Watch - Interest Rate Expectations
Indicators To Watch - Interest Rate Expectations
Indicators To Watch - Interest Rate Expectations
Chart II-7Indicators To Watch - Interest Rate Expectations
Indicators To Watch - Interest Rate Expectations
Indicators To Watch - Interest Rate Expectations
Chart II-8Indicators To Watch - Interest Rate Expectations
Indicators To Watch - Interest Rate Expectations
Indicators To Watch - Interest Rate Expectations
Highlights Global shortages of medical equipment – including medicines – are frontloaded until emergency production kicks in. As the crisis abates, political recriminations between the US and China will surge. The US will seek to minimize medical supply exposure to China going forward, a boon for India and Mexico. China has escaped the COVID-19 crisis with minimal impact on food supply. Pork prices are surging due to African Swine Flu, but meat is a luxury. Still, the “Misery Index” is spiking and this will increase social instability. Food insecurity, inflation, and large current account deficits suggest that emerging market currencies will remain under pressure. Turkey and South Africa stand to suffer while we remain overweight Malaysia. Feature Chart 1Collapse In Economic Activity
Collapse In Economic Activity
Collapse In Economic Activity
With a third of the world population under some form of lockdown, general activity in the world’s manufacturing powerhouses has collapsed (Chart 1). The breakdown is a double whammy on market fundamentals. On the supply side, government-mandated containment efforts force workers in non-essential services to stay home while, on the demand side, households confined to their homes are unable to spend. Acute demand for medical supplies is causing shortages, while supply disruptions threaten states that lack food security. While global monetary and fiscal stimulus will soften the blow (Chart 2), the economic shock is estimated to be a 2% contraction in real GDP for every month of strict isolation. If measures are extended beyond April, markets will sell and new stimulus will be applied. Already the US Congress is negotiating the $1-$2 trillion infrastructure package that we discussed in our March 4 report, and cash handouts will be ongoing. When the dust settles the political fallout will be massive. Authoritarian states like China and especially Iran will face greater challenges maintaining domestic stability. Democracies like Italy and the US, which lead the COVID-19 case count, are the most likely to experience a change in leadership (Chart 3). Initially the ruling parties of the democracies are receiving a bump in opinion polling, but this will fade as households will be worse off and will likely vent their grievances at the ballot box.
Chart 2
Chart 3
Until a vaccine or treatment is discovered, medical equipment and social distancing are the only weapons against the pandemic. National production is (rightly) being redirected from clothing and cars to masks and ventilators to meet the spike in demand. Will the supply shock cause shortages in food and medicine – essential goods for humankind? In this report we address the impact of COVID-19 on global supply security and assess the market implications. Medical Equipment Shortages Will Spur Protectionism
Chart
Policymakers are fighting today’s crisis with the tools of the 2008 crisis, but a lasting rebound in financial markets will depend on surmounting the pandemic, which is prerequisite to economic recovery (Table 1). As the US faces the peak of its COVID-19 outbreak, public health officials and doctors are raising the alarm on the shortage of medical supplies. A recent US Conference of Mayors survey reveals that out of the 38% of mayors who say they have received supplies from their state, 84.6% say they are inadequate (Chart 4). Italy serves as a warning: A reported 8% of the COVID-19 cases there are doctors and health professionals, often treating patients without gloves or with compromised protective gear. These workers are irreplaceable and when they succumb the virus cannot be contained. In the US, doctors and nurses are re-using masks and sometimes treating patients behind a mere curtain, highlighting the supply shortage. While the shortages are mainly driven by a surge in demand from both medical institutions and households, they also come from the supply side, particularly China. Factory closures and transportation disruptions in China earlier this year, coupled with Beijing’s government-mandated export curbs, reduced Chinese exports, a major source of US and global supplies (Chart 5).
Chart 4
Chart 5
Other countries have imposed restrictions on exports of products used in combating the spread of COVID-19. Following export restrictions by the French, German, and Czech governments in early March, the European Commission intervened on March 15 to ensure intra-EU trade. It also restricted exports of protective medical gear outside of the EU. At least 54 nations have imposed new export restrictions on medical supplies since the beginning of the year.1 Both European and Chinese measures will reduce supplies in the US, the top destination for most of these halted exports (Chart 6).
Chart 6
Thus it is no wonder that the Trump administration has rushed to cut import duties and boost domestic production. The administration has released strategic stockpiles and cut tariffs on Chinese medical equipment used to treat COVID-19. With the whole nation mobilized, supply kinks should improve greatly in April. After a debacle in rolling out test kits (Chart 7), the US is rapidly increasing its testing capabilities to manage the crisis, with over a million tests completed as of the end of March (Chart 8). Meanwhile a coalition of companies is taking shape to make face masks. The president has invoked the defense production act to force companies to make ventilators.
Chart 7
Chart 8
However, with the pandemic peaking in the US, the hardest-hit regions will continue experiencing shortages in the near term. Shortages are prompting public outcry against the US government for its failure to anticipate and redress supply chain vulnerabilities that were well known and warned against. A report in The New York Times tells how Mike Bowen, owner of Texas-based mask-maker Prestige Ameritech, has advised the past three presidents about the danger in the fact that the US imports 95% of its surgical masks. “Aside from sitting in front of the White House and lighting myself on fire, I feel like I’ve done everything I can,” he said. He is currently inundated with emergency orders from US hospitals. The same report tells of a company called Strong Manufacturers in North Carolina that had to cut production of masks because it depends on raw materials from Wuhan, China, where the virus originated.2 The Trump administration will suffer the initial public uproar, but the US government will also seek to reduce import dependency going forward, and it will likely deflect some of the blame by focusing on the supply risks posed by China. Beijing, for its part, is launching a propaganda campaign against the US to distract from its own failures at home (some officials have even blamed the US for the virus). Meanwhile it is cranking up production and shipping medical supplies to crisis hit areas like Italy to try to repair its global image after having given rise to the virus. In addition, the city of Shenzhen is sending 1.2 million N95 masks to the US on the New England Patriots’ team plane. Even Russia is sending small donations. But these moves work to propagandistic efforts in these countries and will ultimately shame the Americans into taking measures to improve self-sufficiency. Bottom Line: The most important supply shortage amid the global pandemic is that of medical equipment. While these shortages will abate sooner rather than later, the supply chain vulnerabilities they have exposed will trigger new policies of supply redundancy and import substitution. The US in particular will seek to reduce dependency on China. That COVID-19 is aggravating rather than reducing tensions between these states, despite China’s role as a key supplier in a time of need, highlights the secular nature of their rising tensions. The US-China Drug War Shortages of pharmaceuticals are also occurring, despite the fact that the primary pandemic response is necessarily “non-pharmaceutical” (e.g. social distancing). The US Food and Drug Administration (FDA) announced the first COVID-19 related drug shortage in the US on February 27. While the specific drug was not disclosed, the announcement notes that “the shortage is due to an issue with manufacturing of an active pharmaceutical ingredient used in the drug.”3 The FDA is monitoring 20 other (non-critical) drugs potentially at risk of shortages because the sole source is China. The global spread of the pandemic will increase these shortages. On March 3 India announced export restrictions on 26 drugs, including paracetamol and several antibiotics, due to supply disruptions caused by the Chinese shutdown. While Chinese economic activity has since picked up, India is now among the string of countries under a nationwide lockdown. Similar measures enforced across Europe will also hamper the production and transportation of these goods. The implication is that even if Chinese drugs return to market, supplies further down the chain and from alternative suppliers will take a hit. The risk that this will evolve into a drug shortage depends on the intensity of the outbreak. Drug companies generally hold 3-6 months’ worth of inventories. Consequently, while inventories are likely to draw as supplies are disrupted, consumers may not experience an outright shortage immediately. In the US, as with equipment and protective gear, the government’s strategic stockpile will buffer against shortfalls in supplies of critical drugs. COVID-19 is aggravating rather than reducing US-China tensions. Nevertheless the supply chain is getting caught up in the larger US-China strategic conflict. Even before the pandemic, the US-China trade war brought attention to the US’s vulnerabilities to China’s drug exports. This dispute is not limited to illicit drugs, as with China’s production of the opioid fentanyl, but also extends to mainstream medicines, as highlighted in the selection of public statements shown in Table 2.
Chart
Chart 9
How much does the US rely on China for medicine? According to FDA data, just over half of manufacturing facilities producing regulated drugs in finished dosage form for the US market are located abroad, with China’s share at 7% (Chart 9).4 The figures are higher for manufacturing facilities producing active pharmaceutical ingredients, though still not alarming – 72% of the facilities are located abroad, with 13% in China. Of course, high-level data understate China’s influence. The complex nature of global drug supply chains means that the source of finished dosage forms masks dependencies and dominance higher up the supply chain (Figure 1).
Chart
For instance, active pharmaceutical ingredients produced in Chinese facilities are used as intermediate goods by finished dosage facilities in India as well as China. The FDA reports that Indian finished dosage facilities rely on China for three-quarters of the active ingredients in their generic drug formulations, which are then exported to the US and the rest of the world. Any supply disruption in China – or any other major drug producer – will lead to shortages further down the supply chain.
Chart 10
Chinese influence becomes more apparent when the sample is restricted to generic prescription drugs. These are especially relevant because nearly 70% of Americans are on at least one prescription drug, of which more than 90% are dispensed in the generic form. In this case, 87% of ingredient manufacturers and 60% of finished dosage manufacturers are located outside the US, with 17% of ingredient facilities and 8% of dosage facilities in China (Chart 10). Of all the facilities that manufacture active ingredients that are listed on the World Health Organization’s Essential Medicines List – a compilation of drugs that are considered critical to the health system – 71% are located aboard with 15% located in China (Chart 11). Moreover, manufacturers are relatively inflexible when adapting to market conditions and shortages. Drug manufacturing facilities generally operate at above 80% of their capacity and are thus left with little immediate capacity to ramp up production in reaction to shortages elsewhere. In addition, manufacturers face challenges in changing ingredient suppliers – there is no centralized source of information on them, and additional FDA approvals are required. The US will look to reduce its dependency on China for its drug supplies regardless of 2020 election outcome. China also has overwhelming dominance in specific categories. The Council on Foreign Relations reports that China makes up 97% of the US antibiotics market.5 Other common drugs that are highly dependent on China for supplies include ibuprofen, acetaminophen, hydrocortisone, penicillin, and heparin (Chart 12).
Chart 11
Chart 12
Taking it all together, US vulnerability can be overstated. Consider the following: Of the 370 drugs on the Essential Medicines List that are marketed in the US, only three are produced solely in China. None of these three are used to treat top ten causes of death in the United States. Import substitution is uneconomical. Foreign companies, especially Chinese companies, are attractive due to their lower costs and lax regulations. While China’s influence extends higher up the supply chain, this is true for US markets as well as other consumer markets. While China can cut off the US from the finished dosages it supplies, it cannot do the same for the ingredients that are used by facilities in other countries and eventually make their way to the US in finished dosage form. Americans are demanding that drug prices be reduced and an obvious solution is looser controls on imports. The recent activation of the Defense Production Act shows that the US can take action to boost domestic production in emergencies. Nevertheless, China is growing conspicuous to the American public due to general trade tensions and COVID-19. As it moves up the value chain, it also threatens increasing competition for the US and its allies. Hence the US government will have a strategic reason to cap China’s influence that is also supported by corporate interests and popular opinion. This will lead to tense trade negotiations with China and meanwhile the US will seek alternative suppliers. China will not want to lose market share or leverage over the United States, so it may offer trade concessions at some point to keep the US engaged. Ultimately, however, strategic tensions will catalyze US policy moves to reduce the cost differential with China and promote its rivals. Pressure on China over its currency, regulatory standards, and scientific-technological acquisition will continue regardless of which party wins the White House in 2020. The Democrats would increase focus on China’s transparency and adherence to international standards, including labor and environmental standards. Both Republicans and Democrats will try to boost trade with allies. The key beneficiaries will be India, Southeast Asia, and the Americas. Taiwan’s importance will grow as a middle-man, but so will its vulnerability to strategic tensions. Bottom Line: The US and the rest of the world are suffering shortfalls of equipment necessary to combat COVID-19. There is also a risk of drug shortages stemming from supply disruptions and emergency protectionist policies. These shortages look to be manageable, but they have exposed national vulnerabilities that will be reduced in future via interventionist trade policies. While the US and Europe will ultimately manage the outbreak, the political fallout will be immense. The US will look to reduce its dependency on China. This will increase investment in non-China producers of active pharmaceutical ingredients, such as India and Mexico. The US tactics against China will vary according to the election result, but the strategic direction of diversifying away from China is clear and will have popular impetus in the wake of COVID-19. Food Security In addition to the challenges posed by COVID-19 on medical supplies, food – another essential good – also faces risk of shortages. China is a case in point. Food prices there were on the rise well before the COVID-19 outbreak, averaging 17.3% in the final quarter of 2019. However inflation was limited to pork and its substitutes – beef, lamb and poultry – and reflected a reduction in pork supplies on the back of the African Swine Flu outbreak. While year-on-year increases in the prices of pork and beef averaged 102.8% and 21.0%, respectively, grain, fresh vegetable, and fresh fruit prices averaged 0.6%, 1.5%, and -5.0% in Q42019 (Chart 13). Chart 13Chinese Inflation Has (Thus far) Been Contained To Pork
Chinese Inflation Has (Thus far) Been Contained To Pork
Chinese Inflation Has (Thus far) Been Contained To Pork
Chart 14China's Misery Index Is Spiking - A Political Liability
China's Misery Index Is Spiking - A Political Liability
China's Misery Index Is Spiking - A Political Liability
However China’s COVID-19 containment measures had a more broad-based impact on food supplies, threatening to push up China’s Misery Index (Chart 14). Travel restrictions, roadblocks, quarantined farm laborers, and risk-averse truck drivers introduced challenges not only in ensuring supplies were delivered to consumers, but also to daily farm activity and planting. The absence of farm inputs needed for planting such as seeds and fertilizer, and animal feed for livestock, was especially damaging in regions hardest hit by the pandemic. Livestock farmers already struggling with swine flu-related reductions in herd sizes were forced to prematurely cull starving animals, cutting the stock of chicken and hogs. Now as the country transitions out of its COVID-19 containment phase and moves toward normalizing activity (Chart 15), food security is top of the mind. Authorities are emphasizing the need to ensure sufficient food supplies and adopt policies to encourage production.6 This is especially important for crops due to be planted in the spring. Delayed or reduced plantings would weight on the quality and quantity of the crops, pushing prices up.
Chart 15
With food estimated to account for 19.9% of China’s CPI basket – 12.8% of which goes towards pork (Chart 16) – a prolonged food shortage, or a full-blown food crisis, would be extremely damaging to Chinese families and their pocketbooks.
Chart 16
However, apart from soybeans and to a lesser extent livestock, China’s inventories are well stocked (Chart 17) and are significantly higher than levels amid the 2006-2008 and 2010-2012 food crises. Inventories have been built up specifically to provide ammunition precisely in times of crisis. Corn and rice stocks are capable of covering consumption for nearly three quarters of a year, and wheat stocks exceeding a year’s worth of consumption. Thus, while not completely immune, China today is better able to weather a supply shock. Moreover, with the exception of soybeans, China is not overly dependent on imports for agricultural supplies (Chart 18).
Chart 17
Chart 18
As the COVID-19 epicenter shifts to the US and Europe, farmers there are beginning to face the same challenges. Reports of delays in the arrival of shipments of inputs such as fertilizer and seeds have prompted American farmers to prepare for the worst and order these goods ahead of time.
Chart 19
While these proactive measures will help reduce risks to supply, farmers in Europe and parts of the US who typically rely on migrant laborers will need to search for alternative laborers as the planting season nears. Just last week France’s agriculture minister asked hairdressers, waiters, florists, and others that find themselves unemployed to take up work in farms to ensure food security. As countries become increasingly aware of the risks to food supplies, some have already introduced protectionist measures, especially in the former Soviet Union: The Russian agriculture ministry proposed setting up a quota for Russian grain exports and has already announced that it is suspending exports of processed grains from March 20 for 10 days. Kazakhstan suspended exports of several agricultural goods including wheat flour and sugar until at least April 15. On March 27, Ukraine’s economy ministry announced that it was monitoring wheat export and would take measures necessary to ensure domestic supplies are adequate. Vietnam temporarily suspended rice contracts until March 28 as it checked if it had sufficient domestic supplies. The challenge is that, unlike China, inventories in the rest of the world are not any higher than during the previous food crisis and do not provide much of a buffer against supply shortfalls (Chart 19). Higher food prices would be especially painful to lower income countries where food makes up a larger share of household spending (Chart 20). In addition to using their strategic food stockpiles, governments will attempt to mitigate the impact of higher food prices by implementing a slew of policies:
Chart 20
Trade policies: Producing countries will want to protect domestic supplies by restricting exports – either through complete bans or export quotas. Importing countries will attempt to reduce the burden of higher prices on consumers by cutting tariffs on the affected goods. Consumer-oriented policies: Importing countries will provide direct support to consumers in the form of food subsidies, social safety nets, tax reductions, and price controls. Producer-oriented policies: Governments will provide support to farmers to encourage greater production using measures such as input subsidies, producer price support, or tax exemptions on goods used in production. While these policies will help alleviate the pressure on consumers, they also result in greater government expenditures and lower revenues. Thus, subsidizing the import bill of a food price shock can weigh on public finances, debt levels, and FX reserves. Currencies already facing pressure due to the recessionary environment, such as Turkey, South Africa and Chile will come under even greater downward pressure. Food inventories ex-China are insufficient to protect against supply shortages. Bottom Line: COVID-19’s logistical disruptions are challenging farm output. This is especially true when transporting goods and individuals across borders rather than within countries. This will be especially challenging for food importing countries, as some producers have already started erecting protectionist measures and this will result in an added burden on government budgets that are already extended in efforts to contain the economic repercussions of the pandemic. Investment Implications Chart 21Ag Prices Inversely Correlated With USD
Ag Prices Inversely Correlated With USD
Ag Prices Inversely Correlated With USD
China will continue trying to maximize its market share and move up the value chain in drug production. At the same time, the US is likely to diversify away from China and try to cap China’s market share. This will result in tense trade negotiations regardless of the outcome of the US election. The COVID-19 experience with medical shortages and newfound public awareness of potential medical supply chain vulnerabilities means that another round of the trade war is likely. Stay long USD-CNY. Regarding agriculture, demand for agricultural commodities is relatively inelastic. This inelasticity should prevent a complete collapse in prices even amid a weak demand environment. Thus given the risk on supplies, prices face upward pressure. However, not all crops are facing these same market dynamics. While wheat and rice prices have started to move in line with the dynamics described above, soybeans and to a greater extent corn prices have not reacted as such (Chart 21). In the case of soybeans, we expect demand to be relatively muted. China accounts for a third of the world’s soybean consumption. 80% of Chinese soybeans are crushed to produce meal to feed China’s massive pork industry. However, the 21% y/y decline in pork output in 2019 on the back of the African Swine Flu outbreak will weigh on demand and mute upward pressures on supplies. Demand for corn will also likely come in weak. The COVID-19 containment measures and the resulting halt in economic activity reduce demand for gasoline and, as a consequence, reduce demand for corn-based ethanol, which is blended with gasoline. In addition to the above fundamentals, ag prices have been weighed down by a strong USD which makes ex-US exporters relatively better off, incentivizing them to raise exports and increase global supplies. A weaker USD – which we do not see in the near term – would help support ag prices. It is worth noting that if there is broad enforcement of protectionist measures, then producers will not be able to benefit from a stronger dollar. In that case we may witness a breakdown in the relationship between ag prices and the dollar. In light of these supply/demand dynamics, we expect rice and wheat prices to be well supported going forward and to outperform corn and soybeans. Roukaya Ibrahim Editor/Strategist Geopolitical Strategy RoukayaI@bcaresearch.com Matt Gertken Vice President Geopolitical Strategist mattg@bcaresearch.com Footnotes 1 See "Tackling COVID-19 Together: The Trade Policy Dimension," Global Trade Alert, University of St. Gallen, Switzerland, March 23, 2020. 2 See Rachel Abrams et al, "Governments and Companies Race to Make Masks Vital to Virus Fight," The New York Times, March 21, 2020. 3 The announcement also notes that there are other alternatives that can be used by patients. See "Coronavirus (COVID-19) Supply Chain Update," US FDA, February 27, 2020. 4 All regulated drugs include prescription (brand and generic), over the counter, and compounded drugs. 5 Please see Huang, Yanzhong, "The Coronavirus Outbreak Could Disrupt The US Drug Supply," Council on Foreign Relations, March 5, 2020. 6 The central government ordered local authorities to allow animal feed to pass through checkpoints amid the lockdowns. In addition, Beijing has relaxed import restrictions by lifting a ban on US poultry products and announcing that importers could apply for waivers on goods tariffed during the trade war such as pork and soybeans. The lifting of these restrictions also serves to help China meet its phase one trade deal commitments. Please see "Coronavirus hits China’s farms and food supply chain, with further spike in meat prices ahead," South China Morning Post, dated February 21, 2020.
Highlights The odds of an emergency meeting of OPEC 2.0 to get supply under control are growing, based on the repeated overtures from Russian officials providing the Kingdom of Saudi Arabia (KSA) an opening to resume talks on their production-management regime. We have developed a not-unreasonable scenario in which global oil consumption falls by ~ 20% y/y in April to assess the COVID-19-induced price impact. Even an aggressive 3.5mm b/d cut from OPEC 2.0 – presuming a rapprochement between KSA and Russia – and an additional 200k b/d market-induced cut by North American producers still sees Brent prices bottoming over the next two months at ~ $18/bbl. OECD inventories surge, reaching ~ 3.6 billion by June 2020, before production cuts and demand restoration start to drain them. Comments from Texas Railroad Commission (RRC) leadership indicate they could be back in the business of pro-rating production in the Lone Star state. If a new OPEC 3.0 described here can move quickly enough, Brent prices could revive to ~ $45/bbl by year end, and clear $60/bbl by 2Q21. We are getting long Dec20 Brent and WTI at tonight’s close. Feature Refiners worldwide are reducing runs as the COVID-19 pandemic continues to cut through oil demand like a scythe through wheat.1 Refiners’ inability to sell gasoline, diesel and jet fuel, and a host of other products, is forcing crude oil to back up globally in storage facilities, pipelines and, soon, on ships (Chart 1).2 This is occurring while KSA and Russia wage a global market-share war, targeting each others’ refinery customers with lower and lower prices. Without a concerted effort by OPEC 2.0 – the coalition led by KSA and Russia – and the US shales to rein in production, the global supply of storage will be exhausted and oil prices will push well below $20/bbl to force output to shut in. Indeed, numerous grades of crude oil worldwide already are trading below $20/bbl after factoring in their spreads vs. Brent crude oil as regional takeaway and storage infrastructure are overwhelmed (Chart 2). Chart 1Even With Production Cuts Oil Inventories Will Surge
Even With Production Cuts Oil Inventories Will Surge
Even With Production Cuts Oil Inventories Will Surge
Chart 2Global Crude Prices Trading Below $20/bbl
Global Crude Prices Trading Below $20/bbl
Global Crude Prices Trading Below $20/bbl
Chart 3“The Other Guys” Production Declines Will Accelerate
"The Other Guys" Production Declines Will Accelerate
"The Other Guys" Production Declines Will Accelerate
The consequences for oil producers outside core-OPEC will be disastrous, as they were following the last market-share war led by OPEC in 2014-16. The producer group we’ve dubbed “The Other Guys” – producers outside core-OPEC – will continue to see production falling, most likely at an accelerating rate, if the market-share war persists (Chart 3). Even within core-OPEC – principally the GCC states – governments will be required to cut spending on public works, salaries for workers, and services.3 Sovereign wealth funds and foreign reserves will have to be drawn down to fill holes in budgets, as happened during the last market-share war of 2014-16 launched by OPEC. The IMF last week noted the world economy is in recession, and that EM economies in particular will see growth fall sharply as a result of the COVID-19 pandemic.4 “We are in an unprecedented situation where a global health pandemic has turned into an economic and financial crisis. With a sudden stop in economic activity, global output will contract in 2020. … emerging market and developing countries, especially low-income countries, will be particularly hard hit by a combination of a health crisis, a sudden reversal of capital flows and, for some, a sharp drop in commodity prices. Many of these countries need help to strengthen their crisis response and restore jobs and growth, given foreign exchange liquidity shortages in emerging market economies and high debt burdens in many low-income countries.” For commodity markets, this means the principal source of demand growth is being severely hobbled. The Oil Demand Hit … Estimating the demand destruction caused by COVID-19 is fraught with uncertainty. Instead of attempting such an estimate, we simulate a sharp drop in oil demand of close to 20% y/y in April 2020, which is consistent with the lockdowns that are bringing the global economy to a standstill. Specifically, we have 2Q20 demand falling ~ 12mm b/d (y/y vs. 2Q19). Thereafter, demand picks up rapidly in 2H20, reaching a growth rate of 800k b/d by 4Q20. For all of 2020, we model average demand losses equal to 3.8mm b/d. For next year, we expect the combination of massive fiscal and monetary stimulus hitting markets globally will lift demand 5.3mm b/d. Net, we view the COVID-19 demand shock as transitory. But it leaves a huge amount of unrefined crude oil in storage and massive amounts of unsold products in inventory. Left unaddressed, crude oil will continue to fill storage globally, as will unsold refined products. This will leave oil producers and refiners in an untenable situation, even after demand returns to normal following the pandemic. Strategists in Riyadh, Moscow and Austin, Texas, know this. … Requires A Supply Offset KSA is forcing its competitors to endure what John Rockefeller, one of the founders of Standard Oil Co., once called a “good sweating.”5 A good sweating was a price-cutting strategy designed to drive competitors out of business and force them to sell to Rockefeller’s company. This occurred in 2014-16 and in 1986, when KSA had to rein in fellow OPEC members that were free-riding on its production discipline. We believe KSA is well aware it cannot endure a years-long market-share war, nor does it want to. Its primary goal in the current circumstances is to remind oil producers globally that it can, when it choses, take as much market share as it deems necessary. After flooding global markets in April 2020 we expect the core-OPEC producers in the Gulf (Kuwait, the UAE, Iraq and, of course, KSA) to reduce production by ~ 2.5mm b/d starting in May 2020, and hold these cuts until 2021 (around the time inventories are drawn down to their 5-year average). In 2021, we have the group increasing production by 2.5mm b/d in 1Q21. As for Russia, we have them increasing production in April 2020 – contributing to the surge in inventories globally. However, beginning in May, we believe Russia and its non-OPEC allies will agree to remove ~ 1mm b/d , in line with the cuts we expect from core-OPEC. Russia faces political and geopolitical constraints that work against maintaining the market-share war. First, President Vladimir Putin has already been forced to shift his national strategy over the past three years to address growing concerns with domestic discontent due to the recession caused by the 2014 oil shock and the economic austerity policies his government pursued afterwards. These policies give Putin policy room to fight today’s market-share war, but they also portend another massive blow to the livelihood and wellbeing of the nation. Second, Putin is in the midst of arranging an extension of his term in office through 2036, which requires the constitutional court to approve of constitutional changes as well as a popular referendum. The referendum has been delayed due to the pandemic and need for an emergency response. While Putin is generally popular and has underhanded means of orchestrating the referendum, it would be extremely dangerous for him to compound the pandemic and global recession with an oil market-share war that makes matters even worse for the Russian people while simultaneously preparing for a plebiscite. Third, internationally, Putin cannot ultimately defeat the Saudis or US shale in terms of market share. Therefore the domestic risks posed above are not compensated by an improvement in Russia’s international standing – neither in oil markets nor in broader strategic influence, given that an economic recession hurts Russia’s ability to maintain and modernize its military and security forces. In the US shales, we are modeling a sharp fall-off in production starting as early as May 2020. For the rest of 2020, production will gradually decline naturally from low rig counts. In 2H20 – probably in 4Q20 – we expect the Texas Railroad Commission to once again regulate oil production in the state, provided other state regulators (e.g., in North Dakota) and producing countries, (e.g., Russia and KSA) also sign on to take on a similar role.6 In addition to the market-driven shut-ins between now and 4Q20, we expect the RRC to secure production cuts of up to 1.5mm b/d by Dec 2020. As prices pick up next year, shale production will stabilize and slowly move up. The supply-demand assumptions we make in this scenario produce a physical surplus for the better part of 2020 (Chart 4). Chart 4Supply-Demand Imbalance Leads to Physical Surplus
Supply-Demand Imbalance Leads to Physical Surplus
Supply-Demand Imbalance Leads to Physical Surplus
Prices Could Fall Further, Then Take Off Even if we see OPEC 2.0 cut, and sharp drops in US shale output followed by renewed pro-rationing by state regulators in the US led by Texas, the fact that they’ve all increased production for April means storage will inevitably rise drastically in the coming months (Chart 5). As inventory skyrockets in the wake of both the massive demand and supply shocks in 1Q20 and April 2020, prices will fall to $20/bbl (Chart 6). Chart 5Inventories Swell on Demand Shock, Then Drain on Supply Cuts
Inventories Swell on Demand Shock, Then Drain on Supply Cuts
Inventories Swell on Demand Shock, Then Drain on Supply Cuts
Chart 6Brent Prices Forced Lower, Then Move Above $60/bbl
Brent Prices Forced Lower, Then Move Above $60/bbl
Brent Prices Forced Lower, Then Move Above $60/bbl
Once the large-scale OPEC 2.0 cuts start, prices rebound rapidly. Demand also starts picking up this summer, which also will lift prices. For 2020, we expect Brent prices to average $35/bbl, while in 2021 we expect Brent to average $66/bbl. Over this period, WTI will trade $2-$4/bbl below Brent. Robert P. Ryan Chief Commodity & Energy Strategist rryan@bcaresearch.com Matt Gertken Geopolitical Strategist mattg@bcaresearch.com Footnotes 1 Please see Global oil refiners shut down as coronavirus destroys demand published by reuters.com March 26, 2020, and S&P Global Platts report Refinery margin tracker: Global refining margins take a severe hit on falling gasoline demand published March 23. 2 This appears to be happening now, as pipeline operators ask shippers to reduce the rate at which they fill the lines. Please see Pipelines ask U.S. drillers to slow output as storage capacity dwindles published by worldoil.com March 30, 2020. 3 Prominently among the GCC states, KSA cuts public spending 5% and introduced fiscal measures meant to cushion the blow of the COVID-19 shock and to offset the low prices resulting from its market-share war with Russia. Please see Saudi Arabia announces $32 billion in emergency funds to mitigate oil, coronavirus impact published by cnbc.com March 20, 2020. 4 Please see the Joint Statement by the Chair of International Monetary and Financial Committee and the Managing Director of the International Monetary Fund issued by International Monetary and Financial Committee Chair Lesetja Kganyago and International Monetary Fund Managing Director Kristalina Georgieva March 27, 2020. 5 Please see Daniel Yergin’s The Prize: The Epic Quest for Oil, Money & Power, published by Simon & Schuster in 1990, particularly Chapter 2 for a discussion of Rockefeller’s “good sweating,” in which competitors were driven out of business by low prices engineered by Rockefeller if they refused to sell out to Standard Oil. 6 The tone of remarks from TRR Chairman Wayne Christian has become more agreeable to having the TRR Commission return to pro-rating oil production in the Lone Star state. His recent editorial for worldoil.com notes, “Any action taken by Texas must be done in lockstep with other oil producing states and nations, ensuring that they cut production at similar times and in similar amounts.” Please see Christian’s editorial, Texas RRC Chairman Wayne Christian: We must stabilize worldwide oil markets, published by worldoil.com March 25, 2020.
Highlights The pandemic has a negative impact on households and has not peaked in the US. But a depression is likely to be averted. Our market-based geopolitical risk indicators point toward a period of rising political turbulence across the world. We are selectively adding risk to our strategic portfolio, but remain tactically defensive. Stay long gold on a strategic time horizon. Feature I'm going where there's no depression, To the lovely land that's free from care. I'll leave this world of toil and trouble My home's in Heaven, I'm going there. - “No Depression In Heaven,” The Carter Family (1936) Chart 1The Pandemic Stimulus Versus The Great Recession Stimulus
GeoRisk Update: No Depression
GeoRisk Update: No Depression
Markets bounced this week on the back of a gargantuan rollout of government spending that is the long-awaited counterpart to the already ultra-dovish monetary policy of global central banks (Chart 1). Just when the investment community began to worry about a full-fledged economic depression and the prospect for bank runs, food shortages, and martial law in the United States, the market rallied. Yet extreme uncertainty persists over how long one third of the world’s population will remain hidden away in their homes for fear of a dangerous virus (Chart 2). Chart 2Crisis Has Not Verifiably Peaked, Uncertainty Over Timing Of Lockdowns
GeoRisk Update: No Depression
GeoRisk Update: No Depression
Chart 3The Pandemic Shock To The Labor Market
The Pandemic Shock To The Labor Market
The Pandemic Shock To The Labor Market
While an important and growing trickle of expert opinion suggests that COVID-19 is not as deadly as once thought, especially for those under the age of 50, consumer activity will not return to normal anytime soon.1 Moreover political and geopolitical risks are skyrocketing and have yet to register in investors’ psyche. Consider: American initial unemployment claims came in at a record-breaking 3.3 million (Chart 3), while China International Capital Corporation estimates that China’s GDP will grow by 2.6% for the year. These are powerful blows against global political as well as economic stability. This should convince investors to exercise caution even as they re-enter the equity market. We are selectively putting some cash to work on a strategic time frame (12 months and beyond) to take advantage of some extraordinary opportunities in equities and commodities. But we maintain the cautious and defensive tactical posture that we initiated on January 24. No Depression In Heaven The US Congress agreed with the White House on an eye-popping $2.2 trillion or 10% of GDP fiscal stimulus. At least 46% of the package consists of direct funds for households and small businesses (Chart 4). This includes $290 billion in direct cash handouts to every middle-class household – essentially “helicopter money,” as it is financed by bonds purchased by the central bank (Table 1). The purpose is to plug the gap left by the near complete halt to daily life and business as isolation measures are taken. A depression is averted, but we still have a recession. Go long consumer staples. Chart 4The US Stimulus Package Breakdown
GeoRisk Update: No Depression
GeoRisk Update: No Depression
Table 1Distribution Of Cash Handouts Under US Coronavirus Response Act
GeoRisk Update: No Depression
GeoRisk Update: No Depression
China, the origin of the virus that triggered the global pandemic and recession, is resorting to its time-tried playbook of infrastructure spending, with 3% of GDP in new spending projected. This number is probably heavily understated. It does not include the increase in new credit that will accompany official fiscal measures, which could easily amount to 3% of GDP or more, putting the total new spending at 6%. Germany and the EU have also launched a total fiscal response. The traditionally tight-fisted Berlin has launched an 11% of GDP stimulus, opening the way for other member states to surge their own spending. The EU Commission has announced it will suspend deficit restrictions for all member states. The ECB’s Pandemic Emergency Purchase Program (PEPP) enables direct lending without having to tap the European Stability Mechanism (ESM) or negotiate the loosening of its requirements. It also enables the ECB to bypass the debate over issuing Eurobonds (though incidentally Germany is softening its stance on the latter idea). The cumulative impact of all this fiscal stimulus is 5% of global GDP – and rising (Table 2). Governments will be forced to provide more cash on a rolling basis to households and businesses as long as the pandemic is raging and isolation measures are in place. Table 2The Global Fiscal Stimulus In Response To COVID-19
GeoRisk Update: No Depression
GeoRisk Update: No Depression
President Trump has signaled that he wants economic life to begin resuming after Easter Sunday, April 12. But he also said that he will listen to the advice of the White House’s public health advisors. State governors are the ones who implement tough “shelter in place” orders and other restrictions, so the hardest hit states will not resume activity until their governors believe that the impact on their medical systems can be managed. Authorities will likely extend the social distancing measures in April until they have a better handle on the best ways to enable economic activity while preserving the health system. Needless to say, economic activity will have to resume gradually as the government cannot replace activity forever and the working age population can operate even with the threat of contracting the disease (social distancing policies would become more fine-tuned for types of activity, age groups, and health risk profiles). The tipping point from recession to depression would be the point at which the government’s promises of total fiscal and monetary support for households and businesses become incapable of reassuring either the financial markets or citizens. The largest deficit the US government has ever run was 30% of GDP during World War II (Chart 5). Today’s deficit is likely to go well beyond 15% (5% existing plus 10% stimulus package plus falling revenue). If authorities were forced to triple the lockdown period and hence the fiscal response the country would be in uncharted territory. But this is unlikely as the incubation period of the virus is two weeks and China has already shown that a total lockdown can sharply reduce transmission. Chart 5The US's Largest Peacetime Budget Deficit
The US's Largest Peacetime Budget Deficit
The US's Largest Peacetime Budget Deficit
Any tipping point into depression would become evident in behavior: e.g. a return to panic selling, followed by the closure of financial market trading by authorities, bank runs, shortages of staples across regions, and possibly the use of martial law and curfews. While near-term selloffs can occur, the rest seems very unlikely – if only because, again, the much simpler solution is to reduce the restrictions on economic activity gradually for the low-risk, healthy, working age population. Bottom Line: Granting that the healthy working age population can and will eventually return to work due to its lower risk profile, unlimited policy support suggests that a depression or “L-shaped” recovery is unlikely. The Dark Hour Of Midnight Nearing While the US looks to avoid a depression, there will still be a recession with an unprecedented Q2 contraction. The recovery could be a lot slower than bullish investors expect. Global manufacturing was contracting well before households got hit with a sickness that will suppress consumption for the rest of the year. There is another disease to worry about: the dollar disease. The world is heavily indebted and holds $12 trillion in US dollar-denominated debt. Yet the dollar is hitting the highest levels in years and global dollar liquidity is drying up. The greenback has rallied even against major safe haven currencies like the Japanese yen and Swiss franc (Chart 6). Of course, the Fed is intervening to ensure highly indebted US corporates have access to loans and extending emergency dollar swap lines to a total of 14 central banks. But in the near term global growth is collapsing and the dollar is overshooting. This can create a self-reinforcing dynamic. The same goes for any relapse in Chinese growth. Unlike in 2008 – but like 2015 – China is the epicenter of the global slowdown. China has much larger economic and financial imbalances today than it did in 2003 when the SARS outbreak occurred, and it will increase these imbalances going forward as it abandons its attempt to deleverage the corporate sector (Chart 7). Chart 6The Greenback Surge Deprives The World Of Liquidity
The Greenback Surge Deprives The World Of Liquidity
The Greenback Surge Deprives The World Of Liquidity
Chart 7China's Financial Imbalances Are A Worry
China's Financial Imbalances Are A Worry
China's Financial Imbalances Are A Worry
The rest of emerging markets face their own problems, including poor governance and productivity, as well as the dollar disease and the China fallout. They are unlikely to lift themselves out of this crisis, but they could become the source for credit events and market riots that prolong the global risk-off phase. Bottom Line: It is too soon to sound the all-clear. If the dollar continues on its rampage, then the gigantic stimulus will not be enough, markets will relapse, and fears of deflation will grow. World Of Toil And Trouble Political risk is the next shoe to drop. The pandemic and recession are setting in motion a political earthquake that will unfold over the next decade. Almost all of our 12 market-based geopolitical risk indicators have exploded upward since the beginning of the year. Chart 8China's Political Risk Is Rising
China's Political Risk Is Rising
China's Political Risk Is Rising
These indicators show that developed market equities and emerging market currencies are collapsing far more than is justified by underlying fundamentals. This risk premium reflects the uncertainty of the pandemic, but the recession will destabilize regimes and fuel fears about national security. So the risk premium will not immediately decline in several important cases. China’s political risk is shooting up, as one would expect given that the pandemic began in Hubei (Chart 8). The stress within the Communist Party can be measured by the shrill tone of the Chinese propaganda machine, which is firing on all cylinders to convince the world that Chinese President Xi Jinping did a great job handling the virus while the western nations are failing states that cannot handle it. The western nations are indeed mishandling it, but that does not solve China’s domestic economic and social troubles, which will grow from here. Of course, our political risk indicator will fall if Chinese equities rally more enthusiastically than Chinese state banks expand credit as the economy normalizes. But this would suggest that markets have gotten ahead of themselves. By contrast, if China surges credit, yet equity investors are unenthusiastic, then the market will be correctly responding to the fact that a credit surge will increase economic imbalances and intensify the tug-of-war between authorities and the financial system, particularly over the effort to prevent the property sector bubble from ballooning. China needs to stimulate to recover from the downturn. Obviously it does not want instability for the 100th birthday of the Communist Party in 2021. An even more important reason for stimulus is the 2022 leadership reshuffle – the twentieth National Party Congress. This is the date when Xi Jinping would originally have stepped down and the leading member of the rival faction (Hu Chunhua?) would have taken over the party, the presidency, and the military commission. Today Xi is not at risk of losing power, but with a trade war and recession to his name, he will have to work hard to tighten control over the party and secure his ability to stay in power. An ongoing domestic political crackdown will frighten local governments and private businesses, who are already scarred by the past decade and whose animal spirits are important to the overall economic rebound. It is still possible that Beijing will have to depreciate the renminbi against the dollar. This is the linchpin of the trade deal with President Trump – especially since other aspects of the deal will be set back by the recession. As long as Trump’s approval rating continues to benefit from his crisis response and stimulus deals, he is more likely to cut tariffs on China than to reignite the trade war. This approach will be reinforced by the bump in his approval rating upon signing the $2 trillion Families First Coronavirus Response Act into law (Chart 9). He will try to salvage the economy and his displays of strength will be reserved for market-irrelevant players like Venezuela. But if the virus outbreak and the surge in unemployment turn him into a “lame duck” later this year, then he may adopt aggressive trade policy and seek the domestic political upside of confronting China. He may need to look tough on trade on the campaign trail. Diplomacy with North Korea could also break down. This is not our base case, but we note that investors are pricing crisis levels into the South Korean won despite its successful handling of the coronavirus (Chart 10). Pyongyang has an incentive to play nice to assist the government in the South while avoiding antagonizing President Trump. But Kim Jong Un may also feel that he has an opportunity to demonstrate strength. This would be relevant not because of North Korea’s bad behavior but because a lame duck President Trump could respond belligerently. Chart 9Trump’s Approval Gets Bump From Crisis Response And Stimulus
GeoRisk Update: No Depression
GeoRisk Update: No Depression
Chart 10South Korean Political Risk Rising
South Korean Political Risk Rising
South Korean Political Risk Rising
We highlighted Russia as a “black swan” candidate for 2020. This view stemmed from President Vladimir Putin’s domestic machinations to stay in power and tamp down on domestic instability in the wake of domestic economic austerity policies. For the same reason we did not expect Moscow to engage in a market share war with Saudi Arabia that devastated oil prices, the Russian ruble, and economy. At any rate, Russia will remain a source of political surprises going forward (Chart 11). Go long oil. Putin cannot add an oil collapse to a plague and recession and expect a popular referendum to keep him in power till 2036. The coronavirus is hitting Russia, forcing Putin to delay the April 22 nationwide referendum that would allow him to rule until 2036. It is also likely forcing a rethink on a budget-busting oil market share war, since more than the $4 billion anti-crisis fund (0.2% of GDP) will be needed to stimulate the economy and boost the health system. Russia faces a budget shortfall of 3 trillion rubles ($39 billion) this year from the oil price collapse. It is no good compounding the economic shock if one intends to hold a popular referendum – even if one is Putin. For all these reasons we agree with BCA Research Commodity & Energy Strategy that a return to negotiations is likely sooner rather than later. Chart 11Russia: A Lake Of Black Swans
Russia: A Lake Of Black Swans
Russia: A Lake Of Black Swans
However, we would not recommend buying the ruble, as tensions with the US are set to escalate. Instead we recommend going long Brent crude oil. Political risk in the European states is hitting highs unseen since the peak of the European sovereign debt crisis (Chart 12). Some of this risk will subside as the European authorities did not delay this time around in instituting dramatic emergency measures. Chart 12Europe: No Delay In Offering 'Whatever It Takes'
Europe: No Delay In Offering 'Whatever It Takes'
Europe: No Delay In Offering 'Whatever It Takes'
Chart 13Political Risk Understated In Taiwan And Turkey
Political Risk Understated In Taiwan And Turkey
Political Risk Understated In Taiwan And Turkey
However, we do not expect political risk to fall back to the low levels seen at the end of last year because the recession will affect important elections between now and 2022 in Italy, the Netherlands, Germany, and France. Only the UK has the advantage of a single-party parliamentary majority with a five-year term in office – this implies policy coherence, notwithstanding the fact that Prime Minister Boris Johnson has contracted the coronavirus. The revolution in German and EU fiscal policy is an essential step in cementing the peripheral countries’ adherence to the monetary union over the long run. But it may not prevent a clash in the coming years between Italy and Germany and Brussels. Italy is one of the countries most likely to see a change in government as a result of the pandemic. It is hard to see voters rewarding this government, ultimately, for its handling of the crisis, even though at the moment popular opinion is tentatively having that effect. The Italian opposition consists of the most popular party, the right-wing League, and the party with the fastest rising popular support, which is the right-wing Brothers of Italy. So the likely anti-incumbent effect stemming from large unemployment would favor the rise of an anti-establishment government over the next year or two. The result would be a clash with Brussels even in the context of Brussels taking on a more permissive attitude toward budget deficits. This will be all the worse if Brussels tries to climb down from stimulus too abruptly. Our political risk indicators have fallen for two countries over the past month: Taiwan and Turkey (Chart 13). This is not because political risk is falling in reality, but because these two markets have not seen their currencies depreciate as much as one would expect relative to underlying drivers of their economy: In Taiwan’s case the reason is the US dollar’s unusual strength relative to the Japanese yen amidst the crisis. Ultimately the yen is a safe-haven currency and it will eventually strengthen if global growth continues to weaken. Moreover we continue to believe that real world politics will lead to a higher risk premium in the Taiwanese dollar and equities. Taiwan faces conflicts with mainland China that will increase with China’s recession and domestic instability. In Turkey’s case, the Turkish lira has depreciated but not as much as one would expect relative to European equities, which have utterly collapsed. Therefore Turkey’s risk indicator shows its domestic political risk falling rather than rising. Turkey’s populist mismanagement will ensure that the lira continues depreciating after European equities recover, and then our risk indicator will shoot up. Chart 14Brazilian Political Risk Is No Longer Contained
Brazilian Political Risk Is No Longer Contained
Brazilian Political Risk Is No Longer Contained
Prior to the pandemic, Brazilian political risk had remained contained, despite Brazilian President Jair Bolsonaro’s extreme and unorthodox leadership. Since the outbreak, however, this indicator has skyrocketed as the currency has collapsed (Chart 14). To make matters worse, Bolsonaro is taking a page from President Trump and diminishing the danger of the coronavirus in his public comments to try to prevent a sharp economic slowdown. This lackadaisical attitude will backfire since, unlike the US, Brazil does not have anywhere near the capacity to manage a major outbreak, as government ministers have warned. This autumn’s local elections present an opportunity for the opposition to stage a comeback. Brazilian stocks won’t be driven by politics in the near term – the effectiveness of China’s stimulus is critical for Brazil and other emerging markets – but political risk will remain elevated for the foreseeable future. Bottom Line: Geopolitical risk is exploding everywhere. This marks the beginning of a period of political turbulence for most of the major nation-states. Domestic economic stresses can be dealt with in various ways but in the event that China’s instability conflicts with President Trump’s election, the result could be a historic geopolitical incident and more downside in equity markets. In Russia’s case this has already occurred, via the oil shock’s effect on US shale producers, so there is potential for relations to heat up – and that is even more true if Joe Biden wins the presidency and initiates Democratic Party revenge for Russian election meddling. The confluence of volatile political elements informs our cautious tactical positioning. Investment Conclusions If the historic, worldwide monetary and fiscal stimulus taking place today is successful in rebooting global growth, then there will be “no depression.” The world will learn to cope with COVID-19 while the “dollar disease” will subside on the back of massive injections of liquidity from central banks and governments. Gold: The above is ultimately inflationary and therefore our strategic long gold trade will be reinforced. The geopolitical instability we expect to emerge from the pandemic and recession will add to the demand for gold in such a reflationary environment. No depression means stay long gold! US Equities: Equities will ultimately outperform government bonds in this environment as well. Our chief US equity strategist Anastasios Avgeriou has tallied up the reasons to go long US stocks in an excellent recent report, “20 Reasons To Buy Equities.” We agree with this view assuming investors are thinking in terms of 12 months and beyond. Chart 15Oil/Gold Ratio Extreme But Wait To Go Long
Oil/Gold Ratio Extreme But Wait To Go Long
Oil/Gold Ratio Extreme But Wait To Go Long
Tactically, however, we maintain the cautious positioning that we adopted on January 24. We have misgivings about the past week’s equity rally. Investors need a clear sense of when the US and European households will start resuming activity. The COVID-19 outbreak is still capable of bringing negative surprises, extending lockdowns, and frightening consumers. Hence we recommend defensive plays that have suffered from indiscriminate selling, rather than cyclical sectors. Go tactically long S&P consumer staples. US Bonds: Over the long run, the Fed’s decision to backstop investment grade corporate bonds also presents a major opportunity to go long on a strategic basis relative to long-dated Treasuries, following our US bond strategists. Global Equities: We prefer global ex-US equities on the basis of relative valuations and US election uncertainty. Shifting policy winds in the United States favor higher taxes and regulation in the coming years. This is true unless President Trump is reelected, which we assess as a 35% chance. Emerging Markets: We are booking gains on our short TRY-USD trade for a gain of 6%. This is a tactical trade that remains fundamentally supported. Book 6% gain on short TRY-USD. Oil: For a more contrarian trade, we recommend going long oil. Our tactical long oil / short gold trade was stopped out at 5% last week. While we expect mean reversion in this relationship, the basis for gold to rally is strong. Therefore we are going long Brent crude spot prices on Russia’s and Saudi Arabia’s political constraints and global stimulus (Chart 15). We will reconsider the oil/gold ratio at a later date. Matt Gertken Vice President Geopolitical Strategist mattg@bcaresearch.com Footnotes 1 See Joseph T. Wu et al, "Estimating clinical severity of COVID-19 from the transmission dynamics in Wuhan, China," Nature Medicine, March 19, 2020, and Wei-jie Guan et al, "Clinical Characteristics of Coronavirus Disease 2019 in China," The New England Journal Of Medicine, February 28, 2020. Section II: Appendix : GeoRisk Indicator China
China: GeoRisk Indicator
China: GeoRisk Indicator
Russia
Russia: GeoRisk Indicator
Russia: GeoRisk Indicator
UK
UK: GeoRisk Indicator
UK: GeoRisk Indicator
Germany
Germany: GeoRisk Indicator
Germany: GeoRisk Indicator
France
France: GeoRisk Indicator
France: GeoRisk Indicator
Italy
Italy: GeoRisk Indicator
Italy: GeoRisk Indicator
Canada
Canada: GeoRisk Indicator
Canada: GeoRisk Indicator
Spain
Spain: GeoRisk Indicator
Spain: GeoRisk Indicator
Taiwan
Taiwan: GeoRisk Indicator
Taiwan: GeoRisk Indicator
Korea
Korea: GeoRisk Indicator
Korea: GeoRisk Indicator
Turkey
Turkey: GeoRisk Indicator
Turkey: GeoRisk Indicator
Brazil
Brazil: GeoRisk Indicator
Brazil: GeoRisk Indicator
Section III: Geopolitical Calendar
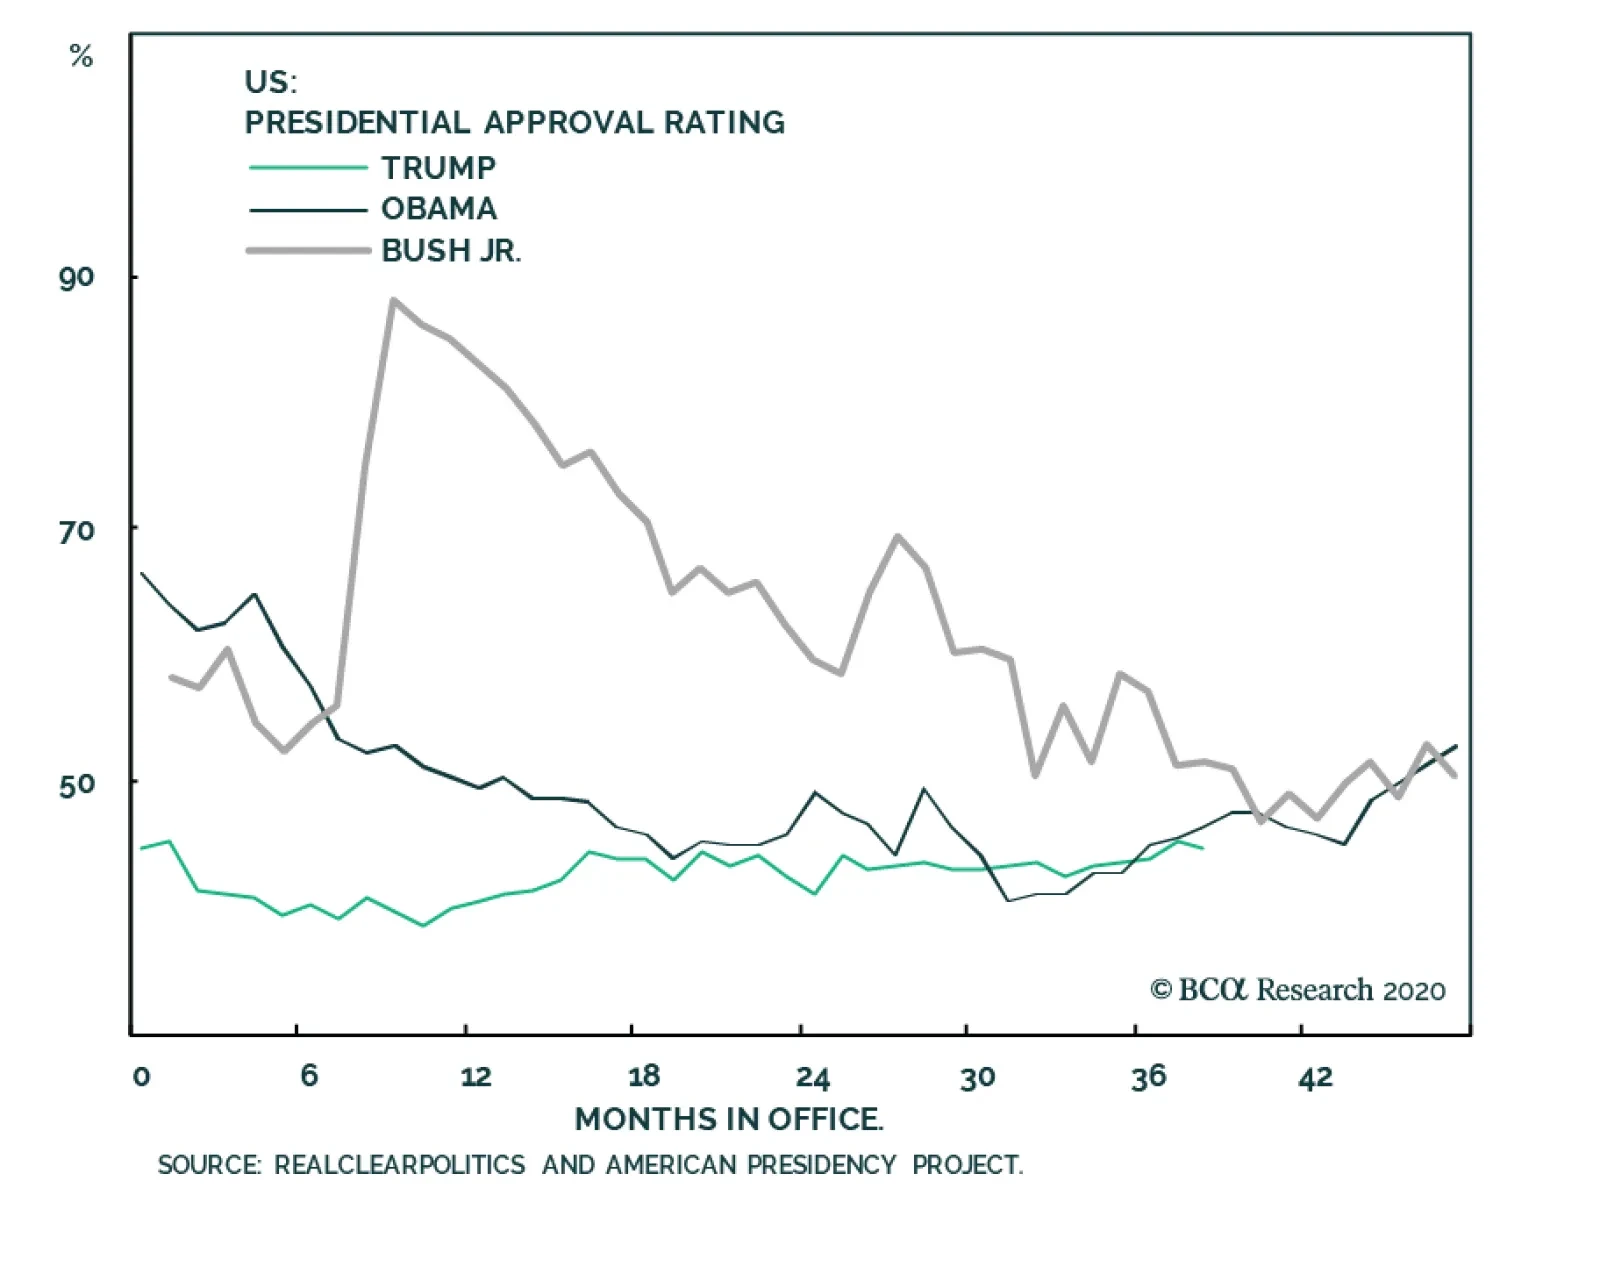
US President Trump’s approval rating has fallen amid the pandemic. It is now deviating from that of President Obama in 2012. Our Geopolitical Strategy argues that Trump is no longer favored to win reelection. Trump apparently believes he can still salvage…
Feature We are downgrading US President Donald Trump’s odds of winning election. We now consider him an underdog. Since November 2018 we had given Trump a 55% chance of victory – and when former Vice President Joe Biden clinched the nomination in the midst of the virus crisis we argued that the election was “too close to call.” Now, subjectively, we would say Trump has a 35% chance of winning. This is generous relative to history, but seems appropriate to us due to the unpredictable nature of the coronavirus pandemic (which could claim either presidential candidate), the massive US and global stimulus, and the weakness of his opponent. Trump’s approval rating has fallen, albeit slightly, amid the coronavirus pandemic (Chart 1). It is now deviating from the rising approval rating of President Barack Obama at this stage in the 2012 election cycle. Since Trump has been generally less popular than the average president (Chart 2), including Obama, this is a very worrying sign for Trump. Chart 1Virus Knocked Trump Off Track
Downgrading Trump's Odds Of Reelection
Downgrading Trump's Odds Of Reelection
Chart 2Trump Has Zero Buffer For Loss Of Popularity
Downgrading Trump's Odds Of Reelection
Downgrading Trump's Odds Of Reelection
It is also a worrying sign for global risk assets despite their recent collapse. Chart 3To Boost Economy, Trump Must Allow Outbreaks
To Boost Economy, Trump Must Allow Outbreaks
To Boost Economy, Trump Must Allow Outbreaks
The risk that Trump becomes a “lame duck” president was one of our top two geopolitical risks for the year. The pandemic and recession have laid the groundwork for this risk to materialize (Chart 3). Trump becomes a liability for the stock market if he concludes that he cannot win reelection. If he seems destined to lose, he has an incentive to use the powers of the presidency in his final months to “turn the tables” and change the narrative, or to cement his legacy by achieving long-term US national interests that have negative economic consequences. For now Trump apparently believes he can still salvage the economy in time to win reelection. He is softening his tone on the need for stringent social distancing policies that are designed to “flatten the curve” of the coronavirus burden on the health system. His administration will review the tough policies on Monday, March 30 before determining whether they should be extended. Individual states have leeway to maintain lockdowns, but a loosening of federal scrutiny would allow more workers to go back to work. While Trump’s desire to restart the economy is self-interested, it is true that too long of a shutdown could create negative feedback loops in the economy. A deeper slump might have worse consequences than the virus outbreak with targeted measures to mitigate the most vulnerable populations (e.g. those over 60, those with heart disease or type-2 diabetes). The problem for Trump is that if he runs on an economic ticket, he is already doomed. Unemployment is bound to rise and laid off workers tend to show up at polls to vote against the party in power. Otherwise Trump’s only option is to run as a “war president” and try to capitalize on the population’s general unwillingness to change leaders in the thick of a crisis. This strategy could work, but then Trump must tighten rather than loosen quarantines, at least over the next month. President George W. Bush benefited from the “war president” effect: his popularity surged after the September 11, 2001 terrorist attacks and the invasion of Iraq. It fell beneath 50% over the following three years, but it recovered as the election approached and the country decided not to “change horses in mid-stream.” Franklin Delano Roosevelt after Pearl Harbor is another analogy, albeit less applicable. Richard Nixon in 1972 is only roughly analogous because the recession began the year after his reelection. For President Trump to benefit from a similar dynamic we would need to see two things. First, his approval rating would need to hold steady through the worst of the crisis – from today throughout the spring – and then improve over the summer on the back of perceived progress in handling the outbreak. Second, we would need to see the economy improve from the deep contraction expected to occur in H1, so that by October voters feel the situation is improving and the future is brightening. Loosening vigilance against the virus and causing new outbreaks jeopardizes the first imperative, while maintaining or increasing vigilance jeopardizes the second part. Few presidents have survived a recession – Trump is asking to do what no president has done since Teddy Roosevelt in 1904. Our quantitative US election model will shift decisively against Trump in April when new data becomes available for state economic indicators (Chart 4). Chart 4Quantitative Election Model Will Show Trump Defeat When Q1 Data Arrive
Downgrading Trump's Odds Of Reelection
Downgrading Trump's Odds Of Reelection
This implies that Trump should double down on the painful isolation measures today to try to secure a victory in the battle against the virus. But then the recession is deeper – and the buck still stops with him for the initial mismanagement of the outbreak. Of course, the virus is not Trump’s fault, but it is a nationwide health crisis, and neither he nor his party can defend their record on health care. True, Biden is a weak opponent. Nevertheless a pandemic and recession would favor any opposition candidate. The burden is on Trump to surprise the world a second time. If the public becomes accustomed to the virus and the 8% of GDP US stimulus package kicks in, Trump might just pull it off, which is why we still give him a 35% chance. The silver lining for financial markets is that the 29% selloff in US equities from their peak earlier this year has already largely discounted any negative implications of a Democratic ascendancy, such as tougher regulation and higher corporate and individual tax rates. The fact that the Democratic candidate is Biden, not democratic socialist Bernie Sanders, is important because the Democrats are highly likely to take the Senate if they take the White House. Biden would reduce some aspects of Trumpian populism and rehabilitate US alliances (e.g. with Europe). However, as with Trump, trade protectionism and great power competition with China and Russia will intensify. A major underrated risk to markets this year is that Trump, running as a “war president” and facing a recessionary defeat, could adopt an aggressive foreign policy or trade policy, especially once the coronavirus outbreak subsides and a scapegoat is sought. A clash with China – including proxy battles over North Korea or Taiwan – is not out of the question. Bottom Line: We are downgrading Trump’s chances of winning reelection. However, a Biden presidency is no longer market-negative because the worst is discounted. Matt Gertken Vice President Geopolitical Strategist mattg@bcaresearch.com
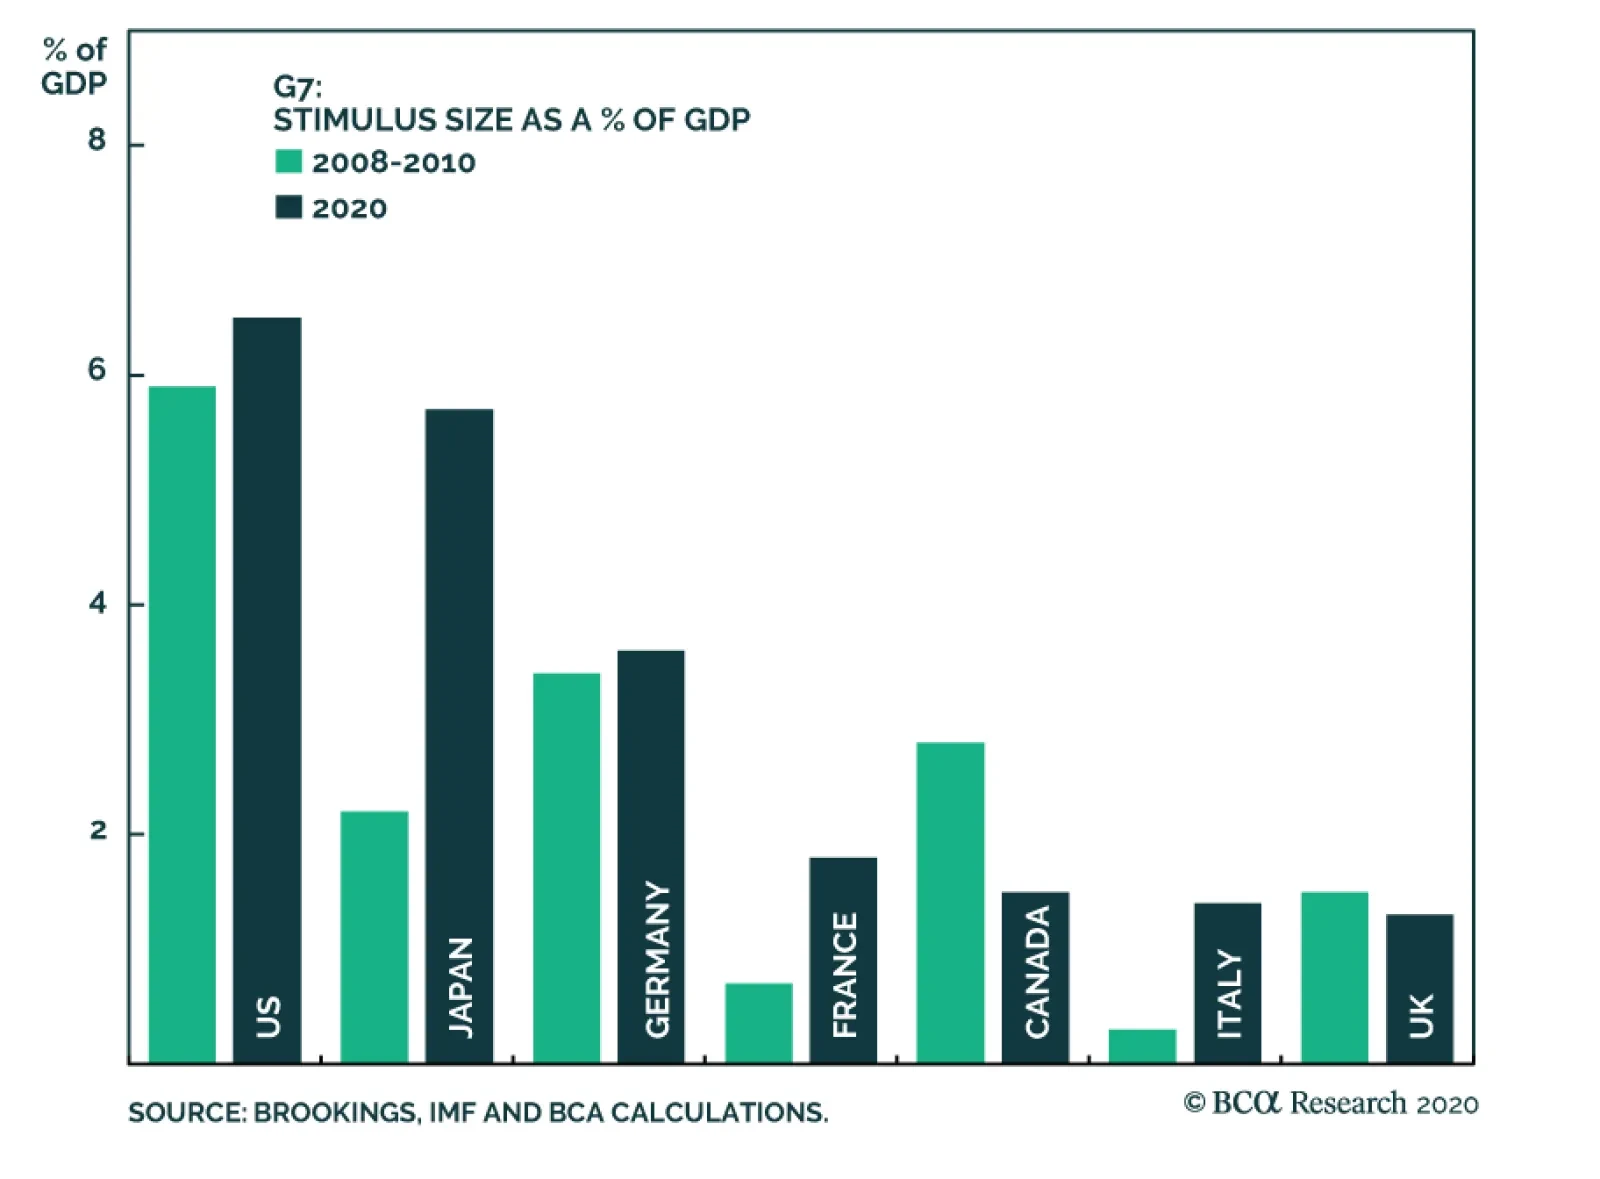
Last Friday, BCA Research's Geopolitical Strategy service determined that government health policy is the key to a durable market rebound. The global financial meltdown continues despite massive monetary and fiscal stimulus by governments across the…
Highlights The global pandemic is quickening the decline in globalization. Democracies can manage the virus, but it will be painful. European integration just got a major boost from Germany’s fiscal turn. Stay long the German consumer relative to the exporter. The US and UK are shifting to a “big government” approach for the first time in forty years. Go long TIPS versus equivalent-maturity nominal Treasuries. The US-China cold war is back on, after a fleeting hiatus. Stay short CNY-USD. Stay strategically long gold but go tactically long Brent crude oil relative to gold. Feature The global pandemic blindsided us this year, but it is catalyzing the past decade’s worth of Geopolitical Strategy’s themes. This week’s report is dedicated to our founder and consulting editor, Marko Papic, who spearheaded the following themes, which should be considered in light of this month’s extraordinary developments: The Apex Of Globalization: Borders are closing and the US is quarreling with both Europe and China over vulnerabilities in its medical supply chain. European Integration: Germany is embracing expansive fiscal policy and is softening its line on euro bonds. The End of Anglo-Saxon Laissez-Faire: Senate Republicans in the US are considering “helicopter money” – deficit-financed cash handouts to the public. US-China Conflict: Pandemic, recession, and the US election are combining to make a dangerous geopolitical cocktail. In this report we discuss how the coronavirus crisis is supercharging these themes, making them salient for investors in the near term. New themes will also develop from the crucible of this pandemic and global recession. Households Can’t Spend Helicopter Money Under Quarantine The global financial meltdown continues despite massive monetary and fiscal stimulus by governments across the world (Chart 1). The reason is intuitive: putting cash in people’s hands offers little solace if people are in quarantine or self-isolation and can’t spend it. Stimulus is essential and necessary to defray the costs of a collapsing economy, but doesn’t give any certainty regarding the depth and duration of the recession or the outlook for corporate earnings. Government health policy, rather than fiscal or monetary policy, will provide the critical signals in the near term. Once the market is satisfied that the West is capable of managing the pandemic, then the unprecedented stimulus has the potential to supercharge the rebound. The most important measure is still the number of new daily cases of the novel coronavirus across the world (Chart 2). Once this number peaks and descends, investors will believe the global pandemic is getting under control. It will herald a moment when consumers can emerge from their hovels and begin spending again. Chart 1Monetary/Fiscal Stimulus Not Enough To Calm Markets
De-Globalization Confirmed
De-Globalization Confirmed
Chart 2Keep Watching New Daily Cases Of COVID-19
De-Globalization Confirmed
De-Globalization Confirmed
It is critical to see this number fall in Italy, proving that even in cases of government failure, the contagion will eventually calm down (Chart 3). This is essential because it is possible that an Italian-sized crisis could develop in the US or another European country, especially given that unlike Iran, these countries have large elderly populations highly susceptible to the virus. Financial markets are susceptible to more panic until the US and EU show the virus is under control. At the same time the other western democracies still need to prove they are capable of delaying and mitigating the virus now that they are fully mobilized. They should be able to – social distancing works. The province of Lodi, Italy offers an example of successful non-pharmaceutical measures (isolation). It enacted stricter policies earlier than its neighbors and succeeded in turning down the number of daily new cases (Chart 4).1 But it may also be testing less than its wealthier neighbor Bergamo, where the military has recently been deployed to remove corpses. Chart 3Market Needs Italy Contagion To Subside
De-Globalization Confirmed
De-Globalization Confirmed
Chart 4Lodi Suggests Social Distancing Works
De-Globalization Confirmed
De-Globalization Confirmed
More stringent measures, including lockdowns, are necessary in “hot zones” where the outbreak gets out of control. It is typical of democracies to mobilize slowly, in war or other crises. Italy brought the crisis home for the G7 nations, jolting them into unified action under Mario Draghi’s debt-crisis slogan of “whatever it takes.” Borders are now closed, schools and gatherings are canceled, policy and military forces are deploying, and emergency production of supplies is under way. Populations are responding to their leaders. Self-preservation is a powerful motivator once the danger is clearly demonstrated. Still, in the near term, Spain, Germany, France, the UK, and the United States have painful battles to fight to ensure they do not become the next Italy, with an overloaded medical system leading to a vicious spiral of infections and deaths (Chart 5). Chart 5Painful Battles Ahead For US And EU
De-Globalization Confirmed
De-Globalization Confirmed
Until financial markets verify that current measures are working, they are susceptible to panics and selling. In the United States, testing kits were delayed by more than a month because the Center for Disease Control bungled the process and failed to adopt the successful World Health Organization protocol. Some materials for testing kits are still missing. Many states will not begin testing en masse for another two weeks. This means that big spikes in new cases will occur not only now but in subsequent weeks as testing exposes more infections. Over the next month there are numerous such trigger points for markets to panic and give away whatever gains they may have made from previous attempts at a rally. Pure geopolitical risks, outlined below, reinforce this reasoning. Volatility will continue to be the dominant theme. Governments must demonstrate successes in health crisis management before monetary and fiscal measures can have their full effect. There is no amount of stimulus that can compensate for the collapse of consumer spending in advanced consumer societies (Chart 6), so consumers’ health must be put on a better trajectory first. Thus in place of economic and financial data streams, we are watching our Health Policy Checklist (Table 1) to determine if policy measures can provide reassurance to the economy and financial markets. Chart 6No Stimulus Can Offset Collapse Of Consumer
No Stimulus Can Offset Collapse Of Consumer
No Stimulus Can Offset Collapse Of Consumer
Table 1Markets Need To See Health Policy Succeeding
De-Globalization Confirmed
De-Globalization Confirmed
Bottom Line: For financial markets to regain confidence durably, governments must show they can manage the outbreak. This can be done but the worst is yet to come and markets will not be able to recover sustainably over the next month or two during that process. There is more upside for the US dollar and more downside for global equities ahead. The Great Fiscal Blowout Global central banks were not entirely out of options when this crisis hit – the Fed has cut rates to zero, increased asset purchases, and extended US dollar swap lines, while central banks already at the zero bound, like the ECB, have still been able to expand asset purchases radically (Table 2). Table 2Central Banks Still Had Some Options When Crisis Hit
De-Globalization Confirmed
De-Globalization Confirmed
Chart 7ECB Still The Lender Of Last Resort
ECB Still The Lender Of Last Resort
ECB Still The Lender Of Last Resort
The ECB’s new 750 billion euro Pandemic Emergency Purchase Program (PEPP) has led to a marked improvement in peripheral bond spreads which were blowing out, guaranteeing that the lender of last resort function remains in place even in the face of a collapse of the Italian economy that will require a massive fiscal response in the future (Chart 7). Nevertheless with rates so low, and government bond yields and yield curves heavily suppressed, investors do not have faith in monetary policy to make a drastic change to the macro backdrop for developed market economies. Fiscal policy was the missing piece. It has remained restrained due to government concerns about excessive public debt. Now the “fiscal turn” in policy has arrived with the pandemic and massive stimulus responses (Table 3). Table 3Massive Stimulus In Response To Pandemic
De-Globalization Confirmed
De-Globalization Confirmed
The Anglo-Saxon world had already rejected budgetary “austerity” in 2016 with Brexit and Trump. Few Republicans dare oppose spending measures to combat a pandemic and deep recession after having voted to slash corporate taxes at the height of the business cycle in 2017.2 The Trump administration is currently vying with the Democratic leadership to see who can propose a bigger third and fourth phase to the current spending plans – $750 billion versus $1.2 trillion? Both presidential candidates are proposing $1 trillion-plus infrastructure plans that are not yet being put to Congress to consider. The Trump administration agrees with its chief Republican enemy, Mitt Romney, as well as former Obama administration adviser Jason Furman, in proposing direct cash handouts to households (“helicopter money”). The size of the US stimulus is at 7% of GDP and rising, larger than in 2008- 10. In the UK, the Conservative Party has changed fiscal course since the EU referendum. Prime Minister Boris Johnson's government had proposed an “infrastructure revolution” and the most expansive British budget in decades – and that was before the virus outbreak. Robert Chote, the head of the Office for Budget Responsibility, captured the zeitgeist by saying, “Now is not a time to be squeamish about public sector debt. We ran during the Second World War budget deficits in excess of 20% of GDP five years on the trot and that was the right thing to do.”3 Now Germany and the EU are joining the ranks of the fiscally accommodative – and in a way that will have lasting effects beyond the virus crisis. Chart 8Coalition Loosened Belt Amid Succession Crisis
Coalition Loosened Belt Amid Succession Crisis
Coalition Loosened Belt Amid Succession Crisis
On March 13 Germany pulled out a fiscal “bazooka” of government support. Finance Minister Olaf Scholz announced that the state bank, KfW, will be able to lend 550bn euros to any business, great or small, suffering amid the pandemic. KfW’s lending capacity was increased from 12% to 15% of GDP. But Scholz, of the SPD, and Economy Minister Peter Altmaier, of the CDU, both insist that there is “no upward limit.” This shift in German policy was the next logical step in a policy evolution that began with the European sovereign debt crisis and took several strides over the past year. The German public, battered by the Syrian refugee crisis, China’s slowdown, and the trade war, voted against the traditional ruling parties, the Christian Democratic Union (CDU) and the Social Democratic Party (SPD). Smaller parties have been stealing their votes, namely the Greens but also (less so) the right-wing populist Alternative for Germany (Chart 8). This competition has thrown the traditional parties into crisis, as it is entirely unclear how they will fare in the federal election in 2021 when long-ruling Chancellor Angela Merkel passes the baton to her as yet unknown successor. To counteract this trend, the ruling coalition began loosening its belt last year with a small stimulus package. But a true game changer always required a crisis or impetus – and the coronavirus has provided that. Germany’s shift is ultimately rooted in geopolitical constraints: Germany is a net beneficiary of the European single market and stands to suffer both economically and strategically if it breaks apart. Integration requires not only the ECB as lender of last resort but also, ultimately, fiscal transfers to keep weaker, less productive peripheral economies from abandoning the euro and devaluing their national currencies. When Germany loosens its belt, it gives license to the rest of Europe to do the same: The European Commission was obviously going to be extremely permissive toward deficits, but it has now made this explicit. Spain announced a massive 20% of GDP stimulus package, half of which is new spending, and is now rolling back the austere structural reforms of 2012. Italy is devastated by the health crisis and is rolling out new spending measures. The right-wing, big spending populist Matteo Salvini is waiting in the wings, having clashed with Brussels over deficits repeatedly in 2018-19 only to see Brussels now coming around to the need for more fiscal action. In addition to spending more, Germany is also sounding more supportive toward the idea of issuing emergency “pandemic bonds” and “euro bonds,” opening the door for a new source of EMU-wide financing. True, the crisis will bring out the self-interest of the various EU member states. For example, Germany initially imposed a cap on medical exports so that critical items would be reserved for Germans, while Italy would be deprived of badly needed supplies. But European Commission President Ursula von der Leyen promptly put a stop to this, declaring, “We are all Italians now.” Fiscal policy is now a tailwind instead of a headwind. Von der Leyen is representative of the German ruling elite, but her position is in line with the median German voter, who approves of the European project and an ever closer union. Chart 9DM Budget Deficits Set To Widen
DM Budget Deficits Set To Widen
DM Budget Deficits Set To Widen
Separately, it should be pointed that Japan is also going to loosen fiscal policy further. Prime Minister Shinzo Abe was supposed to have already done this according to his reflationary economic policy. His decision to hike the consumer tax in 2014-15 and 2019, despite global manufacturing recessions, ran against the aim of whipping the country’s deflationary mindset. While Abe’s term will end in 2021, Abenomics will continue and evolve by a different name. His successor is much more likely now to follow through with the “second arrow” of Abenomics, government spending. Across the developed markets budget deficits are set to widen and public debt to rise, enabled by low interest rates, surging output gaps, and radical policy shifts that were long in coming (Chart 9). Bottom Line: Ultra-dovish fiscal policy is now complementing ultra-dovish monetary policy throughout the West. This was clear in the US and UK, but now Europe has joined in. Germany’s “bazooka” is the culmination of a policy evolution that began with the European debt crisis. This is an essential step to ensuring that Germany rebalances its economy and that Europe sticks together during and after the pandemic. Europe still faces enormous challenges, but now fiscal policy is a tailwind instead of a headwind. US-China: The Cold War Is Back On US-China tensions are heating back up and could provide the source of another crisis event that exacerbates the “risk off” mode in global financial markets. The underlying strategic conflict never went away – it is rooted in China’s rising geopolitical power relative to the United States. The “phase one” trade deal agreed last fall was a manifestly short-term, superficial deal meant to staunch the bleeding in China’s manufacturing sector and deliver President Trump a victory to take to the 2020 election. Beijing was never going to deliver the exorbitant promises of imports and was not likely to implement the difficult structural provisions until Trump achieved a second electoral mandate. Trump always had the option of accusing China of insufficient compliance, particularly if he won re-election. Now, however, both governments are faced with a global recession and are seeking scapegoats for the COVID-19 crisis. Xi Jinping doesn’t have an electoral constraint but he does have to maintain control of the party and rebuild popular confidence and legitimacy in the wake of the crisis. China’s private sector has suffered a series of blows since Xi took power. China’s trend growth is slowing, it is sitting on an historic debt pile, and it is now facing the deepest recession in modern memory. The protectionist threat from the United States and other nations is likely to intensify amid a global recession. Former Vice President Joe Biden has clinched the Democratic nomination and does not offer a more attractive option for China than President Trump. On the US side, Trump’s economic-electoral constraint is vanishing. Trump’s chances of reelection have been obliterated unless he manages to recreate himself as a successful “crisis president” and convince Americans not to change horses in mid-stream. Primarily this means he will focus on managing the pandemic. Yet it also gives Trump reason to try to change the subject and adopt an aggressive foreign or trade policy, particularly if the virus panic subsides. The economic downside has been removed but there could be political upside to a confrontation with China. The US public increasingly views China unfavorably and is now particularly concerned about medical supply chain vulnerabilities. A diplomatic crisis is already unfolding. China’s propaganda machine has gone into overdrive to distract its populace from the health crisis and recession. The main thrust of this campaign is to praise China’s success in halting the virus’s spread through draconian measures while criticizing the West’s ineffectual response, symbolized by Italy and the United States. This disinformation campaign escalated when Zhao Lijian, spokesman for the Ministry of Foreign Affairs, tweeted that COVID-19 originated in the United States. The conspiracy theory holds that it brought or deployed the coronavirus in China while a military unit visited for a friendly competition in Wuhan in October. A Hong Kong doctor who wrote an editorial exposing this thesis was forced to retract the article. President Trump responded by deliberately referring to COVID-19 as the “Chinese virus.” He defended these comments as a way of emphasizing the origin although China and others have criticized the president for dog-whistle racism. Secretary of State Mike Pompeo and Yang Jiechi, a top Chinese diplomat, met to address the dispute, but relations have only gotten worse. After the meeting China revoked the licenses of several prominent American journalists.4 The fact that conspiracy theories are being spouted by official and semi-official sources in the US and China reflects the dangerous combination of populism, nationalism, and jingoism flaring up in both countries – and the global recession has hardly begun.5 The phase one trade deal may collapse. Investors must now take seriously the possibility that the phase one trade deal will collapse. While China obviously will not meet its promised purchases for the year due to the recession, neither side has abandoned the deal. The CNY-USD exchange rate is still rising (Chart 10). President Trump presumably wants to maintain the deal as a feather in his cap for the election. This means that any failure would come from the China side, as an attack on Trump, or from Trump deciding he is a lame duck and has nothing to lose. These are substantial risks that would blindside the market and trigger more selling. Chart 10US And China Could Abandon Trade Deal
US And China Could Abandon Trade Deal
US And China Could Abandon Trade Deal
Military and strategic tensions could also flare up in the South and East China Seas, the Korean peninsula, or the Taiwan Strait. While we have argued that Korea is an overstated geopolitical risk while Taiwan is understated, at this point both risks are completely off the radar and therefore vastly understated by financial markets. A “fourth Taiwan Strait crisis” could emerge from American deterrence or from Chinese encroachments on Taiwanese security. What is clear is that the US and China are growing more competitive, not more cooperative, as a result of the global pandemic. This is not a “G2” arrangement of global governance but a clash of nationalisms. Another risk is that President Trump would look elsewhere when he looks abroad: conflict with Iran-backed militias in Iraq is ongoing, and both Iran and Venezuela are on the verge of collapse, which could invite American action. A conflict or revolution in Iran would push up the oil price due to regional instability and would have major market-negative implications for Europe. Bottom Line: The US-China trade conflict had only been suspended momentarily. The economic collapse removes the primary constraint on conflict, and the US election is hanging in the balance, so Trump could try to cement his legacy as the president who confronted China. This is a major downside risk for markets even at current crisis lows. Investment Implications What are the market implications of the themes reviewed in this report? First, the virus will precipitate another leg down in globalization, which was already collapsing (Chart 11). Chart 11Globalization Has Peaked
Globalization Has Peaked
Globalization Has Peaked
The US dollar will remain strong in the near term. It is too soon to go long commodities and emerging market currencies and risk assets, though it is notable that our Emerging Markets Strategy has booked profits on its short emerging market equity trade (Chart 12). Chart 12Too Soon To Go Long EM/Commodities
Too Soon To Go Long EM/Commodities
Too Soon To Go Long EM/Commodities
Second, the Anglo-Saxon shift away from laissez faire leads toward dirigisme, an active state role in the economy. US stocks can outperform global stocks amid the global recession, but the rising odds that Trump will lose the election herald a generational anti-corporate turn in US policy. We are strategically long international stocks, which are far more heavily discounted. The combination of de-globalization and dirigisme is ultimately inflationary so we recommend that investors with a long-term horizon go long TIPS versus equivalent-maturity nominal Treasuries, following our US Bond Strategy. Third, Germany, the EU, and the ECB are taking dramatic steps to reinforce our theme of continued European integration. We are strategically long German consumers versus exporters and believe that recommendation should benefit once the virus outbreak is brought under control. There is more downside for EUR-USD in the near term although we remain long on a strategic (one-to-three year) horizon. Fourth, China will not come out the “winner” from the pandemic. It is suffering the first recession in modern memory and is beset by simultaneous internal and external economic challenges. It is also becoming the focus of negative attention globally due to its lack of integration into global standards. Economic decoupling is back on the table as the US may take advantage of the downturn to take protective actions. The US stimulus package in the works should be watched closely for “buy America” provisions and requirements for companies to move onshore. A Biden victory will not remove American “containment policy” directed toward China. Stay strategically long USD-CNY. The chief geopolitical insight from all of the above is that the market turmoil can be prolonged by geopolitical conflict, especially with Trump likely to be a lame duck president. With nations under extreme stress, and every nation fending for itself, the probability of conflicts is rising. We do however see the potential for collapsing oil prices to force Russia and Saudi Arabia back to the negotiating table, so we are initiating a tactical long Brent crude oil / short gold trade. Moreover we remain skeptical toward companies and assets exposed to the US-China relationship, particularly Chinese tech. Matt Gertken Vice President Geopolitical Strategist mattg@bcaresearch.com Footnotes 1 See Margherita Stancati, "Lockdown of Recovering Italian Town Shows Effectiveness of Early Action," Wall Street Journal, March 16, 2020. 2 The conservatives Stephen Moore, Art Laffer, and Steve Forbes are virtually isolated in opposing the emergency fiscal measures – and will live in infamy for this, their “Mellon Doctrine” moment. 3 Costas Pitas and Andy Bruce, “UK unveils $420 billion lifeline for firms hit by coronavirus,” Reuters, March 17, 2020. 4 China retaliated against The Wall Street Journal for calling China “the sick man of Asia.” The United States responded by reducing the number of Chinese journalists licensed in the US. (Washington had earlier designated China state press as foreign government actors, which limited their permissible actions.) Beijing then ordered reporters from The Wall Street Journal, New York Times, and Washington Post whose licenses were set to expire in 2020 not to return. 5 Inflicting an epidemic on one’s own people is a very roundabout way to cause a global pandemic and harm the United States – obviously that is not what happened in China. It is also absurd to think that the US has essentially initiated World War III by committing an act of bioterrorism against China.
Highlights As the global economy moves toward shut-down, the Kingdom of Saudi Arabia (KSA) and Russia will be forced to end their market-share war and focus on shoring up their economies and tending to their populations’ welfare. Governments worldwide are rolling out fiscal- and monetary-policy responses to the COVID-19 pandemic. They also are imposing seldom-seen freedom-of-movement and -gathering restrictions on their populations to contain the spread of the virus. A surge in bankruptcies among US shale-oil companies is expected as demand and supply shocks push Brent and WTI below producers’ breakeven prices. In our base case, benchmark prices are pushed toward $20/bbl this year, which will keep volatility elevated. Prices recover in 4Q20 and 2021, as the pandemic recedes, and economies respond to fiscal and monetary stimulus. We have reduced our oil-price forecasts in the wake of the deterioration in fundamentals, expecting Brent to average $36/bbl in 2020, and $55/bbl in 2021. WTI will trade ~ $3-$4/bbl lower. COVID-19 is transitory. Therefore price risk is to the upside in 2021, given the global stimulus being deployed. Feature Brent and WTI prices are down 61.4% and 66.6% since the start of the year (Chart of the Week), taking front-month futures to their lowest levels since 2002. Oil markets are in a fundamental disequilibrium – the expected global supply curve is moving further to the right with each passing day, as the KSA and Russia market-share rhetoric escalates. Global demand curves are moving further to the left on an hourly basis, as governments worldwide impose freedom-of-movement restrictions and lock-downs to contain the spread of COVID-19 seen only during times of war and natural devastation. These effects combine to swell inventories globally, as rising supply fails to be absorbed by demand. The collapse in crude oil prices since the beginning of this year is lifting volatility to levels not seen since the Gulf War of 1990-91. Chart of the WeekBenchmark Crude Prices Collapse Toward Cash Costs
Benchmark Crude Prices Collapse Toward Cash Costs
Benchmark Crude Prices Collapse Toward Cash Costs
Chart 2Oil-Price Volatility Surges To Wartime Levels
Oil-Price Volatility Surges To Wartime Levels
Oil-Price Volatility Surges To Wartime Levels
Prices, as can be expected under such circumstances, are plunging toward cash costs – i.e., the level at which only operating costs are covered – which are below $20/bbl. The collapse in crude oil prices since the beginning of this year is lifting volatility to levels not seen since the Gulf War of 1990-91 launched by the US and its allies following Iraq’s invasion of Kuwait (Chart 2). As inventories rise, the supply of storage globally falls, and prices are forced below cash costs to drive surplus crude oil production from the market. The rapid evolution from backwardation (prompt prices exceed deferred prices) to steep contango (prompt prices at a discount) in the benchmark crudes is how markets signal the supply of storage is falling (Chart 3). Chart 3Markets' Violent Move From Backwardation To Contango
Markets' Violent Move From Backwardation To Contango
Markets' Violent Move From Backwardation To Contango
Chart 4Storage Constraints Drive Price Volatility
KSA, Russia Will Be Forced To Quit Market-Share War
KSA, Russia Will Be Forced To Quit Market-Share War
This strain on global inventory capacity will keep volatility elevated: As physical constraints on storage intensify, only price can adjust to clear the market, which results in massive price moves as markets respond in real time to supply-demand imbalance (Chart 4). Shales Lead US Output Lower At this point, massive increases in supply are not required to keep benchmark oil prices below $30/bbl. Markets are seeing and anticipating a sharp contraction in demand in the near term, with storage building as consumers “shelter in place” around the world. Production is set to increase in April, in the midst of a global exogenous shock to demand. As these fundamentals are worked into prices volatility will remain high. In our updated forecasts, our base case assumes KSA and its allies, and Russia raise production by 1.3mm b/d in 2Q20 and 3Q20. KSA's and Russia's output increase to ~ 11mm b/d and 11.7mm b/d, respectively. We expect the reality of low prices and a slowing world economy to force these states back to the negotiating table in 2H20, with production cuts being realized in 4Q20 and 2021 (see below). With less capital made available to shale drillers, production growth in the shales literally is forced to slow. While KSA’s and Russia’s budgets almost surely will bear enormous strain in such an environment, we believe it is the US shales that take the hardest hit over the short run, if KSA and Russia maintain their avowed production intensions. The growth in US shale output – Russia’s presumed target – is expected to slow sharply this year under current circumstances, increasing at a rate of just 650k b/d over 2019’s level. Next year, we expect shale production in the US to fall ~ 1.3mm b/d to 7.7mm b/d. Part of this is driven by the on-going reluctance of capital markets to fund shale drillers and hydrocarbon-based energy companies generally, which can be seen in the blowout in high-yield bond spreads dominated by shale issuers (Chart 5). With less capital made available to shale drillers, production growth in the shales literally is forced to slow. Chart 5Low Price Force US Shale Cutbacks
Low Price Force US Shale Cutbacks
Low Price Force US Shale Cutbacks
With funding limited and domestic oil prices well below breakevens – and cash costs – more shale-oil producers will be pushed into bankruptcy or into sharp slowdowns in drilling activity (Charts 6A and 6B). These constraints will force total US output to contract by 1.3mm b/d next year, based on our modeling. This will take US lower 48 output this year and next to 10.5mm b/d and 9.2mm b/d, respectively (Chart 7). Chart 6ALow Prices Force US Shale Cutbacks
KSA, Russia Will Be Forced To Quit Market-Share War
KSA, Russia Will Be Forced To Quit Market-Share War
Chart 6BLow Price Force US Shale Cutbacks
KSA, Russia Will Be Forced To Quit Market-Share War
KSA, Russia Will Be Forced To Quit Market-Share War
Capital markets will not tolerate unprofitable production. When the dust settles next year, US shale-oil output is expected to take the biggest supply hit globally, based on our current assumptions and modeling results. Worthwhile remembering, however, shale-oil production is highly likely to emerge a leaner more efficient sector, as they did in the OPEC-led market-share war of 2014-16.1 Also worthwhile remembering, for shale operators, is capital markets will not tolerate unprofitable production. So, net, a stronger, more disciplined shale-oil producer cohort emerges from the wreckage of the COVID-19 demand shock coupled with the KSA-Russia market-share war of 2020. Chart 7US Shale Contraction Leads US Output Lower In 2021
US Shale Contraction Leads US Output Lower in 2021
US Shale Contraction Leads US Output Lower in 2021
Demand Uncertainty Is Huge We are modeling a shock that reduces global demand – a highly unusual occurrence – by 150k b/d this year versus 2019 levels (Table 1). Most of this shock occurs in 1H20, where a large EM contraction originating in China set the pace. We expect China’s demand to begin recovering in 2Q20. The demand contraction moves into OECD states in 2Q20, which are expected to follow a similar trajectory in demand shedding seen elsewhere (Chart 8). In 2H20, we expect global demand to begin recovering, and, barring another outbreak of COVID-19 (or another novel coronavirus) next winter, for global demand growth to re-accelerate to ~ 1.7mm b/d in 2021. Table 1BCA Global Oil Supply - Demand Balances (MMb/d, Base Case Balances)
KSA, Russia Will Be Forced To Quit Market-Share War
KSA, Russia Will Be Forced To Quit Market-Share War
The uncertainty around our demand modeling is large. Expectations from the large data providers are all over the map: The EIA expects demand to grow 360k b/d this year, while the IEA and OPEC expect -90k and 60k b/d. In addition, some banks and forecasters make a case for demand falling by 1mm b/d or more in 2020, a scenario we do not expect. Sorting through the evolution of demand this year – i.e., tracking the recovery from China and EM through to DM – will be difficult, particularly as Western states go into lock-down mode and the global economy remains moribund. This makes our forecasts for supply-demand balances and prices highly tentative, and subject to revision. Chart 8Demand Shock + Market-Share War = Imbalance
Demand Shock + Market-Share War = Imbalance
Demand Shock + Market-Share War = Imbalance
Market-Share War: What Is It Good For? As we argue above, the US shale-oil producers will, for a variety of reasons, be forced by capital and trading markets to retrench, and to cut production sharply. They lost favor with markets prior to the breakdown of OPEC 2.0, and this will not change. At this point, it is unlikely KSA and Russia can alter this evolution by increasing or decreasing production – investors already have shown they have little interest in funding their further growth and development. The KSA-Russia market-share war reinforces investors’ predispositions, and decidedly accelerates this retrenchment by the shale producers. As the global economy moves toward shut-down, KSA and Russia will be forced to turn their attention to shoring up their economies and tending to their populations’ welfare. The strain of a global shut-down will absorb governments’ resources worldwide, and self-inflicted wounds – which, at this point, a market-share war amounts to – will only make domestic conditions worse in KSA, Russia and their respective allies. The income elasticity of supply for these producers is such that small adjustments – positive or negative – on the supply side have profound effects on oil producers’ revenues (Table 2). Both KSA and Russia are aware of this. Russia burns through its $150 billion national wealth fund in ~ three years in a market-share war, while KSA burns through ~ 10% of its foreign reserves, when export prices fall $30/bbl and Russia's exports rise 200k b/d and KSA's rise 2mm b/d.2 In a world where demand destruction is accelerating revenue losses, and storage limitations threaten to collapse oil prices below cash costs, production management – even if that means extending the 1Q20 cuts of 1.7mm b/d for the balance of 2020 – is necessary to avoid larger, longer-term economic damage (Chart 9). Table 2Market-Share War Vs. Revenue
KSA, Russia Will Be Forced To Quit Market-Share War
KSA, Russia Will Be Forced To Quit Market-Share War
Chart 9Global Inventories Could Surge
Global Inventories Could Surge
Global Inventories Could Surge
We believe the leadership in both of these states have sufficient reason to return to the negotiating table to figure out a way to re-start their production-management accord, if only to preserve funds to cover imports while global demand recovers. It may take a month or two of unchecked production to make this point clear, however, so volatility can be expected to remain elevated. These fundamental and political assessments compel us to reduce our oil-price forecasts in the wake of the deterioration in fundamentals, expecting Brent to average ~ $36/bbl in 2020, and $55/bbl in 2021. WTI will trade ~ $3-$4/bbl lower. Price risk is to the upside in 2021, given the global fiscal and monetary stimulus being deployed. Bottom Line: The confluence of a true global demand shock and a market-share war on the supply side has pushed benchmark crude oil prices close to cash costs for many producers. The damage to states highly dependent on oil revenues is just now becoming apparent. We expect KSA and Russia to return to the negotiating table, to hammer out a production-management accord that allows them to control as much of the economic damage to their economies as is possible. Capital markets already are imposing a harsh discipline on US shales – Russia’s presumptive target in the market-share war. The consequences of the COVID-19 vis-a-vis demand destruction are of far greater moment for KSA and Russia than their market-share war. They need to shore up their economies and get in the best possible position to benefit from a global economic rebound, not destroy themselves seeking a Pyrrhic victory that devastates both of them. Robert P. Ryan Chief Commodity & Energy Strategist rryan@bcaresearch.com Hugo Bélanger Associate Editor Commodity & Energy Strategy HugoB@bcaresearch.com Commodities Round-Up Energy: Overweight Chinese refiner Sinochem International Oil (Singapore) turned down an offer of crude-oil cargoes for May-June deliver from Russian oil company Rosneft PJSC, which is under US sanctions, according to Bloomberg. Sinochem refuses cargoes from Iran, Syria, Venezuela, and Kurdistan, which also are under sanction or are commercially aligned with sanctioned entities. Base Metals: Neutral The downward trend in base metal prices remains, as the spread of the coronavirus intensifies outside of China, and governments worldwide impose freedom-of-movement restrictions on their populations to contain further spread. Persistent US dollar strength – supported by inflows to safe assets amid the elevated global economic uncertainty – pressures EM economies’ base metal demand. As a result, the LME index is down 18% YTD, reaching its 2016 lows. We were stopped out of our long LMEX recommendation on March 17, 2020 for a 12% loss. Precious Metals: Neutral Gold and silver are caught up in a global selloff of assets that have performed well over the past year as safe havens, as market participants raise cash for liquidity reasons or margin calls. We are waiting for an opportunity to go long gold again after being stopped out earlier in the sell-off. Silver will recover with industrial-commodity demand, which we expect to occur in 4Q20, when the COVID-19 threat recedes, and consumers worldwide are responding to the globally fiscal and monetary stimulus being rolled out now. We are staying on the sidelines for now, as volatility is extremely high for metals (Chart 10). Ags/Softs: Underweight CBOT May Corn futures were down 3% Tuesday, reaching 18-month lows, driving mostly by high USD levels, which make US exports less competitive. Supplies from South America, where a large harvest is ongoing in Argentina and Brazil, are taking market share. Furthermore, according to a report from the University of Illinois, lower gasoline consumption resulting from the COVID-19 pandemic will reduce the amount of corn needed for ethanol production; demand could fall 120mm to 170mm bushels. Soybeans and wheat futures ended the day slightly higher on the back of bargain buying, after falling to multi-month lows on Monday. USD strength remains a headwind on ags, encouraging production ex-US at the margin and contributing to stifling demand for US exports (Chart 11). Chart 10Gold Is Experiencing Extremely High Volatility
Gold Is Experiencing Extremely High Volatility
Gold Is Experiencing Extremely High Volatility
Chart 11USD Strength Remains A Headwind On AGS
USD Strength Remains A Headwind On AGS
USD Strength Remains A Headwind On AGS
Footnotes 1 Please see How Long Will The Oil-Price Rout Last?, a Special Report we published March 9, 2020, which discussed US bankruptcy law and the re-cycling of assets. 2 Please see Russia's Supply Shock To Oil Markets and Russia Regrets Market-Share War?, which we published March 6 and March 12, 2020, for additional discussion. Investment Views and Themes Recommendations Strategic Recommendations Tactical Trades TRADE RECOMMENDATION PERFORMANCE IN 2019 Q4
KSA, Russia Will Be Forced To Quit Market-Share War
KSA, Russia Will Be Forced To Quit Market-Share War
Commodity Prices and Plays Reference Table Trades Closed in 2020 Summary of Closed Trades
KSA, Russia Will Be Forced To Quit Market-Share War
KSA, Russia Will Be Forced To Quit Market-Share War
Highlights Our short EM equity index recommendation has reached our target and we are booking profits on this trade. The halt to economic activity will produce a global recession that will be worse than the one that took place in late 2008. We continue to recommend short positions in a basket of EM currencies versus the US dollar. In EM fixed-income markets, the duration of the ongoing selloff has been short, and large losses will trigger more outflows ensuring further carnage. Stay defensive for now. Russia is unlikely to make a deal with Saudi Arabia to restrain oil output for now. Feature The global economy is experiencing a sudden, jarring halt. The only comparison for such a sudden stop is the one that occurred in the fall of 2008, following Lehman’s bankruptcy. In our opinion, the global economic impact of the current sudden stop is shaping up to be worse than the one that occurred in 2008. That said, we are taking profits on our short position in EM equities. This position – recommended on January 30, 2020 – has produced a 30% gain. EM share prices have reached the long-term support that acted as the ultimate floor during the bear markets in 1997-‘98, 2001-‘02, 2007-‘08 and 2015. Our decision to take profits reflects investment discipline. The MSCI EM stock index in US dollar terms has reached our target. In addition, this decision is consistent with two important indicators that we follow and respect: 1. EM stocks have become meaningfully cheap. Chart I-1 illustrates that our cyclically-adjusted P/E (CAPE) ratio for EM equities is about one standard deviation below its fair value – the same level when the EM equity market bottomed in 1998, 2008 and 2015. Chart I-1EM Equities Are Cheap According To The Cyclically-Adjusted P/E Ratio
EM Equities Are Cheap According To The Cyclically-Adjusted P/E Ratio
EM Equities Are Cheap According To The Cyclically-Adjusted P/E Ratio
For this EM CAPE ratio to reach 1.5 standard deviations below its fair value – the level that is consistent with EM’s 2001-02 lows – EM share prices need to drop another 15%. 2. In term of the next technical support, EM share prices have reached the long-term support that acted as the ultimate floor during the bear markets in 1997-‘98, 2001-‘02, 2007-‘08 and 2015 (Chart I-2). Chart I-2EM Share Prices Are At Their Long-Term Support
EM Share Prices Are At Their Long-Term Support
EM Share Prices Are At Their Long-Term Support
While share prices are likely to undershoot, it is risky to bet on a further decline amid current extremely elevated uncertainty and market volatility. The Global Downturn Will Be Worse Than In Late 2008 Odds are that the current global downturn is shaping up to be worse than the one that occurred in late 2008. From a global business cycle perspective, the current sudden halt is beginning from a weaker starting point. Global trade growth was positive back in August-September 2008 – just prior to the Lehman bankruptcy – despite the ongoing US recession (Chart I-3A). In comparison, global trade was shrinking in December 2019, before the COVID-19 outbreak (Chart I-3B). Chart I-3AGlobal Trade Growth Was Positive In September 2008…
Global Trade Growth Was Positive In September 2008...
Global Trade Growth Was Positive In September 2008...
Chart I-3B…But Was Negative In December 2019
...But Was Negative In December 2019
...But Was Negative In December 2019
This is because growth in EM and Chinese economies was still very robust in the middle of 2008. Moreover, the economies of EM and China were structurally very healthy and were anchored by solid fundamentals. Still, the blow to confidence emanating from the crash in global financial markets and plunge in US domestic demand in the fall of 2008 produced major shockwaves in EM/Chinese financial markets. Provided the ongoing negative confidence shock and lingering uncertainty persist, odds are that the risk premium will initially overshoot before settling down. Consistently, risk markets will undershoot in the interim. This is in contrast with current cyclical growth conditions and structural economic health, both of which are very poor in EM/China going into this sudden stop. In China, economic growth in January-February 2020 was much worse than at the trough of the Lehman crisis in the fourth quarter of 2008. Chart I-4 reveals that industrial production, auto sales and retail sales volumes all contracted in January-February 2020 from a year ago. The same variables held up much better in the fourth quarter of 2008 (Chart I-4). Business activity in China is recovering in March, but from very low levels. Reports and evidence from the ground suggest that many companies are operating well below their ordinary capacity – the level of economic activity remains well below March 2019 levels. US real GDP, consumer spending and capital expenditure shrunk by 4%, 2.5% and 17% at the trough of 2008 recession (Chart I-5). Odds are that these variables will plunge by an even greater magnitude in the coming months as the US reinforces lockdowns and public health safety measures. Chart I-4China Business Cycle Was Much Stronger In Q4 2008 Than Now
China Business Cycle Was Much Stronger In Q4 2008 Than Now
China Business Cycle Was Much Stronger In Q4 2008 Than Now
Chart I-5US Growth At Trough Of 2008 Recession
US Growth At Trough Of 2008 Recession
US Growth At Trough Of 2008 Recession
Chart I-6US Small Caps: Overlay Of 2008 And 2020
US Small Caps: Overlay Of 2008 And 2020
US Small Caps: Overlay Of 2008 And 2020
About 50% of consumer spending in the US is attributed to people over 55 years of age. Provided COVID-19’s fatality rate is high among the elderly, odds are this cohort will not risk going out and spending. How bad will domestic demand in the US be? It is impossible to forecast with any certainty, but our sense is that it will plunge by more than it did in the late 2008-early-2009 period, i.e., by more than 4% (Chart I-5, bottom panel). Interestingly, the crash in US small-cap stocks resembles the one that occurred in the wake of the Lehman bankruptcy (Chart I-6). If US small-cap stocks follow their Q4 2008 - Q1 2009 trajectory, potential declines from current levels will be in the 10%-18% range. Bottom Line: The current halt in economic activity and impending global recession will be worse than the one that took place in late 2008. Reasons Not To Jump Into The Water…Yet Even though EM equities have become cheap and oversold and we are booking profits on our short position in EM stocks, conditions for a sustainable rally do not exist yet: So long as EM corporate US dollar bond yields are rising, EM share prices will remain under selling pressure (Chart I-7). Corporate bond yields are shown inverted in this chart. Chart I-7EM Stocks Fall When EM Corporate Bond Yields Rise
EM Stocks Fall When EM Corporate Bond Yields Rise
EM Stocks Fall When EM Corporate Bond Yields Rise
Chart I-8Chinese And Emerging Asian Corporate Bond Yields Are Spiking
Chinese And Emerging Asian Corporate Bond Yields Are Spiking
Chinese And Emerging Asian Corporate Bond Yields Are Spiking
The selloff in both global and EM credit markets began only a few weeks ago from very overbought levels. Many investors have probably not yet trimmed their positions. Hence, EM sovereign and corporate credit spreads and yields will likely rise further as liquidation in the global and EM credit markets persists. Consistently, bond yields for Chinese offshore corporates as well as emerging Asian high-yield and investment-grade corporates are rising (Chart I-8). EM local currency bond yields have also spiked recently as rapidly depreciating EM currencies have triggered an exodus of foreign investors. Rising local currency bond yields are not conducive for EM share prices (Chart I-9). Chart I-9EM Equities Drop When EM Local Bond Yields Rise
EM Equities Drop When EM Local Bond Yields Rise
EM Equities Drop When EM Local Bond Yields Rise
EM ex-China currencies correlate with commodities prices (Chart I-10). Both industrial commodities and oil prices have broken down and have further downside. The path of least resistance for oil prices is down, given anemic global demand and our expectation that Russia and Saudi Arabia will not reach any oil production cutting agreement for several months (please refer to our discussion on this topic below). Finally, our Risk-On/Safe-Haven currency ratio1 is in free fall and will likely reach its 2015 lows before troughing (Chart I-11). This ratio tightly correlates with EM share prices, and the latter remains vulnerable to further downside as long as this ratio is falling. Chart I-10EM Currencies Move In Tandem With Commodities Prices
EM Currencies Move In Tandem With Commodities Prices
EM Currencies Move In Tandem With Commodities Prices
Chart I-11More Downside In Risk-On/ Safe-Haven Currency Ratio
More Downside In Risk-On/ Safe-Haven Currency Ratio
More Downside In Risk-On/ Safe-Haven Currency Ratio
Bottom Line: Although we are taking profits on the short EM equity position, we continue to recommend short positions in a basket of EM currencies – BRL, CLP, ZAR, IDR, PHP and KRW – versus the US dollar. Liquidation in EM fixed-income markets has been sharp, but the duration has been short –only a few weeks. Large losses will trigger more outflows from EM fixed-income markets. Stay defensive for now. What We Do Know And What We Cannot Know Amid such extreme uncertainty, it is critical for investors to distinguish between what we know and what we cannot know. What we cannot know: With regards to COVID-19: The speed of its spread, the ultimate number of victims it claims and – finally – its impact on consumer and business confidence and psyche. Related to lockdowns: Their duration in key economies. These questions will largely determine this year’s economic growth trajectory: Will it be V-, U-, W-, or L-shaped? Unfortunately, no one knows the answers to the above questions to have any certainty in projecting this year’s global growth. The key factor that gives Russia an advantage over Saudi Arabia in terms of its ability to deal with a negative terms-of-trade shock is not only its better fiscal position but also its ability to depreciate its currency. What we do know: Authorities in all countries will stimulate aggressively so long as financial markets are rioting. Nonetheless, these stimulus measures will not boost growth immediately. With entire countries locked down and plunging consumer and business confidence, stimulus will not have much impact on growth in the near term. In brief, all policy stimulus will boost growth only when worries about the pandemic subside and the economy begins to function again. Both are not imminent. Hence, we are looking at an air pocket with respect to near-term global economic growth. As we argued in our March 11 report titled, Unraveling Of The Policy Put, the pre-coronavirus financial market paradigm – where stocks and credit markets were priced to perfection because of the notion that policymakers would not allow asset prices to drop – has unravelled. In recent weeks, policymakers around the world have announced plans to deploy massive amounts of stimulus, yet the reaction of financial markets has been underwhelming. The reason is two-fold: Both demand shrinkage and production shutdowns have just started, and they will run their due course regardless of announced policy stimulus measures. Equity and credit markets were priced for perfection before this selloff, and investors are in the process of recalibrating risk premiums. Provided the ongoing negative confidence shock and lingering uncertainty persist, odds are that the risk premium will initially overshoot before settling down. Consistently, risk markets will undershoot in the interim. Bottom Line: DM’s domestic demand downturn is still in its initial phase, and there is little foresight in terms of the pandemic’s evolution. These are natural forces, and any stimulus policymakers enact are unlikely to preclude them from occurring. Reflecting the economic contraction and heightened uncertainty, the selloff in risk assets will likely continue for now. Do Not Bet On An Early Resuscitation Of OPEC 2.0 As we argued in our March 11 report, Russia is unlikely to make a deal with Saudi Arabia to restrain oil output in the immediate term. Russia may agree to restart negotiations, but it will not agree to reverse its position for some time. Both nations will be increasing crude output (Chart I-12). As a result, a full-fledged oil market share war is underway. Consistently, crude prices have experienced a structural breakdown (Chart I-13). Chart I-12The Largest Oil Producers Are Ramping Up Output
The Largest Oil Producers Are Ramping Up Output
The Largest Oil Producers Are Ramping Up Output
Chart I-13Structural Breakdown In Oil Prices
Structural Breakdown In Oil Prices
Structural Breakdown In Oil Prices
The key factor that gives Russia an advantage over Saudi Arabia in terms of its ability to deal with a negative terms-of-trade shock is not only its better fiscal position but also its ability to depreciate its currency. Russia has a flexible exchange rate, which will allow the currency to depreciate in order to soften the blow from lower oil prices on the real economy and fiscal accounts. The Russian economy and financial system have learned to operate with recurring major currency depreciations. Saudi Arabia has been running a fixed exchange rate regime since 1986 and cannot use currency depreciation to mitigate the negative terms-of-trade shock on its end. Even though Russia’s fiscal budget break-even oil price is much lower than that of Saudi Arabia’s, it is not the most important variable to consider in this confrontation. The fiscal situation in both Russia and Saudi Arabia will not be a major problem for now. Both governments can issue local currency and US dollar bonds, and there will be sufficient demand for these bonds from foreign and local investors. This is especially true with DM interest rates sitting at the zero-negative territory. Falling oil prices and downward pressure on exchange rates will trigger capital outflows in both countries. Russia has learned to live with persistent capital flight. In the meantime, capital outflows will stress Saudi Arabia’s financial system and, eventually, its real economy. This is in fact the country’s key vulnerability. We will be publishing a Special Report on Saudi Arabia in the coming weeks. Bottom Line: Do not expect a quick recovery in oil prices. Arthur Budaghyan Chief Emerging Markets Strategist arthurb@bcaresearch.com Footnotes 1 Average of CAD, AUD, NZD, BRL, RUB, CLP, MXN & ZAR total return indices relative to average of CHF & JPY total returns. Equities Recommendations Currencies, Credit And Fixed-Income Recommendations