Geopolitics

Highlights So What? The Trump administration’s decision to apply maximum pressure to Iran fundamentally changes the investment landscape in 2019-20. Why? The impact of the Iran sanctions on a stand-alone basis can easily be handled given OPEC 2.0’s current spare capacity. However, not only Iranian and Venezuelan oil but also Iraqi oil could be pulled off the market in a full-fledged conflict. Policy-induced volatility and the oil risk premium will rise. Geopolitical tail risks have gotten fatter and the odds of a recession have also increased. Feature What are the Trump administration’s foreign policy objectives? First, to confront the U.S.’s greatest long-term competitor, China, by demanding economic reforms and greater market access. Second, to force a decision-point upon rogue regimes with significant ballistic missile programs and nuclear-weapon aspirations: North Korea and Iran. Third, to maintain credible deterrence in Russia’s periphery. Fourth, to reassert the Monroe Doctrine through regime change in Venezuela. The common thread, even with Russia, is confrontation. It is not necessary for President Trump to pursue all of these objectives at once. So his decision last November to issue waivers for eight importers of Iranian oil suggested to us that he was prioritizing – and becoming more risk averse ahead of the 2020 election. Full enforcement of the oil sanctions at that time threatened to push oil prices up at the same time as the Fed was raising rates, a pernicious combination late in the cycle (Chart 1). Thus, after walking away from the 2015 nuclear accord with Iran, it made sense for Trump to delay any confrontation with Iran until his hoped-for second term in office. He could focus on building the border wall, resolving trade tensions with China, and making peace with North Korea instead. Chart 1Full Sanctions Enforcement Was Too Risky Last November
Full Sanctions Enforcement Was Too Risky Last November
Full Sanctions Enforcement Was Too Risky Last November
Chart 2Sanctions Will Raise Risk
Sanctions Will Raise Risk
Sanctions Will Raise Risk
This view has now been proved wrong. The oil waivers apparently represented only a temporary delay in the administration’s hawkish Iran policy. Now that financial conditions have eased and growth has stabilized, Trump has declared the Iranian Revolutionary Guard Corps a foreign terrorist organization and announced that he will discontinue the waivers, demanding full compliance on energy sanctions from all states by the end of May. Volatility will move higher (Chart 2). Trump is emboldened by America’s newfound energy independence (Chart 3). While the shale boom can be used to reduce U.S. strategic commitments in the Middle East, it can also encourage Washington to believe it is invulnerable to traditional Middle Eastern risks. Trump’s advisers, Secretary of State Mike Pompeo and National Security Adviser John Bolton, apparently have won the Iran policy debate on this basis. Since Trump’s reelection is far from guaranteed, it would appear his advisers view re-imposing sanctions against Iran as a rare opportunity to achieve long-term strategic objectives. They may not have the chance in 2021. Chart 3The U.S. Is Energy Independent
The U.S. Is Energy Independent
The U.S. Is Energy Independent
Chart 4Trump's Reelection At Risk If Oil Spikes
Trump's Reelection At Risk If Oil Spikes
Trump's Reelection At Risk If Oil Spikes
All the same, the problem for Trump is that, while the U.S. will survive any chaos ensuing from an Iran confrontation, his presidency may not. Full enforcement of the sanctions could spiral out of control and, through the oil price channel, come back to hurt Trump’s economy – and hence his re-election odds (Chart 4). The implication is that Trump has either been misled about the risks of his Iran policy, or he does not care as much about his re-election odds as we believed. Either way, the result is aggressive policy, which increases the geopolitical risk premium in oil prices. We can see this in our simulations (below), which are based entirely on spare capacity and compliance by consumers to the sanctions. We did not include an Iran-retaliation scenario in this modeling. Therefore, any threat to Iraqi supplies, or talks of disrupting the Strait of Hormuz will add to our prices forecasts. U.S. Administration Sailing Close To The Wind From their public comments, it would appear the U.S. administration has convinced itself the global oil market can absorb a disruption from the loss of production in Iran and Venezuela. For the Trump administration, this view is supported by growing U.S. shale-oil supplies, and the administration’s belief the Kingdom of Saudi Arabia (KSA) and its Gulf allies stand ready to increase production to cover any losses arising from the re-imposition of Iranian oil-export sanctions by the U.S. This belief supports the administration’s end-game, which appears to be regime change in Iran, a position long favored by Trump’s national security advisor John Bolton. Frank Fannon, U.S. Assistant Secretary of State for Energy Resources, succinctly captured the administration’s view when he declared, “We are doing this ... in a favorable market condition with full commitment from producing countries.” He further stated, “We think this is the right time.”1 We believe the Trump administration is sailing close to the wind here. The U.S. administration has convinced itself the global oil market can absorb a disruption from the loss of oil production in Iran and Venezuela. While increasing U.S. shale output does provide something of a cushion to global oil markets, it is not a substitute for the heavy-sour crude produced by Iran and Venezuela (and others), which is favored by refiners with complex units. The loss of Iranian exports hits these refiners harder than those able to process lighter, sweeter crude of the sort exported by the U.S. (Chart 5).2 As Iranian and Venezuelan barrels are lost to the market, these heavier crudes are getting more scarce relative to the crude produced in U.S. shales – typically classified as West Texas Intermediate (WTI) crude oil. This can be seen in tighter light-versus-heavy crude oil spreads, and the wider Brent-WTI spreads, which indicate WTI is relatively more plentiful (Charts 6A & 6B).
Chart 5
Chart 6AWTI Relatively More Plentiful…
WTI Relatively More Plentiful...
WTI Relatively More Plentiful...
Chart 6B…As Heavier Crudes Become More Scarce
...As Heavier Crudes Become More Scarce
...As Heavier Crudes Become More Scarce
It is true U.S. production continues to grow, which is causing crude oil inventories to increase as sanctions on Iran are being re-imposed. We expect U.S. shale-oil output to grow 1.2mm b/d this year – taking it to a record 8.4mm b/d on average – and 800k b/d next year. Caution is required regarding inventories, however: U.S. refiners are in the thick of their plant maintenance – known as turn-around season – and have loaded a lot of the maintenance they would normally have done in the Fall into Spring. As a result, U.S. refiners are running at reduced rates preparing for the Northern Hemisphere’s summer driving season and the January 1, 2020, implementation of the U.N. IMO 2020 regulations, which will require shippers to use lower-sulfur fuel to power their vessels worldwide.3 OPEC 2.0 Gains Control Of Brent Forward Curve Growing U.S. production and inventories might give the Trump administration comfort the market can absorb the loss of Iran’s exports – some 1.3mm b/d at present. However, our base case holds that Iran’s exports will stabilize at ~ 600k b/d after sanctions fully kick in. In most of the scenarios we run (Table 1), the impact of Iran sanctions on a stand-alone basis can easily be handled given OPEC 2.0’s current spare capacity (Chart 7).4 Indeed, many of the low-probability scenarios we run – including the “maximum pressure” scenario, in which the Trump administration succeeds in removing all of Iran’s exports – can be accommodated by current supply and spare capacity without sending Brent prices through $100/bbl (Chart 8). OPEC 2.0 holds ~ 1.5mm b/d of what we would describe as readily available spare capacity – mostly in KSA – that can be brought to market fairly quickly, as the ramp-up last year ahead of the first round of sanctions in November amply demonstrated. Another 1.5mm b/d or so is held by the Kingdom and its GCC allies, but it would take longer to bring on line. Table 1BCA Oil Market Scenarios
U.S.-Iran: This Means War?
U.S.-Iran: This Means War?
Chart 7OPEC 2.0 Can Handle Iranian Losses
OPEC 2.0 Can Handle Iranian Losses
OPEC 2.0 Can Handle Iranian Losses
Chart 8Brent Unlikely To Surpass $100
Brent Unlikely To Surpass $100
Brent Unlikely To Surpass $100
In reality, once refiners are up and running at max capacity in the U.S. in a few weeks, U.S. inventories will begin to draw hard. This will support what we believe to be OPEC 2.0’s goal of backwardating the Brent curve – perhaps sharply. This will allow it some breathing space to gradually add barrels to the market in 2H19 as needed, as our balances and forecasts assume. It is important to remember OPEC 2.0 was formed to drain the massive storage overhang that resulted from the 2014-16 market-share war launched by KSA. The Kingdom’s energy minister, Khalid al-Falih, is in no hurry to reverse OPEC 2.0’s strategy now. Throughout the ramp to renewed sanctions, he has steadfastly maintained the Kingdom will provide oil as Aramco’s customers need it, following the blind-side hit KSA took from the Trump administration in November when it granted Iran’s largest customers waivers on its export sanctions. U.S. Pressure On OPEC To Raise Output Will Grow We expect the Trump administration to continue to pressure OPEC – the old cartel, not OPEC 2.0 – to boost production post-sanctions. However, it is not entirely clear that this time OPEC’s – particularly KSA’s – interests are 100% aligned with President Trump’s. KSA and other producers were shocked by the administration’s decision to grant waivers after lifting supply sharply in response to Trump’s demands. This time around, we believe OPEC – KSA in particular – will be more cautious lifting output, even as the U.S. Navy very publicly displays its ability to project and sustain force in the Mediterranean and Persian Gulf regions (Map 1). With good reason: The U.S. holds ~ 650mm barrels of oil in its Strategic Petroleum Reserve (SPR), which can be released at a rate of 1mm to 1.3mm b/d for a year or so. Realistically, it is probably more like six to nine months, since, by the time much of the oil has been released to the market the reserves that are left likely will have higher concentrations of contaminants (e.g., metals and solids that migrated to the bottom of the storage while it was sitting idle), making buyers way more leery of using it.
Chart
After the shock of the waivers, KSA likely will minimize its exposure to another surprise from the U.S. as sanctions take hold. The risk to OPEC – KSA in particular – is that Trump again will pull a fast one as the U.S. general election approaches. Given Trump’s demonstrated sensitivity to U.S. gasoline prices approaching elections, it is not unlikely that he would hold on to the SPR barrels until mid to late summer 2020, then release them in time to reduce prices further. If, in the run-up to U.S. elections, OPEC has steadily increased production to build precautionary inventories then it runs a non-trivial risk the crude oil price would once again crash as SPR barrels are released. The Kingdom of Saudi Arabia’s energy minister, Khalid al-Falih, is in no hurry to reverse OPEC 2.0’s strategy now. In this iteration of Iranian export sanctions, we expect KSA to adopt a just-in-time inventory management strategy, so that it is not caught out once again over-supplying the market ahead of a U.S. surprise. U.S. Shales Will Figure Into OPEC 2.0’s Calculus Chart 9U.S. Export Capacity Is Constrained
U.S. Export Capacity Is Constrained
U.S. Export Capacity Is Constrained
The other big fundamental OPEC 2.0 will be considering is the rate at which U.S. shale oil can be exported. Export capacity still is constrained by the shortage of deep-water harbor facilities in the U.S. Gulf. This is being addressed, but it has been slowed by additional requests for environmental impact statements from the federal and state governments. If prices start moving higher because KSA and OPEC 2.0 are responding to tightening markets with caution (and slowly), we’d likely see WTI production increase – it’ll have 2mm b/d of new pipe in the Permian to fill by end-2019 – but that crude could start backing up as storage in the U.S. Gulf fills. This would again widen the Brent vs. WTI - Houston spread, which will benefit refiners in the U.S. Gulf, but will lower prices received by U.S. shale producers (again) (Chart 9). Bottom Line: Trump’s decision not to extend the Iranian oil waivers suggests that he has plenty of risk appetite ahead of the 2020 election. His Iran policy is now the biggest geopolitical risk to the late-cycle bull market. It also risks tightening the oil market considerably as the election approaches. Can Iran’s Regime Withstand The Sanctions? Iran’s economic weakness was an added inducement for the Trump administration to take an aggressive turn. The sanctions against Iran’s crude oil exports have not yet been implemented in full force, but the economy is already showing signs of distress. For one, inflation is back near 40% – levels only reached during the previous round of sanctions (Chart 10). Given that food, beverages, and transportation are among the sectors experiencing the fastest growing prices, lower income groups – which the World Bank estimates spend almost half their income on food alone – will suffer disproportionately. Economic dissatisfaction has catalyzed protests in Iran in the past, and the squeeze from the U.S. sanctions could propel further unrest. Chart 10Iran's Economy Already Showing Signs Of Distress
Iran's Economy Already Showing Signs Of Distress
Iran's Economy Already Showing Signs Of Distress
Chart 11
Moreover, soaring prices are coinciding with a slowdown in activity and consumption. On the surface Iran appears relatively well protected given that its economy is not as directly correlated with oil exports as some of its peers (Chart 11). However, Iran’s oil and non-oil sectors are actually closely intertwined. This is evident from weakness in the non-oil sector during the previous round of sanctions (Chart 12). The IMF expects the economy to contract by 6% this year – faster than its 3.9% estimate for last year – leaving Iranians to face a period of deepening stagflation.
Chart 12
The jump in consumer prices is a reflection of the ongoing collapse of the currency. Despite the government’s best efforts to stabilize the foreign exchange market, heightened demand for foreign currencies caused a nearly 30% depreciation in the unofficial exchange rate vis-à-vis the U.S. dollar since the beginning of the year (Chart 13). Chart 13Unofficial Exchange Rate Continues To Weaken
Unofficial Exchange Rate Continues To Weaken
Unofficial Exchange Rate Continues To Weaken
Chart 14Debt Burden Is Manageable
Debt Burden Is Manageable
Debt Burden Is Manageable
To soften the impact of the weaker currency and the potential shortage of essential goods, authorities have introduced a three-tier exchange rate system, and banned the export of several products including grains and seeds, powdered milk, butter, and tea. Since the level of external debt remains manageable (Chart 14) the weak currency will pressure the economy through its impact on prices (highlighted above), with imported inflation eroding purchasing power. Furthermore, Iran will not benefit from any additional export competitiveness due to currency depreciation. The current account surplus is expected to deteriorate and eventually flip to a deficit amidst weak exports, and despite declining imports (Chart 15). The fact that Iran runs a non-energy trade deficit does not help. Chart 15Trade Surplus At Risk
Trade Surplus At Risk
Trade Surplus At Risk
Chart 16Rising Budget Deficit Is A Constraint
Rising Budget Deficit Is A Constraint
Rising Budget Deficit Is A Constraint
In terms of the fiscal purse, under normal circumstances, a weaker rial would raise government revenue from oil exports. However, given the restrictions on oil exports, the fiscal budget will not benefit from this relationship. Instead, the dominant impact will be greater government spending. Historically, expenditures tend to be countercyclical, aiming to mitigate the impact of the deteriorating economic environment on Iranian households (Chart 16). In the past, the Iranian government’s healthy fiscal balance allowed policymakers to implement social protection schemes to combat poverty and revitalize the economy. Now, however, the fiscal coffers are no longer so well-cushioned and the deficit will constrain this option. Stimulative fiscal policy in this environment would only raise inflation further. Furthermore, given that the lion’s share of Iran’s imports are capital and intermediate goods, the currency depreciation will spill over into the domestic industry and weaken demand, even for domestically produced goods. Investments have been lacking in many of the most essential services. The electricity sector is a prime example: while demand is rising, spare capacity is dwindling and causing recurring outages. Similarly, foreign direct investment will likely fall in this uncertain political environment. With the economy on the brink, Iran is not in a position to confront the United States directly. It must take total sanctions enforcement as a very grave risk and seek delaying actions and negotiations. However, this vulnerability will turn into desperation if the Trump administration proceeds with a full embargo without any “off ramp” for negotiations. Bottom Line: Full enforcement of sanctions threatens to destabilize Iran’s already vulnerable economy. Inflation is soaring, the currency is plunging, and the economy will likely be plagued by a twin deficit going forward. The implication is that Iran will eschew direct confrontation unless forced. Will Iran Retaliate In Iraq? Iran is also at risk of losing one of its great sources of leverage: Iraqi stability. Given its gloomy economic outlook, Iran is looking to expand ties with its neighbors in an attempt to soften the blow from the sanctions. Earlier this year president Hassan Rouhani and Iraqi prime minister Adel Abdul Mahdi signed several preliminary trade deals, with the ultimate aim to boost bilateral trade to $20 billion from its current ~$12 billion. However, natural gas exports to Iraq – a major traded good – are covered by the sanctions, so this target is probably unattainable. Although Iran is currently the only foreign supplier of natural gas and electricity to Iraq, the temporary halt in electricity supplies last summer coincided with violent protests in Southern Iraq.5 Growing anger over Iran’s inability to satisfy its commitments to Iraq highlights the tensions in the Iraq-Iran relationship. What’s more, the U.S. is pressuring Iraq to turn to other neighbors such as Saudi Arabia, Jordan, and Kuwait for its electricity needs.6 In March, it renewed a three-month waiver allowing Iraq to import Iranian gas. Then Saudi Arabia promised to connect Iraq to the Saudi electricity grid during a visit by its economic delegation to Baghdad on April 4.7 At that meeting, the Saudi delegation also agreed to provide Iraq with $1 billion in loans, $500 million to boost exports, and a sporting complex as a gift. Additionally, the Saudi consulate in Baghdad – which had been closed for almost 3 decades – reopened last month. Saudi Arabia and Iraq are starting to cooperate. Iraq’s new government is clearly taking a pragmatic approach to its regional relationships. This is also largely in line with growing domestic opposition to Iranian interference within Iraq. Influential Shia leaders such as Muqtada al-Sadr and Ayatollah Ali al-Sistani have been voicing concerns about Iran’s influence in Iraqi politics. As such, the new Iraqi government is attempting to walk a tight rope between placating Iran and taking advantage of new opportunities with its Arab neighbors to rebuild its economy. This trend raises the risk that Iran will strike rapidly in Iraq if it believes Trump’s maximum pressure strategy is succeeding in bringing oil exports to zero. Iraq is the logical target as Iran has great political and sectarian influence there, it is the geographic buffer with Saudi Arabia, and it is the necessary launchpad for Iran’s strategic opponents to undermine or attack the Iranian regime (Map 2).
Chart
Thus, not only Iranian and Venezuelan oil but also Iraqi oil could be pulled off the market in a fullfledged conflict.
Chart 17
Thus, not only Iranian and Venezuelan oil but also Iraqi oil could be pulled off the market in a full-fledged conflict. About 85% of Iraq’s crude exports flow through the southern port city of Basra (Chart 17). It is already home to recurrent protests and any disruptions there threaten around 3.5mm bbl shipping to international markets daily. Bottom Line: Iraq is caught in the strategic tug-of-war between Iran and Saudi Arabia, with the latter gaining influence at present. Sanctions could compel Iran to retaliate in Iraq, jeopardizing up to 3.5mm b/d of supply. What Comes Next? The latest data suggest that Japan is in full compliance with the U.S. sanctions against Iran as of April and that China has been front-running the sanctions and is now reducing imports, as it was at the time the waivers were first introduced. China may not go to zero, but it is apparently complying. This is important given that the Trump administration has essentially introduced a bold new demand – cut off all energy imports from Iran – at the eleventh hour of the U.S.-China trade negotiations. Our projections of spare capacity suggest that the Trump administration will believe it has room to enforce the sanctions fully (Chart 18). This is a risky approach, as a fairly standard unplanned outage anywhere else in the world could bring spare capacity much lower, but the data suggest that Trump’s team will not see it as a hard constraint. If necessary, the administration can later choose to soft-pedal enforcement on black market activity so as to calibrate the global impact.
Chart 18
The Iranians, for their part, are unlikely to leap to the most aggressive forms of retaliation immediately – such as fomenting unrest in Iraq – because of their economic vulnerability. Small acts of sabotage or subversion are a way to send the U.S. a warning signal, but generally Iran will want to signal defiance while shifting the emphasis to negotiations. Hence it will primarily retaliate through diplomatic actions and calculated displays of force. A limited response enables Iran to appear innocent, divide the U.S. and EU, and thus isolate the U.S. over its belligerent policies. Previously, Trump has sought to negotiate with Iranian President Hassan Rouhani. The Iranians have so far rebuffed him, but Foreign Minister Mohammad Zarif’s initial response to the waiver announcement was to blame Trump’s advisers, instead of Trump himself, and offer an exchange of prisoners (And release of detained Americans happen to be one of the Trump administration’s key demands – see Table 2.) Negotiations could begin through back channels and an uneasy period of tensions could thus ensue without a full-blown war. Table 2Trump Administration’s 12 Demands On Iran
U.S.-Iran: This Means War?
U.S.-Iran: This Means War?
The problem is that negotiations cannot work if Trump fully and immediately enforces the sanctions without offering Iran an “off ramp.” If the administration backs Iran into a corner it will have no option but to strike out forcefully. Negotiations also cannot work if Iran joins the U.S. in withdrawing from the 2015 deal and reactivating its nuclear program, specifically the suspected military dimensions of that program. This would force Trump to respond (Diagram 1). Diagram 1Iran-U.S. Tensions Decision Tree
U.S.-Iran: This Means War?
U.S.-Iran: This Means War?
In short, a period of “fire and fury” is about to ensue between Trump and Rouhani. It will be even more uncertain and disruptive than the summer 2017 showdown between Trump and Kim Jong Un of North Korea (Chart 19), which drove a 35 bps decline in the 10-year Treasury yield. Chart 19Upcoming "Fire And Fury" Will Be More Disruptive Than 2017 Trump-Kim Showdown
Upcoming "Fire And Fury" Will Be More Disruptive Than 2017 Trump-Jong Un Showdown
Upcoming "Fire And Fury" Will Be More Disruptive Than 2017 Trump-Jong Un Showdown
There is a pathway for Trump’s pressure tactics to succeed: Iran is vulnerable and the United States and its allies are in a position of relative strength in terms of global oil supply. Therefore, it is possible that Trump could fully enforce the sanctions and yet avoid any uncontrollable crisis or oil shock. However, this pathway, at a subjective 26% probability, is less likely than the combined 48% probability of the alternatives: either escalation short of war, or ultimatums leading to Middle Eastern instability and much higher odds of war. Bottom Line: The geopolitical risk of U.S.-Iran confrontation is not contained. But we do not expect Iran to overreact unless Trump plows forward with full and immediate sanctions enforcement and offers no realistic “off ramp” for negotiations. At that point Iranian retaliation will be concrete and escalation could spiral out of control. Investors should keep in mind that Iran is not North Korea. Unlike the hermit kingdom, Iran has the ability to retaliate with a number of different levers. Indeed, it has threatened to shut the Strait of Hormuz in the past, and could, at the limit, be backed into that corner. While the risk of this is extremely low, should it occur the consequences would be huge – close to 20% of the world’s daily oil supply passes through the Strait daily. Indeed, just this week Iran’s Oil Minister Bijan Zanganeh again threatened to take action against any OPEC member working against its interests. Following a meeting with the Cartel’s president, he is reported to have said, “Iran is a member of OPEC because of its interests, and if other members of OPEC seek to threaten Iran or endanger its interests, Iran will not remain silent.”8 Investment Conclusions The Trump administration’s decision to apply maximum pressure to Iran is a significant and unexpected injection of geopolitical risk that we believe fundamentally changes the investment landscape in 2019-20. While our base case is that the U.S. will enforce the oil sanctions gradually and in such a way as to avoid causing an oil shock, policy-induced volatility and the oil risk premium will rise. Geopolitical tail risks have gotten fatter and the odds of a recession have also increased. Robert P. Ryan, Chief Commodity & Energy Strategist rryan@bcaresearch.com Matt Gertken, Geopolitical Strategist mattg@bcaresearch.com Roukaya Ibrahim, Editor/Strategist roukayai@bcaresearch.com Footnotes 1 Please see Humeyra Pamuk and Timothy Gardner, “How Trump’s hawkish advisors won debate on Iran oil sanctions,” Reuters, May 1, 2019, available at reuters.com. 2 Heavy-sour crudes are those with low API gravity (a measure of how easily a crude flows) and higher sulfur content. Light-sweet crudes have higher API gravity and lower sulfur content. 3 Please see BCA Commodity & Energy Strategy Weekly Report, “IMO 2020: The Greening Of The Ship-Fuel Market,” February 28, 2019, available at ces.bcaresearch.com. 4 OPEC 2.0 is the name we coined for the producer coalition led by KSA and Russia, which was formed in 2016 to manage global crude oil output. Its goal is to drain the massive storage overhang caused by the market-share war launched by KSA in 2014. 5 Iran cited dissatisfaction with Iraq over the accumulation of unpaid bills as the cause of the halt in electricity exports to Iraq. This prompted Iraqi authorities – under pressure from domestic unrest – to send a delegation to Saudi Arabia in attempt to negotiate an electricity agreement. 6 Please see Edward Wong, “Trump Pushes Iraq to Stop Buying Energy From Iran,” The New York Times, February 11, 2019, available at nytimes.com. 7 Please see Geneive Abdo and Firas Maksad, “Iraq’s Place in the Saudi Arabian-Iranian Rivalry,” The National Interest, April 15, 2019, available at nationalinterest.org. 8 Please see Babk Dehghanpisheh, “Iran will respond if OPEC members threaten its interests: oil minister,” Reuters, May 2, 2019, available at reuters.com. Investment Views and Themes Recommendations Strategic Recommendations Tactical Trades TRADE RECOMMENDATION PERFORMANCE IN 2019 Q1
Image
Commodity Prices and Plays Reference Table Trades Closed in 2019 Summary of Closed Trades
Image
Investor surveys show that the majority of investors’ top concerns are political or geopolitical in nature. Yet there is limited research devoted to quantifying these risks. The most prominent techniques involve tallying word counts of key terms that appear…
Highlights So what? Quantifying geopolitical risk just got easier. Why? In this report we introduce 10 proprietary, market-based indicators of country-level political and geopolitical risk. Featured countries include France, U.K., Germany, Italy, Spain, Russia, South Korea, Taiwan, Turkey, and Brazil. Other countries, and refinements to these beta-version indicators, will come in due time. We remain committed to qualitative, constraint-based analysis. Our GeoRisk Indicators will help us determine how the market is pricing key risks, so we can decide whether they are understated or overstated. Feature For the past three months we have been tracking a “Witches’ Brew” of political risks that threaten the late-cycle bull market. Some of these risks have abated for the time being: the Fed is on pause, China’s stimulus has surprised to the upside, and Brexit has been delayed. Other risks we have flagged, however, are heating up: Iran And Oil Market Volatility: Surprisingly the Trump administration has chosen not to extend oil sanction waivers on Iran from May 2, putting 1.3 million barrels per day of oil on schedule to be removed from international markets by an unspecified time. It remains to be seen how rapidly and resolutely the administration will enforce the sanctions on specific allies and partners (Japan, India, Turkey) as well as rivals (China, others). Because the decision coincides with rising production risks from renewed fighting in Libya and regime failure in Venezuela, we expect President Trump to phase in the new enforcement over a period of months, particularly on China and India. But official rhetoric is draconian. Hence the potential for full and immediate enforcement is greater than we thought. In the short term, individual political leaders, and very powerful nations like the United States, can ignore material economic and political constraints. Since the Trump administration’s decision exemplifies this point, geopolitical tail risks will get fatter this year and next. Global oil price volatility and equity market volatility will increase with sanction enforcement actions and retaliation. We would think that Trump’s odds of reelection will marginally suffer, though for now still above 50%, as any full-fledged confrontation with Iran will raise the chances of an oil price-induced recession. U.S.-EU Trade War: Neither the Trump administration nor the U.S. has a compelling interest in imposing Section 232 tariffs on imports of autos and auto parts. Nevertheless the risk of some tariffs remains high – we put it at 35% – because President Trump is legally unconstrained. The decision is technically due by May 18 but Economic Council Director Larry Kudlow has said Trump may adjust the deadline and decide later. Later would make sense given the economic and financial risks of the administration’s decision to ramp up the pressure on Iran.1 But the risk that tariffs will pile onto a weak German and European economy will hang over investors’ heads. U.S.-China Talks Not A Game Changer: The ostensible demand that China cease Iranian oil imports immediately and the stalling of U.S. diplomacy with North Korea are not conducive to concluding a trade deal in May. We have highlighted many times that strategic tensions will persist even if Beijing and Washington quarantine these issues to agree to a short-term trade truce. The June 28-29 G20 meeting in Japan remains the likeliest date for a summit between Presidents Trump and Xi Jinping, but even this timeframe could be too optimistic. Continued uncertainty or a weak deal will fail to satisfy financial markets expecting a very positive outcome. With a 70% chance that U.S. tariffs on China will not increase this year and, contingent on a U.S.-China deal, only a 35% chance that the U.S. slaps tariffs on German cars, we sound optimistic to some clients. But the Trump administration’s decision on Iran is highly market-relevant and portends greater volatility. We expect to see a geopolitical risk premium creep higher into oil markets as well as a greater risk of “Black Swan” events in strategically critical or oil-producing parts of the Middle East. There is limited research devoted to quantifying geopolitical risk. We are late in the business cycle and President Trump has emphatically decided to increase rather than decrease geopolitical risk. Quantifying Geopolitical Risk Geopolitical analysis has taken a bigger role in investors’ decision-making over the last decade. Surveys show that geopolitical risks rank among global investors’ top concerns overall. In the oft-cited Bank of America Merrill Lynch survey, geopolitical and related issues have dominated the “top tail risk” responses for the past half-decade (Chart 1). In other surveys, the most worrisome short-term risks are mostly political or geopolitical in nature, ranking above socio-economic and environmental risks (Chart 2).
Chart 1
Chart 2
Despite this high level of concern, there is limited research devoted to quantifying geopolitical risk. Isolating and measuring the range of risks under this umbrella term remains a challenge. As such, for many investors, geopolitics remains an ad hoc, exogenous factor that is often mentioned but rarely incorporated into portfolio construction. For the past four decades the predominant ways of measuring political or geopolitical risk have been qualitative or semi-qualitative. The Delphi technique, developed on the basis of low-quality data sets in social sciences, relies on pooled expert opinions.2 Independently selected experts are asked to provide risk assessments and their responses are then interpreted by analysts to create a measure of risk. Another semi-qualitative method of measuring geopolitical risk ranks countries according to a set of political and socio-economic variables. These variables – such as governance, political and social stability, corruption, law and order, or formal and informal policies – are extremely important but inherently difficult to quantify.3 These results are useful but suffer from dependency on expert opinion, data quality, and institutional biases. More importantly, these methods are slow to react to breaking events in a rapidly changing world. The same goes for bottom-up assessments using political intelligence. The weakness of these methods is that it is highly unlikely that they will produce statistically significant estimates of risk. The odds of getting a “silver bullet” insight from a “key insider” are decent for simple political systems, but not in the complex jurisdictions that host the vast majority of global, liquid investments. Quantitative approaches to measuring geopolitical risk have since become more widespread. The most prominent method is based on quantifying the occurrence of words related to political and geopolitical tensions that appear in international newspapers. These word-counts typically include terms like “terrorism,” “crisis,” “war,” “military action,” etc. As a result, the indices reflect incidents of physical violence or other “Black Swan” events that may not have direct relevance to financial markets. Moreover, while news-based indices accurately capture dramatic one-time peaks at the time of a crisis, they are largely flat aside from these, as they rely on popular topics rather than underlying structural trends (Chart 3). They fail to capture geopolitical developments associated with electoral cycles, protest movements, paradigm shifts in economic policy, or other policy changes.4 Notice, for instance, that the fall of the Soviet Union in late 1991 and the resulting chaos in Russia and many other parts of the emerging world hardly register in Chart 3. Chart 3News-Based Indices Only Capture Crisis Peaks, Not Geopolitical Developments
News-Based Indices Only Capture Crisis Peaks, Not Geopolitical Developments
News-Based Indices Only Capture Crisis Peaks, Not Geopolitical Developments
Introducing BCA’s GeoRisk Indicators The past 70 years have taught BCA Research to listen and respect the market. Why would we suddenly follow the media instead? Most quantitative geopolitical indicators begin with the premise that journalists and the news-reading public have accurately emphasized the most relevant risks and uncertainties. They proceed to quantify the terms of these assessments with increasingly sophisticated methods. This approach solves only part of the puzzle. News-based indices ... fail to capture geopolitical developments associated with underlying policy changes. At BCA Geopolitical Strategy, we aim to generate geopolitical alpha.5 This means identifying where financial media and markets overstate or understate geopolitical risks. We do not primarily aim to predict events or crises. As such, traditional news-based indicators that capture only major events, even those ex post facto, are of little relevance to our analysis. What is needed is a better way to quantify how the market is calculating risks. We start with a simple premise: the market is the greatest machine ever created for gauging the wisdom of the crowd. Furthermore, it puts its money where its predictions are, unlike other methods of geopolitical risk quantification which have no “value at risk.” Chart 4USD/RUB Captures Geopolitical Risk In Russia...
USD/RUB Captures Geopolitical Risk In Russia...
USD/RUB Captures Geopolitical Risk In Russia...
To this end, we have introduced market-based indicators over the years that rely on currency movements, which are often the simplest and most immediate means of capturing the process of pricing risk. In 2015, for instance, we introduced an indicator that measures Russia’s geopolitical risk premium (Chart 4). It is constructed using the de-trended residual from a regression of USD/RUB against USD/NOK and Russian CPI relative to U.S. CPI. We can show empirically that it captures geopolitical risk priced into the ruble, as the indicator increases following critical incidents. These include the downing of Malaysian Airlines Flight 17 over eastern Ukraine in 2014; the warnings that Russia aimed to stage a “spring offensive” in Ukraine in 2015; Russian military intervention in the Syrian Civil War later that year; and the poisoning of former intelligence agent Sergei Skripal in the U.K. in 2018 and subsequent tensions. Using similar methods, we created a proxy to capture geopolitical risk in Taiwan, based on USD/JPY and USD/KRW exchange rates and relative Taiwanese/American inflation (Chart 5). The indicator tracks well with previous cross-strait crises. It jumped upon Taiwan’s election of President Tsai Ing-wen and her pro-independence government in January 2016 – and this was well before any tensions actually flared. It even registered a small increase upon her controversial phone call congratulating Donald Trump upon winning the U.S. election. Chart 5...And USD/TWD Captures Geopolitical Risk In Taiwan
...And USD/TWD Captures Geopolitical Risk In Taiwan
...And USD/TWD Captures Geopolitical Risk In Taiwan
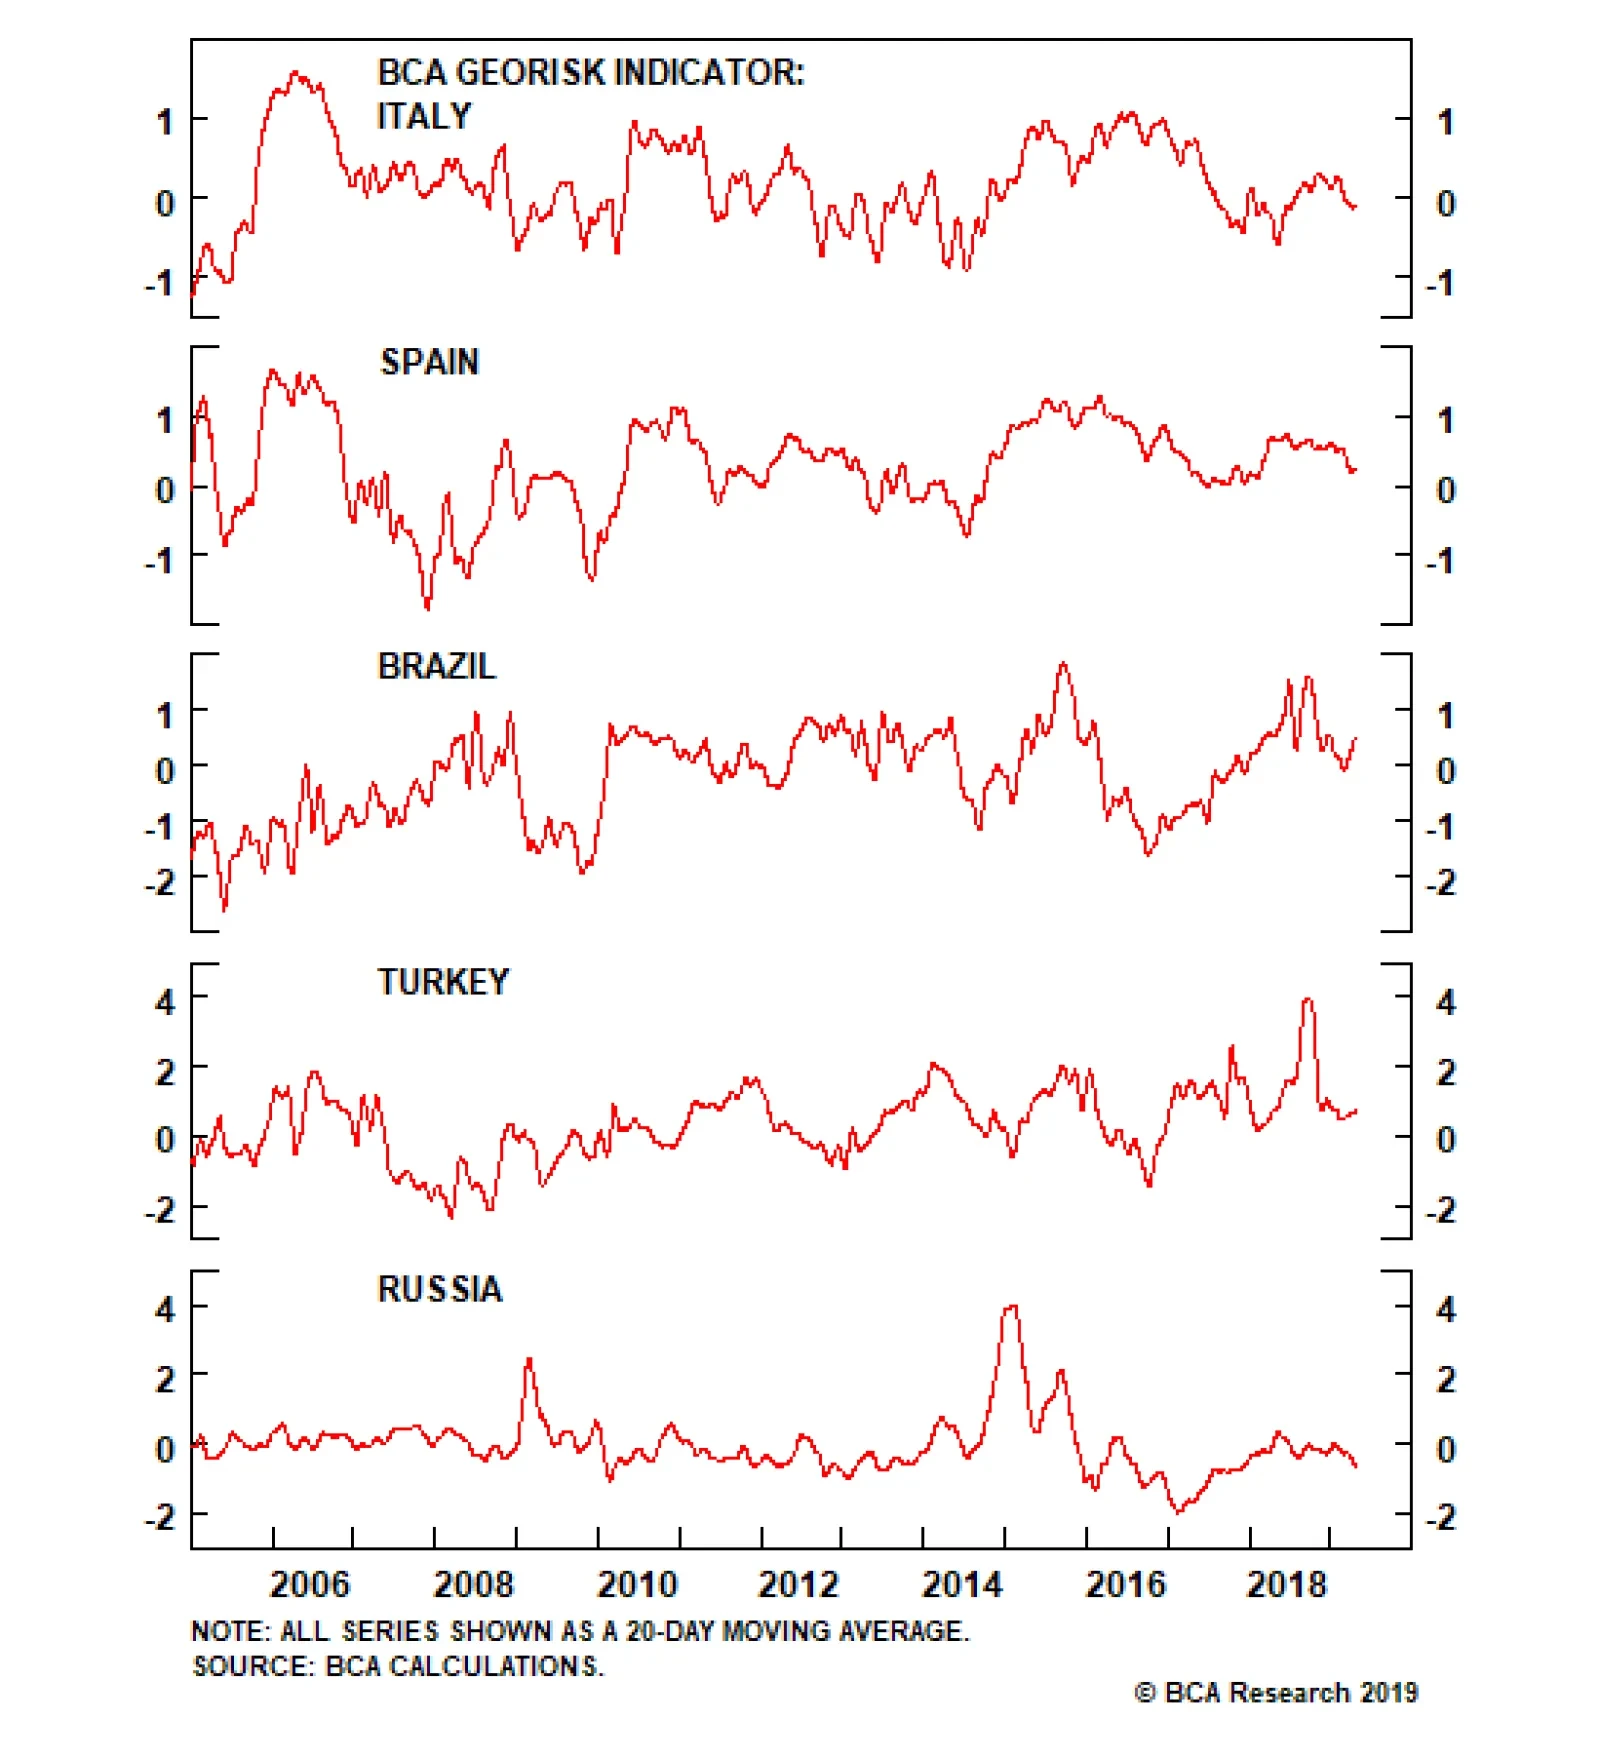
This year we have expanded on this work, constructing a set of ten standardized GeoRisk Indicators for five developed economies and five emerging economies: U.K., France, Germany, Spain, Italy, Russia, Turkey, Brazil, Korea, and Taiwan. Indicators for the U.S., China, and others will be rolled out in a future report. These indicators attempt to capture risk premiums priced into the various currencies – except for Euro Area countries, where the risk is embedded in equity prices. In each case, we look at whether the relevant assets are decreasing in value at a faster rate than implied by key explanatory variables. The explanatory variables consist of (1) an asset that moves together with the dependent variable while not responding to domestic geopolitical risks, and (2) a variable to capture the state of the economy. This set of indicators differs from our earlier indicators in the following ways: We aim to create a simple methodology that we can apply consistently to all countries, both in the DM and EM universes. We therefore omitted using regression models that can prove to be quite whimsical. Instead, we simply looked at the deviation of the dependent variable from the explanatory variables, all in expanding standardized terms, to create the GeoRisk proxy. We wanted an indicator that would immediately respond to priced-in risks, so we opted for a daily frequency rather than the weekly frequency we used in our initial work. To get as accurate of a signal as possible, we use point-in-time data. Since economic data tends to be released with a one-to-two-month lag, we lagged the economic independent variable to correspond to its release date. All ten indicators are shown in the Appendix. Across all countries, they track well with both short-term events and long-term trends in geopolitical risk. In the case of France, for example, the indicator steadily climbs during the period of domestic tensions and protests in the early 2000s; as the European debt crisis flares up; again during the rise of the anti-establishment Front National and the Russian military intervention in Ukraine; and finally during the U.S. trade tariffs and Yellow Vest protests (Chart 6). Our GeoRisk indicators isolate risks that either originate internally or otherwise affect the country more so than others. Similarly, in Germany, there is a general increase in perceived risk as Chancellor Gerhard Schröder implements structural reforms in the early 2000s; another increase leading up to the leadership change as Angela Merkel is elected Chancellor; another during the global and European financial crises; another during the Ukraine invasion and refugee influx; and finally another with the U.S.-China trade war (Chart 7). Chart 6Our French Indicator Picks Up Domestic And European Unrest
Our French Indicator Picks Up Domestic And European Unrest
Our French Indicator Picks Up Domestic And European Unrest
Chart 7Greater German Risk Amid The Trade War
Greater German Risk Amid The Trade War
Greater German Risk Amid The Trade War
We have annotated each country’s GeoRisk indicator heavily in the appendix so that readers can see for themselves the correspondence with political events. The indicators are affected by international developments – like the Great Recession – but we have done our best to isolate risks that either originate internally or otherwise affect the country more than other countries. (As a consequence, the Great Recession is muted in some cases.) What are the indicators telling us now? Most obviously, they highlight the extreme risk we have witnessed in the U.K. over the now-delayed March 29 Brexit deadline. We would bet against this risk as the political reality has demonstrated that a “hard Brexit” is very low probability: the U.K. has the ability to back off unilaterally while the EU is willing to extend for the sake of regional stability. In this sense the pound is a tactical buy, which our foreign exchange strategist Chester Ntonifor has highlighted.6 Our U.K. risk indicator has been fairly well correlated with the GBP/USD since the global financial crisis and it suggests that the pound has more room to rally (Chart 8). Chart 8Betting Against A Hard Brexit, the GBP Is A Tactical Buy
Betting Against A Hard Brexit, the GBP Is A Tactical Buy
Betting Against A Hard Brexit, the GBP Is A Tactical Buy
Meanwhile, Spanish risks are overstated while Italy’s are understated. As for the emerging world, Turkish risks should be expected to spike yet again, as divisions emerge within the ruling coalition in the wake of critical losses in local elections and a failure to reassure investors over monetary policy and the currency. Brazilian risks will probably not match the crisis points of the impeachment and the 2018 election, at least not until controversial pension reforms reach a period of peak uncertainty over legislative passage. Both our new Russian indicator and its prototype are collapsing (see Chart 4 above). This captures the fact that we stand at a critical juncture in Russian affairs, where President Putin is attempting to shift focus to domestic stability even as the U.S. and the West maintain pressure on the economy to deter Russia from its aggressive foreign policy. Given that both Putin’s and the government’s approval ratings are low amid rising oil prices, the stage is set for Russia to take a provocative foreign policy action meant to distract the populace from its poor living conditions. Venezuela is the obvious candidate, but there are others. Moscow will want to test Ukraine’s newly elected, inexperienced president; it may also make a show of support for Iran. With Russia equities having rallied on a relative basis over the past year and a half, and with the Iranian waiver decision already boosting oil prices as we go to press, the window of opportunity to buy Russian stocks is starting to close. (We remain overweight relative to EM on a tactical horizon; our Emerging Markets Strategy is also overweight.) Going forward, we will update these risk indicators regularly as needed and publish the full appendix at the end of every month along with our long-running Geopolitical Calendar. We will also fine-tune the indicators as new information comes to light. In other words, here we present only the beta version. We hope that these indicators will help inform investors as to the direction, and even magnitude, of political risks as the market prices them. Our GeoRisk indicators are not predictive, as establishing a trend is not a prediction. The main purpose of this exercise is to answer the critical question, “What is already priced in?” How is the market currently calculating geopolitical risk for a country? After that, it is the geopolitical strategist’s job to unpack this question through qualitative, constraint-based analysis. It is when our qualitative assessments disagree with what is priced in that we can generate geopolitical alpha. Ekaterina Shtrevensky, Research Analyst ekaterinas@bcaresearch.com Matt Gertken, Vice President Geopolitical Strategist mattg@bcaresearch.com Marko Papic Consulting Editor marko@bcaresearch.com Footnotes 1 See Sean Higgins, “Auto tariffs decision could be delayed, Kudlow says,” Washington Examiner, April 3, 2019, www.washingtonexaminer.com. 2 Norman C. Dalkey and Olaf Helmer-Hirschberg, “An Experimental Application of the Delphi Method to the Use of Experts,” Management Science, Vol. 9, Issue: 3 (April 1963) pp. 458- 467. 3 Darryl S. L. Jarvis, “Conceptualizing, Analyzing and Measuring Political Risk: The Evolution of Theory and Method,” Lee Kuan Yew School of Public Policy Research Paper No. LKYSPP08-004 (July 2008). William D. Coplin and Michael K. O'Leary, "Political Forecast For International Business," Planning Review, Vol. 11 Issue: 3 (1983) pp.14-23. The PRS Group, “Political Risk Services”™ (PRS) or the “Coplin-O’Leary Country Risk Rating System”™ Methodology. Daniel Kaufmann, Aart Kraay, and Massimo Mastruzzi, “The Worldwide Governance Indicators: Methodology and Analytical Issues,” World Bank Policy Research Working Paper No. 5430 (September 2010). 4 Scott R. Baker, Nicholas Bloom, and Steven J. Davis, “Measuring Economic Policy Uncertainty,” The Quarterly Journal of Economics, Volume 131, Issue 4, November 2016 (July 2016) pp.1593–1636. Dario Caldara and Matteo Iacoviello, “Measuring Geopolitical Risk,” Board of Governors of the Federal Reserve Board, Working Paper (January 2018). 5 Please see BCA Research Geopolitical Strategy Special Report, “Five Myths On Geopolitical Forecasting,” dated July 9, 2018, available at gps.bcaresearch.com. 6 Please see BCA Foreign Exchange Strategy Weekly Report, “Not Out Of The Woods Yet,” April 5, 2019, available at www.bcaresearch.com. Appendix Appendix France
France: GeoRisk Indicator
France: GeoRisk Indicator
Appendix U.K.
U.K.: GeoRisk Indicator
U.K.: GeoRisk Indicator
Appendix Germany
Germany: GeoRisk Indicator
Germany: GeoRisk Indicator
Appendix Italy
Italy: GeoRisk Indicator
Italy: GeoRisk Indicator
Appendix Spain
Spain: GeoRisk Indicator
Spain: GeoRisk Indicator
Appendix Russia
Russia: GeoRisk Indicator
Russia: GeoRisk Indicator
Appendix Korea
Korea: GeoRisk Indicator
Korea: GeoRisk Indicator
Appendix Taiwan
Taiwan: GeoRisk Indicator
Taiwan: GeoRisk Indicator
Appendix Turkey
Turkey: GeoRisk Indicator
Turkey: GeoRisk Indicator
Appendix Brazil
Brazil: GeoRisk Indicator
Brazil: GeoRisk Indicator
What’s On The Geopolitical Radar?
Chart 19
Geopolitical Calendar
Highlights So what? Egyptian assets will benefit from improving fundamentals. Why? March credit data confirm China’s stimulus, supporting the commodity/EM complex. Oil price risks are also to the upside. In Egypt, investors will welcome constitutional changes that reinforce the regime and overall stability. Egypt is beginning to reap the rewards of painful IMF reforms enacted in late 2016. A large, under-invested labor market is a key structural risk that will weigh on Egypt’s long-term investment potential. We recommend an overweight stance in Egyptian sovereign (USD) bonds relative to EM. Feature Egypt is the world’s most populous Arab country and a geopolitical fulcrum at the critical juncture between Africa, Europe, and Asia. Its stability is particularly important at a time of rapid geopolitical change. The U.S. is deleveraging from the Middle East and regional powers are scrambling to fill the void. Popular discontent is toppling rigid authoritarian leaders, most recently in Algeria and Sudan. Displaced peoples have spilled into Europe in the recent past and could do so again if more regimes fail (Chart 1). In this week’s Special Report we take a close look at Egypt and show how its continued stabilization is a rare positive trend for the region and one that presents an investment opportunity in its own right. China’s March Credit data confirm that stimulus is surprising to the upside this year. Before proceeding, however, we make note of some key developments on the global front, especially our oil view: China’s Stimulus: China’s March credit data confirm that stimulus is surprising to the upside this year (Chart 2). The data will help galvanize expectations of firming global growth, supporting commodity prices and EM risk assets. We are long Chinese equities, Indonesian and Thai equities, and EM energy producer equities relative to the EM benchmark. Chart 1Asylum Seekers May Rise Amid Mideast Instability
Asylum Seekers May Rise Amid Mideast Instability
Asylum Seekers May Rise Amid Mideast Instability
Chart 2Chinese Credit Supports Economic Outlook
Chinese Credit Supports Economic Outlook
Chinese Credit Supports Economic Outlook
Iranian Sanctions: The Trump administration is increasing the pressure on Iran again and threatening to enforce sanctions strictly on oil exports. Exports have recovered somewhat since Trump issued waivers for key importers last fall and this means that 1.3mm bpd are still at risk if enforcement intensifies (Chart 3).
Chart 3
Libyan War: Libyan National Army leader, General Khalifa Haftar, has made a move for Tripoli after sweeping across the country’s south, jeopardizing the roughly 300,000 barrels per day exported from Zawiya, west of Tripoli. Egypt is one of Haftar’s geopolitical backers, along with the UAE, so Egypt’s improving domestic situation, discussed below, is a factor supporting Haftar’s ability to extend his control across western Libya, which poses a risk of unplanned oil outages this year. The combination of these factors will put upward pressure on oil prices in an environment where supplies are already limited. As a result, Bob Ryan, the head of BCA’s Commodity & Energy Strategy, believes that OPEC 2.0 will eventually follow Russia’s preferred path at this juncture and increase production. Russia and Saudi Arabia are comfortable with Brent crude above $70 per barrel, but will get nervous once prices rise above $80 and threaten to kill demand in emerging markets. An alteration of slated production cuts has not yet been agreed and prices remain well supported in the meantime, with Brent on track to average $75 per barrel in 2019 and $80 in 2020.1 We do not expect President Trump to impose “maximum pressure” on Iran in this context. We have long assumed the worst of Venezuelan production, i.e. that it will at least be cut in half to 500,000 bpd by end of year, and possibly fall to zero. Libyan outages could theoretically rise to the full 900,000 bpd, though the likely cap is 300,000 bpd. The removal of 1.3mm bpd of Iranian barrels would bring the combined production losses close to OPEC 2.0’s spare capacity of around 2.1mm bpd. Moreover, the Iranians have the ability to retaliate, which jeopardizes other output across the Middle East. The United States has a valuable tool in the Strategic Petroleum Reserve.2 But President Trump would still be taking an enormous risk with the economy in advance of an election year to enforce the maximum sanctions on Iran. So we maintain that he will largely keep the waivers in place on May 2. The real danger, from our point of view, comes if Trump is re-elected, as then he will be less constrained both politically (no chance of reelection) and economically (U.S. production going up) in pursuing his hawkish foreign policy against Iran. But that is a story for 2021. With that, we turn to Egypt. A Dream Deferred Earlier this year, the Egyptian parliament voted in favor of a series of proposed constitutional amendments that will further consolidate President Abdel Fattah al-Sisi’s power. Among the changes are the extension of the president’s term, allowing him in principle to rule for another 15 years. The proposed amendments will also expand the role of the military, enshrining a political role for it, thus solidifying its already preeminent position in Egyptian politics.3 These proposed changes bring the de facto Egyptian political environment close to its pre-2011 state – that is, the state of affairs before an estimated two million Egyptians rose in protest at Tahrir Square and removed President Hosni Mubarak from power, setting in motion a tumultuous decade. Sisi supporters argue that these changes will guarantee much needed stability and policy continuity to the Egyptian economy, allowing it to regain its footing. With GDP growth expected to near 6% by the middle of next year – the strongest since the 2011 revolution – it is no surprise that the aspirations of Egypt’s revolutionaries have become a dream deferred. Chart 4Improving Fundamentals Bode Well For Egyptian Equities
Improving Fundamentals Bode Well For Egyptian Equities
Improving Fundamentals Bode Well For Egyptian Equities
Instead, policymakers and ordinary citizens alike have focused on making ends meet – both in terms of the fiscal purse and the household bank account. Policy continuity is what is required for Egypt at this point in time: It is finally beginning to reap the rewards of the painful reforms enacted in late 2016 as part of the IMF program. Sisi’s own position is reinforced by the fact that he oversaw this process and has come out on the other side. While the proposed constitutional amendments will pass, and will be characterized as a step back into authoritarian rule, the stability will be favorable for investors, as it will support a more predictable near-term trajectory for the Egyptian economy. Egyptian assets have already started to reflect this reality, signaling that Egypt is transitioning into a new era that portends a more attractive investment climate. As such, Egyptian equities have picked up and have outperformed the broader EM index since December (Chart 4). Bottom Line: “Stability” is the catch-phrase of the Sisi regime. Constitutional amendments allowing the Egyptian president and military to amass far-reaching powers are likely to pass. While they mark a return to Egypt’s traditional authoritarian system, this will be welcomed by foreign investors who were otherwise hesitant to re-enter the Egyptian market during the turbulent aftermath of 2011 Egypt’s 2016-2019 Policy Mantra: No Pain, No Gain Since the 2011 revolution, the Egyptian economy has been defined by years of turmoil. The popular uprising and ensuing loss of security drove away tourists and foreign investors – key sources of hard currency – causing the central bank to chew through its foreign exchange reserves as it scrambled to stabilize confidence and the currency. High rates of poverty, unemployment, and inequality amid a growing public sector wage bill, over reliance on food imports and an overvalued currency were a recipe for an economic disaster. Public debt ballooned while the black market for foreign exchange thrived. Thus, the structural reforms (Box 1) that accompanied the November 2016 $12bn IMF loan – while painful – were necessary to transition the economy onto a more sustainable trajectory. Box 1 Structural Reforms Implemented Since 2016 The reforms that accompanied the IMF program are designed to improve fiscal consolidation, liberalize the foreign exchange market, and create a more business friendly investment climate. They include the following measures: The floating of the currency in November 2016 which resulted in the Egyptian pound losing half its value relative to the dollar. Given that Egyptians rely on imports for a large chunk of their consumption, the impact on household budgets and consumer prices have been massive (Chart 5). However, the inflation rate has since slowed to 14.4%, with the Central Bank of Egypt (CBE) targeting single-digit inflation by the end of next year. Similarly, it has stabilized the EGP/USD.4 Reductions to fuel subsidies have weighed on consumer expenditures. The target is full-cost recovery by the end of 2018-19 for almost all fuel products (except LPG and fuel oil used in bakeries and electricity generation). The introduction of a value-added tax (VAT) of 13% in 2016, which subsequently rose to 14%. The VAT will help generate revenue, by replacing the distortionary sales tax and broadening the tax base. Basic goods and services are exempt from the VAT in order to shield the poor from rising living costs. A reduction in utility subsidies to reduce state spending and instead channel funds to more productive uses. Authorities target the full elimination of electricity subsidies by 2020-21. Similarly, water and sewage subsidies have been cut. As of December 2018, Egypt ended a discounted customs exchange rate for non-essential imports. The monthly fixed customs exchange rate was introduced in 2017, following the 2016 currency devaluation, offering a favorable exchange rate to importers. In the second half of last year, the customs exchange rate was set at 16 EGP/USD while the market rate was EGP/USD 17.82-17.96. The non-essential imports include tobacco products, alcohol, pet food, and cosmetics. Other goods that will also be subject to the market rate include mobile phones, computers, furniture, shoes, cars, and motorbikes. The elimination of the repatriation mechanism for new inflows. The repatriation mechanism guaranteed the availability of foreign exchange for capital repatriation to portfolio investors that chose to sell foreign exchange to the central bank. Its elimination means that cash inflows and outflows by foreign portfolio investors will now impact the supply and demand of foreign currencies in the market. A new investment law was enacted in July 2017, which aims to promote domestic foreign investments by offering incentives and reducing bureaucracy. A new bankruptcy law was enacted in January 2018. Egypt ranks 101 out of 168 in the “Resolving Insolvency Index” of the Doing Business report. The law simplifies post-bankruptcy procedures and aims to reduce the need for companies to resort to courts in the case of bankruptcy. It also removes investment risk by abolishing imprisonment in bankruptcy cases. Chart 5FX Reform Was Inflationary
FX Reform Was Inflationary
FX Reform Was Inflationary
To mitigate the impact of these changes, especially on the lower and lower-middle income brackets, social programs have been expanded and improved, including: Takaful and Karama: An expansion of the cash transfer program, which now targets more than 10 million people, or ~10% of the population. Forsa: A program that helps create job opportunities for underprivileged youth by focusing on employment training. Mastoura: A program that lifts living standards and provides economic empowerment for Egyptian women by supplying microloans to fund projects. Sakan Karim: A program that aims to improve housing conditions of the poor by promoting access to clean drinking water and sanitation. Together, the structural reforms and targeted social programs will support the Egyptian economy by strengthening the business climate, attracting investment, and increasing employment. Since the beginning of the program, the country’s fiscal arithmetic has improved, inflation has been contained, and foreign exchange is no longer scarce. As a result, investor confidence has picked up. With the final $2bn tranche of the loan expected to be dispersed in the middle of 2019, the onus now lies on Egyptian policymakers to keep up the momentum. Bottom Line: With the IMF program now winding down, the continuity of reform implementation is squarely on the back of policymakers. With further structural policies in the pipeline, we expect policymakers to build on the macroeconomic gains of the past few years. Reaping The Rewards The most evident improvement following the reforms is seen in the fiscal purse. For the first time in over a decade, the primary balance is in surplus (Chart 6). The improvement reflects lower government spending commitments on the back of fiscal consolidation (Chart 7). Nevertheless, revenues remain weak, despite the implementation of the VAT, implying a need to improve tax collection and boost aggregate demand to raise taxable revenues. Chart 6Improving In Fiscal Arithmetic...
Improving In Fiscal Arithmetic...
Improving In Fiscal Arithmetic...
Chart 7...On Back Of Fiscal Consolidation
...On Back Of Fiscal Consolidation
...On Back Of Fiscal Consolidation
As policymakers continue reforming budgetary allocations, we expect the primary surplus to remain intact. This will alleviate some of the pressure on the overall budget, which, while still in deficit, has improved substantially. With the final $2bn tranche of the loan expected to be dispersed in the middle of 2019, the onus now lies on Egyptian policymakers to keep up the momentum. Nevertheless, the stock of public debt – whilst declining – remains elevated and will continue weighing on the overall budget (Chart 8). This is especially problematic for fiscal arithmetic since domestic interest rates are in the double digits and interest payments will tie down roughly half of government revenues. A combination of improving potential GDP, falling domestic interest rates, and continued prudence on debt is needed to stabilize Egypt’s debt dynamics. In fact, with the decline in both headline and core inflation, the Central Bank of Egypt has already embarked on a monetary easing cycle, cutting rates by 300 basis points since the beginning of last year (Chart 9). Although interest rates remain extremely high, lower borrowing costs will not only improve debt dynamics on the margin, but also encourage private sector credit, thus raising aggregate output and revitalizing domestic investment. Chart 8Debt Remains A Burden
Debt Remains A Burden
Debt Remains A Burden
Chart 9Continued Easing Will Boost Outlook
Continued Easing Will Boost Outlook
Continued Easing Will Boost Outlook
While inflation may accelerate in the coming months – on the back of a seasonal uptick in food prices during the month of Ramadan and the further removal of subsidies – we expect further cuts by the CBE in 2H2019 and 2020. Falling real wages due to fiscal consolidation also point to lower inflationary pressures (Chart 10). Unless Egypt manages to stabilize its debt dynamics, it will once again be forced to resort to debt monetization, which bodes ill for the currency as well as for inflation. The evidence to date points to an improvement (Chart 11). Chart 10Inflationary Pressures Are Contained
Inflationary Pressures Are Contained
Inflationary Pressures Are Contained
Along with the improvement in the fiscal account, Egypt’s external deficit has also narrowed on the back of the improvement in the macroeconomic climate (Chart 12). The contraction in the current account deficit has been bolstered by an expansion in exports, which grew more than 10% in 2018. Chart 11Authorities Resisting Urge To Monetize Debt
Authorities Resisting Urge To Monetize Debt
Authorities Resisting Urge To Monetize Debt
Chart 12External Deficit Contracting
External Deficit Contracting
External Deficit Contracting
Chart 13Natural Gas Exports Will be Supportive
Natural Gas Exports Will be Supportive
Natural Gas Exports Will be Supportive
Notably, the energy trade balance has benefitted from an increase in Egypt’s natural gas potential (Chart 13). The giant Zohr field – the largest gas discovery ever made in the Mediterranean – came on stream in December 2017, and will support Egypt’s self-sufficiency in gas after falling domestic production forced Egypt to cut most LNG exports in 2014. The location of the gas field also presents opportunities for Egypt to become a natural gas export hub in the region. The Zohr field is close to other major fields in Israel and Cyprus, which means economies of scale can be utilized in developing regional export infrastructure. Egypt’s LNG export plants in Damietta and Idku have a capacity of 19 billion cubic meters (bcm) per year, which have been mostly idle in recent years. Already, an agreement between Egypt and Cyprus this past December committed to the construction of a pipeline connecting the Aphrodite gas field to Egypt’s LNG facilities. Similarly, a rebound in revenues from tourism to near-pre-crisis levels has helped improve the external account (Chart 14). Going forward, we expect the decline in terrorism to support the rebound of foreign inflows from tourism (Chart 15). This will be a non-negligible source of cash as tourism now accounts for roughly half of all service receipts, up from less than a quarter just three years ago. However, given that the security situation is unpredictable, this sector remains vulnerable to downside risks. Chart 14Rebound In Tourism...
Rebound In Tourism...
Rebound In Tourism...
Chart 15
Another supportive source of inflows has been remittances from Egyptians living abroad. These continue to grow at a double-digit rate (Chart 16). Chart 16Recovery In Remittance Inflows
Recovery In Remittance Inflows
Recovery In Remittance Inflows
Chart 17Foreign Investment Will Be Supported...
Foreign Investment Will Be Supported...
Foreign Investment Will Be Supported...
However, the financial account has taken a hit recently as inflows from portfolio investments have come down quite sharply on the back of investor aversion to emerging markets last year (Chart 17). Given the Fed’s pause, China’s stimulus, and other factors, we expect a pickup in portfolio investment. What’s more, Egyptian authorities have been working on improving the business environment, reflected in Egypt’s rising rank in the ease of doing business and global competitiveness surveys (Chart 18). This should improve foreign direct investment, which remains relatively weak so far.
Chart 18
Chart 19Build Up In Central Bank Reserves
Build Up In Central Bank Reserves
Build Up In Central Bank Reserves
Of course, despite these improvements, Egypt still ranks relatively low on these measures. Thus continued efforts to improve the business environment will be necessary to make Egypt an attractive destination for businesses. Yet Egypt’s foreign reserves have picked up considerably, and more importantly its net reserves – which exclude the CBE’s foreign borrowings – have once again turned positive (Chart 19). Bottom Line: The rewards from Egypt’s structural reforms are evident in the improvements to its twin deficits. While continued policy prudence is necessary to maintain the momentum of these policies, we expect the EGP/USD to remain flattish for the remainder of the year. We expect continued policy easing as the CBE cuts rates at least one more time in the second half of the year on the back of slowing inflation. Ghosts Of Futures Past Political stability and an improvement in macroeconomic indicators will no doubt be supportive of the Egyptian economy and assets in the near term. However, several structural risks remain, and could derail its performance down the road. For one, Egypt remains heavily reliant on its external environment. This environment has been largely cooperative throughout Sisi’s term in office, but a global or EM downturn could cause investment to collapse. Meanwhile the cyclical rise in oil prices will weigh on the import bill and raise headline inflation. Improvements in the business environment should attract foreign directinvestment. Second, a rising dependency ratio will pose a burden on Egypt in the coming years (Chart 20). Furthermore, elevated female and youth unemployment keep the output gap wide. True, the current improvement in the overall labor market will help the country weather the demographic headwind. However, another chronic problem is the quality of the Egyptian labor market. The latest data from the World Bank shows that government spending on education is significantly lower than it is among EM peers (Chart 21). Similarly, health expenditure per capita has not picked up much in recent years and has actually fallen as a share of GDP. Chart 20Demographic Challenges Remain
Demographic Challenges Remain
Demographic Challenges Remain
Chart 21
This has manifested in relatively low labor productivity and highlights the need for investment in human capital to improve potential GDP and the necessity for funds to be channeled to these sectors. Fortunately, the reforms have freed up badly needed fiscal space for now. Another key concern is the bloated economic role of the state and military. This is a double whammy to the Egyptian economy as it reduces fiscal funds available for other uses, such as healthcare and education while constraining the private sector. The crowding out of the private sector is evident from the recipients of bank credit: loans to the government – beyond purchases of government securities – are growing at by nearly 50% y/y, while lending to other sectors is expanding at less than 15% y/y (Chart 22). Once again, however, there is evidence of improvement: bank investments in government securities have come down from their peak and now represent roughly a third of total bank assets (Chart 23). Accordingly, credit to the private sector has likely bottomed. Chart 22Private Sector Crowding Out Remains...
Private Sector Crowding Out Remains...
Private Sector Crowding Out Remains...
Chart 23...But Signs Of Improvement
...But Signs Of Improvement
...But Signs Of Improvement
One structural concern that is here to stay is the fact that the Egyptian military occupies an oversized share of the economy. Given that all companies of the Egyptian armed forces are exempt from taxes, they have an unfair advantage over the private sector. The military has an especially large presence in Egypt’s recent infrastructure mega-projects. These include $8.2 billion invested in an expansion of the Suez Canal as well as the construction of a new administrative capital, 45 km to the east of Cairo. The military budget is secret and connected industries are not subject to auditing. Preferential treatment in assigning government contracts and the ability to offer services at a cheaper rate have further expanded the military’s role in the economy. Bottom Line: Risks to our optimistic outlook on Egypt mostly come from any deterioration in the external environment. The Egyptian economy is also weakened by structural weaknesses such as a large, under-invested labor market. These structural risks are considerable and will weigh on the long term investment potential of Egypt. In the short term, however, Egypt appears to be a lucrative trade opportunity. Investment Implications Egyptian sovereign spreads will likely contract going forward on the back of an improvement in the economic outlook (Chart 24). Thus, we recommend an overweight stance in Egyptian sovereign bonds within the EM space. Chart 24Improved Fundamentals A Positive For Sovereign Bonds
Improved Fundamentals A Positive For Sovereign Bonds
Improved Fundamentals A Positive For Sovereign Bonds
Chart 25Equities Still Attractive
Equities Still Attractive
Equities Still Attractive
In the equities space, Egypt’s valuations look attractive relative to their Emerging Market and Frontier Market peers (Chart 25), despite the recent rally in recognition of the stability we outline here. Matt Gertken, Vice President Geopolitical Strategist mattg@bcaresearch.com Marko Papic Consulting Editor marko@bcaresearch.com Footnotes 1 Please see BCA Commodity & Energy Strategy Weekly Report, “Sussing Out OPEC 2.0’s Production Cuts, U.S. Waivers On Iran Sanctions,” April 11, 2019, available at www.bcaresearch.com. 2 The U.S. Strategic Petroleum Reserve (SPR) was created in 1975, in the wake of the Arab oil embargo, to protect the U.S. from supply disruptions. Faced with a “severe energy supply interruption” the U.S. president can authorize a maximum drawdown of 30 million barrels within a 60-day period, beginning 13 days after the decision. Notably, the SPR was tapped for 21 million barrels in 1990-91, during the Iraqi invasion of Kuwait, and for 30 million barrels in 2011, when Libyan production fell to zero amid the revolution. The current inventory is 649 million barrels of sweet and sour crude, which could last the U.S. 114 days of crude imports. As U.S. net oil imports decrease, the length of time that the SPR could substitute for net imports rises. 3 The Egyptian parliament voted in favor of the proposed changes on April 16. The changes will be put to a public referendum – as early as next week – before taking effect. The amendments seek to (1) extend presidential terms from four to six years, (2) permit President Sisi to run again after his current term ends in 2022 – as an exceptional case, (3) allow the president to select the heads of judicial bodies and to oversee a new council responsible for judicial affairs, and (4) enshrine in the constitution a political role for the army to preserve the constitution, democracy and – ironically – the civilian nature of the country. 4 The most recent appreciation this year raised fears that the CBE is once again intervening in the currency market through state-owned banks.
Highlights Evidence continues to mount that the Chinese economy is in a bottoming process. This suggests the path of least resistance for the RMB is up. Meanwhile, as the U.S. and China move closer to a trade deal, any geopolitical risk premium in the RMB will slowly erode. The ultimate catalyst for CNY longs will be depreciation in the U.S. dollar, which we believe is slowly underway. The ECB is turning more dovish at a time when euro area growth is hitting a nadir. This will be bullish for the euro beyond the near term. Our limit buy on the pound was triggered at 1.30. Target 1.45 with stops at 1.25. With the Aussie dollar close to the epicenter of Chinese stimulus, data down under is increasingly stabilizing. We are closing our short AUD/NOK position for a small profit. Feature Chart I-1The Chinese Yuan Is Pro-cyclical
The Chinese Yuan Is Pro-cyclical
The Chinese Yuan Is Pro-cyclical
In addition to the dovish shift by global central banks, most investors are rightly fixated on China at this juncture in the economic cycle. For one, it has been mostly responsible for the mini cycles in the global economy since 2014. And with improvements in both Chinese credit and manufacturing data in recent months, the consensus is drawing closer to the fact that we may be entering a reflationary window. Looking at risk assets, MSCI China is up 25% from its lows, while the S&P 500 is up 20%. Commodity prices are also rising, with crude oil hitting a new calendar-year high this week. The corollary is that if the improvement in Chinese data proves sustainable, it will propel these asset markets to fresh highs. The evolution of the cycle has important implications for the yuan exchange rate, because the RMB has been trading like a pro-cyclical currency in recent years. The USD/CNY has been moving tick for tick with emerging market equities, Asian currencies, and even some commodity prices (Chart I-1). Ever since its liberalization over a decade ago, the RMB may finally be behaving like a free-floating exchange rate. Therefore, a simple evaluation of how relative prices between China and the rest of the world evolve will be valuable input for the fair value of the RMB exchange rate. Reading the tea leaves from Chinese credit data can be daunting, but we agree with the assessment of our China Investment Strategy team that while the credit impulse has clearly bottomed,1 the magnitude of the rise is unlikely to be what we saw in 2015-2016. That said, a higher credit-to-GDP ratio also requires a smaller increase in credit growth to have an outsized effect on GDP. As such, monitoring what is happening with hard data in the economy concurrently – in particular, green shoots – could add valuable evidence to the reflation theme. A Repeat Of 2016? Cycle bottoms can be protracted and volatile, but also V-shaped. So it is useful when economic data is at a nadir to pay attention to any green shoots emerging, because by the time the last piece of pertinent economic data has turned around, it may well be too late to call the cycle. Admittedly, most measures of Chinese (and global) growth remain weak. But there have been notable improvements in recent months that suggest economic velocity may be picking up: Production of electricity and steel, all inputs into the overall manufacturing value chain, are inflecting higher. Intuitively, these tend to lead overall industrial production. Overall industrial production remains weak, but the production of electricity and steel, all inputs into the overall manufacturing value chain, are inflecting higher. Intuitively, these tend to lead overall industrial production (Chart I-2). Electricity production for the month of February grew 5% after grinding to a halt in 2015-2016. Production of steel also rose by 7%. If these advance any further, they will begin to exceed Q4 GDP growth, indicating a renewed mini-cycle. Chart I-2A Revival In Industrial Activity
A Revival In Industrial Activity
A Revival In Industrial Activity
Chart I-3Metal Prices Are Sniffing A Rebound
Metal Prices Are Sniffing A Rebound
Metal Prices Are Sniffing A Rebound
In recent weeks, both steel and iron ore prices have been soaring. Many commentators have attributed these increases to supply bottlenecks and/or seasonal demand. However, it is evident from both the manufacturing data and the trend in prices that demand is also playing a role (Chart I-3). Overall residential property sales remain soft, but evidence from tier-1 and even tier-2 cities is signalling that this may be behind us, given robust sales. Over the longer term, the ebb and flow of property sales has tended to be in sync across city tiers. A revival in the property market will support construction activity and investment. House prices have been rising to the tune of 10% year-on-year, and real estate stocks in China may be sniffing an eventual pick-up in property volumes (Chart I-4). Over the last 20 years or so, Chinese credit growth has been a reliable indicator for car sales with a lead of about six months. Government expenditures were already inflecting higher ahead of last month’s China National People’s Congress (NPC). Again, this suggests stimulus this time around may be more fiscal than monetary (Chart I-5). In addition to the recent VAT cut for manufacturing firms from 16% to 13%, a string of policy easing measures will begin to accrue, including a cut to social security contributions effective May 1st, and perhaps a pickup in infrastructure spending. Already, real estate infrastructure spending growth is perking up, with that in the mining sector soaring to multi-year highs. Chart I-4Real Estate Volumes Could Pick Up
Real Estate Volumes Could Pick Up
Real Estate Volumes Could Pick Up
Chart I-5The Fiscal Spigots Are Opening
The Fiscal Spigots Are Opening
The Fiscal Spigots Are Opening
Finally, Chinese retail sales including those of durable goods remain very weak. Car sales are deflating at the fastest pace in over two decades. But the latest VAT cut by the government is being passed through to consumers, with an increasing number of car manufactures cutting retail prices. Chart I-6Car Sales Typically Have V-Shaped Recoveries
Car Sales Typically Have V-Shaped Recoveries
Car Sales Typically Have V-Shaped Recoveries
Over the last 20 years or so, Chinese credit growth has been a reliable indicator for car sales with a lead of about six months (Chart I-6). The indicator right now suggests we could witness a coiled-spring rebound in Chinese car sales over the next few months. Bottom Line: Both Chinese stocks and commodity prices have been suggesting a bottoming process in the domestic economy for a while now. Incoming data is beginning to corroborate this view. This has important implications for both the Chinese yuan and other global assets. Capital Flows Improving domestic and external conditions will likely offset any renewed pressure on the Chinese yuan from capital outflows. Our China Investment Strategy team reckons that even after adjusting for cross-border RMB settlements and illicit capital outflows, there is less evidence of capital flight today than there was in 2015-2016.2 Chart I-7Offshore Markets Don't See RMB Weakness
Offshore Markets Don't See RMB Weakness
Offshore Markets Don't See RMB Weakness
Typically, offshore markets have had a good track record of anticipating depreciation in the yuan. Back in 2014, offshore markets started pricing in a rising USD/CNY rate, and maintained that view all the way through to 2018, when the yuan eventually bottomed. Right now, no such depreciation is being priced in (Chart I-7). The reason offshore markets in Hong Kong and elsewhere can be prescient is because more often than not, they are the destination for illicit flows out of China. For example, one of the often-rumored ways Chinese money has left the country is through junkets, key operators in Macau casinos.3 These junkets bankroll their Chinese clients in Macau while collecting any debts in China allowing for illicit capital outflows. This was particularly rampant ahead of the Chinese 2015-2016 corruption clampdown, when Macau casino equities were surging while equity prices in China remained subdued. Historically, both equity markets tend to move together, since over 70% of visitors to Macau come from China (Chart I-8). Right now, both the Chinese MSCI index and Macau casino stocks are rising in tandem, suggesting gains are more related to fundamentals than hot money outflows. Chart I-8Macau Casinos: A Good Proxy For Chinese Spending
Macau Casinos: A Good Proxy For Chinese Spending
Macau Casinos: A Good Proxy For Chinese Spending
A surge in illicit capital outflows could also be part of the reason for an explosion in sight deposits in Hong Kong ahead of the 2015-2016 clampdown (Chart I-9). Admittedly, most of these deposits were and still are due to cross-border RMB settlements, but it is also possible that part of these constituted hot money outflows. With these sight deposits rising at a more reasonable pace, it suggests little evidence of capital flight. Chart I-9The Chinese Government Has Clamped Down On Illicit Flows
The Chinese Government Has Clamped Down On Illicit Flows
The Chinese Government Has Clamped Down On Illicit Flows
Trade Truce A trade truce between the U.S. and China will be the final catalyst for a stronger yuan. The news flow so far has been positive, with both U.S. President Donald Trump and Chinese President Xi Jinping publicly acknowledging they are closer to a deal. Even well-known China hawk Peter Navarro, head of the U.S. National Trade Council, has admitted that the two sides are in the final stages of talks. But with a still-ballooning U.S. trade deficit with China, Trump will want to take home a win (Chart I-10). Chart I-10Trump Needs To Take A Win Back To America
Trump Needs To Take A Win Back To America
Trump Needs To Take A Win Back To America
Concessions on the Chinese side so far seem reasonable, allowing us to speculate that there is a rising probability of a deal. They have agreed to increase agriculture and energy imports from the U.S. by about $1 trillion over the next six years, announced a cut on import tariffs, revised their Patent Law to improve protection of intellectual property, and provided a clear timeline for when foreign caps will be removed in sectors such as autos and financial services. These seem like very reasonable concessions that will allow Trump to go home and declare victory. Trade wars are usually synonymous with recessions. As such, there are acute political constraints inching both sides towards an agreement. For President Trump, a deteriorating U.S. manufacturing sector in the midwestern battleground states is a thorn in his side. For President Xi, rising unemployment is a key constraint. On the currency front, the details of any agreement are still unknown, but should Chinese economic fundamentals start to genuinely improve, it will put upward pressure under rates – and ergo the yuan (Chart I-11). A gradually rising yuan exchange rate will further assuage any doubts or concerns that Trump may have. Bottom Line: Our fundamental models show the yuan as undervalued by about 3%. This means China could allow its currency to gradually appreciate towards fair value, with little impact on the domestic economy or even exports. Given some green shoots in incoming economic data, little risk of capital flight, and the rising likelihood of a trade deal between the U.S. and China, our bias is that the path of least resistance for the Chinese RMB is up (Chart I-12). Chart I-11Rising Chinese Rates Will Favor The Yuan
Rising Chinese Rates Will Favor The Yuan
Rising Chinese Rates Will Favor The Yuan
Chart I-12The RMB Is Not Expensive
The RMB Is Not Expensive
The RMB Is Not Expensive
Another Dovish Shift By The ECB In another dovish twist, the European Central Bank kept monetary policy unchanged following this week’s meeting, while highlighting that it might be on hold for longer. Unsurprisingly, incoming data has been weak of late, which the ECB (like other central banks) blamed on the external environment. It did fall short of speculation that it will introduce a tiered system for its marginal deposit facility, which would have alleviated some cash flow pressures for euro area banks. Our bias is for the new Targeted Long Term Refinancing Operation (TLTRO III – in other words, cheap loans), to remain a better policy tool than a tiered central bank deposit system. In the case of a TLTRO, the ECB can effortlessly decentralize monetary policy, since liquidity gravitates towards the countries that need it the most. While a tiered system can allow a bank to offer higher rates and attract deposits, there is no guarantee that these deposits will find their way into new loans. It is also likely to benefit countries with the most excess liquidity. In the case of a TLTRO, the ECB can effortlessly decentralize monetary policy. Beyond any short-term volatility in the euro, we think the ECB’s dovish shift could be paradoxically bullish. If a central bank eases financing conditions at a time when growth is hitting a nadir, it is tough to argue that it is bearish for the currency. Meanwhile, fiscal policy is also set to be loosened. Swedish new orders-to-inventories lead euro area growth by about five months, and the recent bounce could be a harbinger of positive euro area data surprises ahead (Chart I-13). Chart I-13Euro Area Growth Will Recover
Euro Area Growth Will Recover
Euro Area Growth Will Recover
Bottom Line: European rates are further below equilibrium compared to the U.S., and the ECB’s dovish shift will help lift the euro area’s growth potential. Meanwhile, investors are currently too pessimistic on euro area growth prospects. Our bias is that the euro is close to a floor. House Keeping Our buy-stop on the British pound was triggered at 1.30. We recommend placing stops at 1.25, with an initial target of 1.45. As we argued last week,4 the odds of a hard Brexit continue to fall, with U.K. Prime Minister Theresa May explicitly saying this week that the path for the U.K. going forward is either a deal with the EU or with no Brexit at all. As we go to press, EU leaders have granted the U.K. an extension until the end of October, with a review in June. Chart I-14What Next For The Pound?
What Next For The Pound?
What Next For The Pound?
Back when the referendum was held in June 2016, even the pro-Brexit Tories, a minority in the party, promised continued access to the Common Market. Fast forward to today and there are simply not enough committed Brexiters in Westminster to deliver a hard exit. Given that the can has been kicked down the road, markets are likely to turn their focus on incoming economic data. On that front, economic surprises in the U.K. relative to both the U.S. and euro area are soaring (Chart I-14). Elsewhere, we are also taking profits on our short AUD/NOK position. Since 2015, the market has been significantly dovish on Australia, in part due to a more accelerated downturn in house prices and a marked slowdown in China. The reality is that the downturn in Australia has allowed some cleansing of sorts and has brought it far along the adjustment path relative to its potential. Any potential growth pickup in China will light a fire under the Aussie dollar, which is a risk to this position. Chester Ntonifor, Foreign Exchange Strategist chestern@bcaresearch.com Footnotes 1 Please see China Investment Strategy Special Report, titled “China: Stimulating Amid The Trade Talks,” dated February 20, 2019, available at fes.bcaresearch.com 2 Please see China Investment Strategy Special Report, titled “Monitoring Chinese Capital Outflows,” dated March 20, 2019, available at fes.bcaresearch.com 3 Farah Master, “Factbox: How Macau's casino junket system works,” Reuters, October 21, 2011. 4 Please see Foreign Exchange Strategy Weekly Report, titled “Not Out Of The Woods Yet,” dated April 5, 2019, available at bca.bcaresearch.com Currencies U.S. Dollar Chart II-1USD Technicals 1
USD Technicals 1
USD Technicals 1
Chart II-2USD Technicals 2
USD Technicals 2
USD Technicals 2
Recent data in the U.S. have been mostly positive: In March, 196K nonfarm jobs were created, surprising to the upside; unemployment rate stayed low at 3.8%, though average hourly earnings growth fell to 3.2% year-on-year. The factory orders in February contracted by 0.5% month-on-month. More importantly, headline consumer price inflation in March rose to 1.9% year-on-year, however this was mostly lifted by rising energy prices. Core inflation excluding food and energy dropped by 10 basis points to 2%. JOLTs job openings unexpectedly fell to 7.1 million in February, from 7.6 million. However, initial jobless claims fell to 196K. After a 3-month lull, producer prices are inflecting higher at a pace of 2.2% year-on-year for the month of March. DXY index fell by 0.44% this week. Global risk assets are on the rise this week. Meanwhile, the Fed minutes highlighted that members are in no rush to raise rates. Stalling interest rate differentials will be a headwind for the dollar. Report Links: Not Out Of The Woods Yet - April 5, 2019 Tug OF War, With Gold As Umpire - March 29, 2019 Into A Transition Phase - March 8, 2019 The Euro Chart II-3EUR Technicals 1
EUR Technicals 1
EUR Technicals 1
Chart II-4EUR Technicals 2
EUR Technicals 2
EUR Technicals 2
Recent data in the euro area have been positive: The Sentix Investor Confidence index continues to inflect higher, coming in at -0.3 from -2.2. German industrial production grew by 0.7% month-on-month in February. Trade balances improved across the euro area. In France, the trade deficit fell to €-4.0B in February. In Germany, the trade surplus increased to €18.7B. Italian retail sales increased by 0.9% year-on-year in February. On the inflation front, consumer price inflation in Germany and France both stayed at 1.3% year-on-year in March. EUR/USD rose by 0.57% this week. On Wednesday, the ECB has decided to leave policy unchanged as expected. Mario Draghi also highlighted more uncertainties and downside risks to the euro area amid the ongoing trade disputes. While the global trade war might add volatility to the pro-cyclical euro, easier financial conditions should eventually backstop growth. Report Links: Into A Transition Phase - March 8, 2019 A Contrarian Bet On The Euro - March 1, 2019 Balance Of Payments Across The G10 - February 15, 2019 The Yen Chart II-5JPY Technicals 1
JPY Technicals 1
JPY Technicals 1
Chart II-6JPY Technicals 2
JPY Technicals 2
JPY Technicals 2
Recent data in Japan have been negative: Preliminary cash earnings fell by 0.8% year-on-year in February, the only decline since mid-2017. Household confidence continues to tick lower, coming in at 40.5 in March. The trade balance in February came in at a surplus of ¥489.2B. Capex is rolling over. Machinery orders fell by 5.5% year-on-year in February. Machine tool orders remain extremely weak, at -28.5% year-on-year for the month of March. Lastly, the foreign investment in Japanese stocks increased to ¥1,463.7B. USD/JPY fell by 0.46% this week. In its April regional outlook, the BoJ downgraded most of the prefectures in Japan, with only Hokkaido that had an upgrade in the aftermath of the earthquake. As domestic deflationary pressures intensify, this will favor the yen. This also raises the probability the government defers the consumption tax hike. Report Links: Tug OF War, With Gold As Umpire - March 29, 2019 A Trader’s Guide To The Yen - March 15, 2019 Balance Of Payments Across The G10 - February 15, 2019 British Pound Chart II-7GBP Technicals 1
GBP Technicals 1
GBP Technicals 1
Chart II-8GBP Technicals 2
GBP Technicals 2
GBP Technicals 2
Recent data in the U.K. have been strong: In February, manufacturing production increased by 0.6% year-on-year; industrial production also increased by 0.1% year-on-year, both surprising to the upside. Both were deflating in January. The goods trade balance in February fell to £-14.1B, however the total trade balance came in at a smaller deficit of £4.86B. Monthly GDP also came in higher at 2% year-on-year in February. House prices gains have pared the increase of previous years, but the Halifax house price index still increased by 2.6% year-on-year for the month of March. GBP/USD rose by 0.41% this week. Theresa May got an extension for Brexit to October 31. Meanwhile, U.K. data have been stronger than consensus recently. We are long GBP/USD from 1.30, with a 0.6% profit. Report Links: Not Out Of The Woods Yet - April 5, 2019 A Trader’s Guide To The Yen - March 15, 2019 Balance Of Payments Across The G10 - February 15, 2019 Australian Dollar Chart II-9AUD Technicals 1
AUD Technicals 1
AUD Technicals 1
Chart II-10AUD Technicals 2
AUD Technicals 2
AUD Technicals 2
Recent data in Australia have continued to improve: Investment lending for homes in February grew by 2.6%. Home loans in February increased by 2% month-on-month, surprising to the upside. Westpac consumer confidence came in at 100.7 in April, increasing by 1.9%. AUD/USD surged by 0.64% this week. The RBA Deputy Governor Guy Debelle hinted that a wait-and-see approach for interest rates seemed like the appropriate path, signaling that policy will continue to be accommodative. Meanwhile, the Australian dollar is probably anticipating better upcoming data from China, as it is Australia’s largest trading partner. If the world’s second largest economy can turn around, the Aussie dollar is likely to grind higher. Report Links: Not Out Of The Woods Yet - April 5, 2019 Into A Transition Phase - March 8, 2019 Balance Of Payments Across The G10 - February 15, 2019 New Zealand Dollar Chart II-11NZD Technicals 1
NZD Technicals 1
NZD Technicals 1
Chart II-12NZD Technicals 2
NZD Technicals 2
NZD Technicals 2
There was little data out of New Zealand this week: The food price index came in at 0.5% month-on-month in March, shy of the estimate of 1.3%. NZD/USD plunged after rising by 0.5% initially this week, returning flat. Incoming data in New Zealand is likely to lag its commodity currency counterparts pushing the kiwi relatively lower. Our long AUD/NZD position is now 0.7% in the money since entry last Friday. Report Links: Not Out Of The Woods Yet - April 5, 2019 Balance Of Payments Across The G10 - February 15, 2019 A Simple Attractiveness Ranking For Currencies - February 8, 2019 Canadian Dollar Chart II-13CAD Technicals 1
CAD Technicals 1
CAD Technicals 1
Chart II-14CAD Technicals 2
CAD Technicals 2
CAD Technicals 2
Recent data in Canada have been negative: On the labor market front, the participation rate in March fell slightly to 65.7%; 7,200 jobs were lost, underperforming the estimated creation of 1,000 jobs; unemployment rate was unchanged at 5.8%. On the housing market front, starts in March increased by 192.5K year-on-year, underperforming the expected 196.5K; building permits dropped by 5.7% month-on-month in February. USD/CAD rebounded quickly after falling by 0.7% earlier this week, offsetting the loss. While the dovish shift by the BoC and looser fiscal policy, together with rising oil prices are likely to be growth tailwinds, the data disappointment coming from the housing market and overall economy limit upside in the CAD. Report Links: A Shifting Landscape For Petrocurrencies - March 22, 2019 Into A Transition Phase - March 8, 2019 Balance Of Payments Across The G10 - February 15, 2019 Swiss Franc Chart II-15CHF Technicals 1
CHF Technicals 1
CHF Technicals 1
Chart II-16CHF Technicals 2
CHF Technicals 2
CHF Technicals 2
There was scant data in Switzerland this week: The foreign currency reserves came in at 756B CHF in March. Unemployment rate in March was unchanged at 2.4%, in line with expectations. USD/CHF appreciated by 0.44% this week. With the euro area economy slowly recovering, the franc is likely to underperform as risk appetite rises. We are long EUR/CHF for a 0.1% profit. Report Links: Balance Of Payments Across The G10 - February 15, 2019 A Simple Attractiveness Ranking For Currencies - February 8, 2019 Waiting For A Real Deal - December 7, 2018 Norwegian Krone Chart II-17NOK Technicals 1
NOK Technicals 1
NOK Technicals 1
Chart II-18NOK Technicals 2
NOK Technicals 2
NOK Technicals 2
Recent data in Norway have been strong, with inflation grinding higher: Headline consumer price inflation increased to 2.9% year-on-year in March; core inflation also rose to 2.7% year-on-year, both surprising to the upside. Producer price index grew by 5.2% year-on-year in March, outperforming expectations. USD/NOK depreciated by 1.16% this week. The improving domestic economy, rising oil prices, and the tick up in inflation are all the reasons why we favor the Norwegian krone. We are playing the NOK via a few pairs, notably long NOK/SEK and short AUD/NOK, which are currently 3.11% and 0.75% in the money, respectively. Report Links: A Shifting Landscape For Petrocurrencies - March 22, 2019 Balance Of Payments Across The G10 - February 15, 2019 A Simple Attractiveness Ranking For Currencies - February 8, 2019 Swedish Krona Chart II-19SEK Technicals 1
SEK Technicals 1
SEK Technicals 1
Chart II-20SEK Technicals 2
SEK Technicals 2
SEK Technicals 2
Recent data in Sweden have been mixed: Industrial production fell to 0.7% year-on-year in February, lower than the previous reading of 3%. New manufacturing orders contracted by 2.8% year-on-year in February. However, the leading manufacturing new orders to inventory ratio is rising suggesting we might be near a bottom. Consumer price inflation came in higher at 1.9% year-on-year in March. USD/SEK fell by 0.21% this week. We remain bullish on the Swedish krona due to its cheap valuation and the imminent pickup in the euro area economy. Report Links: Balance Of Payments Across The G10 - February 15, 2019 A Simple Attractiveness Ranking For Currencies - February 8, 2019 Global Liquidity Trends Support The Dollar, But... - January 25, 2019 Trades & Forecasts Forecast Summary Core Portfolio Tactical Trades Closed Trades
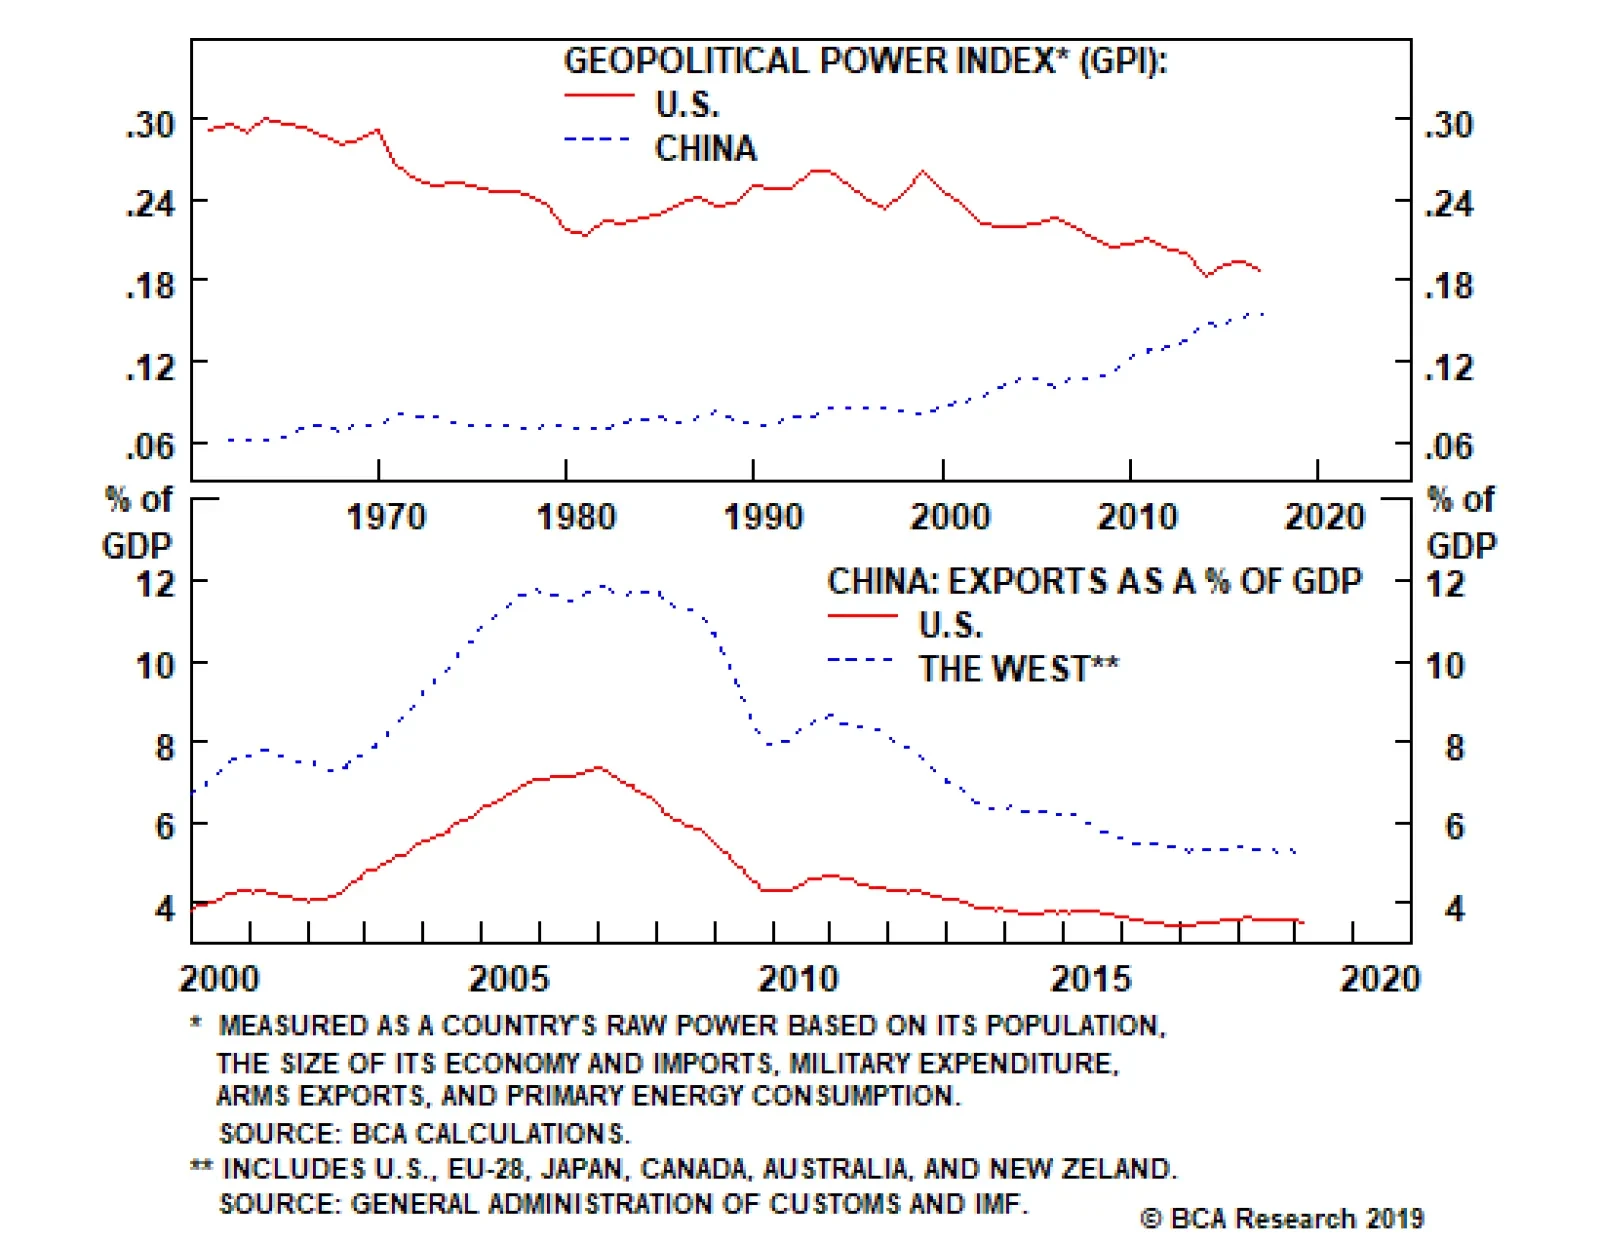
This should temper enthusiasm regarding the long-term durability of the trade truce, highlighting that China’s credit data is the more important factor for the 12-month horizon, though the trade issue is an impediment that needs to be removed for a…
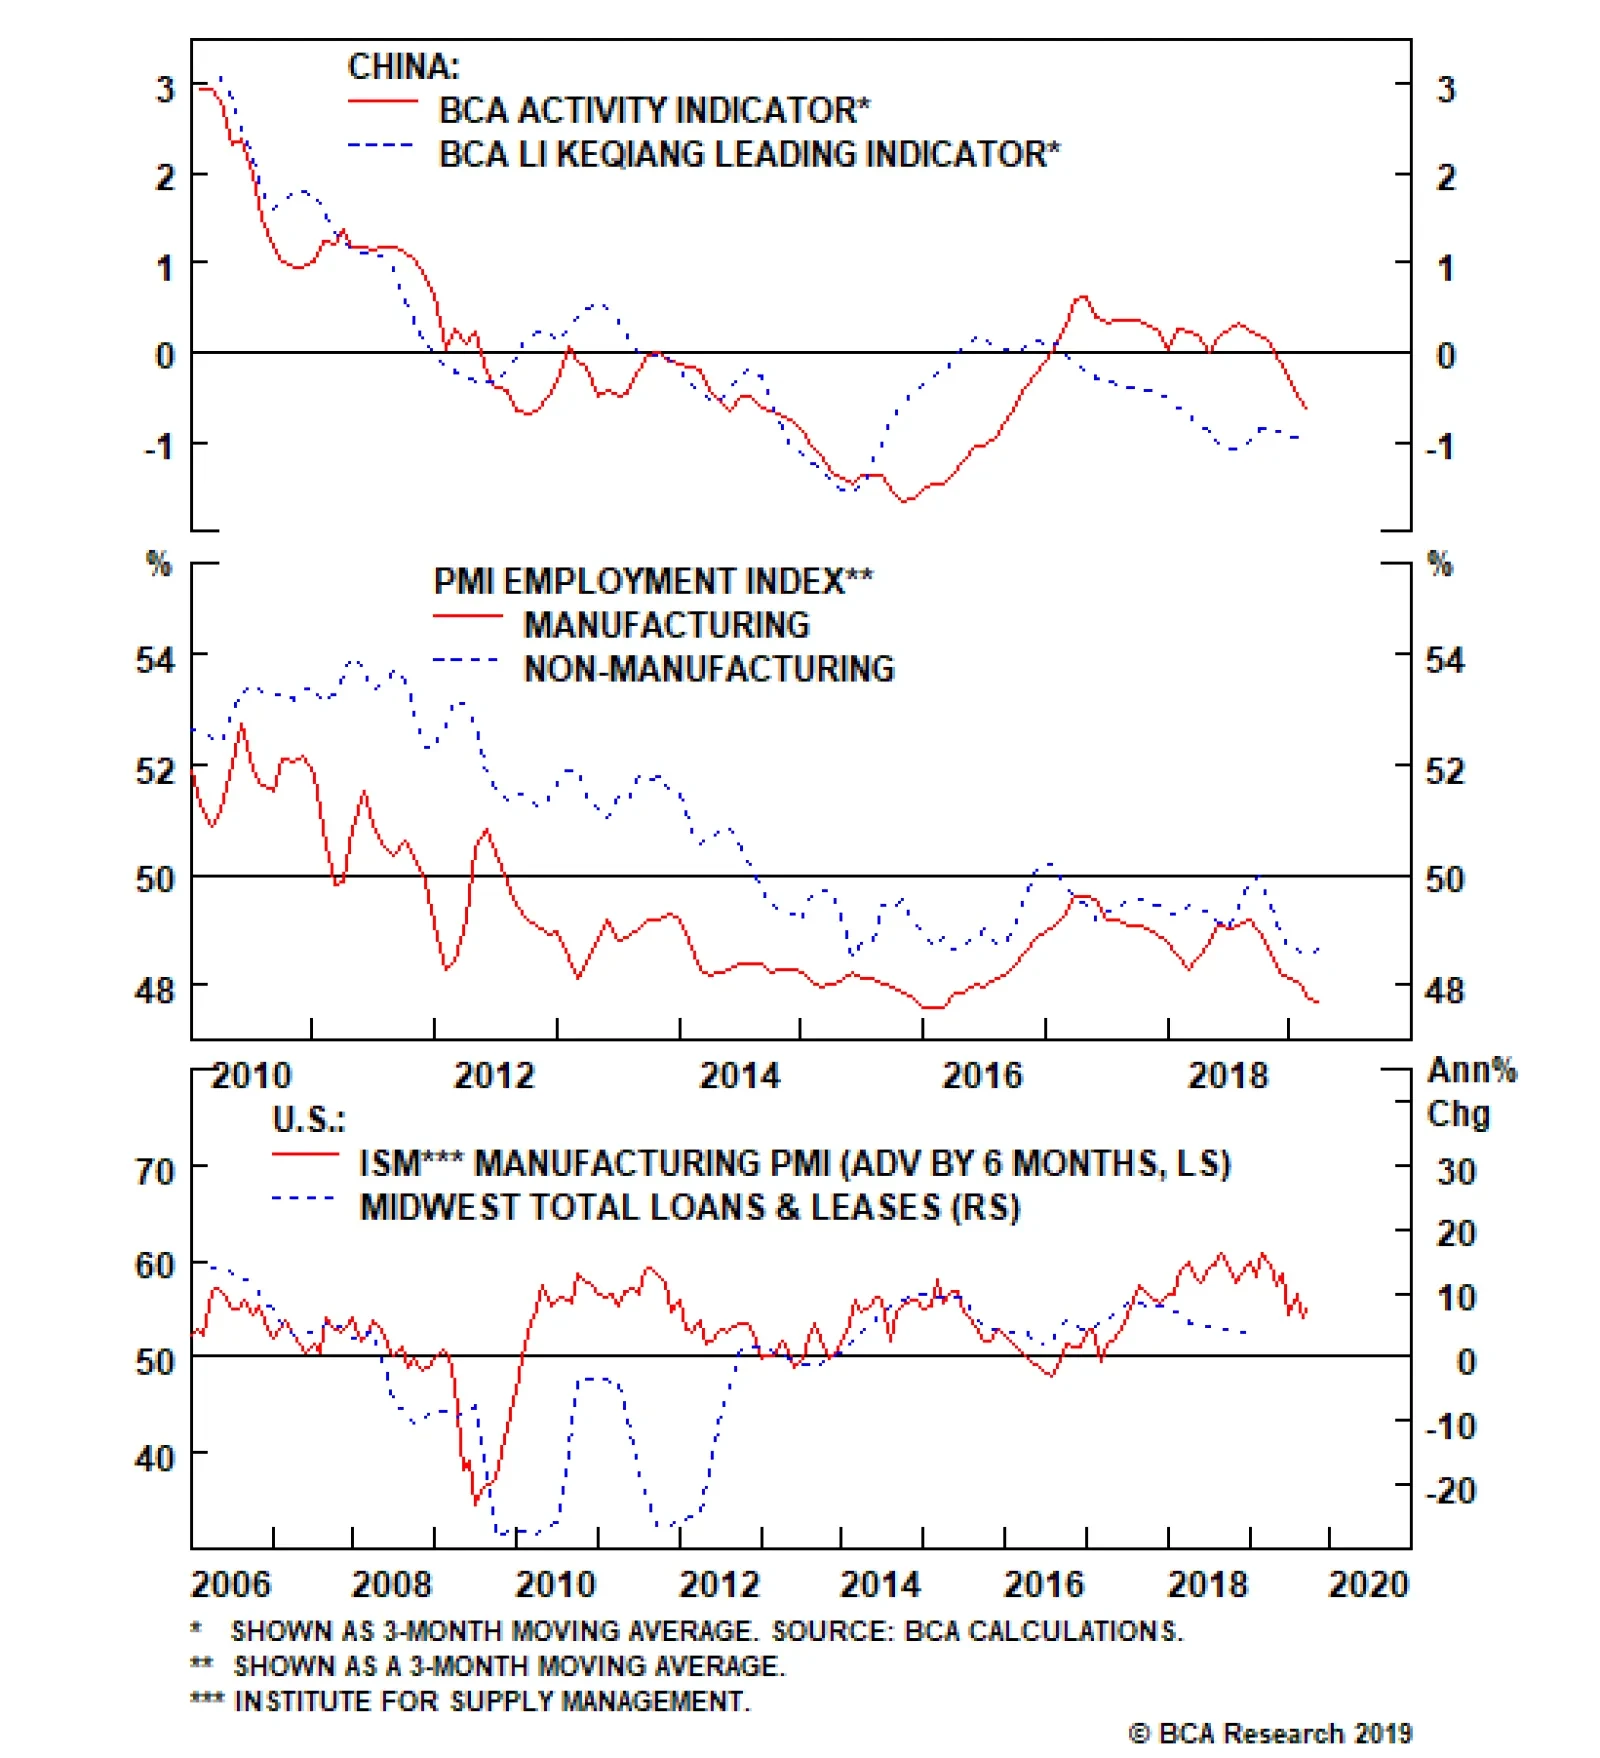
Our China Investment Strategy has highlighted that the BCA Activity Indicator has now fully registered the negative impact of trade tariffs as well as the broader slowdown. President Xi Jinping is not truly a modern-day Chairman Mao Zedong. While he has…
Highlights Foreign investors have been rushing into Indian equities in anticipation of a Modi win. While Modi’s chances are reasonable, he may not win an outright majority. Keep tactically underweighting Indian stocks for now. The structural outlook for Vietnam is strong and improving. A bottom in Vietnamese equities is in the making. Investors should overweight Vietnamese stocks within an EM equity portfolio. Feature Indian Equities: A Window Of Risk Remains Foreign investors have been rushing into Indian equities in anticipation of a win by current Prime Minister Narendra Modi in the upcoming general elections. As a result, Indian stocks have been outperforming the EM benchmark. Nevertheless, a window of risk for the Indian bourse remains. While Modi’s chances of winning the elections are reasonable, he and his party – the Bharatiya Janata Party, or BJP – may not win an outright majority in the lower house, as occurred in May 2014. While Modi’s chances of winning the elections are reasonable, he and his party – the Bharatiya Janata Party, or BJP – may not win an outright majority in the lower house, as occurred in May 2014. The basis for Modi not being able to win an outright majority is that rural area incomes have weakened substantially due to falling food prices (Chart I-1). Corroborating this distress in rural areas, stock prices of rural-exposed companies have massively underperformed urban-exposed ones (Chart I-2). Chart I-1India's Food Prices Have Been Falling Despite Low Rainfall
India's Food Prices Have Been Falling Despite Low Rainfall
India's Food Prices Have Been Falling Despite Low Rainfall
Chart I-2Rural-Exposed Stocks Have Massively Underperformed Urban Stocks
Rural-Exposed Stocks Have Massively Underperformed Urban Stocks
Rural-Exposed Stocks Have Massively Underperformed Urban Stocks
Even though both monetary and fiscal policies are easing, these macro policies always work with a time lag and will not improve domestic growth before the elections. A BJP-led minority-government will force Modi to increasingly rely on his allies in the National Democratic Alliance (NDA) coalition. The prime minister will then be forced to frequently offer concessions, watering down his reform agenda. The BJP’s allies in the NDA coalition are not necessarily as market-friendly. This is why we believe such an outcome would upset Indian financial markets after its most recent outperformance. Meanwhile, rural demand weakness has spilled over into the broader Indian economy. Passenger car sales, as well as sales of two- and three-wheelers are on the verge of contraction, and growth in tractor sales is falling sharply (Chart I-3). Chart I-3Indian Cyclical Growth Is Decelerating
Indian Cyclical Growth Is Decelerating
Indian Cyclical Growth Is Decelerating
Chart I-4Indian EPS Growth Will Likely Contract
Indian EPS Growth Will Likely Contract
Indian EPS Growth Will Likely Contract
Moreover, the bottom panel of Chart I-3 illustrates that the production of intermediate goods is contracting and manufacturing production is decelerating. Worryingly, the domestic growth slowdown has stalled EPS growth for the overall market, and net profit margins are falling (Chart I-4). The large-cap equity index has so far disregarded poor earnings performance, which magnifies the risk to Indian stocks if the BJP fails to win a majority government. Notably, small-cap stocks have failed to advance much and have not corroborated the rally in large-caps (Chart I-5). India’s stock market breadth is also poor, which is a bad omen for the sustainability of the current rally (Chart I-6). Chart I-5India Small Cap Stock Are Not Confirming The Rally
India Small Cap Stock Are Not Confirming The Rally
India Small Cap Stock Are Not Confirming The Rally
Chart I-6India's Stock Market Breadth Is Poor
India's Stock Market Breadth Is Poor
India's Stock Market Breadth Is Poor
Finally, rising oil prices will negatively impact India’s trade balance dynamics (Chart I-7, top panel). The stock market’s relative performance has diverged from the recent rise in oil prices – an unsustainable trend (Chart I-7, bottom panel). Investment Recommendations Chart I-7Higher Oil Prices Are Not Discounted By Indian Equities
Higher Oil Prices Are Not Discounted By Indian Equities
Higher Oil Prices Are Not Discounted By Indian Equities
The Indian economy will remain weak over the next several months, which places Modi’s majority re-election bid at risk. Beyond the elections, fiscal and monetary easing will kick in and boost cyclical growth in the second half of the year. Food prices are also beginning to pick up due to below average rainfall (Chart I-1, page 1). The latter will revive rural income and by extension spending. We recommend tactically underweighting Indian stocks for now. A better entry point to upgrade will likely emerge in the next few months as euphoria surrounding the upcoming elections comes to an end and a growth slowdown is finally priced in. For fixed-income investors, we recommend continuing to bet on yield-curve steepening. A dovish central bank will cut interest rates and keep them low. This, along with fiscal easing, will revive growth later this year. A growth recovery and rising food inflation will lift the long end of the yield curve. Ayman Kawtharani, Associate Editor ayman@bcaresearch.com Vietnam: Structural Tailwinds Getting Stronger; Buy On A Dip Our negative call on Vietnamese stocks since last May has turned out well.1 The significant deceleration in export growth alongside the selloff in broader emerging markets has generated a double-digit drop in Vietnamese stock prices over the past 12 months (Chart II-1, top panel). Chart II-1Vietnamese Equities: An Upturn Is Ahead
Vietnamese Equities: An Upturn Is Ahead
Vietnamese Equities: An Upturn Is Ahead
Looking forward, a new upturn in Vietnamese equities is in the making. The structural outlook for Vietnam is strong and improving. Investors should overweight Vietnamese stocks within an EM equity portfolio (Chart II-1, bottom panel). Shifting Supply Chain For some time, companies in China have been moving their supply chain to Vietnam due to its cheap labor, inexpensive land and supportive policies. The geopolitical confrontation between the U.S. and China that began last year has served to accelerate this process. The U.S. and China may soon reach a trade deal. This will give Chinese manufacturers and multinational companies more time to prepare for their relocation, but it will not stop the ongoing supply chain shift. Both multinationals and Chinese producers would prefer to have alternative supply chains that are not exposed to a potential re-escalation in geopolitical tensions between the U.S. and China in the years to come.2 Chart II-2 shows that Chinese companies have nearly tripled their foreign direct investment in Vietnam over the past nine months. The surge in relocations from the mainland has boosted land prices and wages in Vietnam significantly. For example, the rental price of industrial land at Giang Dien industrial park on a long-term lease of up to 50 years has risen as much as 50% to US$90 per square meter last October from US$60-70 a year ago. The relocations have occurred not only for low-value-added companies such as textile and footwear makers, but also for high-value-add companies like electronics assembly producers. According to the Chairman of Shenzhen-Vietnam Industrial Park, most of the companies that established factories in the park last year have been focused on light processing such as electronic assembly. Chart II-2Accelerating Supply Chain Shift
Accelerating Supply Chain Shift
Accelerating Supply Chain Shift
Chart II-3Strong U.S. Imports From Vietnam
Strong U.S. Imports From Vietnam
Strong U.S. Imports From Vietnam
Chart II-3 shows that U.S. imports from Vietnam have been much stronger than those from China and the rest of the world. This may be the result of both the accelerated supply chain shift last year and the structural competitiveness of Vietnamese goods. Vietnam continues to take market share from China in global markets such as footwear, garments and electronics (Chart II-4). Both multinationals and Chinese producers would prefer to have alternative supply chains that are not exposed to a potential re-escalation in geopolitical tensions between the U.S. and China in the years to come. In fact, rising FDIs have already led to a growth rebound in imports among foreign invested enterprises (FIE), heralding an export growth acceleration in the months ahead (Chart II-5). FIEs import most of the input materials they need to manufacture their goods, which are then exported overseas. This is why this segment’s imports lead export growth. Chart II-4Vietnam: Taking More Market Share From China
Vietnam: Taking More Market Share From China
Vietnam: Taking More Market Share From China
Chart II-5Rising FIE Imports Herald Export Growth Acceleration
Rising FIE Imports Herald Export Growth Acceleration
Rising FIE Imports Herald Export Growth Acceleration
Escaping A Global Slowdown In Smartphone Demand The biggest contributor to Vietnam’s current account and trade surplus has been the smartphone sector (Chart II-6). However, the ongoing downturn in global smartphone shipments may not affect Vietnam due to the latter’s gains in the global smartphone production and assembly market share: Vietnam mobile phone output (mostly Samsung smartphones) fell only slightly (1.2%) last year when Samsung smartphone shipments contracted by 8% (Chart II-7). This reflected Vietnam’s strong competitiveness relative to the other five countries where Samsung smartphones are manufactured: China, India, Brazil, Indonesia and South Korea. Over half of Samsung smartphones were produced in Vietnam last year. Chart II-6Phone Sector: The Biggest Driver Of Vietnamese Trade Surplus
Phone Sector: The Biggest Driver Of Vietnamese Trade Surplus
Phone Sector: The Biggest Driver Of Vietnamese Trade Surplus
Chart II-7Vietnam May Withstand Well In A Global Smartphone Demand Slowdown
Vietnam May Withstand Well In A Global Smartphone Demand Slowdown
Vietnam May Withstand Well In A Global Smartphone Demand Slowdown
Last December, Samsung closed its Chinese Tianjin plant. Without any additional production reductions in other plants, total Samsung capacity will be cut by about 7%. This further lowers the odds of a considerable production cut in Vietnam in the case of a further drop in global smartphone demand. Other Encouraging Signs Many other positive signs have emerged that point to a cyclical upturn ahead for Vietnam: Chart II-8Strong Domestic Demand
Strong Domestic Demand
Strong Domestic Demand
Retail sales growth has been accelerating, and automobile sales have reached new highs, suggesting strong domestic demand (Chart II-8). Despite declining visitor arrivals, the country’s tourism revenue still grew at a robust 10% pace last year. In 2019, the country is expecting a 15% year-on-year growth in visitor arrivals. The Comprehensive and Progressive Agreement for Trans-Pacific Partnership (CPTPP), which came into force for Vietnam in January, and the EU-Vietnam Free Trade Agreement (EVFTA), which will take effect later this year, will be highly beneficial to the Vietnamese economy. Both headline and core inflation are low. The country’s foreign reserves also jumped by 14% over the past 12 months to a record high of US$63.5 billion, equivalent to 26% of GDP. Investment Recommendations We recommend buying Vietnamese equities on dips. Dedicated equity investors should overweight Vietnam in an EM equity portfolio: The Vietnamese property market is booming on surging income growth and low interest rates. The real estate sector accounts for 45% of the MSCI Vietnam Index and 28% of the VN All-Share Index. According to CBRE Vietnam, there was a sharp rise in overseas investors in Vietnamese real estate in 2018, particularly from China. The real estate services firm reported that Chinese customers accounted for 44% of total transactions in the first nine months of 2018. In 2017, there was a 21% year-on-year increase in Chinese buyers. Buoyant household income growth is positive for consumer staples stocks, which accounts for 34% of the MSCI Vietnam Index and 8% of the VN All-Shares Index. Buoyant household income growth is positive for consumer staples stocks, which accounts for 34% of the MSCI Vietnam Index and 8% of the VN All-Shares Index. Vietnamese corporate earnings will outpace broader EM EPS, warranting equity market outperformance (Chart II-9). Vietnam's inclusion into some influential EM equity indices would significantly boost interest from foreign investors (Chart II-10). Chart II-9Vietnamese Corporate Earnings Growth: Better Than EM
Vietnamese Corporate Earnings Growth: Better Than EM
Vietnamese Corporate Earnings Growth: Better Than EM
Chart II-10Rising Interest From Foreign Investors
Rising Interest From Foreign Investors
Rising Interest From Foreign Investors
Technically, it seems the correction in Vietnamese stocks is late, and that the equity market will resume its upturn sooner rather than later. Ellen JingYuan He, Associate Vice President Emerging Markets Strategy ellenj@bcaresearch.com Footnotes 1 Please see Frontier Markets Strategy Special Report titled “Vietnamese Equities: Take A Step Back For Now, ” dated May 15, 2018. Available at fms.bcaresearch.com. 2 Please see Geopolitical Strategy and China Investment Strategy Special Report titled “China-U.S. Trade: A Structural Deal?” dated March 6, 2019. Available at gps.bcaresearch.com. Equity Recommendations Fixed-Income, Credit And Currency Recommendations
Highlights So what? The U.S.-China deal is not shaping up as well as the consensus holds. Why? The odds of reaching a deal by June are rising, but no higher than 50%. Unemployment is a constraint on the Chinese side but stimulus reduces urgency. Structural concessions on currency and foreign investment are limited in scope. Strategic concessions are limited to North Korea; Taiwan risks are rising. Stay overweight U.S. and Chinese equities on a relative basis at least until the deal is signed. Feature Once again investors are faced with a stream of headlines suggesting that a U.S.-China trade deal is all but finished, only to find critical caveats buried on page six. For instance, President Donald Trump and President Xi Jinping have not yet scheduled a summit to sign a trade agreement, though Trump insists a summit is necessary. Chief U.S. negotiator Robert Lighthizer says that he is “hoping but not necessarily hopeful.”1 There is still room for U.S. and Chinese bourses to outperform on a relative basis while negotiations continue. Still, the news flow is encouraging. Trump has said “we’ve agreed to far more than we have left to agree to,” while Xi Jinping has called for an “early conclusion of negotiations.” The other negotiators are also making positive sounds, with Vice Premier Liu He saying that a “new consensus” has been reached on a text of the trade agreement. National Economic Council Director Larry Kudlow says that key structural issues are on the table and that negotiations are continuing by videoconference after two successful rounds of direct talks in Beijing and Washington. Even the notorious China hawk, Peter Navarro, Director of the U.S. National Trade Council, has begrudgingly admitted that the two sides are in the final stage of the talks, saying, “the last mile of the marathon is actually the longest and the hardest.”2 Readers know that we take a pessimistic view of U.S.-China relations over the long run. We were skeptical about the possibility of a tariff truce on December 1. However, the signs are stacking up in favor of a deal. While we would not be surprised if talks extended to the June 28-29 G20 summit in Osaka, Japan, President Trump has suggested that a summit could come as early as May 5-19. Chart 1Still Some Room To Run
Still Some Room To Run
Still Some Room To Run
Judging by the performance of U.S. and Chinese equities relative to the rest of the world since the first tariffs were imposed on June 14, 2018, there is still room for these two bourses to outperform on a relative basis while negotiations continue. Relative to global equities excluding China and U.S., Chinese stocks have retraced 78% of the ground they lost, while U.S. stocks have not surpassed the high points reached at the peak of the global economic divergence in 2018 (Chart 1). Once a deal is reached, will investors that bought equities on the rumor sell the news? We would buy, though equity leadership should rotate away from the U.S. and China depending on the timing and external conditions discussed below. As a House we are overweight global equities on a 12-month horizon. Xi Is Not Mao China’s economic stimulus is a key swing factor for global growth and the corporate earnings outlook this year. Our China Investment Strategy has highlighted that the BCA Activity Indicator has now fully registered the negative impact of trade tariffs as well as the broader slowdown (Chart 2). Chart 2Slowdown Fully Priced In
Slowdown Fully Priced In
Slowdown Fully Priced In
Previously it was more buoyant than our leading indicator suggested it should be, largely because companies placed orders throughout the second half of 2018 to front-run Trump’s tariffs and this artificially boosted China’s exports and manufacturing activity. Now that this front-running is over, any improvement or deterioration in underlying monetary conditions, money supply, and lending should be reflected in the BCA Activity Indicator itself. Hence a stout credit number for March will cause an uptick that will confirm that China’s economy is recovering. We expect this to occur because, to be blunt, President Xi Jinping is not truly a modern-day Chairman Mao Zedong. While he has revived aspects of Maoism, he has responded pragmatically, rather than ideologically, to the Communist Party’s Number one political constraint: the tradeoff between productivity and employment. When Xi consolidated power in 2017, he launched a deleveraging campaign and doubled down on various structural reforms in order to make progress in rebalancing China’s economy. The result was renewed weakness in the labor market as the stimulus measures of 2015-16 wore off (Chart 3). Labor “incidents,” or protests, particularly those sparked by the relocation of workers from closed factories, began to rise again (Chart 4). Significantly, the number of bankruptcies also increased, demonstrating that the government was willing to tolerate some economic pain in order to make the allocation of capital more efficient (Chart 5). Chart 3A Key Constraint On Xi Jinping
A Key Constraint On Xi Jinping
A Key Constraint On Xi Jinping
Chart 4Labor Incidents On The Rise
Labor Incidents On The Rise
Labor Incidents On The Rise
Chart 5
China’s policymakers pursued these reforms while believing that President Trump’s threat of a trade war was largely bluster. But when Trump proceeded to impose tariffs, confidence collapsed and China’s private sector found itself sandwiched between stricter government at home and an impending squeeze of demand abroad. The labor and business indicators in Charts 3-5 suffered further deterioration in 2018 as animal spirits evaporated across the economy. President Xi’s response could have been to close China’s doors to trade and to the West and undertake an even more aggressive purge of “capitalist roaders.” The possibility is inherent in his cult of personality, aggressive anti-corruption campaign, and cyber-security state apparatus. This would have meant a dramatic reckoning with the country's economic and financial imbalances, but it would have given the hardliners in the Communist Party an opportunity to establish absolute control and national “self-sufficiency.” Instead, Xi entered into talks with Trump and launched supply-side, tax-and-tape-cutting measures to stimulate private economic activity, and boosted fiscal spending. He chose reflation rather than revolution. Chinese stimulus does not make a trade deal more likely in itself, as it gives President Xi more leverage in negotiations. But without a trade deal, private sector sentiment and animal spirits will remain depressed and stimulus measures will eventually falter. So it makes sense that Xi wants a deal. China will be the center of two market-positive outcomes in the near term: more domestic reflation and less conflict with the United States. To put this into context: if China’s credit impulse turns positive it will push the overall fiscal-and-credit impulse higher than 2% of GDP (Chart 6), foreshadowing a rebound in Chinese imports and global growth and enabling China’s own corporate earnings to recover. Our China Investment Strategy estimates that if the past three months’ rate of credit growth continues, while manufacturing sentiment improves on a trade deal and the renminbi remains flat, then the probability of an earnings recession on the MSCI China Index falls from 92% to 21%, as shown in Chart 7. From a policy perspective this looks conservative, as the actual rate of credit growth will probably be faster than that of the past three months. Chart 6Credit Will Add To Fiscal Boost
Credit Will Add To Fiscal Boost
Credit Will Add To Fiscal Boost
Chart 7Earnings Unlikely To Contract
Earnings Unlikely To Contract
Earnings Unlikely To Contract
Of course, President Trump has even more acute political constraints than President Xi urging him toward a deal. A deterioration in the U.S. manufacturing sector is a serious liability, especially in the Midwestern battleground states (Chart 8), and Trump has apparently calculated that a tailored infusion of Chinese cash and promises is a better reelection strategy than a continuation of trade war amid a slowdown. Chart 8A Key Constraint On Donald Trump
A Key Constraint On Donald Trump
A Key Constraint On Donald Trump
The implication of all of the above is that China will be the center of two market-positive outcomes in the near term: more domestic reflation and less conflict with the United States. The former is not yet consensus, while the latter is lacking in specifics. Yet both are beneficial for Chinese equities on an absolute and relative basis. And once there is a concluded trade deal and clarity over stimulus, emerging markets can also outperform their developed market counterparts. Note that we do not expect China to launch a massive 2008-09-style stimulus unless the tariff war reignites. Such an outcome would only be bullish for some EMs, since beneath the initial surge in Chinese imports would lie the disruption of the global supply chain and broader de-globalization. Bottom Line: Unemployment is a key political constraint suggesting both that China’s stimulus will surprise to the upside and that a trade deal is forthcoming. We are reducing the odds of an extension of trade talks beyond June from 35% to 20%, leaving a 50% chance for some kind of trade deal to emerge by the end of that month (Table 1). Table 1Updated Trade War Probabilities (April 2019)
U.S.-China Conflict: The End Of The Beginning
U.S.-China Conflict: The End Of The Beginning
Trump Is Not Nixon If Xi is not Mao, then Trump is not Nixon. Despite a likely trade deal, we are not on the verge of a historic 1972-esque “grand compromise” that will usher in a new era of U.S.-China engagement. This should temper enthusiasm regarding the long-term durability of the trade truce, highlighting that China’s credit data is the more important factor for the 12-month horizon, though the trade issue is an impediment that needs to be removed for a sustainable rally. China may be increasingly willing to embrace structural concessions, but the depth of the structural change should be doubted until the details of the trade deal prove otherwise. For example, at the moment there is still no agreement on tariff levels. And there can be no “enforcement mechanism” to satisfy the U.S. side other than the perpetual threat of tariffs, which erodes trust and discourages Chinese implementation of structural changes. Two structural issues highlight the conundrum: currency and foreign investment. First, while the details of the currency agreement are unknown, the U.S. will definitely not get anything comparable to what it got from Japan after the Plaza Accord in 1985. The Japanese were a subordinate ally to the U.S. in the midst of the Cold War; they did not negotiate with the suspicion that the U.S. secretly wanted to destroy their economy. China has neither the security guarantee nor the economic trust. The implication is that the CNY-USD may rise by about 10% or so from current levels (Chart 9), as opposed to the 54% that the JPY-USD witnessed from 1985-88. The upside for the U.S. is that Trump may get some yuan appreciation, while the upside for China is that limited appreciation means no excessively deflationary impact. Chart 9Currency Agreement: Far From A Plaza Accord
Currency Agreement: Far From A Plaza Accord
Currency Agreement: Far From A Plaza Accord
Second, China’s new foreign investment law, which received a rubber stamp from the legislature in March, is not an unqualified success for American negotiators. We have illustrated this in Table 2 by denoting white flags for aspects of the law that are genuine concessions and red flags for aspects that will raise new suspicions about China’s foreign investment framework. It is a mixed bag. Moreover, the law itself has no power and will depend entirely on the central government’s dedication to imposing strict adherence down through the local layers of government, where forced technology transfer actually takes place. Table 2New Foreign Investment Law: A Mixed Bag
U.S.-China Conflict: The End Of The Beginning
U.S.-China Conflict: The End Of The Beginning
American negotiators will also want bilateral agreements on tech transfer and intellectual property protection since otherwise they will not receive any particular benefit from a law that applies equally to all foreign investors (e.g. Europeans). But it is not yet clear that they will get anything more concrete. The upside for the U.S. is that it will have some means of redress for forced tech transfer and intellectual property theft, while the upside for China is that foreign direct investment should improve. The strategic conflicts between the U.S. and China are even less likely to be dealt with than the economic issues. How can we be sure? Peer Competition: The U.S.-China détente under Nixon occurred at a time when a vast asymmetry between U.S. and Chinese national power existed, whereas today China’s power increasingly rivals that of the U.S., making it easier for China to write its own rules for global interactions and to resist U.S. pressure (Chart 10). Unilateralism: Trump did not leverage American alliances and partnerships across the world to create a “coalition of the willing” to confront China over its mercantilist trade and investment practices. There is some cooperation but it has been inconsistent and tentative, even on deep national security concerns like Huawei’s involvement in 5G networks and the Internet of Things. Had the U.S. created such a coalition and then set out to prosecute its claims, the threat to China’s economy would have been so immense that much greater structural changes could be expected than is the case today (Chart 11). Chart 10The Era Of U.S.-China Detente Is Over
The Era Of U.S.-China Detente Is Over
The Era Of U.S.-China Detente Is Over
Chart 11Trump Eschewed A Coalition Of The Willing
Trump Eschewed A Coalition Of The Willing
Trump Eschewed A Coalition Of The Willing
Core Interests: The trade talks only nominally address dangerous conflicts in China’s near abroad. China’s enforcement of sanctions on North Korea has produced limited results so far but we ultimately expect diplomacy to bear fruit (Chart 12). However, Taiwan is more rather than less likely to be the site of conflict. This is not because of pro-independence sentiment, which is actually on decline in public opinion relative to pro-unification sentiment (Chart 12, second panel). It is because the lame duck Tsai Ing-wen administration may attempt to secure last-minute benefits from the U.S., while an unexpected primary election challenge could lead to the nomination of Lai Ching-te (William Lai), a more outspoken pro-independence candidate, on April 24. Either could provoke Beijing. There is zero chance that any trade deal in the coming months will reduce the threat of reunification of Taiwan by force. Underlying distrust will remain. Chart 12Geopolitical Risk Down In Korea But Up In Taiwan
Geopolitical Risk Down In Korea But Up In Taiwan
Geopolitical Risk Down In Korea But Up In Taiwan
Furthermore, the South China Sea is not a “red herring” but a potential “black swan,” as it is connected to Taiwan’s security and more broadly to U.S. alliance security. After all, 96%-97% of Taiwan’s, South Korea’s, and Japan’s oil imports flow through these sea lanes. Critical supplies become vulnerable if China expands its military’s capabilities there (Diagram 1). The U.S. and China will likely be just as provocative as before in this area after they sign a deal. Technology: The tech conflict is more likely to limit the trade deal than vice versa. The sanctions and embargoes on Chinese companies like ZTE, Fujian Jinghua, and Huawei have operated on a separate track from the trade talks, and it is not at all clear that the U.S. will embrace Huawei as part of any final deal. The initial actions of the newly beefed-up Committee on Foreign Investment in the United States (CFIUS) send warning signals. CFIUS is largely a vehicle for U.S. oversight of China (Table 3) and, if anything, that country-specific focus is intensifying. For instance, the U.S. has deemed Chinese ownership of a gay and lesbian hook-up app, Grindr, to pose an excessive national security risk.3 This is not a high bar for intervention and it suggests that any trade deal will fail to improve China’s investment options in the U.S. tech sector. Diagram 1South China Sea As Traffic Roundabout
U.S.-China Conflict: The End Of The Beginning
U.S.-China Conflict: The End Of The Beginning
Table 3CFIUS Is Mostly About China
U.S.-China Conflict: The End Of The Beginning
U.S.-China Conflict: The End Of The Beginning
The takeaway is that while both sides want a deal over the short term, it will not mark the end of the trade war. It is more likely the end of the beginning of a cold war. As long as China’s economy and industrial capabilities continue to grow relative to the United States, its geographic periphery remains a cauldron of geopolitical risks, and its technological advancement remains rapid, the competition will continue. Bottom Line: There is no substantial evidence from the current trade talks that underlying strategic conflicts will be resolved. This implies that the U.S. and China will shift their focus to these conflicts in the weeks and months after any trade deal. That process will be a nuisance to global equity markets expecting a clean deal; Chinese and American tech stocks in particular will remain exposed to tail risks. The status of Chinese tech companies is a critical risk, as a deal for the U.S. to admit Huawei would be a game-changer. Investment Conclusions Ironically, an early resolution of the trade war – in April or May – offers less of a benefit for Chinese equities and other risk assets than a later resolution in June or thereafter. While we expect to have greater clarity on China’s stimulus magnitude from the March data, it is still possible that stimulus will remain mixed or disappointing. Stimulus measures may also be toned down after a deal is approved, which means that an earlier deal would reduce the total stimulus by the end of 2019. The Trump administration will use the new flexibility gained from a China deal to toughen its policies in other areas, potentially with negative market consequences. The decision to designate the Iranian Revolutionary Guard Corps (IRGC) as a foreign terrorist organization is an important example. This decision is squarely within the Trump administration’s policy of pressuring Iran, which is a high-risk policy with substantial market-relevance. Trump may have made the decision in order to save face while planning to renew waivers on Iranian oil sanctions on May 4 – we would be extremely surprised if he did not renew. Sanctioning the IRGC involves a string of consequences but it is not a direct attack on oil supply that could produce an oil shock dangerous to Trump’s re-election prospects in 2020 (Chart 13). Of course, Iran will retaliate to the IRGC blacklisting – and one way it could do so would be through oil production in various places, including Iraq. The result would be oil volatility and higher prices.
Chart 13
Further, an early deal could encourage Trump to instigate a trade war with Europe. Trump’s four-to-six week time frame for the conclusion of talks with China is conspicuously close to the tentative May 18 deadline by which he is required to determine whether to impose tariffs on foreign auto and auto part imports (Chart 14). Such tariffs would be pursuant to the Section 232 investigation that likely found such imports a threat to national security. We have argued that a U.S.-China deal raises the risk of tariffs on European cars to 35%, with Japanese and Korean cars less at risk, progressively. The EU is ready to retaliate so this would be a drawn-out trade conflict.
Chart 14
Chart 15
By contrast, we are less concerned about the market impact of Trump’s recent threats to close the border with Mexico or include Mexico in car tariffs (Chart 15). True, Trump could close the border and generate a temporary drag on trade and the border economy. However, the Republicans have limited patience for the economic blowback of an extended border closure, and Trump cannot afford to jeopardize passage of his USMCA trade deal as long as he has alternative ways of looking tough on the border. Geopolitical Strategy would view the U.S. and China as good overweights relative to global equities and within their respective developed and emerging market contexts. What about a later resolution of the trade deal, in June or later in the summer? This would remove some risks. By that time, the Iran decision and possibly the car tariff decision will be past and there will be greater clarity on the magnitude of China’s stimulus. More extensive negotiations could also suggest that the ensuing trade deal will resolve deeper disagreements – unless the talks drag on without consequence amid signs of declining trust. Given the risk of trade war with Europe, oil volatility, and uncertainties about China’s stimulus, Geopolitical Strategy would view the U.S. and China as good overweights relative to global equities and within their respective developed and emerging market contexts. When and if the above political hurdles are cleared, the emphasis can shift to other bourses. Geopolitical Strategy’s preferred emerging market plays are EM energy producers and EM Asian states like Thailand and Indonesia. Matt Gertken, Vice President Geopolitical Strategy mattg@bcaresearch.com Footnotes 1 See Ailsa Chang, “U.S. Trade Representative Robert Lighthizer Discusses Ongoing Trade Talks With China,” National Public Radio, March 25, 2019, www.npr.org. 2 For the above quotations see Andrew Mayeda, Xiaoqing Pi, and Margaret Talev, “Kudlow Sees No Letup in China Talks as Both Sides Cite Progress,” Bloomberg, April 4, 2019, www.bloomberg.com. 3 See David E. Sanger, “Grindr Is Owned by a Chinese Firm, and the U.S. Is Trying to Force It to Sell,” March 28, 2019, www.nytimes.com.
Highlights Most currency pairs continue to trade toward the apex of tight wedge formations. History suggests major breakouts could be imminent. While the trade-weighted dollar has historically tended to be the best performing currency over a six-month period following a U.S. yield curve inversion, this window is rapidly closing. As the tug of war between data disappointments and easier financial conditions plays out, we intend to selectively add to more USD short positions. The pound is sitting exactly where it was after the 2016 U.K. referendum results, but the odds of a hard Brexit have significantly fallen since then. Place a limit buy on GBP/USD at 1.30. The RBA’s dovish shift was widely expected, while the RBNZ’s was not. Meanwhile, the Aussie dollar is sitting close to the epicenter of any Chinese stimulus. Buy AUD/NZD for a trade. Feature Markets have taken a risk-on tone this week. On the data front, there was strong improvement in the Chinese composite PMI, as well as broad increases in the services component of the PMIs across Europe and the U.S. Retail sales data out of Europe and Asia were above expectations and U.S. housing data is beginning to benefit from the fall in interest rates. Case in point, mortgage applications jumped almost 20% week-on-week, nudging the mortgage purchase index towards new highs. On the political front, China and the U.S. appear to be approaching a trade deal, and the U.K. has reached across the aisle to forge a Brexit deal that will potentially include stronger support from the Labor party. Despite these positives, there remain some dislocations in financial markets as investors digest whether financial conditions have eased enough globally to lift us out of the growth slowdown. Since 2015, both the Japanese Nikkei 225 index and the 10-year U.S. Treasury yield have moved in lockstep (Chart I-1). Right now, these two global growth barometers are sending opposing signals. The Nikkei index bottomed in December 2018 and is 13% off its lows, while at 2.5%, U.S. bond yields are not far off the trough made last week. Back in 2016, both indicators bottomed together in a unified response to the Federal Reserve’s dovish shift as well as Chinese stimulus. Every time the U.S. 10-year versus three-month spread has inverted, pro-cyclical currencies have gotten clobbered. The important message is that monetary policy affects the economy with a lag, and over the last year, more central banks have tightened policy than at any time since 2011 (Chart I-2). Our central bank monitors are still falling, suggesting easy monetary policy is still required. It wasn’t so long ago that dismal manufacturing PMI readings from Europe and Japan sent equity markets into a tailspin, with the U.S. 10-year versus three-month spread inverting. At a minimum, this warns against betting the farm too early on pro-cyclical currencies. Chart I-1Who Is Right?
Who Is Right?
Who Is Right?
Chart I-2Monetary Policy Still relatively Tight
Monetary Policy Still relatively Tight
Monetary Policy Still relatively Tight
Bottom Line: Every time the U.S. 10-year versus three-month spread has inverted, the U.S. trade-weighted dollar has tended to be the best performing currency over the next six months, while other pro-cyclical currencies have gotten clobbered. This occurred whether or not the inversion was a head-fake (Chart I-3). Our bias is that this time is different, but we will await further confirmation from higher-frequency indicators before building aggressive USD short positions. Chart I-3ABeware Of Curve Inversions (1)
Beware Of Curve Inversions (1)
Beware Of Curve Inversions (1)
Chart I-3BBeware Of Curve Inversions (2)
Beware Of Curve Inversions (2)
Beware Of Curve Inversions (2)
What To Watch In our March 8th bulletin,1 we detailed the case for fading U.S. dollar tailwinds and what to watch for in order to adopt a more pro-cyclical stance. These included PMI differentials between the U.S. and the rest of the world, copper- and oil-to-gold ratios, Chinese M2 relative-to-GDP, emerging market currencies, and China-sensitive industrial commodities. The message from these indicators remains broadly consistent with what was observed a month ago, so we will not reprint them here. That said, there are a few additional indicators to consider. AUD/JPY: This cross has broadly tracked swings in the global manufacturing pulse, given the Australian dollar benefits from improving global growth, while the yen benefits from flights to safety and deteriorating liquidity (Chart I-4). The cross has been dead flat around 79 for three months, suggesting these two forces are largely in a stalemate. A break higher in the cross towards the 82-83 zone would be encouraging. EUR/USD: For the U.S. dollar to weaken significantly, the euro will have to strengthen meaningfully, given the large share of euros in global reserves. Following dismal manufacturing PMI numbers out of Europe, the more domestic service-oriented PMIs have proven more resilient. Yet they still point to GDP growth between 1%-1.5% (Chart I-5). The external sector will have to participate to finally put a floor under the euro. It is encouraging that the euro has weakened significantly relative to the Chinese RMB, which should help European exports to China. Chart I-4Bottoming Processes Could Last A While
Bottoming Processes Could Last A While
Bottoming Processes Could Last A While
Chart I-5Dollar Weakness Needs A Strong Euro
Dollar Weakness Needs A Strong Euro
Dollar Weakness Needs A Strong Euro
Chinese Bond Yields: A larger share of financial intermediation is now being done through the Chinese bond market, meaning it has the power to ease financial conditions. There is significant debate as to whether Chinese credit stimulus has been sufficient, but bond yields suggest this has been the case (Chart I-6). We will be watching the Chinese aggregate money data for further confirmation that it is time to put on reflation trades. Chart I-6All Confirmatory Signs From China Count
All Confirmatory Signs From China Count
All Confirmatory Signs From China Count
Bottom Line: We noted last week that exports to China from Singapore jumped by 34% year-on-year and those to emerging markets by 22% year-on-year. Recent data from Taiwan corroborate the improvement in the Chinese manufacturing PMI for the month of March. With many currency pairs trading toward the apex of tight wedge formations, history suggests breakouts are imminent. Given that currency crosses can themselves be indicators, we will wait for confirmation of a breakout before putting on fresh pro-cyclical positions. Westminster Unifies It has been almost three years since the British voted to leave the European Union (EU). The original deadline of March 29th has been extended to April 12th. As the new deadline approaches, the odds are that a new one will be negotiated, probably by the May 23rd EU elections or even later. The imbroglio has been highly complex, even for the most astute of political analysts. However, our simple observation is that while the pound is sitting exactly where it was after the 2016 referendum results, the odds of a hard Brexit have significantly fallen since then. We are opening a buy-stop on GBP/USD at 1.30 today for a trade (Chart I-7). A very detailed scenario analysis for Brexit was discussed in this month’s Bank Credit Analyst publication.2 The historical context is that while complete sovereignty of a nation is and always has been a desirable fundamental right, a hard Brexit will do little to alleviate the British voters’ angst. Globalization, decades of supply-side reforms and competition from emerging markets have lifted income inequality in the U.K. to the detriment of the average U.K. voter. However, this is hardly due to European integration, given that this same sentiment afflicts many other independent nations. Economic surprises in the U.K. relative to both the U.S. and euro area are soaring. Back when the referendum was held in June 2016, even the pro-Brexit Tories, a minority in the party, promised continued access to the Common Market. Fast forward to today and there are simply not enough committed Brexiters in Westminster to deliver a hard Brexit. Meanwhile, there is scant evidence the general populace wanted a hard Brexit, given the very slim margin of victory for the Leave vote. It is also possible that absent the prominence of migration issues and terrorist attacks that were afflicting Europe at the time, we would not be having this debate today. Chart I-7Changing Landscape For The Pound
Changing Landscape For The Pound
Changing Landscape For The Pound
Chart I-8What Brexit?
What Brexit?
What Brexit?
As we publish this week, British Prime Minister Theresa May has kicked off negotiations with opposition party leader Jeremy Corbyn in a plan to muster a deal before the April 12th deadline. This falls into the first camp of our three scenarios, which are: 1) a softer Brexit deal; 2) a general election to break the impasse; or 3) another referendum. In the case of a general election, unless a hard Tory replaces Ms. May, chances are a softer Brexit will prevail. Meanwhile, our geopolitical strategists have ventured to say that Brexit is unsustainable over the secular horizon, and that the U.K. will remain in the EU. Bottom Line: While the political battle unfolds in the U.K., the reality is that the pound and U.K. gilt yields should be much higher solely on the basis of hard incoming data. Employment growth has been holding up very well, wages are inflecting higher, and the average U.K. consumer appears in decent shape (Chart I-8). Economic surprises in the U.K. relative to both the U.S. and euro area are soaring. With the benefit of hindsight, it is possible cable made its lows in mid-2016-early 2017 as it became clearer that the probability of a hard Brexit was waning. We are placing a limit buy on the pound today at 1.30, with a wide stop at 1.22. Buy AUD/NZD Chart I-9AUD Is On Sale
AUD Is On Sale
AUD Is On Sale
There are few times in markets and trading when you get a semblance of a free lunch. But one such opportunity may be on the table for the Aussie versus the Kiwi. For starters, over the past five years or so, whenever this cross has broken below the 1.04 support level, going long proved to be a profitable strategy over the ensuing 6-to-12 months. Meanwhile, over the last 35 years, the cross has spent more than 95% of the time over 1.06, with the low in 2015 close to parity. Finally, the cross is very cheap on a real effective exchange rate basis, which means that relative prices in Australia are at a discount to those in New Zealand (Chart I-9). The confluence of monetary policy shifts over the last few months may be blurring the direction of relative interest rate trends, but on the simple basis of real three-month interest rate differentials, the Aussie should be 15% higher relative to the Kiwi (Chart I-10). Ever since 2015, the market has been significantly more dovish on Australia relative to New Zealand, in part due to a more accelerated downturn in house prices and a significant slowdown in China. The reality is that the downturn in Australia has allowed some cleansing of sorts, and brought it far along the adjustment path relative to New Zealand. We may now be entering a window where economic data in New Zealand converges to the downside relative to Australia, the catalyst being a foreign ban on domestic house purchases (Chart I-11). Chart I-10Divergences Are Very Rare
Divergences Are Very Rare
Divergences Are Very Rare
Chart I-11Australia Is Well Along The Adjustment Path
Australia Is Well Along The Adjustment Path
Australia Is Well Along The Adjustment Path
Chart I-12Domestic Demand Pressures In New Zealand
Domestic Demand Pressures In New Zealand
Domestic Demand Pressures In New Zealand
A study by the Reserve Bank of New Zealand shows that on average, the elasticity of consumption growth to house price changes is 0.22%.3 However, the housing wealth effect is asymmetric with negative housing shocks, hurting consumption by more than the boost received from positive shocks. According to their calculations, the housing wealth elasticity for consumption is 0.23 for negative shocks, as compared to 0.13 for positive changes in housing wealth. This asymmetry may be due to the fact that, at very elevated debt levels, leveraged gains are used to pay down debt aggressively, whereas leveraged losses hit bottom lines directly. The study proves timely, since the RBNZ began a new mandate on April 1st to now include full employment in addition to inflation targeting. But given that the RBNZ has been unable to fulfill its price stability mandate over the last several years, it is hard to argue it will find a dual mandate any easier. Falling consumption will depress aggregate demand which, in turn, will depress consumption further. Falling inbound migration levels at a time of rapidly dwindling labor supply everywhere means the goldilocks scenario of non-inflationary growth may be behind us (Chart I-12). And for an economy driven by agricultural exports, productivity gains will be hard to come by. The final catalyst for the AUD/NZD cross will be a terms-of-trade shock, and evidence is rising that this is turning in favor of the Aussie (Chart I-13). China’s clear environmental push has lifted the share of liquefied natural gas in Australia’s export mix (Chart I-14). Given that eliminating pollution is a strategic goal in China, this will be a multi-year tailwind. Australia overtook Qatar last year as the world’s biggest exporter of liquefied natural gas. As the market becomes more liberalized and long-term contracts are revised to reflect surging spot prices, the Aussie dollar will get a boost. Chart I-13A Positive Shift
A Positive Shift
A Positive Shift
Chart I-14A Shifting Export Landscape
A Shifting Export Landscape
A Shifting Export Landscape
Bottom Line: Go long AUD/NZD as a strategic position. Place stops at parity. Chester Ntonifor, Foreign Exchange Strategist chestern@bcaresearch.com Footnotes 1 Please see Foreign Exchange Strategy Special Report, titled “Into A Transition Phase,”dated March 8, 2019, available at fes.bcaresearch.com 2 Please see The Bank Credit Analyst Special Report, titled “The State Of Brexit,” dated March 28, 2019, available at bca.bcaresearch.com 3 Mairead de Roiste, Apostolos Fasianos, Robert Kirkby, and Fang Yao, “Household Leverage and Asymmetric Housing Wealth Effects - Evidence from New Zealand,” Reserve Bank of New Zealand, Discussion Paper Series, (April 2019). Currencies U.S. Dollar Chart II-1USD Technicals 1
USD Technicals 1
USD Technicals 1
Chart II-2USD Technicals 2
USD Technicals 2
USD Technicals 2
Recent data in the U.S. have been weak compared to the rest of the world: Retail sales in February contracted by 0.2% month-on-month, shy of consensus of 0.3%. The March Markit manufacturing PMI fell to 52.4 while ISM manufacturing PMI rose to 55.3. However, the ISM non-manufacturing PMI also decreased to 56.1. The February durable goods orders contracted by 1.6% while still better than expected. Initial jobless claims fell to 202k this week. DXY index initially fell by 0.3% before rebounding to end the week flat. The upbeat Chinese data earlier this week was the strongest in the manufacturing sector for the past 8 months. Easing financial conditions worldwide and progress on trade talks have brought back investors’ risk appetite, which is a headwind for the counter-cyclical dollar. Report Links: Tug OF War, With Gold As Umpire - March 29, 2019 Into A Transition Phase - March 8, 2019 Balance Of Payments Across The G10 - February 15, 2019 The Euro Chart II-3EUR Technicals 1
EUR Technicals 1
EUR Technicals 1
Chart II-4EUR Technicals 2
EUR Technicals 2
EUR Technicals 2
Recent data in the euro area have shown tentative signs of a recovery: The Markit manufacturing PMI fell to 47.5 in March, the weakest number since 2013. However, the Markit composite PMI and services PMI increased to 51.6 and 53.3 respectively, both higher than expected. The unemployment rate stayed unchanged at 7.8% in February. Consumer price inflation in March fell slightly to 1.4%. Retail sales grew at 2.8% year-on-year in February, outperforming expectations of 2.3% growth. In Germany, retail sales surged by 4.7% year-on-year. EUR/USD depreciated by 0.2% this week. While the manufacturing data remains weak, the services PMI and retail sales in the euro area all show signs of an imminent pickup. During a speech last Wednesday, Mario Draghi highlighted that policy will continue to remain accommodative which should help financial conditions. Moreover, good news from U.K. and China could improve the trade outlook in the euro area. Report Links: Into A Transition Phase - March 8, 2019 A Contrarian Bet On The Euro - March 1, 2019 Balance Of Payments Across The G10 - February 15, 2019 The Yen Chart II-5JPY Technicals 1
JPY Technicals 1
JPY Technicals 1
Chart II-6JPY Technicals 2
JPY Technicals 2
JPY Technicals 2
Recent data in Japan have been positive: Housing starts in February grew by 4.2% year-on-year. Nikkei manufacturing PMI in March came in at 49.2, surprising to the upside, while the services PMI fell slightly to 52. Foreign investment in Japanese stocks increased to 438.7 billion yen. USD/JPY appreciated by 0.5% this week. The Tankan survey for Q1 was a bit disappointing, but nascent green shoots in the global economic recovery are providing support for Japanese shares. On the flip side, the higher risk appetite will likely decrease the demand for the safe-haven Japanese yen. Report Links: Tug OF War, With Gold As Umpire - March 29, 2019 A Trader’s Guide To The Yen - March 15, 2019 Balance Of Payments Across The G10 - February 15, 2019 British Pound Chart II-7GBP Technicals 1
GBP Technicals 1
GBP Technicals 1
Chart II-8GBP Technicals 2
GBP Technicals 2
GBP Technicals 2
Recent data in the U.K. have been mostly positive: The Q4 GDP surprised to the upside, coming in at 1.4% year-on-year. The Markit manufacturing PMI jumped to 55.1 in March, the strongest within the past year. The Markit construction PMI came in slightly below expectation at 49.7, while still above the last reading of 49.5. The services PMI fell to 48.9. GBP/USD appreciated by 0.7% this week. GBP/USD has been very volatile over the past weeks amid ongoing Brexit uncertainties. Despite this, the U.K. economy has been very healthy and cable is still trading at a discount to its fair value. Report Links: A Trader’s Guide To The Yen - March 15, 2019 Balance Of Payments Across The G10 - February 15, 2019 A Simple Attractiveness Ranking For Currencies - February 8, 2019 Australian Dollar Chart II-9AUD Technicals 1
AUD Technicals 1
AUD Technicals 1
Chart II-10AUD Technicals 2
AUD Technicals 2
AUD Technicals 2
Recent data in Australia have been improving: The NAB business confidence fell to 0 in March, but the business conditions component increased to 7. The February HIA new home sales increased by 1% month-on-month. Building permits in February increased by 19.1% month-on-month. Retail sales increased by 0.8% month-on-month in February. Trade balance came in at 4.8 million AUD in February. Legacy LNG projects almost guarantee trade surpluses for years to come. AUD/USD has been flat this week. On Tuesday, the RBA kept the interest rate unchanged at 1.5%, as was widely expected. AUD/USD is likely to form a floor if Chinese economic activity continues to improve and global industrial production picks up. Report Links: Into A Transition Phase - March 8, 2019 Balance Of Payments Across The G10 - February 15, 2019 A Simple Attractiveness Ranking For Currencies - February 8, 2019 New Zealand Dollar Chart II-11NZD Technicals 1
NZD Technicals 1
NZD Technicals 1
Chart II-12NZD Technicals 2
NZD Technicals 2
NZD Technicals 2
Recent data in New Zealand have been positive: The global dairy trade price index increased by 0.8% in April. ANZ commodity prices increased by 1.4% in March. NZD/USD fell by 1% this week. Despite positive terms of trade, NZD/USD is still trading at a 10%-15% premium above its fair value. New Zealand will be held hostage to the downturn in the Aussie economy. Meanwhile, a new dual mandate for the RBNZ makes it difficult to gauge whether its recent dovish shift is a one-off or more perpetual. Report Links: Balance Of Payments Across The G10 - February 15, 2019 A Simple Attractiveness Ranking For Currencies - February 8, 2019 Updating Our Intermediate Timing Models - November 2, 2018 Canadian Dollar Chart II-13CAD Technicals 1
CAD Technicals 1
CAD Technicals 1
Chart II-14CAD Technicals 2
CAD Technicals 2
CAD Technicals 2
Recent data in Canada have been mostly positive: GDP grew by 0.3% month-on-month in January, surprising to the upside. However, the Markit manufacturing PMI fell to 50.5 in March, from a previous reading of 52.8. USD/CAD rebounded after the plunge on positive Canadian GDP data, returning flat this week. On Monday, Governor Poloz gave a speech in Nunavut, highlighting slowing trade growth and the downside risks from trade wars. He stated that the economic outlook continues to warrant a policy rate that is well below the neutral range, and trade among provinces and territories should be promoted. Report Links: A Shifting Landscape For Petrocurrencies - March 22, 2019 Into A Transition Phase - March 8, 2019 Balance Of Payments Across The G10 - February 15, 2019 Swiss Franc Chart II-15CHF Technicals 1
CHF Technicals 1
CHF Technicals 1
Chart II-16CHF Technicals 2
CHF Technicals 2
CHF Technicals 2
Recent data in Switzerland have been strong: The KOF leading indicator increased to 97.4 in March. The February retail sales growth came in at -0.2% year-on-year, above the estimated -0.8%. Consumer price index came in higher than expected at 0.7% year-on-year. USD/CHF increased by 0.47% this week. While the inflation rate took a step closer towards the target rate, the uptick in investment sentiment and rising appetite for risk assets could be a headwind for the safe-haven franc. Report Links: Balance Of Payments Across The G10 - February 15, 2019 A Simple Attractiveness Ranking For Currencies - February 8, 2019 Waiting For A Real Deal - December 7, 2018 Norwegian Krone Chart II-17NOK Technicals 1
NOK Technicals 1
NOK Technicals 1
Chart II-18NOK Technicals 2
NOK Technicals 2
NOK Technicals 2
Recent data in Norway have been improving: Retail sales contracted by 1.3% month-on-month in February. However, the registered unemployment fell to 78.32k in March. The unemployment rate decreased to 2.4% accordingly. House prices increased by 3.2% year-on-year in March. The manufacturing PMI rose from 56.3 to 56.8 in March. USD/NOK fell by 0.3% this week. The Norwegian krone has been one of our favorite currencies, as it remains most responsive to crude oil prices. Our BCA house view is in favor of rising oil prices amid Iran and Venezuela sanctions and production cuts. Report Links: A Shifting Landscape For Petrocurrencies - March 22, 2019 Balance Of Payments Across The G10 - February 15, 2019 A Simple Attractiveness Ranking For Currencies - February 8, 2019 Swedish Krona Chart II-19SEK Technicals 1
SEK Technicals 1
SEK Technicals 1
Chart II-20SEK Technicals 2
SEK Technicals 2
SEK Technicals 2
Recent data in Sweden have been better than expected: The manufacturing PMI came in at 52.8 in March, slightly higher than 52.7 in February. USD/SEK has been flat this week. The Swedish krona is still trading below its one sigma band of fair value. A brighter picture for the euro area could improve trade conditions for Sweden. Our short USD/SEK position is now 1.84% in the money since initiated. Report Links: Balance Of Payments Across The G10 - February 15, 2019 A Simple Attractiveness Ranking For Currencies - February 8, 2019 Global Liquidity Trends Support The Dollar, But... - January 25, 2019 Trades & Forecasts Forecast Summary Core Portfolio Tactical Trades Closed Trades