China

Highlights China’s trade strategy toward the U.S. is not greatly affected by the early U.S. Democratic Party primary election. The sea change in American policy toward China began before Donald Trump and is grounded in U.S. grand strategy. Yet Trump is staging a tactical retreat in his trade war and China is reciprocating, suggesting that Beijing would rather avoid a “lame duck” Trump on the warpath. Beijing will not implement structural changes that would vindicate Trump’s negotiating strategy and set a precedent that is harmful to China’s national interests in the long run. Feature A U.S.-China trade ceasefire is in the works, based on the outcome of the latest high-level talks in Washington. President Trump, paying a surprise visit to the top Chinese negotiator, Vice Premier Liu He, agreed to pause the October 15 tariff hike in exchange for assurances that China would buy $40-$50 billion worth of agricultural goods to ease the economic pressure on Trump’s political base. Trump is now confirmed to attend the Asia Pacific Economic Cooperation summit in Santiago, Chile on November 16-17, where he hopes to cement this “phase one deal” with Chinese President Xi Jinping. Chart 1Global Policy Uncertainty To Fall
Global Policy Uncertainty To Fall
Global Policy Uncertainty To Fall
Our market-based GeoRisk Indicator for Taiwan island – which calculates Taiwanese political risk based on any excessive deviation of the Taiwanese dollar from economic fundamentals – is a good proxy for Sino-American trade tensions due to Taiwan’s high level of exposure to China and the United States. At the moment it is signaling a sharp drop in tensions. We expect global uncertainty to follow over the coming month as Trump and Xi agree to some kind of ceasefire (Chart 1). Our Taiwan risk measure tracks closely with the Global Economic Policy Uncertainty Index, which measures risk via the word count of key terms in influential global newspapers, because Taiwan is highly exposed to the world economy and trade. Taiwan is also uniquely vulnerable to the biggest source of global policy uncertainty today: the Sino-American trade war. Not only are U.S.-China relations slightly thawing, but also the risk of the U.K. leaving the EU without a withdrawal agreement has collapsed. This will reinforce Europe’s underlying political stability despite the manufacturing recession and help create a drop in global uncertainty (Chart 2). Chart 2American Policy Uncertainty To Buck The Trend
American Policy Uncertainty To Buck The Trend
American Policy Uncertainty To Buck The Trend
Uncertainty will remain elevated beyond the fourth quarter, however, for two main reasons. First, U.S. uncertainty will rise, not fall, as a result of the impending 2020 election. Second, the trade ceasefire is highly unlikely to resolve the slate of disagreements and underlying strategic distrust plaguing U.S.-China relations. This will cap the rebound we expect in global business sentiment. How can we be so sure that the U.S. and China will not strike a historic deal? We answer this question in this report, with particular reference to an important corollary question that has emerged in numerous client meetings: wouldn’t China rather deal with the “transactional” Trump than an “ideological” President Elizabeth Warren? Trump Is Not A “Lame Duck” Yet, Hence The Ceasefire President Trump is a uniquely commercial president. He did not become president through experience in military or government, but because he was a bold businessman who claimed he could negotiate better deals for the United States, including on immigration and trade. So he is even more vulnerable to an economic downturn than the average U.S. president. Industrial production, manufacturing, and core capital goods new orders are contracting, and sentiment is souring among both business leaders and average consumers (Chart 3). Trump faces a distinct risk that the manufacturing slowdown and psychological effects will morph into a general slowdown. Even if not outrightly recessionary, a generalized slowdown in the U.S. economy could easily lead to rising unemployment during the election year, which would all but ensure Trump’s loss of the White House. The degree of correlation between presidential approval and the unemployment rate fluctuates over time, but our survey of post-World War II presidents shows that the unemployment rate is the best indicator of the direction the approval rating will ultimately go by the end of the term in office. While Trump’s approval is highly correlated with unemployment, it is also very low – resembling President Obama’s at this point in his first term. Yet that was in the aftermath of the Great Recession, and Trump’s approval is declining as a result of the impeachment inquiry into his alleged attempt to convince Ukraine to interfere in the 2020 election in his favor. And his approval is low despite an incredibly low rate of unemployment, at 3.5%, that can hardly get better (Chart 4). Chart 3Trump Needs A Sentiment Boost For 2020
Trump Needs A Sentiment Boost For 2020
Trump Needs A Sentiment Boost For 2020
Chart 4Rising Unemployment Would Doom Trump 2020
Rising Unemployment Would Doom Trump 2020
Rising Unemployment Would Doom Trump 2020
In short, Trump has very little wiggle room. To be reelected he must not only keep unemployment from rising much, but also achieve some other policy wins in order to draw closer to the average approval rate among post-World War II presidents (top panel, Chart 5). Even the Republican-friendly pollster Rasmussen shows that Trump’s general approval is dangerously eroding (bottom panel, Chart 5). One way Trump can achieve a political and economic victory would be to agree to a trade deal with China.
Chart 5
One clear way to achieve a policy victory and a boost to the economy would be to agree to a trade deal with China. Passing the U.S.-Mexico-Canada Agreement through Congress is out of his control. Policy toward China, by contrast, is entirely within his control. Just as he raised the tariffs unilaterally, so he can roll them back unilaterally to encourage the financial markets and CEO confidence – as long as talks are making progress. The downside of this argument is that if Trump becomes a “lame duck,” with a falling economy and/or approval rating virtually ensuring that he cannot get reelected, he is no longer constrained by financial markets or the economy. He would have an incentive to initiate “Cold War 2.0” with China right here and now – or some other foreign conflict – and encourage Americans to rally around the flag amid a historic confrontation with a foreign enemy. This is a huge risk to the 2020 outlook, but it runs afoul of the economic constraint, so we expect Trump to try the “Art of the Deal” one last time. What about impeachment? When the House of Representatives brings formal impeachment articles against Trump, the Senate will hold the trial. Republicans have a 53-47 majority in the Senate, requiring 20 to defect against the president to generate the 67 votes needed to make him the first president in U.S. history to be removed from office in this way. A total of 16 senators hail from states that Trump won by less than 10% in the 2016 election – so 20 defectors is a strong political constraint.
Chart 6
Unless, of course, grassroots Republican support for Trump collapses. Right now it is falling but in line with the average (top panel, Chart 6). Republicans are not warming to the idea of impeachment and removal from office (middle panel, Chart 6). We will reassess the risk of removal if Trump’s intra-party approval heads further south and begins to look like Richard Nixon’s (bottom panel, Chart 6). Bear in mind that the election is one year away – it is easier for Republicans to kick the decision over to voters than to remove one of their own from the Oval Office. A scandal big enough to prompt an exodus of Republican support will doom any chances of Republicans retaining the White House through Vice President Mike Pence or other candidates. Bottom Line: Trump’s approval rating is in dangerously low territory but he is not yet a “lame duck” freed from the shackles of political and economic constraints. He still has a shot at extending the business cycle and saving his election campaign. This is driving him to retreat from tariffs and pursue a trade ceasefire with China. The result should be a decline in global policy uncertainty in Q4. However, this decline will not last long, as American uncertainty will skyrocket during the election year and U.S.-China tensions will reemerge once the economic constraint has been reduced. China Will Accept A Ceasefire In a special report in these pages in August, we raised a critical question: if Trump is forced to retreat from his trade war, will President Xi Jinping reciprocate? Or will he refuse to bargain, leaving Trump overextended to suffer the negative economic repercussions of the trade war without the political benefit of striking a new deal? We now have our answer, at least for the near term. China resumed negotiations in October and has confirmed that progress was made. Beijing is continuing to offer some accommodation of U.S. demands in both domestic and foreign policy (e.g. financial sector opening, enforcement of sanctions on Iran). In Hong Kong SAR, not only has Beijing avoided a violent intervention and suppression of civilian protesters, but there are rumors that Chief Executive Carrie Lam is on the way out by March (which we find highly plausible). There are still plenty of risks across the broad range of U.S.-China disputes, but from the past month’s developments we can infer that President Xi is not going on the offensive in order to destroy Trump’s latest “deal-making” bid. How far will Xi go to accommodate Trump? Not so far as to implement major structural concessions. And this will limit the positive impact of the deal. Xi does not face an electoral constraint, or the loss of office (having removed term limits), nor does he face a domestic political constraint on a 12-month time frame (the twentieth national party congress is not until 2022). Economically China is much more vulnerable – this is a valid constraint. But tariffs do not force Beijing to make major structural concessions and implement them rapidly, certainly not on Trump’s time frame. The economy is slowing but not plummeting (Chart 7). China does not face conditions like 2015-16 and policymakers have decided it is best to save ammunition in case they need to use “bazooka” stimulus later. Chart 7China's Economy Holding Up
China's Economy Holding Up
China's Economy Holding Up
Chart 8China Not Reflating Property Bubble (Yet)
China Not Reflating Property Bubble (Yet)
China Not Reflating Property Bubble (Yet)
The fact that Beijing has maintained restrictions on the property sector and not allowed reflation to fuel the property bubble (Chart 8) underscores the current policy disposition: some parts of the economy need to be shored up but there is no need to panic. When it comes to tariffs, China ultimately has the option of depreciating the currency to offset the impact. The fact that the CNY-USD exchange rate has not fallen as far as the headline tariff numbers suggest it should fall indicates that Beijing is still maintaining a negotiation rather than letting the currency absorb the full impact (Chart 9). Chart 9China Can Depreciate To Offset Tariffs
China Can Depreciate To Offset Tariffs
China Can Depreciate To Offset Tariffs
Since China is still capable of “irrigation-style” fiscal stimulus, the economic constraint can be mitigated further. Beijing can continue to fight if Trump returns to the offensive. Hence we do not expect major new trade concessions beyond what is already on the table – and many of the current offerings consist of promises more so than concrete actions (Table 1).
Chart
Chart 10Beijing Throws Trump A Bone
Beijing Throws Trump A Bone
Beijing Throws Trump A Bone
We do expect China to try to avoid the worst-case scenario, since it would be destabilizing for China’s medium and long-term economy and single-party rule. Stimulus will increase as necessary to ensure that growth rebounds as Beijing seeks to improve the job market and manufacturing sector. And this also supports the logic for agreeing to a ceasefire with Trump. That China is reciprocating is apparent from the U.S.’s rebounding market share in China’s agricultural imports (Chart 10). The relevant constraint for China is that Trump could be rendered a “lame duck” and go ballistic on China, activating the full slate of threats – from high-tech export controls, to banking sanctions, to capital controls. The U.S. is still the more powerful nation in absolute terms, with enormous financial, economic, military, and technological leverage over China. Beijing also sees the danger in deliberately thwarting Trump only to have him somehow win reelection. He would then have a renewed passion for punitive measures, yet he would lack the first term’s electoral constraints. Hence there is a clear basis for President Xi to accept Trump’s tactical trade retreat. Bottom Line: President Xi does not face an imminent domestic political constraint, which gives him greater leverage than President Trump. Nevertheless he does face short term economic pressures, and enough of a geopolitical and economic constraint from a full-blown escalation of tensions to accept Trump’s offer of a ceasefire. Wouldn’t China Rather Deal With Trump Than Warren? What about the upside risk? What are the chances that Xi offers additional concessions – structural concessions – in order to achieve a groundbreaking deal with the American president? A grand compromise will not occur. Republicans and Communist Party leaders have a history of such deals, which pave the way for a new multi-year stint of deepening bilateral economic engagement. We have a high conviction view that such a grand compromise will not occur. But could the U.S. 2020 election change China’s calculus? In particular, wouldn’t China prefer to deal with Trump than Senator Elizabeth Warren? More and more investors are asking this last question as the early U.S. Democratic Party primary election heats up. Warren is a democratic progressive who aims to revolutionize U.S. trade policy to promote human rights, organized labor, and strict environmental standards. She is seen as more “ideological,” whereas Trump is more “transactional” – i.e. willing to make business tradeoffs while staying away from sensitive issues affecting China’s internal affairs. Moreover Trump is a known quantity, whereas Warren would represent an unknown – a progressive populist as president and another revolution in U.S. policy, reducing predictability for Beijing. Our assessment is that the U.S. election process is too early and too uncertain to serve as a driver of Beijing’s trade negotiating strategy over the fourth quarter. Moreover there is not a clear basis for China to favor Trump to Warren. Chart 11Trade Dispute Precedes Trump
Trade Dispute Precedes Trump
Trade Dispute Precedes Trump
There are three major trends to bear in mind: The sea change in U.S. policy toward China began under the Obama administration. President Obama entered office by slapping tire tariffs on Beijing. He endorsed Congress’s “Buy American” provisions in the fiscal stimulus package to fight the Great Recession. Under his administration, the U.S. effectively capped steel imports from China (Chart 11). The Obama administration orchestrated the “Pivot to Asia,” a diplomatic and military initiative to rebalance U.S. strategic commitment to focus on China and the western Pacific more than the Middle East. This included the Trans-Pacific Partnership (TPP), an advanced trade deal that deliberately excluded China. It eventually also included a robust reassertion of U.S. maritime supremacy via bulked up Freedom of Navigation Operations (FONOPs) in the South China Sea, a critical global sea lane where Beijing had become increasingly assertive (Diagram 1).
Chart
Chart 12U.S.-China THAAD Dispute Under Obama
U.S.-China THAAD Dispute Under Obama
U.S.-China THAAD Dispute Under Obama
The Obama administration’s attempt to install the Terminal High Altitude Area Defense (THAAD) missile defense system in South Korea caused a strategic showdown with China, emblematized by Chinese sanctions against the Korean economy (Chart 12). Obama’s one major policy handover to President Trump was to focus attention on North Korea’s advancing nuclear weaponization and missile capabilities – another source of friction with China. There can be little doubt that if the Democrats win the 2020 election, they will return to some or all of these policies. But this says more about U.S. national policy than it does about which political party China should favor in 2020, because … 2. The Trump administration is unpredictable and disruptive to both the global status quo and China’s economy. President Trump’s significance is that he shifted the Republican Party from its traditional pro-corporate, pro-free trade, pro-China orientation to a more populist, protectionist, and China-bashing approach. He stole the thunder of protectionist Democrats in the manufacturing heartland. He continued the pivot to Asia, albeit by another name (a “free and open Indo-Pacific”). This approach emphasized coercive unilateral “hard power” rather than multilateral “soft power” and resulted in a negative impact on China’s economy. This change, while it has pros and cons, demonstrates that a harder line on China has policy consensus across administrations. Few doubt that this is the new bipartisan consensus in Washington. Trump has executed this policy shift in a way that is fundamentally unsettling and unpredictable for China: sweeping unilateral tariffs against China on national security grounds (Chart 13); sanctions on tech companies critical for China’s economic future (Chart 14); and tightening relations with Taiwan. This policy eschews traditional diplomacy, which is where China thrives, and it unsettles global supply chains, where China once enjoyed centrality. To some extent Trump is even prisoner to his own logic: as he softens policy to get a trade ceasefire, he faces challenges from Congress on everything from tech export controls to Hong Kong human rights to Chinese corporate listings on U.S. stock exchanges. The Democrats will accuse him of caving to China if he agrees to a deal. Still, if China were to grant Trump deep trade concessions, it would effectively vindicate Trump’s approach. Future American presidents could always threaten across-the-board tariffs whenever they want to extract rapid structural changes from China’s policymakers. This is an intolerable precedent to set. A hard line on China has policy consensus across U.S. administrations. Chart 13Trump's Trade Policy Highly Disruptive
Trump's Trade Policy Highly Disruptive
Trump's Trade Policy Highly Disruptive
Chart 14China's Tech Sector Under Threat
China's Tech Sector Under Threat
China's Tech Sector Under Threat
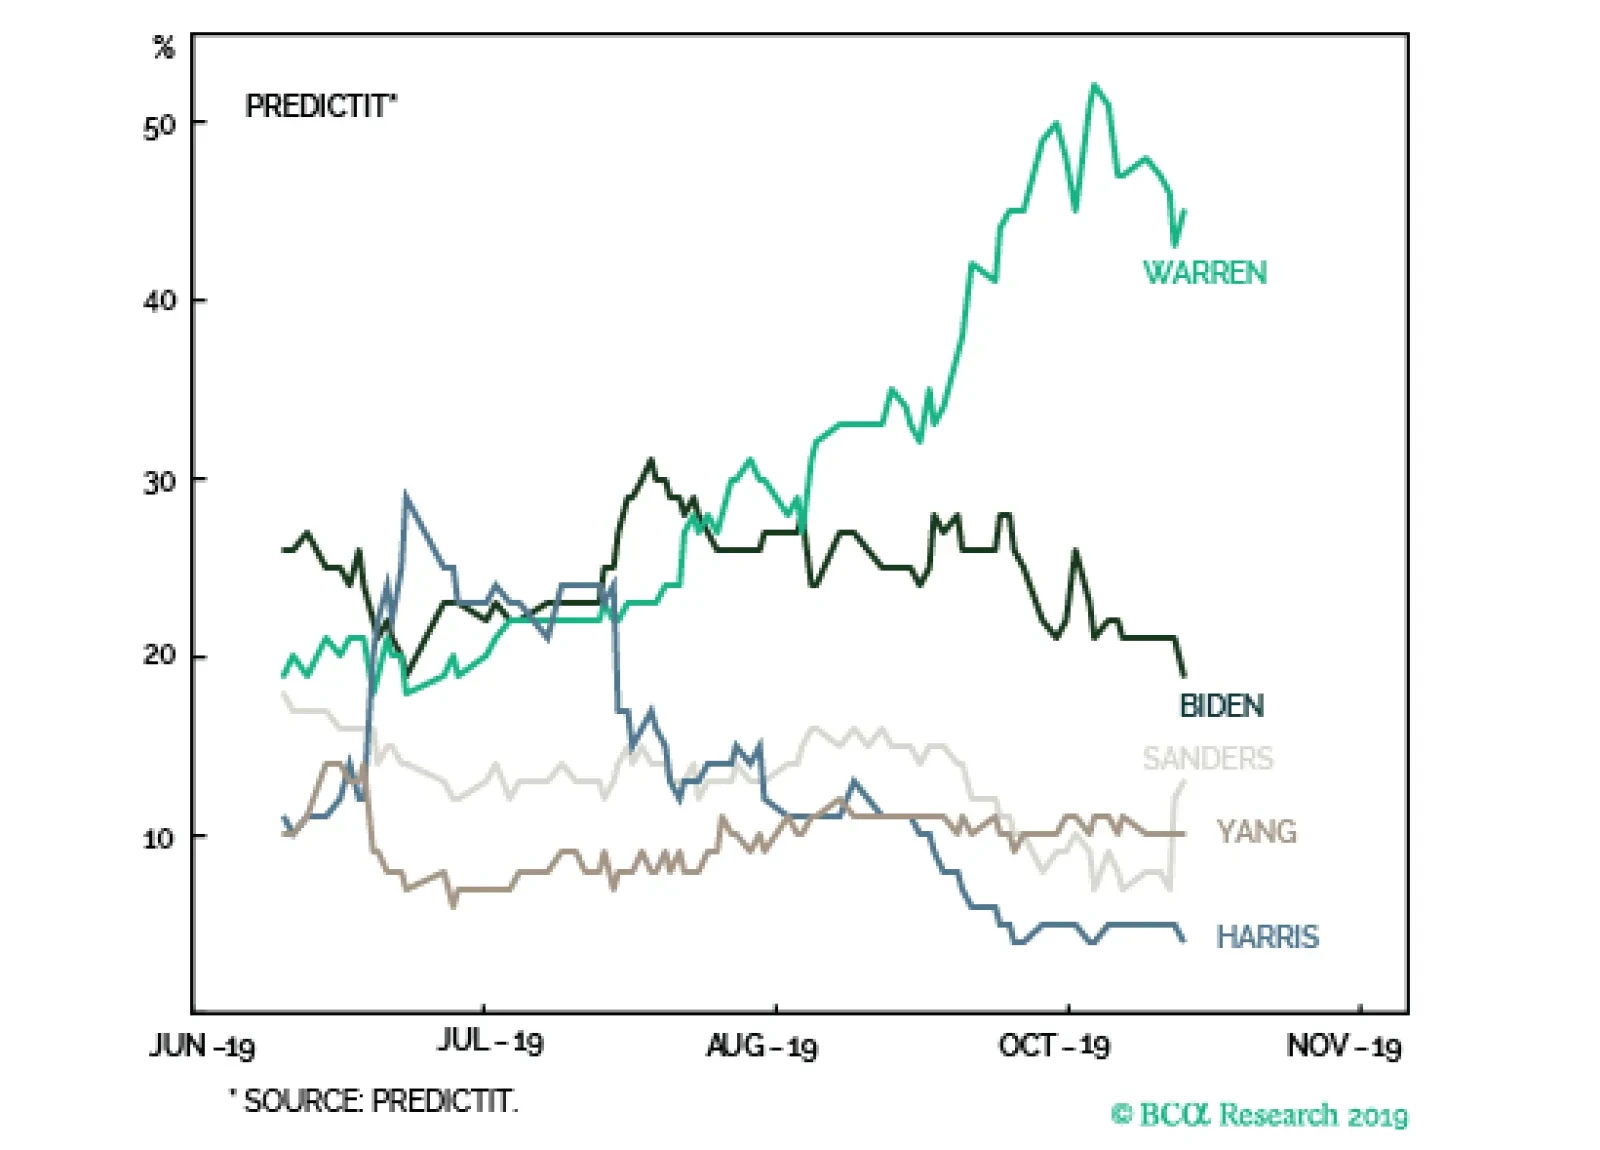
3. China cannot predict the outcome of U.S. primary or general elections. No one knows who will win the Democratic Party’s primary election. Joe Biden is the frontrunner and has clear advantages in terms of electability versus Trump. But Elizabeth Warren is gaining on him and her chief progressive rival, Senator Bernie Sanders of Vermont, is likely to continue flagging in the polls and feeding her rise due to his ill health. It is highly unlikely that Xi Jinping will make decisions regarding a ceasefire with Trump, as early as next month, based on up-and-down developments in a primary election that has not technically even begun (the first vote is in February). Once Biden or Warren have clinched the nomination, it is not clear who will win in November 2020. President Trump narrowly seized the electoral college in 2016 and the risks to his reelection are extreme, as outlined above. Yet he is the incumbent and BCA Research does not expect a recession next year, which should create a baseline case of reelection. Meanwhile Biden’s debate performances and polling are lackluster, despite being the establishment pick and front runner. Warren’s far-left ideology is a liability, although she is at least capable of beating Trump. Chinese policymakers will assess the developments, but Beijing will conduct strategy to be prepared for any outcome. Summing up the above, all that China knows for certain is that Trump is the current standard-bearer of a broader sea change in the Republican Party and Washington. The new consensus is broadly antagonistic toward China’s growing global influence. Hence China is preparing for “protracted struggle” regardless of whether Trump or a Democrat sits in the Oval Office after 2020. The logical conclusion is to continue negotiating with Trump, and offer some concessions to maintain credibility, but not to capitulate to his gunboat diplomacy. Finally, there are a two key arguments that work against the argument that China prefers Warren to Trump: Democrats will need time to build a multilateral anti-China coalition: Trump’s greatest mistake in the trade war is arguably his failure to form a “coalition of the willing” among western nations to take on China’s mercantilist trade practices together. Chart 15Trump Missed Chance To Build Grand Coalition
Trump Missed Chance To Build Grand Coalition
Trump Missed Chance To Build Grand Coalition
Such a coalition would have represented a much greater economic constraint for Chinese leaders (Chart 15), making structural concessions more likely. A future Democratic president would have better luck in galvanizing such a coalition. Thus, by favoring Trump, Beijing could perpetuate the division between “America First” and “the liberal Western order.” Yet western nations will still be reluctant to confront China and it will take years of diplomacy to build such a concerted effort. These are years in which China can improve its economic self-sufficiency and use diplomacy to undermine western cohesion. By contrast, a second-term Trump could pursue punitive measures immediately (beyond tariffs) and could also pursue more western alignment, for instance on tech sanctions. A Chinese policy focused on overall stability would not clearly prefer the latter. As for a Warren presidency, her trade policy has more in common with Trump’s than with Biden’s or the status quo. It is not at all clear that she would be able to unify the West against China on the issue of trade. Hence there is no clear advantage to China of preferring Trump. Biden is probably a greater threat to China on this front, since he would “renegotiate” (i.e. rejoin) the Trans-Pacific Partnership, and court the Europeans, while likely maintaining Obama’s line on China. Yet Biden is viewed as the most pro-China candidate of all. In short, trade policy is a wash from China’s point of view. The U.S. has already taken a more protectionist turn. From China’s view, the U.S. as a whole has taken a protectionist turn. Democrats will not prioritize China: Trump will be unshackled from concerns about bear markets and recessions if he is reelected to a second term due to the two-term limit. Warren would enter as a first-term president and would therefore face the reelection constraint that has hindered Trump’s own trade policy. If Trump loses, Warren faces an implicit threat should she clash with China. Chart 16Market Sees Warren As Health Care Risk
Market Sees Warren As Health Care Risk
Market Sees Warren As Health Care Risk
Warren will also, like President Obama, spend the majority of her first term engrossed in an ambitious domestic policy agenda. Her policy priority is a universal single-payer health care system, which is a much more dramatic undertaking than Biden’s proposal of restoring and enhancing Obamacare, which is why health sector equities are sensitive to Warren’s election chances (Chart 16). Obama did not devote his full attention to Iran and China until his second term, and it is normal for the second term to be the “foreign policy term” due to the absence of electoral constraints. Several of Warren’s policy priorities would also be more favorable to China. In particular, Warren’s desire to impose tougher restrictions on U.S. financials, energy companies, and tech companies is broadly beneficial to China’s efforts to create globally competitive champions. At the same time, Trump is more likely to continue the buildup in U.S. military spending, which, combined with the unlikelihood that Trump will ultimately abandon U.S. allies in Asia, poses a strategic threat for China (Chart 17). China cannot calculate its trade negotiations according to the ups and downs of volatile U.S. politics. Instead it has an incentive to play both sides: to give Trump promises while hesitating to implement them, so as not to render him a dangerous “lame duck” (Chart 18) but also not to gift-wrap the election for him. Chart 17Trump's Military Buildup
Trump's Military Buildup
Trump's Military Buildup
Chart 18
The one thing that can be expected over the next two years is that China will try to maintain economic stability to attract Europe and Asia deeper into its orbit. This means incrementally more stimulus, as mentioned above. China cannot allow itself to risk debt-deflation while encouraging other economies to become less reliant on Chinese demand. Bottom Line: China cannot predict the future. Its best play is to try to undermine the emerging U.S. policy consensus to be tough on China. This means agreeing to a ceasefire to pacify Trump without giving him major structural concessions that improve his chances of reelection. If he loses, future presidents will be afraid of tackling China aggressively. If he wins, yes, China can try to exploit his “America First” policy to keep the U.S. divided within itself and with the rest of the West. If a Democrat wins, China will have set a precedent that gunboat diplomacy fails. It can try to bind the Democrat to the Trump ceasefire terms. If the Democrats tear up the deal then China will have a basis to begin negotiations as an aggrieved party. Investment Conclusions The problem for President Trump is that a weak, short-term ceasefire – in which China does not verifiably implement structural concessions and the threat of “tech war” continues to loom – will not have as positive of an impact on global and American economic sentiment as Trump hopes. Moreover it could collapse under the weight of Sino-American strategic distrust in areas outside trade. Thus while we expect global policy uncertainty to drop off – as we outlined at the beginning of this report – we expect the reduction to be moderate rather than dramatic and not to last all the way to the U.S. election. Our colleagues Bob Ryan and Hugo Belanger have demonstrated that a rise in global policy uncertainty is correlated with a rise in the trade weighted dollar (Chart 19). If uncertainty falls, it will help the dollar ease, which improves global financial conditions and cultivates a rebound in global growth and trade. Chart 19Policy Uncertainty Boosts The Dollar
Policy Uncertainty Boosts The Dollar
Policy Uncertainty Boosts The Dollar
Chart 20Falling Uncertainty Hurts US Outperformance
Falling Uncertainty Hurts US Outperformance
Falling Uncertainty Hurts US Outperformance
This is corroborated by the U.S. trade policy uncertainty index, which reinforces not only the point about the dollar but also the implication that global equities can begin to outperform U.S. equities (Chart 20). With trade sentiment recovering, and U.S. domestic political risk rising due to the election, there is a basis for equity rotation. This assumes that China’s growth does incrementally improve, as we expect. Matt Gertken Geopolitical Strategist mattg@bcaresearch.com
Highlights The U.S. and China are moving toward formalizing a trade ceasefire that reduces geopolitical risk in the near term. The risk of a no-deal Brexit is finished – removing a major downside to European assets. Spanish elections reinforce our narrative of general European political stability. Go long 10-year Italian BTPs / short 10-year Spanish bonos for a trade. Geopolitical risks will remain elevated in Turkey, rise in Russia, but remain subdued in Brazil. A post-mortem of Canada’s election suggests upside to fiscal spending but further downside to energy sector investment over the short to medium term. Feature After a brief spike in trade war-related geopolitical risk just prior to the resumption of U.S.-China negotiations, President Trump staged a tactical retreat in the trade war. Chart 1Proxy For Trade War Shows Falling Risk
Proxy For Trade War Shows Falling Risk
Proxy For Trade War Shows Falling Risk
Negotiating in Washington, President Trump personally visited the top Chinese negotiator Liu He and the two sides announced an informal “phase one deal” to reverse the summer’s escalation in tensions: China will buy $40-$50 billion in U.S. agricultural goods while the U.S. will delay the October 15 tariff hike. More difficult issues – forced tech transfer, intellectual property theft, industrial subsidies – were punted to later. The RMB is up 0.7% and our own measures of trade war-related risk have dropped off sharply (Chart 1). We think these indicators will be confirmed and Trump’s retreat will continue – as long as he has a chance to save the 2020 economic outlook and his reelection campaign. Odds are low that Trump will be removed from office by a Republican-controlled senate – the looming election provides the republic with an obvious recourse for Trump’s alleged misdeeds. However, Trump’s approval rating is headed south. While it is around the same level as President Obama’s at this point in his first term, Obama’s started a steep and steady rise around now and ended above 50% for the election, a level that is difficult to foresee for Trump (Chart 2). So Trump desperately needs an economic boost and a policy victory to push up his numbers. Short of passing the USMCA, which is in the hands of the House Democrats, a deal with China is the only way to get a major economic and political win at the same time. Hence the odds of Presidents Trump and Xi actually signing some kind of agreement are the highest they have been since April (when we had them pegged at 50/50). Trump will have to delay the December 15 tariff hike and probably roll back some of the tariffs over next year as continuing talks “make progress,” though we doubt he will remove restrictions on tech companies like Huawei. Still, we strongly believe that what is coming is a détente rather than the conclusion of the Sino-American rivalry crowned with a Bilateral Trade Agreement. Strategic tensions are rising on a secular basis between the two countries. These tensions could still nix Trump’s flagrantly short-term deal-making, and they virtually ensure that some form of trade war will resume in 2021 or 2022, if indeed a ceasefire is maintained in 2020. Both sides are willing to reduce immediate economic pain but neither side wants to lose face politically. Trump will not forge a “grand compromise.” Our highest conviction view all along has been – and remains – that Trump will not forge a “grand compromise” ushering in a new period of U.S.-China economic reengagement in the medium or long term. China’s compliance, its implementation of structural changes, will be slow or lacking and difficult to verify at least until the 2020 verdict is in. This means policy uncertainty will linger and business confidence and capex intentions will only improve on the margin, not skyrocket upward (Chart 3). Chart 2Trump Needs A Policy Win And Economic Boost
How Much To Buy An American President? – GeoRisk Update: October 25, 2019
How Much To Buy An American President? – GeoRisk Update: October 25, 2019
Chart 3Sentiment Will Improve ... Somewhat
Sentiment Will Improve ... Somewhat
Sentiment Will Improve ... Somewhat
The problem for bullish investors is that even if global trade uncertainty falls, and the dollar’s strength eases, fear will shift from geopolitics to politics, and from international equities to American equities (Chart 4). Trump, hit by impeachment and an explosive reaction to his Syria policy, is entering into dangerous territory for the 2020 race. Trump’s domestic weakness threatens imminent equity volatility for two reasons. Chart 4American Outperformance Falls With Trade Tensions
bca.gps_wr_2019_10_25_c4
bca.gps_wr_2019_10_25_c4
Chart 5Democratic Win In 2020 Is Market-Negative
Democratic Win In 2020 Is Market-Negative
Democratic Win In 2020 Is Market-Negative
First, if Trump’s approval rating falls below today’s 42%, investors will begin pricing a Democratic victory in 2020, i.e. higher domestic policy uncertainty, higher taxes, and the re-regulation of the American economy (Chart 5). This re-rating may be temporarily delayed or mitigated by the fact that former Vice President Joe Biden is still leading the Democratic Party’s primary election race. Biden is a known quantity whose policies would simply restore the Obama-era status quo, which is only marginally market-negative. Contrary to our expectations Biden's polling has not broken down due to accusations of foul play in Ukraine and China. Nevertheless, Senator Elizabeth Warren will gradually suck votes away from fellow progressive Senator Bernie Sanders and in doing so remain neck-and-neck with Biden (Chart 6). When and if she pulls ahead of Biden, markets face a much greater negative catalyst. (Yes, she is also capable of beating Trump, especially if his polling remains as weak as it is.) Chart 6Warren Will Rise To Front-Runner Status With Biden
How Much To Buy An American President? – GeoRisk Update: October 25, 2019
How Much To Buy An American President? – GeoRisk Update: October 25, 2019
Second, if Trump becomes a “lame duck” he will eventually reverse the trade retreat above and turn into a loose cannon in his final months in office. Right now we see a decline in geopolitical risk, but if the economy fails to rebound or the China ceasefire offers little support, then Trump will at some point conclude that his only chance at reelection is to double down on his confrontation with America’s enemies and run as a “war president.” A cold war crisis with China, or a military confrontation with Iran (or North Korea, Venezuela, or some unexpected target) could occur. But since September we have been confirmed in believing that Trump is trying to be the dealmaker one last time before any shift to the war president. Bottom Line: The “phase one” trade deal is really just a short-term ceasefire. Assuming it is signed by Trump and Xi, it suggests no increase in tariffs and some tariff rollback next year. However, as recessionary fears fade, and if Trump’s reelection chances stabilize, U.S.-China tensions on a range of issues will revive – and there is no getting around the longer-term conflict between the two powers. For this and other reasons, we remain strategically short RMB-USD, as the flimsy ceasefire will only briefly see RMB appreciation. BoJo's Brexit Bluff Is Finished Our U.K. indicator captured a sharp decline in political risk in the past two weeks and our continental European indicators mirrored this move (Chart 7). The risk that the U.K. would fall out of the EU without a withdrawal agreement has collapsed even further than in September, when parliament rejected Prime Minister Boris Johnson’s no-deal gambit and we went long GBP-USD. We have since added a long GBP-JPY trade. Chart 7Collapse In No-Deal Risk Will Echo Across Europe
Collapse In No-Deal Risk Will Echo Across Europe
Collapse In No-Deal Risk Will Echo Across Europe
Chart 8Unlikely To See Another Tory/Brexit Rally Like This
Unlikely To See Another Tory/Brexit Rally Like This
Unlikely To See Another Tory/Brexit Rally Like This
The risk of “no deal” is the only reason to care about Brexit from a macro point of view, as the difference between “soft Brexit” and “no Brexit” is not globally relevant. What matters is the threat of a supply-side shock to Europe when it is already on the verge of recession. With this risk removed, sentiment can begin to recover (and Trump’s trade retreat also confirms our base case that he will not impose tariffs on European cars on November 14). Since Brexit was the only major remaining European political risk, European policy uncertainty will continue to fall. The Halloween deadline was averted because the EU, on the brink of recession, offered a surprising concession to Johnson, enabling him to agree to a deal and put it up for a vote in parliament. The deal consists of keeping Northern Ireland in the European Customs Union but not the whole of the U.K., effectively drawing a new soft border at the Irish Sea. The bill passed the second reading but parliament paused before finalizing it, rejecting Johnson’s rapid three-day time table. The takeaway is that even if an impending election returns Johnson to power, he will seek to pass his deal rather than pull the U.K. out without a deal. This further lowers the odds of a no-deal Brexit as it illuminates Johnson's preferences, which are normally hidden from objective analysis. True, there is a chance that the no-deal option will reemerge if Johnson’s deal totally collapses due to parliamentary amendments, or if the U.K. and EU have failed to agree to a future relationship by the end of the transition period on December 31, 2020 (which can be extended until the end of 2022). However, the chance is well below the 30% which we deemed as the peak risk of no-deal back in August. Johnson created the most credible threat of a no-deal exit that we are likely to see in our lifetimes – a government with authority over foreign policy determined to execute the outcome of a popular referendum – and yet parliament stopped it dead in its tracks. Johnson does not want a no-deal recession and his successors will not want one either. After all, the support for Brexit and for the Tories has generally declined since the referendum, and the Tories are making a comeback on the prospect of an orderly Brexit (Chart 8). All eyes will now turn toward the impending election. Opinion polls still show that Johnson is likely to be returned to power (Chart 9). The Tories have a prospect of engrossing the pro-Brexit vote while the anti-Brexit opposition stands divided. No-deal risk only reemerges if the Conservatives are returned to power with another weak coalition that paralyzes parliament. Chart 9Tory Comeback As BoJo Gets A Deal
Tory Comeback As BoJo Gets A Deal
Tory Comeback As BoJo Gets A Deal
Chart 10Brexit Means Greater Fiscal Policy
Brexit Means Greater Fiscal Policy
Brexit Means Greater Fiscal Policy
Whatever the election result, we maintain our long-held position that Brexit portends greater fiscal largesse (Chart 10). The agitated swath of England that drove the referendum result will not be assuaged by leaving the European Union – the rewards of Brexit are not material but philosophical, so material grievances will return. Voter frustration will rotate from the EU to domestic political elites. Voters will demand more government support for social concerns. Johnson’s own government confirms this point through its budget proposals. A Labour-led government would oversee an even more dramatic fiscal shift. Our GeoRisk indicator will fall on Brexit improvements but the question of the election and next government will ensure it does not fall too far. Our long GBP trades are tactical and we expect volatility to remain elevated. But the greatest risk, of no deal, is finished, so it does make sense for investors with a long time horizon to go strategically long the pound. The greatest risk, of a no deal Brexit, is finished. Bottom Line: Brexit posed a risk to the global economy only insofar as it proved disorderly. A withdrawal agreement by definition smooths the process. Continental Europe will not suffer a further shock to net exports. The Brexit contribution to global policy uncertainty will abate. The pound will rise against the euro and yen and even against the dollar as long as Trump’s trade retreat continues. Spain: Further Evidence Of European Stability We have long argued that the majority of Catalans do not want independence, but rather a renegotiation of the region's relationship with Spain (Chart 11). This month’s protests in Barcelona following the Catalan independence leaders’ sentencing are at the lower historical range in terms of size – protest participation peaked in 2015 along with support for independence (Table 1). Table 1October Catalan Protests Unimpressive
How Much To Buy An American President? – GeoRisk Update: October 25, 2019
How Much To Buy An American President? – GeoRisk Update: October 25, 2019
Our Spanish risk indicator is showing a decline in political risk (Chart 12). However, we believe that this fall is slightly overstated. While the Catalan independence movement is losing its momentum, the ongoing protests are having an impact on seat projections for the upcoming election. Chart 11Catalonians Not Demanding Independence
Catalonians Not Demanding Independence
Catalonians Not Demanding Independence
Chart 12Right-Wing Win Could Surprise Market, But No Worries
Right-Wing Win Could Surprise Market, But No Worries
Right-Wing Win Could Surprise Market, But No Worries
Since the April election, the right-wing bloc of the People’s Party, Ciudadanos, and Vox has been gaining in the seat projections at the expense of the Socialist Party and Podemos. Over the course of the protests, the left-wing parties’ lead over the right-wing parties has narrowed from seven seats to one (Chart 13). If this momentum continues, a change of government from left-wing to right-wing becomes likely. However, a right-wing government is not a market-negative outcome, and any increase in risk on this sort of election surprise would be short-lived. The People’s Party has moderated its message and focused on the economy. Besides pledging to limit the personal tax rate to 40% and corporate tax rate to 20%, the People’s Party platform supports innovation, R&D spending, and startups. The party is promising tax breaks and easier immigration rules to firms and employees pursuing these objectives. Chart 13Spanish Right-Wing Parties Narrow Gap With Left
How Much To Buy An American President? – GeoRisk Update: October 25, 2019
How Much To Buy An American President? – GeoRisk Update: October 25, 2019
Another outcome of the election would be a governing deal between PSOE and Podemos, along with case-by-case support from Ciudadanos. After a shift to the right lost Ciudadanos 5% in support since the April election, leader Albert Rivera announced in early October that he would be lifting the “veto” on working with the Socialist Party. If the right-wing parties fall short of a majority, then Rivera would be open to talks with Socialist leader Pedro Sanchez. A governing deal between PSOE, Podemos, and Ciudadanos would have 175 seats, as of the latest projections, which is just one seat short of a majority. As we go to press, this is the only outcome that would end Spain’s current political gridlock, and would therefore be the most market-positive outcome. Bottom Line: Despite having a fourth election in as many years, Spanish political risk is contained. This is reinforced by a relatively politically stable backdrop in continental Europe, and marginally positive developments in the U.K. and on the trade front. We remain long European versus U.S. technology, and long EU versus Chinese equities. We will also be looking to go long EUR/USD when and if the global hard data turn. Following our European Investment Strategy, we recommend going long 10-year Italian BTPs / short 10-year Spanish bonos for a trade. Turkey, Brazil, And Russia Chart 14Turkish Risk Will Rise Despite 'Ceasefire'
Turkish Risk Will Rise Despite 'Ceasefire'
Turkish Risk Will Rise Despite 'Ceasefire'
Turkey’s political risk skyrocketed upward after we issued our warning in September (Chart 14). We maintain that the Trump-Erdogan personal relationship is not a basis for optimism regarding Turkey’s evading U.S. sanctions. Both chambers of the U.S. Congress are preparing a more stringent set of sanctions, focusing on the Turkish military, in the wake of Trump’s decision to withdraw U.S. forces from northeast Syria. At a time when Trump needs allies in the senate to defend him against eventual impeachment articles, he is not likely to veto and risk an override. Moreover, Turkey’s military incursion into Syria, which may wax and wane, stems from economic and political weakness at home and will eventually exacerbate that weakness by fueling the growing opposition to Erdogan’s administration and requiring more unorthodox monetary and fiscal accommodation. It reinforces our bearish outlook on Turkish lira and assets. Chart 15Brazilian Risk Will Not Re-Test 2018 Highs
Brazilian Risk Will Not Re-Test 2018 Highs
Brazilian Risk Will Not Re-Test 2018 Highs
Brazil’s political risk has rebounded (Chart 15). The Senate has virtually passed the pension reform bill, as expected, which raises the official retirement age for men and women to 65 and 63 respectively. This will generate upwards of 800 billion Brazilian real in savings to improve the public debt profile. Of course, the country will still run primary deficits and thus the public debt-to-GDP ratio will still rise. Now the question shifts to President Jair Bolsonaro and his governing coalition. Bolsonaro’s approval rating has ticked up as we expected (Chart 16). If this continues then it is bullish for Brazil because it suggests that he will be able to keep his coalition together. But investors should not get ahead of themselves. Bolsonaro is not an inherently pro-market leader, there is no guarantee that he will remain disciplined in pursuing pro-productivity reforms, and there is a substantial risk that his coalition will fray without pension reform as a shared goal (at least until markets riot and push the coalition back together). Therefore we expect political risk to abate only temporarily, if at all, before new trouble emerges. Furthermore, if reform momentum wanes next year, then Brazil’s reform story as a whole will falter, since electoral considerations emerge in 2021-22. Hence it will be important to verify that policymakers make progress on reforms to tax and trade policy early next year. Our Russian geopolitical risk indicator is also lifting off of its bottom (see Appendix). This makes sense given Russia’s expanding strategic role (particularly in the Middle East), its domestic political troubles, and the risks of the U.S. election. The latter is especially significant given the risk (not our base case, however) that a Democratic administration could take a significantly more aggressive posture toward Russia. Political risk in Turkey and Russia will continue to rise. Bottom Line: Political risk in Turkey and Russia will continue to rise. Russia is a candidate for a “black swan” event, given the eerie quiet that has prevailed as Putin devotes his fourth term to reducing domestic political instability. Brazil, on the other hand, has a 12-month window in which reform momentum can be reinforced, reducing whatever spike in risk occurs in the aftermath of the ruling coalition’s completion of pension reform. Canada: Election Post-Mortem Prime Minister Justin Trudeau returned to power at the head of a minority government in Canada’s federal election (Chart 17). The New Democratic Party (NDP) lost 15 seats from the last election, but will have a greater role in parliament as the Liberals will need its support to pass key agenda items (and a formal governing coalition is possible). The NDP’s result would have been even worse if not for its last-minute surge in the polls after the election debates and Trudeau’s “blackface” scandal. Chart 17Liberals Need The New Democrats Now
How Much To Buy An American President? – GeoRisk Update: October 25, 2019
How Much To Buy An American President? – GeoRisk Update: October 25, 2019
The Conservative Party won the popular vote but only 121 seats in parliament, leaving the western provinces of Alberta and Saskatchewan aggrieved. The Bloc Québécois, the Quebec nationalist party, gained 22 seats to become the third-largest party in the House. Energy investment faces headwinds in the near-term. The Liberal Party will face resistance from the Left over the Trans Mountain pipeline. Trudeau will not necessarily have to sacrifice the pipeline to appease the NDP. He may be able to work with Conservatives to advance the pipeline while working with the NDP on the rest of his agenda. But on the whole the election result is the worst-case scenario for the oil sector and political questions will have to be resolved before Canada can take advantage of its position as a heavy crude producer near the U.S. Gulf refineries in an era in which Venezuela is collapsing and Saudi Arabia is exposed to geopolitical risk and attacks. More broadly, the Liberals will continue to endorse a more expansive fiscal policy than expected, given Canada’s low budget deficits and the need to prevent minor parties from eating away at the Liberal Party’s seat count in future. Bottom Line: The Liberal Party failed to maintain its single-party majority. Trudeau’s reliance on left-wing parties in parliament may prove market-negative for the Canadian energy sector, though that is not a forgone conclusion. Over the longer term the sector has a brighter future. Matt Gertken Geopolitical Strategist mattg@bcaresearch.com Ekaterina Shtrevensky Research Analyst ekaterinas@bcaresearch.com Appendix GeoRisk Indicator
TRADE WAR GEOPOLITICAL RISK INDICATOR
TRADE WAR GEOPOLITICAL RISK INDICATOR
U.K.: GeoRisk Indicator
U.K.: GEOPOLITICAL RISK INDICATOR
U.K.: GEOPOLITICAL RISK INDICATOR
France: GeoRisk Indicator
FRANCE: GEOPOLITICAL RISK INDICATOR
FRANCE: GEOPOLITICAL RISK INDICATOR
Germany: GeoRisk Indicator
GERMANY: GEOPOLITICAL RISK INDICATOR
GERMANY: GEOPOLITICAL RISK INDICATOR
Spain: GeoRisk Indicator
SPAIN: GEOPOLITICAL RISK INDICATOR
SPAIN: GEOPOLITICAL RISK INDICATOR
Italy: GeoRisk Indicator
ITALY: GEOPOLITICAL RISK INDICATOR
ITALY: GEOPOLITICAL RISK INDICATOR
Canada: GeoRisk Indicator
CANADA: GEOPOLITICAL RISK INDICATOR
CANADA: GEOPOLITICAL RISK INDICATOR
Russia: GeoRisk Indicator
RUSSIA: GEOPOLITICAL RISK INDICATOR
RUSSIA: GEOPOLITICAL RISK INDICATOR
Turkey: GeoRisk Indicator
TURKEY: GEOPOLITICAL RISK INDICATOR
TURKEY: GEOPOLITICAL RISK INDICATOR
Brazil: GeoRisk Indicator
BRAZIL: GEOPOLITICAL RISK INDICATOR
BRAZIL: GEOPOLITICAL RISK INDICATOR
Taiwan: GeoRisk Indicator
TAIWAN: GEOPOLITICAL RISK INDICATOR
TAIWAN: GEOPOLITICAL RISK INDICATOR
Korea: GeoRisk Indicator
KOREA: GEOPOLITICAL RISK INDICATOR
KOREA: GEOPOLITICAL RISK INDICATOR
What's On The Geopolitical Radar?
How Much To Buy An American President? – GeoRisk Update: October 25, 2019
How Much To Buy An American President? – GeoRisk Update: October 25, 2019
Section III: Geopolitical Calendar
One risk to a favorable resolution to the trade war is that China will increasingly see Trump as desperate to make a deal. This could lead the Chinese to take a hardline stance in the negotiations. While this risk cannot be dismissed, we would downplay it for…
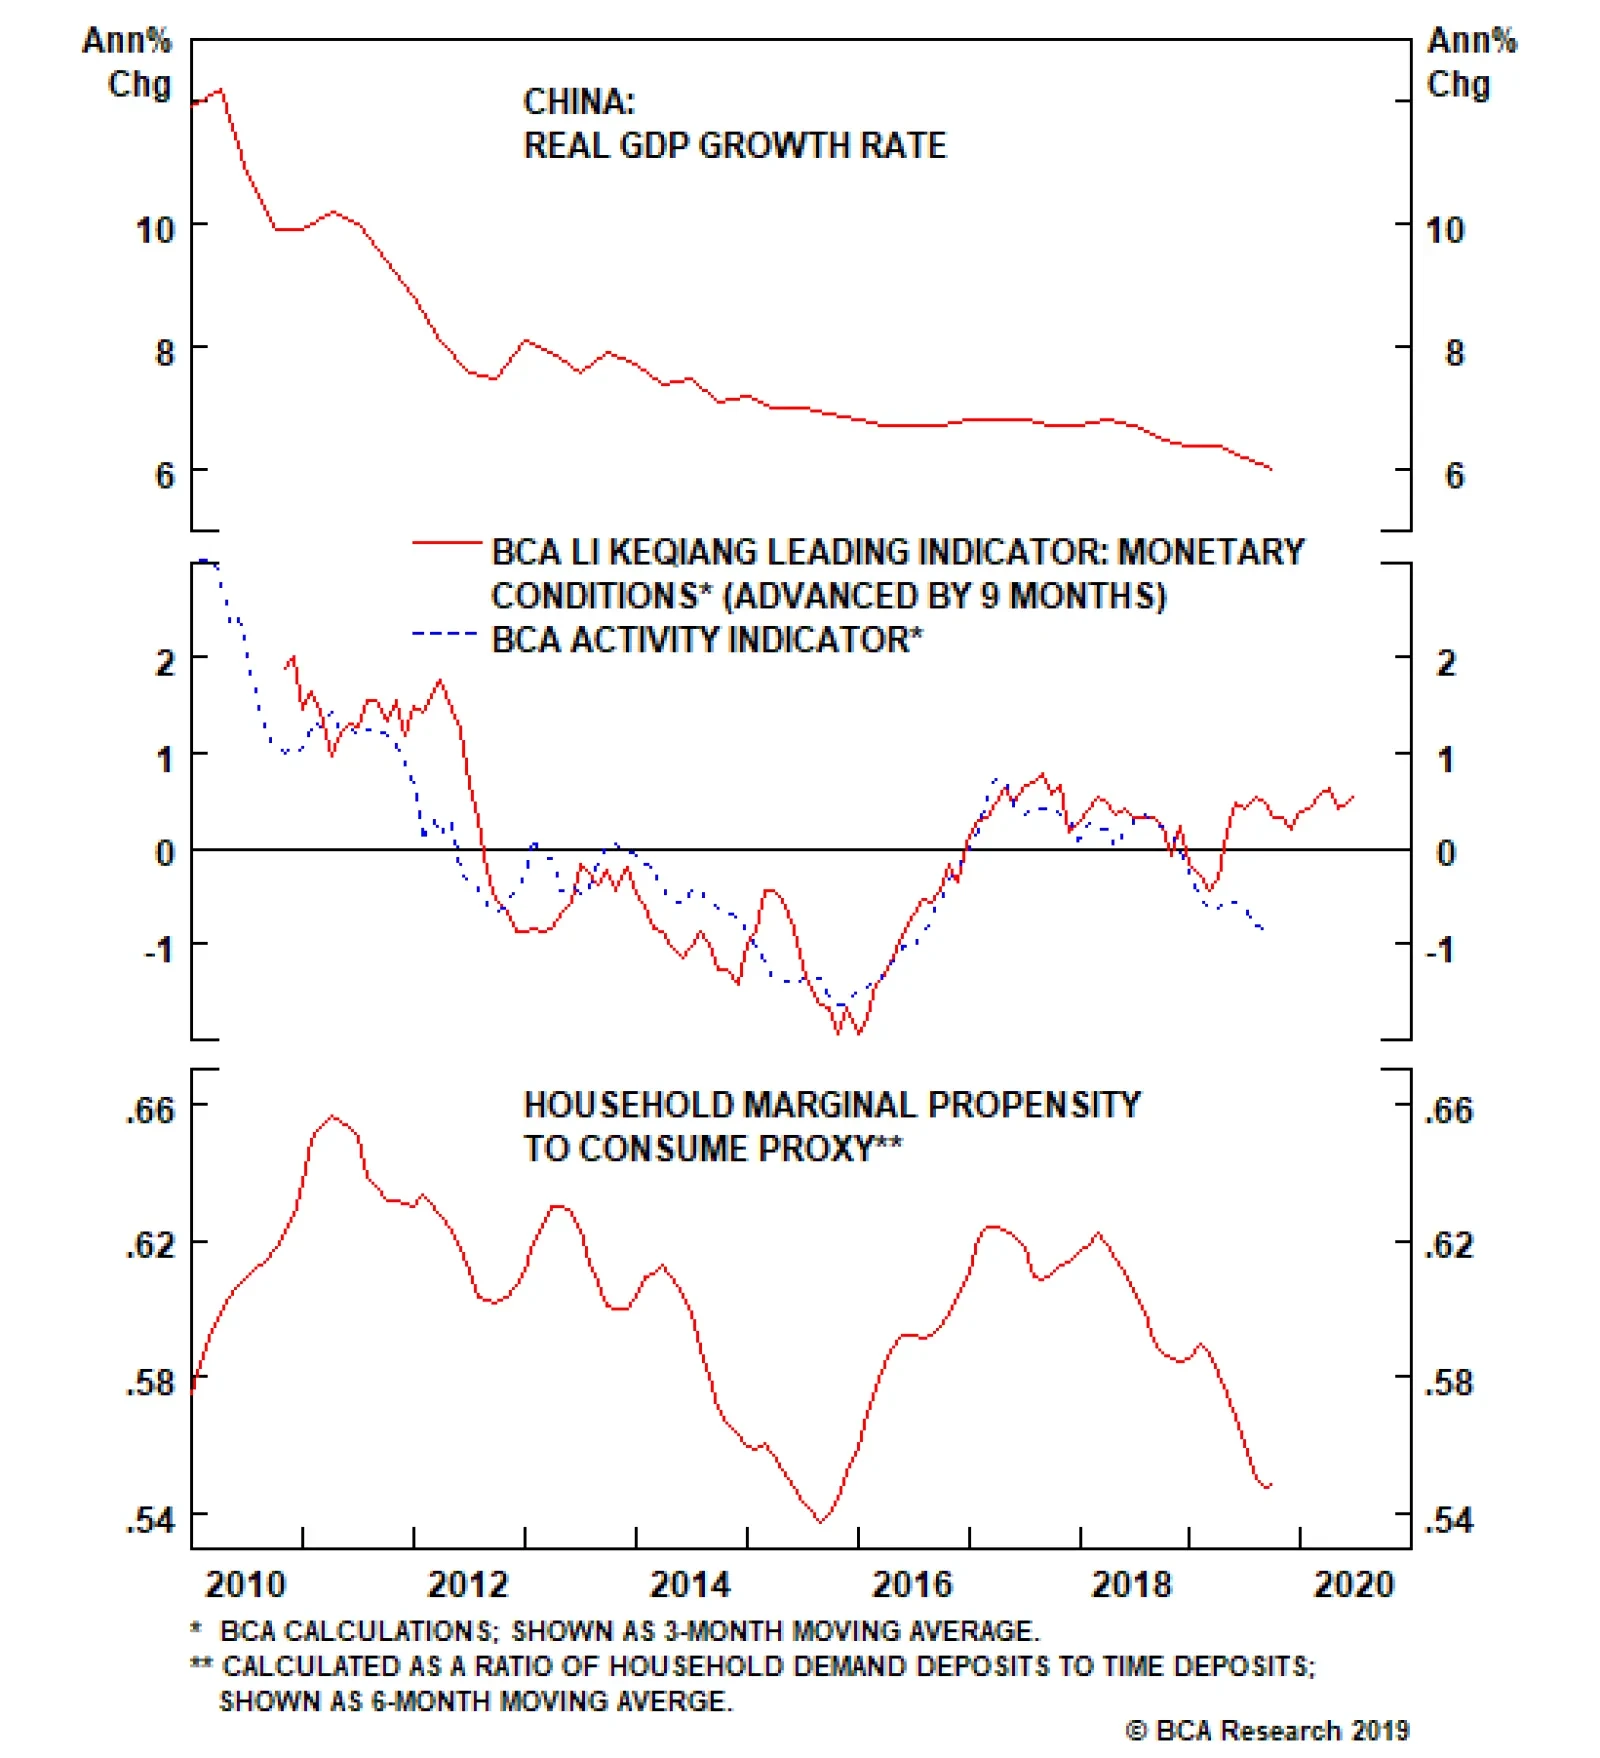
Chinese real GDP annual growth for Q3 fell to 6%, the lowest rate since 1992. September fixed-asset investment fell to 5.4%. Industrial production rebounded to 5.8% from 4.4% but remains in a downtrend. This is not a pretty picture. We expect Chinese…
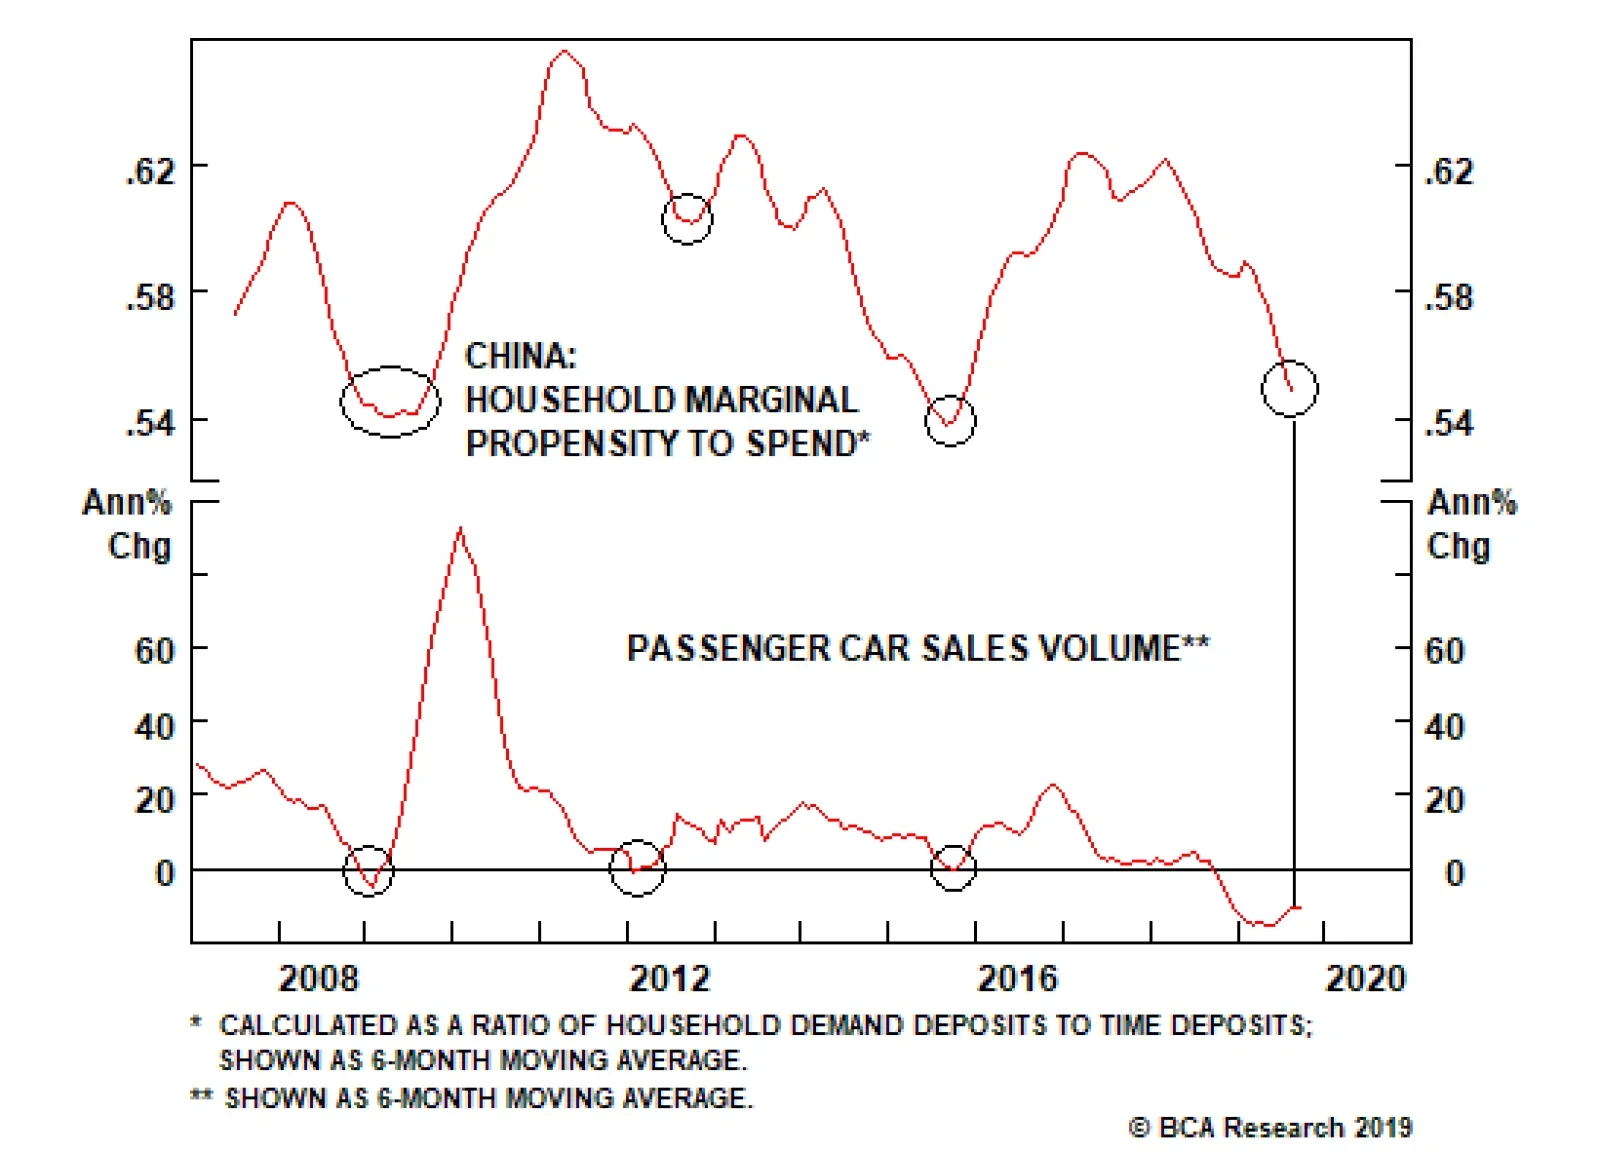
Reluctance to purchase a car and curtailed financing are the causes of the deep auto sales contraction in China. These factors remain intact. First, our indicator for household marginal propensity to spend continues to fall, indicating no immediate signs…
Highlights The interim “phase 1” trade agreement reached last week represents a significant step forward towards reaching a détente in the China-U.S. trade war. Regardless of what happens next in the Brexit negotiations, a hard exit will be avoided. Stay long the pound. U.S. earnings growth is likely to be flat in the third quarter, in contrast to bottom-up expectations of a year-over-year decline. Earnings growth should pick up as global growth reaccelerates by year end. Stronger global growth will put downward pressure on the U.S. dollar. Remain overweight global equities relative to bonds over a 12-month horizon. Cyclical stocks should start to outperform defensives. Financials will finally have their day in the sun. Favorable Tradewinds In our Fourth Quarter Strategy Outlook published two weeks ago, we argued that global equities had entered a “show me” phase, meaning that tangible evidence of a de-escalation in the trade war and a recovery in global growth would be necessary for stock indices to move higher.1 We received some positive news on the trade front last Friday. In exchange for suspending the planned October 15th hike in tariffs from 25% to 30% on $250 billion of Chinese imports, China agreed to purchase $40-$50 billion of U.S. agricultural products per year, improve market access for U.S. financial services companies, and enhance the transparency of currency management. Admittedly, there is still much to be done. The text of the agreement has yet to be finalized. Both sides are aiming to conclude the deal by the time of the APEC summit in Santiago, Chile on November 16-17. Considering that a number of key issues remain unresolved, including what sort of enforcement and resolution mechanisms will be included in the deal, further delays or even a breakdown in the talks are possible. The interim deal agreed upon last week also punts the thorny issue of how to handle intellectual property protections to a “phase 2” of the negotiations slated to begin soon after “phase 1” is wrapped up. According to the independent and bipartisan U.S. Commission on the Theft of American Intellectual Property, U.S. producers lose between $225 and $600 billion annually from IP theft.2 China has often been considered among the worst offenders. Given the importance of the IP issue, meaningful progress will be necessary to ensure that tariffs of 15% on about $160 billion of Chinese imports are not introduced on December 15th. Trump Wants A Deal Despite the many hurdles that remain, last week’s developments significantly raise the prospects of a détente in the 18 month-long trade war. As a self-professed “master negotiator,” President Trump has put his credibility on the line by describing the negotiations as a “love fest,” calling the trade pact “the greatest and biggest deal ever made for our Great Patriot Farmers,” and saying that he has “little doubt” that a final agreement will be reached. Just as he did with NAFTA’s successor USMCA – a deal that is substantively similar to the one it replaced – Trump is likely to shift into marketing mode, trumpeting the “tremendous” new deal that he has negotiated on behalf of the American people. From a political point of view, this makes perfect sense. Rightly or wrongly, President Trump gets better marks from voters on his handling of the economy than anything else (Chart 1). A protracted trade war would undermine the U.S. economy, thereby hurting Trump’s re-election prospects. Chart 1Trump Gets Reasonably High Marks On His Handling Of The Economy, But Not Much Else
Kumbaya
Kumbaya
Chart 2Chinese Business Are Not Paying The Bulk Of The Tariffs
Kumbaya
Kumbaya
Notwithstanding his claims to the contrary, the evidence firmly suggests that U.S. consumers, rather than Chinese businesses, are paying the bulk of the tariffs. Chart 2 shows that U.S. import prices from China have barely declined, even as tariff rates on Chinese imports have risen. To the extent that the latest rounds of tariffs are focused on Chinese goods for which there is little U.S. or third-country competition, the ability of Chinese producers to pass on the cost of the tariffs will only increase. If all the tariff hikes that have been announced were implemented, the effective tariff rate on Chinese imports would rise from around 15% as of late August to as high as 25% in December (Chart 3). Such a tariff rate would reduce U.S. household disposable incomes by over $100 billion, wiping out most of the gains from the 2017 tax cuts. Trump can’t let the trade war reach this point. Chart 3Successive Rounds Of Tariffs Have Started To Add Up
Successive Rounds Of Tariffs Have Started To Add Up
Successive Rounds Of Tariffs Have Started To Add Up
Will China Play Hardball? One risk to a favorable resolution to the trade war is that China will increasingly see Trump as desperate to make a deal. This could lead the Chinese to take a hardline stance in the negotiations. While this risk cannot be dismissed, we would downplay it for three reasons: First, even though China’s exporters have been able to maintain some degree of pricing power during the trade war, trade volumes have still suffered, with exports to the U.S. down nearly 22% year-over-year in September. Second, as the crippling sanctions against ZTE have demonstrated, China remains highly dependent on U.S. technologies. This gives Trump a lot of leverage in the trade negotiations. Chart 4Who Will Win The 2020 Democratic Nomination?
Kumbaya
Kumbaya
Third, as Trump himself likes to say, China will find it easier to negotiate with him in his first term in office than in his second. Hoping that Trump would lose his re-election bid might have made sense for China a few months ago when Joe Biden was riding high in the polls; but now that Elizabeth Warren has emerged as the favorite to secure the Democratic nomination, that hope has been dashed (Chart 4). As we noted several weeks ago, China is likely to find Warren no less vexing on trade matters than Trump.3 All this suggests that China, just like Trump, will look for ways to cool trade tensions over the coming weeks. Brexit Breakthrough? As we go to press, the prospects for a Brexit deal have brightened. Although the details have yet to be released, the proposed deal would effectively put Northern Ireland in a veritable quantum superposition where it is both in the European common market and in the U.K. at the same time. This feat will be achieved by keeping Northern Ireland within the U.K. political jurisdiction but still aligned with EU regulatory standards. Negotiations could still go awry. Despite Prime Minister Boris Johnson’s assurance that he secured “a great new deal,” the Conservative’s coalition partner, the Northern Irish Democratic Unionist Party, is still withholding its support for the accord. Labour leader Jeremy Corbyn has also rejected the deal, saying that it is even worse than Theresa May’s originally proposed pact. Regardless of what transpires over the coming days, we continue to think that a hard Brexit will be avoided. Throughout the entire Brexit ordeal, we have argued that there was insufficient political support within the British ruling class for a no-deal Brexit. That conviction has only grown as polling data has revealed that an increased share of voters would choose to stay in the EU if another referendum were held (Chart 5). We have been long the pound versus the euro since August 3, 2017. The trade has gained 6.6% over this period. Investors should stick with this position. Based on real interest rate differentials, GBP/EUR should be trading near 1.30 rather than the current level of 1.16 (Chart 6). We expect the cross to move towards its fair value as hard Brexit risks diminish further. Chart 5Brexit Angst: A Case Of Bremorse
Brexit Angst: A Case Of Bremorse
Brexit Angst: A Case Of Bremorse
Chart 6Substantial Upside In The Pound
Substantial Upside In The Pound
Substantial Upside In The Pound
Global Growth Prospects Improving Chart 7Growth Slowdown Has Been More Pronounced In The Soft Data
Growth Slowdown Has Been More Pronounced In The Soft Data
Growth Slowdown Has Been More Pronounced In The Soft Data
Chart 8Manufacturing Output Rebounds Amid The ISM Slump
Manufacturing Output Rebounds Amid The ISM Slump
Manufacturing Output Rebounds Amid The ISM Slump
A détente in the trade war and a resolution to the Brexit saga should help support global growth. The weakness in the economic data has been much more pronounced in so-called “soft” measures such as business surveys than in “hard” measures such as industrial production (Chart 7). Notably, U.S. manufacturing output has stabilized over the past three months, even as the ISM manufacturing index has swooned (Chart 8). As sentiment rebounds, the soft data should improve. Global financial conditions have eased significantly over the past five months, thanks in large part to the dovish pivot by most central banks (Chart 9). The net number of central banks cutting rates generally leads the global manufacturing PMI by 6-to-9 months (Chart 10). In addition, the Fed’s decision to start buying Treasurys again will increase dollar liquidity, thus further contributing to looser financial conditions. Chart 9Easier Financial Conditions Will Boost Global Growth
Easier Financial Conditions Will Boost Global Growth
Easier Financial Conditions Will Boost Global Growth
Chart 10The Effects Of Easing Monetary Policy Should Soon Trickle Down To The Economy
The Effects Of Easing Monetary Policy Should Soon Trickle Down To The Economy
The Effects Of Easing Monetary Policy Should Soon Trickle Down To The Economy
Stepped-up Chinese stimulus should also help jumpstart global growth. Chinese money and credit growth both came in above expectations in September. The PBoC has been cutting reserve requirements, which has helped bring down interbank rates. Further cuts to the medium-term lending facility are likely over the remainder of this year. Changes in Chinese credit growth lead global growth by about nine months (Chart 11). Chart 11Chinese Credit Should Support The Recovery In Global Growth
Chinese Credit Should Support The Recovery In Global Growth
Chinese Credit Should Support The Recovery In Global Growth
Stay Overweight Global Equities While the road to finalizing a “phase 1” trade deal in time for the APEC summit is likely to be a bumpy one, we continue to reiterate our recommendation that investors overweight global stocks relative to bonds over a 12-month horizon. We expect to upgrade EM and European equities over the coming weeks once we see a bit more evidence that global growth is bottoming out. Ultimately, the trajectory of stocks will hinge on what happens to earnings. The U.S. earnings season began this week. As of last week, analysts expected S&P 500 EPS to decline by 4.6% in Q3 relative to the same quarter last year according to data compiled by FactSet. Keep in mind, however, that EPS growth has beaten estimates by around four percentage points since 2015 (Chart 12). Thus, a reasonable bet is that U.S. earnings will be flat this quarter, clearing a low bar of expectations. Chart 12Actual EPS Has Generally Beaten Estimates
Kumbaya
Kumbaya
Chart 13Earnings And Nominal GDP Growth Tend To Move In Lock-Step
Earnings And Nominal GDP Growth Tend To Move In Lock-Step
Earnings And Nominal GDP Growth Tend To Move In Lock-Step
The fact that 83% of the 63 S&P 500 companies that have reported earnings thus far have beaten estimates – better than the historic average of 64% – supports the view that current Q3 estimates are too dour. Looking out, earning growth should pick up as nominal GDP growth accelerates (Chart 13). European and EM equities generally outperform the global benchmark when global growth is speeding up (Chart 14). This is due to the more cyclical nature of their stock markets. In addition, as a countercyclical currency, the dollar tends to weaken in a faster growth environment. A weaker dollar disproportionately benefits cyclical stocks (Chart 15). Chart 14EM And Euro Area Equities Usually Outperform When Global Growth Improves
EM And Euro Area Equities Usually Outperform When Global Growth Improves
EM And Euro Area Equities Usually Outperform When Global Growth Improves
Chart 15Cyclical Stocks Will Outperform If The Dollar Weakens
Cyclical Stocks Will Outperform If The Dollar Weakens
Cyclical Stocks Will Outperform If The Dollar Weakens
We would include financials in our definition of cyclical sectors. As global growth improves, long-term bond yields will increase at the margin. Since central banks are in no hurry to raise rates, yield curves will steepen. This will boost bank profits and share prices (Chart 16). Cyclical stocks are currently quite cheap compared to defensives (Chart 17). Likewise, non-U.S. equities are quite inexpensive compared to their U.S. peers, even if one adjusts for differences in sector composition across regions. While U.S. stocks trade at 17.5-times forward earnings, international stocks trade at a more attractive forward PE ratio of 13.7. The combination of higher earnings yields and lower interest rates abroad implies that the equity risk premium is roughly two percentage points higher outside the United States (Chart 18). Chart 16Steeper Yield Curves Will Benefit Financials
Steeper Yield Curves Will Benefit Financials
Steeper Yield Curves Will Benefit Financials
Chart 17Cyclical Stocks Are More Attractive Than Defensives
Cyclical Stocks Are More Attractive Than Defensives
Cyclical Stocks Are More Attractive Than Defensives
Chart 18The Equity Risk Premium Is Quite High, Especially Outside The U.S.
The Equity Risk Premium Is Quite High, Especially Outside The U.S.
The Equity Risk Premium Is Quite High, Especially Outside The U.S.
We expect to upgrade EM and European equities over the coming weeks once we see a bit more evidence that global growth is bottoming out. Peter Berezin, Chief Global Strategist Global Investment Strategy peterb@bcaresearch.com Footnotes 1Please see Global Investment Strategy, “Fourth Quarter 2019 Strategy Outlook: A ‘Show Me’ Market,” dated October 4, 2019. 2 “Update to IP Commission Report: The Report of the Commission on the Theft of American Intellectual Property,” The National Bureau of Asian Research, 2017. 3Please see Global Investment Strategy Weekly Report, “Elizabeth Warren And The Markets,” dated September 13, 2019. Strategy & Market Trends MacroQuant Model And Current Subjective Scores
Kumbaya
Kumbaya
Strategic Recommendations Closed Trades
Highlights A recovery in Chinese auto sales is not imminent. Car sales will likely stage only a rate-of-change improvement, moving from deep to mild contraction or stagnation over the next three-to-six months. Low-speed electric vehicles are a cheap substitute for regular low-end cars. Their production requires fewer inputs and parts compared to cars. Hence, their rising penetration will be negative for economic activity at the margin. Auto ownership will continue to rise in China in the years to come. However, this does not necessitate rising car sales. In fact, auto ownership can increase with car sales contracting in each consecutive year. This scenario represents a major risk to auto stock prices. Feature Chart 1Chinese Auto Sales: An Extended Downturn
Chinese Auto Sales: An Extended Downturn
Chinese Auto Sales: An Extended Downturn
Chinese automobile sales have been deep under water for 15 consecutive months. The magnitude of the contraction has been even worse than the one that occurred in 2008-‘09. Annualized sales1 have declined from a peak of nearly 30 million units in June 2018 to 26 million this September (Chart 1). To put this 4-million-unit decline into perspective, only about 5 million units of automobiles were produced in Germany last year. Given the already long and deep contraction, does this mean Chinese auto sales and production are about to stage an imminent recovery? Although a revival sometime next year is plausible, we are not positive in the near term. Car sales will stage a rate-of-change improvement only, moving from deep to mild contraction or stagnation (i.e. zero growth) the next three to six months (Chart 1, bottom panel). Gauging The Demand Outlook Chart 2Marginal Propensity To Spend Is Falling
Marginal Propensity To Spend Is Falling
Marginal Propensity To Spend Is Falling
Reluctance to purchase a car and curtailed financing are the causes of the deep auto sales contraction in China. The factors that have weighed on consumers’ willingness to purchase cars remain intact. First, our indicator for household marginal propensity to spend continues to fall, indicating no immediate signs of a turnaround (Chart 2). Cyclically, decelerating economic activity is weighing on income expectations, prompting consumers to delay their discretionary spending. Besides, the growth rate of disposable income per capita is at the lower end of its historical range and is falling in real (inflation-adjusted) terms (Chart 3). In addition, Chinese households are more leveraged now than their U.S. counterparts (Chart 4). Their debt levels have reached over 120% of annual disposable income. Chart 3Real Disposable Income Growth Is Weakening
Real Disposable Income Growth Is Weakening
Real Disposable Income Growth Is Weakening
Chart 4Chinese Households Are Increasingly Indebted
Chinese Households Are Increasingly Indebted
Chinese Households Are Increasingly Indebted
Meanwhile, the U.S.-China confrontation continues to foster uncertainty among consumers and businesses in the Middle Kingdom. Although some sort of agreement was reached last week, the future of longer-term U.S.-China relations remains highly uncertain. Hence, the potential “phase-one” trade agreement is unlikely to shift Chinese consumers’ and businesses’ overall cautious sentiment. These factors will continue to weigh on consumers’ purchasing behavior, especially on big-ticket items like automobiles. Reluctance to purchase a car and curtailed financing are the causes of the deep auto sales contraction in China. Second, Chinese auto financing penetration rate – measured as the proportion of autos bought using borrowed funds – has risen from 20% in 2014 to about 48%2 last year. This remains well below the 70%-plus penetration rate in major western countries (the U.S., Germany and France), but is not far from the 50% rate in Japan. The rapid increase in the use of auto financing has facilitated auto sales in China over the past several years. Financing for auto purchases has been provided by banks via loans and credit cards, dealer/manufacturer loans and peer-to-peer lending (P2P). While banks contribute about 40% of auto financing and auto dealers/manufacturers account for about 30%, the peer-to-peer platform has become the third major source of auto loans in recent years. Chart 5Limited Auto Financing From Peer-To-Peer Platforms
Limited Auto Financing From Peer-To-Peer Platforms
Limited Auto Financing From Peer-To-Peer Platforms
However, since early last year, bankruptcies and closures of P2P platforms have significantly reduced available auto financing. P2P financing continues to shrink, further depressing loans for auto purchases (Chart 5). Third, there is an ongoing structural decline in consumers’ willingness to purchase cars due to greater traffic congestion, limited parking and improved public transportation. In addition, greater use of ride-sharing and car-sharing services, which the government is aiming to promote, will also continue to reduce the need to buy a car. Concerning government incentives for auto buyers, auto sales have failed to recover, so far this year, despite policy support and significant auto price cuts (Box 1). Although the government recently loosened some restrictive auto sales policies in certain cities,3 the scale was much smaller than what was done earlier this year. As in any market, production decisions are driven by sales, not inventories. Box 1 Policy Support And Auto Price Cut During January-September 2019 Since late January, Chinese authorities have released a set of pro-auto-consumption measures aimed at spurring auto sales. These measures include the approval of 100,000 new license plates in Guangzhou province and an additional 80,000 in Shenzhen. Since May, auto dealers in China have slashed prices of their Emission Standard 5 cars in order to liquidate inventories, as 15 provinces/provincial level cities have been implementing the new emissions standards since July 1, 2019 – one year earlier than the national implementation deadline. According to the law, vehicles that do not meet the new standard will not be allowed to be sold or registered once the new standard is implemented. Another pertinent question to address is whether inventories can be used to identify a bottom in this industry. This is difficult to gauge in China, as inventories at different stages of the supply chain are currently sending conflicting signals. Manufacturers’ inventories have dropped to low levels (Chart 6). Yet, dealers’ inventories remain elevated according to the newly released inventory data for September (Chart 7). Chart 6Auto Manufacturers Inventories Are Low...
Auto Manufacturers Inventories Are Low...
Auto Manufacturers Inventories Are Low...
Chart 7...But Dealers Inventories Remain Elevated
...But Dealers Inventories Remain Elevated
...But Dealers Inventories Remain Elevated
Chart 8Auto Demand Drives Production
Auto Demand Drives Production
Auto Demand Drives Production
As in any market, production decisions are driven by sales, not inventories. The chain reaction always starts from demand: rising sales lead to rising production. Producers do not typically ramp up output when sales are falling, even if inventories are low (Chart 8). Without a strong and durable rise in demand, manufacturers will not significantly increase their inventories. In short, low car inventories among manufacturers could lead to a short-term rise in output. A sustainable and lasting recovery in production, however, is contingent on a cyclical revival in auto sales. Bottom Line: A cyclical recovery in auto sales is not imminent in the next three-to-six months. A Threat From A Cheap Substitute In many small cities (from Tier 3 to Tier 6 cities), towns and villages where auto buyers are more sensitive to prices, consumers are opting to purchase low-speed electric vehicles (LSEVs) – a cheap substitute for regular autos. Last year, LSEV makers sold about 1.5 million units in China, accounting for about 6% of passenger vehicle sales for the year. In comparison, even with massive government subsidies, total new energy vehicle (NEV, mainly including pure electric vehicles and plug-in hybrids) sales only reached 1.2 million units in 2018, 20% lower than LSEV sales. In many small cities, towns and villages consumers are opting to purchase low-speed electric vehicles (LSEVs) – a cheap substitute for regular autos. LSEVs are small, short-range electric vehicles (three- or four-wheeled cars) with top driving speeds below 80km per hour and with a similar look to regular cars.4 They have much lower technical and safety standards: LSEVs are not considered automobiles by the country’s motor vehicle management system. Consequently, official auto production and sales data released by authorities do not include LSEV figures. Chart 9Significant Output Expansion In Low-Speed Electric Vehicles
Significant Output Expansion In Low-Speed Electric Vehicles
Significant Output Expansion In Low-Speed Electric Vehicles
Technically, these vehicles are within some sort of grey area of Chinese regulations, but that has not stopped the industry's remarkable growth. Shandong province accounts for about 40% of the country’s LSEV output. The dramatic LSEV production expansion in the province gives a glimpse into the booming LSEV industry in China (Chart 9). Last year’s LSEV production drop was due to the government’s tightening of LSEV output policies and greater competition from small-size pure electric vehicles, which benefited from government subsidies. Both factors have diminished this year due to policy changes and the termination of subsidies for the small-size pure electric vehicle. Looking forward, consumers will continue purchasing LSEVs as a substitute for lower-end cars. They will have negative effect on low-end car sales, especially when household budgets tighten. Table 1 lays out the main differences between an LSEV and a lower-end passenger car. Clearly, the most attractive feature of an LSEV is its price, which can be as cheap as 10,000 RMB (less than US$2,000) with a big proportion of LSEVs ranging from 20,000 RMB to 30,000 RMB. In comparison, prices of lower-end passenger vehicles in general range from 50,000RMB to 80,000 RMB, more expensive than LSEVs. As nearly half of Chinese households already own an automobile, the potential of future auto sales clearly lies in lower-income households. However, the 2018 NBS household survey showed the annual household disposable income for the lowest 60% percentile rural households was lower than the low-end price of regular auto – 50,000 RMB (US$ 7,050) (Chart 10). In comparison, a much cheaper LSEV will be affordable for them. Given that they are inferior goods, LSEVs could become even more attractive at times of weak disposable income growth. In addition to cheap prices, Box 2 reveals other attractive features that will make LSEVs the most convenient and affordable form of transportation for many potential auto buyers. This will also help promote the popularity of the LSEVs in small cities and rural areas. Table 1The Comparison Between LSEVs And Lower-End Passenger Cars
Chinese Auto Demand: Time For A Recovery?
Chinese Auto Demand: Time For A Recovery?
Chart 10Low-Speed Electric Vehicles: Affordable For Lower-Income Households
Chinese Auto Demand: Time For A Recovery?
Chinese Auto Demand: Time For A Recovery?
Further, this year’s regulatory changes are also favorable for the LSEV industry (Box 3). This marked a clear policy reversal from last year when the government executed a crackdown on LSEV production and issued a policy prohibiting new capacity of LSEVs. Box 2 The Non-Price Reasons For The Increasing Popularity Of The LSEVs The LSEV is more convenient as it is easy to drive and to park because of its small size. The drive range of 100 km per charge of the battery is sufficient for a person who only uses it to go to work or pick up the kids from school. It is particularly useful in small cities and rural areas where the public transportation network is poor. The speed of 40-60 km per hour is also fast enough to drive in small cities and rural area where there are not much road traffic and the roads are often designed for low driving speed. LSEVs also have the benefit of being able to charge from home electrical outlets, eliminating the need to use public charging/fueling infrastructure. Box 3 Policy On LSEV Industry: More Favorable In 2019 Than In 2018 In March, the Ministry of Industry and Information Technology announced that by 2021 the national standards of the “Technical Conditions of Four-Wheel Low-Speed Electric Vehicles” would be established. This will eventually bring the LSEV market under the government’s supervision while giving LSEV makers two years to improve their technology. This will help improve the quality and safety measures of LSEVs. In May and June, over 20 cities started to issue car plates for LSEVs and approved of the LSEVs right to be on the road. This signals that the government is aiming to regulate the LSEV sector in a positive way, rather than simply banning production. Bottom Line: Cheap LSEVs will be a low-cost substitute for regular low-end cars. Their production requires fewer inputs and parts compared to cars. Hence, their rising penetration will be negative for economic activity at the margin. What About NEV Demand? New Electric Vehicle (NEV) sales were a bright spot among all categories of auto sales in China last year, with year-on-year growth of 62%. However, NEV sales growth has decelerated considerably this year as the government began cutting subsidies (Chart 11). NEV sales will remain under pressure. Table 2 shows the timeline of China’s NEV subsidy exit plan, which was released in late March. The subsidy is set to be phased out by 2021. Chart 11New Electric Vehicle Sales Growth Will Slow But Remain Positive
New Electric Vehicle Sales Growth Will Slow But Remain Positive
New Electric Vehicle Sales Growth Will Slow But Remain Positive
Table 2The China’s New Electric Vehicle Subsidy Exit Plan
Chinese Auto Demand: Time For A Recovery?
Chinese Auto Demand: Time For A Recovery?
In comparison to last year, there will be no subsidy at all for pure electric vehicles (PEVs) with recharge mileage of 250 kilometers and lower. This will make it more difficult for mini-PEVs to compete with LSEVs with respect to price. For PEVs with recharge mileage of 250 kilometers and above, the subsidy has also been cut significantly. However, we still expect NEV demand growth to remain positive. The government will continue to maintain zero sales tax on NEVs until the end of 2020. This gives it a major advantage over non-NEV vehicles, which carry the 10% sales tax. In addition, NEVs are exempt from license restrictions on car sales and time or area restrictions on on-road autos, in cities where such policies apply. This is an attractive privilege for car buyers to consider. Current NEVs that can achieve recharge mileage of 300-450 kilometers, sell at a price of RMB 100,000 to RMB 150,000 per unit. They are both affordable and appealing for upper-middle-income and high-income urban households who prefer either green options or energy cost savings. The recharge mileage is sufficient for most daily use, and prices are in line with prices of traditional gasoline or diesel cars. If and as auto sales fail to stage a notable recovery in the next several months, Chinese auto stock prices will likely break down. Bottom Line: With the gradual phasing out of subsidies, the period of exponential NEV sales growth is over. Nevertheless, NEV demand growth will likely remain positive. Investment Implications Chart 12Chinese Auto Stock Prices Could Break Down
Chinese Auto Stock Prices Could Break Down
Chinese Auto Stock Prices Could Break Down
There are three pertinent investment implications to consider. First, Chinese auto stock prices in the domestic A-share market have dropped by 60% from their 2017 highs, and have lately been moving sideways (Chart 12). Notably, these listed automakers’ per-share earnings have plunged, and the companies have cut dividends by more than the drop in their share prices (Chart 13). As a result, their trailing P/E ratio has risen and the dividend yield has dropped (Chart 14). This implies that investors are looking through the current sales contraction and expecting an imminent recovery. Chart 13A Major Contraction In Corporate Earnings And Dividends
A Major Contraction In Corporate Earnings And Dividends
A Major Contraction In Corporate Earnings And Dividends
Chart 14Rising Trailing P/E And Falling Dividend Yield
Rising Trailing P/E And Falling Dividend Yield
Rising Trailing P/E And Falling Dividend Yield
If and as auto sales fail to stage a notable recovery in the next several months, these share prices will likely break down. Second, petroleum demand growth from the transportation sector will be decelerating in China over the coming years. Rising NEV sales as a share of total auto sales, substituting autos for LSEVs and a slower pace of growth in the number of vehicles on roads imply diminishing demand for gasoline in the coming years (Chart 15). Today BCA’s Emerging Markets Strategy service is also publishing a Special Report discussing India’s demand for oil. The report argues for slowing growth in Indian oil demand. Combined, China and India make up 19% of the world’s oil consumption (slightly lower than the 21% accounted for by the U.S.), and weaker demand growth in these economies is negative for oil prices. Third, investors should differentiate between a long-term economic view and investment strategy. We do not disagree with the economic viewpoint that auto ownership will rise in China in the years to come. But this will happen even if auto sales decline on an annual basis over the next 10 years. Chart 16 illustrates this point: if annual auto sales drop by 2% during each consecutive year over the next decade, and the scrap rate is around 3%, car ownership, defined as the share of households owning one car, will continue to rise from the current 50% level, reaching 80% by 2030. Chart 15Falling Growth In Existing Vehicles Entails Slower Growth In Gasoline Demand
Falling Growth In Existing Vehicles Entails Slower Growth In Gasoline Demand
Falling Growth In Existing Vehicles Entails Slower Growth In Gasoline Demand
Chart 16Stimulation: Car Ownership Can Rise With Shrinking Auto Sales
Stimulation: Car Ownership Can Rise With Shrinking Auto Sales
Stimulation: Car Ownership Can Rise With Shrinking Auto Sales
Nevertheless, such a scenario – a 2% annual drop in car sales in each consecutive year over the next decade - is bearish for automakers’ share prices. Any stock price is very sensitive to long-term growth expectations for corporate earnings.5 A 2% recurring annual drop in car sales will be disastrous for auto stock valuations. This is a case when the long-term economic view on rising prosperity and car ownership in China stands in contrast with a negative investment outcome for the auto sector and its shareholders. Ellen JingYuan He, Associate Vice President ellenj@bcaresearch.com Footnotes 1 Sales of total automobiles, including passenger vehicles and commercial vehicles. 2 From Chinese Banking Association Report on June 18, 2019. https://www.china-cba.net/Index/show/catid/14/id/26688.html 3 Guangzhou further added 10,000 car plates open to the public while Guiyang eliminated cap on new-vehicle sales. 4 https://www.wsj.com/video/big-in-china-tiny-electric-cars/CF7E986A-7C70-4EE3-8F7B-441621F10C94.html 5 The reason is that both interest rates and earnings long-term growth rate are present in the denominator of any cash flow discount model (Stock Price = Expected Dividends / (Interest rate – Earnings long-term growth rate)). Hence, they have the potential to affect share prices exponentially while dividends/profits are present in the numerator so their impact on equity prices is linear.
Dear Client, In lieu of our regular Weekly Report this week, tomorrow we will be publishing a joint Special Report on the Chinese automobile industry outlook with our Emerging Markets Strategy service, authored by my colleague Ellen JingYuan He. Best regards, Jing Sima China Strategist Feature Chart 1Chinese Economy Likely To Bottom In Q1
Chinese Economy Likely To Bottom In Q1
Chinese Economy Likely To Bottom In Q1
President Trump announced last Friday the first phase of a potential trade agreement with China. For now, the most concrete aspect of the announcement has been the deferral of an increase in tariffs that had been scheduled to occur this week, in exchange for agriculture purchase commitments from China. Market participants initially reacted with caution to the news, given the U.S. administration’s about-face in early-May and given signs from Beijing that China “needs time” to finalize a deal. However, Chinese policymakers have subsequently played up the progress made during the negotiations, and characterized both sides as being on “the same page”. We noted in last week’s report that China’s economy was likely to stabilize in Q1 of next year (Chart 1), but that a further shock to China’s external sector and/or internal policy missteps could easily tip the Chinese economy into a deeper growth slowdown.1 This, to us, justified a tactically bearish stance towards Chinese stocks, despite our positive cyclical bias. Indeed, following our tactical underweight call initiated on July 24,2 relative to global stocks, Chinese investable stocks dropped nearly 3% in the months of August and September in reaction to intensified trade tension. Chart 2Chinese Stocks Have Been Underperforming Since Late April
Chinese Stocks Have Been Underperforming Since Late April
Chinese Stocks Have Been Underperforming Since Late April
While it is not yet clear how substantive the final deal between the U.S. and China will be, it is our judgment that the odds of a further escalation in the trade war have legitimately fallen over the past week. Both sides of the negotiating table have strong incentives to reach a deal (particularly the U.S.), and both U.S. and Chinese policymakers may finally be acting in a way that is consistent with each side’s respective constraints. As such, we no longer feel that a tactical underweight stance is warranted, and we recommend that clients maintain a neutral stance towards Chinese stocks over the near term. The potential for the talks to collapse once again is keeping us from recommending an outright overweight tactical stance, as well as the small but still non-trivial chance that the final deal is not meaningful enough to help revive economic activity. Cyclically, a substantive trade deal would be bullish for Chinese stocks, as the relative performance of both the investable and domestic markets are meaningfully below their late-April highs (Chart 2). The stimulus that policymakers have already provided should be enough to stabilize Chinese domestic demand, and a trade deal should help reinforce a stabilization in sentiment and activity over the coming year. However, one risk to our cyclical positioning is that the removal of uncertainty for China’s exporters strengthens the will of Chinese policymakers to curb “excess” credit growth. For now, this remains “a story for another day”, as investors will almost certainly bid up Chinese stocks (particularly the investable market) in reaction to a deal. But the behavior of China’s credit impulse following the surge in Q1 of this year underscores that policymakers are very serious about preventing another significant rise in the macro leverage ratio. This could lead to a less optimistic outlook over the coming 6-12 months than we originally expected when we recommended upgrading Chinese stocks earlier this year, and is a risk that we will be continually monitoring over the coming months. Stay tuned! Jing Sima China Strategist JingS@bcaresearch.com Footnotes 1 Please see China Investment Strategy Weekly Report, “Mild Deflation Means Timid Easing”, dated October 9, 2019, available at cis.bcaresearch.com 2 Please see China Investment Strategy Weekly Report, “Threading A Stimulus Needle (Part 2): Will Proactive Fiscal Policy Lose Steam?”, dated July 24, 2019, available at cis.bcaresearch.com Cyclical Investment Stance Equity Sector Recommendations
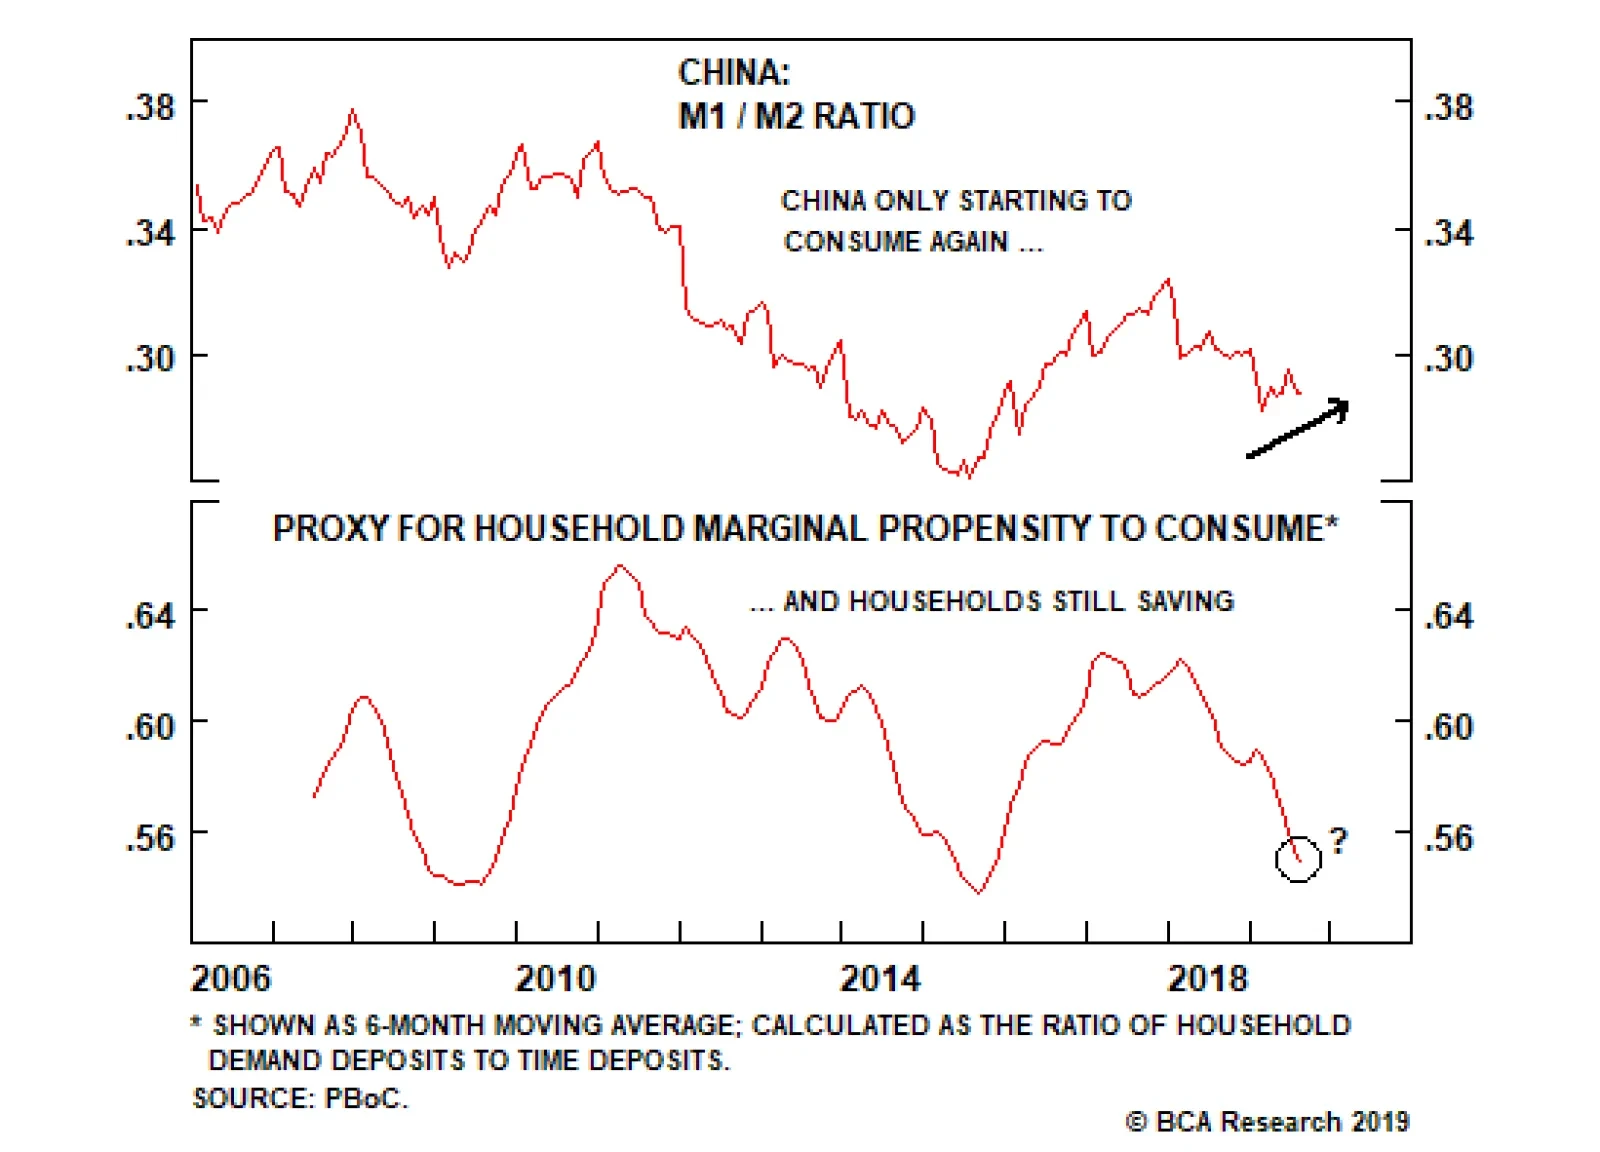
The Xi administration is not without its own constraints. Our proxies for China’s marginal propensity to consume show that Chinese animal spirits are still vulnerable, particularly on the household side, which has not responded to stimulus thus far. Since…
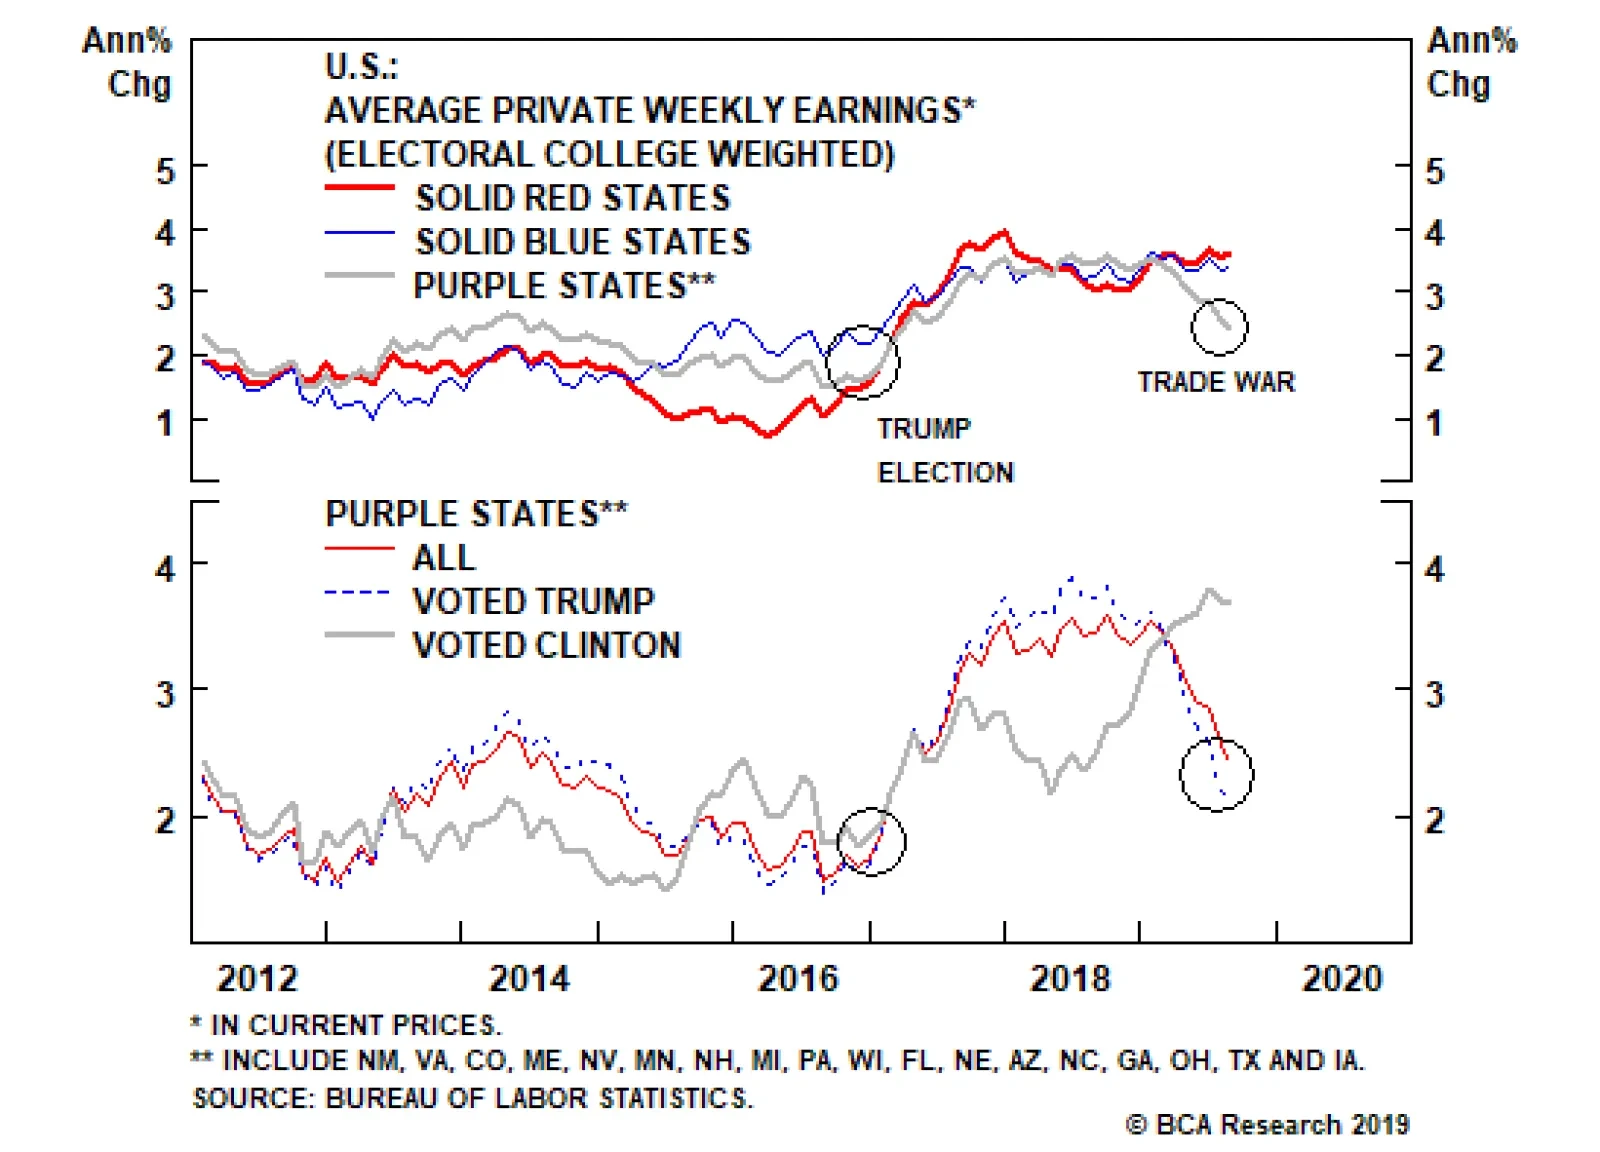
The U.S. and China held the thirteenth round of trade negotiations last week after a summer replete with punitive measures, threats, and failed restarts. Tensions spiked just ahead of the talks. But Friday afternoon, President Donald Trump announced that a…