China

Highlights An analysis on Thailand is available below. In all scenarios of global market performance, EM will underperform DM in the first half of 2020. Absolute return investors should be mindful of downside risks in EM financial markets. The principal drivers for EM corporate profits are domestic demand in both China and EM ex-China. US and European demand are not particularly relevant. We do not expect a recovery in domestic demand in China and the rest of EM in the early months of 2020. EM corporate profit growth is unlikely to turn positive in H1 2020. Volatility Is A Coiled Spring Chart I-1EM Stocks And Profits: An Unsustainable Divergence
EM Stocks And Profits: An Unsustainable Divergence
EM Stocks And Profits: An Unsustainable Divergence
EM share prices and currencies have been range-bound in 2019, despite the strong rally in DM share prices. On one hand, growing hopes of a US-China trade deal, global monetary easing and expectations of a global growth recovery have put a floor under EM (Chart I-1, top panel). On the other hand, a lack of actual growth recovery in EM/China, a deepening contraction in EM corporate profits and lingering structural malaises in many EM economies have capped upside potential (Chart I-1, bottom panel). Consistent with this sideways market action, implied volatility measures for EM equities and currencies have dropped to record lows (Chart I-2, top and middle panels). Similarly, implied volatility measures for commodities currencies – which tend to be strongly correlated with EM risk assets – have plummeted close to their historic lows (Chart I-2, bottom panel). Remarkably, DM currency markets’ implied volatility has also collapsed to the all-time lows recorded in 2007 and 2014 (Chart I-3, top panel). Chart I-2EM Vol Is A Coiled Spring
EM Vol Is A Coiled Spring
EM Vol Is A Coiled Spring
Chart I-3DM Currency Vol Is At Record Low
DM Currency Vol Is At Record Low
DM Currency Vol Is At Record Low
Nevertheless, past performance does not guarantee future performance. The fact that global financial market volatility has been very low over the past 12 months does not imply that it will remain subdued going forward. On the contrary, when DM currency volatility was this low in 2007 and 2014, it was followed by a bear market in EM risk assets (Chart I-3, bottom panel). Both EM and DM market volatility resemble a coiled spring. As such, it is quite likely these coiled springs will snap sometime in the first half of 2020. If this is indeed the case, it will be accompanied by a selloff in EM risk assets. We devote this report to discussing the reasons why such dynamics are likely to play out. An urge on the part of investors to deploy capital in EM has supported EM financial markets despite shrinking corporate profits. Hence, investment portfolios should be positioned for a resurgence in financial market volatility in general and currency volatility in particular in H1 2020. As we argued in our November 14 report, the US dollar is still enjoying tailwinds, especially versus EM and commodities currencies. All in all, asset allocators should continue to underweight EM stocks, credit markets and currencies relative to their DM counterparts. In all scenarios of global market performance, EM will underperform DM in the first half of 2020. Absolute return investors should be mindful of downside risks in EM financial markets. As always, the list of our recommended country allocations across EM equities, currencies, credit markets and domestic bonds is presented in the tables at the end of our report – please refer to pages 18-19. An Urge To Deploy Capital Amid Poor EM Fundamentals Investors’ unrelenting urge to deploy capital in EM financial markets put a floor under EM equities and currencies in 2019. Yet poor fundamentals have prevented EM equities and currencies from rallying. Such a battle between two opposing forces has produced a stalemate in EM financial markets. The same is true for commodities and many global market segments sensitive to global growth. Chart I-4Global Industrials: A Rally Without Profit Amelioration
Global Industrials: A Rally Without Profit Amelioration
Global Industrials: A Rally Without Profit Amelioration
This stalemate is unlikely to last forever. Next year will likely be a year of either an EM breakout or breakdown. EM corporate earnings hold the key, and China’s domestic demand is of paramount importance to the EM profit cycle. We discuss our outlook for both the China and EM business cycles below. Following are the reasons why we believe market expectations of a rebound in global growth are too optimistic, and that EM risk assets are at risk: First, there is a widening gap between share prices and corporate profits. Not only are EM per-share earnings shrinking at a double-digit rate, as shown in Chart I-1 on page 1, but also EM EPS net revisions have not yet turned positive. This widening gap between share prices and net EPS revisions is also striking for global industrials (Chart I-4). If corporate profits stage an imminent recovery, stocks will continue to advance. Alternatively, investor expectations will not be met, and a selloff will ensue. As the top panel of Chart I-5 illustrates, the annual growth rate of EM EPS will at best begin bottoming – from double-digit contraction territory – only in the second quarter of 2020. Odds are that investor patience might run out before that occurs and EM markets will sell off in such a scenario. Second, improvement in US and European growth is not in and of itself a sufficient reason to be positive on EM/China growth. In fact, neither US nor euro area consumer spending have been weak (Chart I-5, middle and bottom panels). Yet, EM growth and corporate profits have plunged. Hence, EM growth is by and large not contingent on consumer spending in the US and Europe. As we have repeatedly argued, EM profit growth and risk assets are driven by China/EM domestic demand, rather than by US or European growth cycles. Third, EM financial markets are not cheap. Our composite valuation indicators based on 20% trimmed-mean and equal-weighted multiples indicate that stocks are trading close to their fair value (Chart I-6). These indicators are composed based on the trailing and forward P/E ratios, price-cash earnings, price-to-book value and price-to-dividend ratios for 50 EM equity subsectors. Chart I-5EM Profits Are Driven By China Not US Or Europe
EM Profits Are Driven By China Not US Or Europe
EM Profits Are Driven By China Not US Or Europe
Chart I-6EM Equities Are Fairly Valued
EM Equities Are Fairly Valued
EM Equities Are Fairly Valued
When valuations are neutral, stock prices can rise or drop depending on the outlook for corporate profits. Provided we believe EM corporate profits will continue to contract for now, risks to share prices are skewed to the downside. Finally, several markets are still conveying a cautious message regarding EM assets. Specifically: There are cracks forming in EM credit markets. EM sovereign credit spreads are widening. Remarkably, emerging Asian high-yield corporate bond yields – shown inverted in Chart I-7 – are beginning to rise. Rising borrowing costs for high-yield borrowers in emerging Asia have historically heralded lower share prices in the region (Chart I-7). Chains often break in their weak links. Similarly, selloffs commence in the weakest segments and then spread from there. Hence, the budding weakness in emerging Asian junk corporate bonds and EM sovereign credit could be signals of a forthcoming selloff in EM/China plays. Remarkably, emerging Asian and Chinese small-cap stocks have failed to stage a rally in the past three months – despite global risk appetite having been strong (Chart I-8). This also signifies the lack of a meaningful recovery in emerging Asia in general and China in particular. Chart I-7A Canary In A Coal Mine?
A Canary In A Coal Mine?
A Canary In A Coal Mine?
Chart I-8No Rally In Chinese And Emerging Asian Small Caps
No Rally In Chinese And Emerging Asian Small Caps
No Rally In Chinese And Emerging Asian Small Caps
Chart I-9Semiconductor Prices Are Still Subdued
Semiconductor Prices Are Still Subdued
Semiconductor Prices Are Still Subdued
Last but not least, cyclical currencies and commodities markets are not signaling a global business cycle recovery. Neither industrial metals nor oil prices have been able to rally meaningfully. EM currencies have also failed to appreciate versus the dollar. In addition, semiconductor prices – both DRAM and NAND – remain weak (Chart I-9). Bottom Line: An urge on the part of investors to deploy capital in EM has supported EM financial markets despite a poor growth background, in general, and shrinking corporate profits, in particular. China: Structural Malaises To Delay A Cyclical Recovery Recent macro data, particularly PMIs, have once again raised hopes of a business cycle recovery in China. While it is reasonable to infer that the industrial cycle in China has recently stabilized, sequential improvements will be hard to achieve in the coming months for the following reasons: The credit and fiscal spending impulse has historically led the manufacturing cycle in China on average by about nine months. However, this time gap has varied – from three months in the first quarter of 2009 to about 20 months in 2017 (Chart I-10). Chart I-10China Credit/Fiscal Impulse And Business Cycle: Varying Time Lags
China Credit/Fiscal Impulse And Business Cycle: Varying Time Lags
China Credit/Fiscal Impulse And Business Cycle: Varying Time Lags
There are several reasons why the time lag could be longer than nine months in the current cycle: (1) The US-China confrontation is dampening sentiment among both enterprises and households in China. Marginal propensity to spend among households and enterprises is low and has not improved (Chart I-11). A Phase One deal is unlikely to reverse this. The fact remains that the US and China have failed to reach an even small and limited accord in the past year of negotiations. With this in mind, even if there is a Phase One deal, businesses both in China and around the world are unlikely to alter their investment plans substantially. (2) Regulatory pressures on banks and on the shadow banking sector to deleverage remain acute. Although the People’s Bank of China has reduced interest rates and is providing ample liquidity, the regulatory tightening measures from 2016-2018 have not been reversed. Consistently, commercial banks’ assets and broad bank credit growth are rolling over anew (Chart I-12). Chart I-11China: Lack Of Appetite To Spend For Enterprises And Households
China: Lack Of Appetite To Spend For Enterprises And Households
China: Lack Of Appetite To Spend For Enterprises And Households
Chart I-12Banking System Is Now More Restrained Compared With Previous Stimulus Episodes
Banking System Is Now More Restrained Compared With Previous Stimulus Episodes
Banking System Is Now More Restrained Compared With Previous Stimulus Episodes
(3) There has been no stimulus targeting the real estate market. Without a recovery in the property market – both strong price appreciation and construction activity – it will be difficult to achieve a business cycle recovery. The basis is that real estate – not exports to the US – has been the key pillar driving China’s growth over the past 10 years. Even if there is a Phase One deal, businesses both in China and around the world are unlikely to alter their investment plans substantially. In the onshore bond market, government bond yields do not confirm the sustainability of the improvement in the national manufacturing PMI (Chart I-13). China’s local currency government bond yields have generally been a good coincident indicator for the industrial cycle, and they are not flashing green. Chart I-13Chinese Local Bond Yields Doubt The Sustainability Of A Stronger PMI
Chinese Local Bond Yields Doubt The Sustainability Of A Stronger PMI
Chinese Local Bond Yields Doubt The Sustainability Of A Stronger PMI
November Asian and Chinese trade data have been somewhat mixed. Korea’s total exports and exports to China still show double-digit contraction (Chart I-14, top panel). Similarly, Japanese foreign machine tool orders – both total and from China – remain in deep contraction (Chart I-14, middle panel). In contrast, Taiwanese exports to China and to the world ex-China have improved (Chart I-14, bottom panel). The recuperation in Taiwanese exports to China could be attributed to stockpiling of semiconductors by mainland companies. Odds are that China has decided to stockpile semiconductors from Taiwan, given the lingering uncertainty over the China-US relationship, especially regarding China’s access to semiconductors. Real estate – not exports to the US – has been the key pillar driving China’s growth over the past 10 years. Infrastructure spending remains lackluster, despite a surge in special bond issuance by local governments over the past 12 months (Chart I-15, top panel). Chart I-14Asian Trade Was Still Very Weak In November
Asian Trade Was Still Very Weak In November
Asian Trade Was Still Very Weak In November
Chart I-15China: Domestic Demand Is Lackluster
China: Domestic Demand Is Lackluster
China: Domestic Demand Is Lackluster
Chart I-16EM Ex-China: No Recovery In Domestic Demand
EM Ex-China: No Recovery In Domestic Demand
EM Ex-China: No Recovery In Domestic Demand
The reason is that special bond issuance accounts for a small share of infrastructure investment. Bank loans, corporate bond issuance by LFGVs and land sales are still the main source of funding for capital expenditures on infrastructure. Finally, on the consumer side, auto sales are contracting for a second straight year, while smartphone sales are flat-to-down for a third year in a row (Chart I-16, middle and bottom panels). EM Ex-China: Mind The Deflationary Forces In EM ex-China, Korea and Taiwan, not only are their exports weak, but their domestic demand trajectory is also downbeat (Chart I-16). Despite rate cuts by EM central banks, their interest rates remain elevated in real terms (adjusted for inflation). The basis is that inflation has dropped as much as policy rate cuts. In fact, in many economies, inflation is flirting with all-time lows (Chart I-17). Furthermore, lending rates by banks have not been adjusted sufficiently low in line with the declines in policy rates. Consequently, local borrowing costs in EM remain elevated. Not surprisingly, broad money growth is close to a record low (Chart I-18). Chart I-17EM Ex-China: Inflation Is At A Record Low
EM Ex-China: Inflation Is At A Record Low
EM Ex-China: Inflation Is At A Record Low
Chart I-18EM Ex-China: More Aggressive Monetary Easing Is Necessary
EM Ex-China: More Aggressive Monetary Easing Is Necessary
EM Ex-China: More Aggressive Monetary Easing Is Necessary
Table I-1EM Corporate Profits Across Sectors
2020 Key Views: A Resolution Of The EM Stalemate
2020 Key Views: A Resolution Of The EM Stalemate
Without recognizing non-performing loans and recapitalizing banks, a sustainable credit cycle - and hence domestic demand recovery - is implausible in many EM countries. This will impede the corporate profit recovery, especially for banks that account for 28% of MSCI EM corporate profits (Table I-1). As we argued in our November 14 report, such deflationary tendencies in many EM economies warrant a weaker currency. Bottom Line: The principal drivers for EM corporate profits are domestic demand in China and EM ex-China, rather than the ones in the US or Europe. We do not expect a recovery in domestic demand in both China and the rest of EM in the early months of 2020. Arthur Budaghyan Chief Emerging Markets Strategist arthurb@bcaresearch.com Thailand: Bet On More Monetary Easing Chart II-1Thailand Is Flirting With Deflation
Thailand Is Flirting With Deflation
Thailand Is Flirting With Deflation
Deflationary pressures are mounting in Thailand. This will lead the central bank to cut interest rates much further. We therefore recommend to continue overweighting Thai domestic bonds within an EM local bond portfolio, currency unhedged. Thailand’s economy is flirting with deflation and needs lower interest rates, a cheaper currency and a fiscal boost: Core inflation has fallen to a mere 0.5%. Likewise, headline inflation has plunged to 0.2%, which is far below the central bank’s lower-bound target of 1% (Chart II-1). Further, nominal GDP growth has dropped below the prime lending rate (Chart II-2). Adjusted for core inflation, real lending rates are too high for the economy to handle. If lending rates are not brought down, credit demand will decline further and non-performing loans will mushroom (Chart II-3). Chart II-2Thailand: Nominal GDP Growth Is Below Prime Lending Rate
Thailand: Nominal GDP Growth Is Below Prime Lending Rate
Thailand: Nominal GDP Growth Is Below Prime Lending Rate
Chart II-3Thailand: Decelerating Domestic Credit
Thailand: Decelerating Domestic Credit
Thailand: Decelerating Domestic Credit
High borrowing costs are especially detrimental for the non-financial private sector – households in particular. Consumer debt currently stands at 125% of disposable income. The central bank is set to deliver more rate cuts and will probably begin intervening in the foreign exchange market to weaken the baht. Thailand’s economic growth has decelerated and more downside is likely. Business sentiment is deteriorating, companies’ book orders are falling and manufacturing production is contracting (Chart II-4, top panel). Overall, corporate earnings are shrinking 8% from a year ago in local currency terms (Chart II-4, bottom panel). Declining corporate profitability is beginning to hurt capex and employment. In turn, slower employment and wage growth have hit consumer confidence. Private consumption volume has decelerated decisively (Chart II-5, top panel) and passenger vehicle sales are falling (Chart II-5, bottom panel). Chart II-4Thailand: Business Sentiment Is Falling
Thailand: Business Sentiment Is Falling
Thailand: Business Sentiment Is Falling
Chart II-5Thailand: Consumer Spending Has Been Hit
Thailand: Consumer Spending Has Been Hit
Thailand: Consumer Spending Has Been Hit
Chart II-6Thailand's Real Estate Market Is Weak
Thailand's Real Estate Market Is Weak
Thailand's Real Estate Market Is Weak
The real estate market is also slowing down. Chart II-6 shows various types of residential property prices. Specifically, house price appreciation has either decelerated or turned into deflation. Accordingly, construction activity has been weak. Overall, the Thai economy needs significant monetary and fiscal easing. Yet the 2020 fiscal budget entails only a 6% increase in expenditures in nominal terms, which is insufficient to halt the economy’s downtrend momentum. With the budget already set, aggressive monetary easing - in the form of generous rate cuts and foreign exchange interventions to induce some currency depreciation – is the only tool available to the authorities at the moment. Bottom Line: The Thai economy is facing strong deflationary forces and requires lower interest rates and a cheaper currency. The central bank is set to deliver more rate cuts and will probably begin intervening in the foreign exchange market to weaken the baht. Investment Recommendations Local interest rates will drop further and the Bank of Thailand (BoT) will keep cutting interest rates next year in the face of mounting deflationary trends in the economy. For dedicated EM fixed-income portfolios, we recommend keeping overweight positions in Thai local currency bonds and sovereign credit within their respective EM portfolios. While the Thai baht could depreciate because of monetary easing, the currency will still perform better than many other EM currencies. Thailand carries a very robust current account surplus of 6% of GDP. This will provide a cushion for the baht. Furthermore, foreign ownership of local currency bonds is low at 18%. This limits potential foreign outflows from local bonds in case the currency depreciates. In addition, Thailand’s foreign debt obligations - which are calculated as the sum of short-term claims, interest payments and amortization over the next 12 months - are small, accounting for 14% of exports. This limits hedging needs by Thai debtors with foreign currency liabilities and, hence, the currency’s potential downside. We recommend EM equity investors to keep an overweight position in Thai equities. First, Thai bourse is defensive in nature – with utilities, consumer staples and healthcare accounting for 27% of the MSCI Thailand market cap – and will begin outperforming as EM share prices come under renewed stress (Chart II-7, top panel). Second, net EPS revision in Thailand vs. EM has plummeted to a 16-year low (Chart II-7, bottom panel). This entails that a lot of bad news has already been priced in relative terms. Finally, narrow money (M1) growth seems to be bottoming. This is occurring because the central bank has begun accumulating foreign exchange reserves. While it might take some time before monetary easing leads to an economic recovery, Thai share prices will benefit from it early on (Chart II-8). Chart II-7Thailand vs. EM: Relative Stock Prices And Earnings Revisions
Thailand vs. EM: Relative Stock Prices And Earnings Revisions
Thailand vs. EM: Relative Stock Prices And Earnings Revisions
Chart II-8Thailand: Narrow Money And Share Prices
Thailand: Narrow Money And Share Prices
Thailand: Narrow Money And Share Prices
Ayman Kawtharani Editor/Strategist ayman@bcaresearch.com Footnotes Equities Recommendations Currencies, Credit And Fixed-Income Recommendations
China’s current economic slowdown predates the trade war and is due to its domestic financial deleveraging campaign that began in early 2017. The trade war exacerbated an existing downward trend in the economy, but was not the cause of it. In 2020, we…
Both President Trump and President Xi will need to adjust to their respective constraints next year. Trump must sustain a strong domestic economy to increase his re-election odds. He will cater to the US economy and financial markets, by trying to de-escalate…
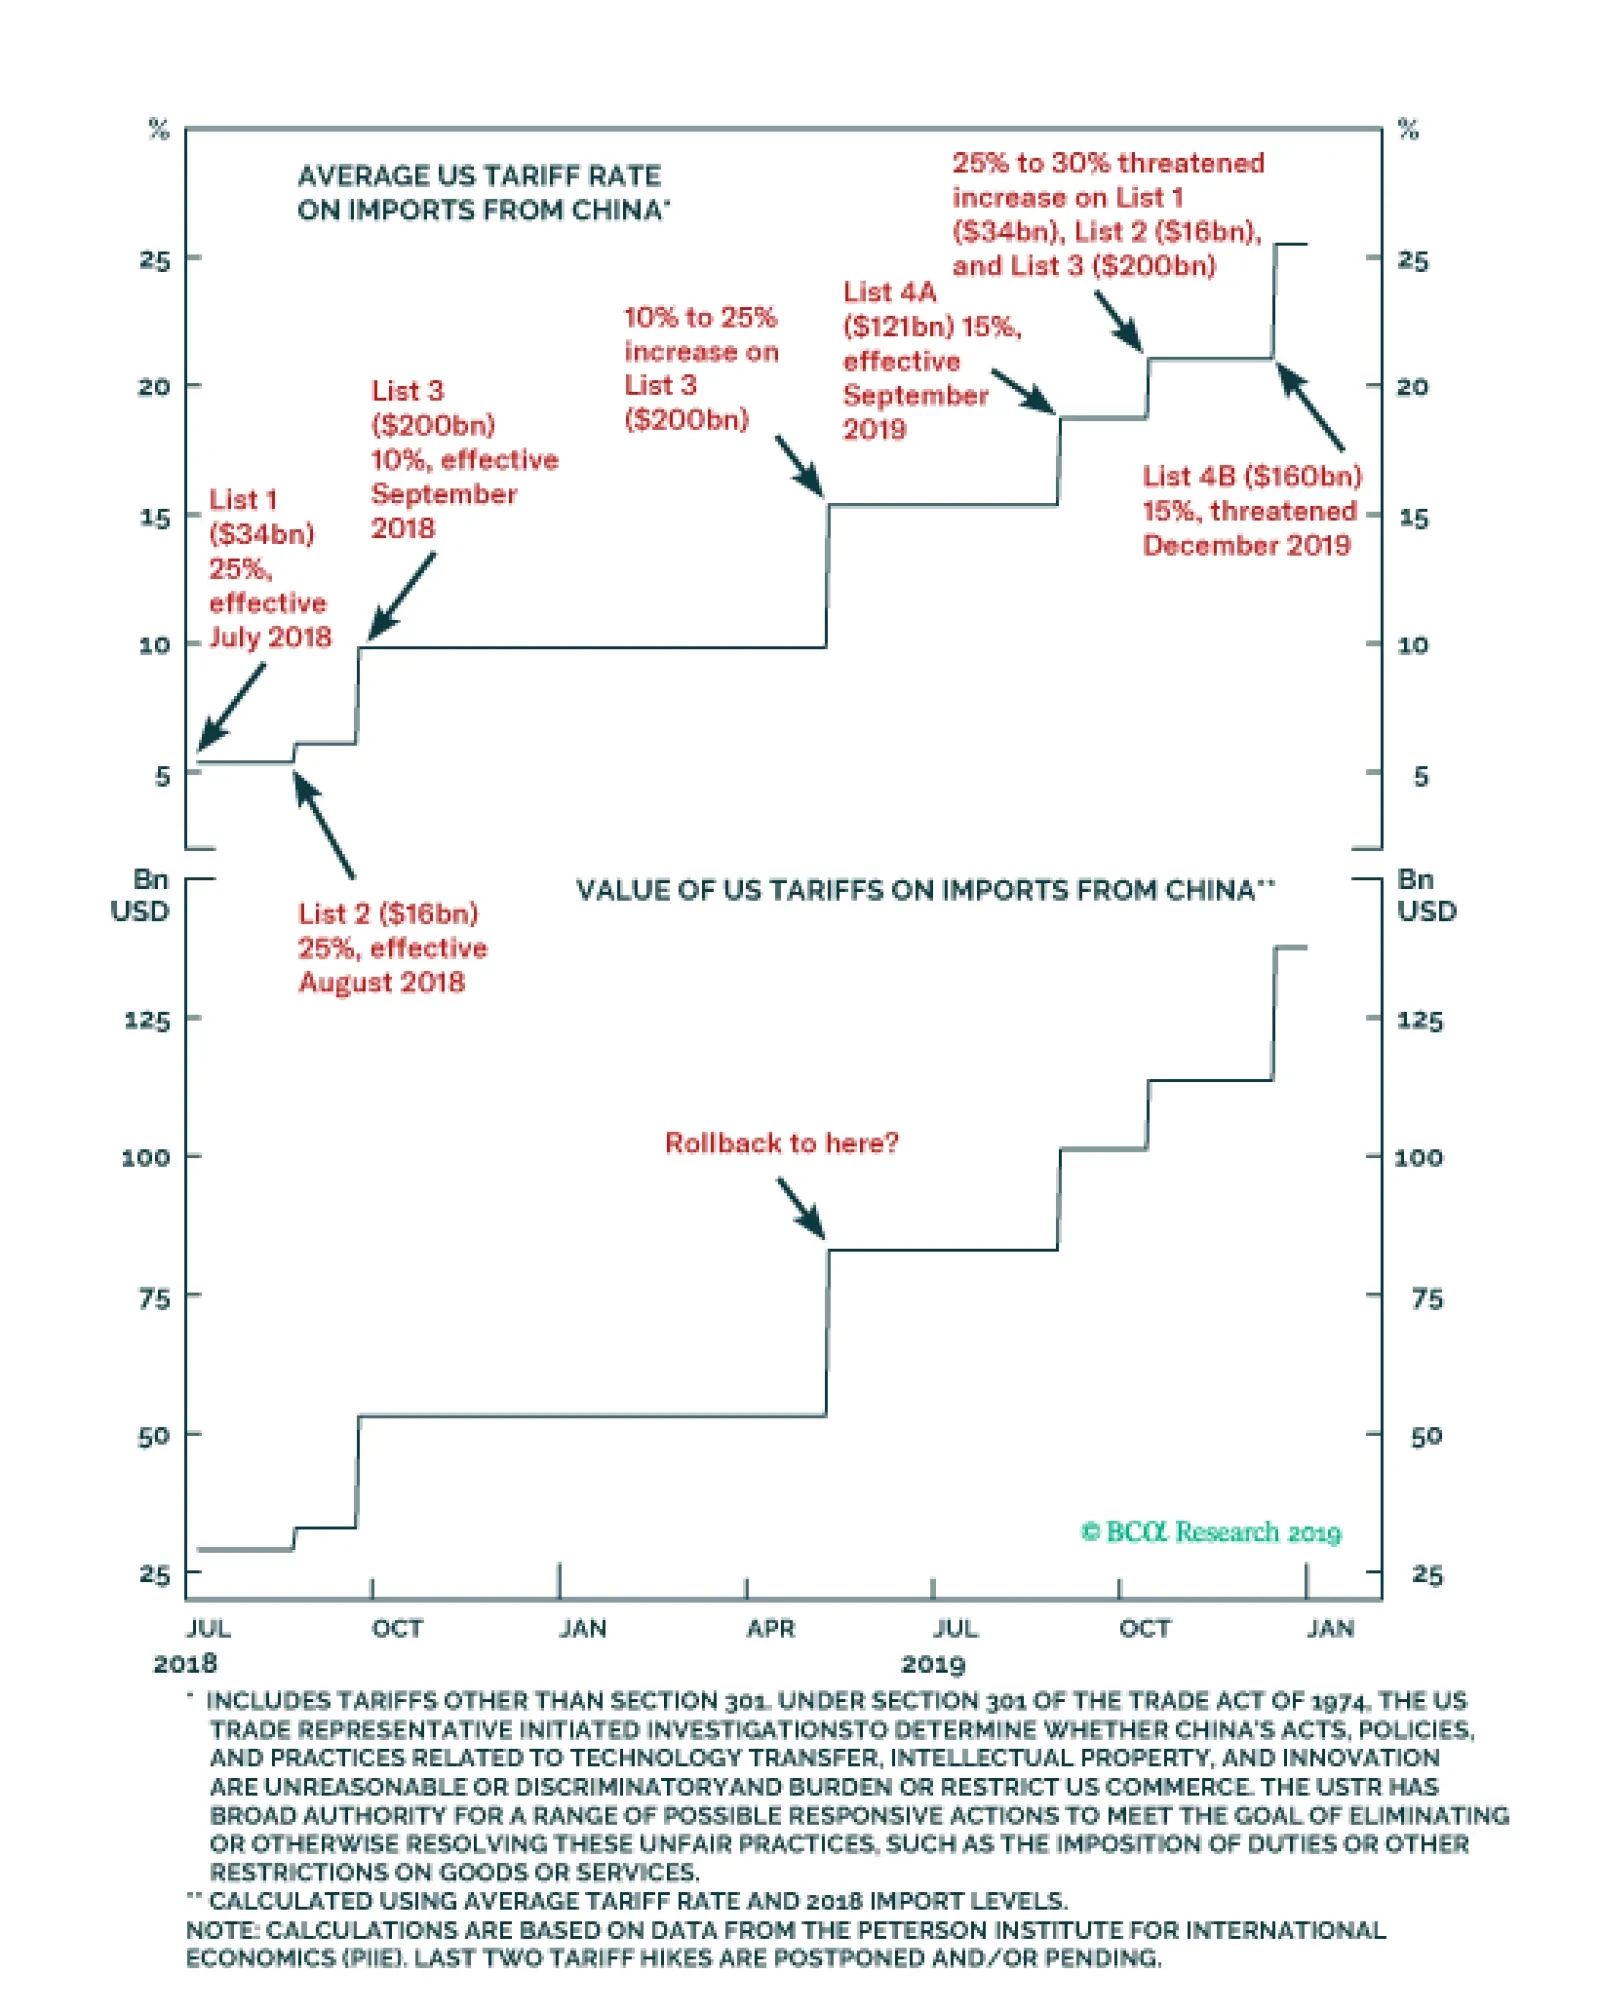
Highlights We expect tensions from the Sino-US trade war to marginally ease in 2020, in the run-up to the US presidential election. The “Phase One” trade deal will likely be signed with a good possibility of some tariff rollbacks. Chinese policymakers will roll out more stimulus to secure an economic recovery in 2020, and external demand will improve. But we expect growth in both the domestic economy and exports to only modestly accelerate. During the next 6 to 12 months, investors should remain bullish on both Chinese A shares and investable stocks, while keeping in mind that relative outperformance, particularly for A-shares, could be frontloaded in the first half of the year. Despite sharply rising amount of defaults, Chinese onshore bonds are priced at a much higher premium than warranted by their default risk. We continue to favor Chinese onshore corporate bonds in both absolute terms and in relative to duration-matched government bonds. Feature BCA Research recently published its special year end Outlook report for 2020, which described the macro themes that are likely to drive global financial markets over the coming year. In this week’s China Investment Strategy report we elaborate on the Outlook, by reviewing our four key themes for China in the year ahead. Key Theme #1: Tension From The Trade War With The US Will Ease In 2020 Despite the harsh rhetoric and threats of retaliation from both the US and China, we expect that the real risks to the global economy from the Sino-US trade war will decline in 2020. In trade negotiations next year, both President Trump and President Xi will need to adjust to their respective constraints. Both President Trump and President Xi will need to adjust to their respective constraints next year. Trump must sustain a strong domestic economy to increase his re-election odds. He will cater to the US economy and financial markets, by trying to de-escalate trade tensions and keeping negotiations going with China. This means he is likely to hold off on tariffs on China, and quite possibly even agree to roll back tariffs to August 2019 or April 2019 levels (Chart 1). Chart 1Some Tariff Rollback Is Possible
Some Tariff Rollback Is Possible
Some Tariff Rollback Is Possible
President Xi also faces economic constraints as the Chinese economy is on an unsure footing. The buildup in leverage in the non-financial sector over the past decade has prevented Chinese policymakers from aggressively stimulating the economy by relying on the old debt-oriented policies. Chinese policymakers are concerned about employment stability.1 The private sector, which accounts for 80% of all job creation in China, has been disproportionally hit by the trade war and tariffs compared to the more domestically oriented state-owned enterprises. These economic constraints suggest that it is in China’s best interest to avoid any further friction with the US. Therefore, the “Phase One” trade deal will likely be signed, with a good possibility of some tariff rollbacks. Trade talks will continue in the run-up to the US presidential election, and any escalation will probably occur in non-trade, non-tariff areas. This means that policy uncertainty surrounding the Sino-US trade war will decline in 2020. Bottom Line: We expect tensions from the Sino-US trade war to marginally ease in 2020. However, the risk to this base case view is high and geopolitical uncertainty remains elevated, as suggested by our Geopolitical Strategy team.2 Trade war tensions could re-emerge, which potentially could end the global business cycle and equity bull market. Key Theme #2: Stimulus Versus Shock: Approaching An Inflection Point We presented some simple “arithmetic” in May showing that in order for investors to be bullish on Chinese stocks, the impact of China’s reflationary efforts needed to more than offset the negative shock to the economy from tariffs.3 In other words, a bullish Chinese equity scenario required Stimulus – Shock > 0. In terms of China’s real economy, 2019 essentially panned out to be a Stimulus – Shock =0 scenario, with a “half strength” reflationary response (measured by its credit impulse) barely offsetting the trade shock to the economy (Chart 2). So far on an aggregate level, the shock from tariffs on China’s economy has had a limited direct impact. This is because exports to the US account for only 3.6% of China’s aggregate economy, whereas domestic capex accounts for more than 40% (Chart 3). Our calculation suggests a 10% annualized decline in export growth to the US would shave off 0.4 percentage points from China’s nominal GDP growth. Chart 2This Year, Measured Stimulus Has Just Offset Shocks To The Economy
This Year, Measured Stimulus Has Just Offset Shocks To The Economy
This Year, Measured Stimulus Has Just Offset Shocks To The Economy
Chart 3Domestic Demand Much More Important Than Exports To The US
Domestic Demand Much More Important Than Exports To The US
Domestic Demand Much More Important Than Exports To The US
Additionally, evidence suggests that a large portion of China’s exports to the US has been rerouted through peripheral countries, such as Taiwan and Vietnam (Chart 4). This fact explains why China’s exports have been in-line with the trend of global trade this year (Chart 5). Chart 4Chinese Exports Finding Alternative Routes To The US...
Chinese Exports Finding Alternative Routes To The US...
Chinese Exports Finding Alternative Routes To The US...
Chart 5...And Total Exports Have Been Holding Up
...And Total Exports Have Been Holding Up
...And Total Exports Have Been Holding Up
Chart 6China's Economic Slowdown Predates The Trade War
China's Economic Slowdown Predates The Trade War
China's Economic Slowdown Predates The Trade War
It is important for investors to remember that China’s current economic slowdown predates the trade war and is due to its domestic financial deleveraging campaign that began in early 2017. The trade war exacerbated an existing downward trend in the economy, but was not the cause of it (Chart 6). In 2020, while we expect a ceasefire in the trade war and a potential rollback of tariffs would ease the shock to China’s economy, we also believe that more pro-growth policy support is underway.4 From an investment perspective, this means both China’s economic conditions and corporate earnings will improve, supporting a bullish cyclical outlook for China-related assets. Still, several reasons point to the overall scale of stimulus being less than that of 2015-16, and the upside to China’s export growth will likely be limited given elevated geopolitical uncertainties. Therefore, it is unrealistic to expect a material acceleration in Chinese economic growth in 2020: China is still falling short of its target to double urban income by 2020. Chart 7A 6% Growth Next Year May Just Make The Cut
A 6% Growth Next Year May Just Make The Cut
A 6% Growth Next Year May Just Make The Cut
Next year will mark the final year for Chinese policymakers to accomplish the goal of “Doubling GDP by 2020”. Without the recent upward revision to the level of its 2018 nominal GDP by 2.1%, China's economy would have to expand by at least 6.1% in 2020 to achieve the goal. The upward revision allows a lower economic growth rate in 2020 to reach the goal (Chart 7). China is still falling short of its target to double urban income by 2020 (Chart 8). While keeping economic growth and employment stable remains a top priority, the recent slight improvement in employment should provide some relief to Chinese policymakers (Chart 9). Chart 8China Is Falling Short Of Urban Income Target...
China Is Falling Short Of Urban Income Target...
China Is Falling Short Of Urban Income Target...
Chart 9...But There Is Some Relief In The Labor Market
...But There Is Some Relief In The Labor Market
...But There Is Some Relief In The Labor Market
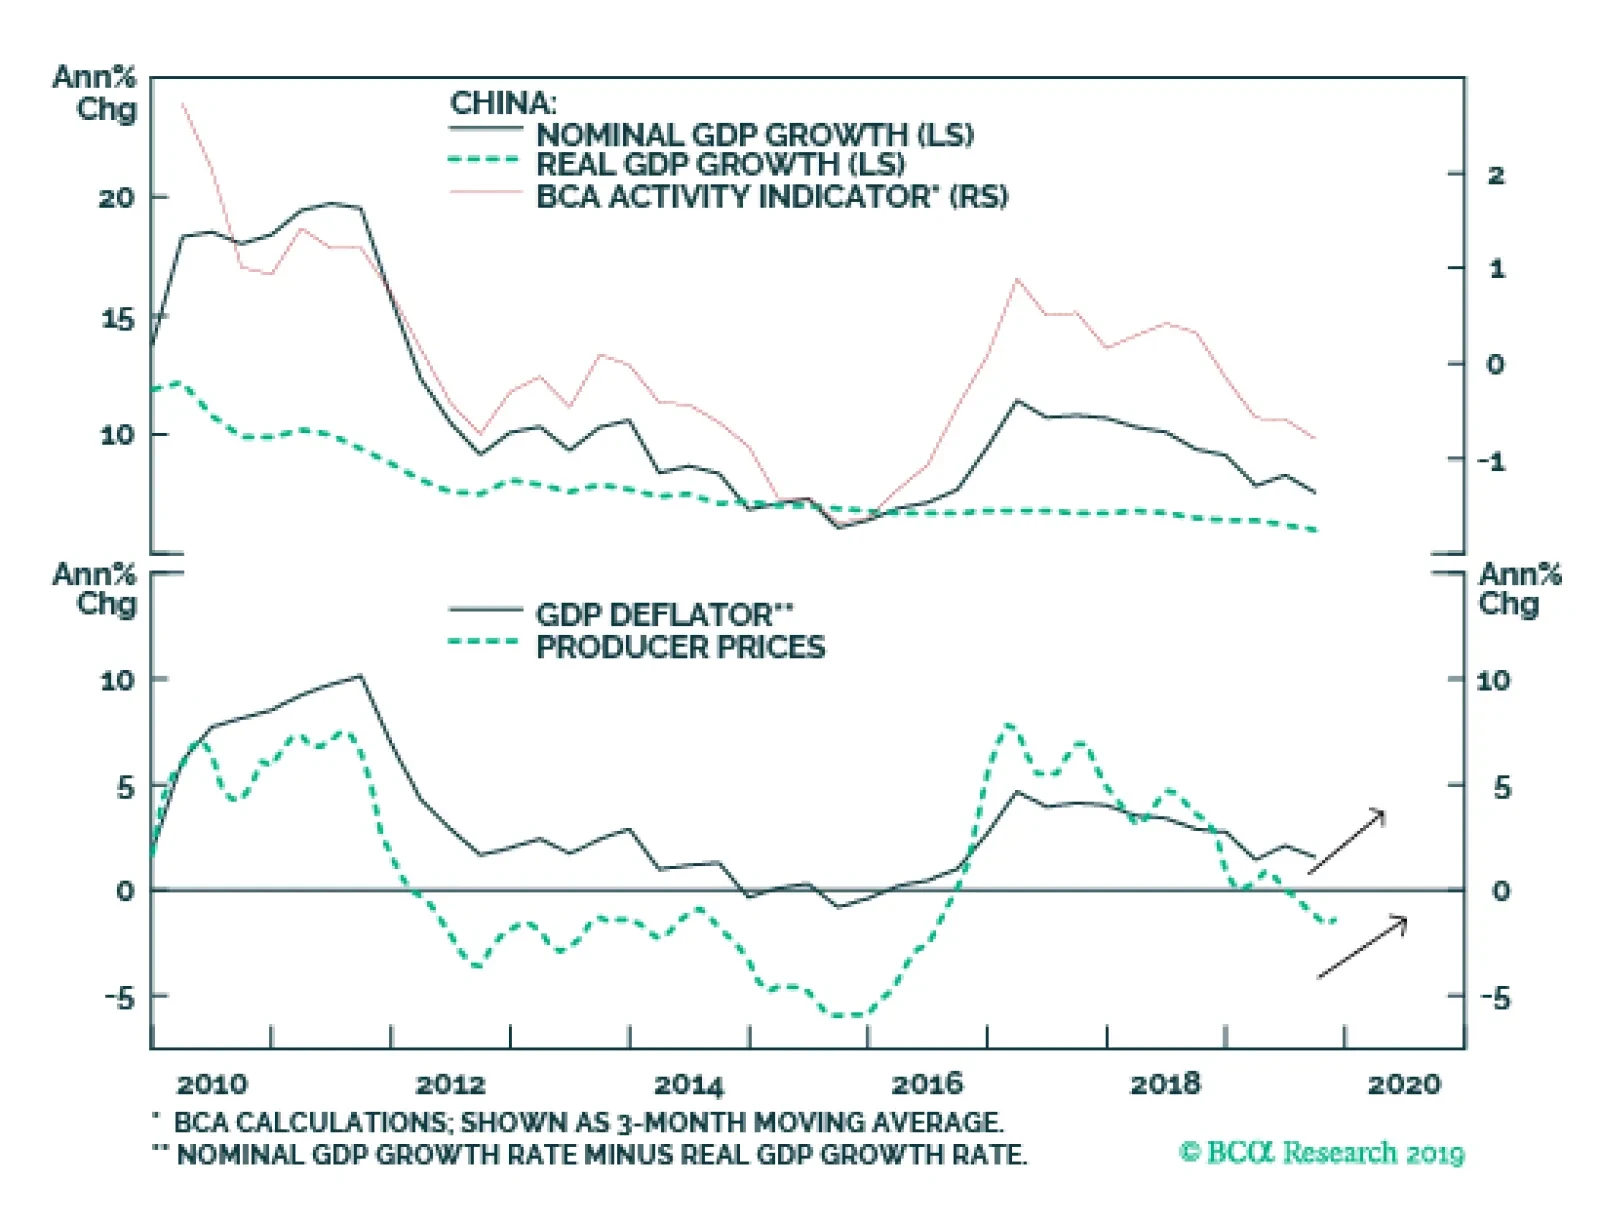
Monetary policy will remain accommodative, with room for further cuts to interest rates and the reserve requirement ratio (RRR). Nonetheless, we think Chinese policymakers will only allow monetary policy to loosen incrementally and modestly, while keeping a lid on corporate leverage. According to a recent article published by Yi Gang, the governor of China’s central bank, the PBoC will be keen to avoid another boom-bust cycle.5 Fiscal stimulus will continue to take the center stage in supporting growth in 2020, as noted in our November 20th China Investment Strategy Weekly.6 We expect that the National People’s Congress in March 2020 will approve higher quotas on issuing local government bonds, and loosened capital requirements will likely further boost local governments’ infrastructure project funding and expenditures. Transportation and urban development infrastructure projects will likely to continue receiving the most policy support in 2020. Other areas such as environmental protection, education, and social security will continue to be the Chinese government’s focus. These areas are unlikely to translate into immediate economic growth, but will improve China’s long-term economic and social structures. In contrast, compared to the 2015-2016 cycle, housing construction will receive less fiscal support (Chart 10). Overall, we expect the Chinese government to set next year’s real GDP growth target between 5.5 - 6.0%, a half of a percentage point lower than the growth target for 2019. Despite slower real output growth, nominal GDP and economic conditions will bottom in the first quarter of 2020, subsequently pushing up core inflation and reversing an ongoing deflation in the industrial sector (Chart 11). Chart 10Transportation And Urban Development Projects Are Again In Favor
2020 Key Views: Four Themes For China In The Coming Year
2020 Key Views: Four Themes For China In The Coming Year
Chart 11Nominal Output Will Tick Up Soon
Nominal Output Will Tick Up Soon
Nominal Output Will Tick Up Soon
Bottom Line: Chinese policymakers will roll out more stimulus to secure an economic recovery in 2020, and external demand will improve. But we expect growth in both the economy and export to only modestly accelerate. Key Theme #3: Improved Earnings Outlook Supports A Cyclically Bullish View On Chinese Stocks A combination of further policy support, improved earnings and decreased trade tensions should provide tailwinds to Chinese stocks in 2020. Chinese stocks will outperform the global benchmark over a cyclical time horizon (6- to 12-months), for the following reasons: Valuations are depressed relative to global averages: the forward P/E ratios of both China’s onshore A-shares and offshore investable stocks are well below the global benchmark (Chart 12). While the forward P/E ratio of the A-share index is hovering around 12 times, the investable market has particularly suffered a setback from uncertainties surrounding the trade war. Even taking into account that structural weakness in the Chinese corporate earnings growth justifies for a lower multiple than the global average, both Chinese onshore and offshore stocks are offering even deeper discounts than their peaks in 2018, compared to global benchmarks. Chart 12Valuations Of Chinese Stocks Are Depressed
Valuations Of Chinese Stocks Are Depressed
Valuations Of Chinese Stocks Are Depressed
Chart 13Chinese Corporate Earnings Closely Track Economic Conditions
Chinese Corporate Earnings Closely Track Economic Conditions
Chinese Corporate Earnings Closely Track Economic Conditions
Both the economy and earnings growth will improve: We expect the Chinese economy to bottom in the first quarter of 2020. Given the close correlation between the coincident economic activity and earnings cycle, we expect earnings to also improve in 2020 (Chart 13). Improved corporate earnings next year will be the catalyst for the currently cheap multiples in Chinese stocks to re-rate, and re-approach their early 2018 high. Our Earnings Recession Probability Model shows that the probability of an upcoming earnings recession has dropped to 35% from its peak of 85% in early 2019 (Chart 14). Additionally, Chart 15 highlights that the 12-month forward EPS momentum has turned modestly positive. Chart 14Probability Of An Upcoming Earnings Recession Has Significantly Dropped
Probability Of An Upcoming Earnings Recession Has Significantly Dropped
Probability Of An Upcoming Earnings Recession Has Significantly Dropped
Chart 1512-Month Forward EPS Momentum Has Turned Modestly Positive
12-Month Forward EPS Momentum Has Turned Modestly Positive
12-Month Forward EPS Momentum Has Turned Modestly Positive
There are, however, a few caveats to our bullish cyclical view on Chinese stocks. First, while it is not our base case view, geopolitical risks, particularly the Sino-US trade war, could end the global business cycle and equity bull market in 2020. Within the context of falling global stocks, we think Chinese domestic A shares would passively outperform global benchmarks, as A shares are mostly driven by China’s domestic credit and economic growth, and are less sensitive to trade frictions. But investable stocks would clearly underperform in this scenario. The odds are decent that all of the outperformance of Chinese stocks in 2020 will be frontloaded in the first half of the year. Secondly, the odds are decent that all of the outperformance of Chinese stocks in 2020 will be frontloaded in the first half of the year. We expect credit growth, infrastructure spending and the economy to improve in the first quarter. If the “Phase One” trade deal is also signed during that period, onshore A shares and investable stocks will significantly outperform their global counterparts in the first and possibly the early part of the second quarter. However, in the second half of next year, if the Chinese economy stabilizes but stimulus does not ramp up further, then the upside potential in both bourses may be capped as investors will question whether Chinese stocks will continue to gain ground in relative terms. We will closely monitor Chinese credit growth and trade negotiations throughout 2020 to determine if there is more eventual upside potential to economic growth, and thus Chinese earnings prospects, than we currently believe. While we recommend a cyclically bullish stance towards Chinese stocks for next year, our tactical (i.e. 0-3 month) stance remains neutral. We expect to align our tactical and cyclical stances soon, and are awaiting confirmation of a hard data improvement alongside a breakout of key technical conditions to do so.7 Bottom Line: During the next 6 to 12 months, investors should remain bullish on both Chinese A shares and investable stocks within a global equity portfolio. However, investors should also keep in mind that the relative outperformance, particularly for the A-share market, could be frontloaded in the first half of 2020. Key Theme #4: We Continue To Favor Chinese Onshore Bonds, Despite Default Concerns Chart 16Global Investors Are Piling Into The Chinese Bond Market
Global Investors Are Piling Into The Chinese Bond Market
Global Investors Are Piling Into The Chinese Bond Market
Despite sharply rising defaults, Chinese onshore bonds are still priced at a much higher premium than warranted by their default risk. This view is increasingly shared by global investors, as evident in the capital flows into China’s onshore bond market (Chart 16). While the total amount of bond defaults in the first eleven months of 2019 was an astonishing 120.4 billion yuan, they account for only half percent of China’s total onshore bonds issued. A 0.5 percent default rate is in line with global ex-US, and 160 bps below the default rate in the US (Chart 17). Yet, Chinese corporate bond spreads are about 150-175 bps higher than their US counterparts, an overpriced risk premium in our view (Chart 18). Recently, despite mounting defaults, China’s corporate bond spreads have continued to narrow. This suggests that investors do not expect the record-high level of defaults in the past two years to damage China’s corporate sector in the near future. Moreover, China’s monetary policy remains ultra-loose, liquidity conditions have been largely stable, RMB devaluation and capital outflows have both been under control, and the Chinese economy is expected to bottom in the next quarter. Chart 17Chinese Default Rate Well Below Global Average
Chinese Default Rate Well Below Global Average
Chinese Default Rate Well Below Global Average
Chart 18The Risk Premium Assigned To Chinese Corporate Bonds Seems Overdone
The Risk Premium Assigned To Chinese Corporate Bonds Seems Overdone
The Risk Premium Assigned To Chinese Corporate Bonds Seems Overdone
Bottom Line: We continue to favor Chinese onshore corporate bonds in both absolute terms, and in relative to duration-matched government bonds. Jing Sima China Strategist jings@bcaresearch.com Footnotes 1 “China to take multi-pronged measures to keep employment stable,” State Council Executive Meeting, December 4, 2019. 2 Please see Geopolitical Strategy Special Report "2020 Key Views: The Anarchic Society," dated December 6, 2019, available at gps.bcaresearch.com 3 Please see China Investment Strategy Weekly Report "Simple Arithmetic," dated May 15, 2019, available at cis.bcaresearch.com. 4, 6, 7 Please see China Investment Strategy Weekly Report "Questions From The Road: Timing The Turn," dated November 20, 2019, available at cis.bcaresearch.com. 5 https://www.chainnews.com/articles/745634370915.htm Cyclical Investment Stance Equity Sector Recommendations
China’s October housing market data highlighted three points: housing sales are modestly improving, the pace of housing construction has again deviated from the trend in sales, and housing price appreciation is slowing in Tier 2 and Tier 3 markets. We are…
Highlights The Fed is the usual culprit for killing business cycles — but the Fed is on hold. This makes geopolitics the likeliest candidate to kill the cycle. The key geopolitical risks are US political turmoil, China’s economic policy, and the US-Iran confrontation. Nevertheless, policymakers are adjusting to the threat of recession, which points to a continuation of this long-in-the-tooth expansion. The US-China talks will be driven by Trump’s need for an economic boost ahead of the US election. If the economy or Trump’s approval rating fails anyway, then all bets are off. Go long gold as a strategic hedge. Feature Great power struggle, or “multipolarity,” continues to be our mega-theme in 2020. The world does not operate like a normal society, with a single government that possesses a monopoly on the use of force and ensures stability. Nations are individualistic, armed, and dangerous, creating what scholar Hedley Bull once called “The Anarchical Society.” This is not pure chaos, but rather a community of nations that lacks a clear and undisputed leader. Hence, quarrels break out often. Updating our geopolitical power index shows that the rise of China remains the most disruptive trend in global politics (Chart 1). The gap between the US and China has closed until recently, with China’s downshift in growth rates, but American fear is just being awakened (Chart 2). Given that Beijing threatens the US’s military and technological dominance over the long run, Washington will continue to develop a containment policy. Chart 1China's Geopolitical Rise Is Disruptive
2020 Key Views: The Anarchic Society
2020 Key Views: The Anarchic Society
Chart 2China-US Power Gap Is Narrowing
2020 Key Views: The Anarchic Society
2020 Key Views: The Anarchic Society
China is too big to quarantine, especially for a relatively unpopular first-term American president who eschews international coalition-building. The European Union’s decline in relative power is more marked than that of the United States, but China does not pose as much of a security threat to Europe. This trend exacerbates the already serious divergence in the trans-Atlantic alliance – which will worsen if Trump wins on November 3, 2020. Hence, globalization faces persistent challenges, as indicated by the falling import share of global output (Chart 3). This multi-decade process has peaked, creating a headwind for trade-exposed firms over the long run. What about the next 12 months? Will geopolitics kill the bull market? Not necessarily. Just as central bankers have cut interest rates to guard against deflationary risks (Chart 4), so the key governments are adjusting policies to avoid recessionary risks, especially with the memory of 2008 still fresh. Simply put: The Fed is on pause, Trump wants to be reelected, and China cannot afford a hard landing. Chart 3Globalization Faces Challenges
2020 Key Views: The Anarchic Society
2020 Key Views: The Anarchic Society
Chart 4Policymakers Are Reacting To Deflationary Risks
2020 Key Views: The Anarchic Society
2020 Key Views: The Anarchic Society
Clearly the risks to this view are elevated. The chief ones: (1) President Trump becomes a lame duck, cannot run on an economic platform, and thus makes a desperate attempt to win as a “war president” (2) Xi Jinping overestimates his advantage, in domestic or foreign policy, and makes a policy mistake (3) the US-Iran conflict spirals out of control due to Iran’s economic vulnerability. Other risks, such as Brexit, pale by comparison. Fear And Loathing On The Campaign Trail It is too soon to declare that Trump’s presidency is finished. On the contrary he is slightly favored to win reelection: • The Senate is unlikely to remove him from office. Republican support for the president is well above average despite evidence that Trump tried to get Ukrainian officials to investigate his political rival (Chart 5). The implication is that a year from now Democrats will have suffered a policy failure while Trump will have been cleared of charges. Chart 5Trump Still Popular Among Republicans
2020 Key Views: The Anarchic Society
2020 Key Views: The Anarchic Society
• The odds of recession in the coming year are low. The US voter is buffered by rising real incomes and wages and high net wealth (Chart 6). To unseat a sitting president requires a recessionary backdrop that fundamentally discredits him and his party – not just slowing growth. Chart 6Pocketbook Voter Theory To The Test
2020 Key Views: The Anarchic Society
2020 Key Views: The Anarchic Society
• Trump’s low approval rating does not prohibit him from reelection. While historically low, it is also historically stable. Our quantitative election model – which predicts Trump will win the Electoral College with 279 votes by clinging onto Pennsylvania – shows that Trump’s victory margin would increase if we looked not at the average level of his approval but at its change, momentum, or low range (i.e. stability). Table 1 shows the results of all four variations of his approval rating, with ascending chances of winning key swing states. Table 1All Measures Of Trump’s Approval Rating Get Him 270 Electoral College Votes
2020 Key Views: The Anarchic Society
2020 Key Views: The Anarchic Society
Trump’s odds of winning will affect the US equity market throughout the year. As long as he remains competitive, i.e. neither scandal nor the economy cause his approval rating to break down, he will have reason to temper his policies to cater to US financial markets. Foreign and trade policies are Trump’s only ways to improve the economy and voter support. Trump’s only remaining way to boost the economy and improve voter support lies in foreign policy and trade policy. Specifically, he will stop increasing tariffs on China – and maybe even roll back tariffs to August 2019 or even April 2019 levels (Chart 7) – at least as long as the manufacturing recession persists. Chart 7Some Tariff Rollback Is Possible
2020 Key Views: The Anarchic Society
2020 Key Views: The Anarchic Society
China is unlikely to implement painful structural changes when Trump could be gone in 12 months’ time. Strategic tensions outside of trade will undermine any ceasefire. Hence economic policy uncertainty will remain elevated even though it will drop off from recent peaks. Assuming the electoral constraint prevents Trump from levying sweeping tariffs on China or Europe, he will be limited to other foreign and trade policies to try to boost his approval rating or fire up his base: • We expect a third summit with Kim Jong Un of North Korea. Trump is rumored to be considering some troop reduction in exchange for progress on denuclearization (neither of which would be irreversible). • Otherwise Trump could turn to saber-rattling, since Pyongyang is threatening to resume long-range tests and the economic consequences of another round of “fire and fury” would be limited. • Trump could also rattle the saber against Iran, Venezuela, or other rogue states. If Trump becomes uncompetitive in the election, then the market will sell off. The market will have to price not only policy discontinuity (e.g. higher taxes), but also the chance of a progressive-populist taking the White House. Moreover, if a Democrat is able to unseat an incumbent president, the Democrats will take the Senate as well. Trump is a known unknown; this scenario would be an unknown unknown. The Democratic Party’s primary election will consume the first half of the year. It culminates in the Democratic National Convention, strategically chosen to take place in Milwaukee, Wisconsin on July 13-16. Wisconsin is one of three critical swing states. Will former Vice President Joe Biden win the nomination? A high conviction is not warranted. Biden is clearly the frontrunner, but we think a progressive can pull it off. A simulation of the Democratic Convention “pledged delegates,” based on November polling in the first four primary elections, shows Biden far short of a majority (Chart 8). He needs to outperform his polls, but this will be difficult given that he is well-known, has not performed well in debates, and will have Mayors Pete Buttigieg and Michael Bloomberg nipping at his heels in the Midwest and Northeast, respectively. Chart 8Do Not Discount A Progressive Win
2020 Key Views: The Anarchic Society
2020 Key Views: The Anarchic Society
Over time, candidates will drop out, so it is more informative to look at the “centrist” candidates as a whole compared to the “progressives.” Here the early primary polling suggests that the progressives will come closest to victory (Chart 9). Chart 9Progressives Come Closest To Victory
2020 Key Views: The Anarchic Society
2020 Key Views: The Anarchic Society
The trend within the party is to move to the left. Senators Elizabeth Warren and Bernie Sanders are tied as voters’ second choice – even Buttigieg supporters are split between Biden and Warren (Chart 10). What is unknown is whether Warren (or Sanders) can consolidate the progressive vote faster than Biden (or Buttigieg) consolidates the centrist vote. Chart 10If Biden Falters, Progressives Are Next In Line
2020 Key Views: The Anarchic Society
2020 Key Views: The Anarchic Society
Chart 11Structural Imbalances Give Rise To Populism
2020 Key Views: The Anarchic Society
2020 Key Views: The Anarchic Society
Trends pointing toward a progressive victory may not at first trouble the market, but any signs that a progressive is pulling ahead decisively will force investors to sharply upgrade the probability that he or she will win the White House. This will cause equity volatility, which could become self-reinforcing. A progressive nominee would force investors to recognize that populism and political risk are here to stay – which is our expectation given that they are motivated by polarization, inequality, and other structural imbalances in the United States (Chart 11). Left-wing or progressive populism is far more negative for corporate earnings than Trump’s right-wing or “pluto-populism.” Sanders or Warren present the worst case for investors because they favor trade protectionism in addition to higher taxes and minimum wages. Most presidents achieve their chief legislative priority in their first term and there is no reason to assume a progressive presidency would be any different. The implication is higher corporate taxes as well as individual taxes to pay for a sweeping expansion of the social safety net – positive for the economy perhaps but negative for corporate earnings. Chart 12A Progressive Win Threatens Key Sectors
2020 Key Views: The Anarchic Society
2020 Key Views: The Anarchic Society
An extensive re-regulation of the US economy would occur regardless, since it falls under executive authority. It would affect the key equity sectors in the US bourse, technology and health (Chart 12), as well as energy and financials. The choice of a centrist Democrat like Biden (or Buttigieg) would be the least negative outcome for US equities of all the Democrats. The market would probably cheer a Trump versus Biden matchup for this reason. Biden favors higher taxes and regulation but is an establishment politician and known quantity. However, even Biden will be pulled to the left by the current within his party once in office; and Buttigieg will govern to the left of Biden. Trump’s reelection would spur a relief rally in US equities, but it would be short-lived. He would solidify low taxes and deregulation and would have a real chance of passing an infrastructure package. But he would also curtail labor force growth with his border wall and double down on trade protectionism – likely against Europe as well as China this time. His unpredictable and aggressive tendencies would be turbo-charged by a new popular mandate. We expect to cut back on risk exposure upon Trump’s reelection, assuming the bull market has survived to return him to office. A Democratic victory would mark another reversal in US policy orientation. Given our view that the White House call is also the Senate call, this would be the third time since 2008 that the country has witnessed a total reversal. Domestic American political risk will not end with the election: a legitimacy crisis could follow a narrow election, and institutional erosion continues regardless. It is too soon to call peak polarization, as the election will result in either a left-wing government bent on redistributing wealth or a right-wing Trump administration that exacerbates inequality. A centrist "return to normalcy" is possible with a Biden or Buttigieg victory. This reinforces our constructive cyclical view. Bottom Line: The chief risk from US politics in 2020 is Trump becoming a lame duck and resorting to belligerent foreign policy to try to win back voters through a rally around the flag. The chief risk of the Democratic nomination, and the general election, is a left-wing populist winning the White House. Any Democratic victory would likely bring the Senate, removing a key constraint. Over time the median voter is moving to the left. The Man Who Changed China Chart 13Xi Is Purging Misallocated Capital
2020 Key Views: The Anarchic Society
2020 Key Views: The Anarchic Society
Xi Jinping undoubtedly represents a “new era” in China – a reassertion of Communist Party rule. The party faced a crisis of legitimacy amid the Great Recession and Arab Spring and was determined to regain political, economic, and social control. Xi had previously been anointed but was all too happy to take on the role of neo-Maoist strongman. Yet Xi’s playbook is close to that of President Jiang Zemin’s: centralize the party, repress dissent, modernize the military, restructure banks and the economy, upgrade the country’s science and technology, and expand China’s global influence. The difference is that while Jiang rode the high tide of globalization, Xi is riding the receding tide. Jiang culled two-thirds of the country’s state-owned enterprises, laying off over 40 million people, confident that a surge of new growth would ensue. Xi is also cracking down – allowing bankruptcies to purge misallocated capital (Chart 13) – but with a large debt load and shrinking labor force, he needs the state sector to put a floor under growth rates. The takeaway is that Xi will act pragmatically to boost growth when China’s stability is threatened, as he did in 2015-16. The trade war has already forced him to backtrack on the 2017-18 deleveraging campaign and stimulate the economy. The combined fiscal and credit impulse amounts to 6.6% of GDP from trough to now, and it hasn’t peaked. The implication is that Chinese growth – and global growth – will pick up from here (Chart 14). Chinese authorities are still trying to contain the growth in leverage, which has kept this year’s stimulus in check. But the chief banking regulator has also stated that as long as the macro-leverage ratio is not growing faster than 10%, this goal is met (Chart 15). Chart 14Chinese Growth Will Pick Up
2020 Key Views: The Anarchic Society
2020 Key Views: The Anarchic Society
Chart 15China Says Leverage Already Contained
2020 Key Views: The Anarchic Society
2020 Key Views: The Anarchic Society
The economy has not yet durably bottomed, so the state will continue adding support. The coming year is the third and final year of the “Three Battles” – against poverty, pollution, and systemic risk – as well as the final year of the thirteenth five-year plan. Beijing is falling short on its targets for real urban per capita income (Chart 16) and poverty elimination (Chart 17). A last-minute rush to meet these targets is likely and will require more fiscal stimulus. Chart 16Beijing Falls Short Of Urban Income Target...
2020 Key Views: The Anarchic Society
2020 Key Views: The Anarchic Society
Chart 17...And Poverty Target
2020 Key Views: The Anarchic Society
2020 Key Views: The Anarchic Society
This is not an argument for a blowout credit splurge. China is saving dry powder for a further escalation in the US containment strategy and a worse economic downturn. Do not expect a blowout Chinese credit splurge. The core constraint on policy is unemployment. Stimulus efforts have created a bottom in the employment component of the manufacturing PMI as well as a notable uptick in the demand for urban labor (Chart 18). To withdraw stimulus now – or tighten policy – would be to trigger a relapse in an economy that is ultimately at risk of a debt-deflation trap. Chart 18Chinese Stimulus Shows Up In Employment
2020 Key Views: The Anarchic Society
2020 Key Views: The Anarchic Society
Chart 19A Banking Crisis Is A Risk To The Chinese Economy
2020 Key Views: The Anarchic Society
2020 Key Views: The Anarchic Society
Tougher controls on credit and shadow banking have seen an uptick in corporate defaults and bank failures. With the government deliberately imposing pain on bloated sectors of the economy, financial turmoil could spread. Newspaper mentions of defaults, layoffs, and bankruptcies have only slightly subsided since stimulus efforts began (Chart 19). If bank failures spiral out of control, the economy will tank. The state will have to fight fires. Tariffs have accelerated the trend of firms relocating out of China, which began because of rising wages and a darkening business environment (Chart 20). A questionable trade ceasefire will not reverse the process as American and Asian companies are seeking a lasting solution, which requires them to set up shop elsewhere. China will want to mitigate the process, first by stabilizing domestic growth, and second by accepting Trump’s tactical trade retreat. Xi is also trying to avoid diplomatic isolation by courting trade partners other than the US, since the ceasefire is unreliable and the US containment strategy is presumed to continue. This involves outreach to the rest of Asia, Russia, and Europe, and even to distrustful neighbors like Japan and India. Europe is the swing player. China’s Asian neighbors, and Australia and New Zealand, have reason to fear Beijing’s growing clout and seek the US’s security umbrella. Russia and China are informal allies. But the European public is not interested in the new cold war – China does not threaten Europe from next door, like Russia does, and the Trump administration is threatening Europe with both trade war and Middle Eastern instability. European leaders are happy to take the market share that the US is leaving, as is clear from direct investment (Chart 21). Only a concentrated US diplomatic effort can address this divergence, which is not forthcoming in 2020. Chart 20Firms Are Relocating Out Of China
2020 Key Views: The Anarchic Society
2020 Key Views: The Anarchic Society
Chart 21Europe Exploits US-China Rift
2020 Key Views: The Anarchic Society
2020 Key Views: The Anarchic Society
A new Democratic administration, or a change in Trump strategy in the second term, could eventually produce a multilateral western coalition demanding that China open up and liberalize parts of its economy. But Europe will need to be convinced of the underlying reality that China is doubling down on the state-led industrial policies that provoked the Americans to begin with. Beijing is after economic self-sufficiency, indigenous innovation, and leadership in high-tech production and new frontiers. Its official research and development budget is not its only means for achieving this end (Chart 22) – it also has state-backed acquisitions and cyber campaigns. Germany and Europe have begun scrutinizing Chinese investment, separately from the United States. Chart 22Beijing Is After Economic Self-Sufficiency
2020 Key Views: The Anarchic Society
2020 Key Views: The Anarchic Society
The danger to China – and the world – is that Xi Jinping might overplay his hand. He could overtighten money, credit, or property regulations and spoil the economy when global growth is vulnerable. His anti-corruption campaign is a telling reminder of his heavy hand in domestic affairs (Chart 23). Chart 23Xi Jinping Risks Overplaying His Hand
2020 Key Views: The Anarchic Society
2020 Key Views: The Anarchic Society
Chart 24China Needs To Calm Things Down
2020 Key Views: The Anarchic Society
2020 Key Views: The Anarchic Society
He could also suppress protesters in Hong Kong and rattle sabers over Taiwan or the South China Sea in a way that undermines the trade ceasefire. Or he could fail to bring the North Koreans to heel. These strategic tensions are significant only insofar as they undermine the trade ceasefire or provoke US-China saber-rattling. Failing to act as an honest broker in the Iran crisis would also irk Europeans and give them an excuse to side with the US. Bottom Line: China will continue modestly stimulating the economy next year to achieve a durable stabilization in growth. The risk of debt-deflation and rising unemployment ultimately necessitates this policy. Beijing can accept Trump’s tariff rollback for the sake of stability – China’s policy uncertainty relative to the rest of the world is off the charts and Beijing has an interest in calming things down (Chart 24). Yet Beijing will double down on indigenous innovation, while courting the rest of the world so as to preempt criticism and isolate the Americans. The risk is that Xi proves too heavy-handed when it comes to domestic leverage, the tech grab, strategic disputes, or trade talks with Washington. The Strait Of Hormuz Risk Chart 25US-Iran Conflict Still Unresolved
2020 Key Views: The Anarchic Society
2020 Key Views: The Anarchic Society
In a special report earlier this year entitled “The Polybius Solution” we argued that while the US-China conflict is the major long-term geopolitical conflict, the US-Iran showdown could supersede it in the short term. This remains a risk for 2020, as the Trump administration’s confrontation with Iran is fundamentally unresolved (Chart 25). The Trump administration is still enforcing “maximum pressure” sanctions, which have reduced Iranian oil exports from 1.8 million barrels per day at their recent peak to 100,000 barrels per day in November (Chart 26). These are crippling sanctions that have sent Iran’s economy reeling. Chart 26Iran Remains Under
2020 Key Views: The Anarchic Society
2020 Key Views: The Anarchic Society
Iran’s Supreme Leader Ayatollah Ali Khamenei has ruled out negotiations with Trump. They would be unpopular at home without a major reversal on sanctions from Trump (Chart 27). Chart 27Major US Reversal Prerequisite For Iran Talks
2020 Key Views: The Anarchic Society
2020 Key Views: The Anarchic Society
Trump presumably aims to avoid an oil shock ahead of the election. The US and its allies have visibly shied away from conflict in the wake of Iran’s provocations, including the spectacular attack on eastern Saudi Arabia that knocked 5.7 million barrels of oil per day offline in September. However, this does not mean the odds of war are zero. The Americans or the Iranians could miscalculate. Both sides might think they can improve their standing at home by flexing their muscles abroad. Iran is a rational actor and would not normally court American airstrikes or antagonize a potentially lame duck president. Yet it is under extreme pressure due to the sanctions. It faces significant unrest both at home and in its sphere of influence (Iraq and Lebanon). Opinion polls show that the public primarily blames the government for the collapsing economy, and yet that American sanctions are siphoning off some of this anger (Chart 28). This could tempt the leaders to continue staging provocations in the Strait of Hormuz or elsewhere in the region. Chart 28Iranians Blame Tehran, Tehran Blames America
2020 Key Views: The Anarchic Society
2020 Key Views: The Anarchic Society
Hardline military leaders and politicians currently receive the most favor in polling, while the reformist President Rouhani – undercut by the American withdrawal from the 2015 deal – is among the least popular (Chart 29). The Majlis (parliament) elections in February will likely reverse the reformist turn in Iranian politics that began in 2012. The regime stalwarts are gearing up for the supreme leader’s succession in the coming years. While a Democratic White House could restore the 2015 deal, that ship may have sailed. Chart 29Rouhani And Reformists In Trouble
2020 Key Views: The Anarchic Society
2020 Key Views: The Anarchic Society
A historic oil supply disruption is a fatter tail risk than investors realize. Chart 30The Iranians May Take Excessive Risk
2020 Key Views: The Anarchic Society
2020 Key Views: The Anarchic Society
Trump, under impeachment, could seek to distract the public. This was Bill Clinton’s tactic with Operations Infinite Reach, Desert Fox, and Allied Force in 1998-99. These operations were minor and not comparable to a conflict with Iran. However, Trump may be emboldened. On paper the US strategic petroleum reserve (along with OPEC and other petroleum reserves) could cover most major oil shock scenarios. According to Hugo Bélanger, Senior Analyst at BCA Research Commodity & Energy Strategy, a supply outage the size of the Abqaiq attack in September would have to persist for four months to cause enough price pressure to harm the US economy and decrease Trump’s chances of winning reelection. The simulations in Chart 30 overstate the gasoline price impact by assuming that global oil reserves remain untapped. Thus while the Iranians may take excessive risks, the Trump administration may not refrain this time from airstrikes. Bottom Line: While the Middle East is always full of risks to oil supply, Iran’s vulnerability and Trump’s status at home make the situation unusually precarious. A historic oil supply disruption is a fatter tail risk than investors realize. Europe Is A Price Taker, Not A Price Maker Just as the US and China have a shared incentive to avoid tariff-induced recession, so the UK and EU have a shared incentive to prevent a shock reversion to basic WTO tariffs. The December 31, 2020 deadline for the UK-EU trade deal, like the various deadlines for Brexit itself, can be delayed. Even Prime Minister Boris Johnson has proved unwilling to exit without a deal and even a hung parliament has proved capable of preventing him from doing so. The negotiation of a trade deal – which is never easy and always drags on – will be a lower-order risk in the wake of the past two years’ Brexit-induced volatility. Johnson will not be held hostage by hardline Brexiters given that Brexit itself will be complete. If our view on Chinese growth is correct, then Europe’s economy can recover and European political risk will be a “red herring” in 2020, as it was in 2019. Instead the EU presents an opportunity. Chart 31Euro Area Breakup Risk Has Subsided
2020 Key Views: The Anarchic Society
2020 Key Views: The Anarchic Society
Euro Area break-up risk has subsided after a series of challenges in the wake of the sovereign debt crisis (Chart 31). There is not a basis for a reversal of this trend, at least not until a full-blown recession afflicts the continent. The rise in anti-establishment parties coincided with a one-off surge in migration that is finished – and successful populists from Greece to Italy have moderated on euro membership once in power. Germany is entering a profound transition driven by de-globalization and tensions with the United States. It is more likely to have an early election than the consensus holds. But it is fundamentally stable and supportive of European integration. In fact the great debate about fiscal policy poses an upside risk over the long run both for European equities and the European project. We remain optimistic on French structural reforms even though President Emmanuel Macron must overcome significant public opposition. An eerie quiet hangs over Russia, making it one of our “Black Swan” risks for 2020. Oil prices are not very high, which discourages foreign adventures, and President Vladimir Putin has spent his fourth term trying to consolidate international gains and improve domestic stability. But approval of the government is weak, the job market is deteriorating, and social unrest is cropping up. There is plenty of room to ease monetary and fiscal policy, but a sharp downturn could provide the basis for an aggressive foreign policy action to shore up regime support. The US election also presents the risk of renewed US-Russian tensions, whether over election interference or a Democratic victory. Investment Conclusions Geopolitics is the likeliest candidate to derail the global bull market in 2020. Nevertheless, policymakers are adjusting to their constraints. Trump and Xi are negotiating a ceasefire and a disorderly Brexit is off the table. Even Trump’s impeachment shows that the US system of checks and balances remains intact. After all, there is nothing to prevent removal from office if Trump further antagonizes public opinion and the Republican Senate. This means that policy uncertainty will decline on the margin in 2020, even as it remains elevated due to the danger of the underlying events. The nature of US economic imbalances suggests that the policy discontinuity of a Democratic victory on November 3, 2020 would be better for the economy (via household consumption) than it would be for corporate earnings. Policy continuity with the Trump administration suggests the opposite. On a sectoral basis we recommend going long US energy large cap stocks and short info-tech and communications. Energy has limited downside even if a progressive wins whereas tech has limited upside even if Trump wins. The BCA Research House View expects the US dollar to weaken as global growth rebounds, stocks to outperform bonds and cash, and developed market equities to outperform those of the United States. But a Republican victory in November would push against these trends as it is more bullish for the greenback and for US equities relative to global. As a play on the global growth rebound we expect, we recommend going long industrial metals. Like our colleagues at BCA Research Commodity & Energy Strategy, we are initiating this as a tactical trade but it may become strategic. We are reinitiating a tactical long Korea / short Taiwan equity trade. Taiwanese political risk is understated ahead of January’s election and the island is the epicenter of the US-China cold war. We are restoring our long gold trade as a strategic hedge. Populism and de-globalization are potentially inflationary, but they are also linked with great power competition which will increase the frequency of geopolitical crises. In either case, gold is the right safe haven to own. Matt Gertken Vice President Geopolitical Strategist mattg@bcaresearch.com
China’s November PMIs were quite positive, which increases the odds that China’s economy is beginning its recovery. However, two phenomena point toward a bottoming in the economy in Q1 next year rather than Q4 this year. First, several important elements of…
Highlights China’s PMIs continue to flash a positive signal, but the hard data trend remains negative. There has been a notable improvement in China’s cyclical sectors (versus defensives) over the past month, but broad equity market performance has been flat-to-down. China’s lackluster equity index performance in the face of rising PMIs suggests that investors can afford to wait for an improvement in the hard economic data before tactically upgrading to overweight. Cyclically, we continue to recommend an overweight stance towards both the investable and A-share markets versus the global benchmark, favoring the former over the latter. Feature Tables 1 and 2 on pages 2 and 3 highlight key developments in China’s economy and its financial markets over the past month. On the growth front, China’s November PMIs were clearly positive, and the rise in the official manufacturing PMI above the 50 mark is notable. However, the odds continue to favor a bottoming in the economy in Q1 rather than Q4, in large part because China’s “hard” economic data has continued to deteriorate during the time that the Caixin PMI has been signaling an expansion in manufacturing activity. In this vein, China’s November update for producer prices and total imports have high potential to be market-moving, and should be closely monitored. Table 1China Macro Data Summary
China Macro And Market Review
China Macro And Market Review
Table 2China Financial Market Performance Summary
China Macro And Market Review
China Macro And Market Review
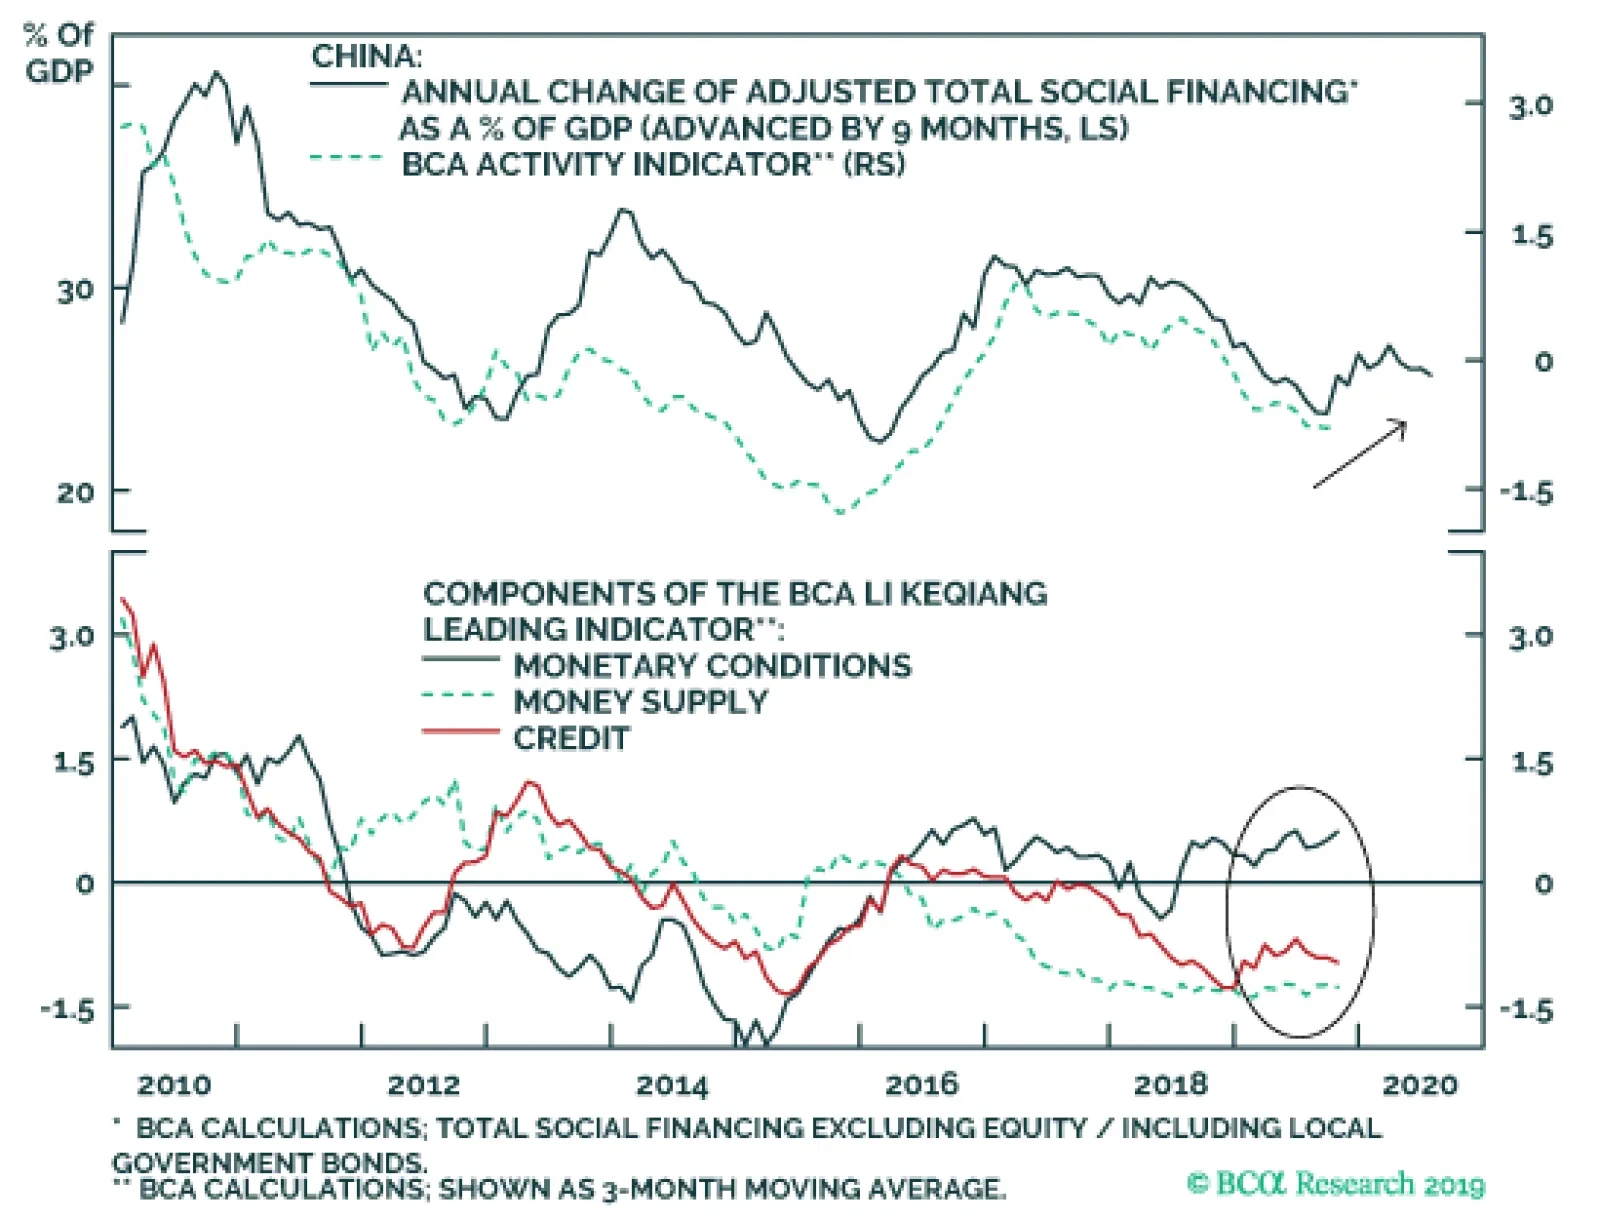
Within financial markets, China’s cyclical sectors have outperformed defensives, which is consistent with the positive message from China’s PMIs. But China’s broad equity markets have been flat-to-down versus the global index over the past month, suggesting that investors can afford to wait for confirmation of a hard data improvement before upgrading their tactical stance to overweight (from neutral). Cyclically, we continue to recommend an overweight stance towards both the investable and A-share markets, but favor the former over the latter in a trade truce scenario. In reference to Tables 1 and 2, we provide below several detailed observations concerning developments in China’s macro and financial market data: Both measures of the Li Keqiang index (LKI) that we track indicated no obvious improvement in Chinese economy activity in October. The BCA China Activity indicator, a broader coincident measure of China’s economy, also moved sideways in October and (for now) remains in a downtrend. Thus, based on the “hard data”, Chinese economic activity has not yet bottomed. Chart 1A Moderate Strength Economic Recovery Will Begin In Q1
A Moderate Strength Economic Recovery Will Begin In Q1
A Moderate Strength Economic Recovery Will Begin In Q1
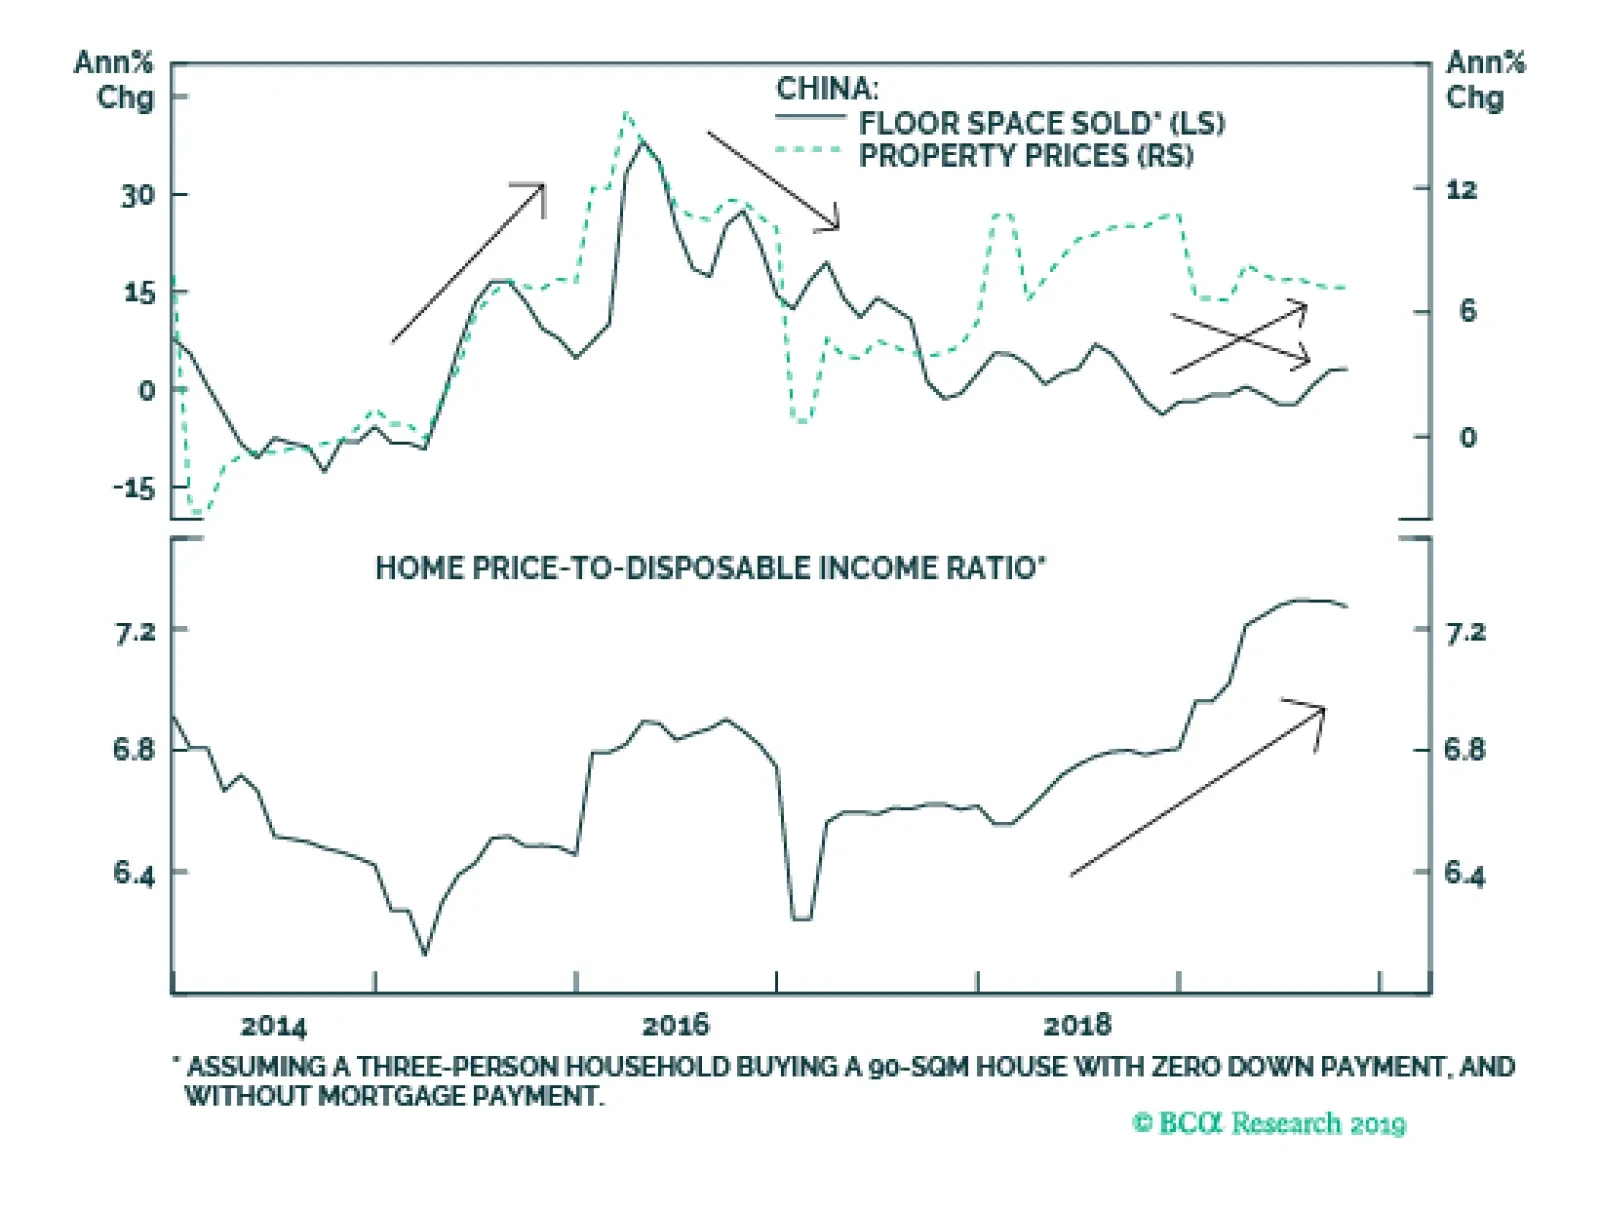
The components of our LKI leading indicator continue to tell a story of easy monetary conditions and sluggish money & credit growth (Chart 1). The indicator itself remains in an uptrend, but it is a shallow one that does not match the intensity of previous credit cycles. While the uptrend in the indicator suggests that China’s economy will soon bottom, the shallow pace suggests that the coming rebound in growth will be less forceful than during previous economic recoveries. The uptrend in headline CPI is a notable macro development, with prices having risen 3.8% year-over-year in Oct (the fastest pace in almost eight years). This rise has been driven almost entirely by a surge in pork prices, which have risen over 60% relative to last year (panel 1 of Chart 2). While some investors have questioned whether the rise in headline inflation will cause the PBoC to tighten its stance at the margin, we argued with high conviction in our November 20 Weekly Report that this will not occur.1 Panel 2 of Chart 2 shows that periods of easy monetary policy line up strongly with periods of deflating producer prices, arguing that the PBoC will see through transient shocks to headline inflation. China’s October housing market data highlighted three points: housing sales are modestly improving, the pace of housing construction has again deviated from the trend in sales, and housing price appreciation is slowing in Tier 2 and Tier 3 markets. For now, we are inclined to discount the surge in floor space started, given previous divergences that proved to be unsustainable. The bigger question is whether investors should be concerned about slowing housing prices. Chart 3 shows that floor space sold and property prices have been negatively correlated over the past three years, in contrast to a previously positive relationship. Deteriorating affordability and tight housing regulations have contributed to this shift in correlation, which helps explain why the PBoC’s Pledged Supplementary Lending (PSL) program has been so closely related to housing sales over the past few years. While the growth in PSL injections is becoming less negative, it has not risen to the point that it would be associated with a strong trend in sales. As such, we continue to see poor affordability as a threat to further housing price appreciation, absent stronger funding assistance. Poor affordability will continue to be a headwind for China’s housing market. Chart 2The PBoC Will See Through Transient Shocks To Headline Inflation
The PBoC Will See Through Transient Shocks To Headline Inflation
The PBoC Will See Through Transient Shocks To Headline Inflation
Chart 3Poor Affordability Will Continue To Weigh On Housing Demand
Poor Affordability Will Continue To Weigh On Housing Demand
Poor Affordability Will Continue To Weigh On Housing Demand
Chart 4Investors Need To See Concrete Signs Of A Hard Data Improvement
Investors Need To See Concrete Signs Of A Hard Data Improvement
Investors Need To See Concrete Signs Of A Hard Data Improvement
China’s November PMIs were quite positive, which legitimately increases the odds that China’s economy is beginning the process of recovery. However, we see two reasons to believe that the odds continue to favor a bottoming in the economy in Q1 rather than Q4. First, while they improved in November, several important elements of the official PMI remain in contractionary territory, particularly the new export orders subcomponent. Second, while the Caixin PMI has now been above the 50 mark for 4 consecutive months, China’s hard data has continued to deteriorate since the summer (Chart 4). Given the historical volatility of the Caixin PMI, we advise investors to wait for concrete signs of a hard data improvement before firmly concluding that China’s economy is recovering. Over the last month, China’s investable stock market has rallied roughly 1% in absolute terms, while domestic stocks have fallen about 3%. In relative terms, A-shares underperformed the global benchmark, while the investable market moved sideways. In our view, the underperformance of China’s domestic market reflects increased sensitivity to monetary conditions and credit growth compared with the investable market,2 and a weaker credit impulse in October appears to have been the catalyst for A-share underperformance. Over the cyclical horizon, earnings will improve in both the onshore and offshore markets in response to a modest improvement in economic activity, suggesting that an overweight stance is justified for both markets. But we think the investable market has more upside potential in a trade truce scenario. The outperformance of cyclical versus defensive sectors is sending a positive signal, but investors can afford to wait for better economic data before tactically upgrading. Chart 5A Positive Sign From Cyclicals Versus Defensives
A Positive Sign From Cyclicals Versus Defensives
A Positive Sign From Cyclicals Versus Defensives
Within China’s investable stock market, it is quite notable that cyclicals have outperformed defensives over the past month on an equally-weighted basis (Chart 5). Interestingly, key defensive sectors such as investable health care and utilities have sold off significantly, and equally-weighted cyclicals have also outperformed defensives in the domestic market. The outperformance of cyclicals and underperformance of defensives is consistent with the positive message from China’s PMIs, but the fact that this improvement is occurring against the backdrop of flat-to-down relative performance for China’s equity market suggests that investors can afford to wait for confirmation of a hard data improvement before upgrading their tactical stance to overweight. In this vein, China’s November update for producer prices and total imports have high potential to be market-moving, and should be closely monitored. China’s government bond yields fell slightly in November, potentially reflecting expectations of further modest easing. Our view that monetary policy will likely remain easy over the coming year even in a modest recovery scenario suggests that Chinese interbank rates and government bond yields are likely to range-trade over the coming 6-12 months. We expect onshore corporate bonds to continue to outperform duration-matched government bonds in 2020. Chinese onshore corporate bond spreads eased modestly over the past month. Despite continued concerns about onshore corporate defaults, the yield advantage offered by onshore corporate bonds have helped the asset class generate a 5.4% year-to-date return in local currency terms. Barring a substantial intensification of the pace of defaults, we expect onshore corporate bonds to continue to outperform duration-matched government bonds in 2020. The RMB has moved sideways versus the US dollar over the last month. USD-CNY had fallen below 7 in October following the announcement of the intention to sign a “phase one” trade deal, but the move ultimately proved temporary given the deferral of an agreement. We would expect the RMB to appreciate following a deal of any kind (a truce or something more), and it is also likely to be supported next year by improving economic activity. Still, it would not be in the PBoC’s best interests to let the RMB appreciate too rapidly, because an appreciating Chinese currency would act as a deflationary force on China’s export and manufacturing sectors. As such, we expect a modest downtrend in USD-CNY over the coming year. Qingyun Xu, CFA Senior Analyst qingyunx@bcaresearch.com Jing Sima China Strategist jings@bcaresearch.com Footnotes 1 Please see China Investment Strategy Weekly Report "Questions From The Road: Timing The Turn," dated November 20, 2019, available at cis.bcaresearch.com 2 Please see China Investment Strategy Special Report "A Guide To Chinese Investable Equity Sector Performance," dated November 27, 2019, available at cis.bcaresearch.com Cyclical Investment Stance Equity Sector Recommendations
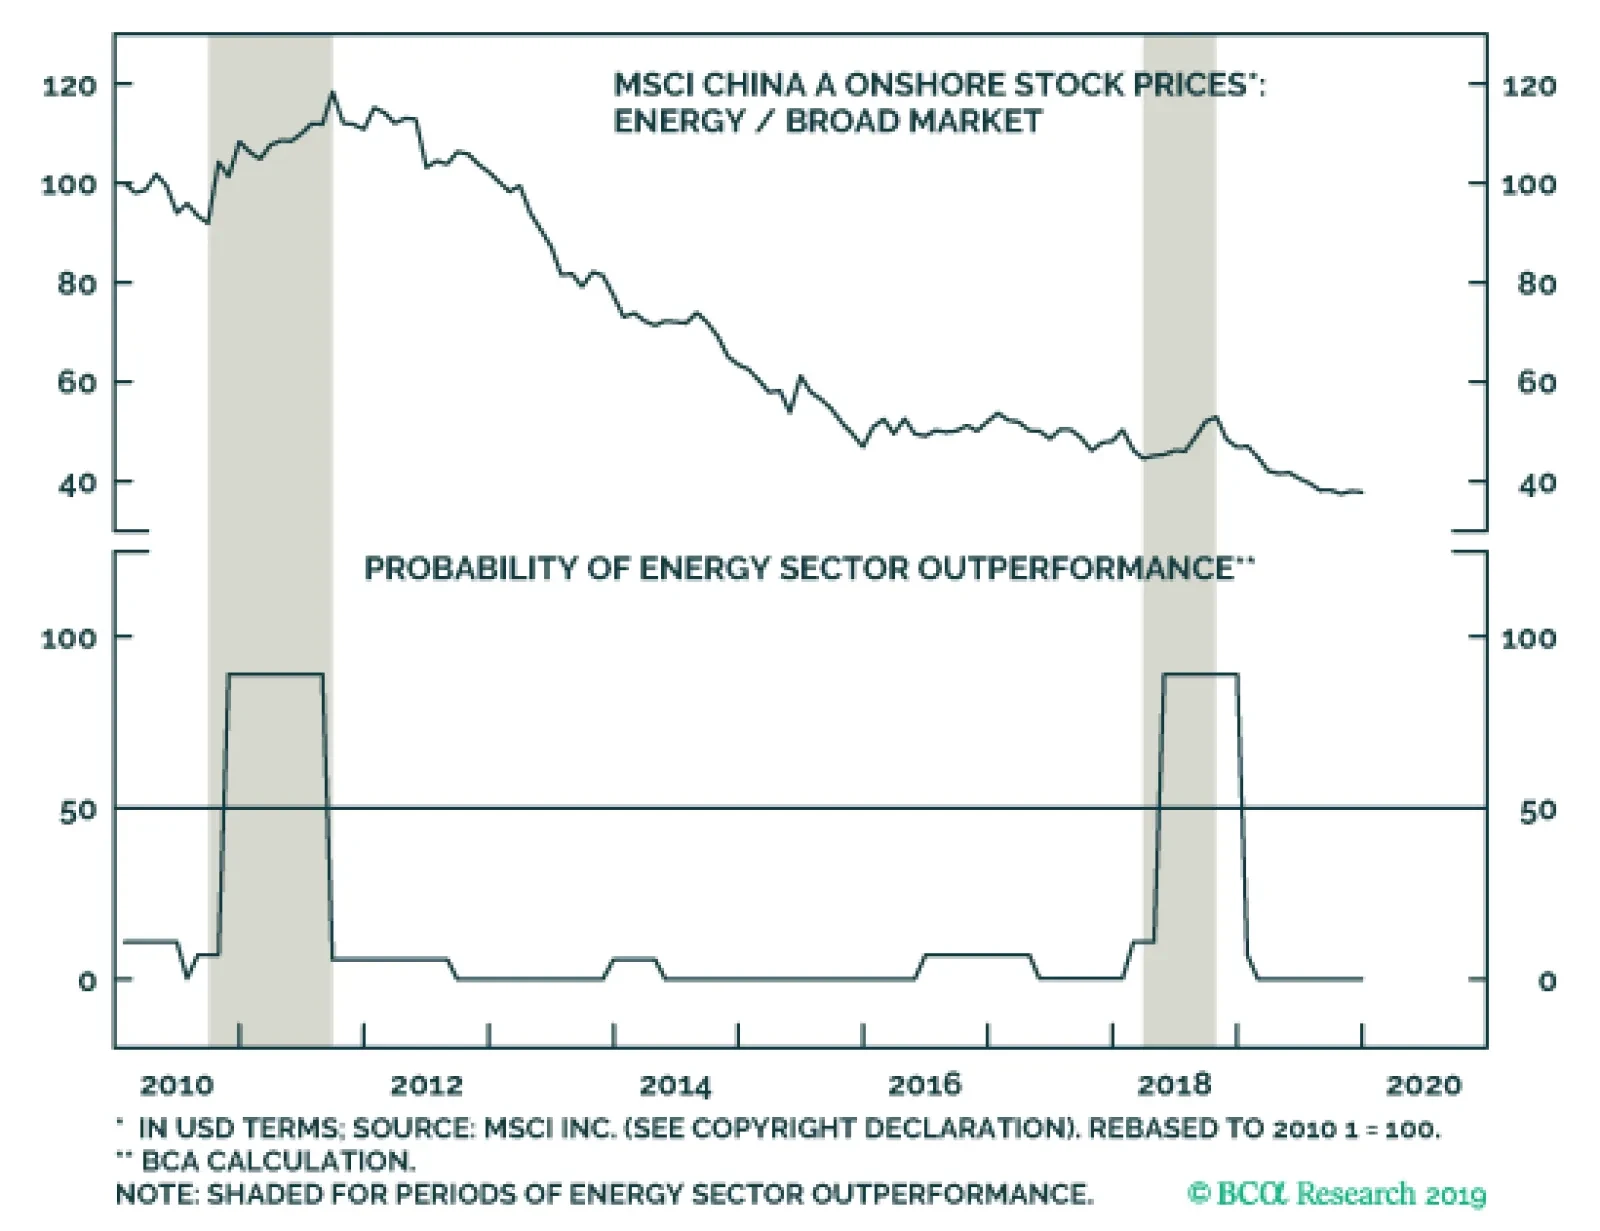
China’s domestic energy sector outperforms when oil prices and domestic headline inflation rise. However, this is a behavioral relationship rather than a fundamental one. Unlike their investable peers, domestic energy stocks underperform when the broad…
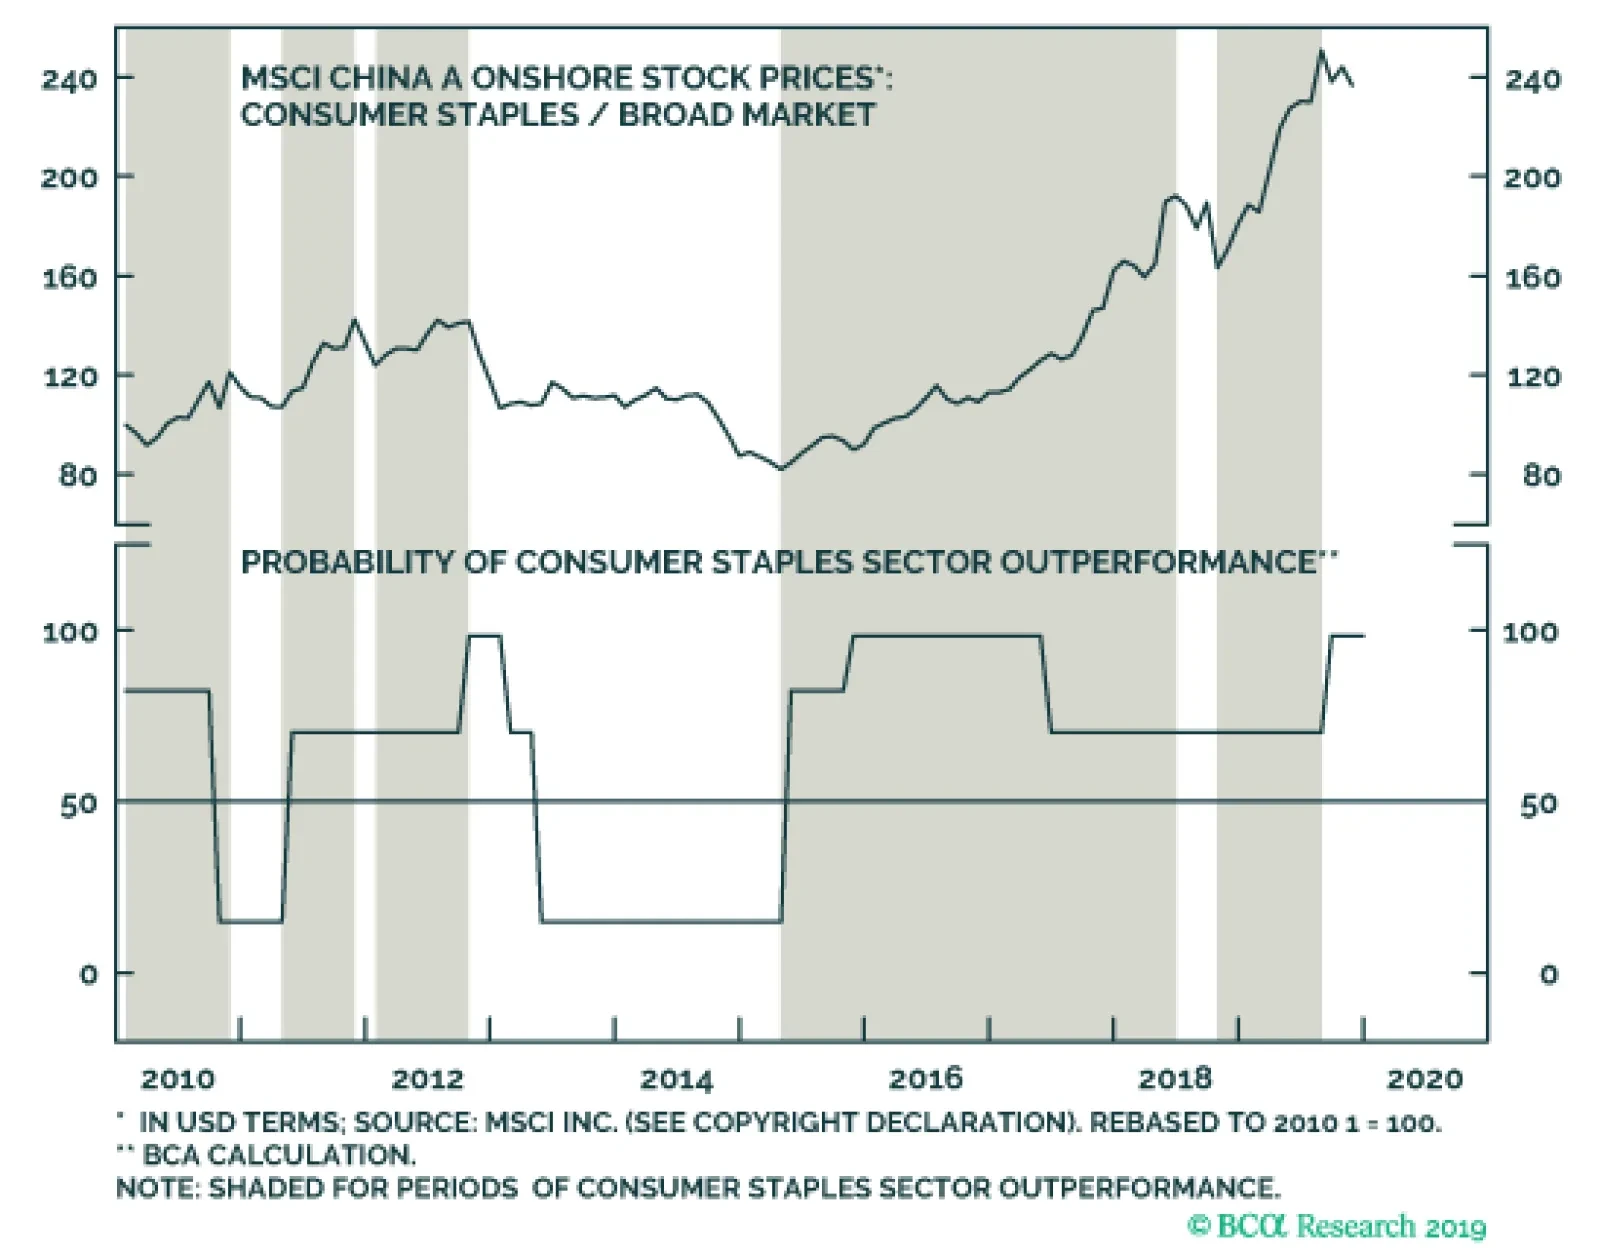
are a defensive sector and the most important determinant of their relative performance is their negative correlation with the broad domestic market EPS. The trend in staples relative earnings closely follows in importance, showing that the tremendous…