Iran Conflict Daily Dashboard
Real-time charts on the Hormuz crisis, energy, and macro risk
Conflict
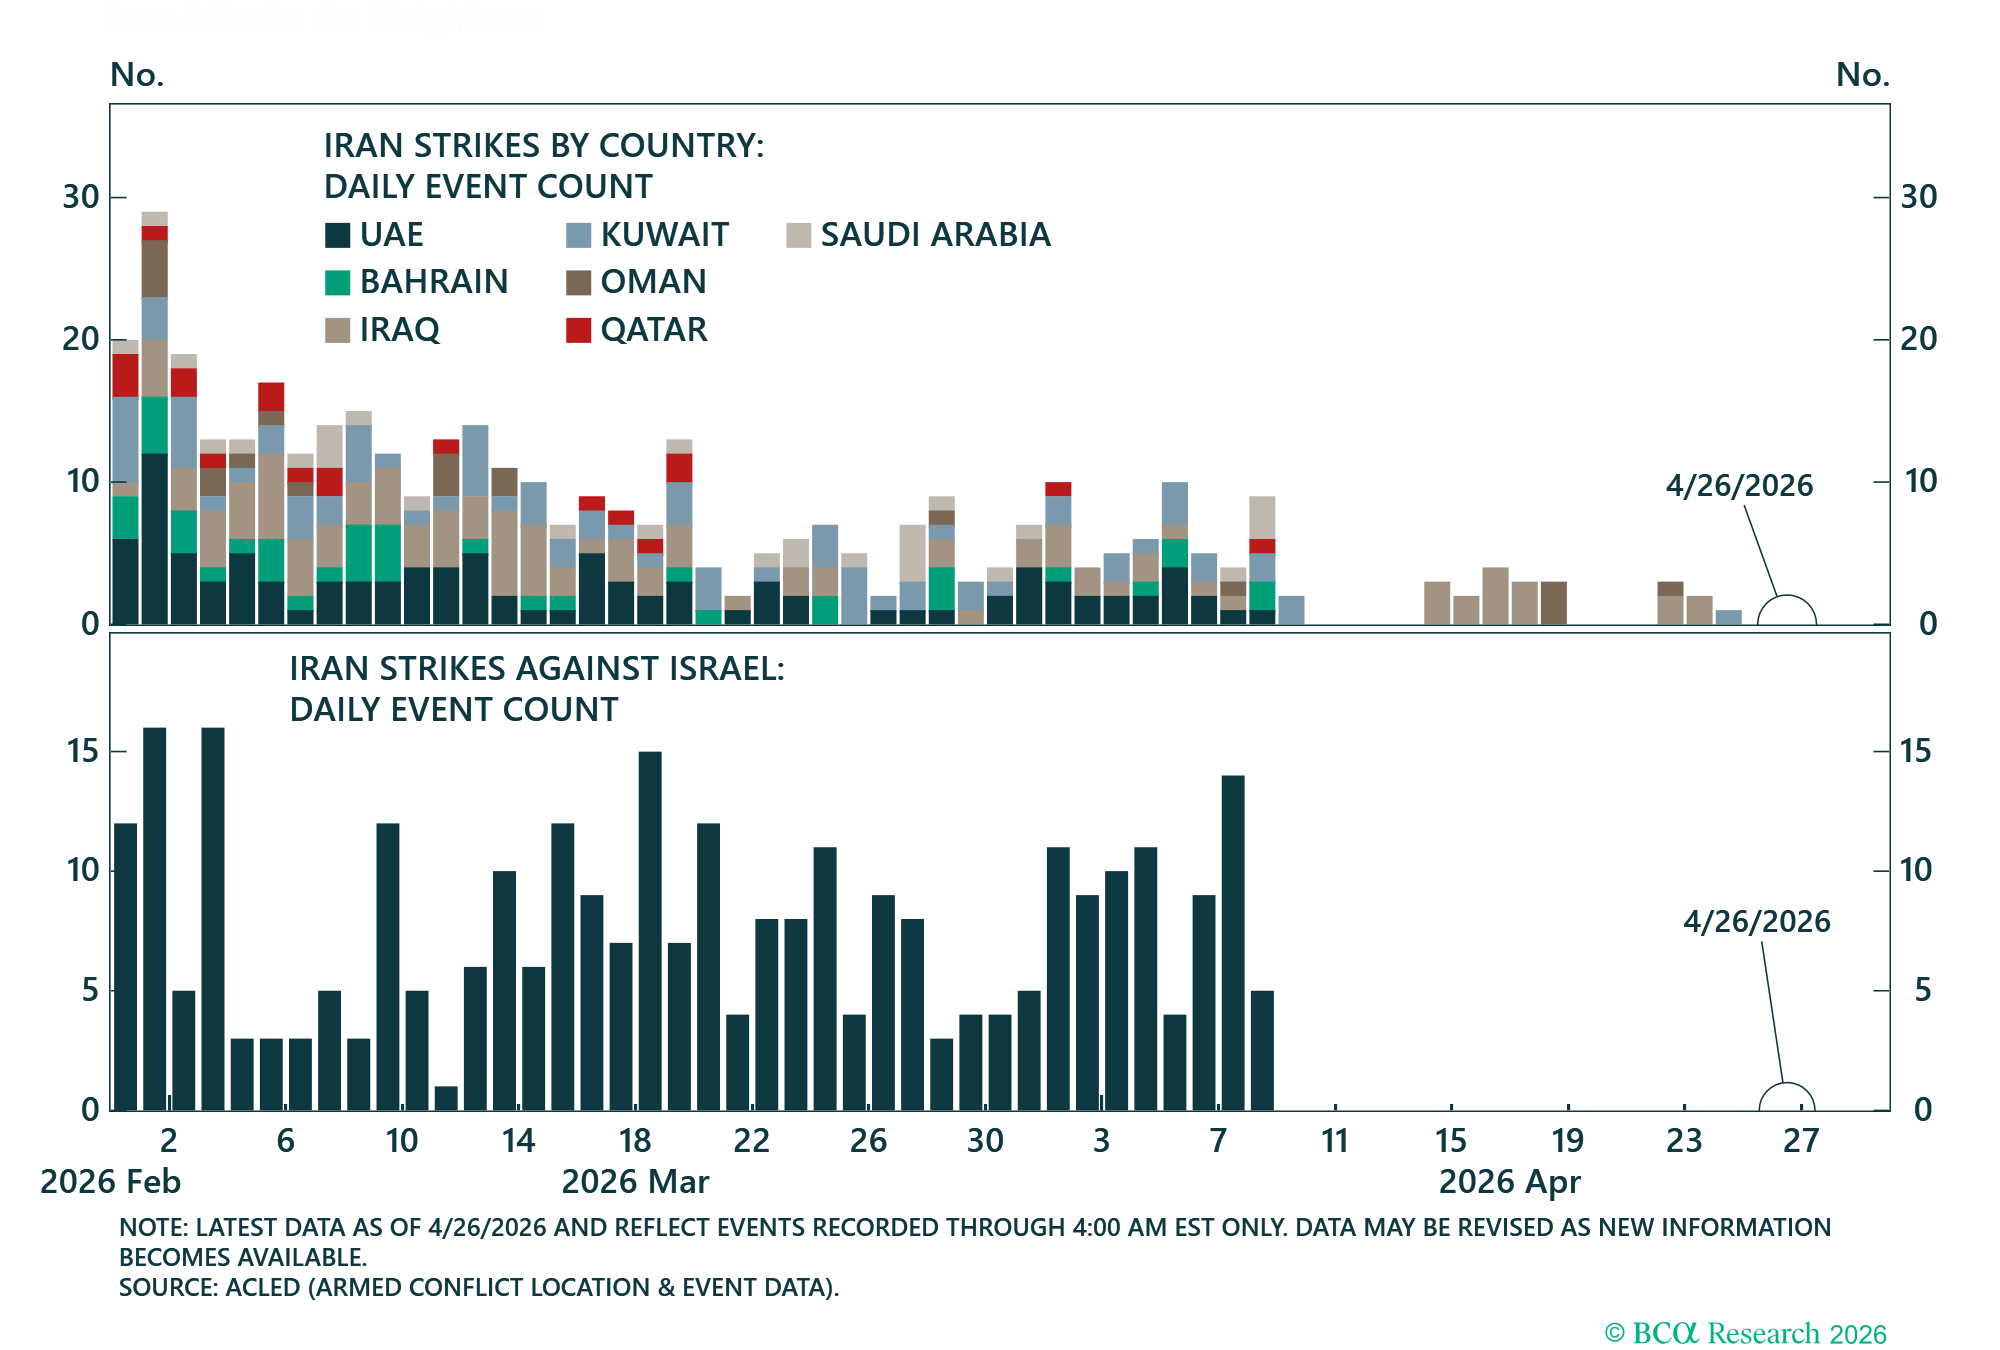
These charts show daily data on attacks launched from Iran towards the Gulf countries, Israel, and vessels traversing the Strait of Hormuz. They provide context on the intensity and phases of the unfolding conflict.
Total events of aggression by Iran at the Gulf States.

Total attack events on neighbors by attack method.

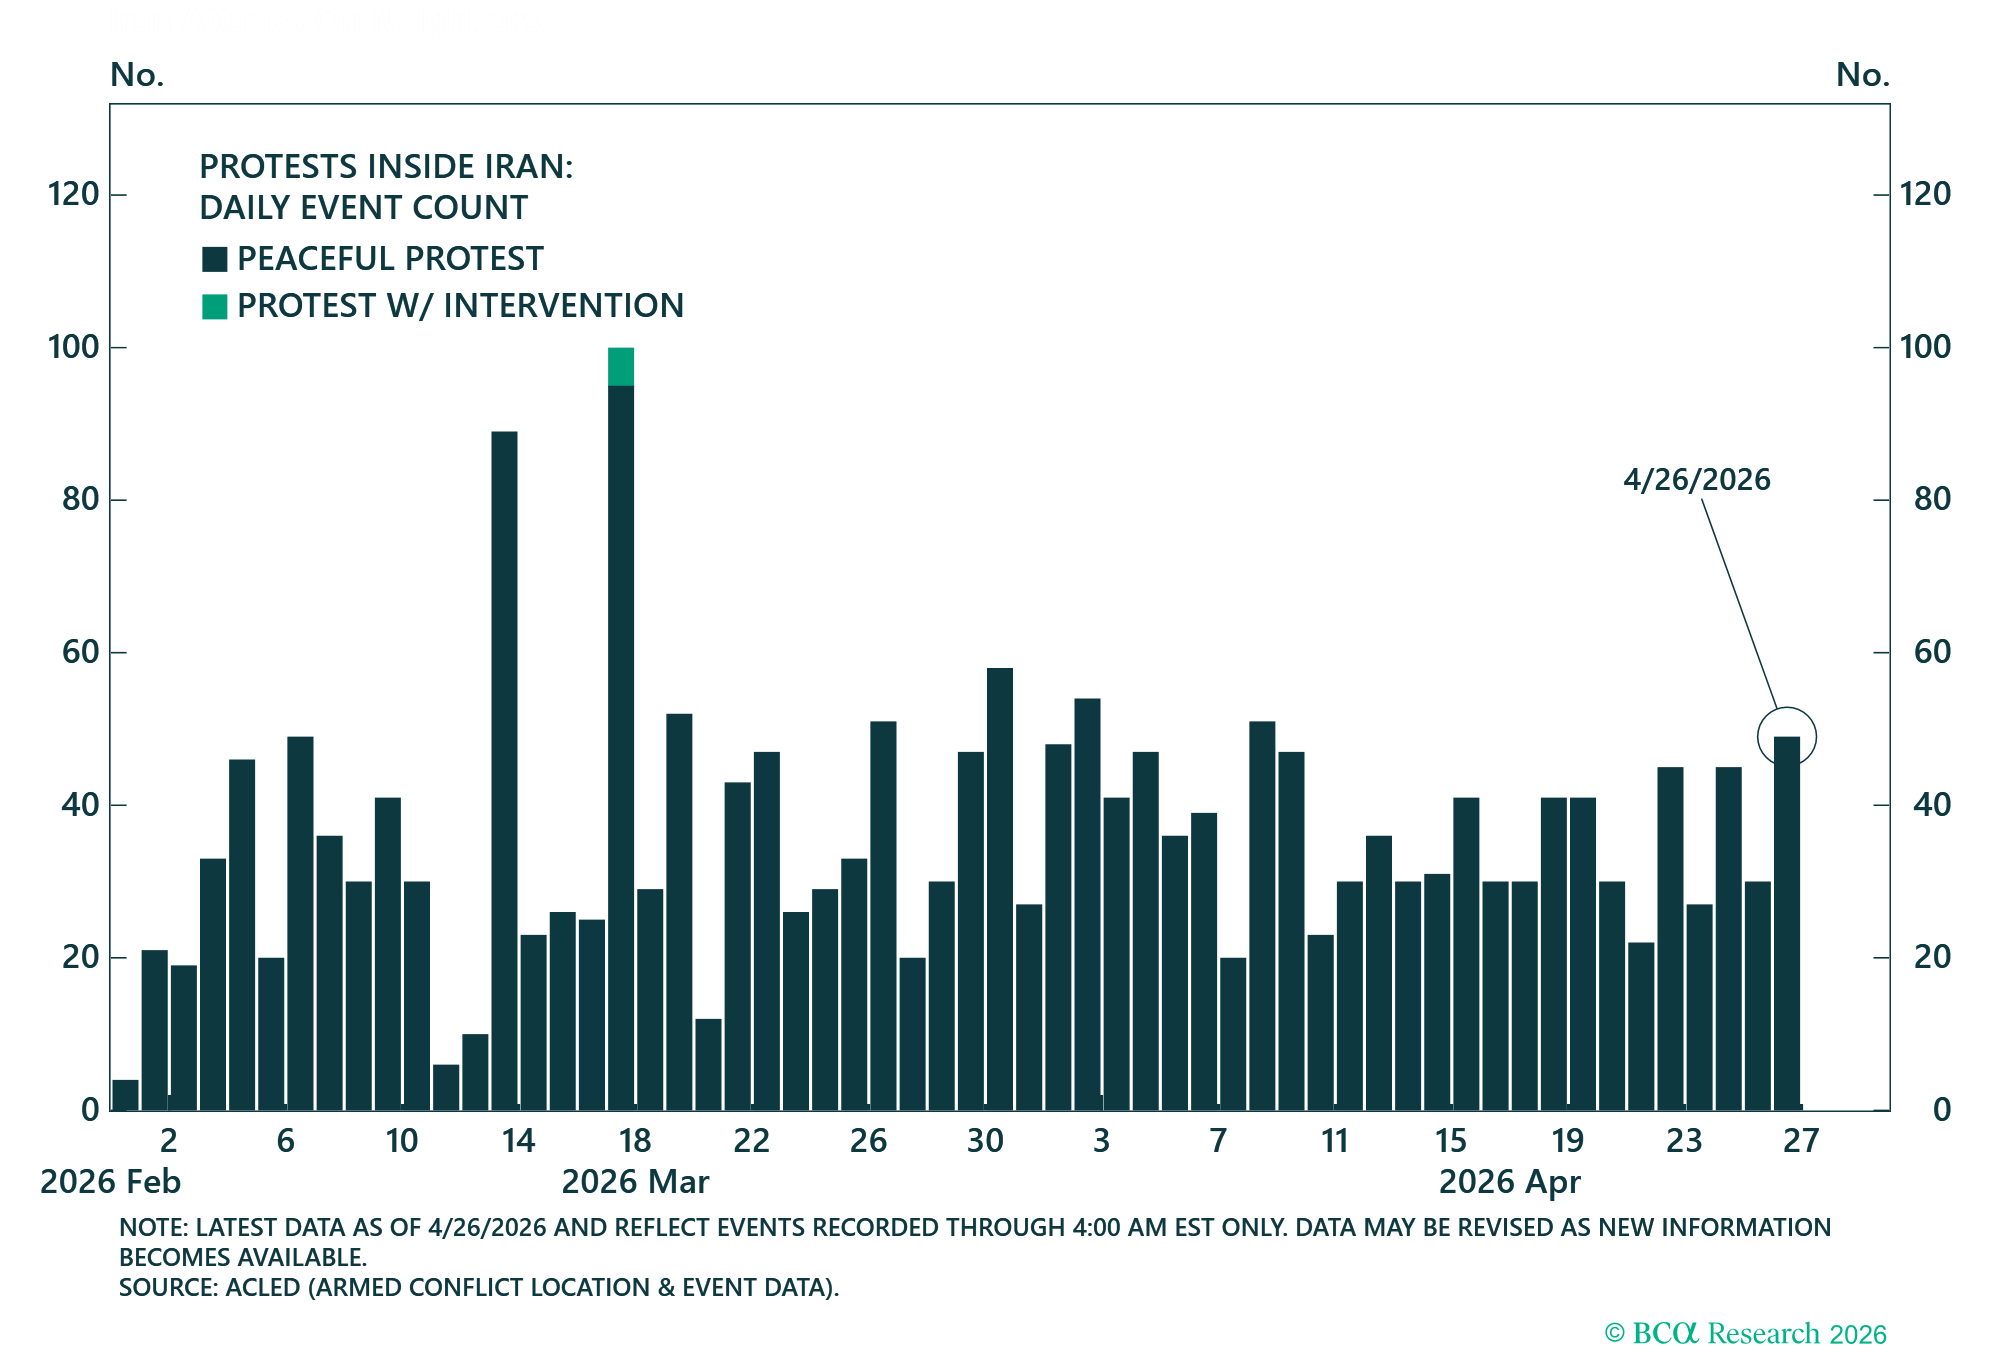
Number of protest events in Iran, by nature of protest.

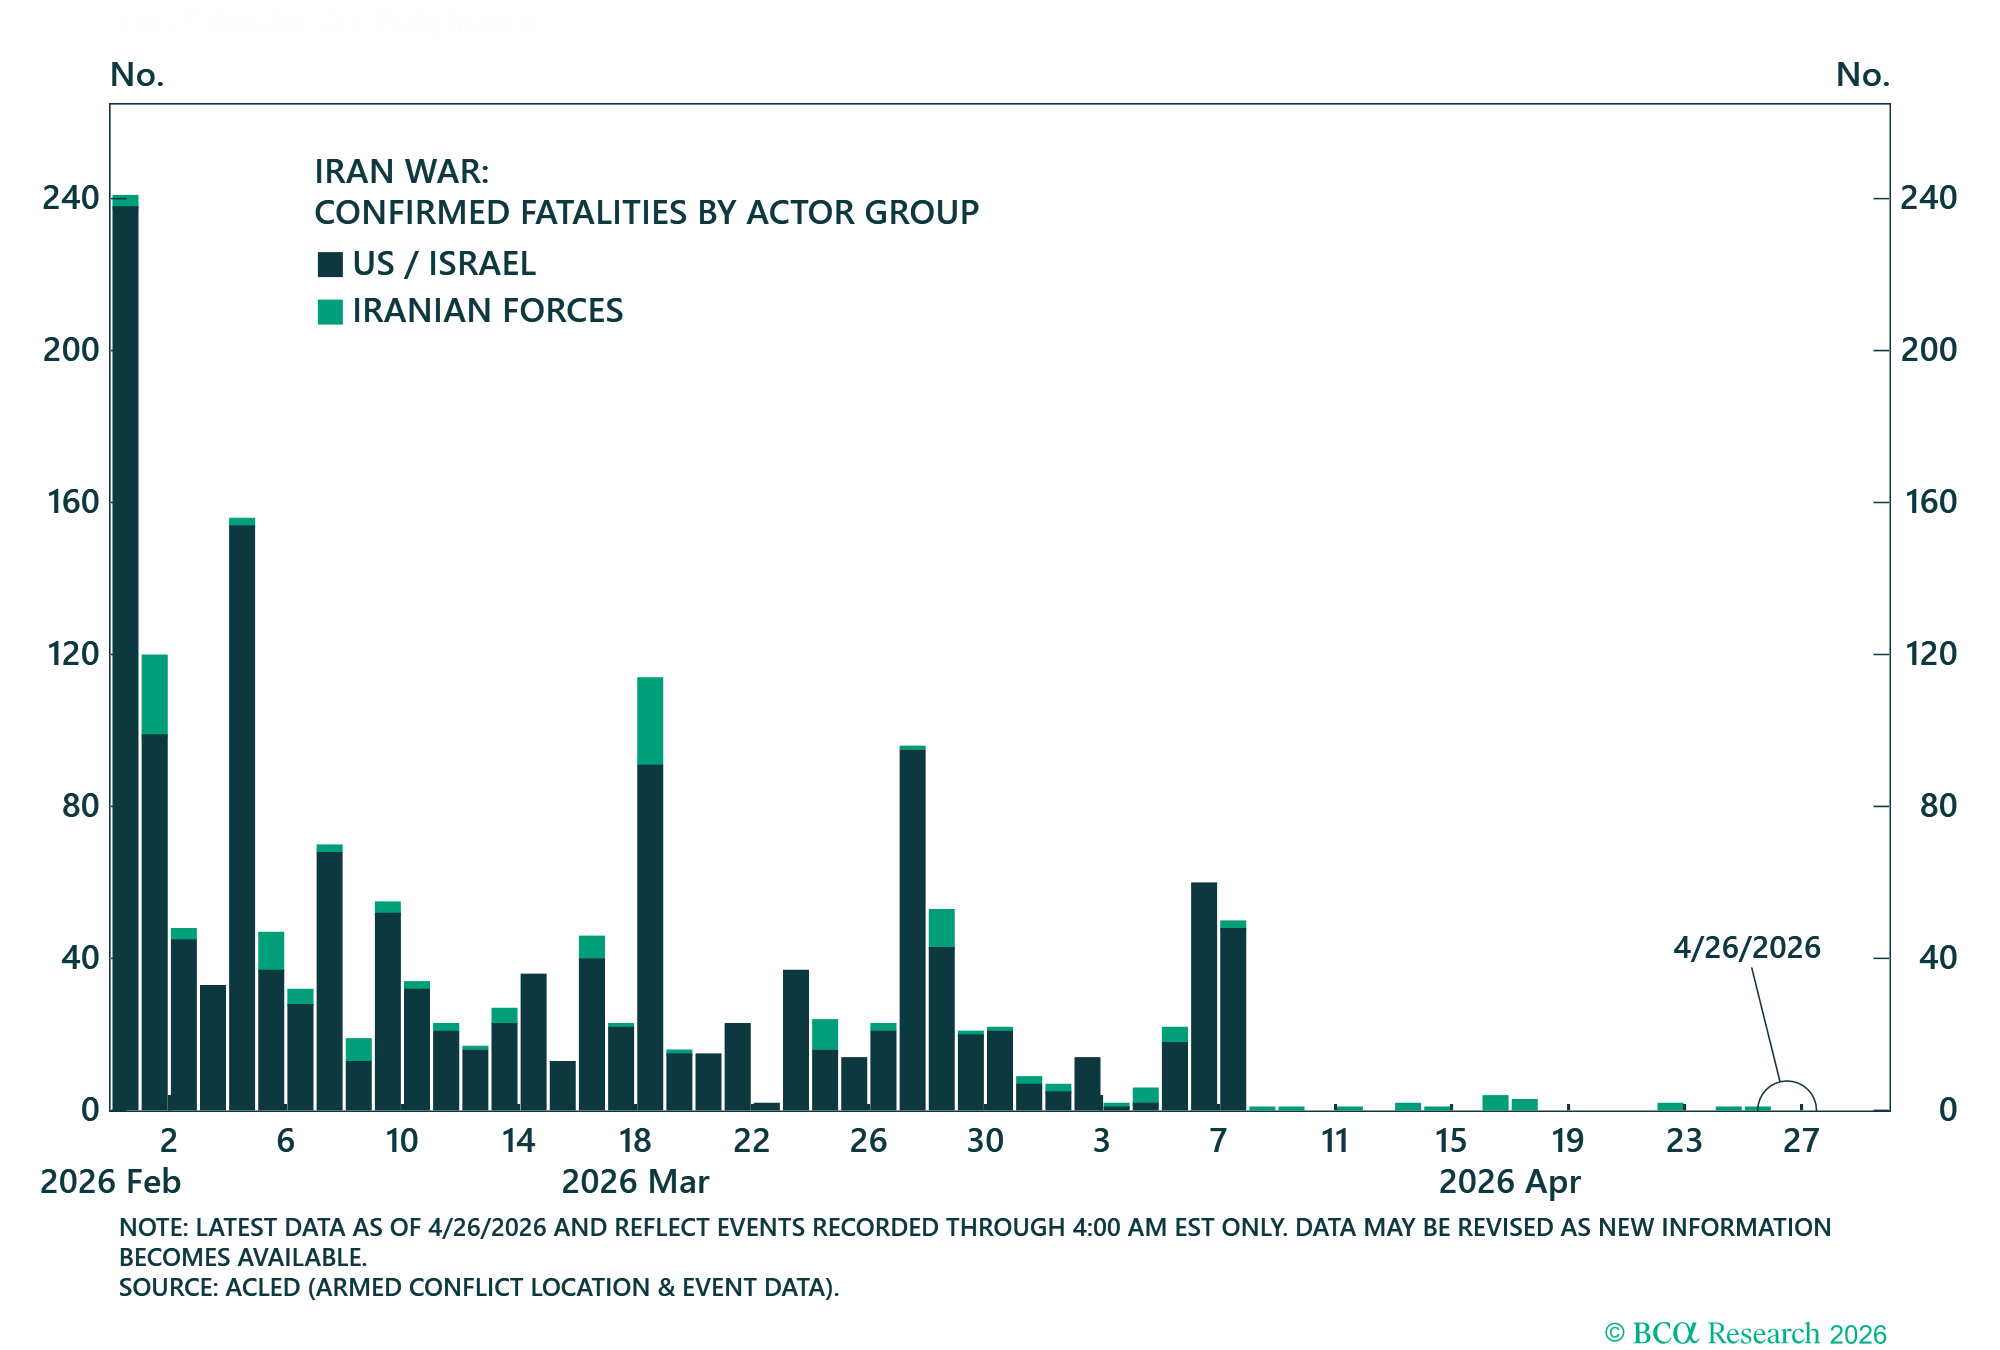
Confirmed deaths by actor group.

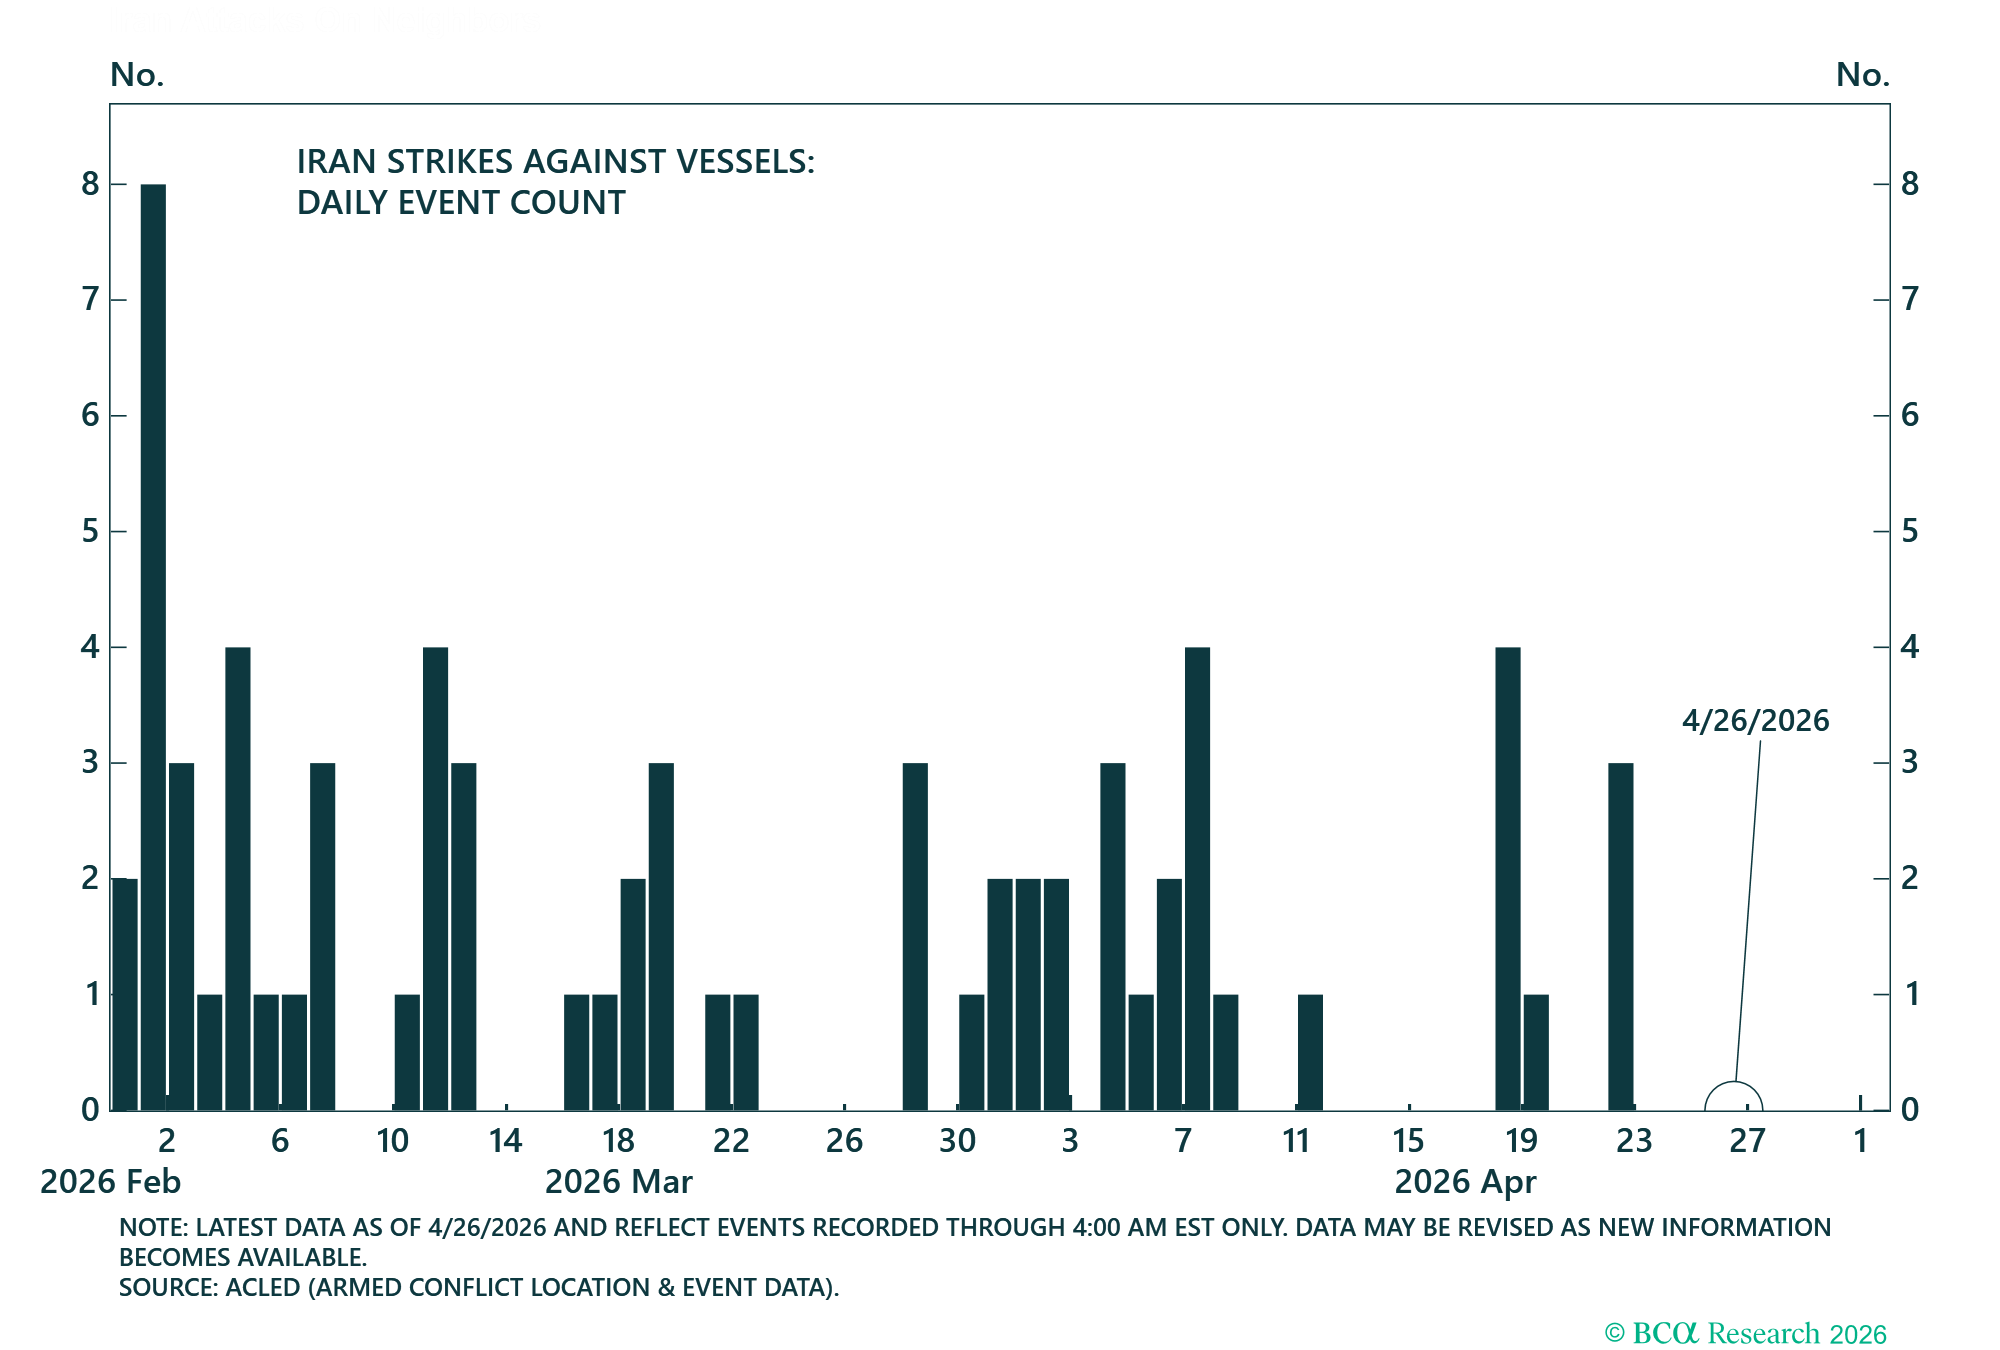
Attacks on vessels passing through the Strait of Hormuz will discourage ships from passing through.

Attack events on Iran by the US and/ or Israel.

Energy Flows
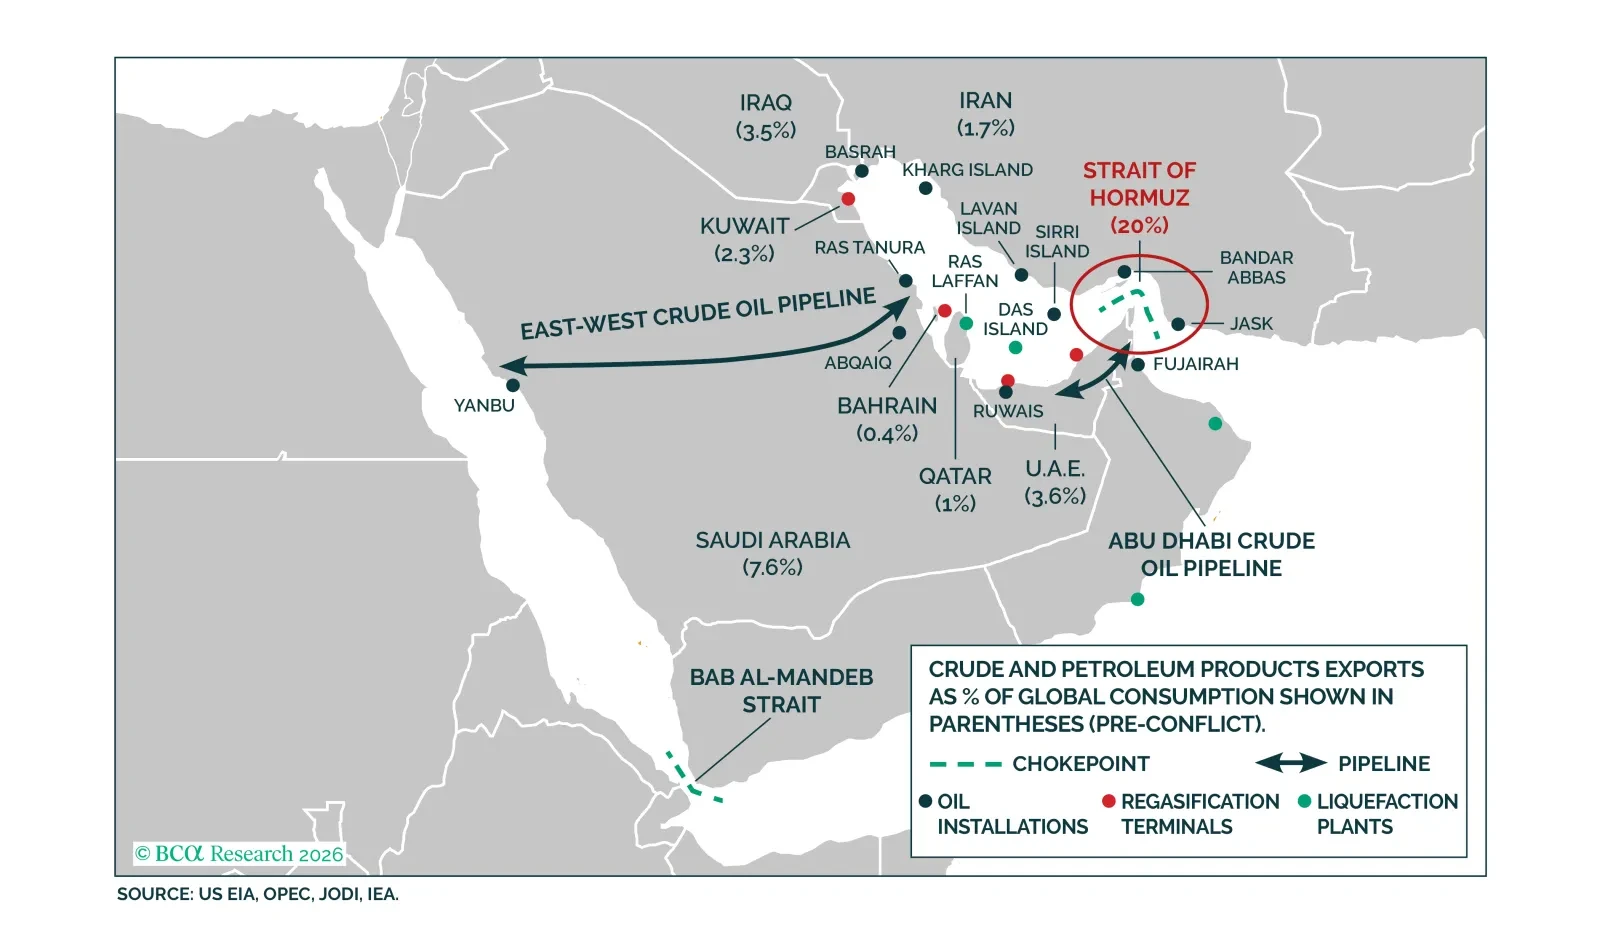
Gulf countries produce a significant portion of global crude oil, natural gas, and refined products. After the start of the war, these products were halted and could not pass through the Strait of Hormuz. Increased traffic through the strait would suggest a softening of the war.
Significant outages on marked infrastructure will exacerbate the conflict's energy supply shock.
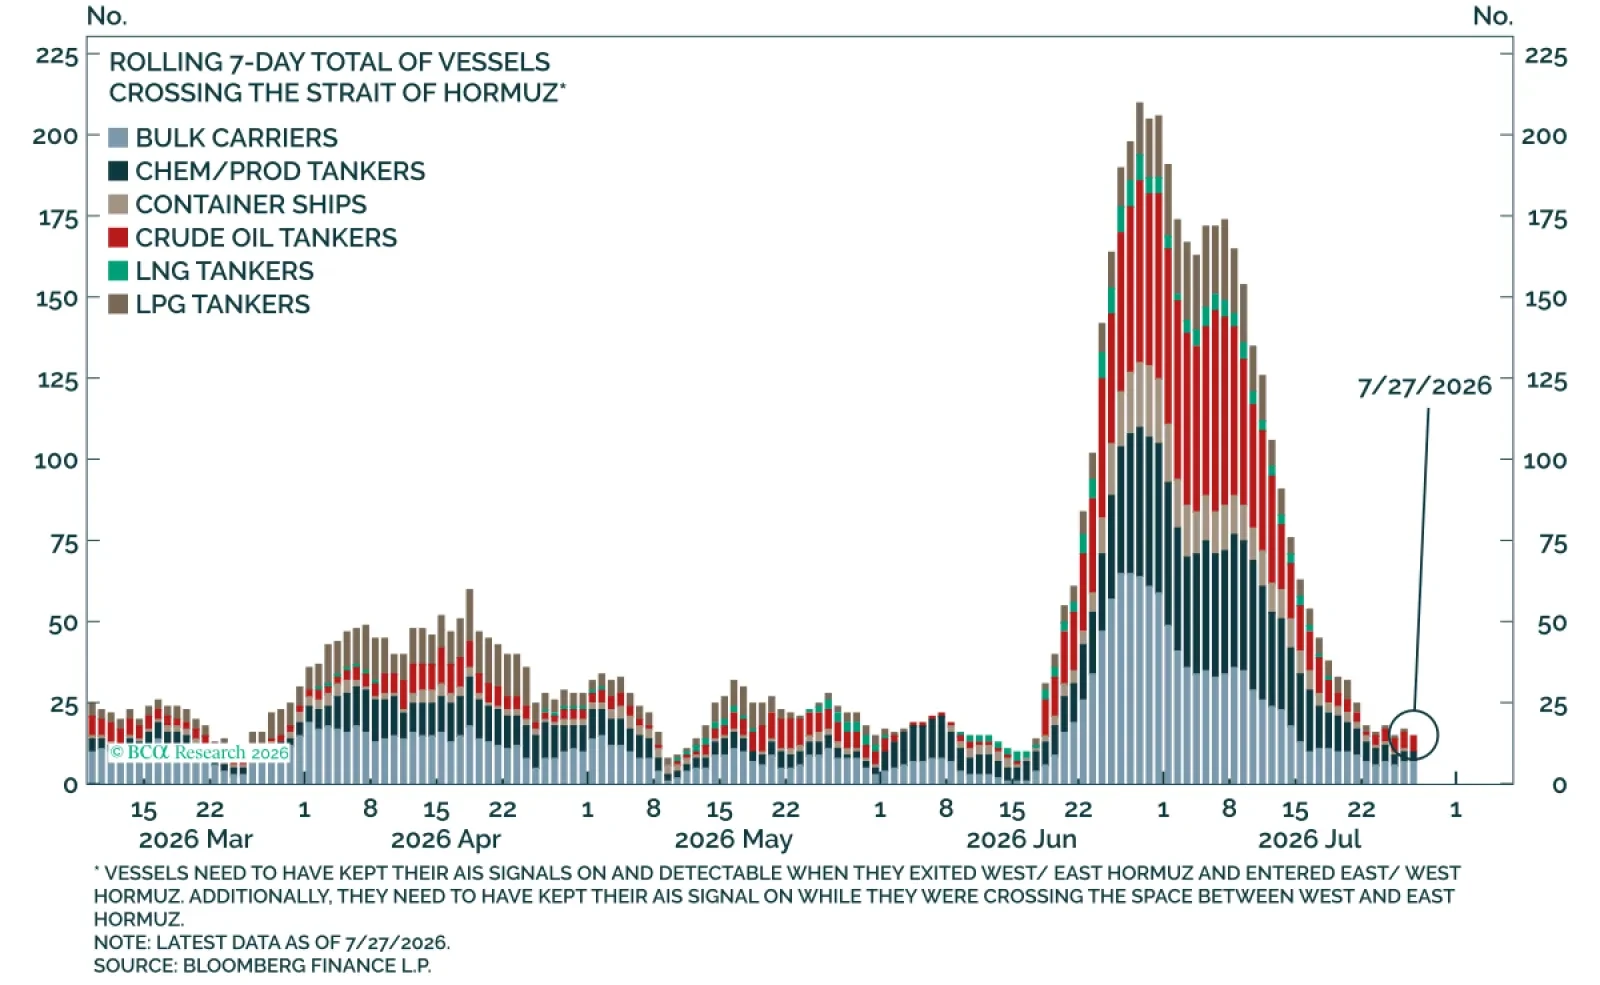
Post-conflict, flows through the Strait of Hormuz have collapsed. (Updated Weekly).

Post-conflict, flows through the Strait of Hormuz has collapsed. (Updated Weekly).

All product shipments through Hormuz are impacted.

All product shipments through Hormuz are impacted.
Shipping through the Suez Canal is not a viable alternative. (Updated Weekly).

Shipping through the Suez Canal is not a viable alternative. (Updated Weekly).

High seaborne oil freight rates will pass onto oil and petroleum product prices.

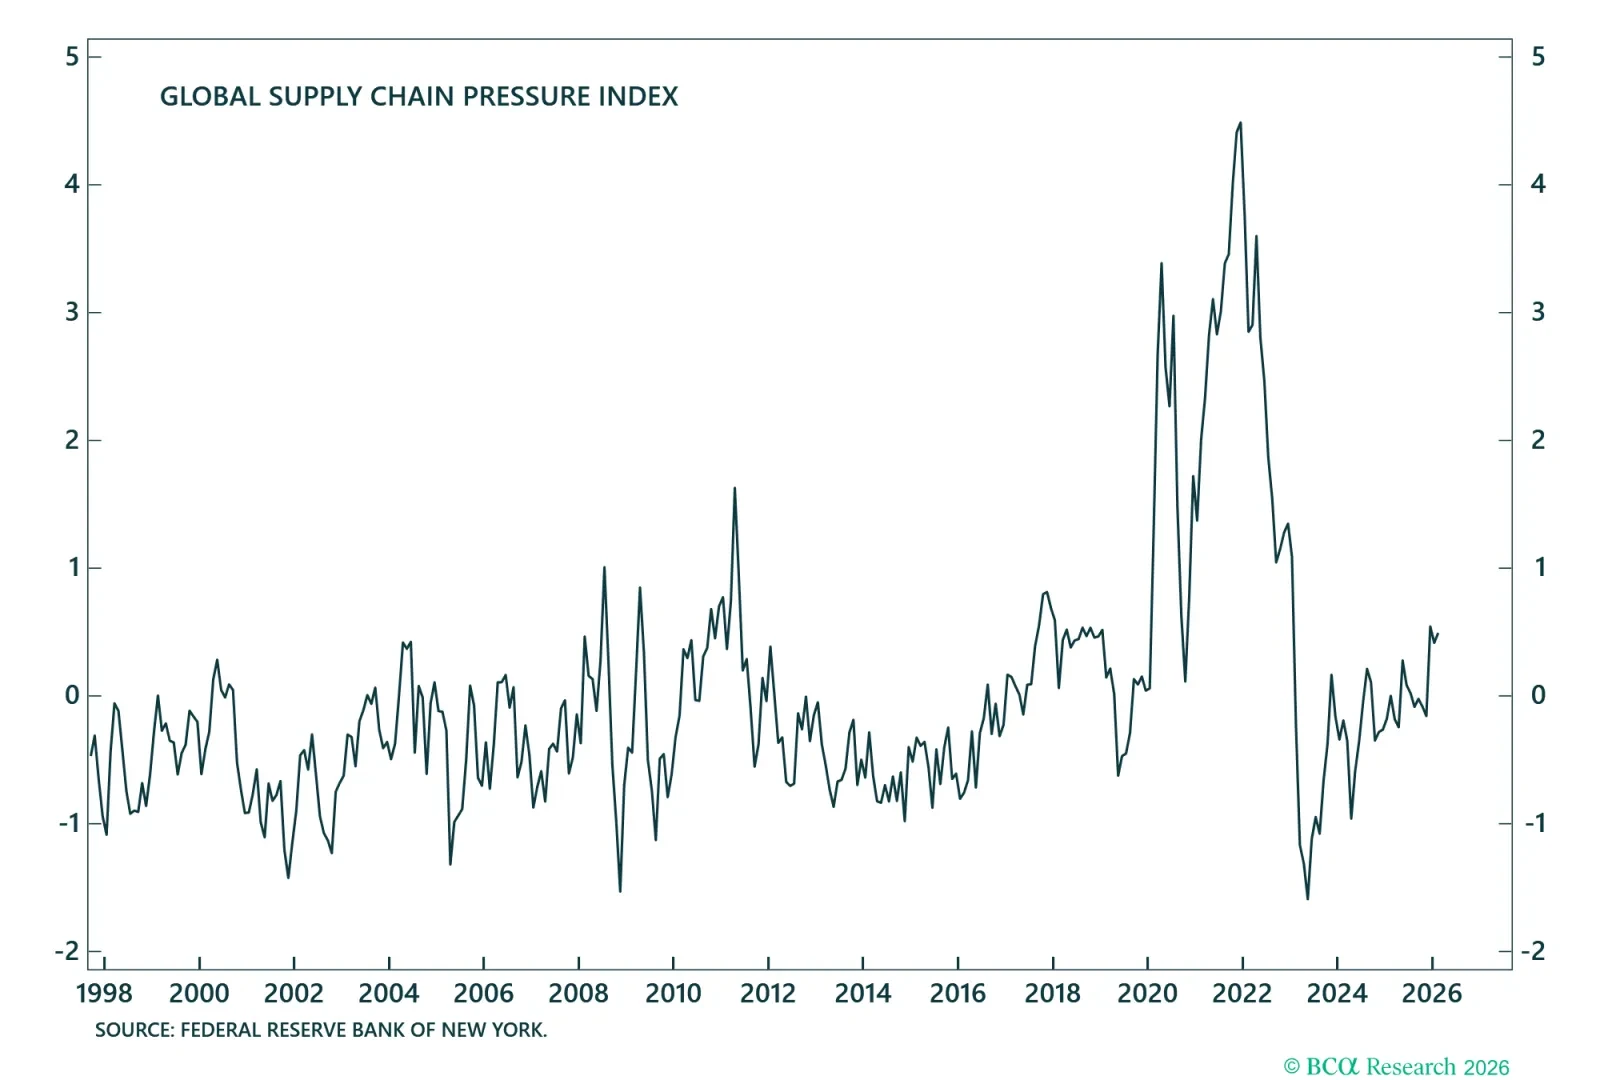
Continued disruption will exacerbate overall supply chain pressures.
Disrupted crude supplies from the Middle East will likely reduce Chinese refinery run rates.

A steep drop in Chinese crude imports alleviated the supply shortage.

US oil and gas production could ameliorate the Middle East oil disruption.

US Strategic Petroleum Reserves is at historically low levels.

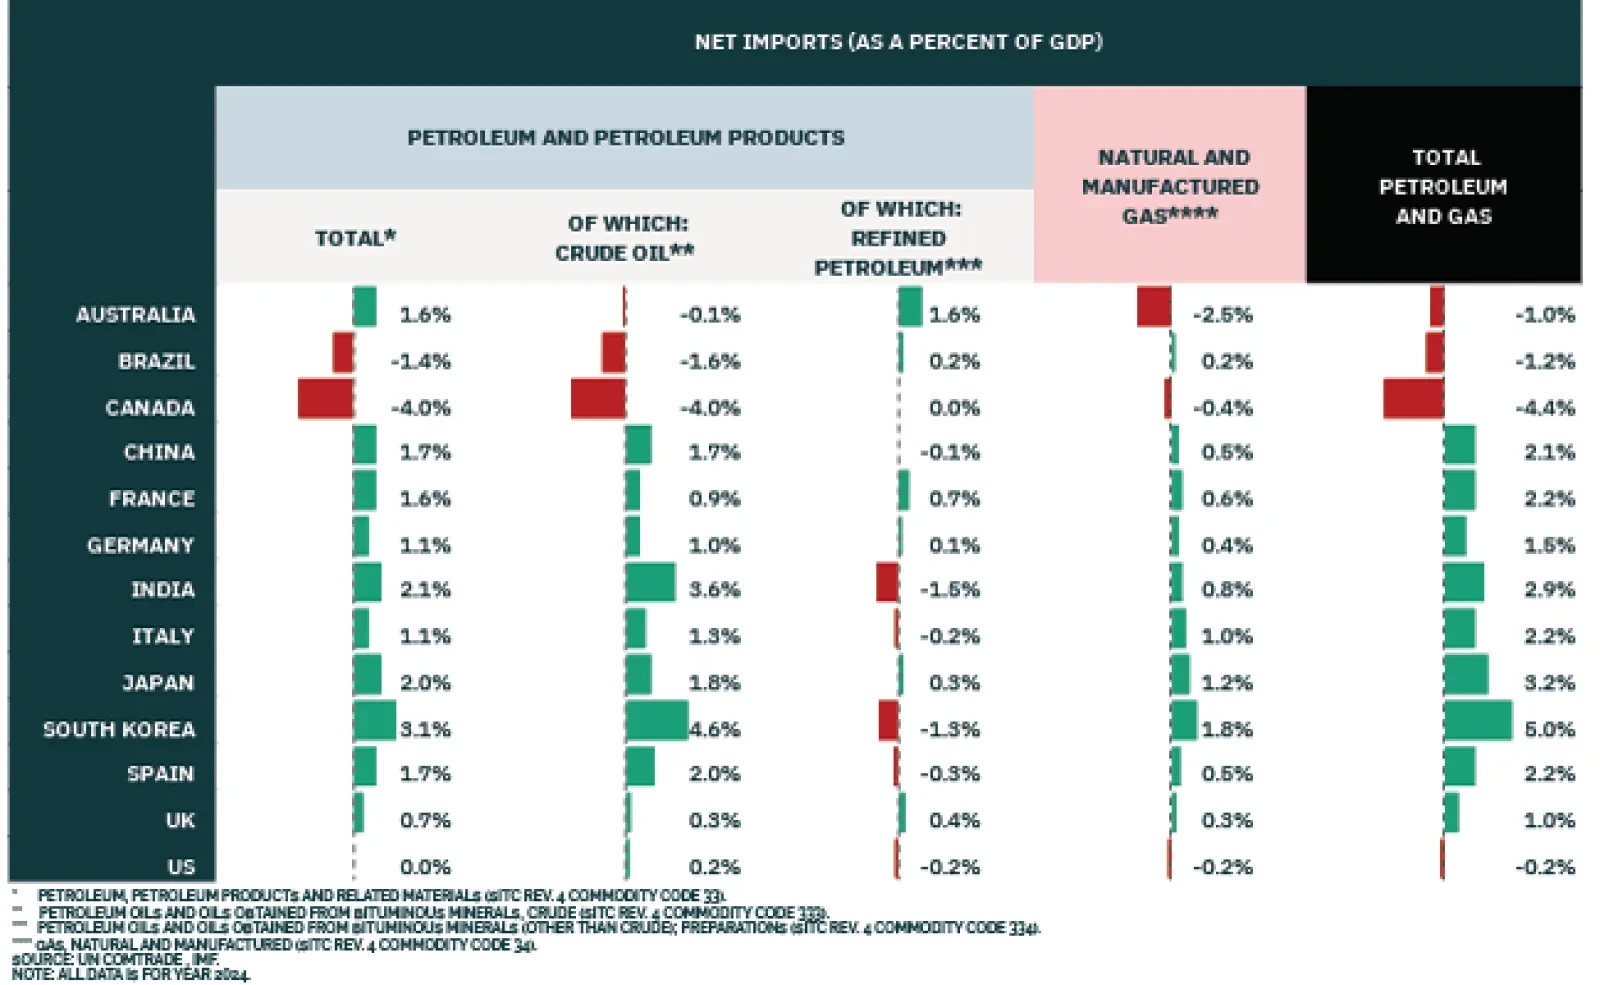
Europe and Asia are most at risk from the oil supply disruption.
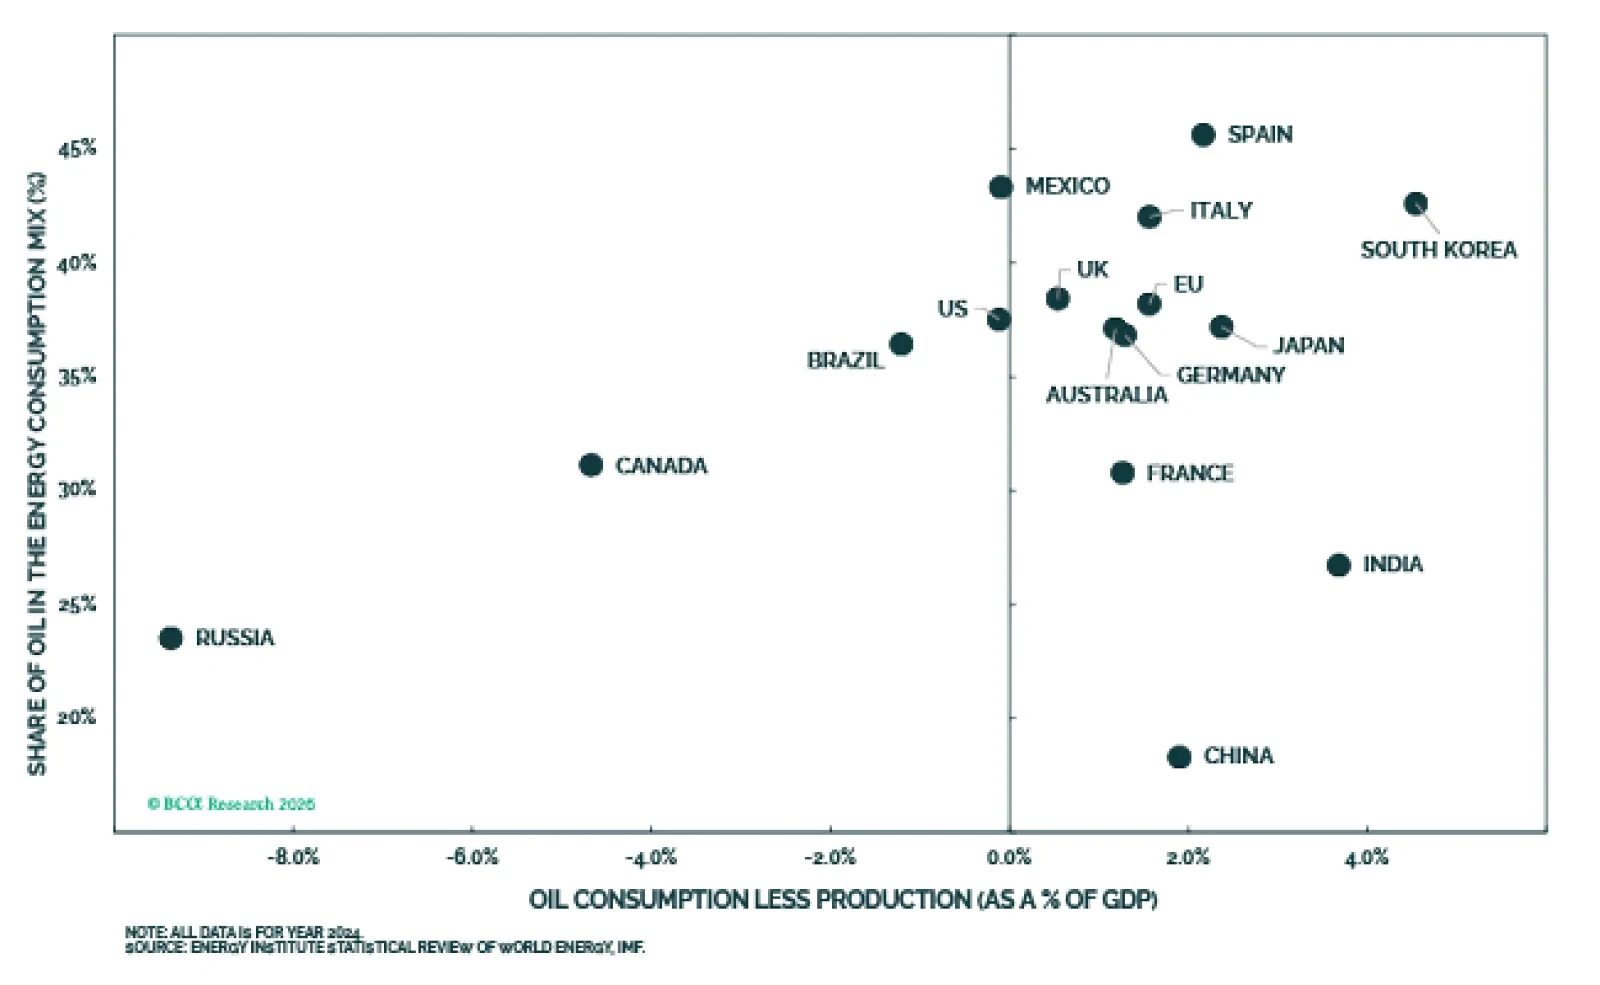
Europe and Asia are most at risk from the overall energy supply disruption.
Gulf energy producers are cutting crude output.

Commodities
This conflict is the most severe oil supply shock in history. The spillovers extend beyond energy. Agricultural commodities, in particular, face indirect upside price risk due to higher prices of fertilizer, fuel, and transportation. Among industrial metals, the disruption is denting global aluminum supplies
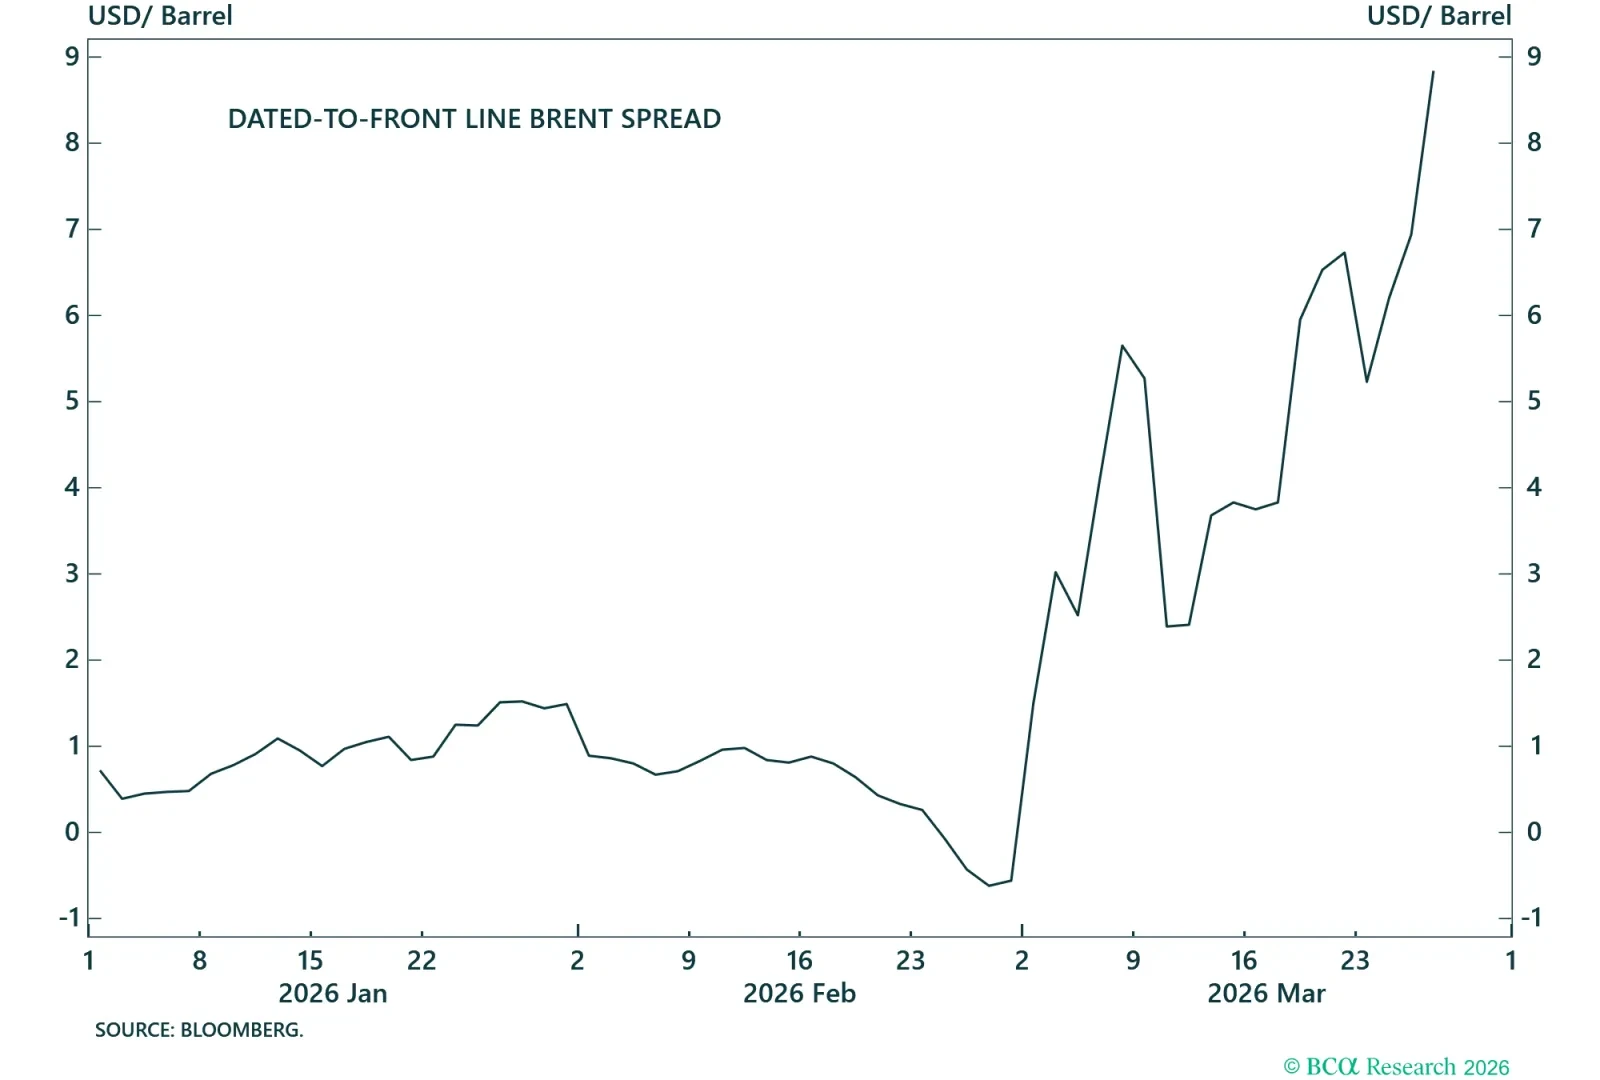
The supply disruption has steepened Brent’s backwardation, widening the premium for prompt barrels over longer-dated supply.

A wider premium for spot physical barrels over futures-priced Brent reflects tighter near-term market conditions.
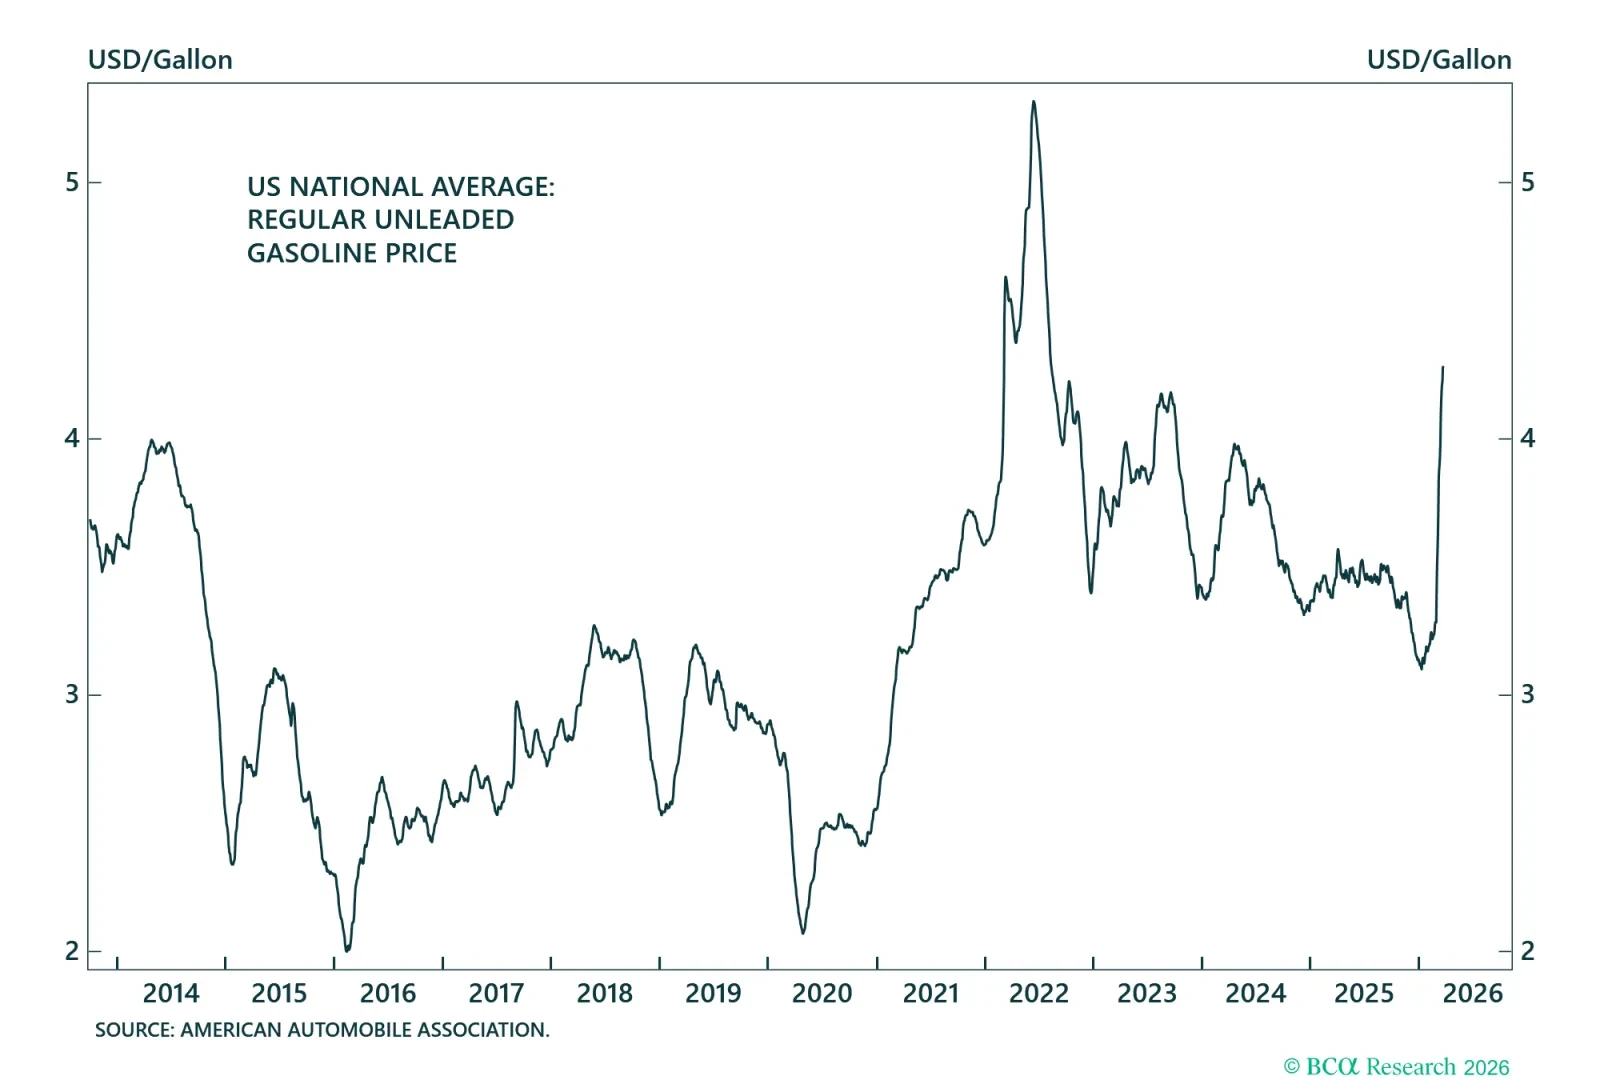
Surging gasoline prices point to rising costs for drivers, signalling pressure on household budgets.
Higher diesel prices raise costs for trucking, rail, shipping, farming, and heavy industry.

Higher propane prices raise costs for space and water heating, cooking, and operating farm equipment.

Higher heating oil prices raise utility bills for households and businesses that rely on oil for space heating.

Higher jet fuel prices signal upward pressure on airfares and shipping rates.

Gasoline prices have increased by more than crude oil.

Diesel prices have increased by more than crude oil.

Crude prices have outpaced propane prices.

Jet fuel prices have increased by more than crude oil.

Heating oil prices have increased by more than crude oil.

The volume of crude in transit by sea and held in floating storage.

Asian and European natural gas prices have surged.

US natural gas markets are relatively insulated from ex-US market developments.

Higher aluminum prices reflect disrupted Gulf supplies.

Coal price: Disrupted LNG flows could incentivize gas-to-coal switching in power generation, pressuring coal prices higher.

Higher fertilizer prices reflect disrupted Gulf supplies.

Surging energy and fertiliser prices point to higher agricultural costs.

Surging energy and fertiliser prices point to higher agricultural costs.

Macro
The energy shock is occurring while inflation remains only partially controlled worldwide. Financial markets will react if inflation expectations increase as the conflict persists over a longer period.
Falling oil prices partly offset tariffs inflation in 2025, but a lasting energy shock would boost goods prices again.
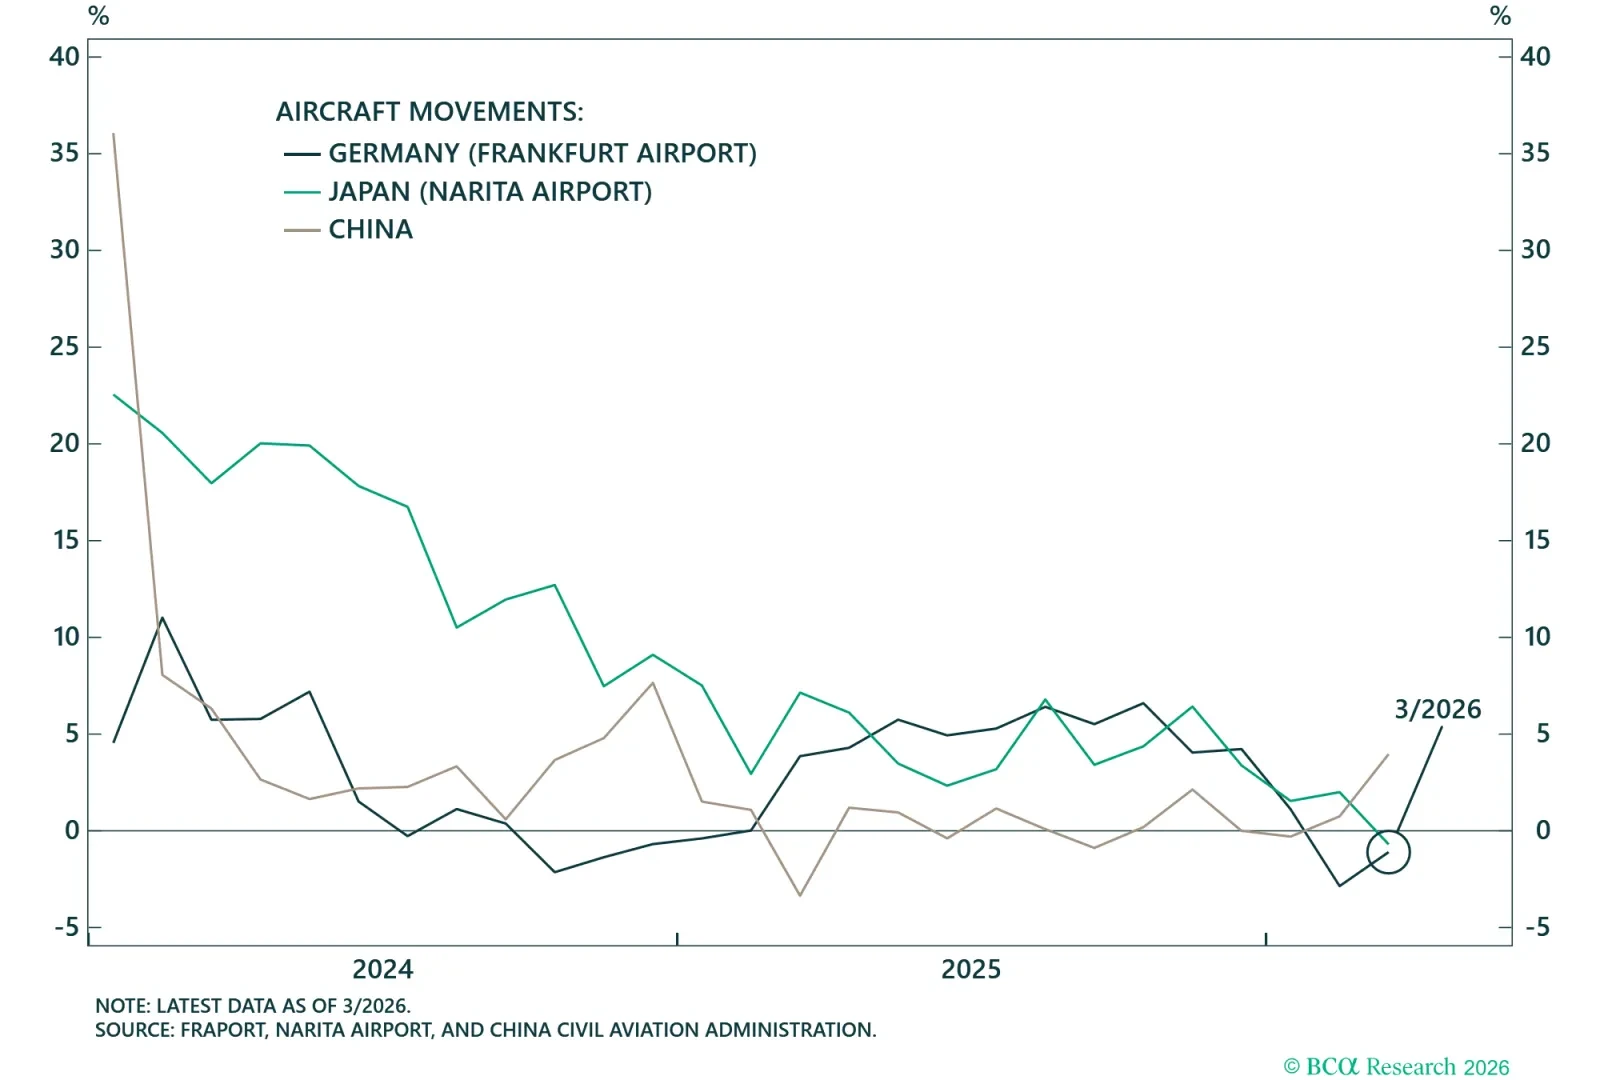
Global air traffic will be affected by fuel shortage.
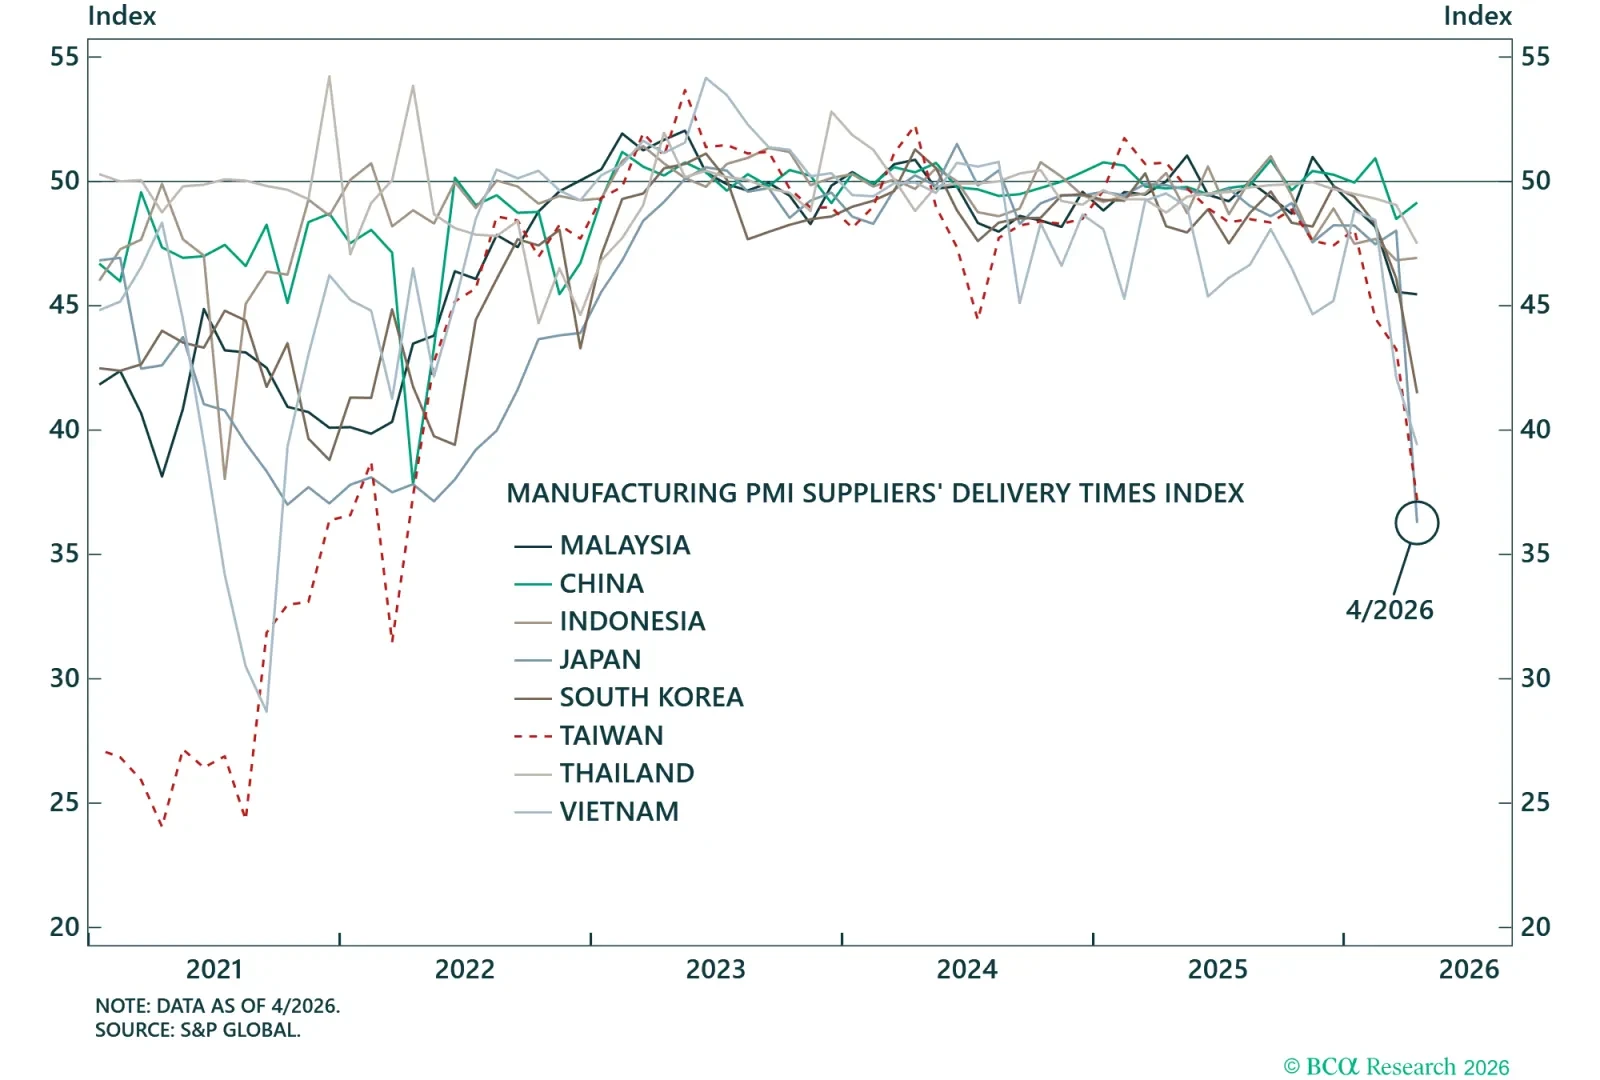
Supply chains will tighten since producers' access to manufacturing inputs are disrupted. Lower values indicate more tightness.
Weakening retail sales highlight soft domestic demand and reinforce the broader structural slowdown in China's economy.
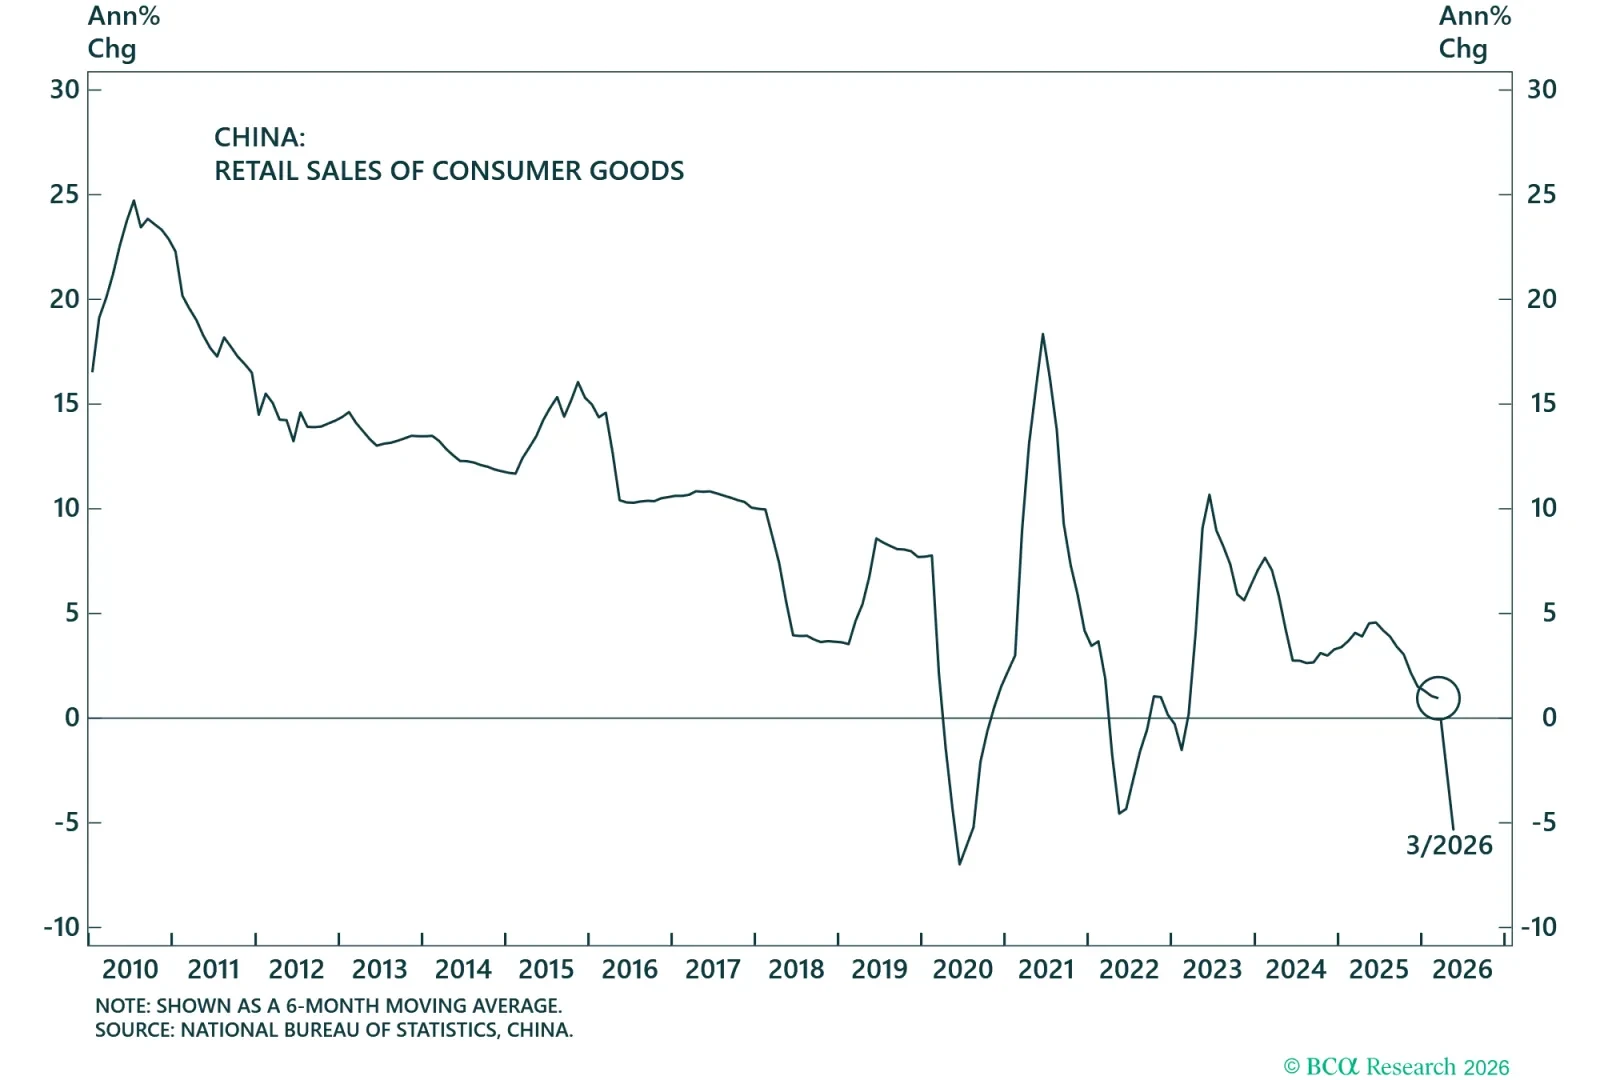
Rising energy prices are beginning to weigh on Chinese consumption.
Systemic financial stress would appear in cross-currency basis swaps, signaling the energy shock is spilling into global funding markets.

Fed funds futures have repriced swiftly already.

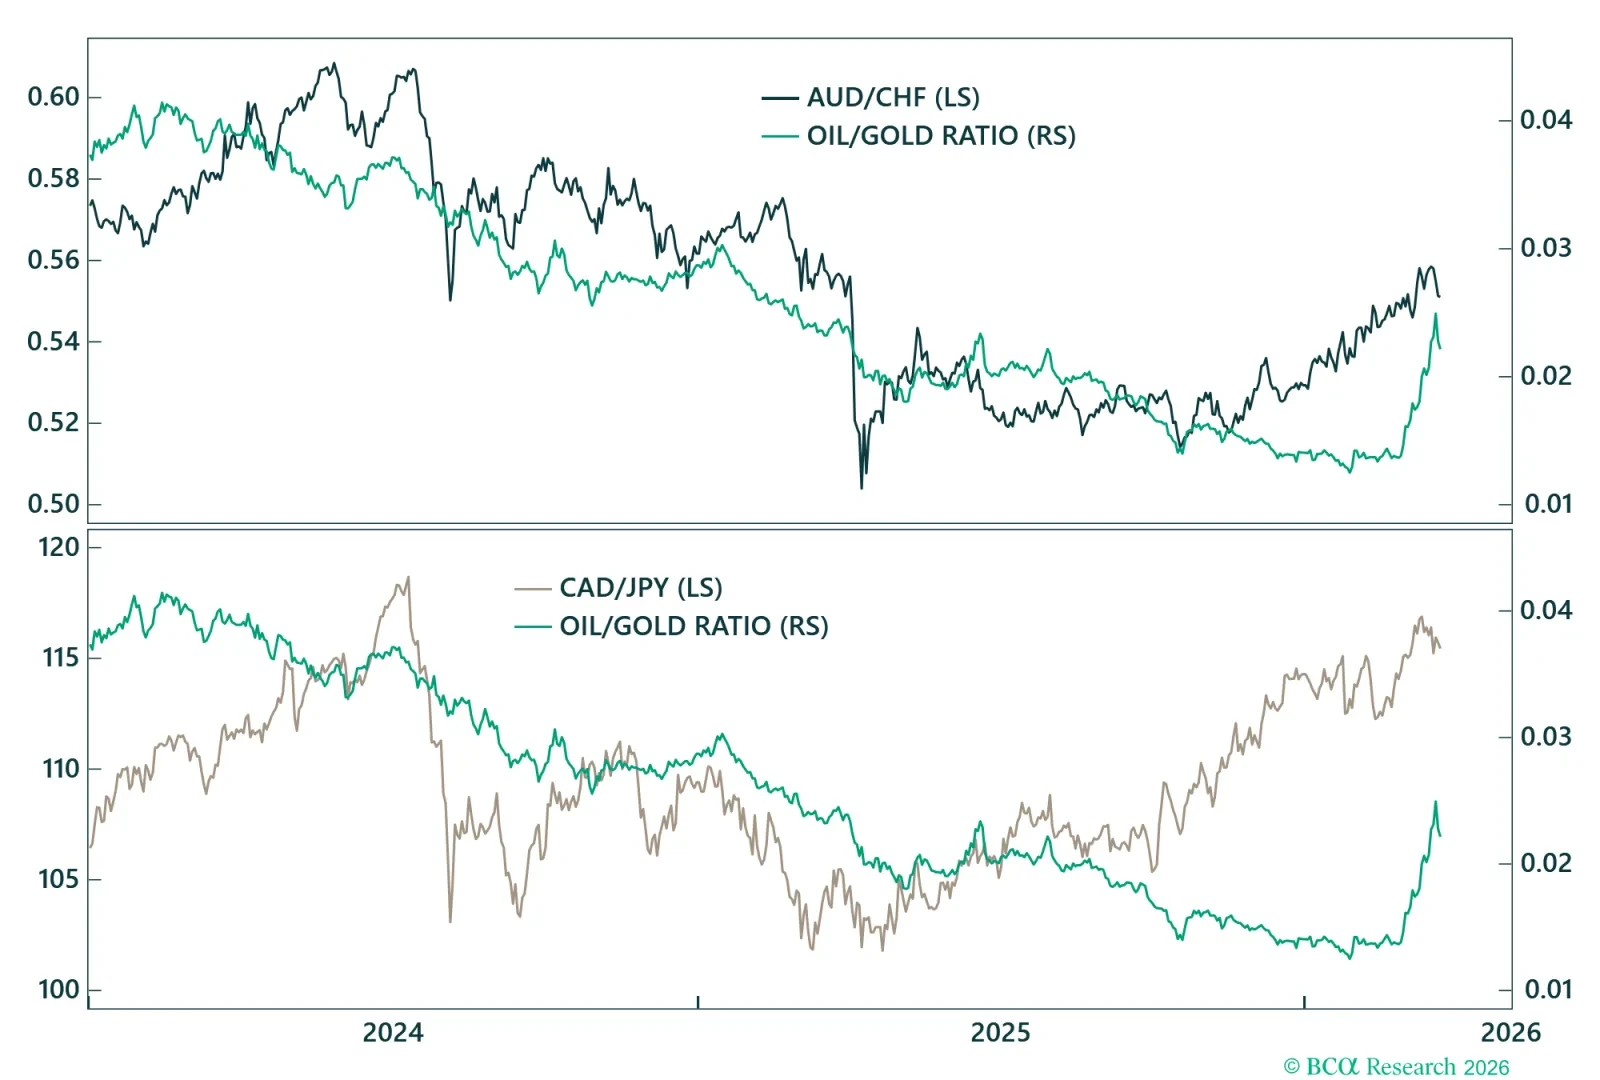
Safe-haven currencies underperforming commodity currencies suggests markets are pricing a terms-of-trade shock rather than a growth shock, for now.
Watch the correlation between oil prices and bond yields. Both have risen, but a reversal (with yields falling) would signal a shift from pricing a commodity shock to a flight into safe havens.

Watch the correlation between oil prices and bond yields. Both have risen, but a reversal (with yields falling) would signal a shift from pricing a commodity shock to a flight into safe havens.

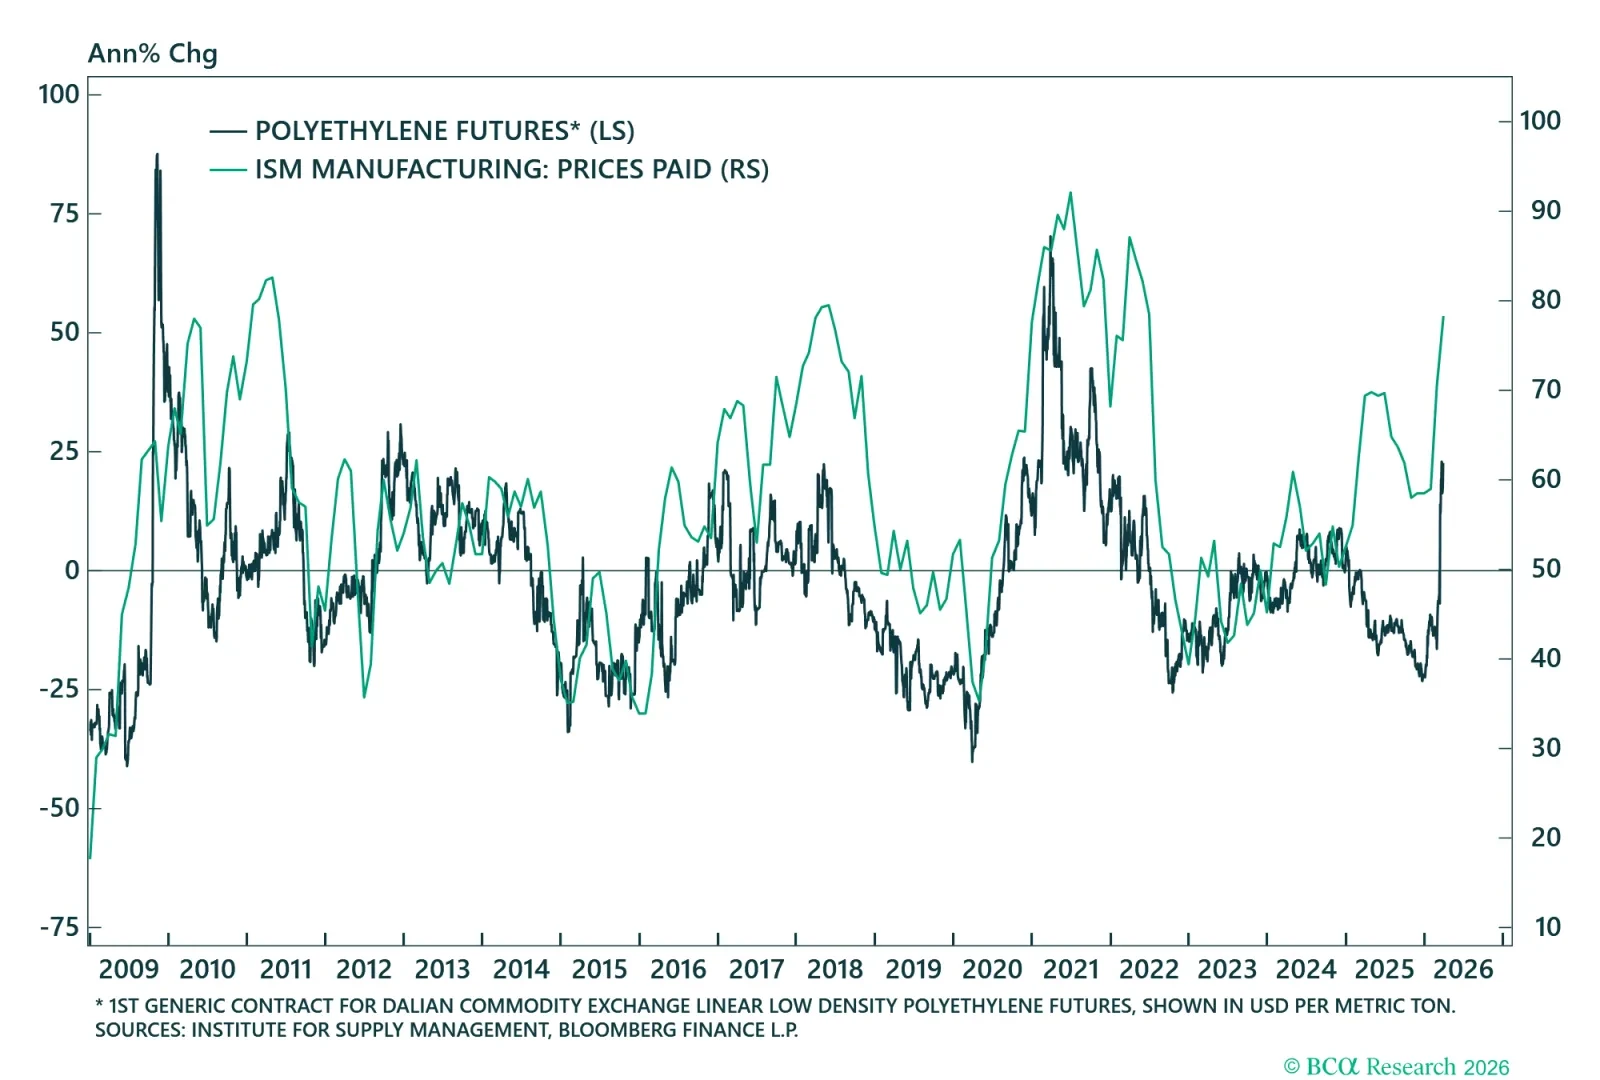
The oil supply disruption will raise petrochemical and plastics prices, which are ubiquitously used in the broader economy.
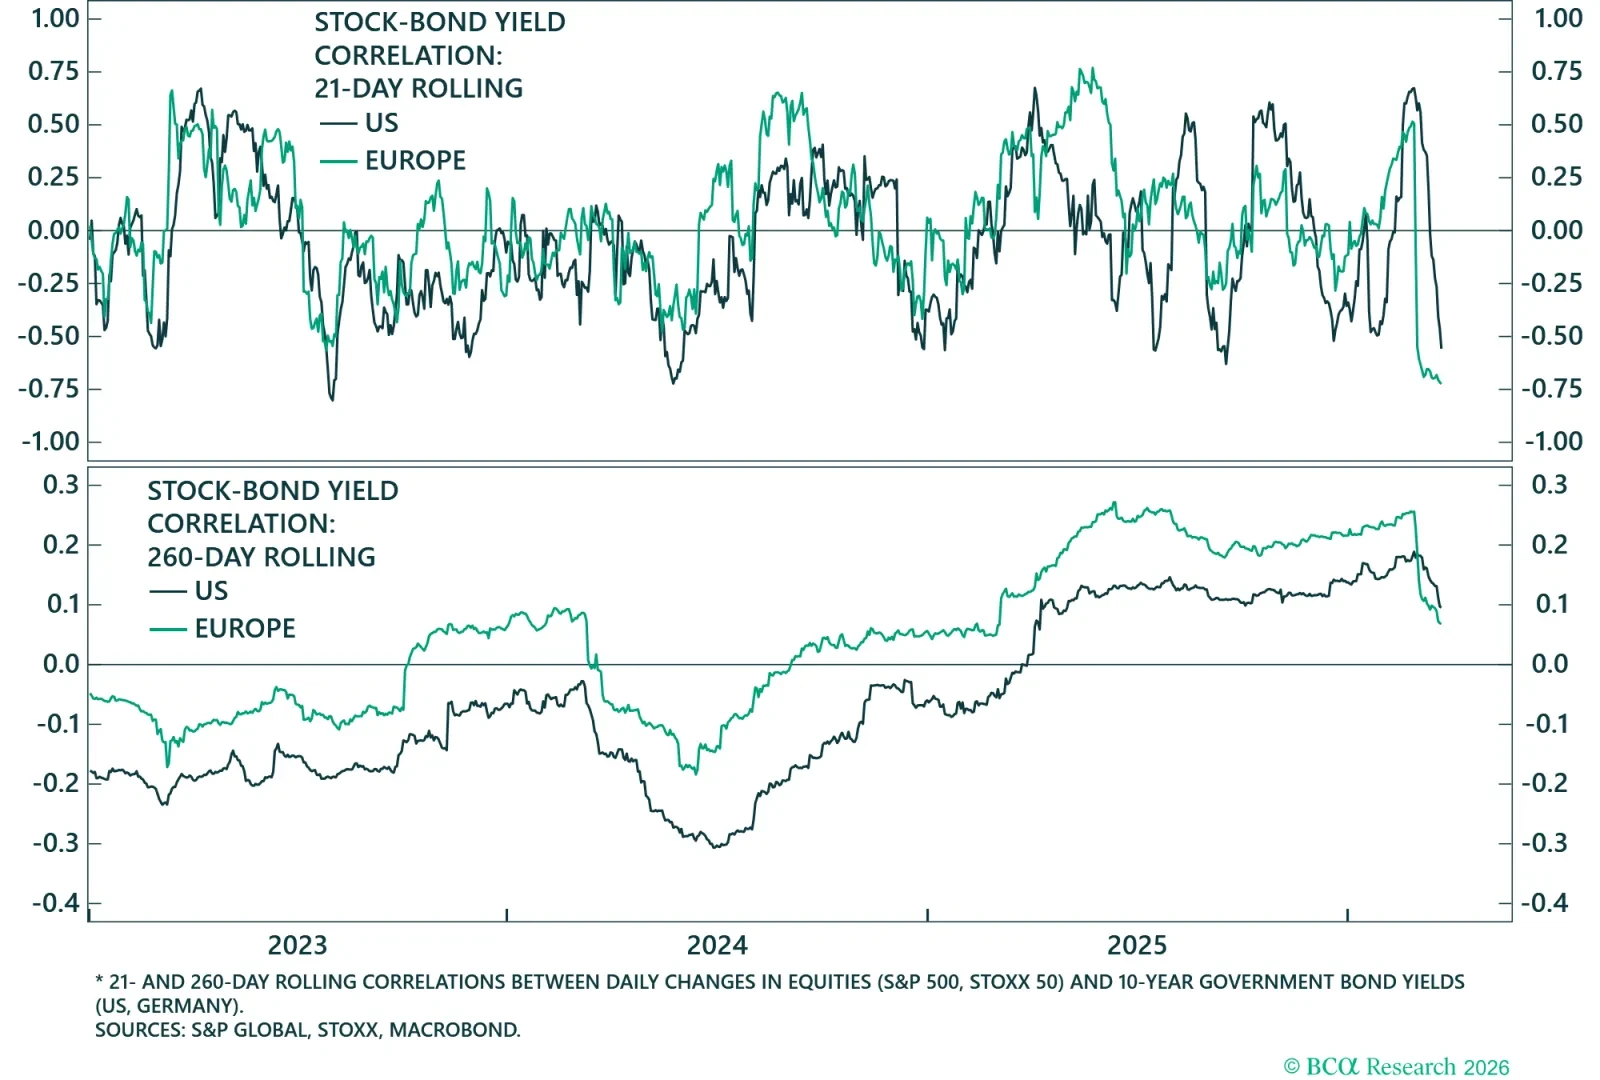
A shift to a positive stock-bond yield correlation would signal markets are focusing on the growth impact of the oil shock rather than its inflationary effects.
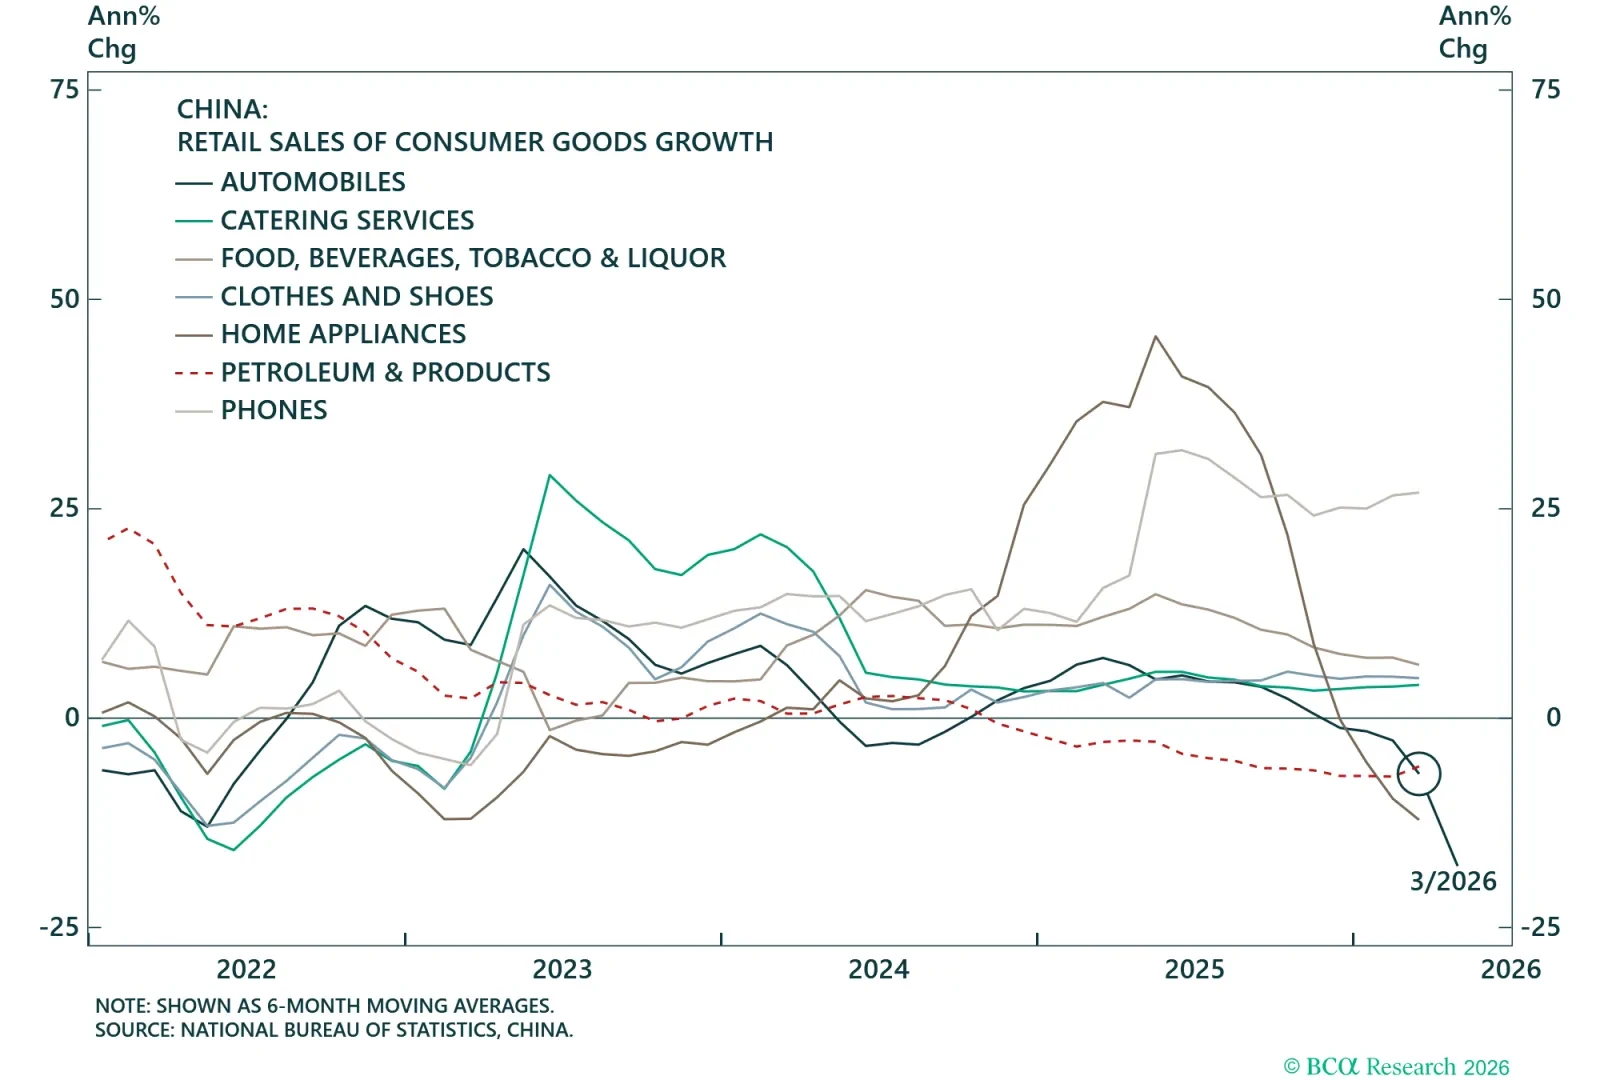
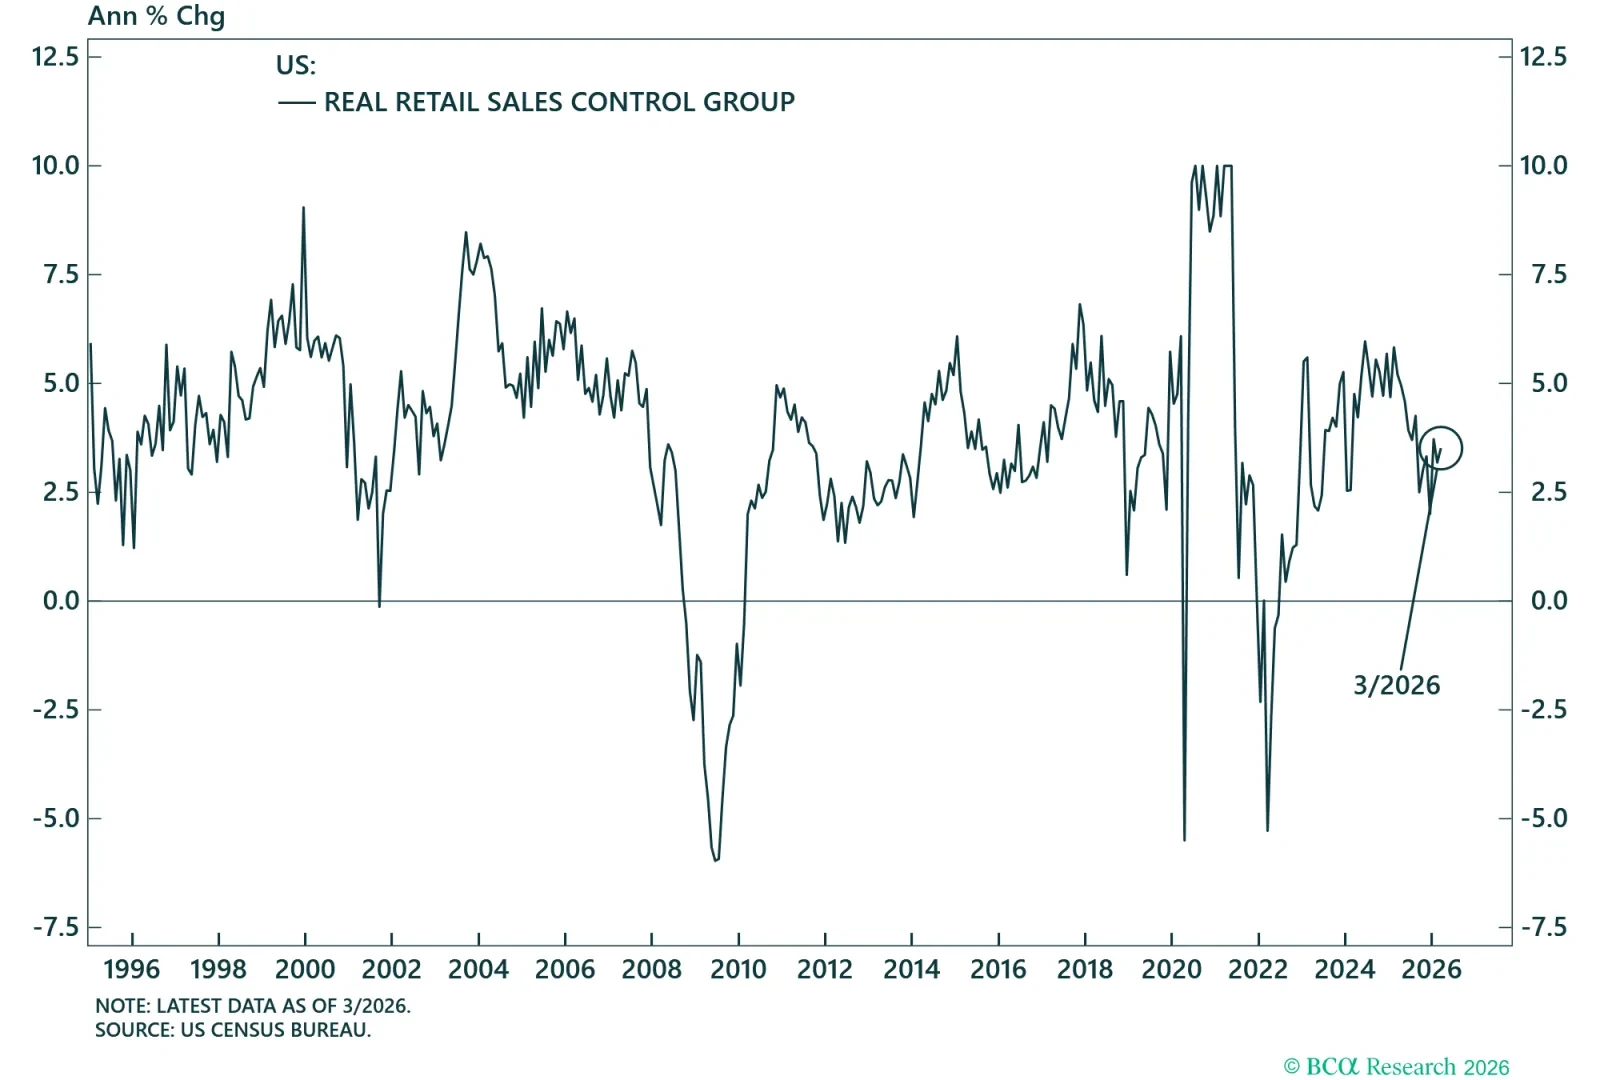
Softening retail sales signal weakening consumer momentum, posing a potential headwind for policymakers in an election year.
The conflict raises oil prices and inflation, which will hit President Trump's and the Republican Party's popularity as the US enters the midterm election campaign season.
