Oil

Highlights Macro outlook: Global growth will continue to decelerate into early next year on the back of brewing EM stresses and an underwhelming policy response from China. Equities: Stay neutral for now, while underweighting EM relative to DM stocks. Within DM, overweight the U.S. in dollar terms. Bonds: Global bond yields may dip in the near term, but the longer-term path is firmly higher. Currencies: The dollar is working off overbought conditions, but will rebound into year-end. EM currencies will suffer the most. Commodities: Favor oil over industrial metals. Precious metals will also remain under pressure until the dollar peaks next year, before beginning a major bull run as inflation accelerates. Feature I. Economic Outlook The Fed Can Hike A Lot More If 2017 was the year of a synchronized global growth recovery, 2018 is turning out to be a year where desynchronization is once again the name of the game. The U.S. economy continues to fire on all cylinders, while much of the rest of the world is struggling to stay afloat. The divergence in economic outcomes has been mirrored in central bank policy. The Fed is now hiking rates once per quarter whereas most other major central banks are still sitting on their hands. How high can U.S. rates go? The answer is a lot higher than investors anticipate. Market participants currently expect the Fed funds rate to rise to 2.37% by the end of this year and 2.84% by the end of 2019. No rate hikes are priced in for 2020 and beyond. The Fed dots are somewhat higher than market expectations (Chart 1). The median dot rises to about 3.4% in 2020-21, but then falls back to 3% over the Fed's longer-run horizon. Both investors and the Fed have apparently bought into Larry Summers' secular stagnation thesis. They seem convinced that rates will not be able to rise above 3% without triggering a recession. While we have a lot of sympathy for Summers' thesis, it must be acknowledged that it is a theory about the long-term determinants of the neutral rate of interest. Over a shorter-term cyclical horizon, many factors can influence the neutral rate. Critically, as discussed last week, most of these factors are pushing it higher: Fiscal policy is extremely stimulative. The IMF estimates that the U.S. cyclically-adjusted budget deficit will reach 6.8% of GDP in 2019. In contrast, the euro area is projected to run a deficit of only 0.8% of GDP (Chart 2). The relatively more expansionary nature of U.S. fiscal policy is one key reason why the Fed can raise rates while the ECB cannot. Chart 1Markets Expect No Fed ##br##Hikes Beyond Next Year
2018 Q4 Strategy Outlook: Desynchronization Is Back
2018 Q4 Strategy Outlook: Desynchronization Is Back
Chart 2Fiscal Policy Is More Expansionary ##br##In The U.S. Than In The Euro Area
Fiscal Policy Is More Expansionary In The U.S. Than In The Euro Area
Fiscal Policy Is More Expansionary In The U.S. Than In The Euro Area
Credit growth has picked up. After a prolonged deleveraging cycle, private-sector nonfinancial debt is increasing faster than GDP (Chart 3). The recent easing in The Conference Board's Leading Credit Index suggests that this trend will continue (Chart 4). Chart 3U.S. Private-Sector Nonfinancial Debt Is Rising At Close To Its Historic Trend
U.S. Private-Sector Nonfinancial Debt Is Rising At Close To Its Historic Trend
U.S. Private-Sector Nonfinancial Debt Is Rising At Close To Its Historic Trend
Chart 4U.S. Credit Growth Will Remain Strong
U.S. Credit Growth Will Remain Strong
U.S. Credit Growth Will Remain Strong
Wage growth is accelerating. Average hourly earnings surprised on the upside in August, with the year-over-year change rising to a cycle high of 2.9%. This followed a stronger reading in the Employment Cost Index in the second quarter. A simple correlation with the quits rate suggests that there is plenty of upside for wage growth (Chart 5). Faster wage growth will put more money into workers' pockets who will then spend it. The savings rate has scope to fall. The personal savings rate currently stands at 6.7%, more than two percentage points higher than what one would expect based on the current level of household net worth (Chart 6). If the savings rate were to fall by two points over the next two years, it would add 1.5% of GDP to aggregate demand. Chart 5The Quits Rate Is Signaling Upside For Wage Growth
The Quits Rate Is Signaling Upside For Wage Growth
The Quits Rate Is Signaling Upside For Wage Growth
Chart 6The Personal Savings Rate Has Room To Fall
2018 Q4 Strategy Outlook: Desynchronization Is Back
2018 Q4 Strategy Outlook: Desynchronization Is Back
A back-of-the-envelope calculation suggests that these cyclical factors will permit the Fed to raise rates to 5% by 2020, almost double what the market is discounting.1 An Absence Of Major Financial Imbalances Will Allow The Fed To Keep Raising Rates The past three recessions were all caused by financial market overheating rather than economic overheating. The 1991 recession was mainly the consequence of the Savings and Loan crisis, compounded by the spike in oil prices leading up to the Gulf War. The 2001 recession stemmed from the dotcom bust. The Great Recession was triggered by the housing bust. Today, it is difficult to point to any clear imbalances in the economy. True, housing activity has been weak for much of the year. However, unlike in 2006, the home vacancy rate stands near record-low levels (Chart 7). Tight supply will limit downside risks to both construction and home prices. On the demand side, low unemployment, high consumer confidence, and a rebound in the rate of new household formation should help the sector. Despite elevated home prices in some markets, the average monthly payment that homeowners must make to service their mortgage is quite low by historic standards (Chart 8). The quality of mortgage lending has also been very high over the past decade, which reduces the risk of a sudden credit crunch (Chart 9). Chart 7Low Housing Inventories Will Support Home Prices And Construction
Low Housing Inventories Will Support Home Prices And Construction
Low Housing Inventories Will Support Home Prices And Construction
Chart 8Housing Affordabiity Is Not Yet Stretched
Housing Affordabiity Is Not Yet Stretched
Housing Affordabiity Is Not Yet Stretched
Chart 9Mortgage Lenders Are Being Prudent
Mortgage Lenders Are Being Prudent
Mortgage Lenders Are Being Prudent
Unlike housing debt, there are more reasons to be concerned about corporate debt. The ratio of corporate debt-to-GDP has risen to record-high levels. So-called "covenant-lite" loans now make up the bulk of corporate leveraged loan issuance. While there is no doubt that the corporate debt market is the weakest link in the U.S. financial sector, some perspective is in order. U.S. corporate debt levels are quite low by global standards. Corporate debt in the euro area is more than 30 points higher as a percent of GDP than in the United States (Chart 10). Moreover, the interest coverage ratio - EBIT divided by interest expense - for U.S. corporates is still above its historic average (Chart 11). While this ratio will fall as interest rates rise, this will not happen very quickly. Most U.S. corporate debt is at fixed rates and average maturities have been rising. This reduces both rollover risk and the sensitivity of debt-servicing costs to higher short-term rates. An increasing share of U.S. corporate debt is held by non-leveraged investors. Bank loans account for only 18% of nonfinancial corporate sector debt, down from 40% in 1980 (Chart 12). This is important, because what makes a spike in corporate defaults so damaging is not the direct impact this has on the economy, but the second-round effects rising defaults have on financial sector stability. Chart 10U.S. Corporate Debt Not That High By Global Standards
U.S. Corporate Debt Not That High By Global Standards
U.S. Corporate Debt Not That High By Global Standards
Chart 11Interest Coverage Ratio Is Above Its Historic Average
Interest Coverage Ratio Is Above Its Historic Average
Interest Coverage Ratio Is Above Its Historic Average
Chart 12Banks Have Been Reducing Their Exposure To The Corporate Sector
Banks Have Been Reducing Their Exposure To The Corporate Sector
Banks Have Been Reducing Their Exposure To The Corporate Sector
In any case, we already had a dress rehearsal for what a corporate debt scare might look like. Credit spreads spiked in 2015. Default rates rose, but the knock-on effects to the financial system were minimal. This suggests that corporate America could handle a fair bit of monetary tightening without buckling under the pressure. The Fed And The Dollar If the Fed is able to raise rates substantially more than the market is discounting while most central banks cannot, the short-term interest rate spread between the U.S. and its trading partners is likely to widen. History suggests that this will produce a stronger dollar (Chart 13). Chart 13Historically, The Dollar Has Moved In Line With Interest Rate Differentials
Historically, The Dollar Has Moved In Line With Interest Rate Differentials
Historically, The Dollar Has Moved In Line With Interest Rate Differentials
Some have speculated that the Trump administration will intervene in the foreign-exchange market in order to drive down the value of the greenback. We doubt this will happen, but even if such interventions were to occur, they would not be successful. Presumably, currency interventions would take the form of purchases of foreign exchange, financed through the issuance of Treasurys. The purchase of foreign currency would release U.S. dollars into the financial system, but the sale of Treasury securities would suck those dollars back out of the system. The net result would be no change in the volume of U.S. dollars in circulation - what economists call a "sterilized" intervention. Both economic theory and years of history show that sterilized interventions do not have lasting effects on currency values. The Fed could, of course, provide funding for the Treasury's purchases of foreign exchange, leading to an increase in the monetary base. This would be tantamount to an unsterilized intervention. However, such a deliberate attempt to weaken the dollar by expanding the money supply would fly in the face of the Fed's efforts to cool growth by tightening financial conditions. We highly doubt the Fed's current leadership would go along with this. Emerging Markets In The Crosshairs The combination of rising U.S. rates and a stronger dollar is bad news for emerging markets. Eighty percent of EM foreign-currency debt is denominated in dollars. Outside of China, EM dollar debt is now back to late-1990s levels, both as a share of GDP and exports (Chart 14). The wave of EM local-currency debt issued in recent years only complicates matters. If EM central banks raise rates to defend their currencies, this could imperil economic growth and make it difficult for local-currency borrowers to pay back their loans. Rather than hiking rates, some EM central banks may simply choose to inflate away debt. Consider the case of Brazil. The fiscal deficit stands at nearly 8% of GDP and government debt has soared from 60% of GDP in 2013 to 84% of GDP at present (Chart 15). Ninety percent of Brazilian sovereign debt is denominated in reais. The Brazilian government won't default on its debt per se. However, if push comes to shove, Brazil's central bank can always step in to buy government bonds, effectively monetizing the fiscal deficit. This could cause the real to weaken much more than it already has. Chart 14EM Dollar Debt Is High
EM Dollar Debt Is High
EM Dollar Debt Is High
Chart 15Brazil's Perilous Fiscal Position
Brazil's Perilous Fiscal Position
Brazil's Perilous Fiscal Position
Chinese Stimulus To The Rescue? When emerging markets last succumbed to pressure in 2015, China saved the day by stepping in with massive stimulus. Fiscal spending and credit growth accelerated to over 15% year-over-year. The government's actions boosted demand for all sorts of industrial commodities. The stimulus measures in 2015 followed an even greater wave of stimulus in 2009. While these stimulus measures invigorated China's economy and helped put a floor under global growth, they came at a price: China's debt-to-GDP ratio has swollen from 140% in 2008 to over 250% at present, which has endangered financial stability (Chart 16). Excess capacity has also increased. This can be seen in the dramatic rise in the capital-to-output ratio. It can also be seen in the fact that the rate of return on assets within the Chinese state-owned enterprise sector, which has been the main source of rising corporate leverage, has fallen below borrowing costs (Chart 17). Chart 16China: Debt And Capital Accumulation Went Hand In Hand
China: Debt And Capital Accumulation Went Hand In Hand
China: Debt And Capital Accumulation Went Hand In Hand
Chart 17China: Rate Of Return On Assets Below Borrowing Costs For SOEs
China: Rate Of Return On Assets Below Borrowing Costs For SOEs
China: Rate Of Return On Assets Below Borrowing Costs For SOEs
Chinese banks are being told that they must lend more money to support the economy, while ensuring that their loans do not turn sour. Unfortunately, that is becoming an impossible feat. The Chinese economy produces too much and spends too little. The result is excess savings, epitomized most clearly in a national savings rate of 46% (Chart 18). As a matter of arithmetic, national savings must be transformed either into domestic investment or exported abroad via a current account surplus. Now that the former strategy has run into diminishing returns, the Chinese authorities will need to concentrate on the latter. This will require a larger current account surplus which, in turn, will necessitate a relatively cheap currency. Above-average productivity growth has pushed up the fair value of China's real exchange rate over time. However, the currency still looks expensive relative to its long-term trend line (Chart 19). Pushing down the value of the yuan against the dollar will not be that difficult. Chart 20 shows that USD/CNY has moved broadly in line with the one-year swap spread between the U.S. and China. The spread was about 3% earlier this year. Today, it stands at only 0.6%. As the Fed continues to raise rates, the spread will narrow further, taking the yuan down with it. Chart 18China Saves A Lot
China Saves A Lot
China Saves A Lot
Chart 19The RMB Is Still Quite Strong
The RMB Is Still Quite Strong
The RMB Is Still Quite Strong
Chart 20USD/CNY Has Tracked China-U.S. Interest Rate Differentials
USD/CNY Has Tracked China-U.S. Interest Rate Differentials
USD/CNY Has Tracked China-U.S. Interest Rate Differentials
Unlike standard Chinese fiscal/credit easing, a stimulus strategy focused on weakening the yuan would hurt other emerging markets by undermining their competitiveness in relation to China. A weaker yuan would also make it more expensive for Chinese companies to import natural resources, thus putting downward pressure on commodity prices. The Euro Area: Back In The Slow Lane After putting in a strong performance in 2017, the economy in the euro area has struggled to maintain momentum this year. Growth is still above trend, but the overall tone of the data has been lackluster at best, with the risks to growth increasingly tilted to the downside. Weaker growth in China and other emerging markets certainly has not helped. However, much of the problem lies closer to home. Bank credit remains the lifeblood of the euro area economy. The 12-month credit impulse - defined as the change in credit growth from one 12-month period to the next - tends to track GDP growth (Chart 21).2 Euro area credit growth accelerated over the course of 2017, but has been broadly stable this year. As a result, the credit impulse has fallen, taking GDP growth down with it. It will be difficult for euro area GDP growth to increase unless credit growth starts rising again. So far, there is little sign that this is about to happen. According to the latest euro area bank lending survey, while banks continue to ease standards for business loans, they are doing so at a slower pace than in the past. A net 3% of banks eased lending standards in the second quarter, compared to 8% in the first quarter. Loan demand growth has been fairly stable. This suggests that loan growth will remain positive, but is unlikely to increase much from current levels. Worries about the health of European banks will further constrain credit growth. European banks in general, and Spanish banks in particular, have significant exposure to the most vulnerable emerging markets (Chart 22). Chart 21Euro Area Credit Growth Has Flatlined
Euro Area Credit Growth Has Flatlined
Euro Area Credit Growth Has Flatlined
Chart 22Spain Most Exposed To Vulnerable EMs
2018 Q4 Strategy Outlook: Desynchronization Is Back
2018 Q4 Strategy Outlook: Desynchronization Is Back
Concerns about the ability of the Italian government to service its debt obligations will also restrain bank lending. Investors breathed a sigh of relief last month when the Italian government signaled a greater willingness to pare back next year's proposed budget deficit, in accordance with the dictates of the European Commission. Tensions remain, however, as evidenced by the fact that the ten-year spread between BTPs and German bunds is still 120 basis points higher than in April (Chart 23). The European political establishment is terrified of the rise in populism across the region and would love nothing more than to see Italy's populist parties implode. This means that any help from the ECB and the European Commission will only arrive once a full-fledged crisis is underway. Anyway, it is far from clear that a smaller budget deficit would actually translate into a lower government debt-to-GDP ratio. Like China, Italy also has a private sector that saves too much and spends too little. A shrinking population has reduced the need for firms to invest in new capacity. The prior government's pension cuts have also incentivized people to save more for their retirement. The result is a private sector savings-investment surplus that stood at 5% of GDP in 2017 compared to close to breakeven a decade ago (Chart 24). Chart 23Italian/Bund Spreads Signal Lingering Fiscal Strain
Italian/Bund Spreads Signal Lingering Fiscal Strain
Italian/Bund Spreads Signal Lingering Fiscal Strain
Chart 24Italy: Private Sector Saves Too Much And Spends Too Little
Italy: Private Sector Saves Too Much And Spends Too Little
Italy: Private Sector Saves Too Much And Spends Too Little
Unlike Germany, Italy cannot export its excess production because it does not have a hypercompetitive economy. Nor does it have the ability to devalue its currency to gain a quick competitiveness boost. This means that the Italian government has to absorb excess private-sector savings with its own dissavings - a fancy way of saying that it has to run a large budget deficit. This has effectively been Japan's strategy for over two decades. However, unlike Japan, Italy does not have a lender of last resort that can unconditionally buy government debt. This raises the risk that Italy's debt woes will resurface, either because the government abandons austerity measures, or because the lack of fiscal support causes nominal GDP to stagnate, making it all but impossible for the country to outgrow its debt burden. Receding Policy Puts The discussion above suggests that many of the "policy puts" that investors have relied on are in the process of having their strike price marked down to deeper out-of-the-money levels. Yes, the Fed will ease off on rate hikes if U.S. growth is at risk of stalling out completely. However, now that the labor market has reached full employment, the Fed will welcome modestly slower growth. Remember that there has never been a case in the post-war era where the three-month average of the unemployment rate has risen by more than a third of a percentage point without a recession taking place (Chart 25). The further the unemployment rate falls below NAIRU, the more difficult it will be for the Fed to achieve the proverbial soft landing. Chart 25Even A Small Uptick In The Unemployment Rate Is Bad News For The Business Cycle
Even A Small Uptick In The Unemployment Rate Is Bad News For The Business Cycle
Even A Small Uptick In The Unemployment Rate Is Bad News For The Business Cycle
Likewise, the "China stimulus put" - the presumption that most investors have that the Chinese authorities will launch a barrage of fiscal and credit easing at the first sign of slower growth - has become less reliable in light of the government's competing objectives namely reducing debt growth and excess capacity. The same goes for the "ECB put." Yes, the ECB will bail out Italy if the entire European project appears at risk. But spreads may need to blow out before the cavalry arrives. Meanwhile, just as the aforementioned policy puts are receding, new policy risks are rising to the fore, chief among them protectionism. We expect the trade war to heat up, with the Trump administration increasingly directing its ire at China. Trump's macroeconomic policies are completely at odds with his trade agenda. Fiscal stimulus will boost aggregate demand, which will suck in more imports. An overheated economy will prompt the Fed to raise rates more aggressively than it otherwise would, leading to a stronger dollar. All this will result in a wider trade deficit. What will Trump tell voters two years from now when he is campaigning in Michigan and Ohio about why the trade deficit has widened rather than narrowed under his watch? Will he blame himself or Beijing? No trophy for getting that answer right. II. Financial Markets Global Equities The combination of slower global growth, rising economic vulnerabilities outside the U.S., and a more challenging policy environment caused us to downgrade our view on global equities from overweight to neutral in June,3 while reiterating our preference for developed market equities relative to EM stocks. For now, we are comfortable with our bearish view towards emerging market stocks. While EM equities have cheapened, they are not yet at washed out levels (Chart 26). Bottom fishers still abound, as evidenced by the fact that the number of shares outstanding in the MSCI iShares Turkish ETF has almost tripled since early April (Chart 27). Chart 26EM Assets: Valuations Not Yet At Washed Out Levels
EM Assets: Valuations Not Yet At Washed Out Levels
EM Assets: Valuations Not Yet At Washed Out Levels
Chart 27EM Bottom Fishers Still Abound
EM Bottom Fishers Still Abound
EM Bottom Fishers Still Abound
At some point - probably in the first half of next year - investors will liquidate their remaining bullish EM bets. At that point, EM stocks will rebound. European and Japanese equities should also start to outperform the U.S., given their more cyclical nature. As far as the absolute direction of the S&P 500 is concerned, the next few months could be challenging. U.S. stocks have been able to decouple from those in the rest of the world, but this state of affairs may not last. Recall that the S&P 500 fell by 22% peak-to-trough between July 20 and October 8, 1998, in what otherwise was a massive bull market. We do not know if there is another Long-Term Capital Management lurking around the corner, but if there is, a temporary selloff in U.S. stocks may be hard to avoid. Such a selloff would present a buying opportunity over a horizon of 12-to-18 months. If we are correct that cyclical forces have lifted the neutral rate of interest, it will take a while for monetary policy to reach restrictive territory. This means that both fiscal and monetary policy will stay accommodative at least for the next 18 months. As such, the S&P 500 may not peak until 2020. Appendix A - Chart I presents a stylized diagram of where we think global equities are going. It incapsulates three phases: 1) a challenging period over the next six months, driven by EM weakness; 2) a blow-off rally in equities starting in the middle of next year; 3) and finally, a recession-induced bear market beginning in late-2020. Appendix B also presents our valuation charts, which highlight that long-term return prospects are better outside the United States. Fixed Income After advocating for a long duration strategy for much of the post-crisis recovery, BCA declared "The End Of The 35-Year Bond Bull Market" on July 5, 2016, the very same day that the 10-year U.S. Treasury yield hit a record closing low of 1.37%. Cyclically and structurally, we continue to expect U.S. bond yields to rise more than the market is discounting. As noted above, the Fed is underestimating how high rates will need to go before they reach restrictive territory. This means that the Fed will end up behind the curve in normalizing monetary policy, causing the economy to overheat and inflation to rise above the Fed's comfort zone. Chart 28Bond Sentiment Is Extremely Bearish
Bond Sentiment Is Extremely Bearish
Bond Sentiment Is Extremely Bearish
Granted, the Fed is willing to tolerate a modest inflation overshoot. However, a core PCE reading above 2.3%, which is at the top end of the range of the Fed's own forecast, would prompt the Fed to expedite the pace of rate hikes. A bear flattening of the yield curve - a situation where long-term yields rise, but short-term rates go up even more - would be highly likely in that environment. Over a shorter-term horizon spanning the next six months, the outlook for yields is more benign. The combination of a stronger dollar, slower global growth, and flight-to-quality flows into the Treasury market from vulnerable emerging markets can cap yields. Add to this the fact that sentiment towards bonds is currently extremely bearish (Chart 28), and a temporary countertrend decline in yields becomes quite probable. Developed market bond yields in general are likely to follow the direction of U.S. yields, both on the upside and the downside, but in a more muted manner. Outside the periphery, euro area yields have less scope to fall in the near term given that they are already so low. European yields also have less room to rise once global growth bottoms next year because the neutral rate of interest is much lower in the euro area than in the United States. Ironically, a more dovish ECB would help reduce Italian bond yields, as higher inflation is critical for increasing Italian nominal GDP. Since labor market slack is still elevated in Italy, continued monetary stimulus would also lift wages in core Europe more than in Italy, helping to boost Italy's competitiveness relative to the rest of the euro area. Japanese yields have plenty of scope to rise over the long haul. An aging population is pushing more people into retirement, which will cause the national savings rate to fall further. A decline in the savings pool will increase the neutral rate of interest in Japan. Instead of raising the policy rate, the Japanese authorities will let the economy overheat, generating inflation in the process. This will cause the yield curve to steepen, particularly at the very long end (e.g., beyond 10 years) which is the part of the yield curve that is the least susceptible to the BoJ's yield curve control regime. We are positioned for this outcome through our short 20-year JGB/long 5-year JGB trade recommendation. Appendix A - Chart II shows our expectations for the major government bond markets over the coming years. Turning to credit markets, high-yield credit typically underperforms in the latter innings of business-cycle expansions, a period when the Fed is raising rates. Thus, while we do not think that U.S. corporate debt levels will be a major source of systemic financial risk for the broader economy, this is hardly a reason to be overweight spread-product. A more cautious stance towards credit outside the U.S. is also warranted. Currencies And Commodities The dollar is working off overbought conditions, but will rebound into year-end, as EM tensions intensify and hopes of a massive credit/fiscal-fueled Chinese stimulus package fizzle. EM currencies will weaken the most against the dollar over the next three-to-six months, but the euro and, to a lesser extent, the yen, will also come under pressure. Granted, the dollar is no longer a cheap currency, but if long-term interest rate differentials stay anywhere close to current levels, the greenback will remain well supported. Consider the dollar's value against the euro. Thirty-year U.S. Treasurys currently yield 3.20% while 30-year German bunds yield 1.12%, a difference of 208 basis points. Even if one allows for the fact that investors expect euro area inflation to be lower than in the U.S. over the next 30 years, EUR/USD would need to trade at a measly 82 cents today in order to compensate German bund holders for the inferior yield they will receive.4 We do not expect EUR/USD to get down to that level, but a descent into the $1.10-to-$1.12 range over the next six months is probable. Sterling will remain hostage to Brexit negotiations. It is impossible to know how talks will evolve, but our bias is to take a somewhat pound-positive view. The main reason is that support for Brexit has faded (Chart 29). Opinion polls suggest that if a referendum were held again, the "bremain" side would almost certainly prevail. Lacking public support for leaving the EU, it is unlikely that British negotiators could simply walk away from the table. This reduces the odds of a "hard Brexit" outcome. Indeed, a second referendum that leads to a "no-Brexit" verdict remains a distinct possibility. The combination of slower global growth and a resurgent dollar is likely to hurt commodity prices. Industrial metals are more vulnerable than oil. China consumes around half of all the copper, nickel, aluminum, zinc, and iron ore produced around the world (Chart 30). In contrast, China represents less than 15% of global oil demand. Chart 29When Bremorse Sets In
When Bremorse Sets In
When Bremorse Sets In
Chart 30China Is A More Dominant Consumer Of Metals Than Oil
China Is A More Dominant Consumer Of Metals Than Oil
China Is A More Dominant Consumer Of Metals Than Oil
The supply backdrop for oil is also more favorable than for metals. Not only are Saudi Arabia and Russia maintaining production discipline, but U.S. sanctions against Iran threaten to weigh on global crude supply. Further reduction in Venezuela's oil output, as well as potential disruptions to Libyan or Iraqi exports, could also boost oil prices. The superior outlook for oil over metals means we prefer the Canadian dollar relative to the Aussie dollar. While AUD/CAD has weakened in recent months, the Aussie dollar is still somewhat expensive against the loonie based on our long-term valuation model (Chart 31). We also see an increasing chance that Canada will negotiate a revamped trade deal with the U.S., as Trump focuses his attention more on China. Should this happen, it will remove the NAFTA break-up risk discount embedded in the Canadian dollar. Finally, a few words on precious metals. Precious metals typically struggle during periods when the dollar is appreciating (Chart 32). Consequently, we would not be eager buyers of gold or other precious metals until the dollar peaks, most likely around the middle of next year. As inflation starts to accelerate in late-2019 and in 2020, gold will finally move decisively higher. Chart 31Canadian Dollar Still Somewhat Cheap Versus The Aussie Dollar
Canadian Dollar Still Somewhat Cheap Versus The Aussie Dollar
Canadian Dollar Still Somewhat Cheap Versus The Aussie Dollar
Chart 32Gold Won't Shine Until The Dollar Peaks
Gold Won't Shine Until The Dollar Peaks
Gold Won't Shine Until The Dollar Peaks
Appendix A - Chart III and Chart IV present an illustration of where the major currencies and commodities are heading. Peter Berezin, Chief Global Strategist Global Investment Strategy peterb@bcaresearch.com 1 Depending on which specification of the Taylor rule one uses, a one percent of GDP increase in aggregate demand will increase the neutral rate of interest by half a point (John Taylor's original specification) or by a full point (Janet Yellen's preferred specification). Fiscal policy is currently about 3% of GDP too stimulative compared to a baseline where government debt-to-GDP is stable over time. Assuming a fiscal multiplier of 0.5, fiscal policy is thus boosting aggregate demand by 1.5% of GDP. Nonfinancial private credit has increased by an average of 1.5 percentage points of GDP per year since 2016. Assuming that every additional one dollar of credit increases aggregate demand by 50 cents, the revival in credit growth is raising aggregate demand by 0.75% of GDP, compared to a baseline where credit-to-GDP is flat. The labor share of income has increased by 1.25% of GDP from its lows in 2015. Assuming that every one dollar shift in income from capital to labor boosts overall spending on net by 20 cents, this would have raised aggregate demand by 0.25% of GDP. Lastly, if the personal savings rate falls by two points over the next two years, this would raise aggregate demand by 1.5% of GDP. Taken together, these factors are boosting the neutral rate by anywhere from 2% (Taylor's specification) to 4% (Yellen's specification). This is obviously a lot, and easily overwhelms other factors such as a stronger dollar that may be weighing on the neutral rate. 2 Recall that GDP is a flow variable (how much production takes place every period), whereas credit is a stock variable (how much debt there is outstanding). By definition, a flow is a change in a stock. Thus, credit growth affects GDP and the change in credit growth affects GDP growth. Euro area private-sector credit growth accelerated from -2.6% in May 2014 to 3.1% in March 2017, but has been broadly flat ever since. Hence, the credit impulse has dropped. 3 Please see Global Investment Strategy Special Report, "Three Policy Puts Go Kaput: Downgrade Global Equities To Neutral," dated June 20, 2018. 4 For this calculation, we assume that the fair value for EUR/USD is 1.32, which is close to the IMF's Purchasing Power Parity (PPP) estimate. The annual inflation differential of 0.47% is based on 30-year CPI swaps. This implies that the fair value for EUR/USD will rise to 1.52 after 30 years. If one assumes that the euro reaches that level by then, the common currency would need to trade at 1.52/(1.0208)^30=0.82 today. Appendix A Appendix A Chart IMarket Outlook: Equities
2018 Q4 Strategy Outlook: Desynchronization Is Back
2018 Q4 Strategy Outlook: Desynchronization Is Back
Appendix A Chart IIMarket Outlook: Bonds
2018 Q4 Strategy Outlook: Desynchronization Is Back
2018 Q4 Strategy Outlook: Desynchronization Is Back
Appendix A Chart IIIMarket Outlook: Currencies
2018 Q4 Strategy Outlook: Desynchronization Is Back
2018 Q4 Strategy Outlook: Desynchronization Is Back
Appendix A Chart IVMarket Outlook: Commodities
2018 Q4 Strategy Outlook: Desynchronization Is Back
2018 Q4 Strategy Outlook: Desynchronization Is Back
Appendix B Appendix B Chart 1Long-Term Return Prospects Are Slightly Better Outside The U.S.
2018 Q4 Strategy Outlook: Desynchronization Is Back
2018 Q4 Strategy Outlook: Desynchronization Is Back
Appendix B Chart 1Long-Term Return Prospects Are Slightly Better Outside The U.S.
2018 Q4 Strategy Outlook: Desynchronization Is Back
2018 Q4 Strategy Outlook: Desynchronization Is Back
Appendix B Chart 1Long-Term Return Prospects Are Slightly Better Outside The U.S.
2018 Q4 Strategy Outlook: Desynchronization Is Back
2018 Q4 Strategy Outlook: Desynchronization Is Back
Appendix B Chart 1Long-Term Return Prospects Are Slightly Better Outside The U.S.
2018 Q4 Strategy Outlook: Desynchronization Is Back
2018 Q4 Strategy Outlook: Desynchronization Is Back
Strategy & Market Trends Tactical Trades Strategic Recommendations Closed Trades
Highlights The risk of unplanned oil-production outages is rising. One or more such events will severely test OPEC 2.0's spare capacity in a supply-constrained market (Chart of the Week).1 As things now stand, OPEC 2.0 spare capacity - if it is available - and a likely U.S. SPR release of 500k b/d in 1Q19 will not cover expected production losses, if markets are hit with another unplanned outage from Libya or Iraq.2 Demand destruction via higher prices will have to balance markets. Oil markets are tightening (Chart 2). Falling supply and stable demand will produce a 1mm b/d physical deficit into 1H19, forcing continued OECD inventory draws (Chart 3). The dominant scenario in our forecast includes a supply shock arising from lost Iranian and Venezuelan exports, which triggers price-induced demand destruction. We raised the odds of Brent prices hitting $100/bbl by 1Q19, and our 2019 forecast to $95/bbl on the back of these factors. Unplanned outages would lift prices higher. Energy: Overweight. The long April, May and June 2019 Brent calls struck at $85/bbl vs short $90/bbl calls we recommended last week are up an average 33.8%, as of Tuesday's close. Base Metals: Neutral. Our foreign-exchange strategists expect the USD to correct further. This will be bullish for copper, which is up ~ 10% since Sept. 11. Precious Metals: Neutral. The USD correction will support gold in the short term. Technically, gold appears to be forming a pennant, which could be short-term bullish. Ags/Softs: Underweight. Corn prices are benefiting from strong exports, according to USDA data. Accumulated exports for the current crop year are up 27% vs last year in the week ending Sept. 13. Chart of the WeekUnplanned Oil-Production Outage Risks Up, OPEC 2.0's Spare Capacity Down
Risks From Unplanned Oil-Outage Rising; OPEC 2.0's Spare Capacity Is Suspect
Risks From Unplanned Oil-Outage Rising; OPEC 2.0's Spare Capacity Is Suspect
Chart 2Physical Oil Deficit Returns##BR##To Oil Market Next Year
Physical Oil Deficit Returns To Oil Market Next Year
Physical Oil Deficit Returns To Oil Market Next Year
Chart 3Fundamentals Support##BR##Strong Prices
Risks From Unplanned Oil-Outage Rising; OPEC 2.0's Spare Capacity Is Suspect
Risks From Unplanned Oil-Outage Rising; OPEC 2.0's Spare Capacity Is Suspect
Feature Oil markets are approaching a moment of truth. OPEC 2.0's spare capacity likely will be put to the test in 1Q19, as Iranian export volumes continue to fall, and other threats to production - Venezuelan losses, and increasing sectarian tension in Iraq and Libya - come to the fore. As the Chart of the Week demonstrates, spare capacity in the traditional OPEC states is low and falling: The U.S. EIA's most recent estimate of OPEC spare capacity is 1.7mm b/d this year and 1.3mm next year, well below the 2.3mm b/d average of 2008 - 2017. For its part, Russia - the other putative leader of OPEC 2.0 - likely only has ~ 200k b/d of spare capacity to ramp. On a relative basis, OPEC spare capacity is even more stretched: This year, the EIA expects it to average 1.7% of global demand. By next year, it is expected to fall to 1.3%, or ~ 1.3mm b/d. This will be lower than the spare capacity reported for 2008 (1.6%), when OPEC (mostly KSA) found itself struggling to meet surging EM demand, and well below the 2.6% average for 2008 - 2017. Spare capacity is very close to levels last seen in 2016, when low prices resulted in supply destruction. In the wake of the oil-price rout of 2014 - 16, capex collapsed as did maintenance spending needed to keep production steady y/y. This can be seen in the relentless decline in OPEC production ex GCC and the stagnation in other states unable to grow output (Chart 4 and Chart 5). Indeed, as prices hit their nadir in 1Q16, sovereign wealth funds (SWFs) in OPEC and non-OPEC states were being liquidated to cover gaping holes in producers' fiscal accounts. This partly explains the growing incidence of unplanned outages, and our contention OPEC spare-capacity claims are highly suspect (Chart of the Week). Chart 4OPEC 2.0's Core Producers Would Be Taxed to Replace Lost Exports
OPEC 2.0's Core Producers Would Be Taxed to Replace Lost Exports
OPEC 2.0's Core Producers Would Be Taxed to Replace Lost Exports
Chart 5Outside Of A Very Few Regions, Oil Production Has Struggled
Outside Of A Very Few Regions, Oil Production Has Struggled
Outside Of A Very Few Regions, Oil Production Has Struggled
U.S. Remains Adamant On Shutting Down Iran's Exports The Trump administration's goal is to reduce Iranian oil exports to zero via the sanctions it will impose beginning November 4 from ~ 2.5mm b/d back in April, when the U.S. sanctions were announced. However, as the EIA data indicates, achieving this goal would leave markets seriously short oil. Indeed, the Washington-based Center for International Strategic Studies (CSIS) noted in late August, "realistically, there is simply not enough readily available spare oil production capacity in the world to replace the loss of all Iranian barrels (some 2.4 mm b/d), coupled with the potential for further reductions in Venezuela, Libya, Nigeria, and elsewhere."3 Our modeling includes 1.25mm b/d of lost Iranian and Venezuelan exports, continued y/y losses in non-core OPEC (Chart 4), constrained U.S. production growth, and stagnate supply growth outside a handful of states able to lift their output (Chart 5). We do not believe OPEC 2.0 spare capacity is sufficient to cover these losses and one or two additional unplanned outages in Iraq or Libya, or anywhere for that matter. In addition, a 500k b/d release of U.S. SPR after the price goes above $90/bbl in 1Q19 will contain the supply shock we expect slightly, but will not completely reverse it. We have long believed KSA's ability to maintain production above 10.5mm b/d for an extended period is suspect, despite its claims it can ramp to its capacity of 12mm b/d.4 We are carrying KSA's current production at 10.4mm b/d in our balances estimates, roughly the level it self-reported to OPEC last month. To be clear, we are not saying KSA's production cannot be increased - perhaps to 10.7mm b/d - but we are dubious it can get to its claimed 12mm b/d capacity, or that it can sustain 10.7mm b/d indefinitely. It is important to note any short-term increase in OPEC 2.0's production will come out of spare capacity available to meet unplanned outages, or deeper-than-expected Venezuelan losses next year. Lastly, unplanned outages in a market already stretched by tighter supply will accelerate the rate of demand destruction via higher prices. This also would accelerate the arrival of a U.S. recession brought about by an oil-price shock, all else equal.5 Iran's Hand Is Strengthening You'd never know it from the declarations of President Trump and U.S. Treasury Secretary Steve Mnuchin - both of whom are adamant in their professed desire to see Iranian oil exports fall to zero - but the U.S. has been attempting to engage Iran in treaty discussions to limit the country's ballistic-missile capabilities and nuclear-development program.6 Not surprisingly, Iranian officials have shown no interest in such discussions. This is a remarkable turn of events, but not unexpected. At some point, it likely became apparent to the Trump administration the global oil markets are on a trajectory for significantly higher prices, as our analysis and forecasts indicate. It also likely is apparent to administration officials that oil prices - and gasoline prices, in particular, which matter most to U.S. voters - will be surging just as the 2020 presidential campaign gets underway next summer. Along with our colleague Marko Papic, who runs BCA's Geopolitical Strategy, we believe that, from a game-theoretic perspective, the approach from the U.S. actually strengthens Iran's hand. Given its history with the previous round of sanctions, and the economic hardships they imposed, the government in Iran likely believes it can ride out 12 to 18 months of renewed sanctions. It is not unrealistic to entertain the possibility Iranian politicians take the bet that sharply higher gasoline prices in the U.S. by 2H19 will give Democrats in U.S. presidential and congressional races - which kick off next summer - a powerful issue with which to campaign against President Trump and the GOP. Bottom Line: There is a non-trivial chance that OPEC 2.0 spare capacity will prove insufficient to cover the losses in Iranian and Venezuelan exports we foresee in the very near term. Should this prove to be the case, the odds that Brent crude oil prices exceed our $95/bbl forecast for next year are high. We believe Iran's political hand could be strengthened, if it rebuffs overtures by the Trump administration to negotiate a treaty to replace the executive agreement with former U.S. president Obama that limited its nuclear program. We recommended getting long Brent call spreads last week to position for the higher prices we are forecasting for next year. Specifically, we recommended getting long April, May and June 2019 Brent calls struck at $85/bbl vs short $90/bbl calls. As of Tuesday's close, these positions were up 33.8% on average vs their opening levels last Thursday. Robert P. Ryan, Senior Vice President Commodity & Energy Strategy rryan@bcaresearch.com Hugo Bélanger, Senior Analyst Commodity & Energy Strategy HugoB@bcaresearch.com 1 Please see "Upside Risks Dominate BCA's Oil Price Forecast," published by BCA Research's Commodity & Energy Strategy October 26, 2017, and "OPEC 2.0 Scrambles To Reassure Markets," published June 28, 2018. Both are available at ces.bcaresearch.com. 2 OPEC 2.0 is the name we coined for the oil-producer coalition led by the Kingdom of Saudi Arabia (KSA) and Russia, which was formed in November 2016, following the price collapse brought on by OPEC's market-share war launched in November 2014. Please see last week's Commodity & Energy Strategy lead article, "Odds Of Oil-Price Spike In 1H19 Rise; 2019 Brent Forecast Lifted $15 To $95/bbl." It is available at ces.bcaresearch.com. In that article we note that, in addition to the highly visible export losses in Iran due to U.S. sanctions and continued deterioration in Venezuelan production, the EIA reduced its estimate of U.S. production growth by 201k b/d in 2019, and the IEA reduced its estimate of Brazilian output this year by 260k b/d. 3 Please see "Whither the Oil Market? Headlines and Tariffs and Bears, Oh My..." published by csis.org August 29, 2018. We are closely following a just-proposed workaround to U.S. sanctions on Iranian oil exports made by the High Representative of the EU, Federica Mogherini, at the UN General Assembly meeting in New York on Tuesday. Ms. Mogherini proposed setting up a special-purpose vehicle that would allow importers in the EU, China and Russia to continue purchasing Iranian oil crude. The SPV would transact in euros, yuan, and roubles, so as to avoid processing transactions through the Society for Worldwide Interbank Financial Telecommunication SWIFT system in Brussels. The SWIFT system is dominated by USD transactions, and the U.S. Treasury has high visibility into transactions made using the system, given USD-denominated transaction like oil purchases and sales must ultimately be cleared through a U.S. bank or intermediary. Iran already takes yuan for its oil, and this mechanism would allow it to purchase goods and services denominated in these currencies. If technical details of the proposed system can be worked out, the SPV could facilitate increased Iranian exports under the U.S. sanctions regime. This would cause us to lower our estimate of lost exports from that country from our baseline assumption of 1.25mm b/d. Please see "Why India Will Struggle to Join Iran's Sanctions Busters," published by bloomberg.com on September 26, 2018. 4 We are not the only ones dubious of KSA's ability to ramp production. Please see "Can Saudi Arabia pump much more oil," published by reuters.com July 1, 2018. 5 In our House view, a recession in the U.S. does not arrive until 2H20. We have argued an oil-supply shock, particularly during a Fed tightening cycle, typically presages a recession in the 6 - 18 months following the shock. Please see Commodity & Energy Strategy lead article, "Odds of Oil-Price Spike In 1H19 Rise; 2019 Brent Forecast Lifted $15 To $95/bbl." It is available at ces.bcaresearch.com. 6 Please see "U.S. seeking to negotiate a treaty with Iran," published September 19, 2018, by reuters.com. Investment Views and Themes Recommendations Strategic Recommendations Tactical Trades Commodity Prices and Plays Reference Table
Risks From Unplanned Oil-Outage Rising; OPEC 2.0's Spare Capacity Is Suspect
Risks From Unplanned Oil-Outage Rising; OPEC 2.0's Spare Capacity Is Suspect
Trades Closed in 2018 Summary of Trades Closed in 2017
Risks From Unplanned Oil-Outage Rising; OPEC 2.0's Spare Capacity Is Suspect
Risks From Unplanned Oil-Outage Rising; OPEC 2.0's Spare Capacity Is Suspect
Since 2017, the factor model used by our commodity strategists to forecast oil prices shows that brent prices have been supported by two drivers that are simultaneously pushing price estimates higher: First, strong compliance of OPEC 2.0 members to the…
With the loss of Iranian exports occurring faster and sooner than expected, and Venezuela remaining on the brink of collapse, senior energy officials from the U.S., Russia, Saudi Arabia are going to great lengths to reassure their domestic consumers…
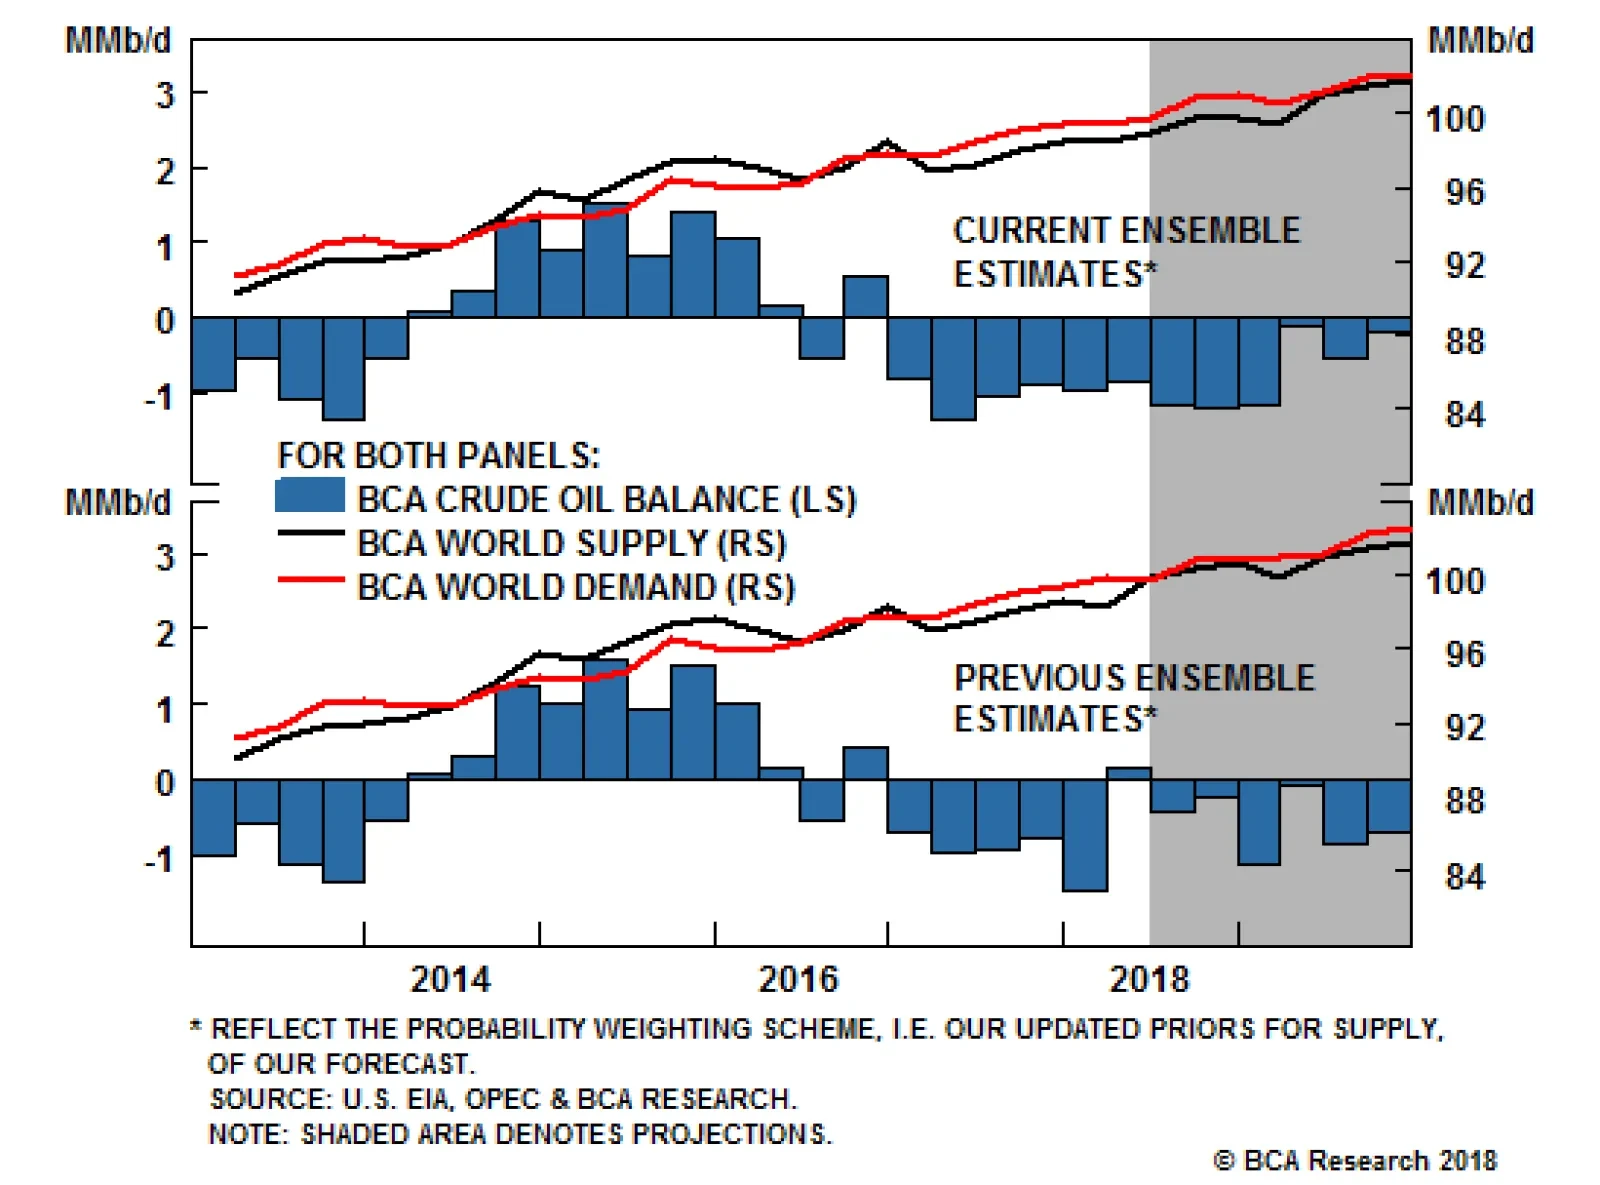
Highlights Recent estimates by ship trackers put the loss of Iranian exports at close to 1mm b/d as of mid-September vs April levels. This loss is higher (and sooner) than our previous baseline expectation, and prompts us to raise our estimate of lost Iranian oil exports to 1.25mm b/d by November, when U.S. sanctions kick in. Venezuela still is close to collapse, but may avoid a complete meltdown with Chinese companies stepping in to safeguard the $50 billion loaned to the country's oil industry.1 We expect production to fall below 1mm b/d next year - to less than half its end-2016 level. With Fed policy likely to continue tightening into 2019 as oil prices surge, the odds of an equity bear market and recession arriving in 2H19 - vs our 2H20 House view - also increase. Our dominant scenario now includes a supply shock and higher prices in 1Q19, which is followed by a U.S. SPR release and price-induced demand destruction (Chart of the Week). As a result, we are raising the odds of Brent prices reaching or exceeding $100/bbl by as early as 1Q19, and lifting our 2019 forecast to $95/bbl. Energy: Overweight. U.S. refining capacity utilization remains close to 19-year highs. At 97.1% of operable capacity, it is within a whisker of the four-week-moving-average highs of 97.3% recorded in August, driven by strong product demand ex U.S. Base Metals: Neutral. The U.S. Treasury granted permission to Rusal's existing customers to continue signing new contracts with the aluminum producer. The announcement stopped short of a full removal of sanctions, which are set to come into effect on October 23. Precious Metals: Neutral. The strong trade-weighted USD continues to hold gold prices on either side of $1,200/oz. We remain long as a portfolio hedge. Ags/Softs: Underweight. The USDA's Crop Production report forecasts record yields for corn and soybeans - 181.3 and 52.8 bushels/acre, respectively - which continues to weigh on prices. The bean harvest is expected to be a record. Feature Chart of the WeekBCA Ensemble Forecast Lifts Brent To $95/bbl, As Market Tightens
BCA Ensemble Forecast Lifts Brent To $95/bbl, As Market Tightens
BCA Ensemble Forecast Lifts Brent To $95/bbl, As Market Tightens
With the loss of Iranian exports occurring faster and sooner than expected, and Venezuela remaining on the brink of collapse, senior energy officials from the U.S., Russia and the Kingdom of Saudi Arabia (KSA) are going to great lengths to reassure their domestic consumers everything - particularly on the supply side - is under control. We are inclined to believe their comfort level re global oil supply is inversely proportional to the amount of reassurance they provide their domestic audiences. The more they meet and talk - particularly to the media - the more concerned they are. And right now, they're pretty concerned. Rick Perry, the U.S. Energy Secretary, held a presser in Moscow following his meeting with Alexander Novak, Russia's Energy Minister, saying the U.S., KSA and Russia can lift output over the next 18 months to compensate for the loss of exports from Iran, Venezuela, and other unplanned outages.2 That might be true, but the market's already tightening far faster and far sooner than many analysts expected. Covering a supply shortfall in 18 months does nothing for the market over the next few months, particularly with demand remaining robust (Chart 2) and OECD inventories falling (Chart 3). Since 2017, our factor model shows Brent prices have been supported by two factors acting simultaneously together: Chart 2Fundamentals Support Strong Prices
Odds Of Oil-Price Spike In 1H19 Rise; 2019 Brent Forecast Lifted $15 To $95/bbl
Odds Of Oil-Price Spike In 1H19 Rise; 2019 Brent Forecast Lifted $15 To $95/bbl
Chart 3Inventory Draws Will Accelerate
Inventory Draws Will Accelerate
Inventory Draws Will Accelerate
Strong compliance of OPEC 2.0 members to the coalition's production-cutting agreement, which reduced the OPEC Supply-and-Inventory factor's role, and The pickup in global oil demand, particularly in EM economies, which pushed our Global Demand factor up. These effects were partly counterbalanced by the rise in our non-OPEC Supply factor - driven by strong growth in U.S. shale-oil output - which became the largest negative contributor to price movements. Global demand's been strengthening since the end of 1H17 on the back of stellar EM income growth. This remains the fundamental backdrop to global oil for now. While our base case remains relatively supportive for oil prices, we are raising the odds of a price spike resulting from a supply shock as early as 1Q19 on the back of larger- and faster-than-expected Iranian export losses, and continued declines in Venezuelan production. Should this occur, we believe it would trigger a U.S. SPR release, and produce demand destruction at a rate that could be faster than historical experience would suggest (Table 1). This further tightens balances, and leads us to raise our 2019 forecast for Brent crude oil to $95/bbl on average, up from $80/bbl last month, with WTI trading $6/bbl below that (Chart 4). This forecast is highly conditional, given our assumptions re supply-side variables, a U.S. SPR release, and demand destruction estimates. Table 1BCA Global Oil Supply - Demand Balances (MMb/d) (Base Case Balances)
Odds Of Oil-Price Spike In 1H19 Rise; 2019 Brent Forecast Lifted $15 To $95/bbl
Odds Of Oil-Price Spike In 1H19 Rise; 2019 Brent Forecast Lifted $15 To $95/bbl
Chart 4BCA's Oil Balances Tighter
BCA's Oil Balances Tighter
BCA's Oil Balances Tighter
Oil Balances Tighten As Supply Contracts In our monthly balances update, we are incorporating a sharply accelerated loss of Iranian export barrels to the market, which already is evident. Bloomberg this week reported its tanker-tracking service registered a decline in Iranian exports of close to 1mm b/d between April, when sanctions were announced, and mid-September.3 At this rate, the assessment by Platts Analytics last week that as much as 1.4mm b/d of Iranian exports could be lost by the time U.S. sanctions kick in November 4 appears more likely.4 However, to be conservative, we are building in a loss of 1.25mm b/d in our balances, and have it developing over the July - November period in increments of 250k b/d, instead of the November - February interval we assumed in last month's balances. We will monitor this situation and revise our estimates as new information arrives. Also on the supply side, we are assuming the U.S. SPR releases 500k b/d starting a month after Brent prices go over $90/bbl in March 2019. This is in line with the SPR's enabling legislation, which limits drawdowns to 30mm b/d over a 60-day period, after the President authorizes such action to meet a severe energy supply interruption. Lastly, we continue to carry supply constraints arising from the lack of sufficient take-away capacity to get all of the crude produced in the Permian Basin to refining markets in our models. To wit: We continue to expect 1.2mm b/d of supply growth from the U.S. shales, driven largely by Permian production, vs an earlier expectation of 1.4mm b/d of growth. We expect the Permian to be de-bottlenecked by 4Q19. We expect the Big 3 producers Secretary Perry expects to fill supply gaps in 18 months - the U.S., Russia, and KSA - to produce 10.83mm, 11.4mm and 10.4mm b/d in 2H18, and 11.79mm, 11.43mm and 10.4mm b/d next year, respectively. They will get some help from OPEC's Gulf Arab producers - i.e., the core OPEC producers (Chart 5) - but, supply will continue to fall/stagnate in most of the rest of the world, particularly in offshore producers (Chart 6). Chart 5While Core OPEC Can Increase Supply...
While Core OPEC Can Increase Supply...
While Core OPEC Can Increase Supply...
Chart 6... 'The Other Guys' Output Stagnates
Odds Of Oil-Price Spike In 1H19 Rise; 2019 Brent Forecast Lifted $15 To $95/bbl
Odds Of Oil-Price Spike In 1H19 Rise; 2019 Brent Forecast Lifted $15 To $95/bbl
We also note the EIA and IEA have lowered their supply-growth estimates this month. The EIA this month reduced expected U.S. crude production growth by 210k b/d in 2019, and the IEA lowered its estimate of offshore production growth in Brazil from 260k b/d to just 30k b/d this year. These are non-trivial adjustments in a market that was tight prior to the downgrade in supply growth. Still, there are significant marginal disagreements on the supply side among the major data supporters (the EIA, IEA and OPEC), which can be seen in Table 2. Table 2Comparison Of Major Balances Estimates
Odds Of Oil-Price Spike In 1H19 Rise; 2019 Brent Forecast Lifted $15 To $95/bbl
Odds Of Oil-Price Spike In 1H19 Rise; 2019 Brent Forecast Lifted $15 To $95/bbl
Demand Destruction Likely As Prices Spike In 1Q19 We expect the rate of growth in EM incomes and trade - a proxy for income - to slow slightly this year vs 2017, on the back of a strengthening USD. This will reduce the rate of growth in EM imports and the rate of growth in EM commodity demand, at the margin. However, y/y growth in EM incomes is expected to remain positive over the next 12 months in our baseline scenario, which will keep the level of commodity demand - particularly for oil and industrial metals - robust. This will drive global demand growth of ~ 1.6mm b/d this year, roughly unchanged from last month. Higher prices risk slowing next year's growth. This is where it gets tricky. An oil-supply shock occurring when global demand is strong most likely will produce a price spike, as we've been arguing for the past several weeks.5 This price spike, coupled with continued monetary-policy tightening by the Fed, raises the likelihood of demand destruction globally. Higher oil prices and a stronger USD act as a double-whammy on EM oil demand. The problem we have now is gauging the elasticity of oil demand, particularly in EM. Oil markets are fundamentally different now than at any point in the modern era - roughly beginning in the early 1960s with the ascendance of OPEC - because many big oil-importing EM economies removed or relaxed subsidies following the prices collapse of 2014 - 2016. Prominent among these states are China and India. OPEC states also took advantage of the price collapse to relax or remove subsidies, e.g., KSA.6 The price shock we anticipate, therefore, will be the first in the modern era in which EM consumers - the principal driver of oil demand in the world, accounting for roughly 70% of the demand growth we expect - are exposed directly to higher prices. How quickly they will respond to higher prices is unknown. For this reason, we're introducing what we consider a reasonable first approximation of how EM demand might respond to higher prices and a stronger USD into the scenarios we include in our ensemble forecast (Chart 7). As a first approximation - subject to at least monthly adjustment, as more data become available - we are modeling a 100k b/d loss of demand for every $10/bbl increase in crude oil prices.7 We will continue to iterate on this as new information becomes available. Chart 7Ensemble Scenarios Reflect New Risks
Ensemble Scenarios Reflect New Risks
Ensemble Scenarios Reflect New Risks
Bottom Line: We've raised the odds of a supply shock in the oil markets that takes Brent prices to or through $100/bbl by 1Q19. Should this occur, we expect it will be met by a U.S. SPR release of 500k b/d a month after prices breach $90/bbl. This price spike will set off a round of demand destruction, which we expect will be quicker than history would suggest, given many large EM oil-consuming states have relaxed or eliminated fuel subsidies, leaving their consumers exposed to the price shock. This will be exacerbated by a stronger USD going forward, as the Fed likely looks through the price spike and continues with its policy-rate normalization. In this scenario, a U.S. recession could arrive in 2H19 vs our House view of 2H20 or later. In addition, we would expect an equity bear market to ensue sooner than presently anticipated. We recommend using Brent call spreads to express the view consistent with our research. At tonight's close, we will go long April, May and June 2019 calls struck at $85/bbl and short $90/bbl calls. Robert P. Ryan, Senior Vice President Commodity & Energy Strategy rryan@bcaresearch.com Hugo Bélanger, Senior Analyst Commodity & Energy Strategy HugoB@bcaresearch.com 1 Please see "Venezuela hands China more oil presence, but no mention of new funds," published by reuters.com September 14, 2018. 2 U.S. Energy Secretary Rick Perry made this claim at a press conference after meeting with Russian Energy Minister Alexander Novak last Friday. Please see "Big Three oil states can offset fall in Iran supplies: Perry," published by reuters.com September 14, 2018. 3 Please see "Saudi Arabia Is Comfortable With Brent Oil Above $80," published by bloomberg.com September 18, 2018. 4 Please see "OPEC crude oil production rises to 32.89 mil b/d in Aug as cuts unwind: Platts survey" published by SP Platts Global September 6, 2018. 5 Please see "Oil-Supply Shock, Rising U.S. Rates Favor Gold As A Portfolio Hedge," published by BCA Research's Commodity & Energy Strategy Weekly Report on September 13, 2018. It is available at ces.bcaresearch.com. For a discussion of the effect of a stronger USD on global oil demand, please see "Trade, Dollars, Oil & Metals ... Assessing Downside Risk," published by the Commodity & Energy Strategy August 23, 2018. 6 Please see the Special Focus in the World Bank's January 2018 Global Economic Prospects entitled "With The Benefit of Hindsight: The Impact of the 2014 - 16 Oil Price Collapse," beginning on p. 49. 7 In this simulation, we employ an iterative one-step-ahead forecasting methodology that reduces demand by 100k b/d for every $10/bbl increase in prices. Investment Views and Themes Recommendations Strategic Recommendations Tactical Trades Commodity Prices and Plays Reference Table
Odds Of Oil-Price Spike In 1H19 Rise; 2019 Brent Forecast Lifted $15 To $95/bbl
Odds Of Oil-Price Spike In 1H19 Rise; 2019 Brent Forecast Lifted $15 To $95/bbl
Trades Closed in 2017 Summary of Trades Closed in 2018
Odds Of Oil-Price Spike In 1H19 Rise; 2019 Brent Forecast Lifted $15 To $95/bbl
Odds Of Oil-Price Spike In 1H19 Rise; 2019 Brent Forecast Lifted $15 To $95/bbl
Highlights Oil markets and U.S. monetary policy are tightening coincidentally. This confluence of events in the past typically presages an equity correction and recession in the U.S. in the following 6 to 18 months (Chart of the Week). EM economies also could weaken as Fed policy collides with the oil-price spike we expect in the wake of a supply shock. In spite of continuing pressure from the Fed's policy-rate normalization policy, we continue to favor gold as a portfolio hedge (see below). Energy: Overweight. Russia's energy minister Alexander Novak expressed his determination to cooperate with OPEC to evolve the current production cut and emphasized his willingness to maintain a stable market, as reported by Platts on Tuesday.1 Base Metals: Neutral. Alcoa workers at Western Australian alumina and bauxite facilities voted to extend a strike initiated on August 8. Precious Metals: Neutral. The odds of sharply higher oil prices colliding with rising U.S. interest rates are increasing as the year winds down. Gold will outperform equities in this environment. Ags/Softs: Underweight. Brazilian farmers are lobbying Chinese consumers and Argentine suppliers to establish a futures contract tailored for delivery of soybeans from Latin America to China.2 Feature Oil markets continue to tighten, as the now fully discounted loss of ~ 2mm b/d of Iranian and Venezuelan exports is compounded by additional supply-side concerns in Iraq and Libya, and razor-thin OPEC spare capacity. Global demand remains robust. Against this backdrop, it is hardly surprising the energy ministers of the Kingdom of Saudi Arabia (KSA) and Russia are huddling with the U.S. Energy Secretary this week to discuss oil markets in separate meetings on opposite sides of the globe.3 The risk an oil-supply shock collides with tightening monetary conditions in the U.S. is rising, as the Fed continues its rates-normalization policy. This potent confluence of risks, which could push Brent prices above $120/bbl, raises the odds of a sharp correction in U.S. equities (Chart of the Week). It also could pull the recession we expect in 2020 into 2019. This is a risk assessment, not our baseline scenario. While the odds of an oil-price spike accompanied by higher interest rates are increasing, we are not changing our view of oil or gold markets: We expect Brent crude to average $70/bbl in 2H18 and $80/bbl in 2019. We also remain long gold as a portfolio hedge against higher inflation this year and next, and expect the Fed to stay the course on its rates-normalization policy.4 Chart of the WeekOil Price Spikes + Rising U.S. Interest Rates Typically Presage S&P 500 Sell-Off
Oil-Supply Shock, Rising U.S. Rates Favor Gold As A Portfolio Hedge
Oil-Supply Shock, Rising U.S. Rates Favor Gold As A Portfolio Hedge
That said, gold will remain one of the best indicators of how markets assess the Fed's willingness to lean into its rates policy: If prices weaken further, it will signal markets are pricing in continued tightness in U.S. monetary policy. Any weakness resulting from this expectation will be an opportunity to get long (or longer) gold as a portfolio hedge, particularly if oil markets tighten as we expect. Energy Ministers Meet As Oil Markets Tighten KSA's minister, Khalid al-Falih, and U.S. Energy Secretary Rick Perry met in Washington this past Monday, and Perry is due to travel to Moscow for a scheduled visit today. The increasing likelihood of 2mm b/d of exports being lost to U.S. sanctions against Iran later this year, and the imminent collapse of Venezuela, provides the context for these meetings. Platts Analytics estimates as much as 1.4mm b/d of Iranian exports could be lost to the market by the time U.S. sanctions against that country kick in in November. In our base case, we expect a loss of 1mm b/d, which keeps the global market in a physical deficit next year (Chart 2). Total OPEC production in August is estimated by Platts at 32.9mm b/d, a 10-month high, with output in Iraq surging to 4.7mm b/d and to 940k b/d in Libya.5 That Iraqi and Libyan production surge is increasingly at risk, however. In addition to the fully discounted Iranian and Venezuelan risk, we expect American, Saudi and Russian ministers also will discuss the growing risk to Iraq's and Libya's production, and its implications for global supply.6 Civil unrest in these states raises the risk of additional unplanned outages over the near term just as output is recovering.7 Concerns over razor-thin OPEC spare capacity - equal to ~ 1.5% to 2.0% of global demand - and continued strong global consumption likely number among their concerns, as well. In our view, these factors strongly suggest the oil market is setting up for a supply shock that could lift prices above $120/bbl (Chart 3). Chart 2Physical Deficits Could Widen
Physical Deficits Could Widen
Physical Deficits Could Widen
Chart 3High-Price Scenarios Becoming More Likely
High-Price Scenarios Becoming More Likely
High-Price Scenarios Becoming More Likely
Fed Policy Could Collide With Oil Price Spike With the U.S. economy at or very near full capacity, unemployment below 4%, and inflation and inflation expectations ticking higher, we believe the Fed will remain focused on its rates-normalization policy. This increases the risk an oil-supply shock collides with tightening monetary conditions in the U.S. is rising. If the Fed looks through the oil-price spike we expect in the next 6 to 12 months - treating it as a transitory event - its rates-normalization policy will become problematic for the U.S. and global economies. Such a reading by the Fed would be a policy error, in our estimation. As shown in the Chart of the Week, an oil-supply shock accompanied by continued Fed tightening raises the risk of a sharp correction in U.S. equity markets, and perhaps could trigger a bear market. In addition, the recession we expect later in 2020 could be pulled into 2019. As shown in Table 1, 10 out of the 11 recessions in the U.S. since 1945 were preceded by spikes in oil prices. Not every rise in oil prices was accompanied by a recession. In other words, recessions in the U.S. are usually preceded by spikes in oil prices, but not all spikes in oil prices are followed by recessions. This is important, as it implies that forecasting a recession based solely on rises in oil prices can sometimes misfire. Table 1History Of Oil Supply Shocks
Oil-Supply Shock, Rising U.S. Rates Favor Gold As A Portfolio Hedge
Oil-Supply Shock, Rising U.S. Rates Favor Gold As A Portfolio Hedge
On the other hand, an oil-price shock combined with a rate-tightening cycle presents a more reliable recession signal. In fact, since 1970, every time the Fed-funds rate rose by more than ~200bps and oil prices rose by more than 50%, the U.S. business cycle peaked in the following 6-18 months.8 EM Growth Threatened, As Well As the Fed proceeds with its policy-rate normalization, the broad trade-weighted USD (USD TWIB) will strengthen. A sharp increase in oil prices accompanied by continued strength in the USD TWIB will redound to the detriment of EM economies, reducing demand for commodities generally, as the local currency costs of all USD-denominated goods increases. The confluence of these factors - should they materialize - would reduce EM income growth - perhaps even cause a contraction - and would produce a medium-term deflationary impulse, along with a rush to U.S. treasuries and other safe-haven assets. This would lower U.S. interest rates, all else equal, forcing the Fed to put its rates-normalization policy on hold, and possibly reverse it.9 Favor Gold, If Oil Spikes And Rates Rise In sum, the U.S. economy is at or very near full capacity, which will keep the Fed focused on its rates-normalization process. This will likely cause the Fed to treat the oil-price spike we expect on the back of a supply-side shock over the next 6 - 12 months as transitory. The Fed won't view it as a true inflationary threat, and will continue with its rates policy, as its core inflation gauge - the U.S. PCEPI ex food and energy - continues to move higher. Over the short run, this would look like U.S. real rates are falling, boosting the appeal of gold. However, the oil-price spike plus a maintained bias by the Fed to continue raising policy rates will lift the USD TWIB, even as oil prices remain high. This will be a double-whammy to EM economies - the absolute price of oil in USD will rise significantly, even as a stronger USD raises the cost of all other dollar-denominated goods and services. This will reduce disposable income and lower aggregate demand in EM economies. Should the Fed misread the oil-price spike in a rising interest-rate environment, we believe holding gold in a diversified portfolio continues to make sense. Gold outperforms in rising inflation environments, and when demand for safe-havens increases. In addition, gold outperforms equities in periods of declining stock markets (Chart 4). This convexity on the upside and downside is one of gold's strongest attributes. Bottom Line: Given the continued pressure on gold from the Fed's rates-normalization policy, the yellow metal will remain an inexpensive portfolio hedge. Gold prices are currently below or close to their long-term average when expressed in terms of the S&P 500 or oil units (Chart 5). Hence, diverting limited amount from equity to gold is recommended on a risk-adjusted basis. Chart 4Gold V. S&P 500
Oil-Supply Shock, Rising U.S. Rates Favor Gold As A Portfolio Hedge
Oil-Supply Shock, Rising U.S. Rates Favor Gold As A Portfolio Hedge
Chart 5Gold Is Relatively Cheap
Gold Is Relatively Cheap
Gold Is Relatively Cheap
Robert P. Ryan, Senior Vice President Commodity & Energy Strategy rryan@bcaresearch.com Hugo Bélanger, Senior Analyst Commodity & Energy Strategy HugoB@bcaresearch.com 1 Please see "Russian energy minister Novak sees broader OPEC, Russia, allies cooperation charter 'expedient' from Jan 1, 2019" published by SP Platts Global on September 11, 2018. 2 Please see "Brazil Farmers Vie For Soy Contract During U.S. - China Trade War," published by reuters.com on September 10, 2018. 3 Please see "U.S. and Saudi energy ministers to meet in Washington: DOE," and "Russia's Novak to meet with U.S. counterpart Perry, discuss oil markets," both published by reuters.com on September 10, 2018. 4 Our view is aligned with BCA's U.S. Bond Strategy, which can be found in "The Powell Doctrine Emerges" published September 4, 2018. It is available at usbs.bcaresearch.com. 5 Please see "OPEC crude oil production rises to 32.89 mil b/d in Aug as cuts unwind: Platts survey" published by SP Platts Global September 6, 2018. Noteworthy in the Platts analysis is the KSA increase to 10.5mm b/d. NB: We will be updating our balances next week. See also "U.S. warns Iran it will respond to attacks by Tehran allies in Iraq" published by reuters.com on September 11, 2018. 6 Rising secular tensions in Iraq - particularly vis-à-vis Iran's role in that state - could threaten production and exports there, as we discussed in the Special Report we published last week, in concert with BCA's Geopolitical Strategy. Please see "Iraq: The Fulcrum Of Middle East Geopolitics And Global Oil Supply" published September 5, 2018, and "Iraq Is The Prize In U.S. - Iran Sanctions Conflict" published June 7, 2018. Both are available at ces.bcaresearch.com. 7 Civil order in Libya is collapsing. The Islamic State is increasing the tempo of its operations in and around Libya; forces loyal to the late dictator late Muammar Qaddafi staged a mass escape from a Tripoli prison earlier this month; and local militia are threatening to extend the Libyan unrest into neighboring states. Please see "Libya's Haftar threatens to 'spread war' to Algeria" reported by Arab News September 11, 2018; "Masked gunmen attack Libyan oil corporation HQ in Tripoli," published by The Guardian September 10, 2018; and "Hundreds escape in jailbreak near Libyan capital" published by The National in the UAE September 3, 2018. 8 These effects are not constant or fixed. Each period has its own specificities implying a range around the rate hike and oil-prices spike necessary to disrupt the economy. 9 Please see BCA Commodity & Energy Strategy Weekly Report, "Trade, Dollars, Oil & Metals ... Assessing Downside Risk" published August 23, 2018, available at ces.bcaresearch.com. Investment Views and Themes Recommendations Strategic Recommendations Tactical Trades Commodity Prices and Plays Reference Table
Oil-Supply Shock, Rising U.S. Rates Favor Gold As A Portfolio Hedge
Oil-Supply Shock, Rising U.S. Rates Favor Gold As A Portfolio Hedge
Trades Closed in 2018 Summary of Trades Closed in 2017
Oil-Supply Shock, Rising U.S. Rates Favor Gold As A Portfolio Hedge
Oil-Supply Shock, Rising U.S. Rates Favor Gold As A Portfolio Hedge
Highlights The U.S. midterm elections are far less investment-relevant than consensus holds; Trump will increase the pressure on China and Iran regardless of the likely negative election results for the GOP; The Iranian sanctions, civil conflict in Iraq, and other oil supply issues are the real geopolitical risk; Despite the tentative good news on Brexit, political uncertainty in the U.K. makes now a bad time to buy the pound; Go long Brent crude / short S&P 500; long U.S. energy / tech equities; long JPY / short GBP. Feature The U.S. political cycle begins in earnest after Labor Day. Understandably, we have noticed an uptick in client interest, with a steady stream of questions and conference call requests about U.S. politics. Generally, our forecast remains unchanged since our April net assessment of the upcoming midterm election.1 Democrats have a slightly better than 60% probability of winning the House of Representatives, with a solid 45% probability of taking the Senate, and rising. The latter is astounding, given that the "math" of the Senate rotation is against the Democrats. Our bias toward a Democratic victory is based on current polling (Chart 1) and President Trump's woeful approval rating (Chart 2). There are a lot of other moving parts, however, and we will update them next week in detail. Chart 1GOP Trails In Polls, But It Is Still Close
GOP Trails In Polls, But It Is Still Close
GOP Trails In Polls, But It Is Still Close
Chart 2Trump's Approval Rating Lines The GOP Up For Steep Losses
Fade The Midterms, Not Iraq Or Brexit
Fade The Midterms, Not Iraq Or Brexit
But why, dear client, should you care? Do the midterms really matter for investors? History suggests that they tend to be a bullish catalyst for the stock market (Chart 3). Will this time be any different? The two bearish narratives hanging over markets have to do with the Democrats foiling President Trump's pro-business policy and impeaching him. The former would purportedly have a direct impact on earnings by stymieing Trump's pluto-populist agenda, while the latter would presumably force Trump to seek relevance abroad - through an aggressive foreign policy or trade policy. We think both concerns are without merit. First, by taking over the House of Representatives, the Democrats will not be able to stop or reverse the president's economic agenda. Trump's deregulation will continue, given that regulatory affairs are the sole prerogative of the executive branch of government. Tax cuts will not be reversed, given that Democrats have no chance of gaining a 60-seat, filibuster-proof, majority in the Senate, and would not have a two-thirds majority in each chamber to override Trump's veto. As for fiscal stimulus, it is highly unlikely that the party of the $15 minimum wage and "Medicare for all" would seek to impose fiscal discipline on the nation. As far as the market is concerned, President Trump has accomplished all he needed to accomplish. Gridlock is perfectly fine, which is why a divided Congress has not stopped bull markets in the past (Chart 4). And should the Republicans somehow retain Congress, the result would be a "more of the same" rally. Chart 3Midterm U.S. Elections Tend To Be Bullish...
Fade The Midterms, Not Iraq Or Brexit
Fade The Midterms, Not Iraq Or Brexit
Chart 4... Even Those That Produce Gridlock
Fade The Midterms, Not Iraq Or Brexit
Fade The Midterms, Not Iraq Or Brexit
What about impeachment? Well, what about it? As we have illustrated in our net assessment of the impeachment risk, the Senate is not likely to convict Trump, so markets can look through it, albeit with bouts of volatility (Chart 5A & 5B).2 Chart 5AMarkets Can Rally Through Impeachment...
Markets Can Rally Through Impeachment...
Markets Can Rally Through Impeachment...
Chart 5B...Despite Volatility
...Despite Volatility
...Despite Volatility
To this our clients counter: "But Trump is different!" According to this theory, President Trump would respond to the threat of impeachment by becoming unhinged and seeking relevance abroad through an aggressive foreign and trade policy. But can he be more aggressive than ... Threatening nuclear war with North Korea; Re-imposing an oil embargo against Iran - and thus unraveling the already shaky equilibrium in the Middle East; Imposing tariffs on half, possibly all, U.S. imports from China; Threatening additional tariffs on U.S. allies like Canada, the EU, and Japan? More aggressive than that? We are agnostic towards the upcoming midterm elections. We already have a deeply alarmist view towards U.S. foreign policy posture vis-à-vis Iran3 and U.S. trade policy vis-à-vis China,4 both of which we have articulated at length. The midterm elections factor very little in our analysis of either. As such, they are a non-diagnostic variable. The outcome of the vote is a red herring. President Trump will seek relevance abroad whether or not his Republican Party holds the House and Senate. In fact, we believe that the midterms are a distraction. Investors have already forgotten about Iran (Chart 6), at a time when global oil spare capacity is falling (Chart 7). BCA's Commodity & Energy Strategy is forecasting Brent to average $80/bbl in 2019, but prices would easily reach $120/bbl in a case where all three pernicious scenarios occur (shale production bottlenecks, Venezuela export collapse, and Iran sanctions).5 Chart 6Nobody Is Paying Attention To Iranian Supply Risk!
Nobody Is Paying Attention To Iranian Supply Risk!
Nobody Is Paying Attention To Iranian Supply Risk!
Chart 7Global Spare Capacity Stretched Thin
Global Spare Capacity Stretched Thin
Global Spare Capacity Stretched Thin
These figures are alarming. But they could become even worse if our Q4 Black Swan - a Shia-on-Shia civil war in Iraq - manifests. The end of the U.S.-Iran détente has put the tenuous geopolitical equilibrium in Iraq on thin ice.6 Since our missive on this topic last week, the violence in Basra has intensified, with rioters setting the Iranian consulate alight. Investors were largely able to ignore the Islamic State insurgency in Iraq because it occurred in areas of the country that do not produce oil. A Shia-on-Shia conflict, however, would take place in Basra. This vital port exports 3.5 bpd. Any damage to its facilities, which is highly likely if Iran gets involved in the conflict, would instantly become the world's largest supply loss since the first Gulf War (Chart 8). Bottom Line: Our message to clients is that midterm elections are far less investment-relevant than is assumed. President Trump has already initiated aggressive foreign and trade policy. We expect the White House to intensify the pressure on Iran and China regardless of the outcome of the midterm election. And we also expect the Democratic Party to be unable to stop President Trump on either front, should it gain a majority in the House of Representatives. The truly underappreciated risk for investors is a massive oil supply shock in 2019 that comes from a combination of instability in Venezuela, aggressive U.S. enforcement of the oil embargo against Iran, and Iran's retaliation against such sanctions via chaos in Iraq. We are initializing a long Brent / short S&P 500 trade, as well as a long energy stocks / short tech trade, as hedges against this risk (Chart 9). Chart 8Civil Unrest In Basra Would Be Big
Fade The Midterms, Not Iraq Or Brexit
Fade The Midterms, Not Iraq Or Brexit
Chart 9Two Hedges We Recommend
Two Hedges We Recommend
Two Hedges We Recommend
Government Shutdown Is The One True Midterm-Related Risk There is a declining possibility of a government shutdown before the midterm - and a much larger possibility afterwards. It is well known that the election odds favor the Democrats, but if there were ever a president who would do something drastic to try to turn the tables, it would be Trump. A majority in the House gives Democrats the ability to impeach. While we think the Senate would acquit Trump of any impeachment articles, this view is based on stout Republican support. A "smoking gun" from Special Counsel Robert Mueller - comparable to Nixon's Watergate tapes - could still change things. Trump would rather avoid impeachment altogether. Trump could still conceivably try to upset the election by insisting on funding his promised "Wall" on the border. The Republicans want to delay the appropriations bill for the Department of Homeland Security, which would include any border security funding increases, until after the election (but before the new House sits in January). Trump has repeatedly threatened to reject his own party's plan, though he has recently backed off these threats. A shutdown ahead of an election would conventionally be political suicide - especially given the likely need for a federal response to Hurricane Florence. Moreover Trump's border wall is opposed by over half the populace. But Trump could reason that the greatest game changer would be a spike in turnout when his supporters hear that he is willing to stake the entire election on this key issue. Turnout is everything. The success of such a kamikaze run would hinge on the Senate. Assuming that Trump retained full Republican support to push through wall funding, as GOP incumbents frantically sought to end the shutdown, there would be 12 Democratic senators, in the broadest measure, who could conceivably be intimidated into voting with them (Table 1). These senators would have to decide on the spot whether they are safer running for office during a government shutdown or after having given Trump his wall. They may decide on the latter. Table 1A Government Shutdown Could Conceivably Intimidate Trump-State Democrats
Fade The Midterms, Not Iraq Or Brexit
Fade The Midterms, Not Iraq Or Brexit
This would total 63 votes in the Senate, enough to invoke "cloture," ending debate, and hence break any Democratic filibuster against proposed wall funding. But this calculation is also extremely generous to Trump. More likely, at least four of the twelve senators would refuse to break rank: Debbie Stabenow of Michigan, Robert Menéndez of New Jersey, Sherrod Brown of Ohio, and Bob Casey of Pennsylvania. They would be averse to defecting from their party on such a consequential vote, even if eight of their colleagues were willing to do so.7 This is presumably why Mick Mulvaney, Trump's budget director, has already gone to Capitol Hill and "personally assured" the leading Republicans that Trump is not going to pursue a government shutdown.8 The legislative math doesn't really work. Nevertheless, there is still some chance that Trump - as opposed to any other president - will try this gambit. Especially as the loss of the House and potentially the Senate begins to appear "inevitable." After the midterm, of course, all bets are off. A lame duck Congress, or worse a Democratic Congress, will give President Trump all the reason he needs to grind things to a halt over his wall, with a view to 2020. The odds of a shutdown will shoot up. Do shutdowns matter for investors? Not really. S&P 500 returns tend to be flat for the first two weeks after a shutdown. Looking at eight past shutdowns, the average return was 1% fifteen days later, and 4.5% two months later. Bottom Line: We give a pre-election shutdown 10% odds due to Trump's unorthodoxy and desperate need to boost turnout among his voter base. Post-midterm election, a government shutdown is inevitable, unless congressional Republicans manage to convince President Trump to sign long-term appropriation bills before the election. Brexit: Is The Pound Pricing In Uncertainty? The U.K.-EU negotiations are entering their final, and thus most uncertain, phase. Our Brexit decision-tree looks messy and complicated (Diagram 1). While we believe that Prime Minister Theresa May has increased the probability of the sanguine "soft Brexit" outcome, there are plenty of pathways that lead to risk-off events. Diagram 1Brexit: Decision Tree And Conditional Probabilities
Fade The Midterms, Not Iraq Or Brexit
Fade The Midterms, Not Iraq Or Brexit
Is the pound sufficiently pricing in this uncertainty? According to BCA's Foreign Exchange Strategy, which recently penned a special report on the subject, the answer is no.9 According to their long-term fair value model, the trade-weighted pound exhibits only a 3% discount - well within its historical norm (Chart 10). Chart 10Pound: A Much Smaller Discount On A Trade-Weighted Basis
Pound: A Much Smaller Discount On A Trade-Weighted Basis
Pound: A Much Smaller Discount On A Trade-Weighted Basis
In order to assess the degree of political risk priced into the pound, one needs to isolate the risk of the U.K. leaving the EU. This is because all fair value models - including that of our FX team - are based on a potentially unrepresentative sample, one where the U.K. is part of the EU! The problem is that the traditional variables used to explain exchange rate movements were also greatly affected by the shock following the Brexit vote in June 2016. For example, looking at the behavior of British gilts, the FTSE, consumer confidence, and business confidence, one can see very abnormal moves occurring in conjunction with large fluctuations in the pound during the summer of 2016 (Chart 11A & 11B). Thus, if one were to regress the pound on these variables, one would not have observed a risk premium, even though the market was clearly very concerned with the geopolitical outlook for the U.K. Chart 11AAbnormal Moves Around The Brexit Vote...
Abnormal Moves Around The Brexit Vote...
Abnormal Moves Around The Brexit Vote...
Chart 11B...Make It Hard To Spot Geopolitical Risk
...Make It Hard To Spot Geopolitical Risk
...Make It Hard To Spot Geopolitical Risk
Our FX team therefore decided to try to explain the pound's normal behavior using variables that did not experience large abnormal moves in the direct aftermath of the British referendum. For GBP/USD (cable), the currency pair was regressed versus the dollar index and the British leading economic indicator (LEI). For EUR/USD, the currency pair was regressed against the trade-weighted euro and U.K. LEI. The reason for using the trade-weighted dollar and euro as explanatory variables is simple: it helps isolate the pound's movements from the impact of fluctuations in the other leg of the pair. Using the U.K. LEI helps incorporate the immediate outlook for U.K. growth and U.K. monetary policy into the pound's movement. The remaining error term was mostly a reflection of geopolitical risk.10 The results of the models are shown in Chart 12A & 12B. While the pound did show a geopolitical discount in the second half of 2016 (as evidenced by the abnormally large discount from the fundamental-based model), today the pound's pricing shows no geopolitical risk premium, whether against the dollar or the euro. This corroborates the message from the economic policy uncertainty index computed by Baker, Bloom, and Davis, which shows a very low level of economic policy uncertainty based on news articles (Chart 13). Chart 12ANo Geopolitical Risk Embedded...
No Geopolitical Risk Embedded...
No Geopolitical Risk Embedded...
Chart 12B...In Today's Pound Sterling
...In Today's Pound Sterling
...In Today's Pound Sterling
Chart 13Policy Uncertainty Index Muted
Policy Uncertainty Index Muted
Policy Uncertainty Index Muted
Considering the thin risk premium embedded in the pound against both the dollar and the euro, GBP does not have much maneuvering room through the upcoming busy calendar. The problem for the pound is that the 5% net disapproval of Brexit among the British public remains smaller than the cohort of British voters who remain undecided (Chart 14). This means that domestic politics in the U.K. could remain a source of surprise, especially as Prime Minister Theresa May's polling remains tenuous (Chart 15). This raises the risk that Hard Brexiters end up controlling 10 Downing Street - despite their status as a minority within the ranks of Conservative MPs (Chart 16). Chart 14A Liability For Sterling
A Liability For Sterling
A Liability For Sterling
Chart 15Theresa May's Tenuous Grip
Theresa May's Tenuous Grip
Theresa May's Tenuous Grip
Chart 16Hard Brexiters Are A Minority
Fade The Midterms, Not Iraq Or Brexit
Fade The Midterms, Not Iraq Or Brexit
With the global economic outlook already justifying a lower pound, especially versus the dollar, the pound seems to be too risky of an investment at this moment. It is true that positioning and sentiment towards cable are currently very depressed, raising the risk of a short-term rebound (Chart 17). This could particularly occur if the EU meeting in Salzburg in two weeks results in some breakthrough. Such an event would still not resolve May's domestic conundrum, which is why we would be inclined to fade any such rebound. Bottom Line: On a six-to-nine-month basis, it makes sense to short the pound against the dollar and the yen. Slowing global growth hurts the pound but also hurts the euro while benefiting the greenback and the yen. The political environment in Japan, in particular, supports this reasoning. As we have maintained, Shinzo Abe is not going to lose the September 20 leadership election for the ruling party (Chart 18).11 And the Trump administration is not going to wage a full-scale trade war against Japan. However, after the leadership poll, Abe will press ahead with his agenda to revise the constitution, which will initiate a controversial process and stake his fate on a popular referendum that is likely to be held next year. Chart 17Fade Any Short-Term Rebound
Fade Any Short-Term Rebound
Fade Any Short-Term Rebound
Chart 18Abe Lives, But Yen Will Rise
Fade The Midterms, Not Iraq Or Brexit
Fade The Midterms, Not Iraq Or Brexit
At the same time, Trump might try throwing some threats or jabs against Japan before his defense secretary and admirals are able to convince him that such actions subvert U.S. strategy against China. Therefore Japan-specific political risks are on the horizon, in addition to the ongoing trade war with China, which is already a boon for the yen. We are therefore initiating a long yen / short pound tactical trade. Marko Papic, Senior Vice President Chief Geopolitical Strategist marko@bcaresearch.com Mathieu Savary, Vice President Foreign Exchange Strategy mathieu@bcaresearch.com Matt Gertken, Associate Vice President Geopolitical Strategy mattg@bcaresearch.com Juan Manuel Correa, Senior Analyst juanc@bcaresearch.com Ekaterina Shtrevensky, Research Associate ekaterinas@bcaresearch.com 1 Please see BCA Geopolitical Strategy Weekly Report, "Will Trump Fail The Midterm?" dated April 18, 2018, available at gps.bcaresearch.com. 2 Please see BCA Geopolitical Strategy Special Report, "Break Glass In Case Of Impeachment," dated May 17, 2017, available at gps.bcaresearch.com. 3 Please see BCA Geopolitical Strategy Special Report, "Why Conflict With Iran Is A Big Deal - And Why Iraq Is The Prize," dated May 30, 2018, available at gps.bcaresearch.com. 4 Please see BCA Geopolitical Strategy Special Report, "The U.S. And China: Sizing Up The Crisis," dated July 11, 2018, available at gps.bcaresearch.com. 5 Please see BCA Commodity & Energy Strategy Weekly Report, "Trade, Dollars, Oil & Metals ... Assessing Downside Risk," dated August 23, 2018, available at ces.bcaresearch.com. 6 Please see BCA Geopolitical Strategy and Commodity & Energy Strategy Special Report, "Iraq: The Fulcrum Of Middle East Geopolitics And Global Oil Supply," dated September 5, 2018, available at gps.bcaresearch.com. 7 Please see Burgess Everett, "Key red-state Democrat sides with Trump on wall funding," Politico, August 8, 2018, available at www.politico.com, and Ali Vitali, "Vulnerable Senate Democrats embrace Trump's wall," NBC News, August 13, 2018, available at www.nbcnews.com. 8 Please see Niv Elis and Scott Wong, "Trump again threatens shutdown," The Hill, September 5, 2018, available at thehill.com. 9 Please see BCA Foreign Exchange Strategy Special Report, "Assessing The Geopolitical Risk Premium In The Pound," dated September 7, 2018, available at fes.bcaresearch.com. 10 To make sure the exercise was robust, Foreign Exchange Strategy tested the out-of-sample performance of the model. Reassuringly, the GBP/USD and EUR/GBP models showed great predictive power out-of-sample (see Appendix), while remaining significant and explaining 80% and 65% of the pairs' variations respectively. 11 Please see BCA Geopolitical Strategy Special Report, "Japan: Kuroda Or No Kuroda, Reflation Ahead," dated February 7, 2018, available at gps.bcaresearch.com. Appendix: Traditional Variables Are Of Little Use To Isolate A Geopolitical Risk Premium Chart 19
Out-Of-Sample Testing Of Model (I)
Out-Of-Sample Testing Of Model (I)
Chart 20
Out-Of-Sample Testing Of Model (II)
Out-Of-Sample Testing Of Model (II)
Geopolitical Calendar
Highlights Iraq remains vital for the security of the Middle East and global oil supply; Sectarian tensions in Iraq have peaked, but risk of Shia-on-Shia violence is rising, which could imperil the all-important export facilities in Basra; With the Islamic State defeated, Iran's military support is no longer needed; This opens a window of opportunity for Saudi Arabia and its Gulf Cooperation Council (GCC) allies to make diplomatic inroads in the country; Stability and security are positive for investments in Iraq's energy sector, but official targets are overly ambitious. BCA's Commodity & Energy Strategy expects oil prices to push higher ahead of the likely loss of 2 million bbl/day of exports on the back of U.S.-imposed sanctions against Iran and the all-but-certain collapse of Venezuela's economy. Feature "Divisiveness is not good for the people ... the policy of exclusion and the policy of marginalization must end in Iraq ... All Iraqis should live under one roof and for one goal." Muqtada Al Sadr, April 2012 "Competition between parties and election candidates must center on economic, educational, and social service programs that can be realistically implemented; to be avoided are narcissism [and] inflammatory sectarian and nationalist rhetoric" Ayatollah Al Sistani, May 4, 2018 "Say no to sectarianism, no to corruption, no to division of shares, no to terrorism and no to occupation" Muqtada Al Sadr's call for a peaceful million man "Day of Rage," September 2018 Moqtada Al Sadr's Sairuun party's unlikely victory in Iraq's May elections came as a surprise. The former leader of the Mahdi Army - a militia that terrorized U.S. forces - has reinvented himself into a champion of reform and a counterweight against foreign influence in the country, particularly Iranian. His political success is due to his ability to recognize that Iraq is at a crossroads. Attitudes and priorities are shifting on several levels: Iraq is turning away from sectarian politics after a decade and a half of internal strife. The security threat from the Islamic State has been eliminated, with nationalism replacing sectarianism. Iran-Saudi tensions are ramping up again at the same time that the U.S. is putting pressure on Iran by reimposing a global oil embargo. Iraq, a buffer state between Iran and Saudi Arabia, will become a battlefield between the two regional powers, but the battlefield may be shifting from the military theatre to the economic one. These junctures provide both opportunities to transition the country to a new stage, as well as challenges in cleansing the system of its old demons. The composition of Iraq's new government matters. It will ultimately determine whether these impulses will pave the way for a stronger, more unified country, or whether Iraq will remain consumed with internal battles. Unity is required for Baghdad to boost its oil output in the way it hopes. The Iraqi economy's relationship with oil markets is two-sided. Not only is its income dependent on oil, but global oil markets are also reliant on Iraqi supplies at a time when global spare capacity is razor-thin. Given that Iraq is currently the fifth-largest crude oil producer in the world - the second-largest within OPEC - and accounts for 5% of global crude oil supply, Iraq's production ambitions are important for global oil markets (Chart 1). Chart 1Iraqi Upstream Production Matters
Iraq: The Fulcrum Of Middle East Geopolitics And Global Oil Supply
Iraq: The Fulcrum Of Middle East Geopolitics And Global Oil Supply
As such, when Baghdad announced its ambitions to raise capacity to 6.5 million bbl/day by 2022, the energy markets were paying attention. If this capacity increase translates to a rise in actual production, additional Iraqi oil by the end of the four-year period would roughly equal 2 million bbl/day. This is equivalent to BCA's Commodity and Energy Strategy's expectation of a loss of exports from the two main risks to energy markets today: the Iranian oil embargo and the internal strife in Venezuela (Chart 2).1 (Of course, the Iraqi production would not come in time to prevent the run-up in prices that we expect as a result of the latter two risks, given that they are immediate risks whereas Iraq will take four years to ramp up.) Chart 2Losses From Venezuela and Iran Will Push Prices Higher
Losses From Venezuela and Iran Will Push Prices Higher
Losses From Venezuela and Iran Will Push Prices Higher
The doubling of Iraq's production over the past decade occurred despite constant sabotage of its oilfields, pumping stations, and pipelines by insurgents. It would seem that the restoration of security offers an optimistic outlook for Iraq's production plan, especially given Iraq's naturally competitive conditions (Table 1). But there is no certainty in Baghdad's ability to reach these targets. Iraqi output is now operating near full capacity (Chart 3). The past decade and a half have wreaked havoc on its infrastructure and discouraged investments needed to develop its fertile oilfields. Table 1Operating Costs Are Competitive
Iraq: The Fulcrum Of Middle East Geopolitics And Global Oil Supply
Iraq: The Fulcrum Of Middle East Geopolitics And Global Oil Supply
Chart 3Not Much Idle Capacity
Not Much Idle Capacity
Not Much Idle Capacity
In this report, we assess whether political conditions will support stability in Iraq. The alternative scenario, one where Iraq becomes a physical battlefield between Iran and Saudi Arabia, would not only snuff out any hope of an oil export boom, but could also become yet another risk to global oil supply. Political Will Is Not Enough To Boost Oil Output An expansion of oil production capacity would bring much needed revenue to aid in Iraq's rebuilding efforts. Iraq's economy is highly dependent on the energy sector, even relative to other major oil-producing Middle Eastern peers (Chart 4). The rebound in oil prices over the past couple of years has therefore helped support Iraq's budget, with a surplus expected this year for the first time since 2012 (Chart 5). Extra revenue has, in turn, helped grease the wheels of stability and reconciliation in the country. Chart 4Addicted to Petrodollars
Iraq: The Fulcrum Of Middle East Geopolitics And Global Oil Supply
Iraq: The Fulcrum Of Middle East Geopolitics And Global Oil Supply
Chart 5Higher Prices Will Help Flip the Deficit
Higher Prices Will Help Flip the Deficit
Higher Prices Will Help Flip the Deficit
However, political will is not a sufficient condition. Rather, the success of the plan to expand capacity is contingent on Baghdad overcoming several key constraints: While the threat from Islamic State has for the most part subsided, security and the potential for sabotage remain risks to Iraq's current oil infrastructure. Ongoing disputes over the status of Kurds in northern Iraq - risks that contains almost 20% of proven reserves - raise the potential for conflict. Additionally, oil infrastructure may become vulnerable to sabotage from Iran, or Iranian-backed militants, if there is a souring of relationships (see more on that below). Discontent among Iraqis in the southern oil-rich region also raises the probability of disruptions. Over the weekend, protesters upset with corruption and poor services gathered near the Nahr Bin Omar oilfield. Clashes between Basna protesters and security forces have already led to six deaths over the past three days. Iraq's current network of pipelines, pumping stations, and storage facilities - many of which are damaged beyond repair - are not capable of handling greater volumes. An expansion of the export capacity is required for Iraq to be able to benefit from future increases in production. Such an expansion will require FDI, which in turn will require stability and a political climate conducive to large-scale, long-term investments. There are currently two main functioning oil export hubs - the northern network of pipelines, and the southern shipping route (Map 1). Map 1Iraq's Oil Infrastructure On Shaky Ground
Iraq: The Fulcrum Of Middle East Geopolitics And Global Oil Supply
Iraq: The Fulcrum Of Middle East Geopolitics And Global Oil Supply
In northern Iraq, the Iraq-Ceyhan pipeline is connected to Kurdish lines at the city of Fishkabur and carries northern oil to the Turkish port (Table 2). Table 2Defunct Pipelines Leave Room For Improvement
Iraq: The Fulcrum Of Middle East Geopolitics And Global Oil Supply
Iraq: The Fulcrum Of Middle East Geopolitics And Global Oil Supply
Northern exports account for ~15% of Iraq's total crude exports (Chart 6). While the Fishkabur-Ceyhan pipeline has a nameplate capacity of 1.5 million bbl/day, usable capacity is reportedly significantly lower, constraining Iraq's northern exports. Chart 6Southern Crude Accounts For Bulk Of Iraqi Exports
Iraq: The Fulcrum Of Middle East Geopolitics And Global Oil Supply
Iraq: The Fulcrum Of Middle East Geopolitics And Global Oil Supply
Although the Kurdistan Regional Government (KRG) has its own network of pipelines transporting crude from fields in the Khurmala Dome and Tawke fields to Ceyhan via Fishkabur, the main infrastructure on the Baghdad-controlled side - the Kirkuk-Fishkabur pipeline - has been targeted by insurgents and has slowly been losing capacity. Its pre-2003 0.9 million bbl/day capacity was reduced to 0.25 million bbl/ day in 2013. Finally, it was closed down in March 2014 rendering it inoperable. Exports from Kirkuk have been on hold following Iraq's takeover of the oilfield in October 2017, as the Iraqi government does not have the infrastructure to bypass Kurdish pipelines. As a result, exports through Ceyhan have collapsed to almost half their pre-October levels.2 The closure of the Kirkuk pipeline undercuts Iraq's ambitions to increase Kirkuk's oil production to 1 million bbl/day. This has been partially mitigated by an agreement for Iraq to truck 0.03-0.06 million bbl/day of Kirkuk oil to Iran in exchange for oil in the south. Ultimately, the vulnerability of northern exports highlights the need for more reliable transportation channels. As such, the Iraqi government announced plans late last year to build a new pipeline from Baiji to Fishkabur, replacing the defunct Kirkuk pipeline in transporting oil to Ceyhan. Furthermore, the idea of using KRG pipelines to export Kirkuk's oil was floated during meetings between current Prime Minister Haider al-Abadi and former President of the Kurdish Regional Government (KRG) Masoud Barzani, and thus could be a possibility going forward. A positive outcome would require a thaw in Iraqi-Kurdish relations and ultimately hinges on the outcome of government formation in Baghdad. Thus, the northern infrastructure - which currently has a nameplate export capacity of 1.5 million bbl/day - underlines the vulnerability of Iraq's exports, not only to sabotage, but also to internal strife. Export capacity from southern Iraq, which accounts for 85% of oil exports, will also require expansion. Pipelines between the oilfields, storage facilities, and export terminals on the Persian Gulf are also susceptible to damage. However, authorities have been expanding export capacity there. The authorities currently operate five single point moorings, bringing total export capacity from the Persian Gulf to 4.6 million bbl/day. The Iraqi Pipeline to Saudi Arabia (IPSA), which could support export capacity from the south, runs through the Arabian Peninsula to the Red Sea. However, it has not been operating since the first Gulf War, and the Saudis have converted their section of the pipeline to transport natural gas. Talks of a revival of this line have recently surfaced. An improvement in Saudi-Iraqi relations would certainly be a positive sign for southern export capacity, providing another outlet for any potential supply increase. Currently there are no operating export pipelines going westward.3 The Kirkuk-Baniyas pipelines were damaged in 2003, and while Iraq and Syria agreed to replace these pipelines with two new ones in 2010, no progress has been made yet. Given instability in Syria, this is unlikely to happen anytime soon. However, there is a plan in place to create a new line between Basra and Aqaba in Jordan with an export capacity of 1 million bbl/day. This would allow Iraq to transport just under a quarter of its total exports via the Red Sea, rather than the Persian Gulf. In terms of internal transportation, the Iraq Strategic Pipeline is a pair of bi-directional lines that run vertically between the country's most important oil-producing regions. However, it has been damaged and currently operates only northward, from Basra to Karbala. Since there are no operational pipelines to the north under Iraqi control, it is currently of limited use. In other words, the oil is stuck in Iraq. Increases in water injection facilities are also required to maintain pressures in the reservoir and boost oil production. Natural gas, which Iraq currently flares, could technically be used as an alternative to water injection. Iraq is working towards reducing gas flaring and hopes to use the captured gas for electricity. The Common Seawater Supply Project (CSSP) aims to treat and transport 5-7.5 million bbl/day of seawater from the Persian Gulf to oil production facilities. 1.5 bbl of water injected are required to produce 1 bbl of oil in the major southern oilfields. However, since the termination of talks with Exxon Mobil Corp on the construction of the facility in June (after two years of negotiations!) there has been no progress on this project. It will likely be awarded to another company, but the lack of clarity regarding CSSP's completion date adds uncertainty to Iraq's expansion plans. Electricity shortages also put expansion plans in peril. Iraq needs significant upgrades to its electricity grid. Given that the oil and gas industry is the top industrial customer of electricity, a stable connection is required to boost output. The World Bank reports that in 2011, an average of 40 outages occurred each month, affecting 77% of firms in Iraq. Bottom Line: Export capacity of Iraq's northern pipeline to Ceyhan currently stands at 1.5 million bbl/day, while its southern ports allow for 4.6 million bbl/day to be shipped through the Persian Gulf. These figures are generous. Usable capacity is reportedly much lower. Iraq has plans to increase its western export capacity to 1 million bbl/day through a new pipeline to Aqaba. Nevertheless, this infrastructure is vulnerable to sabotage by residual insurgents, as well as to Iraq-Kurdish and Iraq-Iran disputes. Iraq's Shifting Interests... Policymakers in Baghdad face the challenge of ensuring sufficient water and electricity not only for the country's oilfields but also for the population. Electricity shortages triggered the recent protests in Basra. Demonstrators have been calling for improved access to these essentials, along with job opportunities and a crackdown on corruption. Furthermore, there is increased evidence that Iraqis have become disillusioned with the political elite and are losing confidence in the political "establishment," such as it is (Chart 7). Transparency International rates Iraq as "highly corrupt" and ranked it 169 out of the 180 countries in its 2017 Corruption Perceptions Index. It stands out even among its highly corrupt Middle Eastern peers (Chart 8). Chart 7Iraqis Lack Confidence In Their Leaders
Iraq: The Fulcrum Of Middle East Geopolitics And Global Oil Supply
Iraq: The Fulcrum Of Middle East Geopolitics And Global Oil Supply
Chart 8Corruption Is Rampant
Iraq: The Fulcrum Of Middle East Geopolitics And Global Oil Supply
Iraq: The Fulcrum Of Middle East Geopolitics And Global Oil Supply
Iraqis fear that even as their country exploits its oil, they will remain destitute. Although the southern region contains three-quarters of Iraq's oil reserves (Table 3), it has the highest poverty rate (Chart 9). Table 3Southern Oilfields Are Iraq's Crown Jewel...
Iraq: The Fulcrum Of Middle East Geopolitics And Global Oil Supply
Iraq: The Fulcrum Of Middle East Geopolitics And Global Oil Supply
Chart 9...Yet Poverty Is Widespread There
Iraq: The Fulcrum Of Middle East Geopolitics And Global Oil Supply
Iraq: The Fulcrum Of Middle East Geopolitics And Global Oil Supply
Anti-establishment sentiment is rising, as reflected in the most recent parliamentary elections in May 2018. Voter turnout was reported at 44%, down from 60% in the previous two elections. The success of Moqtada Al Sadr's Sairuun coalition in winning the majority of seats highlights this shift in allegiance (Box 1). While Iraq's demographic makeup remains heterogeneous, voters are no longer instinctively looking for sectarian parties to represent them. Rather, they want policymakers to resolve basic needs like electricity, water, and corruption. Protesters in Basra are therefore not chanting sectarian slogans, but rather demanding basic services and jobs (Chart 10). Box 1 Ma'a Salama Sectarianism? In surprising results from the May parliamentary elections, the Sairuun coalition - an unlikely combination of communists, leftists, and centrist groups, led by firebrand Shia cleric Moqtada Al Sadr - attained the largest number of votes (Table 4). Nevertheless, it was not able to garner enough seats to secure an outright majority necessary to form the government on its own. Instead, alliances are now being forged as parties scramble to establish the largest coalition group. Of the 329 seats in Iraq's Council of Representatives, just over half are represented by the main Shia parties. The challenge for them this time around is that the five main Shia blocs, which were previously united, have split into two opposing camps. Table 4Politicians Are Picking Up On Shifting Trends
Iraq: The Fulcrum Of Middle East Geopolitics And Global Oil Supply
Iraq: The Fulcrum Of Middle East Geopolitics And Global Oil Supply
The Sadr-backed Sairuun coalition, along with (1) Prime Minister Abadi's Nasr al Iraq, (2) the conservative Hikma bloc, and (3) the Ayad Allawi, centrist Wataniyya bloc have already announced a preliminary agreement to form a coalition as well as a commitment to take an anti-sectarian approach. Several smaller Sunni, Christian, Turkmen, and Yazidi parties have pledged that they would support the non-sectarian, nationalist, bloc of parties. This brings their seats to 187. At the other end are the pro-Iranian Fateh and Dawlet al Qanun blocs, which recently announced that they had formed the largest bloc. The two main Kurdish parties are not included in either alliance. Together they hold 43 seats, giving them the power to be the tie-breakers. They have drafted a list of demands and stated their willingness to join whichever bloc is able to guarantee their fulfillment. Given Maliki's previously divisive rule, we assign a greater probability to the scenario in which they join the core coalition headed by Sadr, as several Sunnis have already done so. The danger of a nationalist, cross-sectarian movement is that it would signal the rebirth of an independent Iraq, which is not necessarily in the interest of its two powerful neighbors, Saudi Arabia and Iran. Iran, in particular, would feel its dominant position weaken and might want to instigate sectarian conflict in order to arrest the nationalist, Sadr-led movement. This would definitely matter to global investors as a Shia-on-Shia conflict in Iraq would geographically take place around Basra, the main shipment route for 85% of the country's oil exports. Chart 10Iraqis Want Better Services
Iraq: The Fulcrum Of Middle East Geopolitics And Global Oil Supply
Iraq: The Fulcrum Of Middle East Geopolitics And Global Oil Supply
Prime Minister al-Abadi has also become more responsive to people's needs. He recently sacked the electricity minister and promised to fund electricity and water projects. Furthermore, amid demands for employment opportunities in the oil sector and accusations of corruption, the Iraqi cabinet recently announced a regulation requiring that at least 50% of foreign oil company employees be Iraqi citizens. Given that the voice of discontent in Iraq is getting louder, we expect the government to uphold these promises. Pacifying protesters will increase stability, reduce risks of violence and disruptions, and build support for the government. Nevertheless, many voters still see the prime minister as part of the corrupt political elite. Bottom Line: Iraqis are demanding their basic rights, and this is taking the form of increased pro¬tests, especially in the south where key oilfields are located. The schism among the main Shia parties along the nationalist/Iran axis suggests that Iraq has evolved beyond the purely sectarian political system. This is a positive in the long term as it means that the country can focus on material issues that matter to Iraqis. However, in the short term, the Iran-aligned Shia groups could spur violence, especially if they realize that the sectarian model of politics is waning. ...And Shifting Allegiance? Apart from the shift in focus toward issues-based politics, the election also highlights a pivot in allegiance away from Iran. Sadr's Sairuun bloc is critical of Iranian interference, and while it was initially open to joining forces with Amiri's Iran-backed Fateh coalition, it ultimately allied with the more secular Shia parties. Iran's recent role in Iraq has been mainly through military aid. It proved vital in driving the Islamic State militants out of Iraq - training, equipping, and funding Iraqi militias who fought against the terrorist group. Iran-backed militias united in 2014 to form the Popular Mobilization Forces (PMF) and eventually defeated Islamic State. The PMF, estimated to be between 100,000-150,000 strong, was officially recognized as part of the Iraqi army earlier this year. However, the loyalty of the Shia militias to Baghdad remains unclear. Furthermore, when Washington expressed reluctance in arming Iraq with U.S. military equipment to fight terrorist groups in early 2014, Iran stepped up and signed a deal to sell arms and ammunition worth $195 million (Table 5). Iran also sent its own troops to support in fights against insurgencies - dispatching 2,000 troops to Central Iraq in June 2014. This military collaboration culminated in the signing of a July 23, 2017 agreement between Iran and Iraq for military cooperation in the fight against terrorism and extremism. Table 5Iran's Military Support Was Needed In The Past...
Iraq: The Fulcrum Of Middle East Geopolitics And Global Oil Supply
Iraq: The Fulcrum Of Middle East Geopolitics And Global Oil Supply
Yet with the curbing of Islamic State, Iraq is preparing to begin a new chapter - rebuilding its war-torn cities. In doing so, its needs will shift from military support to financial support, potentially shifting its allegiance from Iran to Saudi Arabia. Furthermore, Iran's current economic situation - especially with the anticipated impact of U.S. sanctions - will leave fewer funds available for it to direct towards Iraq. The electricity crisis earlier this summer symbolizes the shifting dynamic. Iran, which has been supplying southern Iraq with electricity, announced it would no longer provide Iraq with power, citing its dissatisfaction with the accumulation of unpaid bills. Iran itself is experiencing electricity shortages and is no longer willing or able to sacrifice for Iraq, which it fears is drifting outside its sphere of control. Iran eventually took back this move and restarted its electricity exports. However, this occurred only after the Iraqi government sent a delegation to Saudi Arabia to negotiate an agreement to supply electricity to southern Iraq. The Saudis also offered to build a solar power plant to provide electricity to Iraq at a quarter of the Iranian price. Baghdad therefore used the crisis to signal to Tehran that it has other options, including a closer economic relationship with Iran's chief rival, Saudi Arabia. This emerging rift was also apparent during the International Conference for Iraq's Reconstruction, hosted in Kuwait, where Iraq hoped to secure $88 billion worth of funds. There, Iraq obtained $30 billion in pledges toward rebuilding its economy (Chart 11). While Iraq's Arab neighbors jointly pledged over $10 billion, Iran - despite being present at the conference - failed to guarantee any funds. Later it offered Iraq a $3 billion credit line. Chart 11...But Now Iraq Needs Monetary Support
Iraq: The Fulcrum Of Middle East Geopolitics And Global Oil Supply
Iraq: The Fulcrum Of Middle East Geopolitics And Global Oil Supply
Iran is not only limited by the dire state of its economy. Protests in Iran earlier this year partly focused on Tehran's foreign policy expenses, i.e. its support of various loyal regimes around the region. This "loyalty" costs money that Iranians believe could be better spent on their domestic needs. As such, Iranian policymakers will be wary of committing more funding to Iraq, as it could be seen as wasteful by restless voters at home. What's more, Iraq's Arab GCC neighbors have both the willingness and the ability to ally with Iraq and, in turn, to curb Iran's influence in the region. Bottom Line: Stronger ties with its Arab neighbors - and the accompanying funds - are what Iraq needs right now. Iraq requires another $58 billion towards its reconstruction efforts. Its southern neighbors can help it get there. Whether this will transpire hinges on Iran's ability to infiltrate Iraq's political elite. Given that Iraqi people have become disillusioned with many of these leaders, Iran will likely face a bigger challenge this time around. Investment Implications: Short-Term Pain For Long-Term Gain Since 2011, BCA's Geopolitical Strategy has stressed the emerging Saudi-Iranian proxy war as the main regional dynamic.4 With the U.S. "deleveraging" out of the Middle East, the field is open for regional power dynamics. The result is a "security dilemma," in which Saudi and Iranian attempts to improve their defenses appear offensive to the other side, resulting in a vicious cycle of distrust. The Trump administration has deepened the tensions by ending the Obama administration détente with Iran. Lower oil revenue will limit Iran's ability to influence the Middle East through its proxies, including in Iraq. Iran may decide that Iraq is lost. At that point, it may conclude that if it cannot own Iraq, it must break it. Recently, Reuters reported that Iran has moved short-range ballistic missiles into Iraq in order to threaten Saudi Arabia and Israel, in case it needs to retaliate against a U.S. attack against its nuclear facilities.5 While the report was strongly denied by Iran, it suggests that Tehran could be trying to sow discord in Iraq, or even that its operatives are working with impunity in Iraq. Iran's pain is ultimately Saudi Arabia's gain. An Iranian economy battered by the imposition of sanctions will give way to increased Saudi influence in Iraq. The oil-rich GCC countries certainly have the coffers to incentivize such a switch. In offering to fill the funding gaps of its less fortunate neighbors, Saudi Arabia has already won the allegiance of other strategic regional partners such as Egypt, Pakistan, and Sudan. In 2016, amid economic turmoil in Egypt, Saudi Arabia signed agreements worth over $40 billion to support Egypt (Table 6). This does not include financing from other GCC allies. The UAE and Kuwait also support Egypt's economy in a significant fashion. Table 6Saudi Arabia Is No Stranger To Purchasing Allies
Iraq: The Fulcrum Of Middle East Geopolitics And Global Oil Supply
Iraq: The Fulcrum Of Middle East Geopolitics And Global Oil Supply
Similar financial backing in Iraq would go a long way towards filling the $58 billion funding gap for its reconstruction. The quid pro quo would be the backing of Saudi Arabia's regional political agenda, which includes curbing Iranian influence. Not only would such investment accelerate the eventual increase in Iraqi oil production. It would also curb Iran's ability to retaliate through the region, both by removing an important ally and by cutting off Syria and Lebanese Hezbollah geographically from Tehran. Domestic Iraqi politics are therefore critical for global investors. If Iraq forms a nationalist, non-sectarian government over the next several months, it will degrade Iran's ability to influence the country. At that point, Iran may either lash out against the new Baghdad government and try to create domestic strife through its proxies - the battle-hardened Shia militias - or it may be pressed into negotiations with the U.S., lest it lose more allies in the region. If Iran choses to lash out against Iraq, we suspect that it will do so through attacks and sabotage against Iraqi infrastructure. This could present an additional tailwind to oil prices over the next several months. Any additional risk premium on the cost of a barrel of oil would be a boon for Iran as it deals with a loss of exports due to sanctions. Such a campaign of sabotage, however, would ensure that Baghdad firmly moves outside the Iranian sphere in the long term, which could open up the potential for Saudi Arabia and its GCC allies to invest in the country. In the short term, therefore, there is further risk to global oil supply as the shifting political dynamics in Iraq will put the country squarely in the middle of the ongoing Saudi-Iranian proxy war, right where it has always been. In the long term, we believe that Iranian influence in Iraq has peaked and will wane going forward. This opens up the opportunity for Baghdad to rely on Saudi Arabia and GCC countries for funding. This could be a boon for global oil supply over the next decade. Of course, much will hinge on whether Saudi Arabia is willing to finance the development of Iraqi oil fields. Oil produced in those fields would compete directly for market access with Saudi's own production. If Saudi Arabia decides to look out for its own, short-term, economic interests, then Iraq may be limited in terms of funding its development, or even be thrust back into Iran's orbit. Roukaya Ibrahim, Editor/Strategist Geopolitical Strategy RoukayaI@bcaresearch.com 1 Please see BCA Commodity & Energy Strategy Special Report, "Re Oil Demand: Fed Policy Trumps Tariffs," August 30, 2018, available at ces.bcaresearch.com. 2 Prior to the takeover, Kirkuk oil was being transported to Fishkabur via KRG pipelines, which the Iraqi government can no longer access. 3 The Kirkuk-Haifa line has been defunct since 1948. 4 Please see BCA Emerging Markets Strategy and Commodity & Energy Strategy Special Report, "Riyadh's Oil Gambit," dated October 11, 2011, available at ces.bcaresearch.com. 5 Please see John Irish and Ahmed Rasheed, "Exclusive: Iran moves missiles to Iraq in warning to enemies," Reuters, dated August 31, 2018, available at reuters.com.
Highlights Two key issues will remain important drivers of global financial markets in the coming quarters: the direction of the dollar and Chinese policy stimulus. Policy and growth divergences will remain tailwinds for the dollar and there is little the Trump Administration can do to reverse the upward trend. Dollar strength is exposing poor macro fundamentals in many emerging market economies. The problems facing EM economies run deep, and will not disappear anytime soon. Expect more EM fireworks. EM market turmoil could pause the Fed's tightening campaign, but this would require evidence that the U.S. economy and/or financial markets are being negatively affected. Chinese stimulus is a risk to our base-case outlook. A growth impulse might keep the RMB from weakening further, boost commodity prices and support EM exports. However, we believe that Chinese stimulus will not be a 'game changer', and might even cause more problems if the authorities push the RMB lower. The U.S. economy and financial system are less exposed to emerging markets than in the Eurozone. An excellent profit backdrop also provides U.S. risk assets with a strong tailwind. Nonetheless, the U.S. is not immune to EM woes. Poor valuation implies a meaningful correction in U.S. risk assets on any flight-to-quality event. Stay cautious on asset allocation. Fed Chair Powell is willing to wait for the "whites of the eyes" of inflation before becoming alarmed, almost ensuring that the FOMC will fall behind the inflation curve. Evidence of labor market overheating is accumulating. Bond yields will rise as the FOMC tries to catch up and long-term inflation expectations bounce. We believe that investors are underestimating the upside in U.S. inflation risks over the medium term. We recommend below-benchmark duration, although government bonds would temporarily rally if EM turbulence sparks a flight-to-quality. We still expect the supply/demand balance in the world oil market to tighten later this year. Stay positioned for higher oil prices. Japanese corporate profits have been stellar, but that will soon change. EPS growth is likely to soften in the Eurozone too. Favor the U.S. market in unhedged terms. Feature There are numerous key issues on the investment landscape, but two stand out at the moment because they both have wide-ranging global implications: (1) Will the U.S. dollar continue to appreciate; and (2) Will Chinese policymakers place structural reform on the back burner and 'go for growth' in the near term? The latest U.S. economic and profit data provide a strong tailwind for American risk assets. Nonetheless, the mighty U.S. dollar is casting a dark shadow over the heavily-indebted emerging market economies, sparking comparisons with the late 1990s. Could Turkey be the start of a 'domino' effect, similar to Thailand's plunge into financial crisis in 1997 that eventually spread to Brazil and Russia, and finally contributed to the demise of Long-Term Capital Management in the fall of 1998? On the global growth front, the story has not changed much from our assessment last month. Growth is solid, but slowing, in part due to a deceleration in developed-economy capital spending. The global expansion has become less synchronized and relative growth dynamics are pointing to more upside for the greenback (Chart I-1). Chart I-1Cyclical Divergence Is Still Dollar Bullish
Cyclical Divergence Is Still Dollar Bullish
Cyclical Divergence Is Still Dollar Bullish
As in the late 1990s, the Fed is likely to ignore turbulence in EM financial markets and will continue on its tightening path until it begins to affect the U.S. economy or asset prices. The path of least resistance for the dollar is up until something breaks. A major policy impulse from China could alter the feedback loop between the strengthening dollar and EM asset prices. A growth pickup would lift China's imports and commodity prices, both of which would support emerging market economies and asset prices. There is plenty of uncertainty regarding the size of the recently-announced Chinese stimulus measures, but our take is that they are likely to underwhelm because a major growth push would undermine the authorities' structural initiatives. The implication is that the global backdrop will remain unfriendly to emerging market assets at a time when they are more vulnerable than the consensus believes. The risk of a financial accident is escalating. The good news is that the U.S. earnings picture remains excellent, which precludes us from being underweight on risk assets. Nonetheless, investors should have no more than a benchmark allocation to equities and corporate bonds in the major advanced economies. We are upgrading government bonds to neutral at the expense of cash on a tactical basis, to reflect the rising possibility of a global flight-to-quality. The First Domino Turkey has had all the hallmarks of a crisis for a long while. Erdogan's slim hold on power has motivated several populist policy decisions that have stretched Turkey's macro fundamentals. The central bank has been forced to provide large injections of liquidity into the banking system, despite double-digit inflation readings. The country suffers from a classic "twin deficit" problem. Turkish private sector external debt stands at 40% of GDP, of which 13% of GDP is short-term, the highest among EM countries. Erdogan wants economic growth at all costs, but has done little in terms of the structural reforms necessary to lift the country's growth potential. The Lira has lost almost 26% of its value versus the dollar since August 1 and Turkish spreads have blown out. It appears that a lot of bad news has been discounted, but our EM strategists do not see this as a buying opportunity. One risk is that Erdogan imposes capital controls next. Our emerging market team's long held caution on EM is rooted in concern for failing fundamentals.1 They emphasize that Turkey was the catalyst, not the main cause, for the broader financial stress observed across EM assets in August. BCA has highlighted for some time that EM debt is a ticking time bomb. Chart I-2 shows that EM dollar-denominated debt is now as high as it was in the late 1990s as a share of both GDP and exports. Chart I-3 highlights the most vulnerable EM economies in terms of the foreign currency funding requirement, and the foreign debt-servicing obligation relative to total exports. Turkey stands out as the most vulnerable, along with Argentina, Brazil, Indonesia, Chile, and Colombia. Chart I-2Debt Makes EM Vulnerable
Debt Makes EM Vulnerable
Debt Makes EM Vulnerable
Chart I-3EM Debt Exposure
September 2018
September 2018
In all previous major EM selloffs, any decoupling between different EM regions proved to be unsustainable. And it certainly does not help that the Fed remains on its tightening path; EM equities usually fall when U.S. financial conditions tighten (Chart I-4). The combination of a strong dollar and weak RMB is a deadly combination for highly-indebted emerging market economies. Chart I-4EM Highly Sensitive To U.S. Financial Conditions...
EM Highly Sensitive To U.S. Financial Conditions...
EM Highly Sensitive To U.S. Financial Conditions...
Investors should expect contagion to intensify. China To The Rescue? Some investors are hoping that China will 'save the day' by providing a major dose of policy stimulus, as it did in 2015, the last time that EM was close to a tipping point. We doubt China will be able to play the same stabilizing role. The Chinese authorities are committed to their long-term structural goals. They have been trying to reorient the economy toward consumption and away from investment and exports, as well as undertake other reforms to reduce financial risk, pollution, poverty and corruption. China kept policy on the tight side until recently, which resulted in a gradual growth slowdown. The Li Keqiang index (LKI) is a good coincident indicator for economic growth (Chart I-5). This index has ticked up in recent months, along with imports, but this likely reflects industrial activity designed to fill foreign orders before the new U.S. tariffs take effect. Our LKI model, based on money and credit, points to further economic weakness ahead. Chart I-5China: Watch Credit And Fiscal Impulse
China: Watch Credit And Fiscal Impulse
China: Watch Credit And Fiscal Impulse
The escalation of the trade war with the U.S. is forcing the Chinese authorities to provide some short-term policy stimulus in order to pre-empt any resulting economic damage. A flurry of policy announcements over the past month has given investors the impression that Beijing has cranked up the policy dial, including cuts to short-term interest rates, a decrease in reserve requirements, liquidity provision to the banking system, and promises of various forms of fiscal stimulus. Chinese stimulus has historically been positive for commodity prices and EM assets. However, we are less sanguine this time. First, the authorities are not abandoning structural reforms, which means that the associated growth headwinds will not disappear. Second, our China experts believe that Chinese policy is only turning moderately reflationary; this is not the 'big bang' that followed the Great Recession in the late 2000s, or the same level of stimulus provided following the 2015-16 global manufacturing downturn. There will no doubt be some fiscal stimulus, but we do not expect a major expansion in bank credit to the private sector because of the government's crackdown on shadow banking, excessive leverage and growing non-performing loans. The change in the policy stance amounts to 'taking the foot off the brake' rather than pressing firmly on the accelerator.2 Third, and perhaps most importantly, the authorities may rely even more on the currency lever to do the heavy lifting if the economy continues to slow and/or the tariff war escalates further. This would be negative for commodity demand because a weaker RMB will make commodities dearer for Chinese producers. Metals prices are particularly at risk. China's competitors will also feel the sting of a cheaper RMB. It will be critical to watch the Chinese money and credit data in the coming months to gauge whether our view on the policy stimulus is correct. We will also be watching the combined credit and fiscal impulse which, at the moment, points to continued weakening in import growth in the near term (Chart I-5, bottom panel). Slower EM growth and/or more financial market turbulence is likely to take a larger toll on the euro area than the United States. Exports to emerging markets account for only 3.6% of GDP for the U.S., compared to 9.7% of GDP for the euro area. Euro area banks also have more exposure to emerging markets than U.S. banks (Chart I-6). Notably, Spanish banks - BBVA in particular - has sizable exposure to Turkey. Meanwhile, Italian assets have come under pressure as the rift between the European Commission and the new populist government widens and Italian banks become increasingly wary of financing their government. Chart I-6DM Bank Exposure To EM
September 2018
September 2018
European growth will therefore likely continue to trail that of the U.S. Our base case does not see euro area growth falling below a trend pace in the coming quarters, but relative growth momentum and the ongoing policy divergence will favor the dollar over the euro. FOMC: No Urgency The key message from the latest FOMC Minutes and Chairman Powell's Jackson Hole speech is that policymakers are sticking with the "gradual" approach to tightening, despite the late-cycle acceleration in economic growth. The blowout second-quarter GDP report supports the view that fiscal stimulus is stoking the economy at a time when there is little slack. Evidence that the labor market is overheating is not simply anecdotal anymore. In past cycles, an acceleration in growth at a time when inflation is already at target and unemployment is below estimates of full employment would have sparked aggressive Fed action. But the Minutes and Powell's speech revealed no sense of urgency. Powell made the case that the Fed must proceed carefully in an environment where there is much uncertainty about the level of the neutral policy rate, the natural rate of unemployment and the slope of the Phillips curve. Moreover, long-term inflation expectations are still hovering below a level that is consistent with meeting the 2% target over the medium term. Some FOMC policymakers believe that this fact justifies taking chances with an inflation overshoot in the coming quarters. Another reason for the FOMC to proceed cautiously is the wage picture, which is confusing even to economic experts because the official measures paint a mixed picture (Chart I-7). The Employment Cost Index for private sector workers continues to march higher. However, growth in compensation per hour, average hourly earnings (AHE) and unit labor costs have all eased a little this year. The Atlanta Fed Wage Tracker, one of the cleanest measures of wages, reveals an even more significant pullback. The softening in wage growth has been fairly widespread across age cohorts, educational attainment and regions, according to the Atlanta Fed data (Chart I-8). Part-time workers appear to be the only segment that has bucked the trend. It is not clear why workers in the 16-24 age group, as well as those with bachelor's degrees (of any age), have seen the most pronounced softening in wage growth this year. Chart I-7Mixed U.S. Wage Data
Mixed U.S. Wage Data
Mixed U.S. Wage Data
Chart I-8U.S. Wage Slowdown Broadly-Based
U.S. Wage Slowdown Broadly-Based
U.S. Wage Slowdown Broadly-Based
Which measure is telling the correct story: the ECI or the Atlanta Wage Tracker? Both are a relatively clean measure of wages and it is difficult to tell based on the relative merits of each index alone. Nonetheless, there is little doubt that the labor market is now very tight by historical standards. Small business owners' compensation plans remained near record levels in July, while concerns about the "quality of labor" have never been higher (Chart I-9). Chart I-10 shows that the ratio of the level of job openings to unemployed workers has surpassed the pre-recession level in all but one sector according to the Jolts survey. Indeed, in most cases this ratio is well above the previous peak. Unemployment is now below the estimated level of full-employment in more than 80% of U.S. states. Chart I-9U.S. Labor Shortage Is Growing
U.S. Labor Shortage Is Growing
U.S. Labor Shortage Is Growing
Chart I-10JOLTS Signals Very Tight Jobs Market
JOLTS Signals Very Tight Jobs Market
JOLTS Signals Very Tight Jobs Market
No Evidence Of U.S. Overheating? Labor shortages first appeared for skilled workers, helping to explain why highly-skilled workers have enjoyed the fastest wage gains in recent years. But this year's Fed Beige Books have noted that many businesses are now having trouble finding low- and middle-skilled workers, as listed in Table I-1. These industries roughly line up with the ones that reveal above-average growth in average hourly earnings, and with the ones where labor market tightness is the most acute according to the Jolts survey (second and third columns in the table). The shortages appear to be broadly based, ranging from truck transportation to financial services, manufacturing and construction. This makes it all the more curious that Chairman Powell finds that there is no evidence of overheating in the labor market. The evidence seems pretty conclusive to us and it even features in the Fed's own Beige Book. Keep in mind that inflation is not always the 'cost push' type, beginning in the labor market and traveling to consumer prices. Sometimes inflation can begin in the market for goods and services, and then affect wage demands. U.S. consumer price inflation appears to be headed higher based on the New York Fed's Underlying Inflation Gauge (Chart I-11). Our CPI diffusion index shows that inflation is accelerating in a majority of categories. Other measures of underlying inflation, such as the Sticky Price Index, the Trimmed Mean, and the Median inflation rate are all in a solid uptrend. Dollar strength this year will eventually put downward pressure on core goods inflation, but that will take some time; non-energy goods inflation is more likely to rise in the near term as it catches up to the previous acceleration in imported goods prices (Chart I-11, bottom panel). Table I-1Labor 'Shortages' Identified In The Beige Book
September 2018
September 2018
Chart I-11U.S. Underlying Inflation Is Rising
U.S. Underlying Inflation Is Rising
U.S. Underlying Inflation Is Rising
U.S. Inflation To Surprise On Upside We believe that the market is underestimating the risk of a meaningful inflation overshoot over the medium term. Investors still do not believe that the Fed will be able to consistently meet the 2% target over the long-term, based on CPI swaps and TIPS breakeven rates. BCA's Chief Global Strategist, Peter Berezin, penned a two-part Special Report in August on the potential for upside inflation surprises over the coming years.3 First, increasing political pressure on the major central banks is worrying. Second, policymakers are coming around to the idea that there may be an exploitable trade-off between higher inflation and lower unemployment. This was a mistake last made in the inflationary 1970s. Finally, the pressure to keep monetary policy accommodative until the "whites of the eyes" of inflation are visible will remain strong. Bonds are in for some trouble if we are correct on the inflation outlook. We recommend that investors with a 6-12 month investor horizon remain short in duration and overweight TIPS versus conventional Treasurys. That said, we cannot rule out a flight-to-quality episode at some point, possibly reflecting trade tensions and/or EM turmoil, which would send Treasury yields temporarily lower. The Fed may be forced to place rate hikes on hold if financial conditions tighten too quickly. No Margin Peak Yet In The U.S.... The S&P 500 was unfazed by the turmoil in emerging markets and the re-widening in Italian bond spreads in August, likely because of continuing good news on the profit front. Corporate earnings remained in a sweet spot in the second quarter. Nominal GDP grew by a whopping 5.4% from a year ago, helping to boost the top line for the corporate sector. The lagged effect of previous dollar depreciation is still flattering earnings, although this only accounts for about two percentage points according to our model (Chart I-12). Meanwhile, equity buybacks have kicked into overdrive (Chart I-13). Chart I-12U.S. Dollar Impact On EPS Growth
U.S. Dollar Impact On EPS Growth
U.S. Dollar Impact On EPS Growth
Chart I-13U.S. Equity Buyback In Overdrive
U.S. Equity Buyback In Overdrive
U.S. Equity Buyback In Overdrive
Margins continued their impressive ascent in the second quarter to well above the pre-Lehman peak (Chart I-14). A lot of the increase is related to the tax cuts; EBITDA margins are still substantially below the 2007 peak according to the S&P data. It is disconcerting that all of the surge in S&P 500 margins is due to the Tech sector (Chart I-14, bottom panel). Excluding Tech, S&P after-tax margins have simply moved sideways since 2010. Looking ahead, the tailwind from previous dollar depreciation will shift to a headwind by mid-2019. Chart I-12 shows that the contribution from changes in the dollar to EPS growth will shift from a positive two percentage points to a drag of 1½ percentage points if the dollar is flat from today's level in broad trade-weighted terms. If the dollar rises by another 5% this year, then next year's drag on EPS growth will reach three percentage points. Moreover, the impact of the tax cuts on after-tax profits will fade next year. Wage pressures are building and this should eventually squeeze profit margins. That said, a margin peak does not appear to be imminent. Last month we introduced some macro indicators for profit margins (Chart I-15). Most appeared to be rolling over a month ago, but they have all since ticked up. Chart I-14Tech And Taxes Driving Profit Margins
Tech And Taxes Driving Profit Margins
Tech And Taxes Driving Profit Margins
Chart I-15U.S. Margin Indicators Have Turned Up
U.S. Margin Indicators Have Turned Up
U.S. Margin Indicators Have Turned Up
The bottom line is that we continue to expect a mean reversion in U.S. profit margins in the coming years, but this is not a risk for at least the rest of 2018. ...But Profit Outlook Darkening In Japan Second quarter earnings season was also a good one for Japanese companies. Twelve-month forward earnings estimates have been in a steep incline and margins have been rising (Chart I-16). Despite this, the Nikkei has only managed to move sideways this year in local currency terms. Concerns over trade and global growth have perhaps weighed on Japanese stock performance. Company profits have a high beta with respect to global growth. Things are looking shaky on the domestic front too. Domestic demand growth is decelerating, consistent with a weakening Economy Watcher's Survey. Some of the weakness may be related to poor weather, but the LEI suggests that this trend will continue in the coming quarters (Chart I-17, bottom panel). Chart I-16Japan: Trailing Earnings Are Solid...
Japan: Trailing Earnings Are Solid...
Japan: Trailing Earnings Are Solid...
Chart I-17...But Profit Margins Will Narrow
...But Profit Margins Will Narrow
...But Profit Margins Will Narrow
Chart I-17 presents some of the variables that have helped to explain historical trends in Japanese EPS. Industrial production growth, a good proxy for top line growth, is decelerating. Nominal GDP growth has fallen to just 1.1% year-over-year, at a time when total labor compensation has surged by more than 4%. The difference between these two, a proxy for profit margins, has therefore plunged. Previous shifts in the yen have not had a large impact on EPS growth over the past year and we do not expect that to change much in 2019. On a positive note, Japanese stocks are attractively valued now that the 12-month forward P/E ratio has fallen below 13 (Chart I-16, bottom panel). It is also constructive that the Bank of Japan is the only central bank that is not backing away from monetary stimulus. The recent widening of the trading band for the 10-year JGB yield was a technical change meant to give the central bank more flexibility, not a signal that policymakers are planning to change tack. Nonetheless, we believe that earnings growth and margins will disappoint market expectations over the next year. The story is much the same for the Eurozone. Both trailing and forward profit margins have been in a strong uptrend. Twelve-month forward EPS growth has been holding at a solid 9%. Nonetheless, the data that feed into our Eurozone profit model point to some softening ahead, including industrial production and the difference between nominal GDP and the aggregate wage bill (not shown). The Eurozone's credit impulse turned negative even before concerns about EM and Italian politics exploded onto the scene. Thus, home-grown profit generation is likely to moderate along with foreign-sourced earnings. For the moment, the BCA House View remains at benchmark on Japanese and Eurozone stocks in currency-hedged terms. In unhedged terms, we prefer the U.S. market to these other bourses because of our bullish dollar bias. Investment Conclusions: Two key issues will remain important drivers of global financial markets in the coming months and quarters: the direction of the dollar and Chinese policy stimulus. We believe that the U.S. dollar has additional upside potential due to growth and policy divergences. There is some speculation in the financial community that President Trump might resort to currency intervention. However, any intervention would be sterilized by the Fed. The only way to shift currencies on a sustained basis would be to organize a coordinated change in monetary or fiscal policies among the U.S. and its main trading partners. This is highly unlikely. Thus, the path of least resistance is up for the U.S. dollar. Dollar strength is exposing poor macro fundamentals in many emerging market economies. The problems facing EM economies run deep, and will not disappear anytime soon because high debt levels make these economies vulnerable to any weakness in global growth, commodity prices or global liquidity conditions. EM financial market turmoil could cause the Fed tightening campaign to go on hold, but this would require evidence that the former is negatively affecting the U.S. economy and/or financial markets. In other words, we need to see some pain before the Fed blinks. Chinese stimulus is a risk to our base-case EM outlook. Policy stimulus might keep the RMB from weakening further, boost commodity prices and support EM exports. This would not change the EM debt situation, but would at least give emerging economies a temporary reprieve. Careful analysis suggests that Chinese stimulus will not be a 'game changer', and might even cause problems if the authorities push the RMB lower. But it will be critical to monitor the next couple of money and credit reports. The U.S. economy and financial system are less exposed to further EM turmoil than in the Eurozone. But as the LTCM event demonstrated in 1998, the U.S. is not immune. Moreover, U.S. equity prices are more expensive than they were during previous EM selloffs that have occurred since the Great Recession. This could mean a larger equity re-rating on any flight-to-quality. This is not to say that we expect a bear market in DM risk assets to get underway in the near future. A U.S./global recession before 2020 is unlikely. Nonetheless, the risk of a meaningful correction is elevated enough that caution is warranted, especially at a time when all risk assets appear expensive. Chart I-18 updates our valuation measures for some major asset classes. All appear to be expensive, especially U.S. equities, raw materials and gold. EM sovereigns and equities are at the cheaper end of the spectrum, but are still not cheap in absolute terms even after the recent selloff. Chart I-18Major Asset Valuation Comparison
September 2018
September 2018
Treasurys rallied briefly after Chairman Powell signaled that he is not willing to accelerate the pace of rate hikes in light of the U.S. economy's growth acceleration. He is willing to wait until he sees the "whites of the eyes" of inflation before becoming alarmed, almost ensuring that the FOMC will fall behind the inflation curve. Bond yields will rise as the FOMC tries to catch up and long-term inflation expectations bounce. Over the medium term, we believe that investors are underestimating the upside in U.S. inflation risks. We recommend below-benchmark duration, although bonds may temporarily rally if EM turbulence sparks a flight-to-quality. We still expect the supply/demand balance in the world oil market to tighten later this year. Stay positioned for higher oil prices. Finally, as we go to press, the U.S. is trying to force Canada to sign on to the U.S./Mexico 'agreement in principal' by August 31. A framework deal with Canada would likely leave many tough issues unresolved. There is also a chance that Canada misses the deadline and that the existing trilateral deal will not survive. It is technically possible that Canada's refusal to join the U.S.-Mexico bilateral deal will delay its ratification well into next year. In the meantime, Trump could raise the stakes for Canada by boosting tariffs on Canadian autos and/or by suspending NAFTA altogether. As a result, we decided to go ahead and publish our Special Report on U.S. equity sector implications if NAFTA is not ratified and tariffs rise to WTO levels. The report begins on page 20. Mark McClellan Senior Vice President The Bank Credit Analyst August 30, 2018 Next Report: September 27, 2018 1 Please see BCA Emerging Market Strategy Weekly Report "What's Really Driving The EM Selloff?"dated June 28, 2018, available on ems.bcaresearch.com 2 Please see BCA China Investment Strategy Weekly Report "China is Easing Up On The Brake, Not Pressing The Accelerator," dated July 26, 2018, available on cis.bcaresearch.com 3 Please see BCA Global Investment Strategy Special Reports: "1970s-Style Inflation: Could It Happen Again? Parts I and II," dated August 10 and 24, 2018, available on gis.bcaresearch.com II. What If NAFTA Is Not A Done Deal? U.S. Equity Implications This Special Report examines the impact of a NAFTA cancelation on 21 level-three GICs industries. While the latest news on the NAFTA renegotiation with Mexico is positive as we go to press, there is still a non-negligible risk that the existing trilateral deal will not survive. The U.S.-Mexico bilateral deal is an "agreement in principle" and will take time to ratify. Meanwhile, a framework deal with Canada would leave many thorny issues to be resolved. President Trump can still revert to his tough tactics on Canada ahead of the U.S. mid-term elections. If the President does not gain major concessions that can be presented as "victories" to voters, he is likely to take an aggressive stand in order to fire up his political base. The probability of Trump triggering Article 2205 and threatening to walk away from the suspended U.S.-Canada free trade agreement is still not trivial, despite the deal with Mexico. By itself, the cancelation of NAFTA would not be devastating for any particular U.S. industry because the size of the tariff increases would be fairly small as long as all parties stick with MFN tariff levels. That said, the impact would not be trivial, especially for those industries that have extensive supply lines that run between the three countries involved (especially Autos). We approached the issue from four different perspectives; international supply chains, a model-based approach, and an analysis of foreign revenue exposure and input cost exposure. The broad conclusion is that there are no winners from a NAFTA cancelation for the U.S. manufacturing GICs industries. Pharmaceuticals, Health Care Equipment & Supplies, Personal Products and Construction Materials are lower on the risk scale, but cannot be considered beneficiaries of a NAFTA collapse. The remaining industries are all moderately-to-highly exposed. Considering the four perspectives as a group, the most vulnerable industries are Automobiles, Automobile Components, Metals & Mining, Food Products, Beverages, and Textiles & Apparel. Our U.S. equity sector specialists recommend overweight positions in Defense and Financials; while neither stands to benefit from a NAFTA abrogation, they should at least be relative outperformers. They recommend underweight positions on Auto Components, Steel and Electrical Components & Equipment as relative (and probably absolute) underperformers should NAFTA disappear. While the latest news on the renegotiation of the North American Free Trade Agreement (NAFTA) is positive as we go to press, there is still a non-negligible risk that President Trump could revert to his tough tactics ahead of the U.S. mid-term elections.1 Even if Canada signs on to a framework deal, a lot of thorny details will have to be worked out. A presidential proclamation triggering Article 2205 of the NAFTA agreement (as opposed to tweeting that the U.S. will withdraw) would initiate a six-month "exit" period. Trump could use this deadline, and the threat of canceling the underlying U.S.-Canada FTA, to put pressure on Canada (if not Mexico) to concede to U.S. demands, just as he could revoke his exit announcement anytime within the six-month period. While some market volatility would ensue upon any exit announcement, even a total withdrawal at the end of the six months would have a limited macro-economic impact as long as the U.S. continued to respect its WTO commitments and lifted tariffs only to Most Favored Nation (MFN) levels. Nonetheless, a modest tariff hike is not assured given the Administration's "America First" policy, its looming threat of Section 232 tariffs on auto imports, its warnings against the WTO itself, and the steep tariffs it has already imposed on Canada, including a 20% tariff on softwood lumber and the 300% tariff on Bombardier CSeries jets. Moreover, even a small rise in tariffs to MFN levels would have a significant negative impact on industries that are heavily integrated across borders. Our first report on the evolving U.S. trade situation analyzed the implications of the U.S.-China trade war for the 24 level two U.S. GICs equity sectors. This Special Report examines the impact of a NAFTA cancelation on 21 level three GICs industries (finer detail is required since NAFTA covers mostly goods industries). We find that there are no "winners" among the U.S. equity sectors because the negative impact would outweigh any positive effects. The hardest hit U.S. industries would be Autos, Metals & Mining, Food Products, Beverages, and Textiles and Apparel, but many others are heavily exposed to a failure of the free trade agreement. Out Of Time President Trump is seeking a new NAFTA deal ahead of the U.S. midterms in November. While this timing may yet prove too ambitious, the U.S. has made progress in recent bilateral negotiations with Mexico, raising the potential that Trump will be able to tout a new NAFTA framework deal by November 6. Yet, investors should be prepared for additional volatility. There are technical issues with the bilateral U.S.-Mexico deal that could delay ratification in Congress until mid-2019. The new Mexican Congress must ratify the deal by December 1 if outgoing President Enrique Peña Nieto is to sign off. Otherwise, the incoming Mexican President Andrés Manuel López Obrador may still want to revise any deal he signs, prolonging the process. Meanwhile, it would be surprising if the Canadians signed onto a U.S.-Mexico deal they had no part in negotiating without insisting on any adjustments.2 The important point is that President Trump's economic and legal constraints on withdrawing from NAFTA have fallen even further with the Mexican deal. If Trump does not get major concessions that can be presented as "victories" to voters, he is likely to take an aggressive stand in order to fire up his political base, as a gray area of "continuing talks" will not inspire voters. This could mean imposing the threatened auto tariffs or threatening to cancel the existing trade agreements with Canada. Thus, the risk of Trump triggering Article 2205 is still not trivial. A bilateral Mexican trade deal is not the same as NAFTA. Announcing withdrawal automatically nullifies much of the 1993 NAFTA Implementation Act. Some provisions of NAFTA under this act may continue, but the bulk would cease to have effect, and the White House could refuse to enforce the rest. The potential saving grace for trade with Canada was that the Canada-U.S. Free Trade Agreement (CUSFTA), which took effect in 1989, was incorporated into NAFTA. The U.S. and Canada agreed to suspend CUSFTA's operation when NAFTA was created, but the suspension only lasts as long as NAFTA is in effect. However, Trump may walk away from both CUSFTA and NAFTA in the same proclamation. In that event, WTO rules for preferential trade would require the U.S. and Canada to raise tariffs on trade with each other to Most Favored Nation (MFN) levels. These tariff levels are shown in Charts II-1A and II-1B. The Charts also show the maximum tariff that could potentially be applied under WTO rules. The latter are much higher than the MFN levels, underscoring that the situation could get really ugly if a full trade war scenario somehow still emerged among these three trading partners. Chart II-1AU.S.: MFN Tariff Rates By GICS Industry (2017)
September 2018
September 2018
Chart II-1BMexico & Canada: MFN Tariff Rates By GICS Industry (2017)
September 2018
September 2018
Current tariffs are set at zero for virtually all of these GICs industries, which means that the MFN levels also indicate how much tariffs will rise at a minimum if NAFTA is cancelled. Tariffs would rise the most for Automobiles, Textiles & Apparel, and Food Products (especially agricultural products), and Beverages. U.S. tariffs under the WTO are not significantly higher than NAFTA's rates; the average MFN tariff in 2016 was 3½%, which compares to 4.1% for the average Canadian MFN tariff. Would MFN Tariffs Be Painful? An increase in tariff rates of 3-4 percentage points may seem like small potatoes. Nonetheless, even this could have an outsized impact on some industries because tariffs are levied on trade flows, not on production. A substantial amount of trade today is in intermediate goods due to well-integrated supply chains. Charts II-2A and II-2B present a measure of integration. Exports and imports are quite large relative to total production in some industries. The most integrated U.S. GICs sectors include Automobiles & Components, Materials, Capital Goods and Electrical & Optical Equipment. Higher tariffs would slam those intermediate goods that cross the border multiple times at different stages of production. For example, studies of particular automobile models have found that "parts and components may cross the NAFTA countries' borders as many as eight times before being installed in a final assembly in one of the three partner countries."3 Tariffs would apply each time these parts cross the border if NAFTA fails. Chart II-2AU.S./Canada Supply Chain Integration
September 2018
September 2018
Chart II-2BU.S./Mexico Supply Chain Integration
September 2018
September 2018
Appendix Tables II-1 to II-4 show bilateral trade by product between the U.S. and Canada, and the U.S. and Mexico. In 2017, the U.S. imported almost $300b in goods from Canada, and exported $282b to that country, resulting in a small U.S. bilateral trade deficit. The bilateral deficit with Mexico is larger, with $314b in U.S. imports and $243b in exports. The largest trade categories include motor vehicles, machinery, and petroleum products. Telecom equipment and food products also rank highly. As mentioned above, the impact of rising tariffs is outsized to the extent that a substantial portion of trade in North America is in intermediate goods. Box II-1 reviews the five main channels through which rising tariffs can affect U.S. industry. Box II-1 Trade Channels There are at least five channels through which rising tariffs can affect U.S. industry: (1) The Direct Effect: This can be positive or negative. The impact is positive for those industries that do not export much but are provided relief from stiff import competition via higher import tariffs. The impact is negative for those firms facing higher tariffs on their exports, as well as for those firms facing higher costs for imported inputs to their production process. These firms would be forced to absorb some of import tariffs via lower profit margins. Some industries will fall into both positive and negative camps. U.S. washing machines are a good example. Whirlpool's stock price jumped after President Trump announced an import tariff on washing machines, but it subsequently fell back when the Administration imposed an import tariff on steel and aluminum (that are used in the production of washing machines). NAFTA also eliminated many non-tariff barriers, especially in service industries. Cancelling the agreement could thus see a return of these barriers to trade; (2) Indirect Effect: The higher costs for imported goods are passed along the supply chain within an industry and to other industries that are not directly affected by rising tariffs. This will undermine profit margins in these indirectly-affected industries to the extent that they cannot fully pass along the higher input costs. There would also be a loss of economies-of-scale and comparative advantage to the extent that firms are no longer able to use an "optimal" supply network that crosses borders, further raising the cost of doing business; (3) Foreign Direct Investment: Some U.S. imports emanate from U.S. multinationals' subsidiaries outside the U.S., or by foreign OEM suppliers for U.S. firms. NAFTA eliminated many national barriers to FDI, expanded basic protections for companies' FDI in other member nations, and established a dispute-settlement procedure. The Canadian and Mexican authorities could make life more difficult for those U.S. firms that have undertaken significant FDI in retaliation for NAFTA's cancellation; (4) Macro Effect: The end of NAFTA, especially if it were to lead to a trade war that results in tariffs in excess of the MFN levels, would take a toll on North American trade and reduce GDP growth across the three countries. Besides the negative effect of uncertainty on business confidence and, thus, capital spending, rising prices for both consumer and capital goods will reduce the volume of spending in both cases. Moreover, corporate profits have a high beta with respect to economic activity. The macro effect would probably not be large to the extent that tariffs only rise to MFN levels; (5) Currency Effect: To the extent that a trade war pushes up the dollar relative to the Canadian dollar and Mexican peso, it would undermine export-oriented industries and benefit those that import. However, while we are bullish the dollar due to diverging monetary policy, the dollar may not benefit much from trade friction given that tariffs would rise for all three countries. Chart II-3 is a scatter chart of GICs industries that compares the average MFN tariff on U.S. imports to the average MFN tariff on Canadian and Mexican imports from the U.S. A U.S. industry may benefit if it garners significant import protection but does not face a higher tariff on its exports to the other two countries. Unfortunately, there are no industries that fall into the north-west portion of the chart. The opposite corner, signifying low import protection but high tariffs on exports, includes Beverages, Household Durables, Household Products, Personal Products and Machinery. Chart II-3Import And Export Tariffs Faced By U.S. GICS Industries
September 2018
September 2018
Model-Based Approach The C.D. Howe Institute has employed a general equilibrium model to estimate the impact of a NAFTA failure at the industrial level.4 The model is able to capture the impact on trade conducted through foreign affiliates. The study captures the direct implications of higher tariffs, but also includes a negative shock to business investment that would stem from heightened uncertainty about the future of market access for cross-border trade. It also takes into consideration non-tariff barriers affecting services. Table II-1Impact Of NAFTA Cancellation By Industry
September 2018
September 2018
As with most studies of this type, the Howe report finds that the level of GDP falls by a relatively small amount relative to the baseline in all three countries - i.e. there are no winners if NAFTA goes down. Moreover, the U.S. is not even able to reduce its external deficit. While the trade barriers trim U.S. imports from NAFTA parties by $60b, exports to Canada and Mexico fall by $62b. At the industry level, the model sums the impacts of the NAFTA shock on imports, exports and domestic market share to arrive at the estimated change in total shipments (Table II-1). It is possible that an industry will enjoy a boost to total shipments if a larger domestic market share outweighs the damage to exports. However, the vast majority of U.S. industries would suffer a decline in total shipments according to this study, because the estimated gain in domestic market share is simply not large enough. Beef, Pork & Poultry and Dairy would see a 1-2% drop in total shipments relative to the baseline forecast. Next on the list are textiles & apparel, food products and automotive products. Even some service industries suffer a small decline in business, due to indirect income effects. Foreign-Sourced Revenue And Input Cost Approach Another way to approach this issue is to identify the U.S. industries that garner the largest proportion of total revenues from Mexico and Canada. Unfortunately, few companies provide much country detail on where their foreign revenues are derived. Many simply split U.S. and non-U.S. revenues, or North American and non-North American revenues. Table II-2 presents the proportion of total revenues that is generated from operations outside the U.S. for the top five companies in the industry by market cap (in some cases the proportion that is generated outside of North America was used as a proxy for foreign- sourced revenues). While this approach is not perfect, it does provide a good indication of how exposed a U.S. industry is to Canada and Mexico. This is because any company that has "gone global" will very likely be doing substantial business in these two countries. Table II-2Foreign Revenue Exposure
September 2018
September 2018
At the top of the list are the Metals & Mining, Personal Products, and Auto Component industries. Between 62% and 81% of revenues in these three industries is derived from foreign sources. Following that is Household Durables, Leisure Products, Chemicals and Tobacco. Indeed, all of the level three GICs industries we are analyzing are moderately-to-highly globally-oriented, with the sole exception of Construction Materials. Table II-3Import Tariff Exposure
September 2018
September 2018
U.S. companies are also exposed to U.S. tariffs that boost the price of imported inputs to the production process. This can occur directly when firm A imports a good from abroad, and indirectly, when firm A then sells its intermediate good to firm B at a higher price, and then on to firm C. In order to capture the entire process, we used the information contained in the Bureau of Economic Analysis' Input/Output tables. We estimated the proportion of each industry's total inputs that would be affected by a rise in tariffs to MFN levels. We then allocated the industries contained in the input/output tables to the 21 GICs level 3 industries we are considering, in order to obtain an import exposure ranking in S&P industry space (Table II-3). All 21 industries are significantly vulnerable to rising input costs, which is not surprising given that we are focusing on the manufacturing-based GICs industries and NAFTA focused on trade in goods. The vast majority of the industries could face a cost increase on 50% or more of their intermediate inputs to the production process. The Automobile industry is at the top of the list, with 72% of its intermediate inputs potentially affected by the shift up in tariffs (Automobile Components is down the list, at 56%). Containers & Packaging, Oil & Gas, Aerospace & Defense, Textiles and Food Products are also highly exposed to tariff increases. The automobile industry is a special case because of the safeguards built into NAFTA regarding rules-of-origin and the associated tracing list. The U.S. is seeking significant changes in both in order to tilt the playing field toward U.S. production, but this could severely undermine the intricate supply chain linking the three countries. Box II-2 provides more details. Box II-2 Automotive Production In NAFTA; Update Required We are focused on two key aspects to the renegotiation of the NAFTA rules that could have far reaching implications for automakers and the auto component maker supply base: the tracing list and country of origin rules. Regarding the first of these, the Trump administration has a legitimate gripe when it comes to automotive production. A tracing list was written in the early-1990's to define automotive components such that the rules of origin (ROO) could be easily met; anything not on the list is deemed originating in North America. As anyone who has driven a vehicle of early-1990's vintage and one of late-2010's vintage can attest, high tech components (largely not included on the tracing list) have grown exponentially as a percentage of the cost of the vehicle and, at least with respect to electronic and display components, are sourced mostly from overseas. Updating the tracing list would force auto makers to source a significantly greater amount of components domestically, almost certainly raising the cost of the vehicle and either hurting margins or hurting competitiveness through higher prices. The current NAFTA ROO require that 62.5% of the content of a vehicle must be sourced in North America, with no distinction between any of the member nations. The result of this legislation has been the creation of a highly integrated supply base that sees components move back and forth across borders through each stage of the manufacturing process. Early proposals from the Trump administration for a NAFTA rework included a country of origin provision for as much as 50% U.S. content. Such a provision would certainly cause a massive disruption in the automotive supply chain with components manufacturers forced to relocate or automakers electing to source overseas and pay the 2.5% MFN tariff on exports within North America. Either scenario presents a headwind to the tightly woven auto components base, underscoring BCA's U.S. Equity Strategy's underweight recommendation on the sector. The recently announced bilateral trade deal with Mexico raises the ROO content requirements to 75% from the 62.5% contemplated under NAFTA but, importantly, no country of origin provisions appear in the new deal. Still, given how quickly this is evolving, a final NAFTA deal could be significantly different. Chart II-4 presents a scatter diagram that compares import tariff exposure (horizontal axis) with foreign revenue exposure (vertical axis). The industries in the north-east corner of the diagram are the most exposed to NAFTA failure. The problem is that there are so many in this region that it is difficult to choose the top two or three, although Metals & Mining stands out from the rest. It is easier to identify the industries that face less risk in relative terms: Pharmaceuticals, Construction Materials, Health Care & Supplies, Leisure Products and, perhaps, Machinery. The rest rank highly in terms of both foreign revenue exposure and import tariff exposure. Chart II-4Foreign Revenue And Import Tariff Exposure
September 2018
September 2018
Conclusions: By itself, a total cancelation of NAFTA would not be devastating for any particular U.S. industry because the size of the tariff increases would be fairly small as long as all parties stick with MFN tariff levels. That said, the impact would not be trivial, especially for those industries that have extensive supply lines that run between the three countries involved. The negative impact on GDP growth would likely be worse for Canada (and Mexico if its bilateral somehow fell through), but U.S. exporters would see some loss of business. We approached the issue from four different perspectives; international supply chains, a model-based approach, and an analysis of foreign revenue exposure and import tariff exposure. The broad conclusion is that there are no winners from a NAFTA cancelation for the U.S. manufacturing GICs industries. Pharmaceuticals, Health Care Equipment & Supplies, Personal Products and Construction Materials are lower on the risk scale, but cannot be considered beneficiaries of a NAFTA collapse. The remaining industries are all moderately-to-highly exposed. Considering the four perspectives as a group, the most vulnerable industries are Automobiles, Automobile Components, Metals & Mining, Food Products, Beverages, and Textiles & Apparel. Our U.S. equity sector specialists recommend overweight positions in Defense and Financials; while neither stands to benefit from a NAFTA abrogation, they should at least be relative outperformers. They recommend underweight positions on Auto Components, Steel and Electrical Components & Equipment as relative (and probably absolute) underperformers should NAFTA disappear. As we go to press, rapid developments are taking place in the NAFTA negotiations. The U.S. and Mexico have completed a bilateral agreement in principle and a Canadian team is looking into whether to sign onto the agreement by a U.S.-imposed August 31 deadline. This deadline would enable the current U.S. Congress to proceed to ratification before turning over its seats in January, though it is not a hard deadline. It is possible that the negotiations will conclude this week and the crisis will be averted. But the lack of constraints on President Trump's trade authority gives reason for pause. If Canada demurs, Trump could move to raise the cost through auto tariffs or announcements that he intends to withdraw from existing U.S.-Canada agreements in advance of November 6. While Mexico has now tentatively secured bilaterals with both countries through the new U.S. deal and the Trans-Pacific Partnership (which includes Canada), it still stands to suffer if a trilateral agreement is not in place. Moreover it is technically possible that Canada's refusal to join the U.S.-Mexico bilateral could delay the latter's ratification well into next year. Therefore, we treat Mexico the same as Canada in our analysis, despite the fact that Mexican assets stand to benefit in relative terms from having a floor put under them by the Trump Administration's more constructive posture and this week's framework deal. If Trump does not pursue a hard line with Canada, then it will be an important sign that he is adjusting his trade policy to contain the degree of confrontation with the developed nations and allies and instead focus squarely on China, where we expect trade risks to increase in the coming months. Mark McClellan Senior Vice President The Bank Credit Analyst Matt Gertken Associate Vice President Geopolitical Strategy Chris Bowes Associate Editor U.S. Equity Strategy APPENDIX TABLE II-1 U.S. Imports From Canada (2017)
September 2018
September 2018
APPENDIX TABLE II-2 U.S. Exports To Canada (2017)
September 2018
September 2018
APPENDIX TABLE II-3 U.S. Imports From Mexico (2017)
September 2018
September 2018
APPENDIX TABLE II-4 U.S. Exports To Mexico (2017)
September 2018
September 2018
1 Please see BCA Geopolitical Strategy Special Report, "A Mexican Standoff - Markets Vs. AMLO," dated June 28, 2018, and Weekly Report, "Are You 'Sick Of Winning' Yet?" dated June 20, 2018, available at gps.bcaresearch.com 2 Please see BCA Geopolitical Strategy and Global Investment Strategy Special Report, "NAFTA - Populism Vs. Pluto-Populism," dated November 10, 2017, available at gps.bcaresearch.com 3 Working Together: Economic Ties Between the United States and Mexico. Christopher E. Wilson, November 2011. 4 The NAFTA Renegotiation: What if the U.S. Walks Away? The C.D. Howe Institute Working Paper. November 2017. III. Indicators And Reference Charts Our equity indicators continue to signal that caution is warranted, but U.S. profits have been so strong recently as to dominate any negative market forces. Our Monetary Indicator is hovering at a low level by historical standards, suggesting that liquidity conditions have tightened. It is constructive that our Composite Technical Indicator has hooked up, narrowly avoiding a technical break below the zero line. It is also positive that our Composite Sentiment Indicator is rising, but not yet to a level that would signal trouble for stocks from a contrary perspective. However, our U.S. Willingness-to-Pay (WTP) indicator continues to erode, and the Japanese WTP appears to be rolling over. The WTP indicators track flows, and thus provide information on what investors are actually doing, as opposed to sentiment indexes that track how investors are feeling. Flows into the U.S. stock market are waning, and those into the Japanese market are wavering. Flows into European stocks have flattened off. Moreover, our Revealed Preference Indicator (RPI) for stocks remained on a 'sell' signal in August. The RPI combines the idea of market momentum with valuation and policy measures. It provides a powerful bullish signal if positive market momentum lines up with constructive signals from the policy and valuation measures. Conversely, if constructive market momentum is not supported by valuation and policy, investors should lean against the market trend. These indicators are not aligned at the moment, further supporting the view that caution is warranted. Our indicators thus suggest that the underlying health of the U.S. equity bull market is fraying at the edges. Nonetheless, robust U.S. profits figures have sparked a euphoric late-cycle blow-off phase. The net revisions ratio is still in positive territory, and the net earnings surprises index has surged to an all-time high. Not much has changed on the U.S. Treasury front. The 10-year bond is slightly on the cheap side according to our model, and oversold conditions have not yet been worked off. This month's Overview section discusses the potential for upside inflation surprises in the U.S. that will place the FOMC "behind the curve". The term premium and long-term inflation expectations are still too low. This year's dollar rally has taken it to very expensive levels according to our purchasing power parity estimate. The long-term trend in the dollar is down, but economic and policy divergences vis-à-vis the U.S. and the other major economies suggests that the dollar is likely to continue moving higher in the near term. EQUITIES: Chart III-1U.S. Equity Indicators
U.S. Equity Indicators
U.S. Equity Indicators
Chart III-2Willingness To Pay For Risk
Willingness To Pay For Risk
Willingness To Pay For Risk
Chart III-3U.S. Equity Sentiment Indicators
U.S. Equity Sentiment Indicators
U.S. Equity Sentiment Indicators
Chart III-4Revealed Preference Indicator
Revealed Preference Indicator
Revealed Preference Indicator
Chart III-5U.S. Stock Market Valuation
U.S. Stock Market Valuation
U.S. Stock Market Valuation
Chart III-6U.S. Earnings
U.S. Earnings
U.S. Earnings
Chart III-7Global Stock Market And Earnings: ##br##Relative Performance
Global Stock Market And Earnings: Relative Performance
Global Stock Market And Earnings: Relative Performance
Chart III-8Global Stock Market And Earnings: ##br##Relative Performance
Global Stock Market And Earnings: Relative Performance
Global Stock Market And Earnings: Relative Performance
FIXED INCOME: Chart III-9U.S. Treasurys And Valuations
U.S. Treasurys And Valuations
U.S. Treasurys And Valuations
Chart III-10Yield Curve Slopes
Yield Curve Slopes
Yield Curve Slopes
Chart III-11Selected U.S. Bond Yields
Selected U.S. Bond Yields
Selected U.S. Bond Yields
Chart III-1210-Year Treasury Yield Components
10-Year Treasury Yield Components
10-Year Treasury Yield Components
Chart III-13U.S. Corporate Bonds And Health Monitor
U.S. Corporate Bonds And Health Monitor
U.S. Corporate Bonds And Health Monitor
Chart III-14Global Bonds: Developed Markets
Global Bonds: Developed Markets
Global Bonds: Developed Markets
Chart III-15Global Bonds: Emerging Markets
Global Bonds: Emerging Markets
Global Bonds: Emerging Markets
CURRENCIES: Chart III-16U.S. Dollar And PPP
U.S. Dollar And PPP
U.S. Dollar And PPP
Chart III-17U.S. Dollar And Indicator
U.S. Dollar And Indicator
U.S. Dollar And Indicator
Chart III-18U.S. Dollar Fundamentals
U.S. Dollar Fundamentals
U.S. Dollar Fundamentals
Chart III-19Japanese Yen Technicals
Japanese Yen Technicals
Japanese Yen Technicals
Chart III-20Euro Technicals
Euro Technicals
Euro Technicals
Chart III-21Euro/Yen Technicals
Euro/Yen Technicals
Euro/Yen Technicals
Chart III-22Euro/Pound Technicals
Euro/Pound Technicals
Euro/Pound Technicals
COMMODITIES: Chart III-23Broad Commodity Indicators
Broad Commodity Indicators
Broad Commodity Indicators
Chart III-24Commodity Prices
Commodity Prices
Commodity Prices
Chart III-25Commodity Prices
Commodity Prices
Commodity Prices
Chart III-26Commodity Sentiment
Commodity Sentiment
Commodity Sentiment
Chart III-27Speculative Positioning
Speculative Positioning
Speculative Positioning
ECONOMY: Chart III-28U.S. And Global Macro Backdrop
U.S. And Global Macro Backdrop
U.S. And Global Macro Backdrop
Chart III-29U.S. Macro Snapshot
U.S. Macro Snapshot
U.S. Macro Snapshot
Chart III-30U.S. Growth Outlook
U.S. Growth Outlook
U.S. Growth Outlook
Chart III-31U.S. Cyclical Spending
U.S. Cyclical Spending
U.S. Cyclical Spending
Chart III-32U.S. Labor Market
U.S. Labor Market
U.S. Labor Market
Chart III-33U.S. Consumption
U.S. Consumption
U.S. Consumption
Chart III-34U.S. Housing
U.S. Housing
U.S. Housing
Chart III-35U.S. Debt And Deleveraging
U.S. Debt And Deleveraging
U.S. Debt And Deleveraging
Chart III-36U.S. Financial Conditions
U.S. Financial Conditions
U.S. Financial Conditions
Chart III-37Global Economic Snapshot: Europe
Global Economic Snapshot: Europe
Global Economic Snapshot: Europe
Chart III-38Global Economic Snapshot: China
Global Economic Snapshot: China
Global Economic Snapshot: China
Mark McClellan Senior Vice President The Bank Credit Analyst
Highlights "When you come to a fork in the road, take it." - Yogi Berra The last time we invoked the great American philosopher Yogi Berra was in September 2015. Back then, the oil market was at a critical juncture, as the market-share war initiated by OPEC in November 2014 approached its dénouement.1 The signal feature of the oil market in September 2015 was a massive 1.5mm b/d oversupply that was rapidly filling storage globally. We noted this surplus "... either will be cleared gradually or convulsively. ... (H)igh-cost supply either will exit the market rationally ... or via sharp lurches toward cash-breakeven costs, as global inventories fill on the back of slowing demand in an oversupplied market. Either way, markets will balance." In the event, prices lurched sharply into the left tail of the distribution toward cash-breakevens, with Brent approaching $25/bbl in 1Q16 (vs. more than $100/bbl in mid-2014). Oil's at a critical juncture again. Only this time, prices are poised to push higher into the right tail of the distribution, ahead of the likely loss of 2mm b/d or more of exports on the back of U.S.-imposed sanctions against Iran, and the all-but-certain collapse of Venezuela's economy. In our modelling, these events - along with constrained U.S. shale oil output due to pipeline bottlenecks in the Permian basin, and still-strong demand assumptions - could send prices above $120/bbl.2 This is not a foregone conclusion, however. Downside risks to global oil demand - largely from tariffs and non-tariff barriers to trade, and the Fed's monetary policy - are building. In this Special Report, we expand our examination of downside risks to oil prices arising from divergent monetary policies at systematically important central banks, particularly their impacts on currency markets, which we began last week. Feature Chart of the WeekOil Prices And USD TWIB Share##BR##Long-Term Trend, Equilibrium
Oil Prices And USD TWIB Share Long-Term Trend, Equilibrium
Oil Prices And USD TWIB Share Long-Term Trend, Equilibrium
We strongly believe Fed policy will, once again, become a key variable in the evolution of oil prices, mostly via the FX markets. As a result, our regular monthly oil price forecast will be complemented by an additional component: our U.S. trade-weighted dollar (USD TWIB) forecast. In the current market, this is a downside scenario not a revised expectation. The FX simulation we describe below for prices hugs the lower boundary of the 95-percent confidence interval we use to situate our scenarios within. This will allow us to judge our expectation against market-cleared expectations. Our thesis that the USD's appreciation earlier this year would have a moderate effect on the evolution of oil prices - i.e., that supply-demand fundamentals would dominate this evolution - has been spot-on so far in 2018.3 This is largely due to OPEC 2.0's remarkable production discipline, and strong demand, particularly out of EM economies, which caused global inventories to draw, and kept the forward curves for Brent and WTI backwardated. 4 However, with the U.S. economy powering ahead - growing at a 3.1% rate in 1H18 - and, per our House view, the Fed continuing to lean into its rates-normalization policy, the USD will rise ~ 5% over the next year.5 We have shown in the past how important the USD can be for oil prices. Our oil financial model uses the USD as its main explanatory variable, and shows these variables are cointegrated in the long run - i.e. they share a common long-term trend and are in an equilibrium relationship (Chart of the Week). Consequently, forecasting the U.S. dollar is crucial step in our oil-price forecasting process. The Fed And Oil Prices As the Iran sanctions approach, OPEC 2.0 has indicated - not in a particularly clear manner - that it will be increasing production. While it appears the producer coalition will raise output slower than it previously led the market to believe, it is raising output.6 In addition, the U.S. Strategic Petroleum Reserve (SPR) also will be releasing 11mm barrels of oil over the October - November period. This short-term measure will help keep gasoline prices down going into the U.S. mid-term elections. While OPEC 2.0 calibrates the output required to offset the Iran-Venezuela supply-side risks, demand growth is being threatened by tariff and non-tariff barriers to trade, and the Fed's monetary policy.7 Between tariffs and U.S. monetary policy, we believe Fed policy trumps U.S. trade policy ... at least for now. Fed Policy Trumps Tariffs A lot of ink has been spilled on the Sino - U.S. trade war, but so far, the actual damage done to the $17 trillion global trading markets is trivial (Chart 2). Of course, this could quickly change if the U.S. and China step up their tit-for-tat tariffs and both plunge into an all-out trade war. Fed policy is neither trivial nor local: It is a global macro variable, largely because it impacts the U.S. dollar directly. This is important for EM economies, especially as it pertains to trade. We have shown EM imports and exports are exquisitely sensitive to the USD TWIB.8 This makes the USD TWIB particularly important to commodity markets, since most of the world's traded commodities are priced in USD and EM demand dominates global demand. When the Fed is tightening, the dollar appreciates, and commodities priced in USD become more costly ex-U.S. at the margin. This lowers demand for goods priced in USD. In addition, a stronger USD lowers the cost of production ex-U.S., which, again, at the margin, incentivizes supply growth, since commodity producers effectively arbitrage their local currency weakness by selling their output for USD. This supply-side effect is tempered somewhat by the degree to which commodity producers ex-U.S. are exposed to dollar strength in their input markets. For example, if a producer's production inputs are priced in USD - e.g., drilling services - its margins suffer, and output increases are constrained or nullified. The Fed is the only systematically important central bank we follow - the others being the ECB, BoJ and PBoC - implementing and executing an interest-rate normalization policy. This has supported USD strength against the systematically important currencies we follow, as well (Chart 3). Chart 2Tariffs Are A Less Threat To Global Growth ...
Re Oil Demand: Fed Policy Trumps Tariffs
Re Oil Demand: Fed Policy Trumps Tariffs
Chart 3Important Central Banks Keeping Policies Accommodative
Important Central Banks Keeping Policies Accommodative
Important Central Banks Keeping Policies Accommodative
The IMF is encouraging the ECB to maintain its accommodative policy, and the BoJ also is keeping its policy relatively loose.9 The BoJ is keeping policy on hold for now, and is guiding to no rate hikes until 2020. Our colleagues in BCA's FX and Fixed Income desks expect the BoJ to continue with its Yield Curve Control Strategy for the remainder of the year, and most of next year. The absence of monetary tightening will keep Japanese yields lower than other major central banks. The PBoC appears to have moved toward a more accommodative mode, in the wake of the Sino - U.S. trade war. We believe the PBoC will remain accommodative in terms of official lending rates to avoid too-fast a deceleration of the economy, largely because of high private debt levels.10 EM Trade Volumes And Oil Prices Against a largely accommodative backdrop ex-U.S., the USD TWIB appreciated ~5% y/y, while the JP Morgan Emerging Markets FX index dropped ~11% (Chart 4). In the wake of USD TWIB strength, EM trade volumes have held up reasonably well; but growth rates have been under pressure particularly in Central and Eastern Europe (Chart 5, bottom panel). This is being offset by a turn-around in the Middle East and Africa (third panel). Chart 4Fed Policy Drives USD Strength
Fed Policy Drives USD Strength
Fed Policy Drives USD Strength
Chart 5EM Trade Slowing, But Still Holding Up
Re Oil Demand: Fed Policy Trumps Tariffs
Re Oil Demand: Fed Policy Trumps Tariffs
Assuming the Fed maintains its existing course re policy-rate normalization, our Fed-policy models indicate the USD TWIB will continue to strengthen (Chart 6).11 On the flip side of that, EM currencies will continue to weaken (Chart 7). This will keep pressure on EM trade volumes, particularly the important import volumes. Over the next year, we expect continued slowing in trade volumes, although, on average, we still expect y/y growth (Chart 8). While growth is slowing in EM trade, the levels of trade will remain high, unless a full-blown global trade war erupts that literally forces trade to contract. Chart 6Fed Policy Will Propel USD TWIB Higher...
Fed Policy Will Propel USD TWIB Higher...
Fed Policy Will Propel USD TWIB Higher...
Chart 7... And Keep EM Currencies Weaker
... And Keep EM Currencies Weaker
... And Keep EM Currencies Weaker
Chart 8Downward Trend In EM Trade Will Continue As USD Strengthens ...
USD Strength Slows EM Trade Growth Downward Trend In EM Trade Will Continue As USD Strengthens ...
USD Strength Slows EM Trade Growth Downward Trend In EM Trade Will Continue As USD Strengthens ...
Strong USD, Weak EM Trade := Bearish Fed policy will strengthen the USD TWIB and weaken EM trade. These factors will tend to pull crude oil prices down, in and of themselves (Chart 9). We do not think these factors will dominate the evolution of crude oil prices over the next six months, however. That said, the current environment forces us to adapt our modelling procedure in order to account for the possible re-emergence of the USD as a key driver of oil prices. Going forward, our regular monthly oil price forecast will be complemented by our U.S. trade weighted dollar forecast.12 We will be rolling out our new oil-price forecasting models next month, when we update our supply-demand balances and price forecasts. For the immediate future, we continue to believe upside price risk dominates the oil market: The approaching U.S. sanctions against Iran and the all-but-certain collapse of Venezuela's economy could remove as much as 2mm b/d of exports from oil markets by next year, if not sooner. This would constitute an oil-price shock, pushing prices into the right tail of the price distribution, consistent with the modelling we've done for the past several months (Chart 10). Chart 9... Adding A Bearish Factor To##BR##The Evolution Of Brent, WTI Prices
Stronger USD, Slower EM Import Growth Bearish For Base Metals And Oil ... Adding A Bearish Factor To The Evolution Of Brent, WTI Prices
Stronger USD, Slower EM Import Growth Bearish For Base Metals And Oil ... Adding A Bearish Factor To The Evolution Of Brent, WTI Prices
Chart 10Upside Risks##BR##Still Dominate
Upside Risks Still Dominate
Upside Risks Still Dominate
We reiterate our conclusion from last week, however, that an oil-supply shock, coupled with slower EM trade growth ultimately will produce strong deflationary impulses. If markets avoid an oil supply shock, and if the Fed maintains its rates-normalization policy while the rest of the world's systemically important central banks remain accommodative, pressure will build on EM trade - and incomes - that reduces commodity demand, in line with lower aggregate demand from the EM economies. In either event, the Fed's rates-normalization policy most likely will have to turn accommodative to counter this. Robert P. Ryan, Senior Vice President Commodity & Energy Strategy rryan@bcaresearch.com Hugo Bélanger, Senior Analyst Commodity & Energy Strategy HugoB@bcaresearch.com 1 Please see our Special Report entitled "Oil Volatility To Stay Higher Longer," published September 17, 2015. It is available at ces.bcaresearch.com. 2 We have written at length regarding this possible price evolution. Please see, e.g., BCA's Commodity & Energy Strategy Weekly Reports from August 16 and August 2, 2018, entitled "OPEC 2.0 Sailing Close To The Wind," and "Calm Before The Storm In Oil Markets." Both are available at ces.bcaresearch.com. 3 For more details, please see Commodity & Energy Strategy Weekly Report published February 8, 2018, "OPEC 2.0 Vs. The Fed." It is available at ces.bcaresearch.com. 4 OPEC 2.0 is the name we coined for the producer coalition lead by the Kingdom of Saudi Arabia (KSA) and Russia. 5 In Jackson Hole last week, Fed Chair Jerome Powell gave a strong endorsement of the Fed's rates-normalization. Please see "Fed Chair Powell: further rate hikes best way to protect recovery," published by reuters.com August 24, 2018. 6 On a 4Q19 vs 4Q18 basis, we expect global oil supply to increase just over 1mm b/d, and for demand to rise 1.8mm b/d, leaving the market in a physical deficit in 2H18 and 2019. We expect Brent to average $70/bbl in 2H18 and $80/bbl in 2019. Please see our updated balances estimates and price forecasts in "OPEC 2.0 Sailing Close To The Wind," published August 16, 2018, by BCA Research's Commodity & Energy Strategy. It is available at ces.bcaresearch.com. 7 Our $80/bbl forecast for Brent crude next year - and the physical deficit we expect - implicitly assumes OPEC 2.0 either wants to keep the market relatively tight, which will force inventories to draw and backwardate the forward curves, or that it is pushing up against the limits of the production it can readily bring to market. 8 We most recently discussed this in our Commodity & Energy Strategy Weekly Report published August 23, 2018, "Trade, Dollars, Oil & Metals ... Assessing Downside Risk." It is available at ces.bcaresearch.com. 9 Please see Abdih, Yasser, Li Lin, and Anne-Charlotte Paret (2018), "Understanding Euro Area Inflation Dynamics: Why So Low for So Long?" published by the IMF this month. 10 Please see BCA Research's Global Fixed Income Strategy Weekly Report, "An R-Star Is Born," dated August 7, 2018, and Foreign Exchange Strategy Weekly Report, "Rhetoric Is Not Always Policy", dated July 27, 2018, available at gfis.bcaresearch.com and fes.bcaresearch.com. 11 We have a suite of models we use to forecast the USD TWIB, many of which use proxies for the Fed's Congressionally mandated policy goals - i.e., maximum employment, stable prices and moderate long-term interest rates. We use cointegrating regressions to estimate these policy-driven models. The R2 coefficients of determination for the models are clustered around 0.95. The out-of-sample results are strong; we use a weighted-average of the five forecasts based on root-mean-square errors to come up with our USD TWIB forecast. We presented our policy-variables USD TWIB models in last week's Commodity & Energy Strategy Weekly Report. Please see "Trade, Dollars, Oil & Metals ... Assessing Downside Risk." It is available at ces.bcaresearch.com. 12 With the introduction of these financial and macro variables, our oil price forecast will be a weighted average of our core Fundamental model and the new Financial model - i.e. the final forecast will look like [aFundamental+(1-a)Financial]. The weights - a and (1-a) - are time-varying, and will reflect our Bayesian probabilities for the relative importance of each model's contribution to price action every month. These weights are crucial. We allow them to vary in order to capture periods in which our analysis tells us we should expect the USD effect to be muted by idiosyncratic supply, demand or inventory dynamics. Investment Views and Themes Recommendations Strategic Recommendations Tactical Trades Commodity Prices and Plays Reference Table
Re Oil Demand: Fed Policy Trumps Tariffs
Re Oil Demand: Fed Policy Trumps Tariffs
Trades Closed in 2018 Summary of Trades Closed in 2017
Re Oil Demand: Fed Policy Trumps Tariffs
Re Oil Demand: Fed Policy Trumps Tariffs