Gold

Executive Summary Equities Are Still Attractive Versus Bonds
Equities Are Still Attractive Versus Bonds
Equities Are Still Attractive Versus Bonds
Macroeconomic Outlook: Global growth will reaccelerate in the second half of this year provided a ceasefire in Ukraine is reached. Inflation will temporarily come down as the dislocations caused by the war and the pandemic subside, before moving up again in late 2023. Equities: Maintain a modest overweight in stocks over a 12-month horizon, favoring non-US equities, small caps, and value stocks. Look to turn more defensive in the second half of 2023 in advance of another wave of inflation. Fixed income: The neutral rate of interest in the US is around 3.5%-to-4%, which is substantially higher than the consensus view. Bond yields will move sideways this year but will rise over the long haul. Overweight Germany, France, Japan, and Australia while underweighting the US and the UK in a global bond portfolio. Credit: Corporate debt will outperform high-quality government bonds over the next 12 months. Favor HY over IG and Europe over the US. Spreads will widen again in late 2023. Currencies: As a countercyclical currency, the US dollar will weaken later this year, with EUR/USD rising to 1.18. We are upgrading our view on the yen from bearish to neutral due to improved valuations. The CNY will strengthen as the Chinese authorities take steps to boost domestic demand. Commodities: Oil prices will dip in the second half of 2022 as the geopolitical premium in crude declines and more OPEC supply comes to market. However, oil and other commodity prices will start moving higher by mid-2023. Bottom Line: The cyclical bull market in stocks that began in 2009 is running long in the tooth, but the combination of faster global growth later this year and a temporary lull in inflation should pave the way for one final hurrah for equities. Dear Client, Instead of our regular report this week, we are sending you our Quarterly Strategy Outlook, where we explore the major trends that are set to drive financial markets in the rest of 2022 and beyond. Next week, please join me for a webcast on Monday, April 11 at 9:00 AM EDT (2:00 PM BST, 3:00 PM CEST, 9:00 PM HKT) where I will discuss the outlook. Best regards, Peter Berezin, Chief Global Strategist P.S. You can now follow me on LinkedIn and Twitter. I. Overview We continue to recommend overweighting global equities over a 12-month horizon. However, we see downside risks to stocks both in the near term (next 3 months) and long term (2-to-5 years). In the near term, stocks will weaken anew if Russia’s stated intentions to scale back operations in Ukraine turn out to be a ruse. There is also a risk that China will need to temporarily shutter large parts of its economy to combat the spread of the highly contagious BA.2 Omicron variant. While stocks could suffer a period of indigestion in response to monetary tightening by the Fed and a number of other central banks, we doubt that rates will rise enough over the next 12 months to undermine the global economy. This reflects our view that the neutral rate of interest in the US and most other countries is higher than widely believed. If the neutral rate ends up being between 3.5% and 4% in the US, as we expect, the odds are low that the Fed will induce a recession by raising rates to 2.75%, as the latest dot plot implies (Chart 1). Chart 1The Market Sees The Fed Raising Rates To Around 3% And Then Backing Off
2022 Second Quarter Strategy Outlook – The New Neutral
2022 Second Quarter Strategy Outlook – The New Neutral
The downside of a higher neutral rate is that eventually, investors will need to value stocks using a higher real discount rate. How fast markets mark up their estimate of neutral depends on the trajectory of inflation. We were warning about inflation before it was cool to warn about inflation (see, for example, our January 2021 report, Stagflation in a Few Months?; or our February 2021 report, 1970s-Style Inflation: Yes, It Could Happen Again). Our view has been that inflation will follow a “two steps up, one step down” pattern. We are currently near the top of those two steps: US inflation will temporarily decline in the second half of this year, as goods inflation drops but service inflation is slow to rise. The decline in inflation will provide some breathing room for the Fed, allowing it to raise rates by no more than what markets are already discounting over the next 12 months. Unfortunately, the respite in inflation will not last long. By the end of 2023, inflation will start to pick up again, forcing the Fed to resume hiking rates in 2024. This second round of Fed tightening is not priced by the markets, and so when it happens, it could be quite disruptive for stocks and other risk assets. Investors should overweight equities on a 12-month horizon but look to turn more defensive in the second half of 2023. II. The Global Economy War and Pestilence Are Near-Term Risks BCA’s geopolitical team, led by Matt Gertken, was ringing the alarm bell about Ukraine well before Russia’s invasion. Recent indications from Russia that it will scale back operations in Ukraine could pave the way for a ceasefire; or they could turn out to be a ruse, giving Russia time to restock supply lines and fortify its army in advance of a new summertime campaign against Kyiv. It is too early to tell, but either way, our geopolitical team expects more fighting in the near term. The West is not keen to give Putin an easy off-ramp, and even if it were, it is doubtful he would take it. The only way that Putin can salvage his legacy among his fan base in Russia is to decisively win the war in order to ensure Ukraine’s military neutrality. For his part, Zelensky cannot simply agree to Russia’s pre-war demands that Ukraine demilitarize and swear off joining NATO unless Russian forces first withdraw. To give in to such demands without any concrete security guarantees would raise the question of why Ukraine fought the war to begin with. The Impact of the Ukraine War on the Global Economy The direct effect of the war on the global economy is likely to be small. Together, Russia and Ukraine account for 3.5% of global GDP in PPP terms and 1.9% in dollar terms. Exports to Russia and Ukraine amount to only 0.2% of G7 GDP (Chart 2). Most corporations have little direct exposure to Russia, although there are a few notable exceptions (Chart 3). Chart 2Little Direct Trade Exposure To Russia And Ukraine
2022 Second Quarter Strategy Outlook – The New Neutral
2022 Second Quarter Strategy Outlook – The New Neutral
In contrast to the direct effects, the indirect effects have the potential to be sizable. Russia is the world’s second largest oil producer, accounting for 12% of annual global output (Chart 4). It is the world’s top exporter of natural gas. About half of European natural gas imports come from Russia. Russia is also a significant producer of nickel, copper, aluminum, steel, and palladium. Chart 3Only A Handful Of Firms Have Significant Sales Exposure To Russia
2022 Second Quarter Strategy Outlook – The New Neutral
2022 Second Quarter Strategy Outlook – The New Neutral
Chart 4Russia is The World's Second Largest Oil Producer
Russia is The World's Second Largest Oil Producer
Russia is The World's Second Largest Oil Producer
Russia and Ukraine are major agricultural producers. Together, they account for a quarter of global wheat exports, with much of it going to the Middle East and North Africa (Chart 5). They are also significant producers of potatoes, corn, sugar beets, and seed oils. In addition, Russia produces two-thirds of all ammonium nitrate, the main source of nitrogen-based fertilizers. Largely as a result of higher commodity prices and other supply disruptions, the OECD estimates that the war could shave about 1% off of global growth this year, with Europe taking the brunt of the hit (Chart 6). At present, the futures curves for most commodities are highly backwardated (Chart 7). While one cannot look to the futures as unbiased predictors of where spot prices are heading, it is fair to say that commodity markets are discounting some easing in prices over the next two years. If that does not occur, global growth could weaken more than the OECD expects. Chart 5Developing Economies Buy The Bulk Of Russian And Ukrainian Wheat
2022 Second Quarter Strategy Outlook – The New Neutral
2022 Second Quarter Strategy Outlook – The New Neutral
Chart 6The War In Ukraine Could Shave One Percentage Point Off Of Global Growth
2022 Second Quarter Strategy Outlook – The New Neutral
2022 Second Quarter Strategy Outlook – The New Neutral
Chart 7Futures Curves For Most Commodities Are Backwardated
2022 Second Quarter Strategy Outlook – The New Neutral
2022 Second Quarter Strategy Outlook – The New Neutral
Another Covid Wave Two years after “two weeks to flatten the curve,” the world continues to underappreciate the power of exponential growth. Suppose that it takes five days for someone with Covid to infect someone else. If everyone with Covid infects an average of six people, the cumulative number of Covid cases would rise from 1,000 to 10 million in around four weeks. Suppose you could cut the number of new infections in half to three per person. In that case, it would take about six weeks for 10 million people to be infected. In other words, mitigation measures that cut the infection rate by half would only extend how long it takes for 10 million people to be infected by two weeks. That’s not a lot. The point is that any infection rate above one will generate an explosive rise in cases. In the pre-Omicron days, keeping the infection rate below one was difficult, but not impossible for countries with the means and motivation to do so. As the virus has become more contagious, however, keeping it at bay has grown more difficult. The latest strain of Omicron, BA.2, appears to be 40% more contagious than the original Omicron strain, which itself was about 4-times more contagious than Delta. BA.2 is quickly spreading around the world. The number of cases has spiked across much of Europe, parts of Asia, and has begun to rise in North America (Chart 8). In China, the authorities have locked down Shanghai, home to 25 million people. Chart 8Covid Cases Are On The Rise Again
2022 Second Quarter Strategy Outlook – The New Neutral
2022 Second Quarter Strategy Outlook – The New Neutral
The success that China has had in suppressing the virus has left its population with little natural immunity; and given the questionable efficacy of its vaccines, with little artificial immunity as well. Moreover, as is the case in Hong Kong, a large share of mainland China’s elderly population remains completely unvaccinated. Chart 9New Covid Drugs Are Set To Hit The Market
2022 Second Quarter Strategy Outlook – The New Neutral
2022 Second Quarter Strategy Outlook – The New Neutral
This presents the Chinese authorities with a difficult dilemma: Impose severe lockdowns over much of the population, or let the virus run rampant. As the logic of exponential change described above suggests, there is not much of a middle ground. Our guess is that the Chinese government will choose the former option. China has already signed a deal to commercialize Pfizer’s Paxlovid. The drug is highly effective at preventing hospitalization if taken within five days from the onset of symptoms. Fortunately, Paxlovid production is starting to ramp up (Chart 9). China will probably wait until it has sufficient supply of the drug before relaxing its zero-Covid policy. While beneficial to growth later this year, this strategy could have a negative near-term impact on activity, as the authorities continue to play whack-a-mole with Covid. Chart 10Inflation Is Running High, Especially In The US
Inflation Is Running High, Especially In The US
Inflation Is Running High, Especially In The US
Central Banks in a Bind Standard economic theory says that central banks should adjust interest rates in response to permanent shocks, while ignoring transitory ones. This is especially true if the shock in question emanates from the supply side of the economy. After all, higher rates cool aggregate demand; they do not raise aggregate supply. The lone exception to this rule is when a supply shock threatens to dislodge long-term inflation expectations. If long-term inflation expectations become unanchored, what began as a transitory shock could morph into a semi-permanent one. The problem for central banks is that the dislocations caused by the Ukraine war are coming at a time when inflation is already running high. Headline CPI inflation reached 7.9% in the US in February, while core CPI inflation clocked in at 6.4%. Trimmed-mean inflation has increased in most economies (Chart 10). Fortunately, while short-term inflation expectations have moved up, long-term expectations have been more stable. Expected US inflation 5-to-10 years out in the University of Michigan survey stood at 3.0% in March, down a notch from 3.1% in January, and broadly in line with the average reading between 2010 and 2015 (Chart 11). Survey-based measures of long-term inflation expectations are even more subdued in the euro area and Japan (Chart 12). Market-based inflation expectations have risen, although this partly reflects higher oil prices. Even then, the widely-watched 5-year, 5-year forward TIPS inflation breakeven rate remains near the bottom of the Fed’s comfort range of 2.3%-to-2.5% (Chart 13).1 Chart 11Long-Term Inflation Expectations Remain Contained In The US...
Long-Term Inflation Expectations Remain Contained In The US...
Long-Term Inflation Expectations Remain Contained In The US...
Chart 12... And In The Euro Area And Japan
... And In The Euro Area And Japan
... And In The Euro Area And Japan
Chart 13The Market's Long-Term Inflation Expectations Are Near The Bottom Of The Fed's Comfort Zone
The Market's Long-Term Inflation Expectations Are Near The Bottom Of The Fed's Comfort Zone
The Market's Long-Term Inflation Expectations Are Near The Bottom Of The Fed's Comfort Zone
Goods versus Services Inflation Most of the increase in consumer prices has been concentrated in goods rather than services (Chart 14). This is rather unusual in that goods prices usually fall over time; but in the context of the pandemic, it is entirely understandable. Chart 14Goods Prices Have Been A Major Driver Of Overall Inflation
2022 Second Quarter Strategy Outlook – The New Neutral
2022 Second Quarter Strategy Outlook – The New Neutral
The pandemic caused spending to shift from services to goods (Chart 15). This occurred at the same time as the supply of goods was being adversely affected by various pandemic-disruptions, most notably the semiconductor shortage that is still curtailing automobile production. Chart 15AGoods Inflation Should Fade As Consumption Shifts Back Towards Services (I)
Goods Inflation Should Fade Goods Inflation Should Fade As Consumption Shifts Back Towards Services (I)
Goods Inflation Should Fade Goods Inflation Should Fade As Consumption Shifts Back Towards Services (I)
Chart 15BGoods Inflation Should Fade As Consumption Shifts Back Towards Services (II)
Goods Inflation Should Fade Goods Inflation Should Fade As Consumption Shifts Back Towards Services (II)
Goods Inflation Should Fade Goods Inflation Should Fade As Consumption Shifts Back Towards Services (II)
Looking out, the composition of consumer spending will shift back towards services. Supply chain bottlenecks should also abate, especially if the situation in Ukraine stabilizes. It is worth noting that the number of ships on anchor off the coast of Los Angeles and Long Beach has already fallen by half (Chart 16). The supplier delivery components of both the manufacturing and nonmanufacturing ISM indices have also come off their highs (Chart 17). Even used car prices appear to have finally peaked (Chart 18). Chart 16Shipping Delays Are Abating
Shipping Delays Are Abating
Shipping Delays Are Abating
Chart 17Delivery Times Are Slowly Coming Down
Delivery Times Are Slowly Coming Down
Delivery Times Are Slowly Coming Down
Chart 18Used Car Prices May Have Finally Peaked
Used Car Prices May Have Finally Peaked
Used Car Prices May Have Finally Peaked
On the Lookout for a Wage-Price Spiral Could rising services inflation offset any decline in goods inflation this year? It is possible, but for that to happen, wage growth would have to accelerate further. For now, much of the acceleration in US wage growth has occurred at the bottom end of the income distribution (Chart 19). It is easy to see why. Chart 20 shows that low-paid workers have not returned to the labor market to the same degree as higher-paid workers. However, now that extended unemployment benefits have lapsed and savings deposits are being drawn down, the incentive to resume work will strengthen. Chart 19Wage Growth Has Picked Up, But Mostly At The Bottom End Of The Income Distribution
Wage Growth Has Picked Up, But Mostly At The Bottom End Of The Income Distribution
Wage Growth Has Picked Up, But Mostly At The Bottom End Of The Income Distribution
Chart 20More Low-Wage Employees Should Return To Work
More Low-Wage Employees Should Return To Work
More Low-Wage Employees Should Return To Work
Chart 21More Workers Will Return To Their Jobs Once The Pandemic Ends
More Workers Will Return To Their Jobs Once The Pandemic Ends
More Workers Will Return To Their Jobs Once The Pandemic Ends
The end of the pandemic should allow more workers to remain at their jobs. In January, during the height of the Omicron wave, 8.75 million US workers (5% of the total workforce) were absent from work due to the virus (Chart 21). How High Will Interest Rates Eventually Rise? If goods inflation comes down swiftly later this year, and services inflation is slow to rise, then overall inflation will decline. This should allow the Fed to pause tightening in early 2023. Whether the Fed will remain on hold beyond then depends on where the neutral rate of interest resides. Chart 22The Yield Curve Inverted in Mid-2019 But Growth Accelerated
The Yield Curve Inverted in Mid-2019 But Growth Accelerated
The Yield Curve Inverted in Mid-2019 But Growth Accelerated
The neutral rate, or equilibrium rate as it is sometimes called, is the interest rate consistent with full employment and stable inflation. If the Fed pauses hiking before interest rates have reached neutral, the economy will eventually overheat, forcing the Fed to resume hiking. In contrast, if the Fed inadvertently raises rates above neutral, unemployment will start rising, requiring the Fed to cut rates. Markets are clearly worried about the latter scenario. The 2/10 yield curve inverted earlier this week. With the term premium much lower than in the past, an inversion in the yield curve is not the powerful harbinger of recession that it once was. After all, the 2/10 curve inverted in August 2019 and the economy actually strengthened over the subsequent six months before the pandemic came along (Chart 22). Nevertheless, an inverted yield curve is consistent with markets expectations that the Fed will raise rates above neutral. That is always a dangerous undertaking. Raising rates above neutral would likely push up the unemployment rate. There has never been a case in the post-war era where the 3-month moving average of the unemployment rate has risen by more than 30 basis points without a recession occurring (Chart 23). Chart 23When Unemployment Starts Rising, It Usually Keeps Rising
When Unemployment Starts Rising, It Usually Keeps Rising
When Unemployment Starts Rising, It Usually Keeps Rising
As discussed in the Feature Section below, the neutral rate of interest is probably between 3.5% and 4% in the US. This is good news in the short term because it lowers the odds that the Fed will raise rates above neutral during the next 12 months. It is bad news in the long run because it means that the Fed will find itself even more behind the curve than it is now, making a recession almost inevitable. The Feature Section builds on our report from two weeks ago. Readers familiar with that report should feel free to skip ahead to the next section. III. Feature: A Higher Neutral Rate Conceptually, the neutral rate is the interest rate that equates the amount of investment a country wants to undertake at full employment with the amount of savings that it has at its disposal.2 Anything that reduces savings or increases investment would raise the neutral rate (Chart 24). Chart 24The Savings-Investment Balance Determines The Neutral Rate Of Interest
2022 Second Quarter Strategy Outlook – The New Neutral
2022 Second Quarter Strategy Outlook – The New Neutral
A number of factors are likely to lower desired savings in the US over the next few years: Households will spend down their accumulated pandemic savings. US households are sitting on $2.3 trillion (10% of GDP) in excess savings, the result of both decreased spending on services during the pandemic and the receipt of generous government transfer payments (Chart 25). Household wealth has soared since the start of the pandemic (Chart 26). Conservatively assuming that households spend three cents of every additional dollar in wealth, the resulting wealth effect could boost consumption by 4% of GDP. Chart 25Plenty Of Pent-Up Demand
Plenty Of Pent-Up Demand
Plenty Of Pent-Up Demand
Chart 26Net Worth Has Soared Since The Pandemic
Net Worth Has Soared Since The Pandemic
Net Worth Has Soared Since The Pandemic
The household deleveraging cycle has ended (Chart 27). Household balance sheets are in good shape. After falling during the initial stages of the pandemic, consumer credit has begun to rebound. For the first time since the housing boom, mortgage equity withdrawals are rising. Banks are easing lending standards on consumer loans across the board. Chart 27US Household Deleveraging Pressures Have Abated
US Household Deleveraging Pressures Have Abated
US Household Deleveraging Pressures Have Abated
Chart 28Baby Boomers Have Amassed A Lot Of Wealth
2022 Second Quarter Strategy Outlook – The New Neutral
2022 Second Quarter Strategy Outlook – The New Neutral
Baby boomers are retiring. They hold over half of US household wealth, considerably more than younger generations (Chart 28). As baby boomers transition from being savers to dissavers, national savings will decline. Government budget deficits will stay elevated. Fiscal deficits subtract from national savings. While the US budget deficit will come down over the next few years, the IMF estimates that the structural budget deficit will still average 4.9% of GDP between 2022 and 2026 compared to 2.0% of GDP between 2014 and 2019 (Chart 29).Chart 29Fiscal Policy: Tighter But Not Tight
2022 Second Quarter Strategy Outlook – The New Neutral
2022 Second Quarter Strategy Outlook – The New Neutral
On the investment front: The deceleration in trend GDP growth, which depressed investment spending, has largely run its course.3 According to the Congressional Budget Office, real potential GDP growth fell from over 3% in the early 1980s to about 1.9% today. The CBO expects potential growth to edge down only slightly to 1.7% over the next few decades (Chart 30). After moving broadly sideways for two decades, core capital goods orders – a leading indicator for capital spending – have broken out to the upside (Chart 31). Capex intention surveys remain upbeat (Chart 32). The average age of the nonresidential capital stock currently stands at 16.3 years, the highest since 1965 (Chart 33). Chart 30Much Of The Deceleration In Potential Growth Has Already Happened
Much Of The Deceleration In Potential Growth Has Already Happened
Much Of The Deceleration In Potential Growth Has Already Happened
Chart 31Positive Signs For Capex (I)
Positive Signs For Capex (I)
Positive Signs For Capex (I)
Chart 32Positive Signs For Capex (II)
Positive Signs For Capex (II)
Positive Signs For Capex (II)
Chart 33An Aging Capital Stock
An Aging Capital Stock
An Aging Capital Stock
Similar to nonresidential investment, the US has been underinvesting in residential real estate (Chart 34). The average age of the housing stock has risen to a 71-year high of 31 years. The homeowner vacancy rate has plunged to the lowest level on record. The number of newly finished homes for sale is half of what it was prior to the pandemic. Chart 34US Housing Is In Short Supply
US Housing Is In Short Supply
US Housing Is In Short Supply
The New ESG: Energy Security and Guns The war in Ukraine will put further upward pressure on the neutral rate, especially outside of the United States. After staging a plodding recovery following the euro debt crisis, European capital spending received a sizable boost from the launch of the NextGenerationEU Recovery Fund (Chart 35). As Mathieu Savary points out in his latest must-read report on Europe, capital spending will rise further in the years ahead as European governments accelerate efforts to make their economies less reliant on Russian energy. Germany has already announced plans to construct three new LNG terminals. The push to build out Europe’s energy infrastructure is coming at a time when businesses are looking to ramp up capital spending. As in the US, Europe’s capital stock has aged rapidly over the past decade (Chart 36). Chart 35European Capex Should Recover
European Capex Should Recover
European Capex Should Recover
Chart 36European Machines Need More Than Just An Oil Change
European Machines Need More Than Just An Oil Change
European Machines Need More Than Just An Oil Change
Chart 37The War In Ukraine Calls For More Spending Across Europe
The War In Ukraine Calls For More Spending Across Europe
The War In Ukraine Calls For More Spending Across Europe
Meanwhile, European governments are trying to ease the burden from rising energy costs. For example, France has introduced a rebate on fuel. It is part of a EUR 20 billion package aimed at cutting heating and electricity bills. European military spending will rise. Military spending currently amounts to 1.5% of GDP, well below NATO’s threshold of 2% (Chart 37). Germany has announced that it will spend EUR 100 billion more on defense. European governments will also need to boost spending to accommodate Ukrainian refugees. The UN estimates that four million refugees have left Ukraine, with the vast majority settling in the EU. A Smaller Chinese Current Account Surplus? The difference between what a country saves and invests equals its current account balance. Historically, China has been a major exporter of savings, which has helped depress interest rates abroad. While China’s current account surplus has declined as a share of its own GDP, it has remained very large as a share of global ex-China GDP, reflecting China’s growing weight in the global economy (Chart 38). Many analysts assume that China will double down on efforts to boost exports in order to offset the drag from falling property investment. However, there is a major geopolitical snag with that thesis: A country that runs a current account surplus must, by definition, accumulate assets from the rest of the world. As the freezing of Russia’s foreign exchange reserves demonstrates, that is a risky proposition for a country such as China. Rather than increasing its current account surplus, China may seek to bolster its economy by raising domestic demand. This could be achieved by either boosting domestic infrastructure spending or raising household consumption. Notably, China’s credit impulse appears to have bottomed and is set to increase in the second half of the year. This is good news not just for Chinese growth but growth abroad (Chart 39). Chart 38Will China Be A Source Of Excess Savings?
Will China Be A Source Of Excess Savings?
Will China Be A Source Of Excess Savings?
Chart 39China's Credit Impulse Appears To Have Bottomed
China's Credit Impulse Appears To Have Bottomed
China's Credit Impulse Appears To Have Bottomed
The IMF’s latest projections foresee China’s current account surplus falling by more than half between 2021 and 2026 as a share of global ex-China GDP. If this were to happen, the neutral rate in China and elsewhere would rise. IV. Financial Markets A. Portfolio Strategy Chart 40The Markets Wobbled And Then Recovered After The Beginning Of The Last Four Fed Rate Cycles
The Markets Wobbled And Then Recovered After The Beginning Of The Last Four Fed Rate Cycles
The Markets Wobbled And Then Recovered After The Beginning Of The Last Four Fed Rate Cycles
As noted in the overview, if the neutral rate turns out to be higher than currently perceived, the Fed is unlikely to induce a recession by raising rates over the next 12 months. That is good news for equities. A look back at the past four Fed tightening cycles shows that stocks often wobble when the Fed starts hiking rates, but then usually rise as long as rates do not move into restrictive territory (Chart 40). Unfortunately, a higher neutral rate also means that investors will eventually need to value stocks using a higher discount rate. It also means that any decline in inflation this year will not last. The US economy will probably start to overheat again in the second half of 2023. This will set the stage for a second, and more painful, tightening cycle in 2024. Admittedly, there is a lot of uncertainty over our “two steps up, one step down” forecast for inflation. It is certainly possible that the “one step down” phase does not last long and that the resurgence in inflation we are expecting in the second half of next year occurs earlier. It is also possible that investors will react negatively to rising rates, even if the economy is ultimately able to withstand them. As such, only a modest overweight to equities is justified over the next 12 months, with risks tilted to the downside in the near term. More conservative asset allocators should consider moving to a neutral stance on equities already, as my colleague Garry Evans advised clients to do in his latest Global Asset Allocation Quarterly Portfolio Outlook. B. Fixed Income Stay Underweight Duration Over a 2-to-5 Year Horizon Our recommendation to maintain below-benchmark duration in fixed-income portfolios panned out since the publication of our Annual Outlook in December, with the US 10-year Treasury yield rising from 1.43% to 2.38%. We continue to expect bond yields in the US to rise over the long haul. Conceptually, the yield on a government bond equals the expected path of policy rates over the duration of the bond plus a term premium. The term premium is the difference between the return investors can expect from buying a long-term bond that pays a fixed interest rate, and the return from rolling over a short-term bill. The term premium has been negative in recent years. Investors have been willing to sacrifice return to own long-term bonds because bond prices usually rise when the odds of a recession go up. The fact that monthly stock returns and changes in bond yields have been positively correlated since 2001 underscores the benefits that investors have received from owning long-term bonds as a hedge against unfavorable economic news (Chart 41). However, now that inflation has emerged as an increasingly important macroeconomic risk, the correlation between stock returns and changes in bond yields could turn negative again. Unlike weak economic growth, which is bad for only stocks, high inflation is bad for both bonds and stocks. Chart 41Correlation Between Stock Returns And Bond Yields Could Turn Negative
Correlation Between Stock Returns And Bond Yields Could Turn Negative
Correlation Between Stock Returns And Bond Yields Could Turn Negative
If bond yields start to rise whenever stock prices fall, the incentive to own long-term bonds will decline. This will cause the term premium to increase. Assuming the term premium rises to about 0.5%, and a neutral rate of 3.5%-to-4%, the long-term fair value for the 10-year US Treasury yield is 4%-to-4.5%. This is well above the 5-year/5-year forward yield of 2.20%. Move from Underweight to Neutral Duration Over a 12-Month Horizon Below benchmark duration positions usually do well when the Fed hikes rates by more than expected over the subsequent 12 months (Chart 42). Chart 42The Golden Rule Of Bond Investing
The Golden Rule Of Bond Investing
The Golden Rule Of Bond Investing
Given our view that US inflation will temporarily decline later this year, the Fed will probably not need to raise rates over the next 12 months by more than the 249 basis points that markets are already discounting. Thus, while a below-benchmark duration position is advisable over a 2-to-5-year time frame, it could struggle over a horizon of less than 12 months. Our end-2022 target range for the US 10-year Treasury yield is 2.25%-to-2.5%. Chart 43Bond Sentiment And Positioning Are Bearish
Bond Sentiment And Positioning Are Bearish
Bond Sentiment And Positioning Are Bearish
Supporting our decision to move to a neutral benchmark duration stance over a 12-month horizon is that investor positioning and sentiment are both bond bearish (Chart 43). From a contrarian point of view, this is supportive of bonds. Global Bond Allocation BCA’s global fixed-income strategists recommend overweighting German, French, Australian, and Japanese government bonds, while underweighting those of the US and the UK. They are neutral on Italy and Spain given that the ECB is set to slow the pace of bond buying. The neutral rate of interest has risen in the euro area, partly on the back of more expansionary fiscal policy across the region. In absolute terms, however, the neutral rate in the euro area is still quite low, and possibly negative. Unlike in the US, where inflation has risen to uncomfortably high levels, much of Europe would benefit from higher inflation expectations, as this would depress real rates across the region, giving growth a boost. This implies that the ECB is unlikely to raise rates much over the next two years. As with the euro area, Japan would benefit from lower real rates. The Bank of Japan’s yield curve control policy has been put to the test in recent weeks. To its credit, the BoJ has stuck to its guns, buying bonds in unlimited quantities to prevent yields from rising. We expect the BoJ to stay the course. Unlike in the euro area and Japan, inflation expectations are quite elevated in the UK and wage growth is rising quickly there. This justifies an underweight stance on UK gilts. Although job vacancies in Australia have climbed to record levels, wage growth is still not strong enough from the RBA’s point of view to justify rapid rate hikes. As a result, BCA’s global fixed-income strategists remain overweight Australian bonds. Finally, our fixed-income strategists are underweight Canadian bonds but are contemplating upgrading them given that markets have already priced in 238 basis points in tightening over the next 12 months. Unlike in the US, high levels of consumer debt will also limit the Bank of Canada’s ability to raise rates. Modest Upside in High-Yield Corporate Bonds Credit spreads have narrowed in recent days but remain above where they were prior to Russia’s invasion of Ukraine. Since the start of the year, US investment-grade bonds have underperformed duration-matched Treasurys by 154 basis points, while high-yield bonds have underperformed by 96 basis points (Chart 44). The outperformance of high-yield relative to investment-grade debt can be explained by the fact that the former has more exposure to the energy sector, which has benefited from rising oil prices. Looking out, falling inflation and a rebound in global growth later this year should provide a modestly supportive backdrop for corporate credit. High-yield spreads are still pricing in a default rate of 3.8% over the next 12 months (Chart 45). This is well above the trailing 12-month default rate of 1.3%. Our fixed-income strategists continue to prefer US high-yield over US investment-grade. Chart 44Spreads Have Narrowed Over The Past Two Weeks But Remain Above Pre-War Levels
Spreads Have Narrowed Over The Past Two Weeks But Remain Above Pre-War Levels
Spreads Have Narrowed Over The Past Two Weeks But Remain Above Pre-War Levels
Chart 45Spread-Implied Default Rate Is Too High
2022 Second Quarter Strategy Outlook – The New Neutral
2022 Second Quarter Strategy Outlook – The New Neutral
European credit is attractively priced and should benefit from any stabilization in the situation in Ukraine. Our fixed-income strategists prefer both European high-yield and investment-grade bonds over their US counterparts. As with equities, the bull market in corporate credit will end in late 2023 as the Fed is forced to resume raising rates in 2024 in the face of an overheated economy. C. Currencies Chart 46Widening Interest Rate Differentials Have Supported The Dollar
Widening Interest Rate Differentials Have Supported The Dollar
Widening Interest Rate Differentials Have Supported The Dollar
The US Dollar Will Weaken Starting in the Second Half of 2022 Since bottoming last May, the US dollar has been trending higher. While the dollar could strengthen further in the near term if the war in Ukraine escalates, the fundamental backdrop supporting the greenback is starting to fray. If US inflation comes down later this year, the Fed is unlikely to raise rates by more than what markets are already discounting over the next 12 months. Thus, widening rate differentials will no longer support the dollar (Chart 46). The dollar is a countercyclical currency: It usually weakens when global growth is strengthening and strengthens when global growth is weakening (Chart 47). The dollar tends to be particularly vulnerable when growth expectations are rising more outside the US than in the US (Chart 48). Chart 47The Dollar Is A Countercyclical Currency
The Dollar Is A Countercyclical Currency
The Dollar Is A Countercyclical Currency
Chart 48Better Growth Prospects Abroad Will Weigh On The US Dollar
Better Growth Prospects Abroad Will Weigh On The US Dollar
Better Growth Prospects Abroad Will Weigh On The US Dollar
Global growth should rebound in the second half of the year once the pandemic finally ends and the situation in Ukraine stabilizes. Growth is especially likely to recover in Europe. This will support the euro, a dovish ECB notwithstanding. Chester Ntonifor, BCA’s Foreign Exchange Strategist, expects EUR/USD to end the year at 1.18. The Dollar is Overvalued The dollar’s ascent has left it overvalued by more than 20% on a Purchasing Power Parity (PPP) basis (Chart 49). The PPP exchange rate equalizes the price of a representative basket of goods and services between the US and other economies. PPP deviations from fair value have done a reasonably good job of predicting dollar movements over the long run (Chart 50). Chart 49USD Remains Overvalued
2022 Second Quarter Strategy Outlook – The New Neutral
2022 Second Quarter Strategy Outlook – The New Neutral
Chart 50Valuations Matter For FX Long-Term Returns
Valuations Matter For FX Long-Term Returns
Valuations Matter For FX Long-Term Returns
Reflecting the dollar’s overvaluation, the US trade deficit has widened sharply (Chart 51). Excluding energy exports, the US trade deficit as a share of GDP is now the largest on record. Equity inflows have helped finance America’s burgeoning current account deficit (Chart 52). However, these inflows have ebbed significantly as foreign investors have lost their infatuation with US tech stocks. Chart 51The US Trade Deficit Has Widened
The US Trade Deficit Has Widened
The US Trade Deficit Has Widened
Chart 52Net Inflows Into US Equities Have Dried Up
Net Inflows Into US Equities Have Dried Up
Net Inflows Into US Equities Have Dried Up
Dollar positioning remains stretched on the long side (Chart 53). That is not necessarily an obstacle in the short run, given that the dollar tends to be a momentum currency, but it does suggest that the greenback could weaken over a 12-month horizon as more dollar bulls jump ship. The Yen: Cheaper but Few Catalysts for a Bounce The trade-weighted yen has depreciated by 6.4% since the start of the year. The yen is 31% undervalued relative to the dollar on a PPP basis (Chart 54). In a nod to these improved valuations, we are upgrading our 12-month and long-term view on the yen from bearish to neutral. Chart 53Still A Lot of Dollar Bulls
Still A Lot of Dollar Bulls
Still A Lot of Dollar Bulls
Chart 54The Yen Has Gotten Cheaper
The Yen Has Gotten Cheaper
The Yen Has Gotten Cheaper
While the yen is unlikely to weaken much from current levels, it is unlikely to strengthen. As noted above, the Bank of Japan has no incentive to abandon its yield curve control strategy. Yes, the recent rapid decline in the yen is a shock to the economy, but it is a “good” shock in the sense that it could finally jolt inflation expectations towards the BoJ’s target of 2%. If inflation expectations rise, real rates would fall, which would be bearish for the currency. Favor the RMB and other EM Currencies The Chinese RMB has been resilient so far this year, rising slightly against the dollar, even as the greenback has rallied against most other currencies. Real rates are much higher in China than in the US, and this has supported the RMB (Chart 55). Chart 55Higher Real Rates In China Have Supported The RMB
Higher Real Rates In China Have Supported The RMB
Higher Real Rates In China Have Supported The RMB
Chart 56The RMB Is Undervalued Based On PPP
The RMB Is Undervalued Based On PPP
The RMB Is Undervalued Based On PPP
Despite the RMB’s strength, it is still undervalued by 10.5% relative to its PPP exchange rate (Chart 56). While productivity growth has slowed in China, it remains higher than in most other countries. The real exchange rates of countries that benefit from fast productivity growth typically appreciates over time. China holds about half of its foreign exchange reserves in US dollars, a number that has not changed much since 2012 (Chart 57). We expect China to diversify away from dollars over the coming years. Moreover, as discussed earlier in the report, the incentive for China to run large current account surpluses may fade, which will result in slower reserve accumulation. Both factors could curb the demand for dollars in international markets. Chart 57Half Of Chinese FX Reserves Are Held In USD Assets
2022 Second Quarter Strategy Outlook – The New Neutral
2022 Second Quarter Strategy Outlook – The New Neutral
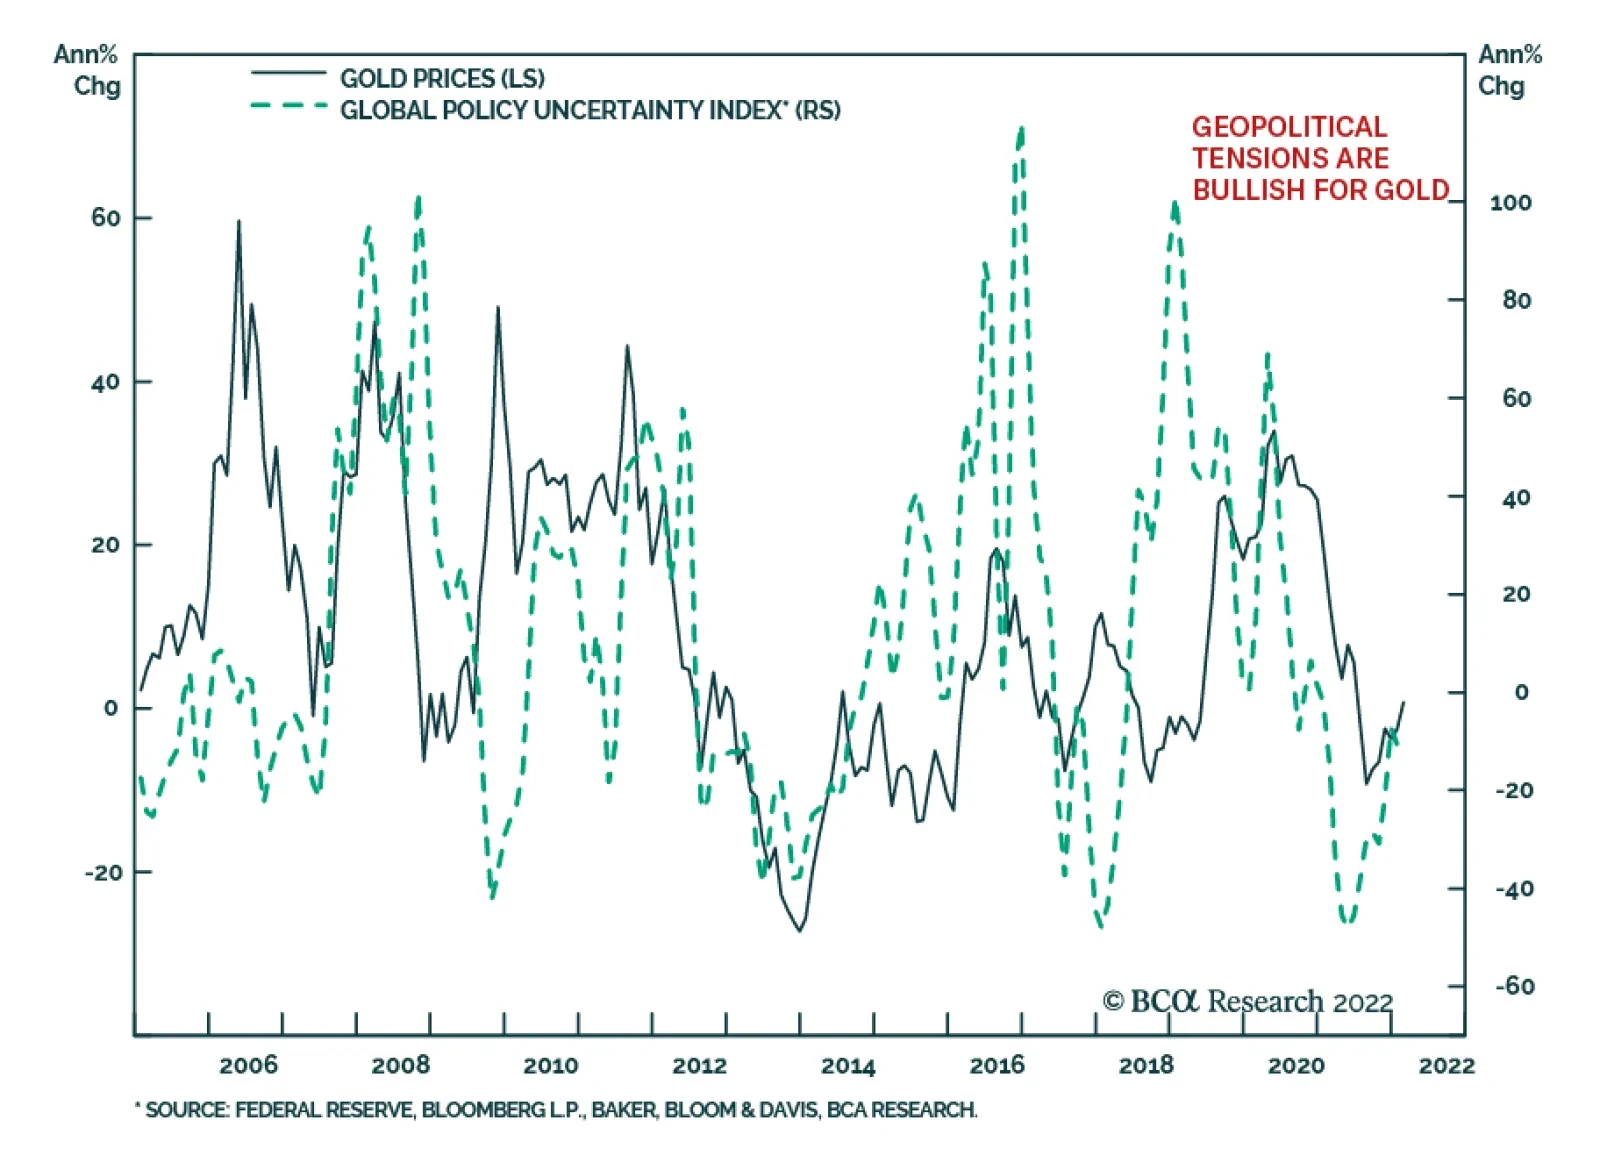
A resilient RMB will provide a tailwind for other EM currencies. Many EM central banks began to raise rates well before their developed market counterparts. In Brazil, for example, the policy rate has risen to 11.75% from 2% last April. With inflation in EMs likely to come down later this year as pandemic and war-related dislocations subside, real policy rates will rise, giving EM currencies a boost. D. Commodities Longer-Term Bullish Thesis on Commodities Remains Intact BCA’s commodity team, led by Bob Ryan, expects crude prices to fall in the second half of the year, before moving higher again in 2023. Their forecast is for Brent to dip to $88/bbl by end-2022, which is below the current futures price of $97/bbl. Chart 58Dearth Of Oil Capex Will Put A Floor Under Oil Prices
2022 Second Quarter Strategy Outlook – The New Neutral
2022 Second Quarter Strategy Outlook – The New Neutral
The risk to their end-2022 forecast is tilted to the upside. The relationship between the Saudis and the US has become increasingly strained. This could hamper efforts to bring more oil to market. Hopes that Iranian crude will reach global markets could also be dashed if, as BCA’s geopolitical strategists expect, the US-Iran nuclear deal falls through. A cut-off of Russian oil could also cause prices to rise. While Urals crude is being sold at a heavy discount of $30/bbl to Brent (compared to a discount of around $2/bbl prior to the invasion), it is still leaving the country. In fact, Russian oil production actually rose in March over February. An escalation of the war would make it more difficult for Russia to divert enough oil to China, India, and other countries in order to evade Western sanctions. Looking beyond this year, Bob and his team see upside to oil prices. They expect Brent to finish 2023 at $96/bbl, above the futures price of $89/bbl. Years of underinvestment in crude oil production have led to tight supply conditions (Chart 58). Proven global oil reserves increased by only 6% between 2010 and 2020, having risen by 26% over the preceding decade. Stay Positive on Metals As with oil, there has been little investment in mining capacity in recent years. While a weaker property market in China will weigh on metals prices, this will be partly offset by increased infrastructure spending. The shift towards green energy will also boost metals prices. The typical electric vehicle requires about four times as much copper as a typical gasoline-powered vehicle. Huge amounts of copper will also be necessary to expand electrical grids. Favor Gold Over Cryptos After breaking above $2,000/oz, the price of gold has retreated to $1,926/oz. In the near term, gold prices will be swayed by geopolitical developments. Longer term, real rates will dictate the direction of gold prices. Chart 59 shows that there is a very strong correlation between the price of gold and TIPS yields. If we are correct that the neutral rate of interest is 3.5%-to-4% in the US, real bond yields will eventually need to rise from current levels. Gold prices are quite expensive by historic standards, which represents a long-term risk (Chart 60). Chart 59Strong Correlation Between Real Rates And Gold
Strong Correlation Between Real Rates And Gold
Strong Correlation Between Real Rates And Gold
Chart 60Gold Is Quite Pricey From A Historical Perspective
Gold Is Quite Pricey From A Historical Perspective
Gold Is Quite Pricey From A Historical Perspective
That said, we expect the bulk of the increase in real bond yields to occur only after mid-2023. As mentioned earlier, the Fed will probably not have to deliver more tightening that what markets are already discounting over the next 12 months. Thus, gold prices are unlikely to fall much in the near term. In any case, we continue to regard gold as a safer play than cryptocurrencies. As we discussed in Who Pays for Cryptos?, the long-term outlook for cryptocurrencies remains daunting. Many of the most hyped blockchain applications, from DeFi to NFTs, will turn out to be duds. Concerns that cryptocurrencies are harming the environment, contributing to crime, and enriching a small group of early investors at the expense of everyone else will lead to increased regulatory scrutiny. Our long-term target for Bitcoin is $5,000. E. Equities Equities Are Still Attractively Priced Relative to Bonds Corporate earnings are highly correlated with the state of the business cycle (Chart 61). A recovery in global growth later this year will bolster revenue, while easing supply-chain pressures should help contain costs in the face of rising wages. It is worth noting that despite all the shocks to the global economy, EPS estimates in the US and abroad have actually risen this year (Chart 62). Chart 61The Business Cycle Drives Earnings
The Business Cycle Drives Earnings
The Business Cycle Drives Earnings
Chart 62Global EPS Estimates Have Held Up Reasonably Well
2022 Second Quarter Strategy Outlook – The New Neutral
2022 Second Quarter Strategy Outlook – The New Neutral
Chart 63Equities Are Still Attractive Versus Bonds
Equities Are Still Attractive Versus Bonds
Equities Are Still Attractive Versus Bonds
As Doug Peta, BCA’s Chief US Strategist has pointed out, the bar for positive earnings surprises for Q1 is quite low: According to Refinitiv/IBES, S&P 500 earnings are expected to fall by 4.5% in Q1 over Q4 levels. Global equities currently trade at 18-times forward earnings. Relative to real bond yields, stocks continue to look reasonably cheap (Chart 63). Even in the US, where valuations are more stretched, the earnings yield on stocks exceeds the real bond yield by 570 basis points. At the peak of the market in 2000, the gap between earnings yields and real bond yields was close to zero. Favor Non-US Markets, Small Caps, and Value Valuations are especially attractive outside the US. Non-US equities trade at 13.7-times forward earnings. Emerging markets trade at a forward P/E of only 12.1. Correspondingly, the gap between earnings yields and real bond yields is about 200 basis points higher outside the US. In general, non-US markets fare best in a setting of accelerating growth and a weakening dollar – precisely the sort of environment we expect to prevail in the second half of the year (Chart 64). US small caps also perform best when growth is strengthening and the dollar is weakening (Chart 65). In contrast to the period between 2003 and 2020, small caps now trade at a discount to their large cap brethren. The S&P 600 currently trades at 14.4-times forward earnings compared to 19.7-times for the S&P 500, despite the fact that small cap earnings are projected to grow more quickly both over the next 12-months and over the long haul (Chart 66). Chart 64A Weaker Dollar And Stronger Global Economy Are Tailwinds For Non-US Stocks
A Weaker Dollar And Stronger Global Economy Are Tailwinds For Non-US Stocks
A Weaker Dollar And Stronger Global Economy Are Tailwinds For Non-US Stocks
Chart 65US Small Caps Usually Fare Well When The Economy Is Strengthening And The Dollar Is Weakening
US Small Caps Usually Fare Well When The Economy Is Strengthening And The Dollar Is Weakening
US Small Caps Usually Fare Well When The Economy Is Strengthening And The Dollar Is Weakening
Globally, growth stocks have outperformed value stocks by 60% since 2017. However, only one-tenth of that outperformance has come from faster earnings growth (Chart 67). This has left value trading nearly two standard deviations cheap relative to growth. Chart 66Small Caps Look Attractive Relative To Large Caps
Small Caps Look Attractive Relative To Large Caps
Small Caps Look Attractive Relative To Large Caps
Chart 67Value Remains Cheap
Value Remains Cheap
Value Remains Cheap
Chart 68Higher Yields Tend To Flatter Bank Stocks And Usually Weigh On Tech
Higher Yields Tend To Flatter Bank Stocks And Usually Weigh On Tech
Higher Yields Tend To Flatter Bank Stocks And Usually Weigh On Tech
Tech stocks are overrepresented in growth indices, while banks are overrepresented in value indices. US banks have held up relatively well since the start of the year but have not gained as much as one would have expected based on the significant increase in bond yields (Chart 68). With the deleveraging cycle in the US coming to an end, US banks sport both attractive valuations and the potential for better-than-expected earnings growth. European banks should also recover as the situation in Ukraine stabilizes. They trade at only 7.9-times forward earnings and 0.6-times book. On the flipside, structurally higher bond yields will weigh on tech shares. Moreover, as we discussed in our recent report entitled The Disruptor Delusion, a cooling in pandemic-related tech spending, increasing market saturation, and concerns about Big Tech’s excessive power will all hurt tech returns. Peter Berezin Chief Global Strategist peterb@bcaresearch.com Footnotes 1 The Federal Reserve targets an average inflation rate of 2% for the personal consumption expenditures (PCE) index. The TIPS breakeven is based on the CPI index. Due to compositional differences between the two indices, CPI inflation has historically averaged 30-to-50 basis points higher than PCE inflation. This is why the Fed effectively targets a CPI inflation rate of about 2.3%-to-2.5%. 2 These savings can either by generated domestically or imported from abroad via a current account deficit. 3 Theoretically, there is a close relationship between trend growth and the equilibrium investment-to-GDP ratio. For example, if real trend growth is 3% and the capital stock-to-GDP ratio is 200%, a country would need to invest 6% of GDP net of depreciation to maintain the existing capital stock-to-GDP ratio. In contrast, if trend growth were to fall to 2%, the country would only need to invest 4% of GDP. Global Investment Strategy View Matrix
2022 Second Quarter Strategy Outlook – The New Neutral
2022 Second Quarter Strategy Outlook – The New Neutral
Special Trade Recommendations Current MacroQuant Model Scores
2022 Second Quarter Strategy Outlook – The New Neutral
2022 Second Quarter Strategy Outlook – The New Neutral
Executive Summary Oil Remains A Prominent Inflation Variable
WTI Futures Strongly Linked To US Inflation Expectations
WTI Futures Strongly Linked To US Inflation Expectations
Tight oil and metals markets will translate into persistently high inflation and inflation expectations over the next 5 – 10 years. High and volatile commodity prices caused by low capex will keep global inventories tight for years. This will keep the key 5-year/5-year (5y5y) CPI swap rates used by policy makers elevated, given the strong relationship between commodity prices – particularly longer-dated oil prices – and inflation expectations. Central banks will exacerbate this tightness if they follow through on more aggressive policy. This would increase the cost of capital for commodity producers and could induce a recession. All the same, commodity supplies still will remain tight, and will keep inflationary pressures emanating from the real economy elevated. Stagflation is the likely outcome. Gold is lagging as an inflation hedge vs. the average return of our commodity recommendations. We expect this to persist. Still, as a safe-haven and store of value during recessionary and inflationary periods, we continue to recommend gold as a portfolio hedge. Bottom Line: The dearth of capex in oil, gas and base metals markets makes persistently high inflation a foregone conclusion for the next 5-10 years. We remain long the S&P GSCI and the COMT ETF for direct commodity-index exposure, and the XOP, XME and PICK ETFs for exposure to commodity producers' equity. Feature That's all well and good in practice, but how does it work in theory? - Seen on a T-shirt at the University of Chicago1 Related Report Commodity & Energy StrategyCommodities' Watershed Moment Central banks are signaling they expect higher inflation and inflation expectations to persist, and now are communicating their collective resolve to deal with this aggressively, if needs be.2 As central-bank policy evolves, commodities – particularly oil – will become even more important as coincident and leading indicators used to assess the likely course of inflation and inflation expectations, particularly their persistence. The ECB notes oil prices have become more than just one of the input costs of manufacturing, or of mining, agriculture and the production of other forms of energy essential to powering modern economies, and delivering these goods globally. For the ECB, "oil is barometer of global economic activity as well as a financial asset."3 Likewise, the BIS stresses the importance of augmenting conventional Phillips curve models with commodity inputs to more accurately capture inflation dynamics.4 This Special Report follows our earlier report published on March 10, 2022 entitled Commodities' Watershed Moment. Here we explore the consequences of tightening commodity markets, especially as regards inflation and inflation expectations, and attempt to dispel some notions about commodities and markets that could lead to policy errors. We also evaluate our commodity recommendations' performance as inflation hedges compared to gold's performance. Modeling Inflation And Inflation Expectations Our own research and modeling broadly aligns with the ECB and BIS approaches. We periodically estimate cointegrating regressions of inflation expectations using WTI futures prices to forecast 5y5y CPI swap rates (Chart 1).5 Our results are strongest when we use 3-years forward WTI prices to forecast 5y5y CPI swap rates, but shorter-term futures also provide useful information and are cointegrated with inflation expectations discovered in the 5y5y market (Chart 2). The prompt-delivery WTI futures are cointegrated with the longer-dated 3-years forward futures contract, indicating that, over time, these different maturities are following a common long-term trend. This also explains why a similar equilibrium obtains using commodity indexes – the Bloomberg Commodity Index, the S&P GSCI, etc. – as regressors in estimating inflation expectations via the 5y5y CPI swap rates. Chart 1WTI Futures Strongly Linked To US Inflation Expectations
WTI Futures Strongly Linked To US Inflation Expectations
WTI Futures Strongly Linked To US Inflation Expectations
Chart 2US Oil Output Slightly Higher
US Oil Output Slightly Higher
US Oil Output Slightly Higher
Globalization of production, distribution and consumption across markets weaves these markets together – e.g., global fertilizer markets experienced a supply shock this past winter when large consuming markets in Asia and Europe got into a bidding war for limited LNG supplies – and transmits shocks across commodity markets. This partly explains the common long-term trend commodities generally share. Another feature weaving markets together globally is the fact that most global trade is invoiced and funded in USD, which means that the Fed's monetary policy decisions reverberate around the world when rates are increased or dollar liquidity is reduced.6 Lastly, trading markets are global. Commodity markets have evolved – as the ECB notes – into asset markets as well as hedging markets. This means arbitrage across commodity and rates markets (interest rates, inflation rates, FX rates, etc.) accelerates the impounding of information into prices quickly. In this environment, cointegration is strengthened among physical and financial trading markets, creating prices that share long-term equilibria. This makes the current time especially fraught, as the Fed embarks on a policy-tightening course against the backdrop of war in Europe and global commodity shortages. These effects are experienced across geographies and across time, forming a dynamic system in which supply, demand and inventories are constantly adjusting to new information. This affects current and expected fundamentals and financial conditions, which arrives to markets instantaneously. It is not surprising, then, that prices in these markets are, for the most part, cointegrated over the long run.7 Policy Errors Likely On The Way Monetary policy is not well suited to dealing with commodity scarcity. Nor is fiscal policy – e.g., government subsidies to soften the blow of rising energy prices only encourage over-consumption of scarce resources, which accelerates inventory depletion and tightens markets further. The Fed, in particular, likely is reviewing its 1970s playbook for lessons learned in the last major supply shock to hit the world – the Arab Oil Embargo of 1973, which was followed by the Iran-Iraq war in 1979. Together, these events triggered a surge in real oil prices, which rose by 4.5x – from $21.55/bbl in 1970 to $116.11/bbl in 1980, according to the EIA (Chart 3). Chart 3Fed Will Look Back At 1970s Playbook
Tight Commodity Markets: Persistently High Inflation
Tight Commodity Markets: Persistently High Inflation
In setting policy, economists generally – at the Fed, the IMF, the World Bank and elsewhere – mistakenly view commodity forward curves as something of a forecast.8 This use of the futures curve is mistaken because it only reflects the price levels as which transactions occurred on any given day. So while a non-specialist might view a backwardated forward curve for Brent as a market-based forecast for lower prices in the future – since prompt prices are trading below deferred prices – a more accurate reading would suggest markets are tight and likely will remain tight. This particular term structure indicates physical inventories are tight, and will remain so until sufficient supply is brought to market to allow refiners to restock. Steep backwardations also predispose markets to higher price volatility, because because of low inventory levels: The market's shock absorber (inventories) is low, so volatility increases.9 Suppose policy makers are counting on lower oil prices – per a forward curve's "forecast" – to bring inflation down. In that case, they likely will be disappointed unless additional supplies arrive. Should the Fed act on the belief that backwardation is a forecast for lower prices and continue to provide forward guidance to markets suggesting inflation will be lower next year, e.g., any delay in its rate hikes will leave it behind the inflation curve. Additional policy errors can come from the fiscal side, for example, when governments provide subsidies to soften the blow of higher oil prices. This retards the function of the price mechanism, and incentivizes higher consumption, which will exacerbate price increases. This would be bullish for oil prices in the short and medium term (6 months – 2 years). Commodity markets are tight globally – at or near scarcity levels in many cases, as can be seen by the continually declining inventories in oil and base metals (Chart 4 and 5). Base metals markets are extremely tight, and are on the back foot – i.e., with physical deficits and low inventories – just as the world's largest economic blocks (EU, US, China) are launching massive buildouts of their renewable-generation fleets and electric grids, and embarking on massive military buildups. These applications will require huge increases in base metals supplies to pull off. Grain markets will tighten as the impact of the Russian invasion of Ukraine unfolds in the spring, when winter wheat crops in Ukraine will need to be fertilized and tended. Chart 4Oil Markets Remain Tight...
Oil Markets Remain Tight...
Oil Markets Remain Tight...
Chart 5…As Do Metals
Tight Commodity Markets: Persistently High Inflation
Tight Commodity Markets: Persistently High Inflation
Barring an extremely deep recession that sharply reduces aggregate demand globally, it is difficult to see how this is not inflationary for years to come. Nonetheless, even a deep recession will still leave markets massively short base metals, and, after core-OPEC producers Saudi Arabia and the UAE bring what left of their spare capacity to market, oil. Investment Implications In days gone by, gold served as a go-to inflation hedge. At present, gold is lagging as an inflation hedge vs. the average return of our direct and equity-related commodity recommendations (Chart 6). We expect this to persist. Gold has performed well against the broad-trade weighted USD, however (Chart 7). We continue to recommend gold as a portfolio hedge, as it remains responsive to policy and geopolitical shocks. And it remains a safe-haven and store of value during recessionary and inflationary periods. Chart 6Commodity Recommendations Outperform Gold
Commodity Recommendations Outperform Gold
Commodity Recommendations Outperform Gold
Chart 7Gold Outperforms USD
Gold Outperforms USD
Gold Outperforms USD
The dearth of capex in oil, gas and base metals markets makes persistently high inflation a foregone conclusion for the next 5-10 years, barring a steep recession. Such a turn of events diminishes in probability, as governments keep funneling subsidies to households to soften the blow of higher prices and stave off a recessionary contraction in GDP. These subsidies only succeed in retarding the price signal the market is sending to reduce consumption of scarce commodities, which means available inventories will be drawn down more quickly. We remain long the S&P GSCI and the COMT ETF for direct commodity-index exposure, and the XOP, XME and PICK ETFs for exposure to commodity producers' equity. These are long-term holdings, given our view the commodities bull market will run for years. Robert P. Ryan Chief Commodity & Energy Strategist rryan@bcaresearch.com Footnotes 1 Please see That Works Very Well in Practice, But How Does It Work In Theory? Published by quoteinvestigator.com for a history of how this phrase made it to UChicago's T-shirts. 2 Please see Between A Rock And A Hard Place, published 21 March 2022 by our US Investment Strategy, which is led by Doug Peta, a UChicago alum. 3 For insight into how central banks assess inflation and inflation expectations vis-à-vis commodity markets, particularly oil, please see the ECB's September 2020 working paper entitled " Global financial markets and oil price shocks in real time," by Fabrizio Venditti, Giovanni Veronese. In it, the authors note, "The role that the price of oil plays in economic analysis in central banks and in financial markets has evolved over time. Oil is not seen anymore just as a (sic) input to production but also as a barometer of global economic activity as well as a financial asset." 4 The BIS recently noted augmenting standard Phillips Curve models with information from commodities and FX markets to reflect the profound changes wrought by globalization is critical for improving inflation forecasts, and explaining the dynamics of inflation and inflation expectations. Please see "Has globalization changed the inflation process?" by Kristin J. Forbes, published by the Bank for International Settlements in June 2019. She notes, "The results in this paper suggest it is necessary to incorporate additional “global” factors in models of inflation dynamics, including global slack, non-fuel commodity prices (as well as oil prices), the exchange rate, and global price competition" to accurately explain and forecast inflation. See below for further discussion. 5 In our modeling, the regressor with the best fit in our 5y5y CPI swap forecasts is the WTI 3-years forward futures contract. Both the 5y5y CPI swap rate and the WTI futures are non-stationary variables sharing a common long-term trend, meaning these are cointegrated random variables. The time series we use start in 2010, so post-GFC, which was a regime change for markets globally. The regression diagnostics are very strong, particularly for the ARDL model. We also find the 3-years forward WTI price is cointegrated with the prompt WTI futures contract, indicating these variables – one calling for delivery of crude oil in 3 years, the other in one month – are cointegrated. We get similar cointegration results using commodity indexes – e.g., the Bloomberg Commodity Index, and the LME base metals index – which tend to use futures contracts closer to delivery. This indicates commodity prices generally can be thought of as non-stationary variables vibrating randomly around a common long-term trend. We use cointegration models to avoid spurious relationships – e.g., regressing a stationary variable on a non-stationary variable. Statistically, cointegration is much stronger than simple correlation because it avoids the trap of spurious relationships. Please see Granger, C.W.J., Developments in the Study of Cointegrated Variables, Chapter 4 in Engle and Granger (eds): 1991, Long-Run Economic Relationships. Readings in Cointegration, Oxford University Press. This is an a article by Clive Granger, who received the Nobel prize in economics in 2003 for his pioneering work developing the mathematics of cointegration. See also Geman, H. (2007), Mean reversion versus random walk in oil and natural gas prices, in Advances in Mathematical Finance (pp. 219-228), for a rigorous discussion of random-walking oil and gas variables. 6 Please see Global Dimensions of U.S. Monetary Policy by Maurice Obstfeld, which appeared in the February 2020 issue of International Journal of Central Banking for an excellent discussion of the Fed's role in global trade. This is not all a one-way street, as Obstfeld notes, in that policy decisions can create "potential spillback onto the U.S. economy from the disproportionate influence of U.S. monetary policy on the outside world." 7 These cointegrating features of commodity markets, inflation rates and USD effects are not agreed by all economists. See, e.g., the Oxford Institute for Energy Studies report of August 2021 Is the Oil Price-Inflation Relationship Transitory? by Ilia Bouchouev. The paper notes, "In theory, the fundamental relationship that exists between short-term inflation and gasoline futures should be fading away with time, and for 5y5y breakeven it should indeed be close to zero. In practice, however, it is not." 8 Please see Forecasting the price of oil, which was published by the ECB in Issue 4 of its 2015. The Bank notes, "Oil price futures are frequently used as the baseline for oil price assumptions in economic projections. They are used, for example, in the Eurosystem/ECB staff macroeconomic projections and in the projections of many other central banks and international institutions. The main reason for using futures as a baseline for oil price assumptions is that they provide a simple and transparent method which is easy to communicate." (p. 90) 9 Please see Kogan, Leonid, Dmitry Livdan and Amir Yaron (2009), " Oil Futures Prices in a Production Economy With Investment Constraints," The Journal of Finance, 64:3, pp. 1345-1375. Investment Views and Themes Strategic Recommendations Trades Closed in 2021
Image
Tensions between the West and Russia are intensifying. Although Russian Foreign Minister Sergei Lavrov stated in a televised meeting with President Vladimir Putin that there is still a possibility that diplomatic engagement will succeed, US National Security…

Executive Summary Inflation Expectations Likely Too Low
Inflation Expectations Likely Too Low
Inflation Expectations Likely Too Low
Inverted term structures for industrial commodities likely are being interpreted as forecasts of lower prices. This leads investors to assume the real economy will not be a source of persistent inflationary pressure. This is misguided: Backwardations (i.e., inverted forward curves) are evidence of tight markets facing severe upside price pressures, not lower prices ahead. Oil and base metals prices share a stronger relationship with US 5-year/5-year inflation expectations than gold, which is more correlated with short-term inflation expectations. Increases in US permanent unemployment are positively correlated with 5y5y inflation expectations. This suggests markets price in a more accommodative Fed as permanent unemployment increases, and vice versa. US PCEPI realized core inflation is negatively correlated with permanent unemployment levels, suggesting markets are pricing lower inflation as permanent unemployment rises, and vice versa. Bottom Line: Markets generally exhibit well-anchored inflation expectations. We believe these will be undone by profound backwardations in industrial commodities, which point to steadily increasing inflation pressures from the real economy to end-2023. Thereafter, oil and metals demand will continue to grow faster than supply, as the renewable-energy transition picks up steam. We remain long commodity-index exposure, and industrial-commodity producers' equity via ETFs. Feature Backwardated forward curves for industrial commodities – oil and base metals, in particular – are clear evidence these markets are pricing to severe physical supply deficits, which presently are being covered by drawing down inventories.1 These inverted term structures for industrial commodities likely are being interpreted as forecasts of lower prices, which leads investors to assume the real economy will not be a source of more permanent inflationary pressure. This is misguided, in our view: Profound inversions in the term structure of commodities (i.e., backwardations) are evidence of tight markets facing severe upside price pressures. Persistently tight supply-demand balances are keeping the forward curves of industrial commodities backwardated, as inventories are drawn down to cover physical supply deficits. These deficits are dramatically evident in oil markets (Chart 1) and copper markets (Chart 2), both of which are widely followed by investors and corporates alike. Chart 1Tight Oil Markets
Tight Oil Markets
Tight Oil Markets
Chart 2Coppers Physical Deficits Will Persist...
Coppers Physical Deficits Will Persist...
Coppers Physical Deficits Will Persist...
Higher Commodity Prices, Higher Inflation In Chart 3, we show the difference between the forecast outcome of US 5-year/5-year (US5y5y) CPI inflation expectations drawn from the CPI swap markets as a function of our internal oil-price forecasts and commodity forwards reflecting futures-contract settlements. These curves show the model based on the futures curve understates the expected path of inflation expectations versus our oil-price forecasts. When we used our higher oil price forecasts – based on the scenario where OPEC 2.0 and the US fail to increase oil supply in 2022 and 2023 – US5y5y rates tracked the increase in oil prices. The results of these forecasts show that oil prices, and more broadly, the real economy, feeds directly into inflation expectations. We modelled the US5y5y rates as a function of additional commodity prices as well – namely, copper and gold (Chart 4). The coefficients for commodity prices associated with the levels equation was always positive, irrespective of the commodity, implying that commodity prices and inflation expectations share a long-run equilibrium. We ran these regressions with nearer term forward inflation expectation rates as well, and found the direction of the relationship held.2 Chart 3Inflation Expectations Likely Too Low
Inflation Expectations Likely Too Low
Inflation Expectations Likely Too Low
Chart 4Consistent Relationships Between Commodities and Inflation Expectations
Consistent Relationships Between Commodities and Inflation Expectations
Consistent Relationships Between Commodities and Inflation Expectations
Gold Hedges Shorter-Term Inflation Expectations Gold prices had a stronger relationship to nearer-term forward inflation expectation rates than WTI and COMEX copper prices, in our modeling. On the other hand, WTI and COMEX copper prices had stronger relationships with longer-term forward inflation expectation rates than gold prices. These results suggest different commodities can be used to hedge different segments of the inflation-expectations term structure, which is a novel outcome to our modeling. This strongly suggests a portfolio of gold, copper and crude oil – using futures, commodity indices or physical assets – can hedge the inflation-expectations term structure. Labor Markets And Inflation Expectations We also modelled realized monthly inflation and US5y5y inflation expectations as a function of permanent job losses, a series maintained by the US Bureau of Labor Statistics (BLS). The coefficient associated with permanent job losses was positive (Chart 5). Increases in US permanent job losses are positively correlated with 5y5y inflation expectations. This suggests markets price in a more accommodative Fed in the future as permanent unemployment increases, and vice versa. This positive relationship holds even when WTI and copper prices are added as regressors to the equation. We also find that realized US PCEPI core inflation – the Fed's preferred gauge – is negatively correlated with permanent unemployment levels, suggesting markets are pricing lower inflation as permanent job losses increase (Chart 6). This also is intuitively appealing in the model, as it points toward the markets' assessments of Fed policy functions. Chart 5Labor Markets Also Effect Inflation Expectations
Labor Markets Also Effect Inflation Expectations
Labor Markets Also Effect Inflation Expectations
Chart 6Lower Inflation When Permanent Job Losses Rises
Lower Inflation When Permanent Job Losses Rises
Lower Inflation When Permanent Job Losses Rises
Investment Implications In earlier research, we showed commodity prices generally feed directly into realized inflation and inflation expectations (Chart 7).3 In the current report, we also showed that different commodities are better suited for hedging inflation expectations at different points along the inflation forward curve, which is a novel finding. We continue to expect the global energy transition to keep industrial commodities well bid for at least the next decade, as markets are forced to reconcile increasing demand for hydrocarbons and base metals with flat to declining supplies. On top of this, as we have noted in the past, there is a growing list of exogenous threats to the supply side. Among them are the election of left-of-center governments in important commodity-producing states, which have campaigned on redistributionist agendas; climate activism at the board level at major energy suppliers and in the courtroom, and mounting calls for still-undefined ESG compliance. Chart 7Commodity Indices Move Closely With Inflation Expectations
Commodity Indices Move Closely With Inflation Expectations
Commodity Indices Move Closely With Inflation Expectations
All of these threats – not to mention increasing geopolitical threats globally – add uncertainty to the evolution of commodity markets and increase the costs of producing commodities. As supply curves become more inelastic, higher prices for these commodities will be required to allocate capital and ration demand. We remain long commodity-index exposure, and industrial-commodity producers' equity via ETFs. Robert P. Ryan Chief Commodity & Energy Strategist rryan@bcaresearch.com Ashwin Shyam Research Associate Commodity & Energy Strategy ashwin.shyam@bcaresearch.com Commodities Round-Up Energy: Bullish US liquified natural gas (LNG) exports surged to an average of 11.2 Bcf/d last month, an 8% increase from the 10.4 Bcf/d shipped ex-US in 4Q21, according to the US EIA. Continued strength in Asia and Europe were responsible for the increase. The EIA cited the low level of European inventories for the sharp move higher. We have been expecting European demand to remain strong coming out of winter, as inventories are rebuilt (Chart 8). Exports are expected to average 11.3 Bcf/d this year, or 16% above 2021 levels. Base Metals: Bullish LME aluminum prices hit their highest since 2008, on the back of low inventory levels and supply disruptions (Chart 9). Industrial metals generally are facing tight markets, with nickel hitting a decade high earlier this year. Towards the end of last year, Zinc prices started rising and are now closing in on the decade high seen in October 2021. Low inventories of these metals in different parts of the world are backwardating forward curves and causing prices to rise. For example, according to data from World Bureau of Metal Statistics, Zinc LME stocks were only at 1,650 tons in December in Europe. Reduced supply and refining activity in Europe and China, have contributed to these markets’ tightness. In Europe, high power prices have caused smelters to stop production, while in China, refining activity has fallen due to the country’s zero-COVID tolerance policy. Precious Metals: Bullish According to the Australian Department of Industry, Science, Energy and Resources, the semiconductor chip shortage is expected to result in 7.7 million fewer vehicles being made in 2021. According to data from SFA Oxford via Heraeus, in 2021, automotive demand is forecast to constitute 80% of total palladium demand. The underperforming automotive sector, which makes up a significant chunk of palladium demand, led to Palladium being one of the worst performing commodities in 2021. The chip shortage will persist into 2022, pressuring automotive demand for platinum and palladium. Weak auto production will affect platinum to a lesser extent, since demand from automotive manufacturing constitutes just ~30% of total demand. Recently, however, palladium prices rose on geopolitical uncertainty arising from the escalating Russia-Ukraine conflict. Russia constitutes ~ 43% of global palladium production. Chart 8
Commodities Unmoor Inflation Expectations
Commodities Unmoor Inflation Expectations
Chart 9
Aluminum Hitting Highs
Aluminum Hitting Highs
Footnotes 1 Chart on p. 1 (Chart 3 below) shows the impact the backwardation in crude oil has on forecasted US 5-year/5-year inflation expectations in Model Output 2. The backwardation in Model Output 3 lowers the US5y5y estimate, while our forecast for higher prices raises the inflation expectation. We have written at length on this topic, most recently in our reports of on January 27, 2022, Short Squeezes In Copper, Nickel Highlight Tight Metals Markets, on January 6, 2022, Persistent Inflation Pressures From Commodities and on November 4, 2021, in a report entitled Despite Weaker Prices Crude Oil Backwardation Will Persist. These reports are available at ces.bcaresearch.com. 2 COMEX copper and WTI oil futures are stronger regressors in explaining US5y5y – i.e., their shared long-term trend (i.e., cointegration) is stronger (statistically speaking) than gold futures. This is particularly evident in the regressions of US5y5y employing realized CPI monthly inflation and US real exchange rates as additional explanatory variables in the equations using the industrial-commodity prices. It is worthwhile noting that the 3-year forward WTI futures contract as a lone regressor for US5y5y inflation expectations continues to produce some of the strongest results in our modelling exercise. Indeed, as a sole regressor, it dominates the other models. 3 Please see More Commodity-Led Inflation On The Way and Persistent Inflation Pressures From Commodities published on December 9, 2021 and on January 6, 2022, respectively. Both are available at ces.bcaresearch.com. Investment Views and Themes Strategic Recommendations Trades Closed in 2021
Image
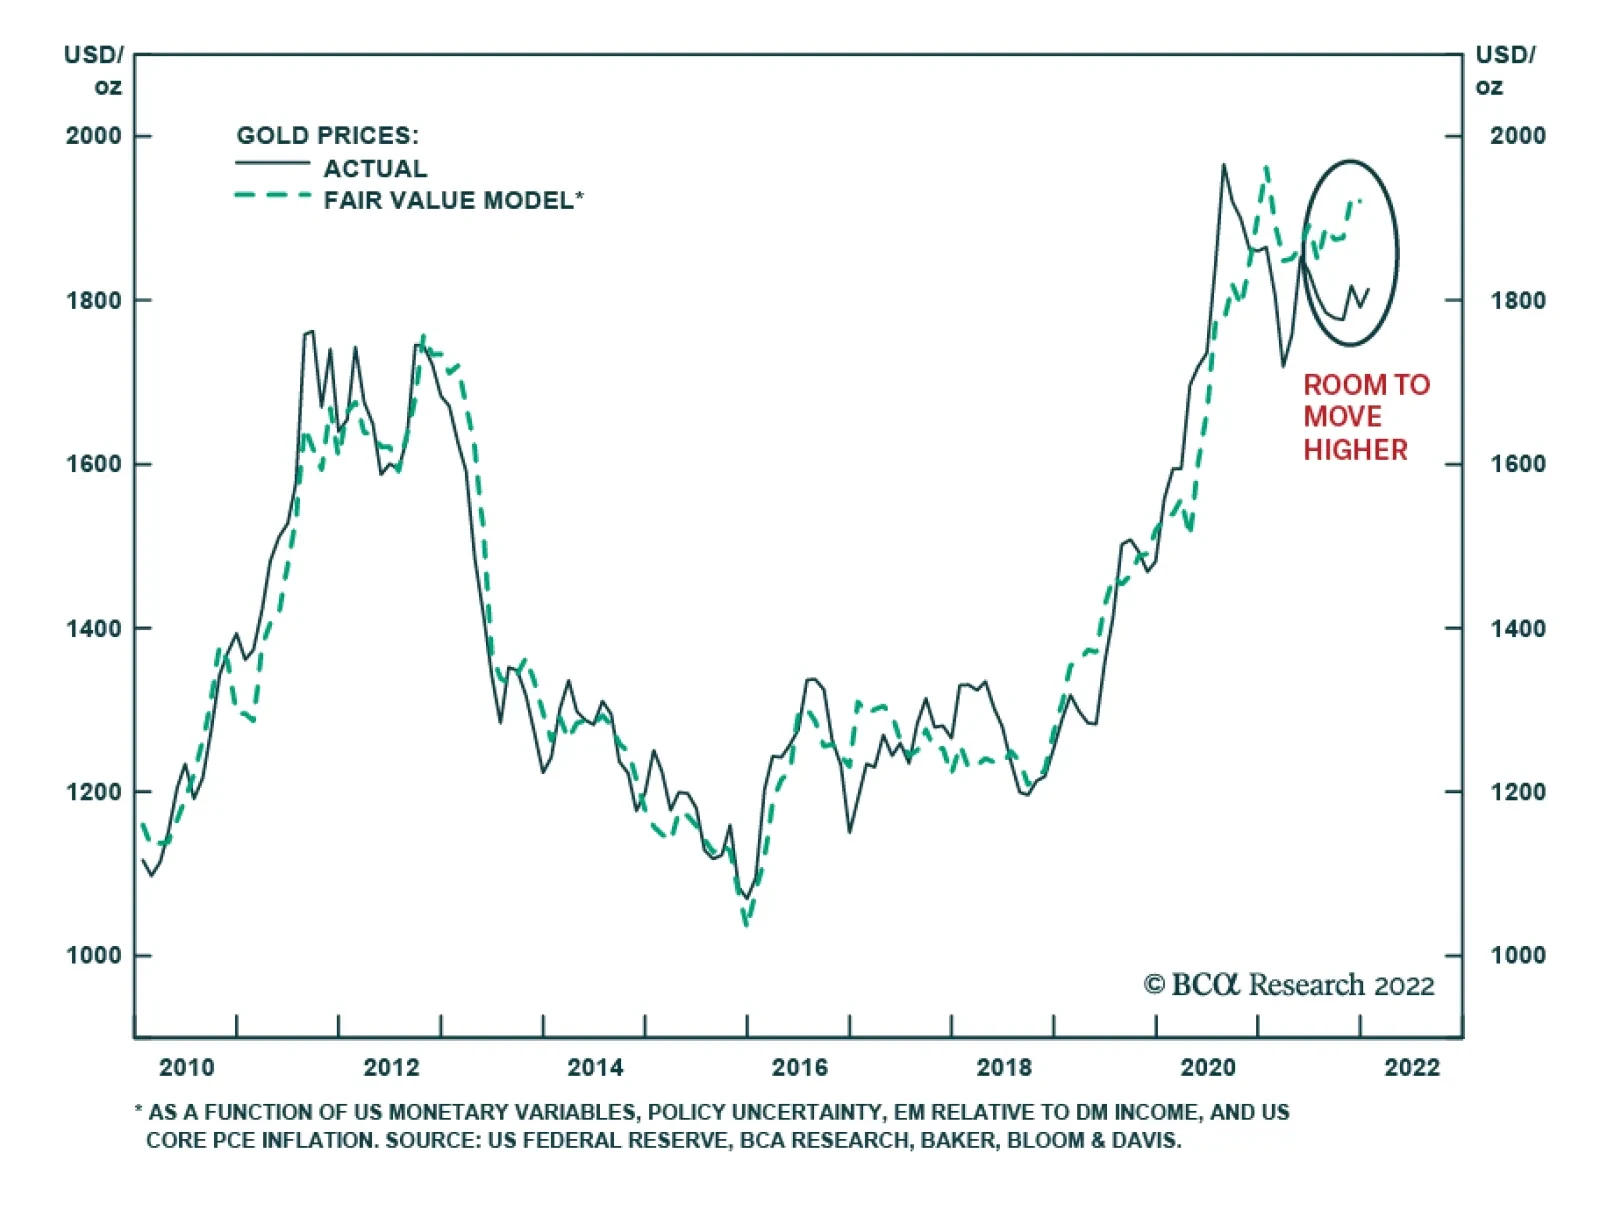
The price of gold has been grinding higher since the beginning of December and now stands at a two-month high. The outlook for gold from here is clouded by opposing forces. On the one hand, gold benefits from investors looking to hedge against rising…
Dear client, This is our final report for this year. Clients who missed our FX key views report last week can access the link here. We thank you for your continued readership, and wish you happy and healthy holidays. Kind regards, Chester Highlights We were offside on the dollar this year. Our 94-95 ceiling for the DXY was punched in November (currently 96). More importantly, the dollar is the strongest performing G10 currency this year, which we did not anticipate. That said, both the Norges Bank and the Bank of England hiked rates today. This reinforces our conviction that the Fed will stay behind the curve. Our trades still managed to deliver alpha. Our batting average (percentage of wins) was 64%. Our worst performing trade was to go long silver in July this year and go short USD/JPY in May. This proved premature as the dollar extended its rally, following a hawkish shift by the Federal Reserve. Our best trades were being opportunistically long the Scandinavian currencies, short the gold/silver ratio and short EUR/GBP. More importantly, swimming against the tide, we benefited from respecting our stop losses, and not overstaying our welcome in profitable trades. Our current view is that the dollar has some more near-term upside. Our target for the DXY is 98 over the next few months or so, but we expect a reversal after. For the moment, we are playing three themes in the FX market – policy convergence between central banks (long EUR/GBP, AUD/NZD and short USD/JPY), a rise in FX volatility (long CHF/NZD), and forthcoming green shoots in China (long AUD/USD). That said, we will maintain tight stops on all these trades, given the landscape remains fraught with uncertainty. Feature The dollar is in a perfect storm, characterized by rising inflation that is prompting the Federal Reserve to turn more hawkish, but also raising the possibility that it kills the US recovery. The US 10/2 Treasury curve slope has flattened to 79 bps, and the 30/2 Treasury slope has collapsed to 120 bps (Chart 1A). Historically, this pattern of curve flattening has been symptomatic of a brewing recession and further gains in the dollar (Chart 1B). Chart 1AThe Dollar And The Yield Curve
The Dollar And The Yield Curve
The Dollar And The Yield Curve
Chart 1BThe Dollar And The Yield Curve
The Dollar And The Yield Curve
The Dollar And The Yield Curve
Two-year yields have shot up in the US, relative to other G10 countries. This is a phenomenon that has been pretty consistent throughout the year with sub-zero interest rate countries (euro area, Japan, Switzerland, Chart 2A) but is becoming even more broad based. Two-year yields are accelerating in the US versus countries such as Canada, New Zealand and Norway, where their central banks have already ended QE and/or are raising interest rates. It is also interesting that their currencies have depreciated more this year than what will be implied by nominal yield differentials (Chart 2B). Chart 2ARising Short-Term Rates In The US
Rising Short-Term Rates In The US
Rising Short-Term Rates In The US
Chart 2BRising Short-Term Rates In The US
Rising Short-Term Rates In The US
Rising Short-Term Rates In The US
The Federal Reserve’s own estimates suggest that a 10% increase in the dollar will shave US real growth by 50 bps the following year, an additional 20 bps the year after. This is occurring when China is easing monetary policy, which will likely support growth outside the US. Commodity currencies such as the AUD, NZD and NOK are very sensitive to subtle shifts in Chinese growth (Chart 3). If financial conditions tighten in the US while easing elsewhere, it pretty much ensures that growth will rotate next year from the US to other countries that have seen their currencies weaken (Chart 4). Chart 3Commodity Currencies Weighed Down By The China Slowdown
Commodity Currencies Weighed Down By The China Slowdown
Commodity Currencies Weighed Down By The China Slowdown
Chart 4The US Dollar And Relative ##br##Growth
The US Dollar And Relative Growth
The US Dollar And Relative Growth
This year, our bias was that the Fed will lag the inflation curve, relative to other central banks, and this will weaken the dollar. This thesis hinged on two critical observations. First, real rates in the US remained very low as the Fed was lagging other central banks in tightening policy. Almost all central banks, with the exception of the Bank of Japan and the European Central Bank, have already ended QE. Many have also hiked interest rates (Chart 5). Second, and related, inflation overshot in the US relative to other countries (Chart 6). Where we went wrong was not anticipating that the market would price in a more credible Fed, especially against other G10 central banks. Chart 5Worldwide Monetary Normalization Weighs On The Dollar
Worldwide Monetary Normalization Weighs On The Dollar
Worldwide Monetary Normalization Weighs On The Dollar
Chart 6Surging US Inflation Also Bearish For The Dollar
Surging US Inflation Also Bearish For The Dollar
Surging US Inflation Also Bearish For The Dollar
In the near term, we think the dollar continues to do well, but we are not betting on an overshoot. Longer term, the themes suggested in our outlook should play out, including a weaker dollar. In the next few sections, we review some of our big losses this year, as well as our winners. Finally, in April 2020, we designed a rules-based trading model to see if, over time, currencies could be traded purely mechanically. That model was also offside this year, shorting the dollar 9 out of 12 months. That said, over time, a model grounded in the fundamental basis that has defined the BCA approach provided alpha (Chart 7). According to the model, investors should be long most G10 currencies versus the dollar, except the Japanese yen and the New Zealand dollar (Chart 8A and 8B). Chart 7Our USD Model Takes A Long-Term Approach
Our USD Model Takes A Long-Term Approach
Our USD Model Takes A Long-Term Approach
Chart 8AOur Model Is USD Bearish
Our Model Is USD Bearish
Our Model Is USD Bearish
Chart 8BOur Model Is USD Bearish
Our Model Is USD Bearish
Our Model Is USD Bearish
Overall Trade Performance For 2021 Chart 9 highlights the timeline of closed trades in 2021, alongside performance. Our trades still managed to deliver alpha. Our batting average (percentage of wins) was 64%. The cumulative return this year was 37%, the mean return was 1.1%, and the median return was 1.3%.
Chart 9
Our worst performing trade was to go long silver in July this year and go short USD/JPY in May. Our long silver trade was by far the worst decision. Excluding this trade, our cumulative returns this year would have been 50.6%, with a mean return of 1.6%, and a median return of 1.4%. We implemented this trade after the hawkish shift by the Federal Reserve, but it proved premature as the dollar extended its rally. Short USD/JPY
Chart 10
We were long the yen against the dollar for the entire second half of 2020, and opportunistically long in the spring and summer of 2021. Real rate differentials versus the US supported the yen. Equally important was the yen’s hedging benefit among our other trades at the time, most of which were pro-growth. Finally, the yen was also cheap. Going long in June was particularly interesting. First, we believed that the dollar rally would be short lived, a view that was offside for 2021. We also observed that a nation’s currency tended to outperform as it hosted the Olympic Games, leading to our belief that the yen would benefit from the Tokyo Summer Games (Chart 10). In the end, the two-year yield differential between the US and Japan was the most important driver for the yen. We remain long, but with a stop loss at our latest entry point of 114.40. Long Petrocurrencies (CAD, NOK, MXN, RUB And COP) Versus The Euro Chart 11Commodity Currencies Still Have Upside
Commodity Currencies Still Have Upside
Commodity Currencies Still Have Upside
Our Commodity Strategists have been bullish oil since the bottom in 2020, a call that has been prescient. As a derivative, we went long a petrocurrency basket against the euro for most of the second half of 2020. We took profits on that trade when our trailing stop was triggered, but the returns were mostly from the carry. Towards the end of October 2021, we once again went long the basket, given the divergence between currency performance and surging oil prices (Chart 11). However, we were stopped out a month later as the dollar started to rally on the back of an increasingly hawkish Fed. Overall, our rational for the trade played out, but the meagre gains were because we were swimming against the tide of a strong dollar. Short EUR/GBP We sold this pair in September of 2020 mainly based on the belief that stalled UK/EU trade talks instilled too much pessimism in the market, leading to an undervalued pound against the euro. The UK data that came out during that time were also relatively strong compared to both the US and the euro area. We closed the trade for a sizeable profit. Short CAD/NOK Chart 12The CAD/NOK Still Has Downside
The CAD/NOK Still Has Downside
The CAD/NOK Still Has Downside
Our main rationale for this trade rested on the differences in geographies for these oil sources, amidst a bullish oil environment. While both of these petrocurrencies strengthened, Canadian oil’s lower grade and higher cost of transportation would subject the loonie to underperformance against the NOK. CAD/NOK is also correlated to EUR/USD because of economic ties, and so a bet on a stronger euro (driven by stronger economic performance outside the US) was also a bet on a lower CAD/NOK (Chart 12). Our view turned out to be right. Long EUR/CHF Chart 13EUR/CHF And The German Bund Yield
EUR/CHF And The German Bund Yield
EUR/CHF And The German Bund Yield
We went long EUR/CHF in November 2020 and took profits in May 2021. At the time, CHF had appreciated by 1.2% in a week, opening an interesting gap between EUR/CHF and USD/CHF. This suggested that either the franc was too high versus the euro, or the euro was too high versus the dollar. The overall rationale behind the trade was right. The SNB maintained a dovish stance with a close focus on the exchange rate. Going forward, rising yields on the back of an economic recovery will support EUR/CHF (Chart 13). EUR/CHF is also underpinned by cheap valuations. We remain long the cross. Long CAD/NZD And AUD/NZD Our bias on NZD for most of the 2021 has been negative at the crosses. This was based on two driving factors. First, according to our models, the kiwi is the most expensive G10 currency after the dollar. Second, we did not believe the Reserve Bank of New Zealand could credibly hike interest rates ahead of other G10 countries. New Zealand is an island geographically but not economically. As such, we have been short NZD at the crosses. Other factors add to this high-conviction view. First, the New Zealand stock market is the most defensive in the G10, while Canadian and Australian bourses are heavy in cyclical stocks. Should value start to outperform growth, this will favor the CAD/NZD and AUD/NZD cross. Second, in the commodity space, our bias is that energy and metals will fare better than agriculture, boosting loonie/aussie relative terms of trade. We remain long AUD/NZD, and made modest gains when we got stopped out of our previous position in April. Long Silver Relative To Gold Chart 14Gold/Silver Tracks The Dollar
Gold/Silver Tracks The Dollar
Gold/Silver Tracks The Dollar
We shorted the the gold/silver ratio four times throughout the year based on the view that global ex-US growth was poised to recover amid very accommodative policy. As such, industrial precious metals would be well supported. The gold/silver ratio is also a play on the dollar (Chart 14). Our first two attempts earlier in the spring to catch the drawdown in the gold/silver ratio both profited handsomely, registering 6.25% and 8.45% returns respectively. However, since June, the dollar has strenghthend, which has eroded the anti-fiat appeal of silver. Long Scandinavian Currencies We were long NOK and SEK for most of 2021. We were bullish on the NOK as the Norges Bank is leading the pack in raising interest rates, as we witnessed today. Indeed, for the first half of the year, the return on our Scandinavian basket was driven primarily by the NOK against both the dollar and the euro. We respected our trailing stop loss on this trade, and will reinitiate in the near future. Short AUD/MXN Chart 15AUD/MXN Still Richly Valued
AUD/MXN Still Richly Valued
AUD/MXN Still Richly Valued
Short AUD/MXN was a play on a slowdown in China. A falling credit impulse in China, and a short-term recovery in the US economy relative to the rest of the world, argued for an AUD/MXN short. Further, on a real effective exchange rate basis, AUD/MXN was richly valued (Chart 15). Our first attempt to trade the pair was unsuccessful. Once our stop loss was triggered, we reinitiated the trade and made a net profit. Long CHF/NZD We went long this pair as both a bet on rising currency volatility, but also as a hedge to our portfolio of trades, which were pivoted towards growth and recovery. Our view was right. The pair did strengthen for much of the early part of the year leading up to the end of August. We exited for a minscule profit, but reinitiated, and are now sitting on 3.98% gains. Long EUR/USD The euro has been the toughest call this year, because the ECB has been surprisingly steady on its path to keep interest rates low. In July, our limit buy on EUR/USD was triggered at 1.18. Even though a dollar rally was a major risk, we argued adjustment in the weight of the shelter component in the euro area CPI basket will boost the European CPI relative to the US. This proved premature and we obeyed our stop loss. Chester Ntonifor Foreign Exchange Strategist chestern@bcaresearch.com Kate Sun Research Analyst kate.sun@bcaresearch.com Trades & Forecasts Strategic View Tactical Holdings (0-6 months) Forecast Summary
Dear Client, This week we present our annual Commodities & Energy Strategy outlook, which contains our key views on the principal markets we cover – energy, base metals and bulks, precious metals, and ags. Over the coming decade, we expect industrial commodity prices to move higher in an increasingly volatile fashion, not unlike these markets' recent experience. In the short term, commodity markets will remain exquisitely sensitive to the evolution of the COVID-19 pandemic. The highly transmissible omicron variant of the coronavirus – now spreading at more than 4x the rate of the delta variant – appears to be less lethal than previous mutations, suggesting it could become the dominant variant globally. We remain wary, however, particularly as China still is operating under a zero-tolerance COVID-19 policy, and has relied on less efficacious vaccines that appear to offer no protection against the omicron variant of the coronavirus. This also is a risk for EM economies that rely on these vaccines. However, the roll-out of mRNA vaccines globally via joint ventures will be gathering steam in 2H22, which is bullish for commodity demand. Longer term, the effort to decarbonize global energy markets is gaining traction, with the three largest economies in the world – the US, China and EU – embarked on a massive transition to renewables. This will be a multi-decade undertaking that literally could transform the world. We expect this to continue to unfold in an erratic and uncoordinated fashion, as states work out how to decarbonize the production, delivery and consumption of goods and services. Markets critical to this transition, particularly base metals, face long odds developing the supply that will be necessary for this effort. Conventional energy markets – oil, gas and coal – are in a forced wind-down imposed by courts, investors, governments, climate activists, public opinion and policymakers, which is reducing supply at a faster rate than demand. This leaves markets exposed to volatile price bursts. As is our custom, this will be the last CES report of the year. This decade promises to be extraordinary for commodities, and we are hopeful we will continue to be of service in navigating the epic transition to a low-carbon future. As you gather with friends and loved ones, we wish you all the best in this beautiful season, Robert Ryan Chief Commodity & Energy Strategist Highlights Macro: Bullish. Systematically important central banks will remain wary of moving too strongly too soon, in the wake of the COVID-19 omicron variant. US real rates will remain low and the USD will weaken, which will support commodities. Energy: Bullish. OPEC 2.0 and the price-taking cohort will maintain existing production policies, which will restrain oil supply. The omicron variant likely will dent demand, not tank it. Our 2022 Brent forecast is slightly weaker on omicron risk, averaging $78.50/bbl, with most of the demand hit in 1H22 made up in 2H22, while our 2023 forecast is $80/bbl. Base Metals: Bullish. Supply-demand balances will remain tight. Climate activism in courts and boardrooms; ESG-related costs, local and geopolitical uncertainty will continue to weigh on supply. COMEX copper will average $4.80/lb next year and $6.00/lb in 2023. Precious Metals: Bullish. Rising commodity prices will feed directly into inflation gauges favored by the Fed. Inflation and inflation expectations will remain elevated. Gold will push to $2,000/oz and silver to $30/oz in 2022. Ags/Softs: Neutral. Ag markets will remain balanced, with a bias to the upside from higher costs of fertilizer and transportation. Erratic weather remains an upside risk. Risk: Elevated. On the upside, a less lethal omicron variant that dominates other COVID-19 variants will rally markets. A more virulent mutant would hit demand harder and push prices lower. Hospitalizations/Cases and Deaths/Cases remain the critical ratios – trajectories need to remain flat to downward for growth (Chart of the Week). Recommendations: Our COMT ETF position was stopped out on 13 December 2021, which is when the ETF went ex-dividend. The ETF paid $5.4941/share for an 18.44% dividend (p.a.). Our stop-loss is being overridden, and we remain long the COMT ETF, in the expectation commodity markets will remain tight and backwardation will continue to drive returns. Feature COVID-19 continues to determine the trajectory of global growth – hence commodity demand – and how it will be distributed in the short run. Reports this week indicating the widely used Sinovac COVID-19 vaccine used in China and EM states is ineffective in neutralizing the omicron variant will renew the focus on an underappreciated risk: High vaccination rates in and of themselves are not useful indicators of successful public-health responses.1 More than anything, what appears to matter most is the vaccine that's been used to address the public-health threat posed by COVID-19. A booster of the Pfizer-BioNTech mRNA vaccine, e.g., appears to neutralize the omicron variant, and to convey a higher likelihood of avoiding serious illness and hospitalization.2
Chart 1
This will be important going forward, as the COVID-19 omicron variant appears to be transmitted at a rate that is 4.2x as contagious as the delta variant. This raises the odds that hospital beds will fill faster as the omicron mutant spreads.3 This could again lead to reduced availability of health care, and additional lockdowns to contain the spread of the omicron variant, which would again radiate through global supply chains. Oil Market Outlook Hinges On Omicron Response The risk exposed in these public-health developments is the global commodity recovery – particularly for crude oil and refined products like gasoline and jet fuel – could become more bifurcated this year, with economies using primarily mRNA technology continuing to open and recover. States without access to or distribution of these vaccines will have to rely more on social distancing and lockdowns to contain the spread of the virus. We would expect this to be a powerful inducement to accelerate local production and distribution of mRNA vaccines in Asia, Latin America and Europe. Successful implementation of this strategy would boost commodity demand, particularly for transportation fuels.4 Our prior regarding the omicron variant is it will dent demand but not tank oil demand. To account for the so-far-unknown effects of omicron, we are assuming 1H22 global crude and refined-product demand falls to 100.4mm b/d, versus our earlier estimate of 101.5mm b/d. Most of this demand is recovered in 2H22, when we expect oil consumption to average 101.8mm b/d versus our earlier expectation of 102.5mm b/d. On the supply side, OPEC 2.0 core producers – KSA, Russia, Iraq, UAE and Kuwait – will continue to implement the coalition's production-management strategy – i.e., keeping the level of supply just below demand. Meanwhile, the price-taking cohort led by the US shale-oil producers will continue to focus on profitability, not production for the sake of production. Accelerating production too rapidly at this point would undo much of the work and effort undertaken to establish oil and gas companies as attractive alternatives for investors. Our 2022 Brent forecast is weaker by $1.50/bbl vs last month's estimate, averaging $78.50/bbl. Our 2023 forecast is $1/bbl lower, with our average expectation at $80.00/bbl (Chart 2). Longer term, oil + gas capex remains weak (Chart 3). As we have stressed repeatedly, this is wicked bullish for prices in 2024 and beyond. Chart 2Brent Forecast Slightly Weaker In 2022
Brent Forecast Slightly Weaker In 2022
Brent Forecast Slightly Weaker In 2022
Chart 3
Table 1BCA Global Oil Supply - Demand Balances (MMb/d, Base Case Balances) To Dec23
2022 Key Views: Past As Prelude For Commodities
2022 Key Views: Past As Prelude For Commodities
Weak Capex Keeps Base Metals Outlook Bullish Weak capex is a common theme in the industrial commodities – oil and base metals – which points to tight supply-demand balances for these markets going forward. This is as true for base metals as it is for oil (Chart 4). The principal drivers of the capex squeeze are similar in both markets: A desire to regain investors' favor after years of poor returns. This has managements focused on returning capital to shareholders either in the form of share buybacks or higher dividend payments. However, there are additional pressures adding to the cost structures of industrial commodities, particularly the seismic shifts in the political underpinnings of commodity-exporting countries, where left-of-center politicians are proving more attractive to the median voter in states with contestable elections. Once elected – e.g., in Peru, and, likely Chile after this weekend's elections – politicians push hard to secure a greater share of mining revenues for long-neglected poor and indigenous populations.5
Chart 4
The bellwether base metal market – copper – best highlights these factors, which, in our view, will keep base-metals capex tentative and restrained over the medium term. Miners are almost forced to exercise capex restraint until they get greater clarity on how newly elected governments will deliver on their avowed intent to secure a greater share of mining revenues for their constituents. This is particularly true in Chile and Peru – which together account for a combined 40% of global copper ore output – where poor and indigenous populations are engaging in more frequent civil disobedience.6 In addition to the contentious changing of the guard at the political level, ESG-related initiatives brought to the fore by climate activists elected to corporate boards and in court proceedings are adding new layers of cost to base-metals mining (and oil and gas exploration for that matter). This week, Reuters reported on separate court decisions in Australia and Chile that redress mistreatment of aboriginal peoples in key metals-exporting states.7 We believe political and ESG-related costs will raise miners' all-in sustaining costs, which will have to be covered by higher prices going forward. The additional costs that will be imposed on miners trying to meet the demand that will be driven by the global decarbonization and renewable-energy buildout now kicking into high gear will require prices to spur investment in new mine production, and to keep existing and brownfield production up and running.8 Copper prices will get an assist from a weaker USD, which will boost demand for the metal ex-US (Chart 5). We are expecting copper to push to $4.80/lb on average next year and $6.00/lb in 2023 on the COMEX, on the back of stronger supply fundamentals and a weaker USD. Chart 5A Weaker USD Will Boost Copper
A Weaker USD Will Boost Copper.
A Weaker USD Will Boost Copper.
Gold Will Rally As Inflation, Uncertainty Remain Elevated Gold prices will move higher in 2022 – our target remains $2,000/oz – as investors seek cover from higher commodity prices, which will feed directly through to higher inflation (Chart 6).9 This has been apparent in the recent US PCEPI and core PCEPI – the Fed's preferred inflation gauge – and CPI data, and at the wholesale level in PPI data. Most of this results from tight supplies for commodities and strong demand for goods, which is driving the price increases. We expect this to continue into 2022, as pent-up consumer demand continues to drive goods purchases and supply-side tightness for most manufacturing inputs. Higher prices across commodity markets will keep inflation gauges elevated in 2022. In addition to the inflation-hedging demand we expect next year, investors also will turn to gold as a hedge against economic policy uncertainty: As inflation and policy uncertainty increase, gold prices move higher (Chart 7). Chart 6Higher Commodity Prices Will Pressure Inflation Higher
Higher Commodity Prices Will Pressure Inflation Higher
Higher Commodity Prices Will Pressure Inflation Higher
Chart 7Investors Will Use Gold To Hedge Inflation, Uncertainty
Investors Will Use Gold To Hedge Inflation, Uncertainty
Investors Will Use Gold To Hedge Inflation, Uncertainty
Lastly, in line with our colleagues in BCA's Foreign Exchange Strategy service, we remain USD bears in 2022. As is the case with all commodities, gold will benefit from a weaker USD.10 Ags Remain Balanced In 2022 Global ag markets, by and large, will remain balanced over the current crop year (Chart 8), with a bias to the upside as input and transportation costs – chiefly fertilizers and grain vessels, respectively – remain high (Charts 9 and 10). Erratic weather, as always, remains an upside risk.
Chart 8
Chart 9
Chart 10… And Fertilizer Costs Will Push Grains, Beans Higher
Natgas Price Surge Pushes Fertilizer Prices Higher
Natgas Price Surge Pushes Fertilizer Prices Higher
While we remain neutral grains, the periodic price spikes resulting from higher freight rates and natural gas prices will support overall commodity exposures. Over the short term, the risk of higher prices is acute: Markets still are contending with the possibility of another colder-than-normal winter. This would push natgas prices – and, because it is 70% natgas, fertilizer costs – sharply higher next year. This will have to be recouped by higher food prices, particularly if shipping costs spike higher due to COVID-19-induced port closures. Surging food prices will keep inflation rates higher globally, making them more persistent (vs. transitory). Investment Implications Global supply-demand fundamentals continue to support our conviction commodity markets will remain tight in 2022. As such we remain long commodity index exposure – the S&P GSCI and COMT ETF – expecting market tightness to result in renewed backwardation. We also remain long the PICK expecting continued tightness in base metals. Risks to our views remain elevated – and occur in both directions. On the upside, commodities will rally if a less-lethal omicron variant becomes the dominant COVID-19 strain and does not overly tax hospital resources or drive death rates higher. It could actually convey a global benefit as the dominant strain, crowding out other mutations and pushing states to herd immunity. On the downside, it's still too early to tell how this new variant and other mutations will behave. Given the fragility of the current global recovery and reopening shown in the initial response to omicron, a more virulent mutant likely would hit aggregate demand hard, forcing yet another supply-side adjustment in commodities generally. Upside risks dominate in our assessment, but, as always, we remain cautious. Robert P. Ryan Chief Commodity & Energy Strategist rryan@bcaresearch.com Ashwin Shyam Research Associate Commodity & Energy Strategy ashwin.shyam@bcaresearch.com Footnotes 1 Please see Sinovac shot offers inadequate shield from Omicron variant, says HK study published by straitstimes.com on December 15, 2021. The Sinovac vaccine is almost half as effective as mRNA-based vaccines, and is widely distributed in EM economies. We flagged this risk earlier in July in our report titled Assessing Risks To Our Commodity Views; it is available at ces.bcaresearch.com. 2 Please see Pfizer Booster Shots Are Effective Against Omicron Variant, Israeli Study Says published by wsj.com on December 12, 2021. 3 Please see Omicron four times more transmissible than Delta in Japan study published by straitstimes.com on December 9, 2021. 4 Please see Upside Price Risk Rises For Crude, which we published on September 16, 2021, for addition discussion of the global joint-ventures engaged in local production of mRNA vaccines. 5 Please see Add Local Politics To Copper Supply Risks, which we published on November 25, 2021 and Chile: Prepare For A Boric Win, published by BCA's Emerging Markets Strategy service on December 15, 2021. The latter report discusses the growing odds of a victory for the left-of-center candidate in Chile's election this weekend. 6 Please see, e.g., Peru's poor Andean hamlets, backed by state, unleash anger at mines, published by reuters.com on December 14, 2021. 7 Please see Australian mining state passes Aboriginal heritage protection law, and Chile's Supreme Court orders new evaluation of Norte Abierto mining project published by reuters.com on December 15 and 14, 2021, respectively. 8 Incremental investment needed to meet 2050 net-zero climate goals will come to almost $2 trillion per year, half of which will go into renewable power generation, industrial processes, and transportation, according to estimates by Goldman Sachs, published on December 13, 2021. 9 Please see More Commodity-Led Inflation On The Way, which we published on December 9, 2021. It is worthwhile reiterating Granger-causality between realized and expected inflation gauges (US PCEPI, core PCEPI, CPI, along with 5-year/5-year CPI swap rates) and commodity price indices (the S&P GSCI and Bloomberg Commodity Index) is very strong. 10 Please see 2022 Key Views: Tug Of War, published by BCA's Foreign Exchange Strategy service on December 10, 2021. Investment Views and Themes Strategic Recommendations Trades Closed in 2021
Image
Highlights Tight commodity markets, rising incomes, and constrained logistics networks will continue to push inflation gauges higher, so long as coronavirus mutations don't cause another global economic shutdown. Commodity price pressures – exacerbated by weak capex on the supply side – will feed directly into realized and expected inflation gauges going forward, just as they have this year (Chart of the Week). In the short run, tight natural gas markets will raise fertilizer prices, which will keep food prices elevated next year. Inflation in goods prices will persist as tight energy and base-metals markets keep input and transportation costs elevated. Political uncertainty in important energy- and metals-exporting states, and ESG-related costs will contribute to upside price pressures. The cost of building the infrastructure required to decarbonize the global economy – an effort now kicking into high gear – is heavily dependent on the availability of base metals and fossil fuels, which means the cost of this energy transition likely will rise. Against this backdrop, central banks’ room to maneuver will shrink – tightening policy to fight inflation risks will drive up hurdle rates and make supply-side investment more costly. We remain long gold as a hedge against inflation and policy uncertainty, and our commodity-index exposures (S&P GSCI and the COMT ETF). Feature The Fed's preferred inflation gauge, the core Personal Consumption Expenditures Price Index, is up 4.12% y/y; the overall index is up 5.05%. In the euro zone, inflation soared to record highs in November, reaching 4.9% y/y. Most of the surge in these inflation gauges is due to higher commodity prices, which are caused by tight markets globally: In many markets, particularly energy and metals, the level of demand exceeds that of supply, which is forcing inventories lower and prices higher. Supply has been slow catching up with demand post-pandemic. There is a direct feed through from commodity markets to price inflation, something markets will be reminded of repeatedly in coming years as the supply-side of critically important commodities – energy, metals and food – are stressed to keep up with demand (Chart 2).1 Chart of the WeekRealized, Expected Inflation Will Continue To Rise
Realized, Expected Inflation Will Continue To Rise
Realized, Expected Inflation Will Continue To Rise
Chart 2Feedthrough From Commodities To Expected Inflation Is Strong
Feedthrough From Commodities To Expected Inflation Is Strong
Feedthrough From Commodities To Expected Inflation Is Strong
The scope for central banks to act to contain inflation in such circumstances is constrained: Tightening policy to the point where the cost of capital becomes prohibitive will exacerbate supply-side constraints in energy and metals markets. The risk here is acute, given that a decade of monetary policy operating close to the zero bound has failed to encourage long-term investment on the supply side in oil, gas, and metals. The dearth of capex in energy (Chart 3) and metals (Chart 4) threatens to keep supplies constrained for years.
Chart 3
Chart 4
Short-Run Pressure On Food Prices In earlier research, we delved into the sharp rise in food prices, and the underlying causes (Chart 5). Some of these are transitory – e.g., the tight shipping market for grains brought about by clogged logistics markets and delays in sailing, which has lifted rates sharply over the course of this year (Chart 6).
Chart 5
Chart 6
Other factors – high natural-gas prices, which will drive fertilizer prices higher next year – will dog markets at least until 2H22, when natural gas inventories in Europe will be on their way to being rebuilt, following a difficult injection season this year (Chart 7). The scramble to find gas in Europe and Asia as distributors prepare for a La Niña winter will take time to recover from next year.2 Chart 7High EU Gas Prices Will Keep Fertilizer Prices Elevated
High EU Gas Prices Will Keep Fertilizer Prices Elevated
High EU Gas Prices Will Keep Fertilizer Prices Elevated
Energy, Metals PricesDrive Inflation Expectations The really big inflationary push over the next five to 10 years will come from energy and metals markets, where capex has languished for years, as can be seen in Charts 3 and 4. These markets have been and remain in persistent physical deficits, which will not be easy to reverse without higher prices over a sustained period (Charts 8 and 9). Chart 8Oil Markets Will Remain In Deficit...
Oil Markets Will Remain In Deficit...
Oil Markets Will Remain In Deficit...
Chart 9...As Will Metals Bellwether, Copper
...As Will Metals Bellwether, Copper
...As Will Metals Bellwether, Copper
These markets will exert a strong influence on inflation and inflation expectations for as long as capex remains weak and supply is constrained. As can be gleaned from the model shown in Chart 10, the London Metal Exchange Index (LMEX) and 3-year-forward WTI are good explanatory variables for US 5-year/5-year CPI swap rates, the trading market in which inflation expectations are hedged. Until markets see sustainable investment in base metals and hydrocarbons over the course of the global energy transition now underway, forward-looking inflation markets will continue to price to tighter supply expectations.
Chart 10
Gold's Role As A Hedge Against Inflation, Uncertainty In our modeling we often describe gold as a currency, which, similar to other currencies, is highly sensitive to US monetary variables, EM and DM income (as measured by nominal GDP), economic policy uncertainty, and core inflation (Chart 11). These variables are what we could call the "usual suspects" that typically are rounded up to explain inflation, in addition to commodities prices.3 In Chart 12, we zero in on one of the inflation gauges discussed above, which is extremely sensitive to commodity prices, and policy uncertainty. Here we show gold as a function of US Economic Policy uncertainty and US PCEPI to make the point that gold can hedge not only the inflation driving these indices, but the economic uncertainty that likely will attend the transition to a low-carbon future, which we expect will remain elevated during this transition. Chart 11Gold Prices Sensitive To Usual Suspects
Gold Prices Sensitive To Usual Suspects
Gold Prices Sensitive To Usual Suspects
Chart 12...Particualrly Inflation And Uncertainty
...Particualrly Inflation And Uncertainty
...Particualrly Inflation And Uncertainty
Investment Implications Much of the surge showing up in inflation gauges in the US and EU is being driven by strong commodity prices. These prices are being powered higher by strong income growth, which leads to strong demand; tight supplies, and inventories. As we have noted, the level of commodity demand exceeds that of supply, which is forcing inventories lower and prices higher in oil and metals markets. Going forward, these fundamentals will be slow to change, which argues in favor of our long gold position and our long commodity index positions (S&P GSCI and the COMT ETF). We reiterate the COVID-19 risk factor mentioned at the beginning of this report: Global aggregate demand still is fragile. The risk of another coronavirus shock remains high. In particular, China maintains its zero-tolerance COVID-19 policy. This means commodity markets have to remain alert to how policymakers respond if the highly contagious Omicron variant is detected and authorities once again shut down ports and travel. The risk of disrupted supply chains and hits to supply-demand balances next year remains acute.4 Robert P. Ryan Chief Commodity & Energy Strategist rryan@bcaresearch.com Ashwin Shyam Research Associate Commodity & Energy Strategy ashwin.shyam@bcaresearch.com Commodities Round-Up Energy: Bullish Crude oil prices rebounded following its Omicron-induced drop last week. Relative to last Wednesday - when brent closed at its lowest following news of the new variant - prices were up 9.54% as of Tuesday’s close (Chart 13). Saudi Arabia’s decision to increase the official selling price of oil to customers in Asia and the US is testimony to its belief global demand will remain strong, despite the emergence of the highly transmissible new COVID-19 variant. Base Metals: Bullish Ever since the Omicron variant of COVID-19 was disclosed, prices of base-metals bellwether copper have become more volatile. This mostly reflects uncertainty surrounding macroeconomic conditions, as characteristics of the latest variant of the coronavirus are not well-known. COVID-19 lockdowns due to the Omicron variant could potentially delay tightening stimulus measures, which will be positive for industrial metals. However, lockdowns will also reduce industrial activity and demand for the red metal, acting as a sea anchor on copper's price. At the start of this week, looser monetary policy and rising copper imports in China supported the red metal, however these gains were capped by fears regarding the Omicron variant and a strong USD. Despite the volatility in copper prices following Fed Chair Jay Powell’s remarks last week on the pace of the asset purchases, we continue to expect tight fundamentals will outweigh the bearish effects of a stronger USD, and the weaker global financial conditions which come with it (Chart 14). Precious Metals: Bullish The World Platinum Investment Council (WPIC) reported a large third quarter refined platinum surplus of 592k oz, up nearly 430k oz from the second quarter. The jump in the third quarter surplus means the organization expects a full year 2021 surplus of 792k oz, compared to the 190k oz it had forecast in its second quarter report. Increased refined supply due to accelerated processing of 2020 semi-finished platinum stock coupled with lower demand by automakers and outflows from ETFs and stocks held by exchanges propelled the global platinum market into this relatively large surplus. In 2022 South African mined supply is expected to remain stable, while demand is expected to pick up as the economic recovery continues, resulting in a surplus of 637k oz for the full year. These forecasts do not account for the latest Omicron variant which was first reported in South Africa. Lockdowns due to the virus could lead to mine closures in the world’s largest platinum producer and reduce platinum demand from automakers. Chart 13
WTI LEVEL GOING UP
WTI LEVEL GOING UP
Chart 14
Copper Overcomes Tighter Global Financial Conditions
Copper Overcomes Tighter Global Financial Conditions
Footnotes 1 We find Granger-causality between realized and expected inflation gauges (US PCEPI and core PCEPI; US CPI, and US 5-year/5-year CPI swap rates) and commodity price indices (the S&P GSCI and Bloomberg Commodity Index) is very strong. This indicates the commodity-price indices are good explanatory and predictive variables for realized inflation gauges and for inflation expectations. 2 Please see our November 11 report entitled Risk Of Persistent Food-Price Inflation for additional detail. 3 Please see Conflicting Signals Challenge Gold, which we published on October 7, for example. 4 Please see 2022 Key Views: A Challenging Balancing Act published by BCA Research's China Investment Strategy on December 8, 2021. Investment Views and Themes Strategic Recommendations
Highlights Long-term investors should place up to 5 percent of their assets in cryptocurrencies. As the drawdown risk of owning cryptocurrencies converges with that of owning gold, the cryptocurrency asset-class can reasonably displace gold to take half of the $12 trillion anti-fiat investment market… … with BTC, ETH, and the others taking a third of this half – $2 trillion – each. This means that BTC would double to $120,000, while ETH would quadruple to $17,000. Some embryonic blockchain tokens could do even better. In this list of potentials, we would put Solana, Cardano, XRP, and Polkadot. Underweight gold relative to the other precious metals. As cryptocurrencies eat more of gold’s lunch, gold is set to become a pale shadow of its former self. Fractal analysis: Coffee and Cameco. Feature Chart of the WeekCryptos Are Eating Gold's Lunch... And There's Plenty More To Eat
Cryptos Are Eating Gold's Lunch... And There's Plenty More To Eat
Cryptos Are Eating Gold's Lunch... And There's Plenty More To Eat
If you’re wondering just how the market value of cryptocurrencies has surged to $2.5 trillion today from $0.5 trillion barely eighteen months ago, there’s a simple answer. Cryptocurrencies have eaten gold’s lunch – displacing almost $2 trillion from the investment value of the yellow metal. And that’s just so far… Given that the investment value of gold still stands at $9.5 trillion, there is plenty more of gold’s lunch that cryptocurrencies can eat (Chart of the Week). As Mark Twain might put it, rumours of crypto’s demise have been greatly exaggerated. When cryptocurrency prices corrected by 50 percent in May this year, the obituary writers got busy. For the 419th time. But since their birth in 2007, every time that they have ‘died’, cryptocurrencies have proved their detractors wrong, with prices quickly resurrecting and reaching new highs. We expect this pattern to continue (Chart I-2). Chart I-2Rumours Of Crypto's Demise Have Been Greatly Exaggerated
Rumours Of Crypto's Demise Have Been Greatly Exaggerated
Rumours Of Crypto's Demise Have Been Greatly Exaggerated
Cryptocurrencies And Blockchains Are Joined At The Hip To understand the investment case for cryptocurrencies, it is important to realise that the success of a cryptocurrency and the success of its blockchain are inextricably linked. Yet what confuses this matter is that for the best known cryptocurrency of all – Bitcoin – the relationship between the cryptocurrency and its blockchain is ‘back-to-front’. Bitcoin is first and foremost a cryptocurrency BTC, which is secured (against double-spending) by its blockchain network. Meaning that BTC is the main act, and the Bitcoin blockchain is the supporting act. However, for most other cryptocurrencies, the opposite is true. The blockchain is the main act, and the cryptocurrency is the supporting act. For example, Ethereum is first and foremost a blockchain network – a decentralised intermediator of services such as smart-contracts or bond-issuance through decentralised finance (DeFi). Note that over $5 billion of bonds have already been issued on Ethereum and other blockchains, including by the European Investment Bank, the World Bank, and the Bank of China. The users of the Ethereum intermediation services pay the users of Ethereum that validate them in its cryptocurrency, ETH. Crucially, this ability to exchange ETH (and other cryptocurrencies) for intermediation services on the associated blockchain gives the cryptocurrency an economic utility. This economic utility means that the cryptocurrencies of successful blockchain networks can be thought of as ‘digital gold’. Gold derives its utility from its physical attributes – beauty, wear-ability, and electrical conductivity. Whereas, the cryptocurrencies of successful blockchains derive their utility from their means of exchange for the useful intermediation services that the blockchains provide. Furthermore, just as governments and central banks cannot determine the supply of gold, neither can they determine the supply of successful cryptocurrencies. This last point is important because most of the current value of gold comes not from its beauty, wear-ability, and electrical conductivity, but from its investment value as a hedge against the debasement of fiat money. The immediate investment case for cryptocurrencies is that they are set to displace much of this investment value from gold (Chart I-3). Chart I-3Cryptocurrencies Are Displacing Gold's Investment Value
Cryptocurrencies Are Displacing Gold's Investment Value
Cryptocurrencies Are Displacing Gold's Investment Value
Cryptocurrencies Are Displacing Gold As The Anti-Fiat Hedge. Gold is scarce, but we can quantify its scarcity. Geology tells us that, in the earth’s crust, gold is 15 times as scarce as silver. And chemistry tells us that gold sits directly beneath silver in group 11 of the periodic table, meaning that the chemistry to extract gold and silver from their ores is essentially the same. Therefore, based on the geology and chemistry of the precious metals, gold should trade at around 15 times the price of silver. And 15 times the price of silver is precisely where gold did trade for centuries, and broadly where it traded in 1970. Yet by the mid-1970s the gold-to-silver ratio had breached 45, and by the late-1980s it had breached 75, where it stands today (Chart I-4). Why? Chart I-4Gold’s Massive Premium Versus Its Geological And Chemical Fundamentals Comes From Its Investment Value (As A Hedge Against The Debasement Of Fiat Money)
Gold's Massive Premium Versus Its Geological And Chemical Fundamentals Comes From Its Investment Value
Gold's Massive Premium Versus Its Geological And Chemical Fundamentals Comes From Its Investment Value
The gold-to-silver ratio surged because, in 1971, the Bretton Woods ‘pseudo gold standard’ collapsed and the world economy moved to a fiat monetary system. Lest there is any doubt, a similar surge happened forty years earlier in 1931 when the original gold standard collapsed, before being reconstructed at the Bretton Woods conference in 1944. From these two surges, we can deduce that the premium in gold’s value versus its geological and chemical fundamentals constitutes its insurance policy value against the debasement of fiat money. Some people counter that only a small proportion of gold is owned as an explicit investment, and a large proportion is owned for its beauty and status. Yet this has been the case for millennia, and through most of this history gold-to-silver has traded in line with its geological and chemical fundamentals. Given that the gold price surges post-1931 and post-1971 coincided almost precisely with the introduction of fiat money, it is gold’s insurance policy value against the debasement of fiat money that is setting most of its current value. Based on the gold-to-silver ratio of 75 versus the geological and chemical fundamental value of 15, we can deduce that around four-fifths of gold’s $12 trillion above ground market value, or $9.5 trillion, comes from its insurance policy value. Add to that the current $2.5 trillion value of cryptocurrencies, and we can estimate that the total ‘anti-fiat’ investment market is worth $12 trillion. Of which, gold comprises around 80 percent, and cryptocurrencies around 20 percent. But to repeat, cryptocurrencies can eat much more of gold’s lunch (Chart I-5). Chart I-5Cryptocurrencies Can Eat Much More Of Gold's Lunch
Cryptocurrencies Can Eat Much More Of Gold's Lunch
Cryptocurrencies Can Eat Much More Of Gold's Lunch
The Investment Implications: Bitcoin To $120,000, Ethereum To $17,000 We estimate that absent the displacement of investment value into cryptocurrencies since mid-2020, gold would now be trading at an all-time high of $2150 instead of at $1800. But given that there is much more of gold’s lunch for cryptocurrencies to eat, gold is set to become a pale shadow of its former self. Investors should underweight gold relative to the other precious metals. One pushback we get is that governments will ultimately issue a blanket ban on cryptocurrencies. But our pushback to the pushback is that it is a contradiction to be pro-blockchain and the anti- the ‘joined at the hip’ cryptocurrency which secures and validates the transactions on that blockchain. To resolve this contradiction, governments will try and regulate, rather than ban, cryptocurrencies. Another obvious question is: if Bitcoin is ‘back-to-front’ with its underlying blockchain having less utility and versatility than Ethereum and most other cryptocurrencies, should we still own BTC? The answer is yes, for two reasons. First, in time, the Bitcoin blockchain is likely to become more versatile; second, there will be some investors who hold out for the very long-term possibility that a cryptocurrency does displace fiat money. In which case, BTC would be the prime candidate. As the drawdown risk of owning cryptocurrencies converges with that of owning gold (Chart I-6), the cryptocurrency asset-class can reasonably displace gold to take half of the $12 trillion anti-fiat investment market, with BTC, ETH, and the others taking a third of this half – $2 trillion – each. Although BTC would become a smaller slice of the pie, the pie would be much bigger. From current market values, this means that BTC would double to $120,000. Chart I-6Cryptocurrency Corrections Are Becoming Less Extreme
Cryptocurrency Corrections Are Becoming Less Extreme
Cryptocurrency Corrections Are Becoming Less Extreme
But the real action would be in the other cryptocurrencies. ETH would quadruple to $17,000, while some embryonic blockchain tokens could do even better. In this list of potentials, we would put Solana, Cardano, XRP, and Polkadot. In conclusion, we expect the cryptocurrency asset-class to continue its strong structural uptrend, punctuated by short sharp corrections. As such, long-term investors should place up to 5 percent of their assets in cryptocurrencies. Coffee Is Too Expensive In this week’s fractal analysis, we make two observations: First, for those who want a second bite at the cherry for shorting the uranium meme theme, the spectacular rally in the Canadian stock Cameco offers a good opportunity – given its very fragile 260-day fractal structure, which has successfully signalled five previous turning-points (Chart I-7). Chart I-7Cameco Is Overbought
Cameco Is Overbought
Cameco Is Overbought
Second, within the soft commodities, the spectacular rally in coffee combined with the recent sell-off in cocoa has stretched the relative pricing of the two softs to a 10-year extreme, as well as a very fragile 260-day fractal structure (Chart I-8). Chart I-8Coffee Is Too Expensive
Coffee Is Too Expensive
Coffee Is Too Expensive
Accordingly, this week’s recommended trade is to short coffee versus cocoa, setting a profit-target and symmetrical stop-loss at 30 percent. Dhaval Joshi Chief Strategist dhaval@bcaresearch.com Fractal Trading System Fractal Trades 6-Month Recommendations Structural Recommendations Closed Fractal Trades Indicators To Watch - Bond Yields Chart II-1Indicators To Watch - Bond Yields ##br##- Euro Area
Indicators To Watch - Bond Yields - Euro Area
Indicators To Watch - Bond Yields - Euro Area
Chart II-2Indicators To Watch - Bond Yields ##br##- Europe Ex Euro Area
Indicators To Watch - Bond Yields - Europe Ex Euro Area
Indicators To Watch - Bond Yields - Europe Ex Euro Area
Chart II-3Indicators To Watch - Bond Yields ##br##- Asia
Indicators To Watch - Bond Yields - Asia
Indicators To Watch - Bond Yields - Asia
Chart II-4Indicators To Watch - Bond Yields ##br##- Other Developed
Indicators To Watch - Bond Yields - Other Developed
Indicators To Watch - Bond Yields - Other Developed
Indicators To Watch - Interest Rate Expectations Chart II-5Indicators To Watch - Interest Rate Expectations
Indicators To Watch - Interest Rate Expectations
Indicators To Watch - Interest Rate Expectations
Chart II-6Indicators To Watch - Interest Rate Expectations
Indicators To Watch - Interest Rate Expectations
Indicators To Watch - Interest Rate Expectations
Chart II-7Indicators To Watch - Interest Rate Expectations
Indicators To Watch - Interest Rate Expectations
Indicators To Watch - Interest Rate Expectations
Chart II-8Indicators To Watch - Interest Rate Expectations
Indicators To Watch - Interest Rate Expectations
Indicators To Watch - Interest Rate Expectations
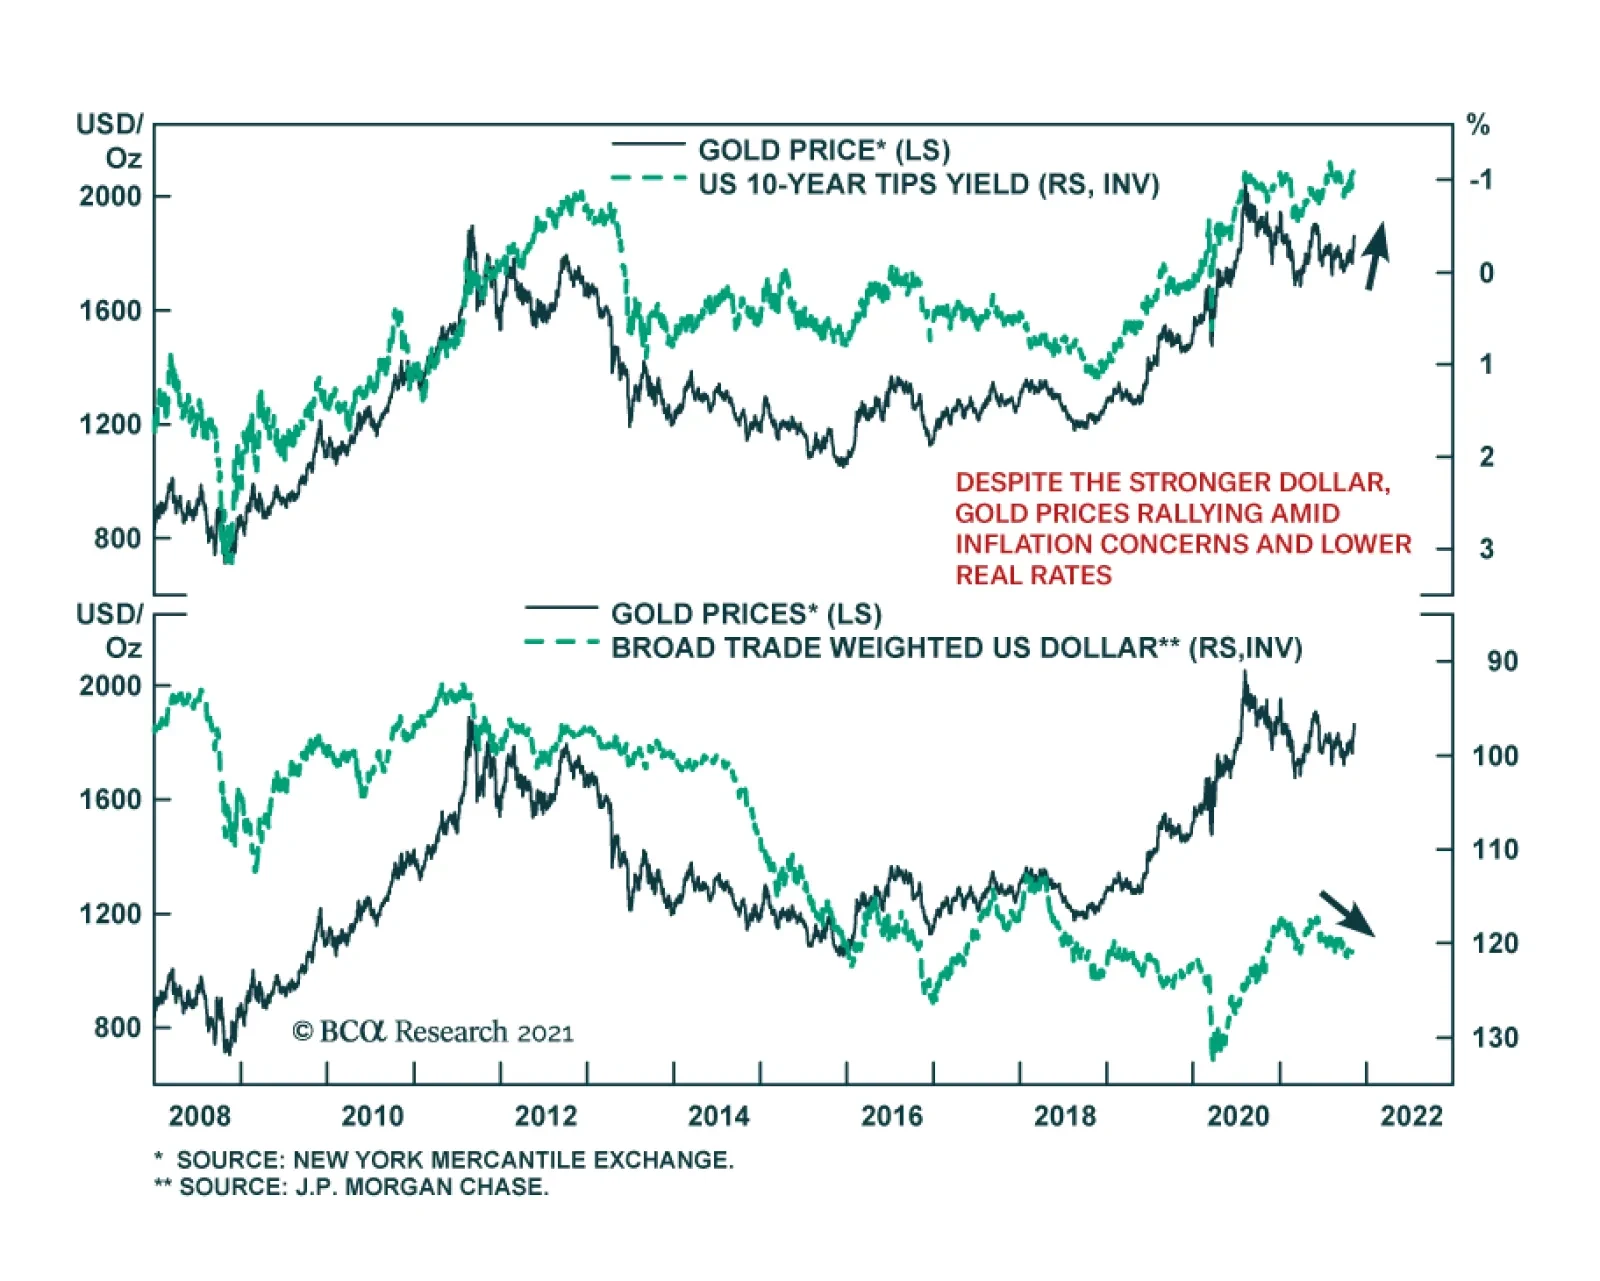
Recently, gold has been enjoying a sharp rally. The price of gold prices is up 4.5% so far in November to the highest level in nearly five months. Concerns that inflationary pressures will persist has renewed demand for the yellow metal as an inflation hedge.…