Global

Highlights Underweighting T-bonds, tech versus the market, growth versus value, new economy versus old economy, and US versus the euro area are all just one massive correlated trade. Get the direction of the T-bond yield right, and you will get the whole correlated trade right. The rise in the 10-year T-bond yield will meet resistance much closer to 2 percent than to 3 percent… …because the level of the yield is already starting to weigh on the stock market, the financial system, and the real economy. Hence, on a 6-month horizon, fade the massive correlated trade. When allocating to stock markets, don’t confuse a ‘stock effect’ for a ‘country effect’. Fractal trade shortlist: European autos and European personal products. The Pareto Principle Of Investment Chart of the WeekCorrelated Trade: Tech And The US
Correlated Trade: Tech And The US
Correlated Trade: Tech And The US
One of the guiding principles of investment is that: Investment is complex, but it is not complicated. The words complex and complicated are often used synonymously, but they mean different things. Complex means something that is not fully predictable or analysable. Complicated means something that is made up of many parts. Investment is not complicated because a few parts drive the relative prices of everything. This is also known as the Pareto Principle, or the 20:80 rule. Just 20 percent of the input determines 80 percent of the output.1 Right now, the 20 that is determining the 80 is the bond yield. Higher bond yields are hurting high-flying tech stocks. This is because the ‘net present value’ of cashflows that are weighted deep into the future are highly sensitive to rising yields. Therefore, underweighting T-bonds means underweighting tech versus the market. Which extends to growth versus value, new economy versus old economy, US versus the euro area, and so on. In effect, all these positions have become one massive correlated trade (Chart of the Week, Chart I-2, and Chart I-3). Chart I-2Correlated Trade: T-Bond, And Growth Vs. Value
Correlated Trade: T-Bond, And Growth Vs. Value
Correlated Trade: T-Bond, And Growth Vs. Value
Chart I-3Correlated Trade: Growth Vs. Value, ##br##And Tech
Correlated Trade: Growth Vs. Value, And Tech
Correlated Trade: Growth Vs. Value, And Tech
Get the direction of the bond yield right and your whole investment strategy will be right. You will be a hero. Get the direction of the bond yield wrong and your whole investment strategy will be wrong. You will be a zero. Get the direction of the bond yield right and your whole investment strategy will be right. The hero/zero decision for investors is: from the current level of 1.7 percent, at what level will the 10-year T-bond yield peak and reverse? If the answer is, say, 3 percent, then the recent direction of this correlated trade has much further to go, and investors should stay on the ride. But if the answer is, say, 2 percent, then this correlated trade does not have much further to go, and it will soon be time to get off. To repeat, investment is not complicated, but it is complex. The evolution of the bond yield is not fully analysable or predictable. Still, our assessment is that the rise in the 10-year T-bond yield will meet resistance much closer to 2 percent than to 3 percent. This is because the level of yields is already starting to weigh on the stock market, the financial system, and the real economy. Specifically: The global stock market rally has stalled since mid-February because high-flying growth stocks have been reined back by rising bond yields. Recent margin calls and liquidations in the hedge fund space presage points of fragility in the financial system. Note, there is never just one cockroach. US mortgage applications for home purchases and building permits for new housebuilding appear to be rolling over (Chart I-4). Admittedly, these are just straws in the wind. But straws in the wind can be the first sign of a brewing storm. Chart I-4Are Higher Bond Yields Starting To Weigh On The Housing Market?
Are Higher Bond Yields Starting To Weigh On The Housing Market?
Are Higher Bond Yields Starting To Weigh On The Housing Market?
On a 6-month horizon, fade the underweighting to bonds, tech versus the market, growth versus value, new economy versus old economy, and US versus the euro area correlated trade. Sectors Still Rule The Stock Market World The evolution of the pandemic, the pace of vaccination roll-outs, and the size of fiscal stimuluses have become polarised by region and country, with clear leaders and laggards. This raises the question: are the regions and countries that are winning against the pandemic the investment winners too? For the major stock markets, the answer is an emphatic no. Compared with the US, the euro area is experiencing an aggressive third wave of infections, is lagging in its vaccination roll-outs, and is unleashing much less fiscal stimulus. Yet euro area equities have not been underperforming US equities. Proving that the outperformance and underperformance of the major stock markets has very little to do with what is going on in the local economy. The outperformance and underperformance of the major stock markets has very little to do with what is going on in the local economy. By far the biggest driver of euro area versus US stock market performance is the euro area’s massive underweighting to tech stocks vis-à-vis the US. Hence, the tech sector’s recent travails have boosted the euro area stock market’s relative performance. Similar types of sector skews explain the relative performance of all the major stock markets (Table I-1). For example, developed markets (DM) versus emerging markets (EM) is nothing more than healthcare versus basic resources (Chart I-5). Table I-1The Sector Fingerprints Of The Major Stock Markets
The Pareto Principle Of Investment
The Pareto Principle Of Investment
Chart I-5DM Vs. EM Is Nothing More Than Healthcare Vs. Basic Resources
DM Vs. EM Is Nothing More Than Healthcare Vs. Basic Resources
DM Vs. EM Is Nothing More Than Healthcare Vs. Basic Resources
Exchange rates can also have a bearing on stock market relative performance – though the main transmission mechanism is not through competitiveness, but through the so-called ‘currency translation effect.’ Specifically, the multinationals that dominate the major stock markets have their cost bases diversified across multiple currencies. Hence, for a euro-listed multinational company, a weaker euro doesn’t boost its competitiveness. But it does boost the translation of its multi-currency profits into euros, the currency of its stock market listing. Thereby, the weaker euro boosts its stock price. Don’t Confuse A ‘Stock Effect’ For A ‘Country Effect’ Many people think that there is also a strong ‘country effect’ in stock market selection. For example, if US tech hardware outperforms euro area tech hardware, then this is clearly not a sector effect. It must be to do with a difference between the US and the euro area, meaning a country effect. The truth is more nuanced. Many sectors are now highly concentrated in one or two dominant stocks. US tech hardware is concentrated in Apple while euro area tech hardware is concentrated in ASML. Hence, if US tech hardware is outperforming euro area tech hardware, it is because Apple is outperforming ASML (Chart I-6). Chart I-6Is US Tech Vs. Euro Area Tech A 'Country Effect' Or A 'Stock Effect'?
Is US Tech Vs. Euro Area Tech A 'Country Effect' Or A 'Stock Effect'?
Is US Tech Vs. Euro Area Tech A 'Country Effect' Or A 'Stock Effect'?
Likewise, if euro area pharma is outperforming UK pharma, it is because the dominant euro area pharma stock, Sanofi, is outperforming the dominant UK pharma stock, AstraZeneca (Chart I-7). Chart I-7Is Euro Area Pharma Vs. UK Pharma A 'Country Effect' Or A 'Stock Effect'?
Is Euro Area Pharma Vs. UK Pharma A 'Country Effect' Or A 'Stock Effect'?
Is Euro Area Pharma Vs. UK Pharma A 'Country Effect' Or A 'Stock Effect'?
So, if US tech hardware is outperforming euro area tech hardware, and euro area pharma is outperforming UK pharma, are these ‘country effects’, or are they ‘stock effects’? We would argue that, in truth, they are stock effects. Meaning they have little to do with what is happening in the country of listing, and much more to do with the specifics of the company. For example, if UK pharma is underperforming, it is because AstraZeneca is underperforming. And if AstraZeneca is underperforming, it is more likely to do with the performance of its Covid-19 vaccine than the performance of the UK economy. The problem is that most performance attributions will incorrectly count what are stock effects as country effects. And the more concentrated that sectors become, the more pronounced this error becomes. Yet nowadays, extreme concentration in one or two stocks per sector is the norm rather than the exception. Hence, what appears to be a country effect is, in most cases, a stock effect. What appears to be a country effect is, in most cases, a stock effect. The important lesson is that when allocating to the major stock markets, do not think in terms of regions or countries because the country effect is, in truth, negligible. Think in terms of the sectors and the dominant stocks that you want to own, and the regional and country allocation will resolve itself automatically. On this basis our high-conviction structural position to be overweight DM versus EM simply follows from our high-conviction structural position to be overweight healthcare versus basic resources. In the DM versus EM decision, everything else is largely irrelevant. Candidates For Countertrend Reversals This week’s candidates for countertrend reversal are European autos, and European personal products. The euphoria towards electric vehicles (EVs) has taken European auto stocks to a technically overbought extreme (Chart I-8). Chart I-8European Autos Are Overbought
European Autos Are Overbought
European Autos Are Overbought
Conversely, the euphoria towards economic reopening plays has taken European personal products stocks to a technically oversold extreme (Chart I-9). Chart I-9European Personal Products Are Oversold
European Personal Products Are Oversold
European Personal Products Are Oversold
Our recommended trade is overweight European personal products versus European autos (Chart I-10), setting a profit target and symmetrical stop-loss at 15 percent. Chart I-10Overweight European Personal Products Versus European Autos
Overweight European Personal Products Versus European Autos
Overweight European Personal Products Versus European Autos
Dhaval Joshi Chief Strategist dhaval@bcaresearch.com Footnotes 1 The exact numbers 20 and 80 are simply indicative of the Pareto Principle rather than set in stone, they could also be 5 and 95, or indeed 5 and 99 as they do not need to sum to 100. Fractal Trading System
The Pareto Principle Of Investment
The Pareto Principle Of Investment
6-Month Recommendations
The Pareto Principle Of Investment
The Pareto Principle Of Investment
Structural Recommendations
The Pareto Principle Of Investment
The Pareto Principle Of Investment
Closed Fractal Trades
The Pareto Principle Of Investment
The Pareto Principle Of Investment
The Pareto Principle Of Investment
The Pareto Principle Of Investment
The Pareto Principle Of Investment
The Pareto Principle Of Investment
Asset Performance
The Pareto Principle Of Investment
The Pareto Principle Of Investment
Equity Market Performance
The Pareto Principle Of Investment
The Pareto Principle Of Investment
The Pareto Principle Of Investment
The Pareto Principle Of Investment
Indicators Bond Yields Chart II-1Euro Area
Indicators To Watch - Bond Yields - Euro Area
Indicators To Watch - Bond Yields - Euro Area
Chart II-2Europe Ex Euro Area
Indicators To Watch - Bond Yields - Europe Ex Euro Area
Indicators To Watch - Bond Yields - Europe Ex Euro Area
Chart II-3Asia
Indicators To Watch - Bond Yields - Asia
Indicators To Watch - Bond Yields - Asia
Chart II-4Other Developed
Indicators To Watch - Bond Yields - Other Developed
Indicators To Watch - Bond Yields - Other Developed
Interest Rate Chart II-5Expectations
Indicators To Watch - Interest Rate Expectations
Indicators To Watch - Interest Rate Expectations
Chart II-6Expectations
Indicators To Watch - Interest Rate Expectations
Indicators To Watch - Interest Rate Expectations
Chart II_7Expectations
Indicators To Watch - Interest Rate Expectations
Indicators To Watch - Interest Rate Expectations
Chart II-8Expectations
Indicators To Watch - Interest Rate Expectations
Indicators To Watch - Interest Rate Expectations
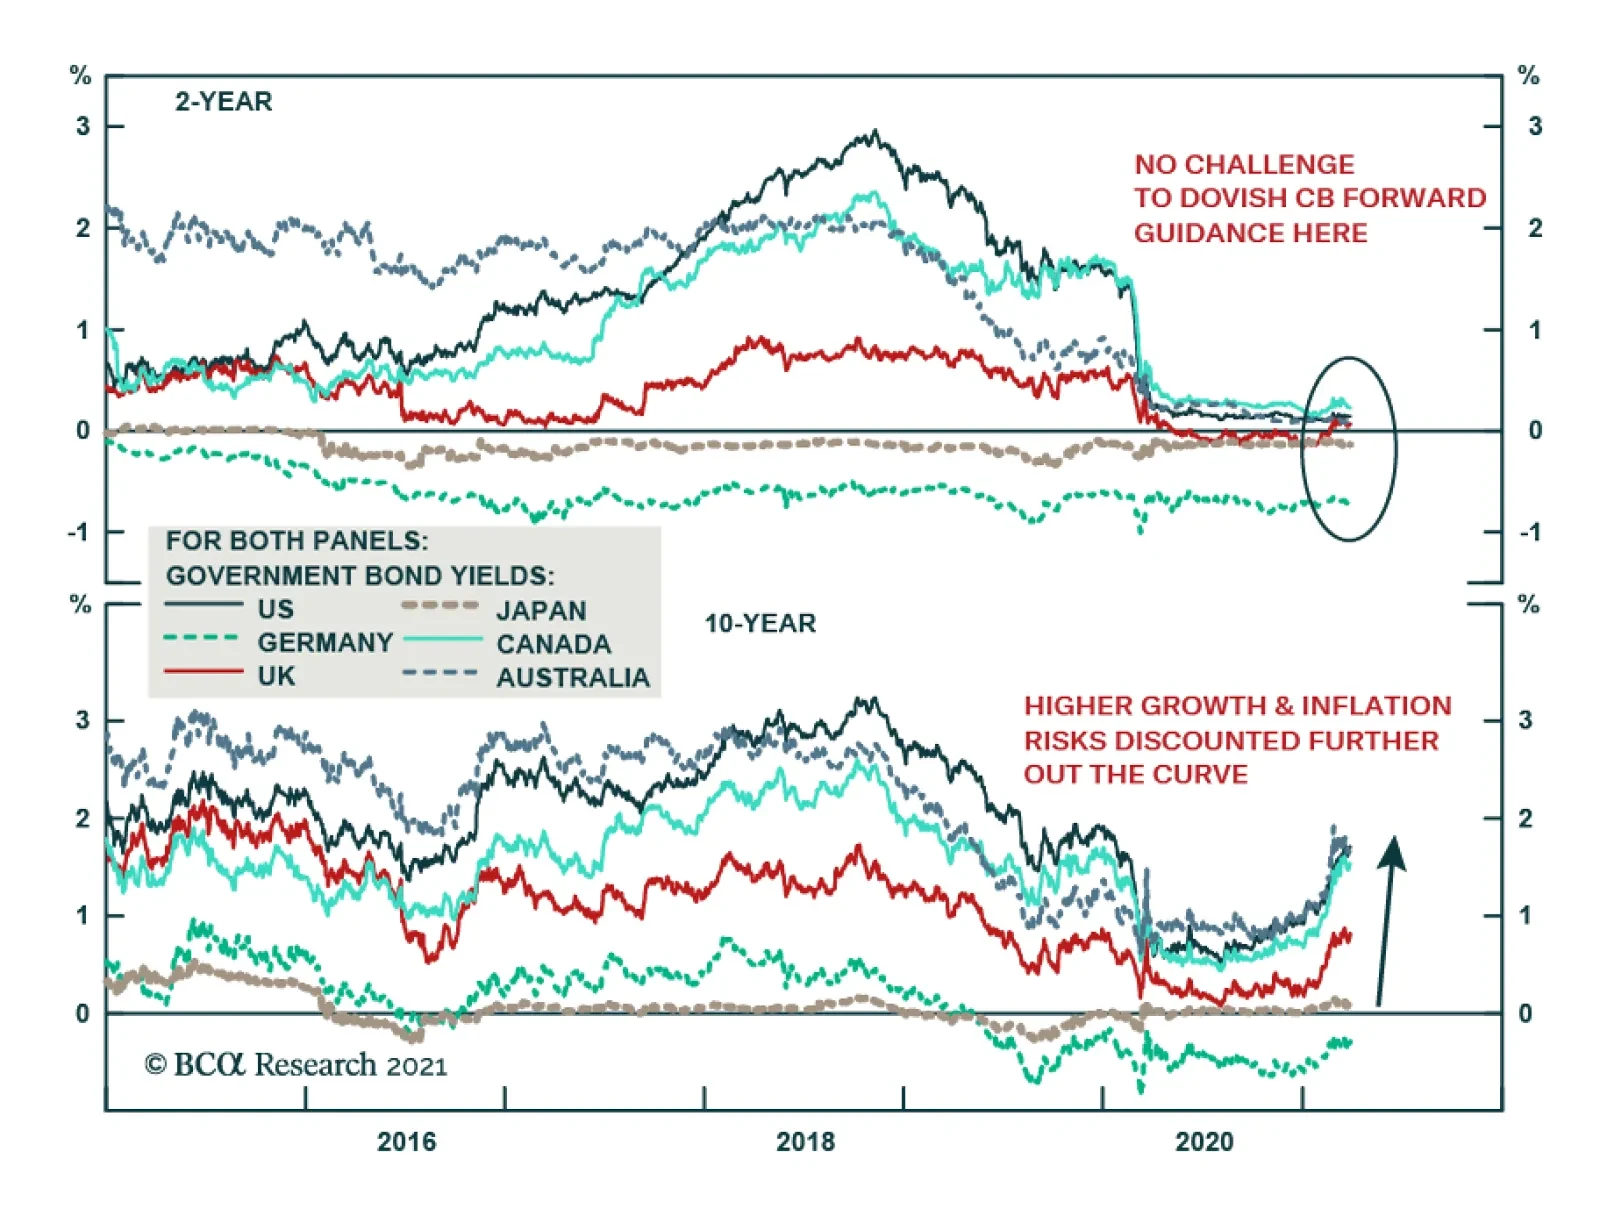
BCA Research’s Global Fixed Income Strategy service believes that the current strong growth environment is likely to cause the bond market to further challenge the dovish forward guidance of central banks. Thus far, the trend in rising yields has been…
Dear Client, We are sending you our Strategy Outlook today, where we outline our thoughts on the macro landscape and the direction of financial markets for the rest of 2021 and beyond. Next week, please join me for a webcast on Thursday, April 1 at 10:00 AM EDT (3:00 PM BST, 4:00 PM CEST, 10:00 PM HKT) where I will discuss the outlook. Best regards, Peter Berezin, Chief Global Strategist Highlights Growth outlook: The global economy will rebound over the course of the year, with momentum rotating from the US to the rest of the world. Inflation: Structurally higher inflation is not a near-term risk, even in the US, but could become a major problem by the middle of the decade. Global asset allocation: Investors should continue to overweight equities on a 12-month horizon. Unlike in the year 2000, the equity earnings yield is still well above the bond yield. Equities: Value stocks will maintain their recent outperformance. Investors should favor banks and economically-sensitive cyclical sectors, while overweighting stock markets outside the US. Fixed income: Continue to maintain below average interest-rate duration exposure. Spread product will outperform safe government bonds. Favor inflation-protected securities over nominal bonds. Currencies: While the dollar could strengthen in the near term, it will weaken over a 12-month period. Large budget deficits, a deteriorating balance of payments profile, and an accommodative Fed are all dollar bearish. Commodities: Tight supply conditions and a cyclical recovery in oil demand will support crude prices. Strong Chinese growth will continue to buoy the metals complex. I. Macroeconomic Outlook Global Growth: The US Leads The Way… For Now The global economy should rebound from the pandemic over the remainder of the year. So far, however, it has been a two-speed recovery. Whereas the Bloomberg consensus has US real GDP growing by 4.8% in the first quarter, analysts expect the economies in the Euro area, UK, and Japan to contract by 3.6%, 13.3%, and 5%, respectively. Chart 1Dismantling Of Lockdown Measures Occurring At Varying Pace
Second Quarter 2021 Strategy Outlook: Inflation Cometh?
Second Quarter 2021 Strategy Outlook: Inflation Cometh?
Chart 2US Is Among The Vaccination Leaders
US Is Among The Vaccination Leaders
US Is Among The Vaccination Leaders
Two things explain US growth outperformance. First, the successful launch of the US vaccination campaign has allowed state governments to begin dismantling lockdown measures (Chart 1). Currently, the US has administered 40 vaccine shots for every 100 inhabitants. Among the major economies, only the UK has performed better on the vaccination front (Chart 2). In contrast, parts of continental Europe are still battling a new wave of Covid infections, prompting policymakers there to further tighten social distancing rules. Second, US fiscal policy has been more stimulative than elsewhere (Chart 3). On March 11, President Biden signed the $1.9 trillion American Rescue Plan Act into law. Among other things, the Act provides direct payments to lower- and middle-class households, extends and expands unemployment benefits, and offers aid to state and local governments (Chart 4). Unlike President Trump’s Tax Cuts and Jobs Act, the Democrats’ legislation will raise the incomes of the poor much more than the rich (Chart 5). Chart 3The US Tops The Stimulus Race
Second Quarter 2021 Strategy Outlook: Inflation Cometh?
Second Quarter 2021 Strategy Outlook: Inflation Cometh?
We expect growth leadership to shift from the US to the rest of the world in the second half of the year. Nevertheless, US real GDP in Q4 of 2021 will probably end up 7% above the level of Q4 of 2020, enough to close the output gap. In Section II of this report, we discuss whether this could cause inflation to take off on a sustained basis. We conclude that such an outcome is unlikely for the next two years. However, materially higher inflation is indeed a risk over a longer-term horizon. Chart 4Composition Of The American Rescue Plan Act
Second Quarter 2021 Strategy Outlook: Inflation Cometh?
Second Quarter 2021 Strategy Outlook: Inflation Cometh?
Chart 5Biden’s Package Will Boost The Income Of The Poor More Than The Rich
Second Quarter 2021 Strategy Outlook: Inflation Cometh?
Second Quarter 2021 Strategy Outlook: Inflation Cometh?
The EU: Recovery After Lockdown The EU will benefit from a cyclical recovery later this year as the vaccination campaign picks up steam. The recent weakness in Europe was concentrated in services (Chart 6). The latest European PMI data shows that the service sector may have turned the corner. As in the US, European households have accumulated significant excess savings. The unleashing of pent-up demand should drive consumption over the remainder of the year (Chart 7). Chart 6For Now, The Service Sector Is Doing Better In The US Than The Euro Area
Second Quarter 2021 Strategy Outlook: Inflation Cometh?
Second Quarter 2021 Strategy Outlook: Inflation Cometh?
Chart 7European Households Have Accumulated Excess Savings
European Households Have Accumulated Excess Savings
European Households Have Accumulated Excess Savings
Meanwhile, the manufacturing sector continues to do well, with the Euro area manufacturing PMI hitting all-time highs in March. Sentiment indices such as the Sentix and ZEW surveys point to further upside for manufacturing activity (Chart 8). Chart 8Positive Outlook For Euro Area Manufacturing Activity
Positive Outlook For Euro Area Manufacturing Activity
Positive Outlook For Euro Area Manufacturing Activity
Fiscal policy should also turn modestly more expansionary. The EU recovery fund will begin disbursing aid in the second quarter. This should allow the southern European economies to maintain more generous levels of fiscal support. It also looks increasingly likely that the Green Party will either lead or join the coalition government in Germany, which could translate into greater spending. UK: Recovering From A One-Two Punch The UK had to shutter its economy late last year due to the emergence of a new, more contagious, strain of the virus. The resulting hit to the economy came on top of a decline in exports to the EU following Brexit. The economic picture will improve over the coming months. Thanks to the speedy vaccination campaign, the government plans to lift the “stay at home” rules on March 29. Most retail, dining, and hospitality businesses are scheduled to reopen on April 12. A strong housing market and the extension of both the furlough schemes and tax holidays should also sustain demand. Japan: More Fiscal Support Needed Like many other countries, Japan had to introduce new lockdown measures in late 2020 after suffering its worst wave of the pandemic. While the number of new cases has dropped dramatically since then, they have edged up again over the past two weeks. Japanese regulations require that vaccines be tested on Japanese people. Prime Minster Yoshihide Suga has promised that vaccine shots will be available to the country’s 36 million seniors by the end of June. However, with less than 1% of the population vaccinated so far, strict social distancing will persist well into the summer. The Japanese government passed a JPY 73 trillion (13.5% of GDP) supplementary budget in December. However, only 40 trillion of that has been allocated for direct spending. Due to negative bond yields, the Japanese government earns more interest than it pays on its debt. It should be running much more expansionary fiscal policy. China: Policy Normalization, Not Deleveraging Chart 9China: Tailwind For Easier Monetary And Fiscal Policies Will Fade Over The Remainder Of The Year
China: Tailwind For Easier Monetary And Fiscal Policies Will Fade Over The Remainder Of The Year
China: Tailwind For Easier Monetary And Fiscal Policies Will Fade Over The Remainder Of The Year
China’s combined credit/fiscal impulse peaked late last year (Chart 9). The impulse leads growth by about six months, implying that the tailwind from easier monetary and fiscal policies will fade over the rest of the year. Nevertheless, we doubt that China’s economy will experience much of a slowdown. First and foremost, the shock from the pandemic should fade, helping to revive consumer and business confidence. Second, the Chinese authorities are likely to pursue policy normalization, rather than outright deleveraging. Jing Sima, BCA’s chief China strategist, expects the general government deficit to remain broadly stable at 8% of GDP this year. She also thinks that the rate of credit expansion will fall by only 2-to-3 percentage points in 2021, bringing credit growth back in line with projected nominal GDP growth of 8%. Total credit was 290% of GDP at end-2020. Thus, credit growth of 8% would still generate 290%*8%=23% of GDP of net credit formation, providing more than enough support to the economy. II. Feature: Will The US Economy Overheat? As of February, US households were sitting on around $1.7 trillion in excess savings. About two-thirds of those savings can be chalked up to reduced spending during the pandemic, with the remaining one-third arising from increased transfer payments (Chart 10). The recently passed stimulus bill will boost household savings by an additional $300 billion, bringing the stock of excess savings to $2 trillion by April. This cash hoard will support spending. Already, real-time measures of economic activity have hooked up. Traffic congestion in many US cities is approaching pre-pandemic levels. OpenTable’s measure of restaurant occupancy is progressing back to where it was before the pandemic (Chart 11). J.P. Morgan reported that spending using its credit cards rose 23% year-over-year in the 9-day period through to March 19 as stimulus payments reached bank accounts. Anecdotally, airlines and cruise line companies have been expressing optimism on the back of a surge in bookings. Chart 10Lower Spending And Higher Income Led To Mounting Excess Savings
Lower Spending And Higher Income Led To Mounting Excess Savings
Lower Spending And Higher Income Led To Mounting Excess Savings
Chart 11Real-Time Measures Of Economic Activity Have Hooked Up
Second Quarter 2021 Strategy Outlook: Inflation Cometh?
Second Quarter 2021 Strategy Outlook: Inflation Cometh?
Meanwhile, the supply side of the economy could face temporary constraints. Under the stimulus bill, close to half of jobless workers will receive more income through to September from extended unemployment benefits than they did from working. This could curtail labor supply at a time when firms are trying to step up the pace of hiring. The Fed Versus The Markets In the latest Summary of Economic Projections released last week, the median “dot” for the fed funds rate remained stuck at zero through to end-2023. The bond market, in contrast, expects the Fed to start raising rates next year. Why is there a gap between the Fed and market expectations? Part of the answer is that the “dots” and market expectations measure different things. Whereas the dots reflect a modal, or “most likely” estimate of where short-term rates will be over the next few years, market expectations reflect a probability-weighted average. The fact that rates cannot fall deeply into negative territory – but can potentially rise a lot in a high-inflation scenario – has skewed market rate expectations to the upside. That said, there is another, more fundamental, reason at work: The Fed simply does not think that a negative output gap will lead to materially higher inflation. The “dots” assume that core PCE inflation will barely rise above 2% over the next two years, even though, by the Fed’s own admission, the unemployment rate will fall firmly below NAIRU in 2023 (Chart 12). Chart 12The Fed Sees Faster Recovery, Same Rate Path
Second Quarter 2021 Strategy Outlook: Inflation Cometh?
Second Quarter 2021 Strategy Outlook: Inflation Cometh?
Chart 13Just Like It Did In 2011, The Fed Will Disregard What It Sees As Transitory Price Shocks
Just Like It Did In 2011, The Fed Will Disregard What It Sees As Transitory Price Shocks
Just Like It Did In 2011, The Fed Will Disregard What It Sees As Transitory Price Shocks
Is the Federal Reserve’s relaxed view towards inflation risk justified? The Fed knows full well that headline inflation could temporarily reach 4% over the next two months due to base effects from last year’s deflationary shock, lingering supply chain disruptions, the rebound in gasoline prices, and the lagged effect from dollar weakness. However, as it did in late 2011, when headline inflation nearly hit 4% and producer price inflation briefly topped 10%, the Fed is inclined to regard these price shocks as transitory (Chart 13). The Fed believes that PCE inflation will tick up to 2.4% this year but then settle back down to 2% by the end of next year as supply disruptions dissipate and most fiscal stimulus measures roll off. Our bet is that the Fed will be right about inflation in the near term, but wrong in the long term. That is to say, we think that core inflation will probably remain subdued for the next two years, as the Fed expects. However, inflation is poised to rise significantly towards the middle of the decade, an outcome that is likely to surprise both the Fed and market participants. War-Time Inflation, But Which War? In some respects, the Fed sees the current environment as resembling a war, except this time the battle is against an invisible enemy: Covid-19. Chart 14 shows what happened to US inflation during WWI, WWII, the Korean War, and the Vietnam War. In the first three of those four wars, inflation rose but then fell back down after the war had concluded. That is what the Fed is counting on. What about the possibility that the coming years could resemble the period around the Vietnam War, where inflation continued to rise even though the number of US military personnel engaged in the conflict peaked in 1968? Chart 14Inflation During Wartime: Which War Is Most Relevant For Today?
Inflation During Wartime: Which War Is Most Relevant For Today?
Inflation During Wartime: Which War Is Most Relevant For Today?
Chart 15Inflation Started Accelerating Quickly Only When Unemployment Reached Very Low Levels In The 1960s
Inflation Started Accelerating Quickly Only When Unemployment Reached Very Low Levels In The 1960s
Inflation Started Accelerating Quickly Only When Unemployment Reached Very Low Levels In The 1960s
In the near term, this does not appear to be a major risk. In 1966, when the war effort was ramping up, the US unemployment rate was two percentage points below NAIRU (Chart 15). As of February, US employment was still more than 5% below pre-pandemic levels. Chart 16Employment Has Been Weak And Edging Lower At The Bottom Quartile Of The Wage Distribution
Second Quarter 2021 Strategy Outlook: Inflation Cometh?
Second Quarter 2021 Strategy Outlook: Inflation Cometh?
We estimate that the US output gap currently stands at around 5%-to-6% of GDP. Among the bottom quartile of the wage distribution, employment is 20% below pre-pandemic levels, and has been edging lower, not higher, since last October (Chart 16). Thus, for now, hyperbolic talk of how fiscal stimulus is crowding out private-sector spending is unwarranted. Inflation Nation Looking further out, the parallels between today and the late sixties are more striking. As we discussed in a report titled 1970s-Style Inflation: Yes, It Could Happen Again, much of what investors believe about how inflation emerged during the late 1960s is either based on myths, or at best, half-truths. To the extent that there are differences between today and that era, they don’t necessarily point to lower inflation in the coming years. For example, in the late sixties, the baby boomers were entering the labour force, supplying the economy with a steady stream of new workers. This helped to temper wage pressures. Today, baby boomers are leaving the labour force. They accumulated a lot of wealth over the past 50 years – so much so that they now control more than half of all US wealth (Chart 17). Over the coming two decades, they will run down that wealth, implying that household savings rates could drop. By definition, a lower savings rate implies more spending in relation to output, which is inflationary. Chart 17Baby Boomers Have Accumulated A Lot Of Wealth
Second Quarter 2021 Strategy Outlook: Inflation Cometh?
Second Quarter 2021 Strategy Outlook: Inflation Cometh?
III. Financial Markets A. Portfolio Strategy Overweight Stocks Versus Bonds Stocks usually outperform bonds when economic growth is strong and money is cheap (Chart 18). The end of the pandemic and ongoing fiscal stimulus should support growth over the next 12-to-18 months, allowing the bull market in equities to continue. With inflation slow to rise, monetary policy will remain accommodative over this period. Chart 18AStocks Usually Outperform Bonds When Economic Growth Is Strong...
Stocks Usually Outperform Bonds When Economic Growth Is Strong...
Stocks Usually Outperform Bonds When Economic Growth Is Strong...
Chart 18B... And Money Is Cheap
... And Money Is Cheap
... And Money Is Cheap
The recent back-up in long-term bond yields could destabilize stocks for a month or two. However, our research has shown that as long as bond yields do not rise enough to trigger a recession, stocks will shrug off the effect of higher yields (Chart 19 and Table 1). Indeed, there is a self-limiting aspect to how high bond yields can rise, and stocks can fall, in a setting where inflation remains subdued. Higher bond yields lead to tighter financial conditions. Tighter financial conditions, in turn, lead to weaker growth, which justifies an even longer period of low rates. It is only when inflation rises to a level that central banks find uncomfortable that tighter financial conditions become desirable. We are far from that level today. Chart 19What Happens To Equities When Treasury Yields Rise?
What Happens To Equities When Treasury Yields Rise?
What Happens To Equities When Treasury Yields Rise?
Table 1As Long As Bond Yields Don’t Rise Into Restrictive Territory, Stocks Will Recover
Second Quarter 2021 Strategy Outlook: Inflation Cometh?
Second Quarter 2021 Strategy Outlook: Inflation Cometh?
It’s Not 2000 In recent months, many analysts have drawn comparisons between the year 2000 and the present day. While there are plenty of similarities, ranging from euphoric retail participation to the proliferation of dubious SPACs and IPOs, there is one critical difference: The forward earnings yield today is above the real bond yield, whereas in 2000 the earnings yield was below the bond yield (Chart 20). The US yield curve inverted in February 2000, with the 10-year Treasury yield peaking a month earlier at 6.79%. An inverted yield curve is one of the most reliable recession predictors. We are a far cry from such a predicament today. By the same token, the S&P 500 dividend yield was well below the bond yield in 2000. Today, they are roughly the same. Even if one were to pessimistically assume that US companies are unable to raise nominal dividend payments at all for the next decade, the S&P 500 would need to fall by 20% in real terms for equities to underperform bonds. Many other stock markets would have to decline by an even greater magnitude (Chart 21). Chart 20Relative To Bonds, Stocks Are More Favorably Valued Now Than In 2000
Relative To Bonds, Stocks Are More Favorably Valued Now Than In 2000
Relative To Bonds, Stocks Are More Favorably Valued Now Than In 2000
Chart 21Stocks Would Need To Fall A Lot For Equities To Underperform Bonds
Stocks Would Need To Fall A Lot For Equities To Underperform Bonds
Stocks Would Need To Fall A Lot For Equities To Underperform Bonds
Protecting Against Long-Term Inflation Risk The bull market in stocks will end when central banks begin to fret over rising inflation. In the past, central banks have used forecasts of inflation to decide when to raise rates. The Federal Reserve’s revised monetary policy framework, which focuses on actual rather than forecasted inflation, almost guarantees that inflation will overshoot the Fed’s target. This is because monetary policy fully affects the economy with a lag of 12-to-18 months. By the time the Fed decides to clamp down on inflation, it will have already gotten too high. Investors looking to hedge long-term inflation risk should reduce duration exposure in fixed-income portfolios, favor inflation-protected securities over nominal bonds, and own more “real assets” such as property. In fact, one of the best inflation hedges is simply to buy a nice house financed with a high loan-to-value fixed-rate mortgage. In a few decades, you will still own the nice house, but the value of the mortgage will be greatly reduced in real terms. Gold Versus Cryptos Historically, gold has offered protection against inflation. Increasingly, many investors have come to believe that cryptocurrencies are a better choice. We disagree. As we recently discussed in a report titled Bitcoin: A Solution In Search Of A Problem, not only are cryptocurrencies such as Bitcoin highly inefficient mediums of exchange, they are also likely to turn out to be poor stores of value. Bitcoin’s annual electricity consumption now exceeds that of Pakistan and its 217 million inhabitants (Chart 22). About 70% of Bitcoin mining currently takes place in China, mainly using electricity generated by burning coal. Much of the rest of the mining takes place in countries such as Russia and Belarus with dubious governance records. Bitcoin and ESG are heading for a clash. We suspect ESG will win out. Chart 22Bitcoin Is Not Your Eco-Currency
Second Quarter 2021 Strategy Outlook: Inflation Cometh?
Second Quarter 2021 Strategy Outlook: Inflation Cometh?
B. Equities Favor Cyclicals, Value, And Non-US Stocks Chart 23Cyclicals And Ex-US Stocks Do Best When Global Growth Is On The Upswing
Cyclicals And Ex-US Stocks Do Best When Global Growth Is On The Upswing
Cyclicals And Ex-US Stocks Do Best When Global Growth Is On The Upswing
The vast majority of stock market capitalization today is concentrated in large multinational companies that are more leveraged to global growth rather than to the growth rate of countries in which they happen to be domiciled. Thus, while country-specific factors are not irrelevant, regional equity allocation often boils down to figuring out which stock markets will gain or lose from various global trends. The end of the pandemic will prop up global growth. In general, cyclical sectors outperform when global growth is on the upswing (Chart 23). As Table 2 illustrates, stock markets outside the US have more exposure to classically cyclical sectors such as industrials, energy, materials, and consumer discretionary that usually shine coming out of a downturn. This leads us to favor Europe, Japan, and emerging markets. We place banks in the cyclical category because faster economic growth tends to reduce bad loans, while also placing upward pressure on bond yields. Chart 24 shows that there is a very close correlation between the relative performance of bank shares and long-term bond yields. As government yields trend higher, banks will benefit. Table 2Financials Are Overrepresented In Ex-US Indices, While Tech Dominates The US Market
Second Quarter 2021 Strategy Outlook: Inflation Cometh?
Second Quarter 2021 Strategy Outlook: Inflation Cometh?
Chart 24Close Correlation Between Relative Performance Of Banks And Long-Term Bond Yields
Close Correlation Between Relative Performance Of Banks And Long-Term Bond Yields
Close Correlation Between Relative Performance Of Banks And Long-Term Bond Yields
Banks and most other cyclical sectors dominate value indices (Table 3). Not only is value still exceptionally cheap in relation to growth, but traditional value sectors have seen stronger upward earnings revisions than tech stocks since the start of the year (Chart 25). The likelihood that global bond yields put in a secular bottom last year, coupled with the emergence of a new bull market in commodities, makes us think that the nascent outperformance of value stocks has years to run. Table 3Breaking Down Growth And Value By Sector
Second Quarter 2021 Strategy Outlook: Inflation Cometh?
Second Quarter 2021 Strategy Outlook: Inflation Cometh?
Chart 25AValue Is Attractive On Multiple Levels (I)
Value Is Attractive On Multiple Levels (I)
Value Is Attractive On Multiple Levels (I)
Chart 25BValue Is Attractive On Multiple Levels (II)
Value Is Attractive On Multiple Levels (II)
Value Is Attractive On Multiple Levels (II)
US Corporate Tax Hikes Coming Finally, there is one country-specific factor worth mentioning, which reinforces our view of favoring non-US, cyclical, and value stocks: US corporate taxes are heading higher. BCA’s geopolitical strategists expect the Biden Administration and the Democrat-controlled Congress to raise the statutory corporate tax rate from 21% to as high as 28% later this year in order to fund, among other things, a major infrastructure investment program. Capital gains taxes will also rise. While tax hikes are unlikely to bring down the whole US stock market, they will detract from the relative performance of US stocks compared with their international peers. Cyclical sectors will benefit from the infrastructure spending. To the extent that such spending boosts growth and leads to a steeper yield curve, it should also benefit banks. In contrast, tech companies outside the clean energy sector will lag, especially if the bill introduces a minimum corporate tax on book income and raises taxes on overseas profits, as President Biden pledged to do during his campaign. C. Fixed Income Expect More US Curve Steepening As discussed above, inflation in the US and elsewhere will be slow to take off. However, when inflation does rise later this decade, it could do so significantly. Investors currently expect the Fed to start raising rates in December 2022, bringing the funds rate to 1.5% by the end of 2024 (Chart 26). In contrast, we think that a liftoff in the second half of 2023, preceded by a 6-to-12 month period of asset purchase tapering, is more likely. This implies a modest downside for short-dated US bond yields. Chart 26The Market Sees The Fed Rate Hike Cycle Kicking Off In Late 2022
The Market Sees The Fed Rate Hike Cycle Kicking Off In Late 2022
The Market Sees The Fed Rate Hike Cycle Kicking Off In Late 2022
Chart 27Long-Term US Real Yield Expectations Have Recovered But Remain Below Pre-Pandemic Levels
Long-Term US Real Yield Expectations Have Recovered But Remain Below Pre-Pandemic Levels
Long-Term US Real Yield Expectations Have Recovered But Remain Below Pre-Pandemic Levels
In contrast, long-term yields will face upward pressure first from strong growth, and later from higher inflation. The 5-year/5-year forward TIPS yield currently stands at 0.35%, which is still below pre-pandemic levels (Chart 27). Given structurally looser fiscal policy, the 5-year/5-year forward TIPS yield should be at least 50 basis points higher, which would translate into a 10-year Treasury yield of a bit over 2%. Regional Bond Allocation While the Fed will be slow out of the gate to raise rates, most other central banks will be even slower. The sole exception among developed market central banks is the Norges bank, which has indicated its intention to hike rates in the second half of this year. Conceivably, Canada could start tightening monetary policy fairly soon, given strong jobs growth and a bubbly housing market. While the Bank of Canada is eager to begin tapering asset purchases later this year, our global fixed-income strategists suspect that the BoC will wait for the Fed to raise rates first. An early start to rate hikes by the Bank of Canada could significantly push up the value of the loonie, which is something the BoC wants to avoid. New Zealand will also hike rates shortly after the Fed, followed by Australia. Bank of England governor Andrew Bailey has downplayed the recent rise in gilt yields. Nevertheless, the desire to maintain currency competitiveness in the post-Brexit era will prevent the BoE from hiking rates until 2024. Among the major central banks, the ECB and the BoJ will be the last major central banks to raise rates. Putting it all together, our fixed-income strategists advocate maintaining a below-benchmark stance on overall duration. Comparing the likely path for rate hikes with market pricing region by region, they recommend overweighting the Euro area and Japan, assigning a neutral allocation to the UK, Canada, Australia, and New Zealand, and an underweight on the US. Credit: Stick With US High Yield Corporates Corporate spreads have narrowed substantially since last March. Nevertheless, in an environment of strong economic growth, it still makes sense to favor riskier corporate credit over safe government bonds. Within corporate credit, we favor high yield over investment grade. Geographically, we prefer US corporate bonds over Euro area bonds. The former trade with a higher yield and spread than the latter (Chart 28). CHART 28Favor High-Yield Bonds Over Investment-Grade And US Corporates Over Euro Area (I)
Favor High-Yield Bonds Over Investment-Grade And US Corporates Over Euro Area (I)
Favor High-Yield Bonds Over Investment-Grade And US Corporates Over Euro Area (I)
Chart 28Favor High-Yield Bonds Over Investment-Grade And US Corporates Over Euro Area (II)
Favor High-Yield Bonds Over Investment-Grade And US Corporates Over Euro Area (II)
Favor High-Yield Bonds Over Investment-Grade And US Corporates Over Euro Area (II)
One way to gauge the attractiveness of credit is to look at the percentile rankings of 12-month breakeven spreads. The 12-month breakeven spread is the amount of credit spread widening that can occur before a credit-sensitive asset starts to underperform a duration-matched, risk-free government bond over a one-year horizon. For US investment-grade corporates, the breakeven spread is currently in the bottom decile of its historic range, which is rather unattractive from a risk-adjusted perspective. In contrast, the US high-yield breakeven spread is currently in the middle of the distribution. In the UK, high-yield debt is more appealing than investment grade, although not quite to the same extent as in the US. In the Euro area, both high-yield and investment-grade credit are fairly unattractive (Chart 29). Chart 29US High-Yield Stands Out The Most
Second Quarter 2021 Strategy Outlook: Inflation Cometh?
Second Quarter 2021 Strategy Outlook: Inflation Cometh?
D. Currencies Faster US Growth Should Support The Dollar In The Near Term… Chart 30US Has A Smaller Share Of Manufacturing Than Most Other Developed Economies
US Has A Smaller Share Of Manufacturing Than Most Other Developed Economies
US Has A Smaller Share Of Manufacturing Than Most Other Developed Economies
The US has a “low beta” economy. Compared to most other economies, the US has a bigger service sector and a smaller manufacturing base (Chart 30). The US economy is also highly diversified on both a regional and sectoral level. This tends to make US growth less volatile than growth abroad. The relatively low cyclicality of the US economy has important implications for the US dollar. While the US benefits from stronger global growth, the rest of the world usually benefits even more. Thus, when global growth accelerates, capital tends to flow from the US to other economies, dragging down the value of the dollar. This relationship broke down this year. Rather than lagging other economies, the US economy has led the charge thanks to bountiful fiscal stimulus and a successful vaccination campaign. As growth estimates for the US have been marked up, the dollar has caught a temporary bid (Chart 31). Chart 31US Growth Outperformance Could Be A Near-Term Tailwind For The Dollar
US Growth Outperformance Could Be A Near-Term Tailwind For The Dollar
US Growth Outperformance Could Be A Near-Term Tailwind For The Dollar
… But Underlying Fundamentals Are Dollar Bearish As discussed earlier in the report, growth momentum should swing back towards the rest of the world later this year. This should weigh on the dollar in the second half of the year. To make matters worse for the greenback, the US trade deficit has ballooned in recent quarters. The current account deficit, a broad measure of net foreign income flows, rose by nearly 35% to $647 billion in 2020. At 3.1% of GDP, it was the largest shortfall in 12 years (Chart 32). Consistent with the weak balance of payments picture, the dollar remains overvalued by about 10% on a purchasing power parity basis (Chart 33). Chart 32The Widening US External Gap
The Widening US External Gap
The Widening US External Gap
Chart 33The Dollar Is Expensive Based On Its PPP Fair Value
The Dollar Is Expensive Based On Its PPP Fair Value
The Dollar Is Expensive Based On Its PPP Fair Value
Historically, the dollar has weakened whenever fiscal policy has been eased in excess of what is needed to close the output gap (Chart 34). Foreigners have been net sellers of Treasurys this year. It is equity inflows that have supported the dollar (Chart 35). However, if non-US stock markets begin to outperform, foreign flows into US stocks could reverse. Chart 34The Greenback Tends To Weaken When Fiscal Policy Is Eased Relative To What The Economy Needs
The Greenback Tends To Weaken When Fiscal Policy Is Eased Relative To What The Economy Needs
The Greenback Tends To Weaken When Fiscal Policy Is Eased Relative To What The Economy Needs
Chart 35Equity Inflows Supported The Dollar This Year (I)
Equity Inflows Supported The Dollar This Year (I)
Equity Inflows Supported The Dollar This Year (I)
Chart 35Equity Inflows Supported The Dollar This Year (II)
Equity Inflows Supported The Dollar This Year (II)
Equity Inflows Supported The Dollar This Year (II)
Meanwhile, stronger US growth has pushed long-term real interest rate differentials only modestly in favor of the US. At the short end of the curve, real rate differentials have actually widened against the US since the start of the year, reflecting rising US inflation expectations and the Fed’s determination to keep rates near zero for an extended period of time (Chart 36). Chart 36Real Rate Differentials Have Moved In Favor Of The Dollar At The Long End Of The Curve, But Not At The Short End (I)
Real Rate Differentials Have Moved In Favor Of The Dollar At The Long End Of The Curve, But Not At The Short End (I)
Real Rate Differentials Have Moved In Favor Of The Dollar At The Long End Of The Curve, But Not At The Short End (I)
Chart 36Real Rate Differentials Have Moved In Favor Of The Dollar At The Long End Of The Curve, But Not At The Short End (II)
Real Rate Differentials Have Moved In Favor Of The Dollar At The Long End Of The Curve, But Not At The Short End (II)
Real Rate Differentials Have Moved In Favor Of The Dollar At The Long End Of The Curve, But Not At The Short End (II)
On balance, while the dollar could strengthen a bit more over the next month or so, the greenback will weaken over a 12-month horizon. Chester Ntonifor, BCA’s chief currency strategist, expects the dollar to fall the most against the Norwegian krone, Swedish krona, Australian dollar, and British pound over a 12-month horizon. In the EM space, stronger global growth will disproportionately benefit the Mexican peso, Chilean peso, Colombian peso, South African rand, Czech koruna, Indonesian rupiah, Korean won, and Singapore dollar. Chart 37Weak Dollar Is Usually A Tailwind For Cyclicals, Non-US Stocks, And Value Stocks (I)
Weak Dollar Is Usually A Tailwind For Cyclicals, Non-US Stocks, And Value Stocks (I)
Weak Dollar Is Usually A Tailwind For Cyclicals, Non-US Stocks, And Value Stocks (I)
Chart 37Weak Dollar Is Usually A Tailwind For Cyclicals, Non-US Stocks, And Value Stocks (II)
Weak Dollar Is Usually A Tailwind For Cyclicals, Non-US Stocks, And Value Stocks (II)
Weak Dollar Is Usually A Tailwind For Cyclicals, Non-US Stocks, And Value Stocks (II)
Consistent with our equity views, a weaker dollar would be good news for cyclical equity sectors, non-US stock markets, and value stocks (Chart 37). E. Commodities Favorable Outlook For Commodities Strong global growth against a backdrop of tight supply should sustain momentum in the commodity complex over the next 12-to-18 months. Capital investment in the oil and gas sector has fallen by more than 50% since 2014 (Chart 38). BCA’s Commodity & Energy Strategy service, led by Robert Ryan, expects annual growth in crude oil demand to outstrip supply over the remainder of this year (Chart 39). Chart 38Oil & Gas Capex Collapses In COVID-19’s Wake
Second Quarter 2021 Strategy Outlook: Inflation Cometh?
Second Quarter 2021 Strategy Outlook: Inflation Cometh?
Chart 39Crude Oil Demand Growth To Outstrip Supply Over The Remainder Of This Year
Crude Oil Demand Growth To Outstrip Supply Over The Remainder Of This Year
Crude Oil Demand Growth To Outstrip Supply Over The Remainder Of This Year
A physical deficit in the metals markets – particularly for copper and aluminum – should also persist this year (Chart 40). While the boom in electric vehicle (EV) production represents a long-term threat to oil, it is manna from heaven for many metals. A battery-powered EV can contain more than 180 pounds of copper compared with 50 pounds for conventional autos. By 2030, the demand from EVs alone should amount to close to 4mm tonnes of copper per year, representing about 15% of annual copper production. Chart 40ACopper Will Be In Physical Deficit...
Copper Will Be In Physical Deficit...
Copper Will Be In Physical Deficit...
Chart 40B...As Will Aluminum
...As Will Aluminum
...As Will Aluminum
China’s Commodity Demand Will Remain Strong Chart 41China Keeps Buying More And More Commodities
China Keeps Buying More And More Commodities
China Keeps Buying More And More Commodities
Strong demand for metals from China should also buoy metals prices. While trend GDP growth in China has slowed, the economy is much bigger in absolute terms than it was in the 2000s. China’s annual aggregate consumption of metals is five times as high as it was back then. The incremental increase in China’s metal consumption, as measured by the volume of commodities consumed, is also double what it was 20 years ago (Chart 41). As we discussed in our report To Deleverage Its Economy, China Needs MORE Debt, the Chinese government has no choice but to continue to recycle persistently elevated household savings into commodity-intensive capital investment. This will ensure ample commodity demand from China for years to come. Peter Berezin Chief Global Strategist pberezin@bcaresearch.com Global Investment Strategy View Matrix
Second Quarter 2021 Strategy Outlook: Inflation Cometh?
Second Quarter 2021 Strategy Outlook: Inflation Cometh?
Special Trade Recommendations
Second Quarter 2021 Strategy Outlook: Inflation Cometh?
Second Quarter 2021 Strategy Outlook: Inflation Cometh?
Current MacroQuant Model Scores
Second Quarter 2021 Strategy Outlook: Inflation Cometh?
Second Quarter 2021 Strategy Outlook: Inflation Cometh?
Dear client, Next week, in lieu of our weekly report, I will be hosting a webcast on Tuesday, March 30 at 9:00 am HKT and Tuesday, March 30 at 10:00 am EDT. In the webcast, I will share our outlook on China’s post-pandemic economic and policy dynamics. Best regards, Jing Sima, China Strategist Highlights China is aiming for a massive adoption of new energy vehicles (NEVs) to help achieve its 2030 peak carbon dioxide emissions target. The country’s NEV share of total vehicle sales will likely rise significantly to 40% in 2030, from only 5.4% in 2020. This will translate into a compound annual growth rate (CAGR) of 24%-25% in Chinese NEV sales in this decade. China will become increasingly competitive and important in the global NEV supply chain. The country will maintain its leading position in global electric vehicle battery production while reducing its dependence on imported auto chips. The Chinese NEV production/sales boom will likely reduce the country’s crude oil consumption while increasing the country’s copper demand during 2021-2030. It will also impact more positively on nickel and lithium demand than on cobalt demand. The Chinese NEV stocks could be a good long-term investment, but we recommend waiting for a better entry point. Feature China's production and sales of new energy vehicles (NEVs) have ranked first in the world for six consecutive years. The country’s NEV sales quadrupled during 2015-2020, propelled by supporting policies such as significant amounts of subsidies to buyers. We believe China will continue to be the leader in both global NEV sales and production this decade. The country’s NEV production and sales will get supercharged by continuing favorable polices and increasing consumers’ interest in NEVs. Many market-driven factors, including falling NEV prices, longer driving range per charge, rapid expansion in the NEV charging/battery-swapping network, as well as new functions including autonomous driving and more software applications-based services, will accelerate NEV adoption in China during 2021-2030. According to the country’s NEV development roadmap, the NEV share of total vehicle sales in China aims to rise to at least 40% in 2030, from only 5.4% in 2020. This will likely translate to a compound annual growth rate (CAGR) of 24%-25% in Chinese NEV sales in this decade. In 2030, the NEV sales in units could be eight to nine times its 2020 level, rising from 1.37 million units to 12-13 million units (Chart 1). Benefiting from the massive scale of the domestic NEV market, China will become increasingly competitive and important in the global NEV supply chain. The country will maintain its leading position in global electric vehicle battery production while reducing its dependence on imported auto chips. The Chinese NEV production/sales boom will help reduce transportation fuel consumption, leading to less carbon dioxide emissions (Chart 2). Chart 1Chinese NEV Sales: A Supercharged Decade Ahead
Chinese NEV Sales: A Supercharged Decade Ahead
Chinese NEV Sales: A Supercharged Decade Ahead
Chart 2China: Booming NEV Sales Reduce Oil Demand, Leading To Less CO2 Emissions
China: Booming NEV Sales Reduce Oil Demand, Leading To Less CO2 Emissions
China: Booming NEV Sales Reduce Oil Demand, Leading To Less CO2 Emissions
In addition, the country’s copper demand will likely be increase due to booming NEV production during 2021-2030. Meanwhile, the impact will be more positive on nickel and lithium demand than on cobalt demand. Given such significant growth ahead for the Chinese NEV market, we believe Chinese NEV-related stocks are a potential good buy, but we recommend waiting for a better entry point. China’s NEV Market: A Supercharged Decade Chinese NEV market is entering a supercharged decade (Box 1). Box 1 Our Forecast Of China’s NEV Sales In 2030 Our estimates of China’s NEV sales in 2030 were derived from two assumptions. First, we assume the NEV share of total Chinese automobile sales in 2030 to be 40%. Based on last October’s report, “Technology Roadmap 2.0 for Energy-Saving and New Energy Vehicles,” published by the China Society of Automotive Engineers (China-SAE), the China-SAE projects that NEVs will account for at least 40% of total automobile sales in China in 2030. The China-SAE is under the supervision of the Ministry of Industry and Information Technology (MIIT). Second, as car ownership – the share of households owning one car – has already risen to over 50% in China, we assume the CAGR of the country’s automobile sales will slow to 1.5%-2.5% in the next decade from 3.4% in the past decade. Based on this assumption, China’s automobile annual sales will likely increase to 29-32 million units in 2030. What Are The Underlying Drivers For Such Significant Growth? First, the interest in buying a NEV is rapidly growing in China. In a September 2020 survey done by Roland Berger, 80% of surveyed potential car buyers in China were considering buying an electric vehicle as their next car, the highest among major economies (Chart 3). Last year, this surveyed number for China was only 60%. We believe this shift in buying intention will continue and will consequently translate into a boom in NEV sales during 2021-2030. NEV battery costs have decreased by nearly 90% since 2010 and will continue to fall (Chart 4). This will drive down average NEV selling prices as the battery in general accounts 40-45% of the total production cost of NEVs, thereby making them more appealing to buyers. Chart 3China: Rising Interest In NEV Purchases
Implications Of China’s 2030 CO2 Peak Emission Target (Part II: New Energy Vehicles)
Implications Of China’s 2030 CO2 Peak Emission Target (Part II: New Energy Vehicles)
Chart 4NEV Battery Costs Will Continue To Fall
NEV Battery Costs Will Continue To Fall
NEV Battery Costs Will Continue To Fall
The average driving range per charge for NEVs will continue to rise. The average driving mileage per charge in China has nearly doubled, from 190km in 2016 to 360km in 2019.1 Currently, a growing proportion of NEV vehicles on the market can even achieve a mileage of 600km and above with a single charge. This is already comparable to traditional gasoline-powered vehicles, which can also cover approximately 600km per fuel tank. More models with a wide range of selling prices will soon be on the market. Last June, the cheapest electric car with a selling price of only RMB 28,800 (about US$4,000) was released into the Chinese market. Since then the sales of this model have quickly surpassed the Tesla Model 3 to become the hottest seller in China. This shows consumer enthusiasm for affordable NEVs. In the meantime, the success of Tesla electric cars in China demonstrated Chinese consumers’ strong interest in high-quality and expensive NEVs. Chart 5China Has The Most NEV Models In The World
Implications Of China’s 2030 CO2 Peak Emission Target (Part II: New Energy Vehicles)
Implications Of China’s 2030 CO2 Peak Emission Target (Part II: New Energy Vehicles)
Chart 5 shows that China is the country with most electric vehicle models in the world. The number of available electric vehicle models was 227 in China in 2019, significantly higher than all other individual countries. According to McKinsey, more than 250 new battery electric vehicle (BEV) and plug-in hybrid electric vehicle (PHEV) models will be introduced in the next two years alone. Most of these models will likely be sold in China, adding more purchase options for Chinese consumers. Faster charging time for EV batteries as well as expanding charging/battery-swapping networks are in the making. This will greatly reduce recharge waiting time for NEV drivers. Chart 6Chinese NEV Charging Infrastructure: The Rapid Expansion Will Continue
Implications Of China’s 2030 CO2 Peak Emission Target (Part II: New Energy Vehicles)
Implications Of China’s 2030 CO2 Peak Emission Target (Part II: New Energy Vehicles)
Based on the data from the China Electric Vehicle Charging Infrastructure Promotion Alliance (EVCIPA), the number of both public and private charging poles has increased significantly from 2015 to 2020. In addition, the number of private ones has already exceeded the number of public ones each year since 2017 (Chart 6). The rapid expansion in the country’s charging station network will continue. The number of total charging poles will likely rise from 1.7 million units to the government’s target of 5 million units in 2025. In addition, Wood Mackenzie last May forecasted this number could reach 9.8 million units in 2030. Roland Berger last September reported that the number of charging locations per 100 km of roadway was about 6.1 in China, significantly higher than 2.2 in Germany and 0.5 in the US (Chart 7). In terms of the number of charging stations per 1000 NEVs, China has also significantly exceeded other major automobile producing countries (Chart 8). Chart 7The Number Of Charging Locations Per 100 km Of Roadway Is Higher In China Than In Many Other Countries…
Implications Of China’s 2030 CO2 Peak Emission Target (Part II: New Energy Vehicles)
Implications Of China’s 2030 CO2 Peak Emission Target (Part II: New Energy Vehicles)
Chart 8…The Same Is True Of The Number Of Charging Stations Per 1,000 NEVs
Implications Of China’s 2030 CO2 Peak Emission Target (Part II: New Energy Vehicles)
Implications Of China’s 2030 CO2 Peak Emission Target (Part II: New Energy Vehicles)
Meanwhile, the Chinese government is also promoting an expansion of battery-swapping networks. The Chinese auto manufacturer Nio has been the leader in this area. The company currently has a network of 178 battery-swapping stations located in and between major cities such as Beijing and Shenzhen; by the end of the year, it plans to have 500 stations. The battery-swapping time for the Nio EV now can be as fast as 90 seconds, even faster than fueling up with gasoline. EVs will become increasingly equipped with functions such as autonomous driving and more software applications-based services. EVs will also become more integrated with intelligent and interactive networks. All these features will make EVs more attractive to automobile buyers. Second, with the 2030 target for peak emissions, the Chinese authorities will likely continue to develop favorable polices for the domestic NEV sector. China’s key policy support tools for NEVs include tax reductions, direct subsidies to manufacturers, consumer subsidies, and mandated government procurements. In the past, China has provided immense support for NEVs by spending billions of dollars on direct subsidies to manufacturers2 and on consumer subsidy programs.3 In the future, the country’s policy focus will be on NEV charging/battery-swapping network development as well as on NEV-related technology research and investment. For example, since 2019, auto manufacturers have received credits for each NEV produced. The credits take into consideration factors such as the type of vehicle, as well as its maximum speed, energy consumption, weight, and range. This measure will encourage NEV automakers to put more emphasis on technological change. These government supports of technology and network development, coupled with strong interest in NEV purchases by domestic consumers, should offset the impact of the government’s reduced direct subsidies for NEV production and sales. China has reduced overall direct subsidies to both NEV manufacturers and consumers, and vehicles must meet minimum technical and performance criteria to qualify. In 2021, subsidies will be reduced by 20% on NEVs for personal use, and by 10% on NEVs for public transport, including buses and taxis, from their respective 2020 level. In addition, NEV subsidies and tax exemptions will expire at the end of 2022 and subsidies will be limited to 2 million NEVs per year from 2020 to 2022. A vehicle price limit for passenger cars of CNY300,000 has also been introduced. The NEV subsidy level is currently less in China than in European countries as well as in the US, showing the Chinese NEV market’s diminishing dependence on subsidies. Bottom Line: The country’s NEV production and sales will get supercharged by continuing favorable polices and by increasing consumer interest in NEVs during 2021-2030. We expect China’s NEV sales to reach 12 to 13 million units in 2030, eight to nine times its 2020 level of 1.37 million units. Growing China’s Competitiveness In The Global NEV Supply Chain The global NEV market has two main subsectors – plug-in hybrid electric vehicles (PHEV) and battery electric vehicles (BEV). The former can be operated in either the electric-powered mode or internal-combustion engines (ICE) mode. The BEVs can only run in electric mode and are also called pure electric vehicles. Traditional ICE vehicle manufacturers from Europe, US, Japan, and South Korea have more competitive advantages in the global PHEV subsector supply chain due to their long-term dominance in the global traditional ICE vehicle market. Chart 9BEVs Account For Over 80% Of Chinese NEV Sales
BEVs Account For Over 80% Of Chinese NEV Sales
BEVs Account For Over 80% Of Chinese NEV Sales
China has been putting more focus on the new BEV market as it has enabled a level playing field with traditional ICE vehicle players. Hence, China has stronger competitiveness in the global BEV subsector. BEVs account for approximately 82% of Chinese NEV sales (Chart 9). According to China-SAE, this ratio could reach 95% by 2035 as China will increase its development of the BEV market and the adoption of BEV vehicle options. We expect China’s competitiveness will continue to grow along the global NEV supply chain, especially in the BEV subsector. Having the largest domestic NEV market in the world gives China the advantage of attracting NEV manufacturers and building a more integrated global supply chain. During 2017-2020, accumulated world NEV sales were about 8.8 million units, with the largest share of 49% coming from China, higher than 31% for Europe and 14% for the US (Chart 10). China is the largest NEV battery producer in the global NEV supply chain. The battery is the most important component of a NEV, and its technological progress holds the key to transitioning away from fossil fuel dependence. Data shows that six out of the world’s top ten NEV battery producers are Chinese companies, together accounting for 41% of global battery sales in kwh last year (Chart 11). Chinese company CATL has been the largest NEV battery producer for the past four years. Chart 10China Has The Largest NEV Market In The World
Implications Of China’s 2030 CO2 Peak Emission Target (Part II: New Energy Vehicles)
Implications Of China’s 2030 CO2 Peak Emission Target (Part II: New Energy Vehicles)
Chart 11Chinese Companies: Major Players In The Global NEV Battery Market
Implications Of China’s 2030 CO2 Peak Emission Target (Part II: New Energy Vehicles)
Implications Of China’s 2030 CO2 Peak Emission Target (Part II: New Energy Vehicles)
The development of charging/battery-swapping infrastructure will continue to be faster in China than in other countries/regions due to the country’s much larger scale of EV users and related policy support. This allows China to collect more NEV charging-related data, which may be used to improve the country’s NEV manufacturing process, charging pole production, and the country’s charging infrastructure development. The development of the 5G network is much more advanced in China than in any other countries. This allows NEV makers to work closely with IT/internet companies such as Huawei, Baidu, Tencent and Alibaba to test integrated applications such as the autonomous driving and AI functions of NEVs. This will help promote the technology advancement related to NEVs in all aspects in China. Chart 12Chinas NEV Net Exports Are Set To Go Up
Chinas NEV Net Exports Are Set To Go Up
Chinas NEV Net Exports Are Set To Go Up
Due to its competitive advantages, China has become a net exporter of electric vehicles (Chart 12). In 2019, Chinese NEV sales abroad accounted for only 1.7% of the world total in US dollar terms, far below the US (31%), Germany (15%), and South Korea (9%). We expect growing competitiveness will allow China to gain share in global NEV exports. The area China needs to work on the most along the NEV supply chain is the design/manufacturing of automotive chips. There is still no Chinese company among the top ten global auto chip semiconductor companies based on sales revenue (Chart 13). Chart 13China’s Greatest Weaknesses Lie In Automotive Chip Design/Manufacturing
Implications Of China’s 2030 CO2 Peak Emission Target (Part II: New Energy Vehicles)
Implications Of China’s 2030 CO2 Peak Emission Target (Part II: New Energy Vehicles)
Non-Chinese companies account for about 90% of the global auto chip supply while China contributes no more than 5%. The current automotive chip shortage has done much more severe damage to automakers in China than in any other country. Bloomberg recently reported the global auto industry might lose US$61 billion of 2021 sales from chip shortages, with 42% of the losses from China. In the recent National People’s Congress, the Chinese government reiterated the importance of addressing this weak link, with an urgency on reducing the country’s dependence on foreign auto chips. Bottom Line: China will become globally more competitive in the NEV supply chain. Impact On Commodity Markets The evolution in China’s NEV markets in this decade will have various impacts on commodities such as crude oil, copper, nickel, cobalt, and lithium. During 2021-2030, massive NEV adoption will only modestly reduce Chinese crude oil consumption for the transportation sector, while significant growth in NEV/charging pole/battery production will increase the country’s copper demand. Meanwhile, as NEV battery production requires raw materials including nickel, cobalt and lithium, rapid growth in NEV battery production will also have different impacts on these commodity markets. Crude oil: In 2019, the total number of vehicles in China was 252.6 million units and the country’s total gasoline and diesel consumption was about 6,800 thousand barrels per day (kbpd) of crude oil equivalent. This equals 26.7 kbpd per 1000 vehicles. Annual NEV sales in China will rise from 1.37 million units in 2020 to about 12 million units in 2030. Assuming all these NEVs are only using their electric battery, this will cut oil consumption/imports by an increasing amount every year, ranging from 50 kbpd in 2021 to 320 kbpd in 2030. The reduction from increased NEV sales will have a relatively minuscule impact on China’s total crude oil imports. A 50-kbpd reduction in 2021 would account for less than half a percent of China’s 2020 crude oil imports. By 2030, this number could potentially rise to 1-3%, but is still insignificant. Copper: An average gasoline powered car uses only about 20kg of copper, while a hybrid car uses about 40 kg and a fully electric car uses roughly 80kg. In addition, NEV batteries and charging station chargers also require copper. Table 1 shows our rough calculation of the copper demand from the expansion of Chinese NEV market. Chinese copper demand may increase by 210 thousand tons in 2021 and by about 1,500 thousand tons in 2030. To put this into perspective, China consumed about 15 million tons of copper in 2020 based on World Bureau of Metal Statistics (WBMS) data. The increase in copper demand in 2021 is only 1.4% of 2020 copper consumption in China. However, when it increases to 1,500 thousand tons in 2030, it will account for 10% of China’s current copper consumption. Table 1China's Copper Demand Due To EV Adoption In 2021 And 2030
Implications Of China’s 2030 CO2 Peak Emission Target (Part II: New Energy Vehicles)
Implications Of China’s 2030 CO2 Peak Emission Target (Part II: New Energy Vehicles)
Chart 14Chinas NEV Boom Will Have A More Positive Impact On Nickel And Lithium Demand Than On Cobalt Demand
Chinas NEV Boom Will Have A More Positive Impact On Nickel And Lithium Demand Than On Cobalt Demand
Chinas NEV Boom Will Have A More Positive Impact On Nickel And Lithium Demand Than On Cobalt Demand
Nickel: The NEV battery technology is on a trend to reduce the use of cobalt given its high price and limited supply, while increasing the use of nickel. This will be a long-term positive factor for nickel prices (Chart 14, top panel). Cobalt: EV battery makers are trying to reduce or even avoid the use of cobalt. In the next couple of years, the demand for cobalt will likely remain strong as the technology of non-cobalt batteries is still in the developing stage. Non-cobalt batteries in development include solid-state , lithium-sulphur, sodium-ion and lithium-air batteries. However, cobalt prices may face increasing headwinds in the longer term (Chart 14, middle panel). Lithium: Lithium is a very abundant mineral produced from either brines or hard rock sources, with products from clays also in the pipeline. There is no structural constraint on global lithium production. Lithium prices may remain elevated in the near term but as the supply catches up over a longer run, we expect lithium prices to go down (Chart 14, bottom panel). Bottom Line: The massive growth in the Chinese NEV market in this decade will have a small negative impact on crude oil demand and a more positive impact on commodity demand such as copper, nickel, cobalt, and lithium. However, cobalt may face a substitution risk due to its elevated prices while lithium may face the risk of increasing supply. Investment Implications On NEV-related Stocks Chart 15The Chinese NEV stocks: A Good Long-term Investment, But We Recommend Waiting For A Better Entry Point
The Chinese NEV stocks: A Good Long-term Investment, But We Recommend Waiting For A Better Entry Point
The Chinese NEV stocks: A Good Long-term Investment, But We Recommend Waiting For A Better Entry Point
We believe share prices of the Chinese NEV makers and NEV battery producers will deliver considerable positive long-term returns. The basis for this assumption is that many of them will experience strong revenue growth over this decade. While NEV maker stock prices have recently fallen considerably, we think they are still overpriced and recommend waiting for a better entry point (Chart 15). Ellen JingYuan He Associate Vice President ellenj@bcaresearch.com Footnotes 1Source: “Technology Roadmap 2.0 for Energy-Saving and New Energy Vehicles,” released on October 27, 2020 by the China Society of Automotive Engineers (China-SAE). 2For example, as part of China’s 2012 “Energy-Saving and New Energy Vehicle Industry Development Plan (2012–2020),” the central government allocated over $15 billion to support the development of energy-efficient vehicles and NEVs, pilot car projects, and electric vehicle infrastructure. Source: "Chinese Government Support for New Energy Vehicles as a Trade Battleground", published by The National Bureau of Asian Research" on September 27, 2017. 3For example, the central government had provided 60,000 yuan (approximately $8,700) and 50,000 yuan (approximately $7,250) per car in subsidies for electric vehicles and plug-in hybrid vehicles, respectively, covering 40%–60% of the cost of the vehicle. Local governments also created their own subsidy programs that provided additional discounts for NEV purchases through cash subsidies, free parking, or free license plates. Source: "Chinese Government Support for New Energy Vehicles as a Trade Battleground", published by The National Bureau of Asian Research" on September 27, 2017. Cyclical Investment Stance Equity Sector Recommendations
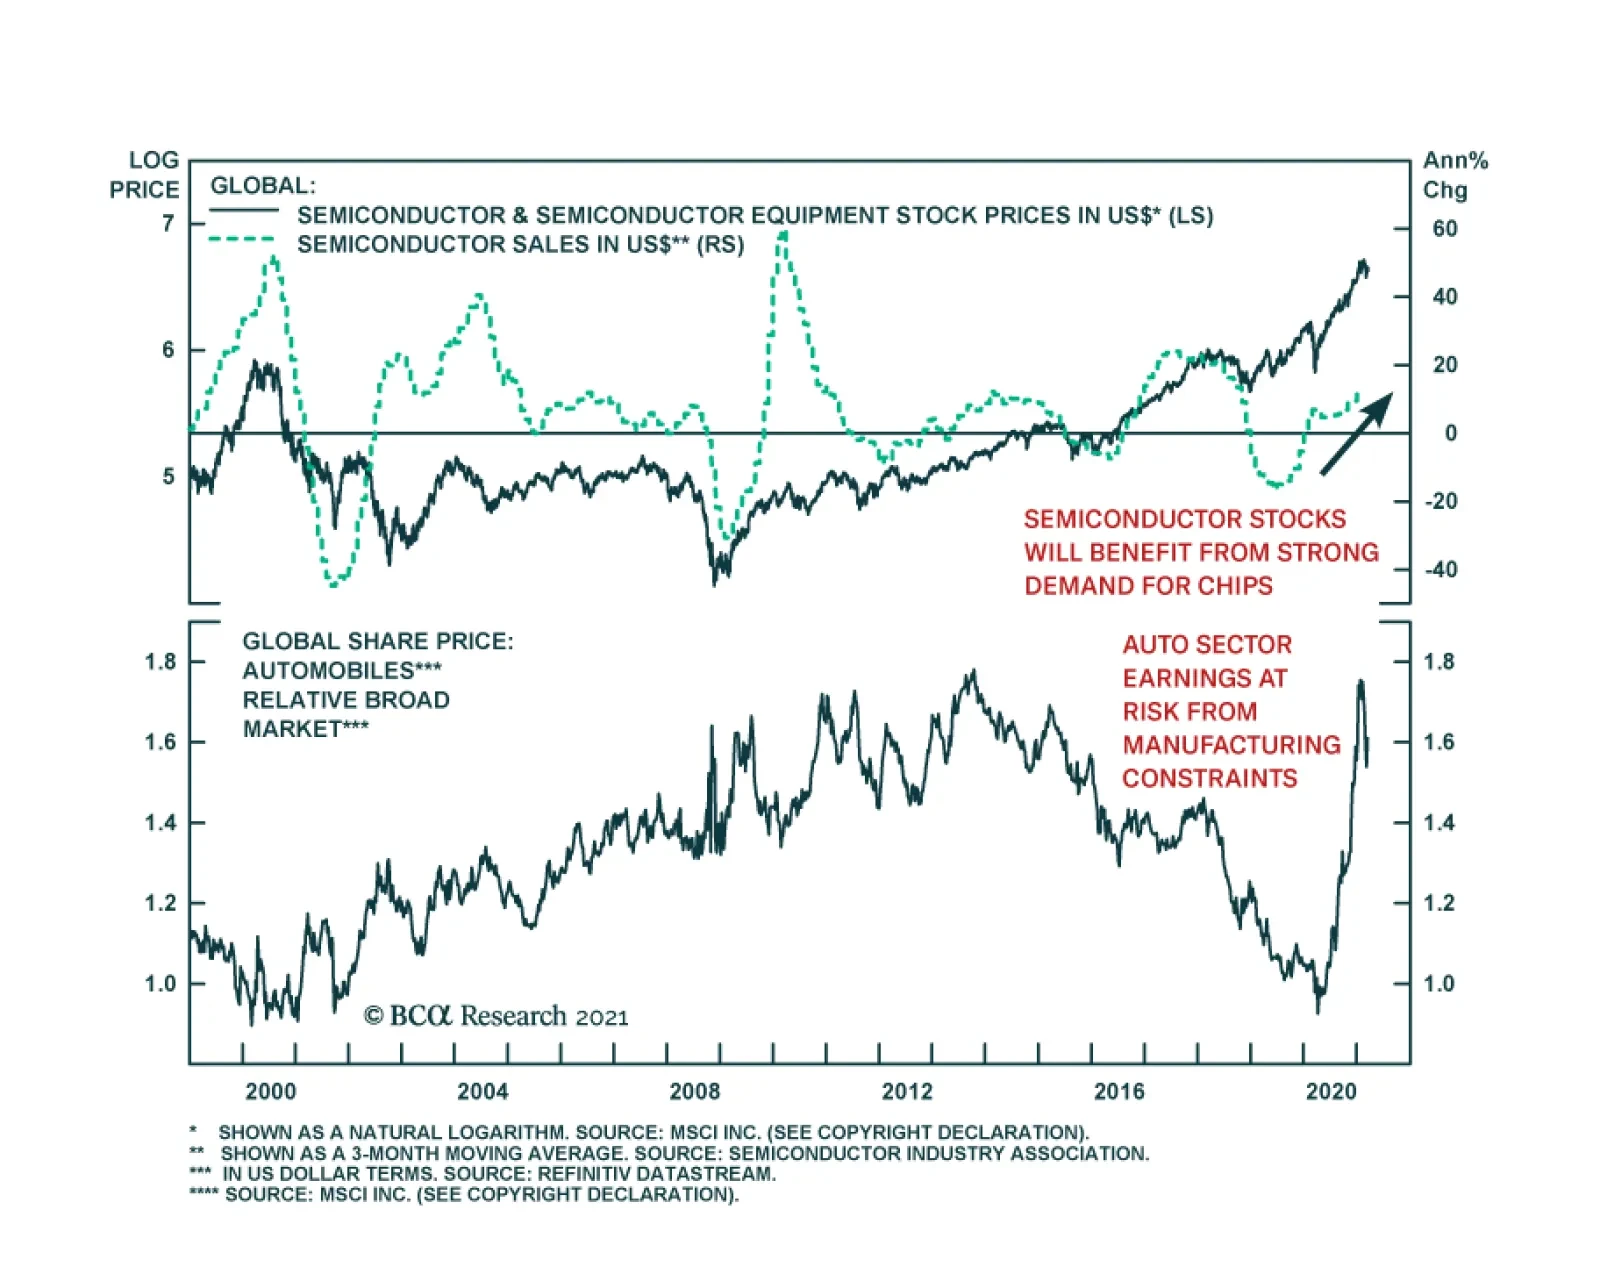
The global semiconductor shortage is weighing on production schedules of major industries. Last month, GM and Ford were forced to shutter some of their North American production because they do not have enough chips to manufacture cars. Now Samsung has…
Highlights The latest “dot plot” from the Fed reaffirmed the FOMC’s intention to keep rates near zero for at least the next two years, despite evidence that the US economy will recover from the pandemic much faster than expected. The Fed’s reluctance to telegraph any rate hikes stems in part from its conviction that the neutral rate of interest has declined. A lower neutral rate implies that monetary policy may not be as accommodative as widely believed. Whereas Fed officials have argued that the neutral rate has fallen due to structural factors outside their control, critics insist that the Fed’s own actions have painted it into a corner. By cutting rates at every opportunity, so the argument goes, the Fed has inflated a massive asset bubble. Moreover, low rates have encouraged governments and the private sector to take on more debt. All this has locked the Fed into a low interest-rate trap: Any attempt to tighten monetary policy would cause asset prices to plunge and debt-servicing costs to rise. This would result in financial distress and rising unemployment – the exact two things the Fed wants to avoid. While we disagree with the view that easier monetary policy has made things worse, we do agree that elevated asset prices and high debt levels limit the Fed’s room for maneuver. In this week’s report, we contend that the low interest-rate trap will likely be resolved through an extended period of easy money, ultimately culminating in significantly higher inflation starting by the middle of this decade. Growth Dots Up, Rate Dots Not The FOMC released its latest Summary of Economic Projections (aka the “dot plot”) this week. As widely anticipated, the Fed upgraded its view on growth following the passage of the $1.9 trillion American Rescue Plan Act. The Fed now expects real GDP to rise by 6.5% in the fourth quarter of 2021 from a year ago, up from its December 2020 estimate of 4.2%. The Fed also sees the unemployment rate falling to 4.5% by the fourth quarter of this year. Back in December, the Fed thought the unemployment rate would end this year at 5% (Chart 1). Chart 1The Fed Sees Faster Recovery, Same Rate Path
Is The Fed Locked Into A Low Interest-Rate Trap?
Is The Fed Locked Into A Low Interest-Rate Trap?
Chart 2The Fed Has Been Lowering Its Estimate Of The Neutral Rate
The Fed Has Been Lowering Its Estimate Of The Neutral Rate
The Fed Has Been Lowering Its Estimate Of The Neutral Rate
The Fed’s unemployment rate projection of 3.9% for 2022 is slightly below the “longer run” estimate of 4.0%. This suggests that the Fed believes the US will have reached full employment by the end of next year. Yet, despite the Fed’s sanguine view on the pace of the economic recovery, the median dot for the expected fed funds rate in 2023 remained at 0.1% (although seven members did pencil in a hike for that year, up from five last December). The median “longer run” dot stayed at 2.5%, with not a single Fed member putting in an estimate above 3%. The Fed regards this longer-run dot as its estimate of the neutral rate of interest – the interest rate consistent with full employment and stable inflation. When the Fed introduced the “dots” back in early 2012, its estimate of the neutral rate stood at 4.3%. It has been trending lower ever since (Chart 2). Explanations For The Falling Neutral Rate What accounts for the steady decline in the Fed’s estimate of the neutral rate in recent years? Fed officials have generally argued that structural forces have dragged down the equilibrium interest rate for the economy. These forces include slower trend growth, an aging population, the shift to a capital-lite economy, high levels of overseas savings, and as we recently discussed, increased income inequality. There is another interpretation, however. Rather than casting the Fed as a helpless observer responding to structural forces beyond its control, some commentators have argued that the Fed’s own actions explain why rates are so chronically low today. By cutting interest rates at every opportunity, so the argument goes, the Fed has inflated a massive asset bubble, stretching from equities to commercial real estate to cryptocurrencies. Moreover, low rates have encouraged governments and the private sector to take on more debt. Chart 3The Correlation Between Swings In Mortgage Rates And Housing Activity
The Correlation Between Swings In Mortgage Rates And Housing Activity
The Correlation Between Swings In Mortgage Rates And Housing Activity
All this has locked the Fed into a low interest-rate trap: Any attempt to tighten monetary policy would cause asset prices to plunge and debt-servicing costs to rise. This would result in financial distress and rising unemployment – the exact two things the Fed wants to avoid. The Fed Is Not The Culprit It is a provocative argument, but is the Fed really to blame? For the most part, the answer is “’no.” To see why, consider the counterfactual: Suppose the Fed did not cut rates. If rates had stayed elevated, the recovery in the cyclical sectors of the economy following the Global Financial Crisis would have been even slower. Housing, in particular, would have remained in the doldrums. Chart 3 shows that there is a strong correlation between housing activity and the 30-year mortgage rate. Lower home prices would have reduced spending via the wealth effect channel, while making it more difficult for banks to recapitalize their balance sheets. In addition, relatively high US rates would have put upward pressure on the dollar, leading to a larger trade deficit (Chart 4). All of this would have reduced aggregate demand. Chart 4The Dollar And The Trade Balance
The Dollar And The Trade Balance
The Dollar And The Trade Balance
Chart 5Rising Labor Share Of Income Occurring Alongside Labor Market Tightening
Rising Labor Share Of Income Occurring Alongside Labor Market Tightening
Rising Labor Share Of Income Occurring Alongside Labor Market Tightening
The share of national income flowing to workers tends to rise when the labor market tightens (Chart 5). A chronic shortfall in aggregate demand would have exacerbated income inequality. Since the poor spend more of every dollar of disposable income than the rich, this would have further dampened overall spending. The Fed has been like a doctor administering a life-saving medicine that comes with some notable side effects. These side effects include increased sensitivity of asset prices to changes in interest rates.1 They also include higher debt levels, at least in those sectors of the economy that had the ability to lever up in response to lower interest rates. Side Effect Triage How dangerous are these side effects? To the extent that today’s low policy rates stem from the fact that structural forces have depressed the neutral rate of interest, they are not especially dangerous at the moment. Yes, debt-servicing costs would balloon, and asset prices would tumble, if the Fed raised rates significantly. However, there’s no reason for the Fed to do that in a setting where the neutral rate is very low. The problem is that the neutral rate may rise over time. Baby boomers are leaving the labor force en masse. They accumulated a lot of wealth while working. According to the Federal Reserve, they currently own more than half of all US wealth (Chart 6). In fact, Americans over the age of 55 controlled 70% of household wealth as of the third quarter of 2020, up from 54% in 1989. As baby boomers retire, their consumption will no longer be backed by income. The resulting depletion of savings will push up the equilibrium rate of interest. Chart 6Baby Boomers Have Accumulated A Lot Of Wealth
Is The Fed Locked Into A Low Interest-Rate Trap?
Is The Fed Locked Into A Low Interest-Rate Trap?
While US fiscal policy will tighten next year, it will remain highly pro-cyclical by historic standards. BCA’s geopolitical strategists expect Congress to pass a $4 trillion spending bill this fall focusing on infrastructure, health care, and clean energy. They anticipate that only half of the bill will be financed through higher taxes. Big budget deficits will drain private-sector savings. There Will Be Political Pressure To Keep Rates Low Debt is not a major problem for governments when the interest rate they pay is below the growth rate of the economy. As we have discussed before, when trend GDP growth exceeds the borrowing rate, the more debt a government carries, the more fiscal support it can provide without putting the debt-to-GDP ratio on a runaway trajectory. If interest rates were to rise meaningfully, however, what had previously been a virtuous fiscal circle would become a vicious one. Needless to say, governments would resist such an outcome. Faced with the prospect of having to reallocate tax revenue from social programs to bondholders, politicians would put political pressure on central banks to refrain from raising rates. Central banks would probably oblige, at least initially. By keeping interest rates below their equilibrium level, central banks could engineer higher inflation – something they have been striving to do for quite some time. Higher inflation, in turn, could pave the way for an exit from the low interest-rate trap. Rising prices would lift nominal GDP, thereby reducing the debt-to-GDP ratio. As inflation rose, real rates would fall. This would provide relief to overextended private-sector borrowers. Once enough debt had been inflated away, central banks could bring interest rates to their equilibrium level. In the end, bondholders would suffer while borrowers would prosper. This leads us to our key macroeconomic conclusion: Today’s low interest-rate trap will likely be resolved through an extended period of easy money, ultimately culminating in significantly higher inflation. Investment Implications Equities face some near-term risks stemming from the recent rise in bond yields. Nevertheless, as we have argued in past reports, stocks will shrug off their losses provided that bond yields do not rise to a level that chokes off economic growth. With the Fed still on hold, we do not expect that to happen anytime soon. As such, our best bet is that the Goldilocks environment for risk assets – where growth is strong, inflation is contained, and monetary policy is accommodative – will last another two years. Investors operating on a 12-month horizon should continue to favor stocks over bonds. Within the fixed-income category, investors should overweight spread product relative to safer government bonds. Value stocks will lead the equity market higher over the next 12 months. The pandemic benefited growth names, especially in the tech realm. The cessation of lockdown measures will favor value names. Not only is value still exceptionally cheap in relation to growth, but traditional value sectors such as banks and energy companies have seen stronger upward earnings revisions than tech stocks since the start of the year (Chart 7). Chart 7 Earnings Revisions And Valuations Favor Value Stocks (I)
Earnings Revisions And Valuations Favor Value Stocks (I)
Earnings Revisions And Valuations Favor Value Stocks (I)
Chart 7Earnings Revisions And Valuations Favor Value Stocks (II)
Earnings Revisions And Valuations Favor Value Stocks (II)
Earnings Revisions And Valuations Favor Value Stocks (II)
Recent upgrades to economic growth forecasts have favored the US, which could help the dollar in the near term. Nevertheless, we expect the greenback to fall modestly over a 12-month horizon. The US trade deficit has ballooned in recent quarters, while the dollar remains overvalued on a purchasing power parity basis (Chart 8). Despite improving US growth prospects, real yield differentials have not moved significantly in favor of the dollar (Chart 9). Chart 8The Dollar Is Expensive Based On Its PPP Fair Value And Growing Trade Deficit (I)
The Dollar Is Expensive Based On Its PPP Fair Value And Growing Trade Deficit (I)
The Dollar Is Expensive Based On Its PPP Fair Value And Growing Trade Deficit (I)
Chart 8The Dollar Is Expensive Based On Its PPP Fair Value And Growing Trade Deficit (II)
The Dollar Is Expensive Based On Its PPP Fair Value And Growing Trade Deficit (II)
The Dollar Is Expensive Based On Its PPP Fair Value And Growing Trade Deficit (II)
Chart 9Real Yield Differentials Have Not Moved Significantly In Favor Of The Dollar (I)
Real Yield Differentials Have Not Moved Significantly In Favor Of The Dollar (I)
Real Yield Differentials Have Not Moved Significantly In Favor Of The Dollar (I)
Chart 9Real Yield Differentials Have Not Moved Significantly In Favor Of The Dollar (II)
Real Yield Differentials Have Not Moved Significantly In Favor Of The Dollar (II)
Real Yield Differentials Have Not Moved Significantly In Favor Of The Dollar (II)
Moreover, the growth outlook outside the US should improve later this year as more countries ramp up their vaccination campaigns. US growth should also come down from its highs due to the expiration of various stimulus measures. Meanwhile, China will continue to stimulate its economy, albeit at a slower pace. Jing Sima, BCA’s chief China strategist, expects the rate of credit expansion to fall by only 2-to-3 percentage points in 2021. The general government deficit should remain broadly stable at 8% of GDP this year, ensuring adequate fiscal support for growth. A strong Chinese economy will bolster the RMB and other EM currencies. Looking further ahead, the cyclical bull market in stocks will end when inflation rises so high that central banks are forced to tighten monetary policy. While this is not a near-term risk, it is a major danger for the middle of the decade and beyond. As we discussed last week, inflation is often slow to rise in response to an overheated economy, but when it does rise, it can do so precipitously. Investors looking to hedge long-term inflation risk should reduce duration exposure in fixed-income portfolios while favoring inflation-protected securities over nominal bonds. In addition to gold, they should own some property. The best inflation hedge is simply to buy a nice house financed with a high loan-to-value fixed-rate mortgage. In a few decades you will still own the nice house, but the value of the mortgage will be greatly reduced in real terms. Peter Berezin Chief Global Strategist pberezin@bcaresearch.com Footnotes 1 For example, suppose the earnings yield is 4% – as it approximately is now for global equities – and the real bond yield is zero, implying an equity risk premium (ERP) of 4%. A one percentage-point increase in real bond yields would require that stock prices fall by 20% in order to keep the ERP unchanged (e.g., the earnings yield would have to rise from 4/100=4% to 4/80=5%). In contrast, if the earnings yield were initially 7% and the real bond yield were 3%, stock prices would need to fall by only 12.5%, taking the earnings yield from 7/100=7% to 7/87.5=8%. Global Investment Strategy View Matrix
Is The Fed Locked Into A Low Interest-Rate Trap?
Is The Fed Locked Into A Low Interest-Rate Trap?
Special Trade Recommendations
Is The Fed Locked Into A Low Interest-Rate Trap?
Is The Fed Locked Into A Low Interest-Rate Trap?
Current MacroQuant Model Scores
Is The Fed Locked Into A Low Interest-Rate Trap?
Is The Fed Locked Into A Low Interest-Rate Trap?
Dear client, Next week, in lieu of our weekly report, I will be hosting a webcast on Thursday, March 25 at 10:00 am EDT and Friday March 26 at 9:00 am HKT. I look forward to your comments and questions during the webcast. Best regards, Chester Highlights During bear markets, counter-trend rallies in the dollar are capped around 4%. This time should be no different. Meanwhile, unless the Fed tightens policy to stem the increase in aggregate demand, inflation will rise and real short rates will drop. The relative equity performance of the US is critical for the dollar. Reserve diversification out of dollars has also started to place a natural ceiling against other developed market currencies. An attractive opportunity is emerging to short the AUD/CAD cross. Feature The 1.7% rise in the US dollar this year is reinvigorating the bull case. When presenting our key views last year, we highlighted that the DXY index was at risk of a 2-4% bounce.1 We reaffirmed this view in our January report: Sizing A Potential Dollar Bounce. At the time, the DXY index was at the 90 level, suggesting the rally should fizzle around 94. Therefore, the key question is whether the nascent rise in the DXY will punch through this level, or fade as we originally expected. The short-term case for the dollar remains bullish. The currency is much oversold. Meanwhile, real interest rates are moving in favor of the US, vis-à-vis a few countries. Third and interrelated, economic momentum in the US is quite strong, compared to other G10 countries. With the rising specter of a market correction, the dollar could also benefit from safe haven flows towards the US. The Federal Reserve’s meeting yesterday certainly reaffirmed that short-term rates will remain anchored near zero, at least until 2023. The Fed does not see inflation much above 2% a couple of years out. Nevertheless, a lot can change in the coming months. Cycles, Positioning And Interest Rates The dollar tends to move in long cycles, with the latest bull and bear markets lasting about a decade or so. In other words, the dollar is a momentum currency. As such, determining which regime you are in is critical to assessing the magnitude of any rally. This is certainly the case when sentiment remains overly dollar bearish, as now. During bear markets, counter-trend rallies in the dollar are capped around 4-6%. This was what happened in the early 2000s. In bull markets, such as after the financial crisis, the dollar achieves escape velocity, with more durable rallies well into the teens (Chart I-1). So far, the current rise still fits within the narrative of a healthy reset in a longer-term bear market. Chart I-1The Dollar Rally Is Still Benign
The Dollar Rally Is Still Benign
The Dollar Rally Is Still Benign
Long interest rates have also been moving in favor of the dollar, especially relative to the euro area, Japan, and even Sweden. Currencies are driven by real interest rate differentials, and higher US yields are bullish. With the Fed giving no indication it will prevent the curve from steepening further, US interest rates could keep gaping higher. However, currencies are about relative rate differentials, and the rise in US interest rates has not been in isolation. Rates in the UK, Australia and New Zealand, countries that have managed the COVID-19 crisis pretty well, are beginning to rise faster than in the US (Chart I-2). Chart I-2A Synchronized Rise In Global Yields
A Synchronized Rise In Global Yields
A Synchronized Rise In Global Yields
US Versus World Growth The rise in US interest rates has been justified by better economic performance. Whether looking at purchasing managers’ indices, economic surprise indices, or even GDP growth expectations, the US has had the upper hand (Chart I-3). The Fed expects US growth to hit 6.5% this year. This is well above what other central banks expect for their domestic economies. The ECB expects 4%, the BoJ expects 3.9%, and the BoC expects 4.6% (Table I-1). Chart I-3AThe US Leads In Growth This Year
The US Leads In Growth This Year
The US Leads In Growth This Year
Chart I-3BThe US Leads In Growth This Year
The US Leads In Growth This Year
The US Leads In Growth This Year
Table I-1The US Leads In Growth And Inflation This Year
Arbitrating Between Dollar Bulls And Bears
Arbitrating Between Dollar Bulls And Bears
However, economic dominance can be transient, especially in a world of flexible exchange rates. For one, a higher dollar will sap US growth via the export channel. This is especially the case since the starting point is an expensive currency. On a real effective exchange rate basis, the dollar is above its long-term mean (Chart I-4). Meanwhile, we expect the rest of the world to perform better as economies reopen. The services PMI in the US is already close to a cyclical high, similar to Sweden (Chart I-5). These are among the countries with the least stringent COVID-19 measures in the western hemisphere. This suggests that other economies, even manufacturing-centric ones, could see a coiled-spring rebound in growth as we put this pandemic behind us. Chart I-4The Dollar Is Expensive
The Dollar Is Expensive
The Dollar Is Expensive
Chart I-5The US Service PMI Is At A Cyclical High
The US Service PMI Is At A Cyclical High
The US Service PMI Is At A Cyclical High
The sweet spot for most economies is when growth is rising but inflation is low, allowing the resident central bank to keep policy dovish. However, it is an open question if the US can continue to boost spending, without a commensurate rise in inflation. The OECD estimates that the US output gap will close by 2022, with the $1.9-trillion fiscal package. This will put the US well ahead of any G10 country (Chart I-6). Unless the Fed tightens policy to stem the increase in aggregate demand, inflation will rise and real rates will drop (Chart I-7). Rising nominal rates and falling real yields will be anathema to the dollar. Chart I-6The US Output Gap Will Soon Close
The US Output Gap Will Soon Close
The US Output Gap Will Soon Close
Chart I-7Wages And Inflation Should Inch Higher
Wages And Inflation Should Inch Higher
Wages And Inflation Should Inch Higher
Equity Rotation And The Dollar A currency manager once noted that the most important variable to pay attention to when making FX allocations is relative equity performance. This might seem bizarre at first blush, but stands at the center of what an exchange rate is – a mechanism that equalizes rates of return across countries. As such while bond flows are important for exchange rates, equity flows matter as well. The relative equity performance of the US is critical for two reasons. First, the US equity market tends to do relatively better during bear markets. This was the case last year and during the 2008 crisis. Second, the outperformance of the US over the last decade has dovetailed with a dollar bull market (Chart I-8). It is rare to find a currency that has performed well both during equity bull and bear markets. If past is prologue, the near-term risks for the dollar are to the upside, especially if the market rally encounters turbulence as yields rise. The put/call ratio in the US is at a 5-year nadir. A move towards parity could violently pull up the DXY index (Chart I-9). However, a garden-variety 5-10% correction in the SPX should correspond to a shallow bounce in the DXY. This will also fit the pattern of bear market USD rallies, as we already highlighted in Chart I-1. Chart I-8US Equity Relative Performance And The Dollar
US Equity Relative Performance And The Dollar
US Equity Relative Performance And The Dollar
Chart I-9The Dollar Could Rise In ##br##A Market Reset
The Dollar Could Rise In A Market Reset
The Dollar Could Rise In A Market Reset
At the same time, any correction could usher in a violent rotation from cyclicals to defensives, especially if underpinned by higher interest rates. The performance of energy and financials are a leap ahead of other sectors in the S&P 500 this year. Importantly, they also massively outperformed during the February drawdown. Meanwhile, valuations are heavily elevated in the US compared to the rest of the world. This is true for growth sectors compared to value, and cyclicals compared to defensives. Throughout history, both exchange rates and valuations have tended to mean revert. Long-Term Dollar Outlook The 2020 pandemic was a one-in-a-hundred-year event. Coordinated fiscal and monetary stimuli have ushered in a new economic cycle. As a counter-cyclical currency, the dollar tends to do poorly (Chart I-10). This is because monetary stimulus provides more torque to economies levered to the global cycle. Once growth achieves escape velocity, the currencies of these more pro-cyclical economies benefit. The IMF projects that non-US growth should outpace US growth after 2021. Meanwhile, it is an open question that any rally in the dollar will be durable. The key driver behind the dollar increase in 2020 was a global shortage. Not only has the Fed extended its liquidity provisions to foreign central banks until September this year, the share of offshore US dollar debt issuance has fallen by a full 9 percentage points (Chart I-11). Simply put, the Fed is flooding the system with dollar liquidity at the same time that foreign entities are weaning themselves off it Chart I-10The IMF Expects Faster Growth Outside The US After 2021
The IMF Expects Faster Growth Outside The US After 2021
The IMF Expects Faster Growth Outside The US After 2021
Chart I-11Share Of US Dollar Debt ##br##Rolling Over
Arbitrating Between Dollar Bulls And Bears
Arbitrating Between Dollar Bulls And Bears
The reason behind this is balance-of-payment dynamics. The market has realized that ballooning twin deficits in the US come at a cost. For foreign issuers, it is the prospect of rolling over US-denominated debt at a much higher coupon rate. For bond investors, it is currency depreciation, especially if fiscal largesse becomes too “sticky,” and stokes inflation. As such, bond investors continue to avoid the US, despite rising rates (Chart I-12). Finally, reserve diversification out of dollars has started to place a natural ceiling on the US dollar, especially against other developed market currencies. Ever since the trend began to accelerate in 2015, the DXY has been unable to sustainably punch through the 100 level (Chart I-13). This will place a durable floor under developed market currencies in general and gold in particular. The Chinese RMB has also been gaining traction in global FX reserves. Chart I-12Little Appetite For US ##br##Treasurys
Little Appetite For US Treasurys
Little Appetite For US Treasurys
Chart I-13Reserve Diversification Has Been A Headwind For The Dollar
Reserve Diversification Has Been A Headwind For The Dollar
Reserve Diversification Has Been A Headwind For The Dollar
More specifically, the role of the USD/CNY exchange rate as a key anchor for emerging market currencies will rise, especially if the RMB remains structurally strong.2 The People’s Bank of China has massive foreign exchange reserves, worth about US$3.2 trillion. This means it can provide swap agreements that will almost cover the totality of EM foreign dollar debt. Swap agreements entail no exchange of currency, but are about confidence. The PBoC can instill this confidence in countries that have low and/or falling foreign exchange reserves. The dollar will remain the global reserve currency for years to come. However, a slow pivot towards reserve diversification will act as a structural headwind for the dollar. Housekeeping Chart I-14AUD/CAD Is Correlated To The VIX
Arbitrating Between Dollar Bulls And Bears
Arbitrating Between Dollar Bulls And Bears
We were stopped out of our CAD/NOK trade for a profit of 3.1%. The resilience of the US economy is benefiting the CAD more than the NOK for now. However, the Norges Bank confirmed it might be one of the first central banks to lift rates, as early as this year. We are both short USD/NOK and EUR/NOK and recommend sticking with these positions. Second, the growing spat between the EU and the UK could lead to more volatility in our short EUR/GBP position. Our target remains 0.8, but we are tightening stops to 0.865 to protect profits. The BoE left interest rates unchanged, but struck a constructive tone. This will bode well for cable, beyond near-term volatility. Third, our short USD/JPY position was stopped out amid the dollar rally. We are standing aside for now, but will reopen this trade later. Finally, a rise in volatility will boost the dollar, but also benefit short AUD/CAD positions. We are already short the AUD/MXN, but short AUD/CAD could be more profitable should market turmoil persist (Chart I-14). Chester Ntonifor Foreign Exchange Strategist chestern@bcaresearch.com Footnotes 1 Please see the Foreign Exchange Strategy Special Report, titled “2021 Key Views: Tradeable Themes,” dated December 4, 2020. 2 Please see Foreign Exchange Strategy Currency In-Depth Report, titled “Will The RMB Continue To Appreciate?,” dated February 26, 2021. Currencies U.S. Dollar Chart II-1USD Technicals 1
USD Technicals 1
USD Technicals 1
Chart II-2USD Technicals 2
USD Technicals 2
USD Technicals 2
Most data out of the US has been robust: Both PPI, import and export prices were in line with expectations for February. The PPI ex food and energy came in at 2.5% year-on-year. Empire manufacturing was robust at 17.4 in March, versus 12.1 last month. Housing starts and building permits came in a nudge below expectations in February, at 1421K and 1682K. The one disappointment was retail sales, which fell 3.3% year-on-year in February. The DXY index rose slightly this week. The FOMC remained dovish, without any revision to its median path of interest rate hikes. The markets disliked its reticence on rising long-bond yields. As such, equities are rolling over as yields continue to creep higher. Report Links: The Dollar Bull Case Will Soon Fade - March 5, 2021 Are Rising Bond Yields Bullish For The Dollar? - February 19, 2021 Portfolio And Model Review - February 5, 2021 The Euro Chart II-3EUR Technicals 1
EUR Technicals 1
EUR Technicals 1
Chart II-4EUR Technicals 2
EUR Technicals 2
EUR Technicals 2
Recent data from the euro area are mending: The ZEW expectations survey rose to 74 in March, from 69.6. For Germany, the improvement was better at 76.6 from 71.2. The trade balance remained at a healthy €24.2bn euro surplus in January. The euro fell by 0.6% amidst broad dollar strength. With the ECB committed to cap the rise in yields and rise in peripheral spreads, relative interest rates will move against the euro. Sentiment remains elevated, and so a healthy reset is necessary to wash out stale longs. Report Links: Portfolio And Model Review - February 5, 2021 On Japanese Inflation And The Yen - January 29, 2021 The Dollar Conundrum And Protection - November 6, 2020 The Japanese Yen Chart II-5JPY Technicals 1
JPY Technicals 1
JPY Technicals 1
Chart II-6JPY Technicals 2
JPY Technicals 2
JPY Technicals 2
Recent data from Japan has been mixed: Core machinery orders grew 1.5% year-on-year in January. Exports fell by 4.5% in January, while imports rose by 11.8%. This has shifted the adjusted trade balance to a deficit of ¥38.7bn yen. The Japanese yen fell by 0.4% against the US dollar this week, and remains the weakest G10 currency this year. Rising yields have seen Japanese investors stampede into overseas markets such as the UK, while pushing down the yen. We remain yen bulls, but will stand aside for now since it could still go lower in the short term. Report Links: The Dollar Bull Case Will Soon Fade - March 5, 2021 On Japanese Inflation And The Yen - January 29, 2021 The Dollar Conundrum And Protection - November 6, 2020 British Pound Chart II-7GBP Technicals 1
GBP Technicals 1
GBP Technicals 1
Chart II-8GBP Technicals 2
GBP Technicals 2
GBP Technicals 2
Recent data out of the UK have been weak: Industrial production and construction output fell by 4.9% and 3% year-on-year in January. Monthly GDP growth fell by 2.9% in January. Rightmove house prices rose 2.7% year-on-year in March. The pound fell by 0.4% against the dollar this week. It however remains the best performing currency this year. The BoE kept monetary policy on hold, but struck a hawkish tone as vaccination progresses, giving way to higher mobility in the summer. We remain long sterling via the euro. Report Links: Portfolio And Model Review - February 5, 2021 The Dollar Conundrum And Protection - November 6, 2020 Revisiting Our High-Conviction Trades - September 11, 2020 Australian Dollar Chart II-9AUD Technicals 1
AUD Technicals 1
AUD Technicals 1
Chart II-10AUD Technicals 2
AUD Technicals 2
AUD Technicals 2
Recent data in Australia was robust: Home prices rose by 3.6% in the fourth quarter. Modest home appreciation is welcome news by the RBA, given high-flying prices in its antipodean neighbor. The employment report was solid. There were 88.7K new jobs in February, all full-time. This pushed down the unemployment rate to 5.8% from 6.4%. The Aussie fell by 0.4% this week. The Australian recovery is fast approaching escape velocity, forcing the RBA to contain a more pronounced rise in long-bond yields. We remain long AUD/NZD. In the very near term, a market shakeout could pull the Aussie lower, favoring short AUD/CAD positions. Report Links: The Dollar Bull Case Will Soon Fade - March 5, 2021 Portfolio And Model Review - February 5, 2021 Australia: Regime Change For Bond Yields & The Currency? - January 20, 2021 New Zealand Dollar Chart II-11NZD Technicals 1
NZD Technicals 1
NZD Technicals 1
Chart II-12NZD Technicals 2
NZD Technicals 2
NZD Technicals 2
Recent data out of New Zealand was weak: Credit card spending fell by 10.6% year-on-year in January. Q4 GDP contracted by 1% both year-on-year and quarter-on-quarter. The current account remains in deficit at NZ$-2.7bn for Q4. The New Zealand dollar fell by 0.9% against the US dollar this week. The new rule to include house prices in setting monetary policy will be a logistical nightmare for the RBNZ. In trying to achieve financial stability, the RBNZ will have to forego some economic stability, especially if the country still requires accommodative settings. Confused messaging could also introduce currency volatility. Report Links: Portfolio And Model Review - February 5, 2021 Currencies And The Value-Versus-Growth Debate - July 10, 2020 Updating Our Balance Of Payments Monitor - November 29, 2019 Canadian Dollar Chart II-13CAD Technicals 1
CAD Technicals 1
CAD Technicals 1
Chart II-14CAD Technicals 2
CAD Technicals 2
CAD Technicals 2
There was a data dump in Canada this week: The economy added 259.2K jobs in February. This pushed down the unemployment rate from 9.4% to 8.2%. Wages also increased by 4.3% in February. The Nanos confidence index rose from 60.5 to 62.7 in the week of March 12. Housing starts rose by 246K in February, as expected. The BoC’s preferred measures of CPI came in close to the 2% target. Headline CPI was weaker at 1.1% in February. The Canadian dollar rose by 0.3% against the US dollar this week. The correction in oil prices could set the tone for the near-term performance of the loonie, despite robust domestic conditions. However, at the crosses, CAD should have upside. We took profits on our short CAD/NOK position this week. Report Links: Will The Canadian Recovery Lead Or Lag The Global Cycle? - February 12, 2021 Currencies And The Value-Versus-Growth Debate - July 10, 2020 More On Competitive Devaluations, The CAD And The SEK - May 1, 2020 Swiss Franc Chart II-15CHF Technicals 1
CHF Technicals 1
CHF Technicals 1
Chart II-16CHF Technicals 2
CHF Technicals 2
CHF Technicals 2
There was scant data out of Switzerland this week: Producer and import prices fell by 1.1% year-on-year in February. February CPI releases also suggest the economy remains in deflation. The Swiss franc fell by 0.4% against the US dollar this week. Safe-haven currencies continue to be sold as yields rise, making the Swiss franc the worst performing currency this year after the yen. This is welcome news for the SNB. We have been long EUR/CHF on this expectation, and recommend investors to stick with this trade. Report Links: Portfolio And Model Review - February 5, 2021 The Dollar Conundrum And Protection - November 6, 2020 On The DXY Breakout, Euro, And Swiss Franc - February 21, 2020 Norwegian Krone Chart II-17NOK Technicals 1
NOK Technicals 1
NOK Technicals 1
Chart II-18NOK Technicals 2
NOK Technicals 2
NOK Technicals 2
There was scant data out of Norway this week: The trade balance remained in surplus of NOK 25.1bn in February. The Norges bank kept interest rates on hold at 0%. The NOK fell by 1.2% against the dollar this week. The trigger was the selloff in oil prices. However, with the Norges bank signaling a rate hike later this year, placing it ahead of its G10 peers, there is little scope for the NOK to fall durably. Inflation in Norway is above target, and higher mobility later this year will benefit oil-rich Norway. We are long the Norwegian krone as a high-conviction bet against both the dollar and the euro. Report Links: Portfolio And Model Review - February 5, 2021 Revisiting Our High-Conviction Trades - September 11, 2020 A New Paradigm For Petrocurrencies - April 10, 2020 Swedish Krona Chart II-19SEK Technicals 1
SEK Technicals 1
SEK Technicals 1
Chart II-20SEK Technicals 2
SEK Technicals 2
SEK Technicals 2
Swedish data releases were a slight miss: Headline CPI came in at 1.4% in February. Core CPI came in at 1.2%. The unemployment rate remained at 8.9% in February. The Swedish krona fell by 0.8% against US dollar this week. Sweden is struggling to contain another wave of the pandemic and this has weighed on the currency this year. The saving grace for the economy has been a global manufacturing cycle that continues humming. Until Sweden is able to get past the pandemic, the currency will continue trading in a stop-and-go pattern. We remain long the SEK on cheap valuations and as a play on the global industrial cycle. Report Links: Revisiting Our High-Conviction Trades - September 11, 2020 Updating Our Balance Of Payments Monitor - November 29, 2019 Where To Next For The US Dollar? - June 7, 2019 Trades & Forecasts Forecast Summary Core Portfolio Tactical Trades Limit Orders Closed Trades
Highlights We are lowering our expectation for oil-demand growth this year, bringing it more in line with levels expected by OPEC, the IEA and EIA. Our GDP-driven demand estimates have proven too bullish for 1Q21, considering the wide margin by which we missed actual demand in January and February. Our expectation for oil demand growth this year is lowered to 5.5mm b/d, down from 6.6mm b/d last month. For 2022, we are increasing our growth assumption to 4.1mm b/d, up from 2.8mm b/d. We continue to expect Brent prices to reflect an accommodation between Russia's and KSA's preferred Brent ranges of $50-$55/bbl and $70-$75/bbl, respectively. We are keeping our forecast for average prices at $65/bbl and $70/bbl for this year and next, with WTI averaging $2-$3/bbl below that (Chart of the Week). Brent benchmark pricing confusion subsided, following the decision of S&P Global Platts to revert to free-on-board (FOB) reporting of prices. However, as the center of gravity for crude oil demand settles on Asia, confusion around the North Sea benchmark could provide an opening for regional benchmarks and consolidation of futures platforms trading crudes delivered to the region. Feature The decision by the Kingdom of Saudi Arabia (KSA) to voluntarily remove 1mm b/d of its production from the market over February – April will be remembered as one of the more prescient reads on the state of global oil demand during the COVID-19 pandemic. KSA's insistence on seeing improvement in actual demand – as opposed to forecasted demand – before it commits to returning production to the market could not have been more clear-sighted. The upcoming April 1 meeting of OPEC 2.0 will convey useful information to the market re changes, if any, to the production-management strategy of the coalition, which is led by KSA and Russia. Perhaps the most important information coming out of the meeting will be how KSA reads the current state of global oil demand, as it has not committed to a date-certain when it will return this production to market. We expect the Kingdom to extend its production cuts and to lobby for continued restraint by the other member states of OPEC 2.0 at the meeting. Going into the meeting, OPEC 2.0 will be assessing global demand against a deteriorating public-health backdrop in important consuming markets. The EU's policy failures in securing sufficient vaccinations to protect its population, and public-health missteps regarding the AstraZeneca vaccine continue to retard Europe's efforts to contain the pandemic.1 Chart of the WeekOPEC 2.0 Expected To Maintain Production Discipline
OPEC 2.0 Expected To Maintain Production Discipline
OPEC 2.0 Expected To Maintain Production Discipline
Increasing lockdowns in several EU countries and a higher likelihood of a resurgence in COVID-19 infection rates in the US – particularly in the states that are reopening before they have achieved herd immunity or have vaccinated a large share their populations – will slow demand recovery. The annual Spring Break holidays in the US potentially could become a world-class super-spreader event. Elsewhere, LatAm is distressed, particularly Brazil, which, like the EU, has misjudged and mishandled its vaccination policy and rollout, leaving its populations at higher risk for infection. This also has the attendant risk of producing an environment ripe for further COVID-19 mutations and the spread of new variants. Lower Oil Demand Forecast For 2021 We were wrong on our call expecting stronger demand growth in 1Q21 – our consumption forecasts exceeded realized demand an average of 2.3mm b/d in 1Q21. We are now more aligned with demand expectations of IEA, EIA, and OPEC (Chart 2). Our expectation for oil demand growth this year is lowered to 5.5mm b/d, down from 6.6mm b/d last month. For 2022, we are increasing our growth assumption to 4.1mm b/d, up from 2.8mm b/d. We expect non-OECD oil consumption, our proxy for EM demand, to average 53.2mm b/d this year and 55.5mm b/d next year, vs. 54mm b/d and 55.4mm b/d last month. DM demand, proxied by OECD oil consumption, is expected to average 44.5mm b/d and 46.3mm b/d next year, versus our previous forecast of 44.9mm and 46.3mm b/d last month. Chart 2Lower Oil Demand In 2021, Higher Next Year
Lower Oil Demand In 2021, Higher Next Year
Lower Oil Demand In 2021, Higher Next Year
We continue to expect the massive fiscal and monetary stimulus to support markets and lead to stronger growth going forward. The recently approved package by the US Congress calling for an additional $1.9 trillion of fiscal stimulus will have global knock-on effects, which will be bullish for commodity demand, once the COVID-19 pandemic is contained (Chart 3). Chart 3Pandemic Recovery Will Spur Pent-Up Demand
OPEC 2.0 Production Discipline Still Required To Balance Markets
OPEC 2.0 Production Discipline Still Required To Balance Markets
OPEC 2.0 Production Discipline Persists The salient feature of the oil market during the pandemic has been the cohesion of OPEC 2.0 and its production discipline. We expect that to continue going into and coming out of the coalition's April 1 meeting. Our view that OPEC 2.0 's overall strategy as the dominant producer in the market is to calibrate the level of supply to the level of demand remains intact. We expect production for the coalition to average 46.0mm b/d in 2021 and 46.2mm b/d in 2022 (Chart 4). We do not expect OPEC 2.0 to raise production, given the increasing uncertainty around demand vis-à-vis getting the COVID-19 pandemic under control in large consuming markets like the EU and LatAm, and higher infection rates out of the US. However, as we noted above, we are closely watching what KSA does and says at the upcoming meeting for any clue that global demand is improving faster than we now expect. Chart 4OPEC 2.0 Production Discipline Persists
OPEC 2.0 Production Discipline Persists
OPEC 2.0 Production Discipline Persists
Outside OPEC 2.0, our expectation for the bellwether US shale-oil producers' output remains relatively unchanged. We continue to expect production to move higher, and to remain constrained by capital availability. US shale output is expected to average 10.7mm b/d this year, and 12.1mm b/d next year. In our modeling, the shale producers lead the price-taking cohort, which produces whatever the market allows it to produce. We continue to expect capital-market discipline to keep US oil producers from getting too far out ahead of their balance sheets' ability to profitably grow production. The same holds for producers outside the OPEC 2.0 coalition ex-US (Table 1). Table 1BCA Global Oil Supply - Demand Balances (MMb/d, Base Case Balances)
OPEC 2.0 Production Discipline Still Required To Balance Markets
OPEC 2.0 Production Discipline Still Required To Balance Markets
Markets Balance On OPEC 2.0 Discipline OPEC 2.0's production strategy will keep markets balanced, as relatively high compliance among those producers capable of increasing production is observed and markets are not over-supplied (Chart 5). This will allow inventories to continue to draw then stabilize around mid-year. It is important to point out that this balancing is an iterative process, driven by OPEC 2.0's read on the state of demand, which, perforce, is occurring with lags in the data it is responding to. We continue to keep a weather eye on the USD, given the impact it has on commodity fundamentals. We continue to expect dollar weakening and model for that, but the path of the USD has been difficult to call, given it is highly correlated with global economic policy uncertainty, which is heavily influenced by the evolution of the COVID-19 pandemic (Chart 6). Chart 5Markets Remain Balanced...
Markets Remain Balanced...
Markets Remain Balanced...
Chart 6The USD's Evolution Remains Important
The USD's Evolution Remains Important
The USD's Evolution Remains Important
A Hue and Cry In Brent Additional uncertainty is entering oil markets from an unlikely corner: The Brent benchmark pricing index used to set prices on some two-thirds of all the oil traded in the world. Brent benchmark pricing was thrown into wide-eyed confusion when S&P Global Platts – the leading price reporting agency for the index used as a reference in Brent physical contracts (Dated Brent) – decided to convert the index from a free-on-board (FOB) index to a cost-insurance-freight (CIF) index. Platts' proposed Brent reporting changes two weeks ago essentially would have transformed the pricing index from a pure spot index that assumes the buyer will arrange insurance and freight after purchasing a cargo at a North Sea terminal into a delivered index reflecting CIF-Rotterdam terms provided by the seller. After a great hue and cry went up, Platts reverted to quoting Brent on an FOB basis. But that hardly ends the drama. Brent production is collapsing – by next year, only one 600k-barrel cargo a day of Brent will be loaded out of North Sea terminals. This is a very thin reed supporting the global oil market's primary price index. In an effort to expand the Brent pricing pool, Platts also is looking to include US WTI in one form or another, but nothing's been settled upon to date. The confusion around Brent pricing comes as the center of gravity for crude oil demand and trading continues its inexorable shift to Asia. This could provide an opening for regional benchmarks – e.g., the UAE's Murban crude oil, which supports a just-launched futures contract calling for delivery in Asia, where most of the demand for oil is met by Middle East suppliers. It could even allow for consolidation of other futures platforms in the region (e.g., the Dubai Mercantile Exchange), which also are used to price and hedge Asia-bound crude cargoes out of the Gulf. As interesting and complex as the global oil market is, it is nothing without a viable pricing benchmark. Much of the world's oil business hinges on that index being determined by the price of a single cargo loaded every day. We will be following this with great interest. Robert P. Ryan Chief Commodity & Energy Strategist rryan@bcaresearch.com Commodities Round-Up Energy: Bullish An exceptionally cold winter resulted in a sharp drawdown US natgas inventories down, which are expected to end the 2020-21 winter season at 2021 at 1.6 Tcf by the US EIA's reckoning (Chart 7). This would be 13% lower than the 5-year average level of inventories, according to the EIA. Over the April-October injection season, EIA is expecting natgas inventories to finish at ~ 3.7 Tcf, or ~ 2% below their 5-year average. Spot natgas prices at Henry Hub, LA – the delivery point for NYMEX/CME futures – averaged $5.35/MMBtu in February, the highest level since February 2014, the EIA noted. Natural gas for April 2021 delivery at Henry Hub closed at $2.562/MMBtu on Tuesday. Base Metals: Bullish COMEX copper came close to its 2011 highs late last month, at $4.30/lb but has since retreated. However, we believe fundamental supply-demand factors will keep copper prices moving higher over the longer term. As highlighted in an earlier report (BCA Research - Renewables, China's FYP Underpin Metals Demand), the move to EVs and renewable energy will keep demand for copper and the overall base metals complex well-bid during this decade. The International Renewable Energy Agency (World Energy Transitions Outlook: 1.5°C Pathway (Preview) (irena.org)) reported on Tuesday that copper-intensive renewable power capacity will have to increase by more than 10-fold by 2050 to avert severe climate change. On the supply side, in our recent report entitled BCA Research - Copper's Supply Challenges, we noted falling copper investment and declining copper ore quality inexorably will increase production costs. Only higher copper prices will incentivize producers to increase mining activity. Rising demand and stagnant supply will put copper supply-demand balances in a deficit over the short-to-medium term, causing inventories to decline over this period as well. Precious Metals: Bullish The sharp run-up in 10-year US real rates since the end of 2020 pulled gold prices from down from their 2021 high of ~ $1,950/oz in January to ~ $1,680/oz earlier this month (Chart 8). Price have since rebounded above $1,740/oz as real rates weakened. We expect markets to re-price gold when it becomes apparent the rally in rates was more a function of higher growth expectations for the US economy than a higher likelihood of Fed tightening. Our view that the Fed's ultra-accommodative monetary policy and massively expansive US fiscal policy will spur growth and inflation has not changed. We expect the Fed to remain behind the inflation curve in its rate hikes, which will keep US real rates on their downward trajectory. Chart 7
OPEC 2.0 Production Discipline Still Required To Balance Markets
OPEC 2.0 Production Discipline Still Required To Balance Markets
Chart 8
Gold Prices Down From Their 2021 High
Gold Prices Down From Their 2021 High
Footnotes 1 Please see Extent of damage to AstraZeneca vaccine’s perceived safety in Europe revealed published by yougov.co.uk 7 March 2021. See also States lift Covid restrictions, drop mask mandates and reopen businesses despite warnings from Biden officials published by cnbc.com 11 March 2021, and European travel restrictions: Non-essential travel curbed published by dw.com 15 March 2021. Investment Views and Themes Recommendations Strategic Recommendations Tactical Trades Commodity Prices and Plays Reference Table Summary of Closed Trades
Higher Inflation On The Way
Higher Inflation On The Way
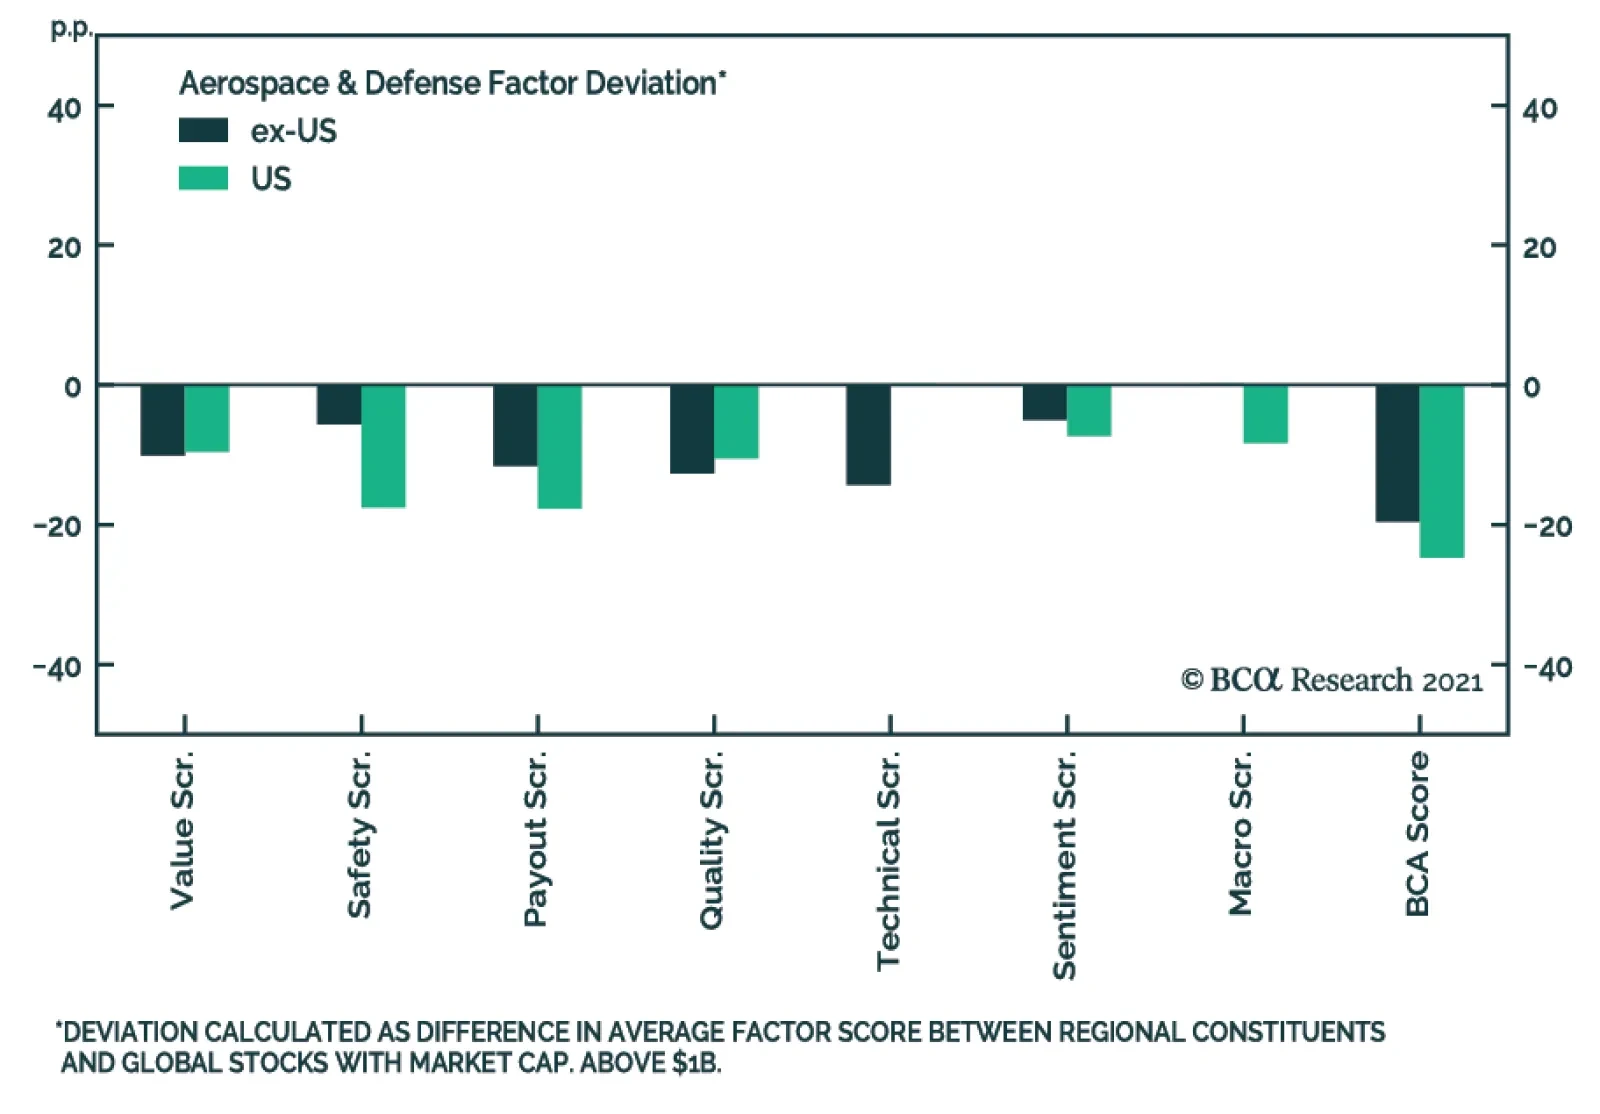
BCA Research’s geopolitical strategists have a structurally bullish view on global tensions. Of note are risks in the South and East China Seas, the Persian Gulf and Indian Ocean basin, the Mediterranean, and even the Baltic Sea and Arctic. These risks…
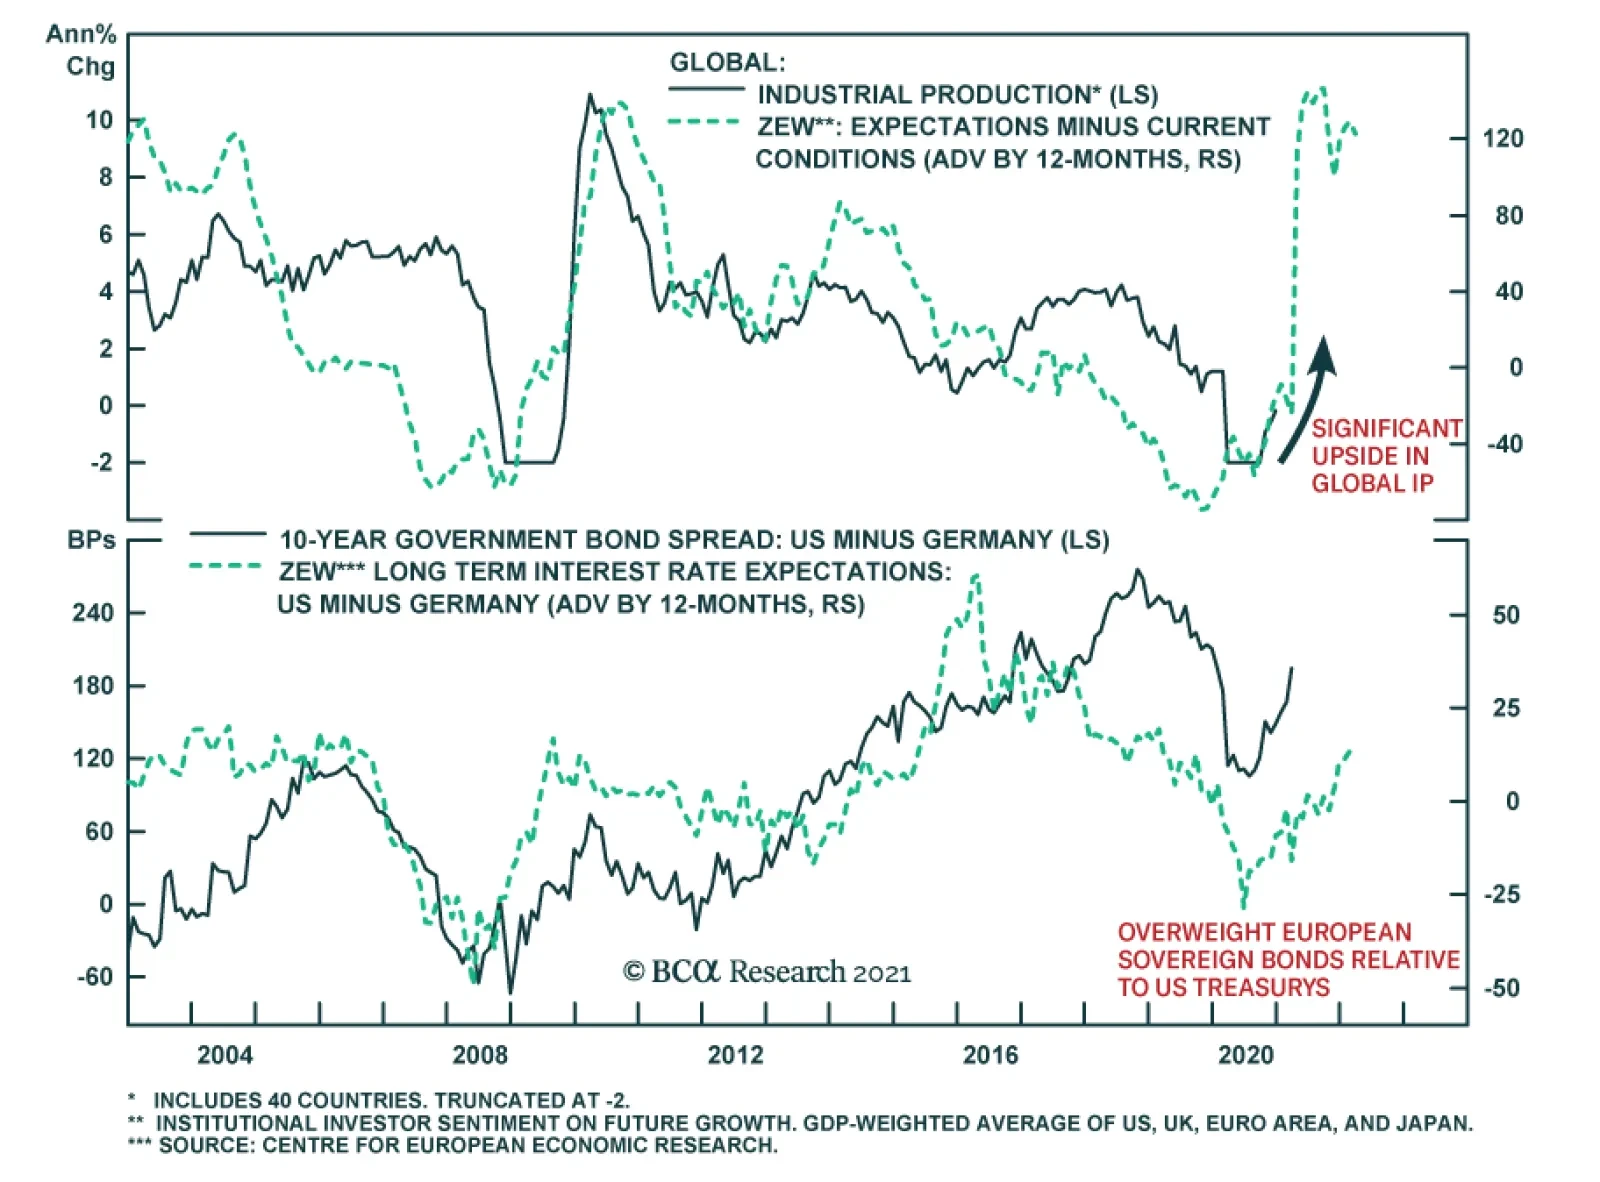
Germany’s ZEW Indicator of Economic Sentiment highlights the growing optimism regarding future economic conditions even as the current situation remains underwater. The economic expectations index for Germany rose to 76.6 in March, slightly above consensus…