Global

Highlights The drubbing that cryptocurrencies have received over the past two weeks is just a taste of things to come. Crypto markets will continue to face tighter regulation, as this week’s announcements from China and the US Treasury underscore. The hope that cryptocurrencies can ever truly “go green” is wishful thinking. Given their decentralized nature, cryptocurrencies require real resources to be expended to permit secure transactions to take place. In addition to their technical limitations, cryptocurrencies face a fundamental constraint, which we dub the “Crypto Impossibility Theorem.” The Crypto Impossibility Theorem states that cryptocurrencies will be viable only if they offer a higher return than equities. The assumption that cryptos can generate a return in excess of equities is almost certain to be false since it would require that cryptocurrency holdings rise more quickly than income in perpetuity. In the near term, the pain in crypto markets could drag down other speculative assets such as tech stocks. In the long term, diminished investor interest in cryptos will benefit the stock market, as investor attention focuses back on equities. Cryptos: Can’t Have It All Investors who track the cryptocurrency market might be aware of the “blockchain trilemma.” It posits that cryptocurrencies can possess only two of the following three attributes: decentralization, security, and scalability. Bitcoin is both highly decentralized and reasonably secure. However, because control of the Bitcoin blockchain is distributed across thousands of individual computer nodes, it is also very slow. The Bitcoin network can barely process five transactions per second, compared to over 20,000 for the Visa network (Chart 1). The average fee for a Bitcoin transaction is around $30, a number that has risen over the past few years (Chart 2). Chart 1Speed Of Transactions, Or Lack Thereof
Speed Of Transactions, Or Lack Thereof
Speed Of Transactions, Or Lack Thereof
Chart 2Rising Cost Per Transaction
Rising Cost Per Transaction
Rising Cost Per Transaction
The elaborate puzzles that the Bitcoin algorithm must solve to verify transactions are extremely energy intensive. Bitcoin mining consumes more energy than entire countries such as Sweden, Argentina, and Pakistan (Chart 3). About two-thirds of Bitcoin mining currently takes place in China, often using electricity generated by burning coal. Chart 3Bitcoin And Ethereum: How Dare You!
The Crypto Impossibility Theorem
The Crypto Impossibility Theorem
Some claim that Bitcoin and other cryptocurrencies are shifting to renewable energy sources, a trend that will continue in the years ahead. However, this argument misses the point, which is that the “proof of work” mechanism that underpins Bitcoin requires that real resources be expended. Suppose that all Bitcoin mining could be performed entirely for free using solar energy. This would reduce the cost of running a “mining rig,” incentivizing more mining. The Bitcoin algorithm operates in such a way that the difficulty of mining coins increases as the total computational power of all miners grows. In this computational rat race, miners would need to purchase more servers with ever more powerful specifications to keep up with their competitors. And semiconductors do not grow on trees. It takes real resources to produce them. As this recent Bloomberg article pointed out, Taiwan Semiconductor generates almost 50% more greenhouse emissions than General Motors. Like Bitcoin, Ethereum uses the “proof of work” mechanism to verify transactions. There have been active discussions to shift Ethereum to a “proof of stake” mechanism, which would greatly expedite transactions.1 However, some have argued that a proof of stake system would degrade security, allowing for “double-spend attacks” where someone transfers coins to someone else but then spends the coins before the transaction is completed. The Crypto Impossibility Theorem We will not delve any further into the technical nature of the blockchain trilemma other than to note that it poses a serious challenge to the entire cryptocurrency project. Instead, let us highlight another obstacle that has received less attention – one that could be even more damaging for the prospects of cryptocurrencies in the long run. Let us hyperbolically call it the “Crypto Impossibility Theorem.” The Crypto Impossibility Theorem states that a cryptocurrency will be viable only if it offers a higher return than equities. As we discuss below, the assumption that cryptos can generate a return in excess of equities is almost certain to be false since it would require that cryptocurrency holdings rise more quickly than income in perpetuity. This implies that the value that investors currently attach to cryptos will turn out to be illusory. To see the theorem in action, recall that money serves three functions: As a unit of account, as a medium of exchange, and as a store of value. It is doubtful that anyone seriously thinks that the price tag on a box of cereal will ever be displayed in units of Bitcoin, ether, or any of the various dog coins currently in vogue. Thus, we can scratch “unit of account” off the list of possible crypto uses. What about medium of exchange? One can imagine a scenario where the prices of goods and services are still listed in dollars, but one may transfer the equivalent in cryptocurrencies to purchase them. However, this raises an obvious question: Why would anyone choose to hold a cryptocurrency if wages and prices are denominated in fiat currencies such as US dollars or euros? The only possible answer is that people must see cryptocurrencies as fulfilling the third function of money, namely being a store of value. Would people be willing to hold cryptocurrencies if their prices generally moved sideways? It is doubtful. Cryptocurrencies are risky. Cryptocurrency accounts are not subject to deposit insurance. Crypto prices are also extremely volatile. During the pandemic, the S&P 500 fell by 34%, but the price of Bitcoin sank by an even greater 53%. Other cryptocurrencies fared even worse. In contrast, the trade-weighted US dollar strengthened by about 4% while gold prices only fell marginally (Chart 4). Thus, to incentivize people to hold cryptos, the prospective capital gain has to be large enough to offset the inherent volatility in owning these currencies. Chart 4Cryptocurrencies Fared Badly During Last Year’s Equity Sell-Off
The Crypto Impossibility Theorem
The Crypto Impossibility Theorem
This is where the Crypto Impossibility Theorem comes in. Unlike dividend-paying stocks, cryptocurrencies do not provide any income to their holders. Thus, even if cryptos were just as risky as stocks, the price of cryptos would still need to rise more than the price of stocks in order to ensure that investors remain indifferent between the two asset classes. In practice, as the experience of the pandemic demonstrates, cryptos are even riskier than stocks. Thus, the expected return on cryptos has to exceed the expected increase in stock prices by more than the dividend yield. The problem for crypto holders is that this is not mathematically possible. Even if one controls for the rise in price-earnings multiples over time, equity returns have generally exceeded nominal GDP growth (Table 1). Hence, if cryptos need to offer superior returns to equities, and if the return on equities is at least equal to nominal GDP growth, then the market capitalization of cryptocurrencies will not only end up rising faster than for stocks, it will rise faster than aggregate national income. In a digital world where people need ever-less money to facilitate transactions, there is no good reason to expect this to happen. Table 1Equity Returns And GDP Growth
The Crypto Impossibility Theorem
The Crypto Impossibility Theorem
A Fashion Choice Crypto-optimists might argue that the required rate of return to holding cryptos will decline as the market matures. This is wishful thinking. Equities derive their value from the fundamentals of a company’s business. In contrast, cryptocurrencies have no intrinsic value. Their value is whatever others are willing to pay for them. Not only does this make cryptocurrencies inherently more risky than equities, it also makes them highly susceptible to fashion trends. It is not surprising that many upstart cryptocurrencies have crafted ties with celebrities and other “influencers.” The whole point is to get enough people interested in a cryptocurrency to generate a feedback loop of wider adoption, thus allowing the currency’s early backers to cash out. The drubbing that cryptocurrencies have received over the past two weeks is just a taste of things to come. In this sense, cryptocurrencies are even more vulnerable to affinity scams than other assets such as precious metals. While apocalyptic warnings of “currency debasement” have long been used to sell bullion, at least with gold and silver, you truly do get something that is in short supply. In the case of cryptocurrencies, while the supply of any individual cryptocurrency may be limited, the overall supply is unbounded. This means that the average price of each currency is likely to rise much less than the aggregate value of all cryptocurrencies, making the entire asset class even less viable over time. Cryptogeddon The drubbing that cryptocurrencies have received over the past two weeks is just a taste of things to come. As Matt Gertken and Guy Russell discuss in this week’s Geopolitical Strategy report, crypto markets will continue to face tighter regulation (Table 2). Just this week, China reiterated its ban on financial companies offering cryptocurrency services. As part of its broader effort to crack down on tax evasion, the US Treasury Department also announced that it will require any cryptocurrency transfer worth $10,000 or more to be reported to the IRS. Table 2Regulation Of Cryptos: What Can And Cannot Be Done
The Crypto Impossibility Theorem
The Crypto Impossibility Theorem
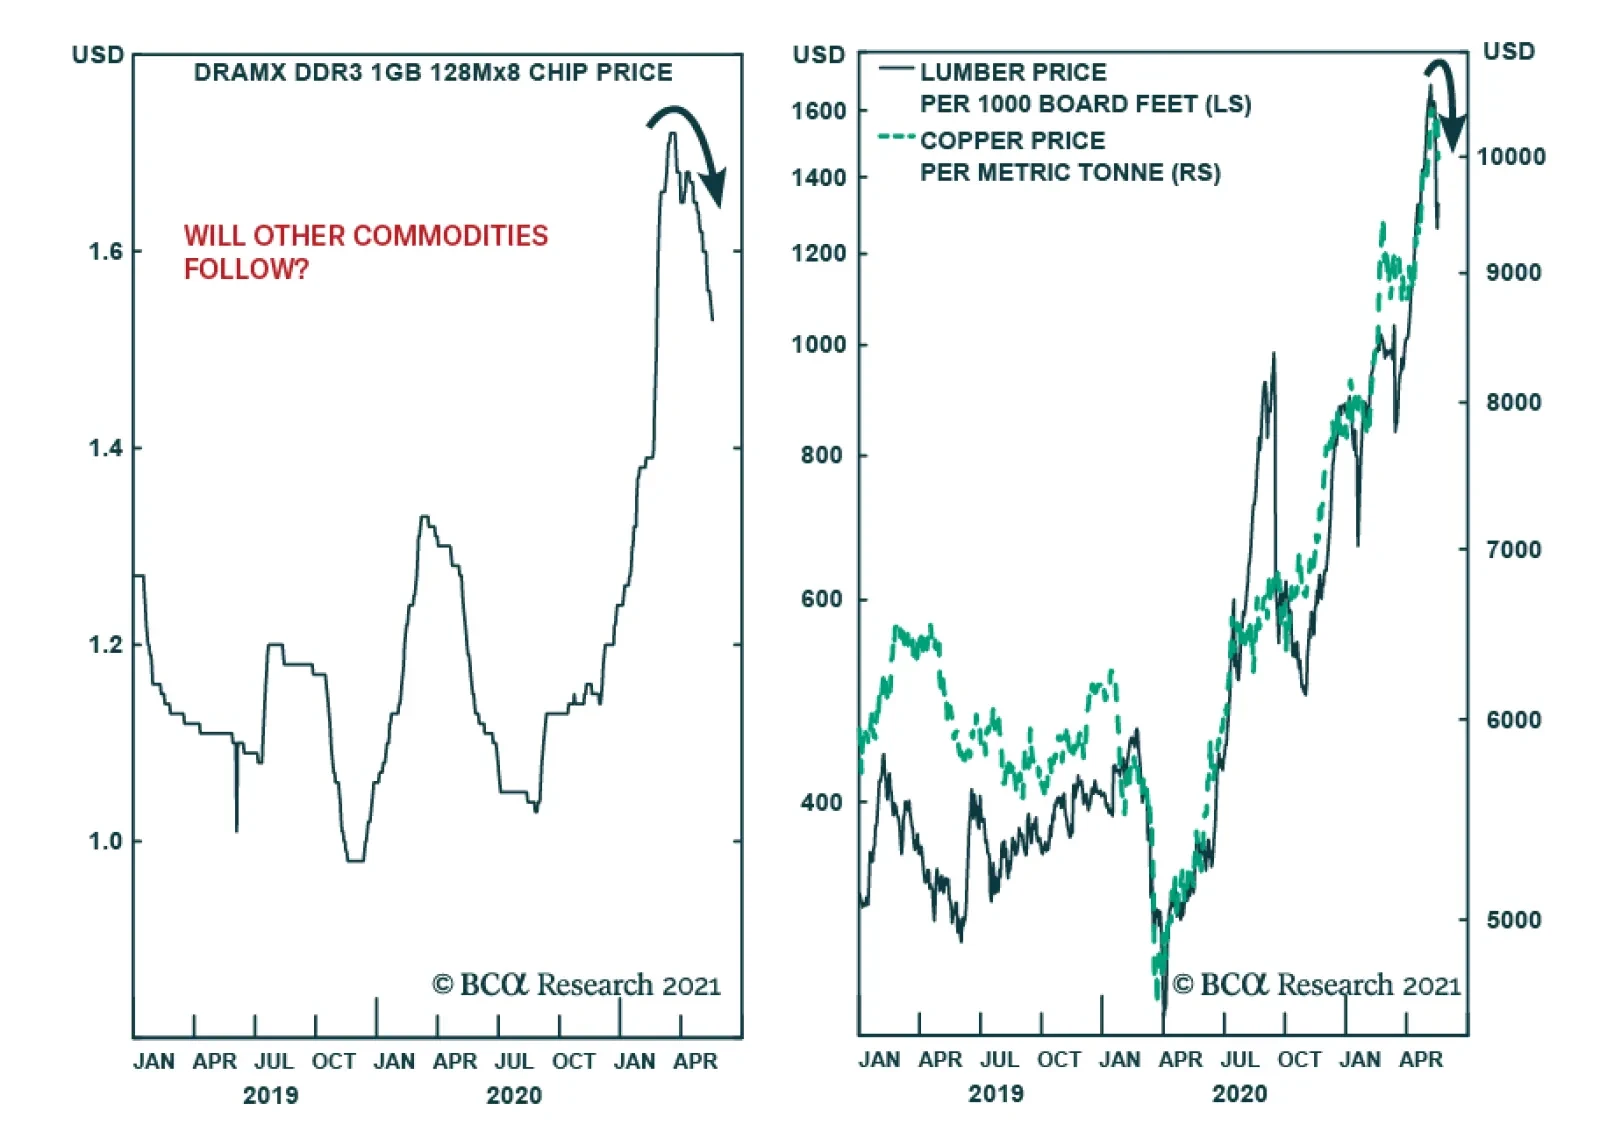
The blockchain trilemma will make it impossible for cryptos to overcome ESG concerns, while the Crypto Impossibility Theorem will prevent cryptocurrencies from ever being stable stores of value. In the meantime, an ebbing of input price inflation will take some of the wind out of the sails from the argument that cryptos are an indispensable hedge against the “inevitable” debasement of fiat monies. Chart 5 shows that DRAM prices have rolled over. Lumber prices have dropped 11% so far this week. Corn, soybean, and steel prices have also backed off their highs. Cryptos are like sharks; they need to move forward or they will sink. Back when they were unknown to most investors, a speculative case could have been made for buying cryptos. However, that case vanished earlier this year when the aggregate value of cryptocurrencies briefly surpassed the entire stock of US dollars in circulation (Chart 6). Even with the recent correction, there are 17 cryptocurrencies with market capitalizations above $10 billion (Table 3). Chart 5To The Moon And Back?
To The Moon And Back?
To The Moon And Back?
Chart 6Aggregate Value Of Cryptos Briefly Surpassed The Entire Stock Of US Dollars In Circulation
Aggregate Value Of Cryptos Briefly Surpassed The Entire Stock Of US Dollars In Circulation
Aggregate Value Of Cryptos Briefly Surpassed The Entire Stock Of US Dollars In Circulation
Table 3Close To 20 Cryptos Have A Market Cap In Excess Of US$10bn
The Crypto Impossibility Theorem
The Crypto Impossibility Theorem
What will the ongoing crypto collapse mean for the broader investment landscape? In the near term, the pain in crypto markets could drag down other speculative assets such as tech stocks. In the long term, diminished investor interest in cryptos will benefit the stock market, as investor attention focuses back on equities. For the broader economy, the impact of a crypto bear market will be limited. The banking system has very little exposure to cryptos. There will be a modest adverse wealth effect from falling crypto prices. However, the inability of a few laser-eyed crypto traders to buy their Lambos is hardly going to matter much against the backdrop of strong stimulus-fueled consumption growth in the US and a number of other economies. Investors should continue to overweight stocks in a global asset portfolio, favoring value over growth, cyclicals over defensives, and non-US stocks over their US peers. Peter Berezin Chief Global Strategist pberezin@bcaresearch.com Footnotes 1 Proof of Work (PoW) and Proof of Stake (PoS) are two methods used to ensure the integrity of a coin’s ledger or record of transactions. PoW achieves this by requiring miners (those who add transactions to the ledger) to solve a time-consuming mathematical puzzle. PoS achieves this through a different mechanism, where anyone who stakes their own coin can be randomly selected to add new transactions to the ledger. Those holding or “staking” more coin have a higher probability of being selected. Global Investment Strategy View Matrix
The Crypto Impossibility Theorem
The Crypto Impossibility Theorem
Special Trade Recommendations
The Crypto Impossibility Theorem
The Crypto Impossibility Theorem
Current MacroQuant Model Scores
The Crypto Impossibility Theorem
The Crypto Impossibility Theorem
There has been a mania in inflation expectations over the past couple of months. Industries have reconfigured for the end of lockdowns and supply bottlenecks in some commodities led to spikes in their prices. These commodity price increases then unleashed…
Highlights Global oil markets will remain balanced this year with OPEC 2.0's production-management strategy geared toward maintaining the level of supply just below demand. This will keep inventories on a downward trajectory, despite short-term upticks due to COVID-19-induced demand hits in EM economies and marginal supply additions from Iran and Libya over the near term. Our 2021 oil demand growth is lower – ~ 5.3mm b/d y/y, down ~ 800k from last month's estimate – given persistent weakness in realized consumption. We have lifted our demand expectation for 2022 and 2023, however, expecting wider global vaccine distribution and increased travel toward year-end. The next few months are critical for OPEC 2.0: The trajectory for EM demand recovery will remain uncertain until vaccines are more widely distributed, and supply from Iran and Libya likely will increase this year. This will lead to a slight bump in inventories this year, incentivizing KSA and Russia to maintain the status quo on the supply side. We are raising our 2021 Brent forecast back to $63/bbl from $60/bbl, and lifting our 2022 and 2023 forecasts to $75 and $78/bbl, respectively, given our expectation for a wider global recovery (Chart of the Week). Feature A number of evolving fundamental factors on both sides of the oil market – i.e., lingering uncertainty over the return of Iranian and Libyan exports and the strength of the global demand recovery – will test what we believe to be OPEC 2.0's production-management strategy in the next few months. Briefly, our maintained hypothesis views OPEC 2.0 as the dominant supplier in the global oil market. This is due to the low-cost production of its core members (i.e., those states able to attract capital and grow production), and its overwhelming advantage in spare capacity, which we reckon will average in excess of 7mm b/d this year, owing to the massive production cuts undertaken to drain inventories during the COVID-19 pandemic. Formidable storage assets globally – positioned in or near refining centers – and well-developed transportation infrastructures also support this position. We estimate core OPEC 2.0 production will average 26.58mm b/d this year and 29.43mm b/d in 2022 (Chart 2). Chart of the WeekBrent Prices Likely Correct Then Move Higher in 2022-23
Brent Prices Likely Correct Then Move Higher in 2022-23
Brent Prices Likely Correct Then Move Higher in 2022-23
Chart 2OPEC 2.0 Will Maintain Status Quo
OPEC 2.0 Will Maintain Status Quo
OPEC 2.0 Will Maintain Status Quo
The putative leaders of the OPEC 2.0 coalition – the Kingdom of Saudi Arabia (KSA) and Russia – have distinctly different goals. KSA's preference is for higher prices – ~ $70-$75/bbl (basis Brent) to the end of 2022. Higher prices are needed to fund the Kingdom's diversification away from oil. Russia's goal is to keep prices closer to the marginal cost of the US shale-oil producers, who we characterize as the exemplar of the price-taking cohort outside OPEC 2.0, which produces whatever the market allows. This range is ~ $50-$55/bbl. The sweet spot that accommodates these divergent goals is on either side of $65/bbl for this year. OPEC 2.0 June 1 Meeting Will Maintain Status Quo With Brent trading close to $70/bbl, discussions in the run-up to OPEC 2.0's June 1 meeting likely are focused on the necessity to increase the 2.1mm b/d being returned to the market over the May-July period. At present, we do not believe this will be necessary: Iran likely will be returning to the market beginning in 3Q21, and will top up its production from ~ 2.4mm b/d in April to ~ 3.85mm b/d by year-end, in our estimation. Any volumes returned to the market by core OPEC 2.0 in excess of what's already been agreed going into the June 1 meeting likely will come out of storage on an as-needed basis. Libya will likely lift its current production of ~ 1.3mm b/d close to 1.5mm b/d by year end as well. We are expecting the price-taking cohort ex-OPEC 2.0 to increase production from 53.78mm b/d in April to 53.86mm b/d in December, led by a 860k b/d increase in US output, which will take average Lower 48 output in the US (ex-GOM) to 9.15mm b/d by the end of this year (Chart 3). When we model shale output, our expectation is driven by the level of prompt WTI prices and the shape of the forward curve. The backwardation in the WTI forward curve will limit hedged revenues at the margin, which will limit the volume growth of the marginal producer. We expect global production to slowly increase next year, and the year after that, with supply averaging 101.07mm b/d in 2022 and 103mm b/d in 2023. Chart 3US Crude Output Recovers, Then Tapers in 2023
US Crude Output Recovers, Then Tapers in 2023
US Crude Output Recovers, Then Tapers in 2023
Demand Should Lift, But Uncertainties Persist We expect the slowdown in realized DM demand to reverse in 2H21, and for oil demand to continue to recover in 2H21 as the US and EU re-open and travel picks up. This can be seen in our expectation for DM demand, which we proxy with OECD oil consumption (Chart 4). EM demand – proxied by non-OECD oil consumption – is expected to revive over 2022-23 as vaccine distribution globally picks up. As a result, demand growth shifts to EM, while DM levels off. China's refinery throughput in April came within 100k b/d of the record 14.2mm b/d posted in November 2020 (Chart 5). The marginal draw in April stockpiles could also signify that as crude prices have risen higher, the world’s largest oil importer may have hit the brakes on bringing oil in. In the chart, oil stored or drawn is calculated as the difference between what is imported and produced with what is processed in refineries. With refinery maintenance in high gear until the end of this month, we expect product-stock draws to remain strong on the back of domestic and export demand. This will draw inventories while maintenance continues. Chart 4EM Demand Will Recovery Accelerates in 2022-23
EM Demand Will Recovery Accelerates in 2022-23
EM Demand Will Recovery Accelerates in 2022-23
Chart 8China Refinery Runs Remain Strong
China Refinery Runs Remain Strong
China Refinery Runs Remain Strong
COVID-19-induced demand destruction remains a persistent risk, particularly in India, Brazil and Japan. This is visible in the continued shortfall in realized demand vs our expectation so far this year. We lowered our 2021 oil demand growth estimate to ~ 5.3mm b/d y/y, which is down ~ 800k from last month's estimate, given persistent weakness in realized consumption. Our demand forecast for 2022 and 2023 is higher, however, based on our expectation for stronger GDP growth in EM economies, following the DM's outperformance this year, on the back of wider global vaccine distribution year-end (Table 1). Table 1BCA Global Oil Supply - Demand Balances (MMb/d, Base Case Balances)
OPEC 2.0's Production Strategy In Focus
OPEC 2.0's Production Strategy In Focus
Our supply-demand estimates continue to point to a balanced market this year and into 2022-23 (Chart 6). Given our expectation OPEC 2.0's production-management strategy will remain effective, we expect inventories to continue to draw (Chart 7). Chart 6Markets Remained Balanced
Markets Remained Balanced
Markets Remained Balanced
Chart 7Inventories Continue To Draw
Inventories Continue To Draw
Inventories Continue To Draw
CAPEX Cuts Bite In 2023 In 2023, we are expecting Brent to end the year closer to $80/bbl than not, which will put prices outside the current range we believe OPEC 2.0 is managing its production around (Chart 8). We have noted in the past continued weakness in capex over the 2015-2022 period threatens to leave the global market exposed to higher prices (Chart 9). Over time, a reluctance to invest in oil and gas exploration and production prices in 2024 and beyond could begin to take off as demand – which does not have to grow more than 1% p.a. – continues to expand and supply remains flat or declines. Chart 8By 2023 Brent Trades to /bbl
By 2023 Brent Trades to $80/bbl
By 2023 Brent Trades to $80/bbl
Chart 9Low Capex Likely Results In Higher Prices After 2023
OPEC 2.0's Production Strategy In Focus
OPEC 2.0's Production Strategy In Focus
Bottom Line: We are raising our 2021 forecast back to an average of $63/bbl, and our forecasts for 2022 and 2023 to $75 and $78/bbl. We expect DM demand to lead the recovery this year, and for EM to take over next year, and resume its role as the growth engine for oil demand. Longer term, parsimonious capex allocations likely result in tighter supply meeting slowly growing demand. At present, markets appear to be placing a large bet on the buildout of renewable electricity generation and electric vehicles (EVs). If this does not occur along the trajectory of rapid expansion apparently being priced by markets – i.e., the demand for oil continues to expand, however slowly – oil prices likely would push through $80/bbl in 2024 and beyond. Robert P. Ryan Chief Commodity & Energy Strategist rryan@bcaresearch.com Ashwin Shyam Research Associate Commodity & Energy Strategy ashwin.shyam@bcaresearch.com Commodities Round-Up Energy: Bullish The Colonial Pipeline outage pushed average retail gasoline prices in the US to $3.03/gal earlier this week, according to the EIA. This was the highest level for regular-grade gasoline in the US since 27 October 2014. According to reuters.com, the cyberattack that shut down the 5,500-mile pipeline was the most disruptive on record, shutting down thousands of retail service stations in the US southeast. Millions of barrels of refined products – gasoline, diesel and jet fuel – were unable to flow between the US Gulf and the NY Harbor because of the attack, which was launched 7 May 2021 (Chart 10). While most of the system is up and running, problems with the pipeline's scheduling system earlier this week prevented a return to full operation. Base Metals: Bullish Spot copper prices remained on either side of $4.55/lb (~ $10,000/MT) by mid-week following a dip from the $4.80/lb level (Chart 11). We remain bullish copper, particularly as political risk in Chile rises going into a constitutional convention. According to press reports, the country's constitution will be re-written, a process that likely will pave the way for higher taxes and royalties on copper producers.1 In addition, unions in BHP mines rejected a proposed labor agreement, with close to 100% of members voting to strike. In Peru, a socialist presidential candidate is campaigning on a platform to raise taxes and royalties. Precious Metals: Bullish According to the World Platinum Investment Council, platinum is expected to run a deficit for the third consecutive year in 2021, which will amount to 158k oz, on the back of strong demand. Refined production is projected to increase this year, with South Africa driving this growth as mines return to full operational capacity after COVID-19 related shutdowns. Automotive demand is leading the charge in higher metal consumption, as car makers switch out more expensive palladium for platinum to make autocatalysts in internal-combustion vehicles. Ags/Softs: Neutral Corn prices continued to be better-offered following last week's WASDE report, which contained the department's first look at the 2021-22 crop year. Corn production is expected to be up close to 6% over the 2020-21 crop year, at just under 15 billion bushels. On the week, corn prices are down ~ 15.3%. Chart 10
RBOB Gasoline at a High
RBOB Gasoline at a High
Chart 11
Political Risk in Chile and Peru Could Bolster Copper Prices
Political Risk in Chile and Peru Could Bolster Copper Prices
Footnotes 1 Please see Copper price rises as Chile fuels long-term supply concerns published 18 May 2021 by mining.com. Investment Views and Themes Strategic Recommendations Tactical Trades Commodity Prices and Plays Reference Table Trades Closed in 2021 Summary of Closed Trades
Higher Inflation On The Way
Higher Inflation On The Way
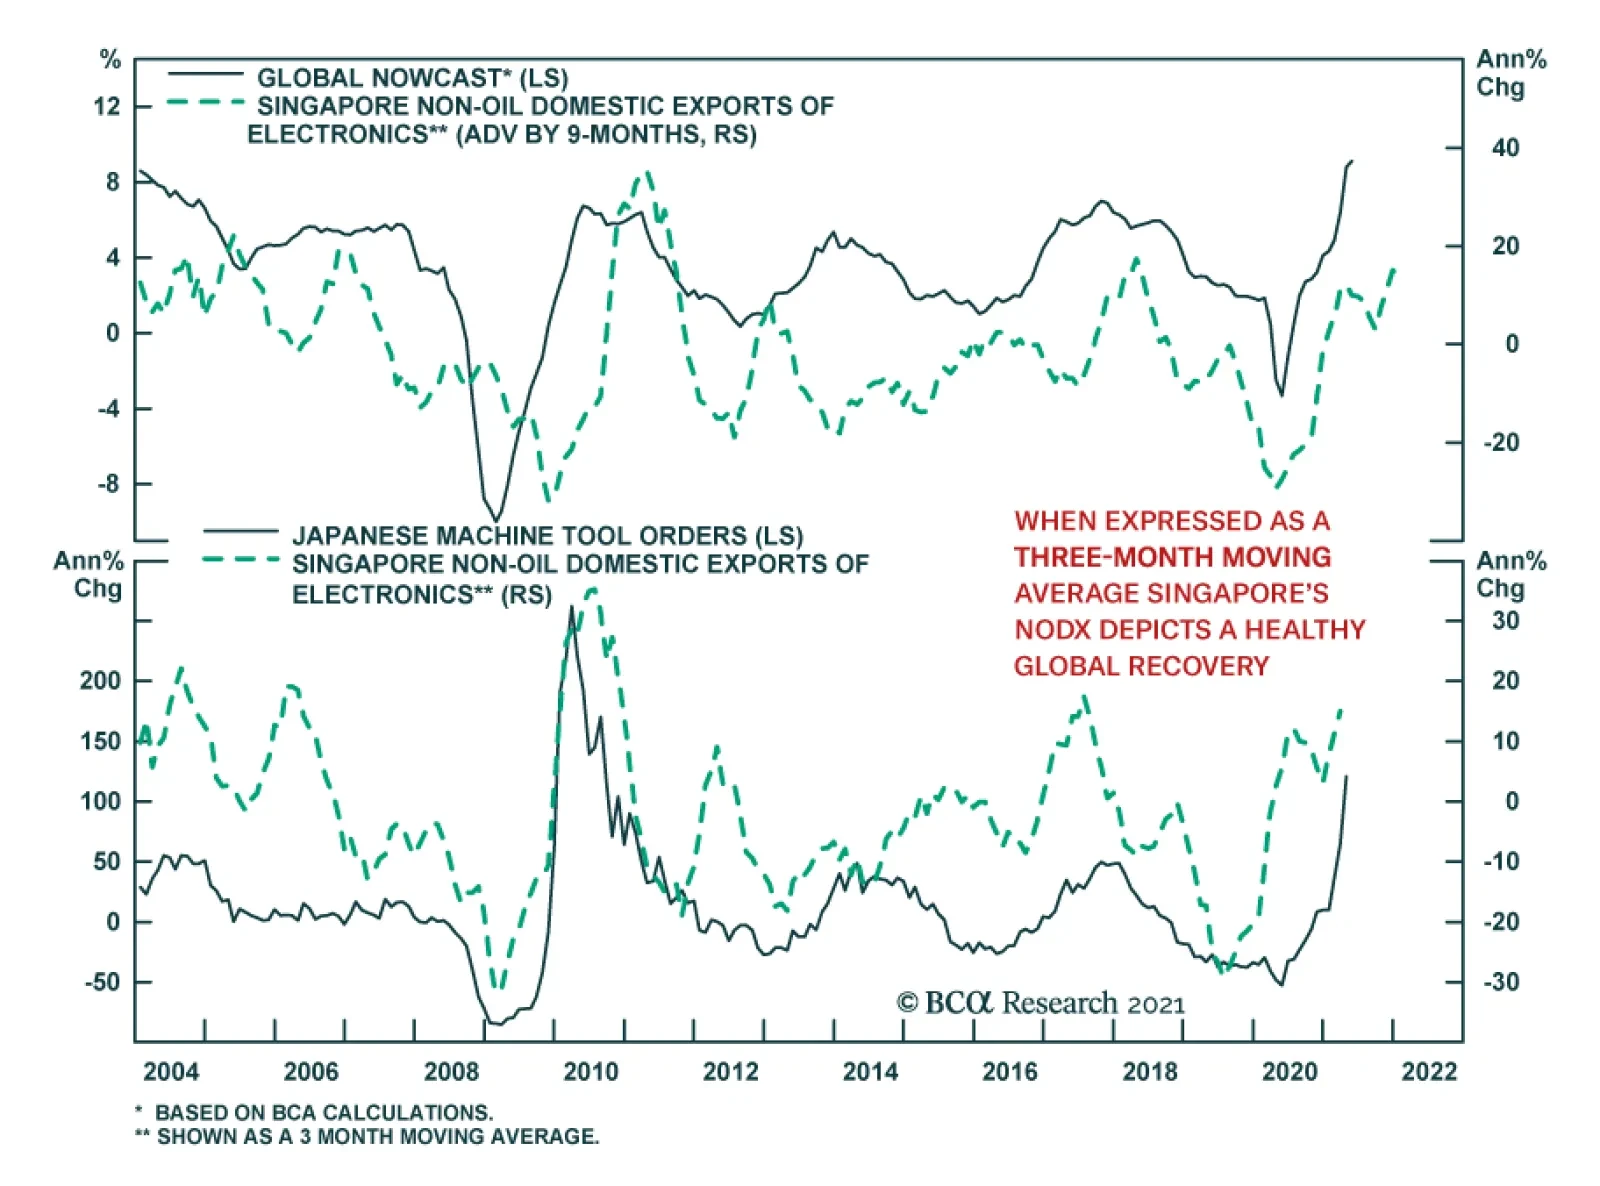
Asian trade data for April have been generally robust. Japan’s machine tool orders are booming, and both Taiwanese and Korean exports remain elevated. Together, this suggests that the global manufacturing recovery is intact. However, Singapore’s non-oil…
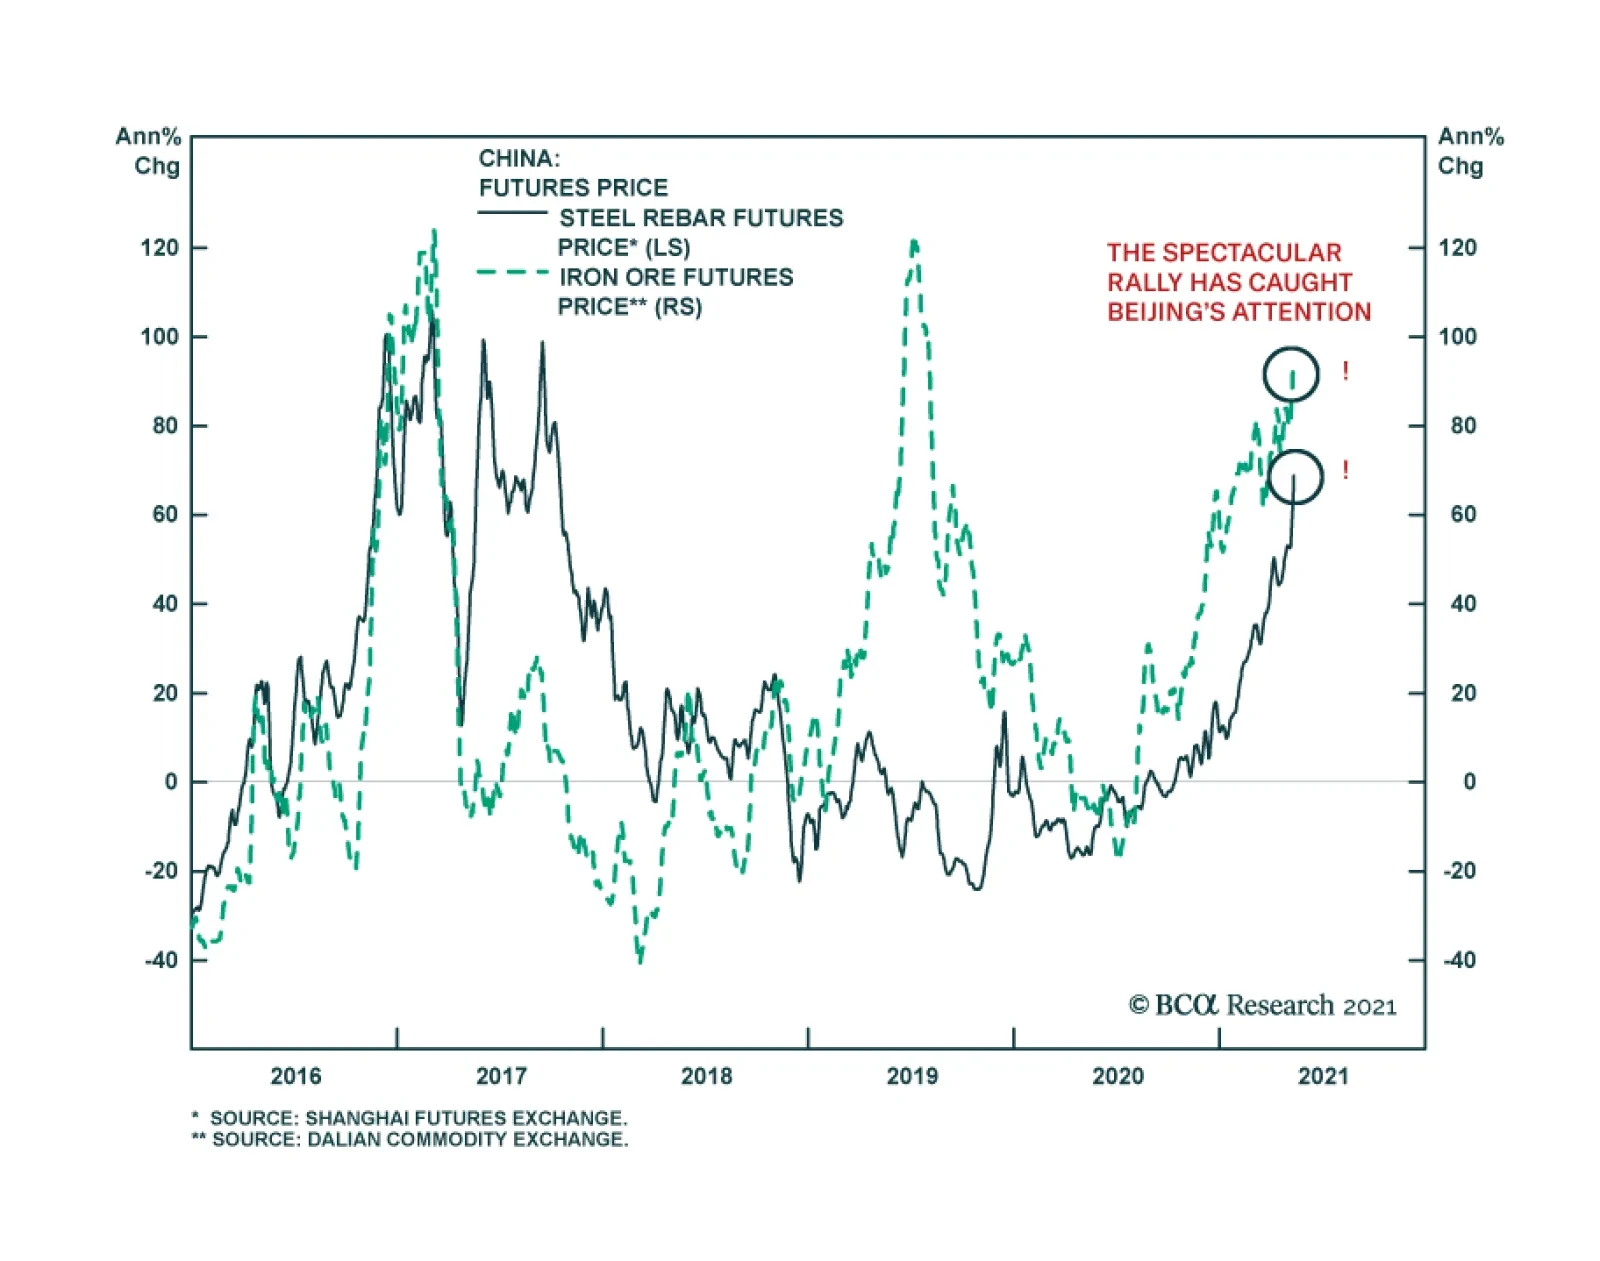
After a spectacular rally, wobbles have emerged in the commodity space. Copper prices peaked on May 11 and are down 1.5% since, and Brent crude oil prices have failed to break above $70/bbl. Similarly, steel rebar and iron ore futures traded on Chinese…
Highlights US growth has likely peaked. Economic momentum will slow over the coming quarters as the tailwind from stimulus fades and the vaccination campaign winds down. Historically, a slowdown in US growth, as proxied by a decline in the ISM manufacturing index, has been associated with lower overall equity returns, the outperformance of defensive stocks over cyclicals, large caps over small caps, and US equities over their overseas peers. A falling ISM has also been associated with a strengthening dollar, lower Treasury yields, wider credit spreads, a decline in the US Treasury/German bund spreads, falling oil prices, and an increase in the gold-to-copper price ratio. Compared to past episodes, there are three reasons to expect the coming US slowdown to be relatively benign: First, growth is slowing from exceptionally strong levels; second, growth in many other parts of the world is still speeding up; and third, monetary policy will remain highly accommodative in the face of what is likely to be a transitory increase in inflation. We continue to maintain a positive 12-month view on global equities. Nevertheless, with global growth momentum likely to slow later this year, investors who are maximally overweight risk should pare back cyclical exposure. Crypto update: We warned that “Bitcoin is on a collision course with ESG” two weeks ago. Elon Musk’s flip-flop on allowing customers to pay for Teslas in Bitcoin is yet another piece of evidence that ESG concerns will win out. With that in mind, we are going short Bitcoin. Beware The Second Derivative US growth has likely peaked. Economic momentum will slow over the coming quarters as the tailwind from fiscal stimulus fades and the vaccination campaign winds down. According to the Brookings Institution, fiscal easing contributed nearly seven percentage points to US growth in the first quarter (Chart 1). However, fiscal policy is set to detract from growth in the remainder of the year, reflecting the one-off nature of some of the stimulus measures. Chart 1After A Strong Boost, Fiscal Thrust Is Turning Negative
Peak Growth And A Whiff Of Stagflation
Peak Growth And A Whiff Of Stagflation
On the pandemic front, the number of new cases continues to trend lower in the US, thanks mainly to a successful vaccination campaign. A falling infection rate has allowed states to dismantle lockdown measures. Conceptually, it is the change in social distancing measures that correlates with economic growth. While some restrictions remain in place (especially in the educational sector), we are now well past the point of maximum loosening. How have financial markets performed during episodes of slowing US economic growth? To answer this question, we looked at the performance of various assets during periods when the ISM manufacturing index was falling and when it was rising. To add a bit more granularity to the analysis, we also looked at cases when the ISM was trending up and above 50, trending down and above 50, trending down and below 50, and trending up and below 50. As summarized in Table 1 and the Appendix Charts, the key results are as follows: Stocks tend to do best when the ISM is rising. Since 1950, the S&P 500 has risen on average by 1.51% during months when the ISM was trending higher, compared to 0.49% during months when the ISM was trending lower. The results were virtually the same if one restricts the sample to the post-1995 period. While the change in the ISM generally matters more for the S&P 500, absolute levels matter too. Since 1995, the best period for the S&P 500 was when the ISM was below 50 but trending higher (S&P 500 up 2.07%), while the worst period was when the ISM was below 50 and trending lower (S&P 500 up 0.03%). This suggests that swings in the ISM have a bigger effect on the stock market during periods of economic contraction. During periods where the ISM was falling but still above 50, the S&P 500 has delivered a positive – though far from stellar – monthly return of 0.69%. US defensively-geared equities outperformed cyclicals when the ISM was trending lower. During periods when the ISM was falling but still above 50, defensives beat cyclicals by 0.45%. Defensives outperformed cyclicals by 0.84% during periods when the ISM was below 50 and trending lower. US small caps underperformed large caps during periods when the ISM was falling. Non-US stocks also underperformed their US counterparts in a falling ISM environment. The relationship between the ISM and value/growth performance is more ambiguous. To the extent that there is one, value generally outperforms growth when the ISM is below 50. Treasury yields tend to increase, while the yield curve tends to steepen, when the ISM is trending higher. Reflecting the higher beta that Treasuries have to the global business cycle, Treasury yields generally rise more than Germany bund yields when the ISM is on the upswing. Corporate credit spreads tend to widen when the ISM is falling. Spreads narrow the most when the ISM is below 50 but rising. As a countercyclical currency, the US dollar tends to weaken when the ISM is rising and strengthen when the ISM is falling. The prices of cyclically-sensitive commodities such as oil and copper normally decline when the ISM is trending lower, although in general, the bulk of the decline in commodity prices usually occurs only when the ISM has dipped below 50. There is not much of a relationship between gold prices and the ISM. Table 1The Economic Cycle And Financial Assets
Peak Growth And A Whiff Of Stagflation
Peak Growth And A Whiff Of Stagflation
Implications For Today Assuming that the ISM has peaked but remains above 50, the analysis above suggests that the S&P 500 will rise modestly over the coming months; US stocks will edge out non-US stocks; defensives will outperform cyclicals; and large caps will perform slightly better than small caps. The analysis also suggests that Treasury yields will move lower; the Treasury-bund spread will narrow; corporate credit spreads will be flat-to-wider; the dollar will strengthen modestly; and commodities will move broadly sideways. Our own 12-month view is more pro-risk than implied by the ISM analysis. There are three reasons for this: First, US growth is slowing from exceptionally strong levels; second, growth in many other parts of the world is still accelerating; and third, monetary policy remains highly accommodative. Let’s examine each assumption in turn. Reason #1: US growth is slowing from exceptionally strong levels While payroll growth surprised sharply on the downside in April, we suspect this was mainly due to pandemic-induced distortions to the seasonal adjustment mechanism used by the Bureau of Labor Statistics. Seasonally unadjusted payrolls rose by 1.1 million in April, which is broadly consistent with the strong pace of GDP growth tracking estimates. The Atlanta Fed GDPNow model points to growth of 11% in Q2. Bloomberg consensus estimates have US real GDP rising by 8.1% in the second quarter. Growth will decline to 7% in Q3 and 4.7% in Q4, but still average 4% in 2022 (Table 2). Table 2Growth Is Peaking, But At A Very High Level
Peak Growth And A Whiff Of Stagflation
Peak Growth And A Whiff Of Stagflation
Chart 2Firms Will Need To Rebuild Inventories
Peak Growth And A Whiff Of Stagflation
Peak Growth And A Whiff Of Stagflation
US households were sitting on $2.2 trillion in excess savings as of the end of April. This is money they would not have had in absence of the pandemic. Slightly less than half of that stockpile can be attributed to transfer payments, mainly in the form of stimulus checks and unemployment benefits. The rest stems from decreased spending during the pandemic. Not all of this money will be spent immediately. However, given the large sums involved – $2.2 trillion is equivalent to 15% of annual personal consumption – even a partial depletion of these excess savings will be enough to power consumption for the foreseeable future. Meanwhile, firms will have to boost production in order to restore depleted inventories. The inventory-to-sales ratio stands at record low levels (Chart 2). The decline in inventories pushed up the ISM new orders-to-inventory ratio in April, even as the overall ISM index slid from 64.7 in March to 60.7. The new orders-to-inventory ratio tends to lead the ISM index, which suggests that any decline in the ISM index over the coming months will be gradual. An easing of supply-side constraints should also support growth. Even though overall employment was still 5.2% below pre-pandemic levels in April, a record share of small firms surveyed by the NFIB reported difficulty in filling vacant positions (Chart 3). Enhanced unemployment benefits have eroded the incentive to find work. In addition, many schools remain partially shuttered. Chart 4 shows that mothers with young children have seen a much larger decline in labor force participation than other groups. Chart 3Firms Are Struggling To Find Workers
Firms Are Struggling To Find Workers
Firms Are Struggling To Find Workers
Chart 4Mothers With Children Had To Leave The Labor Force
Peak Growth And A Whiff Of Stagflation
Peak Growth And A Whiff Of Stagflation
Enhanced unemployment benefits will expire in September. As schools resume normal operations, more workers will flow back into the labor market. At the same time, some of the bottlenecks currently gripping the global supply chain should abate, allowing for increased output. Reason #2: Growth in many other parts of the world is still accelerating Chart 5Over 40% Of S&P 500 Revenues Come From Abroad
Peak Growth And A Whiff Of Stagflation
Peak Growth And A Whiff Of Stagflation
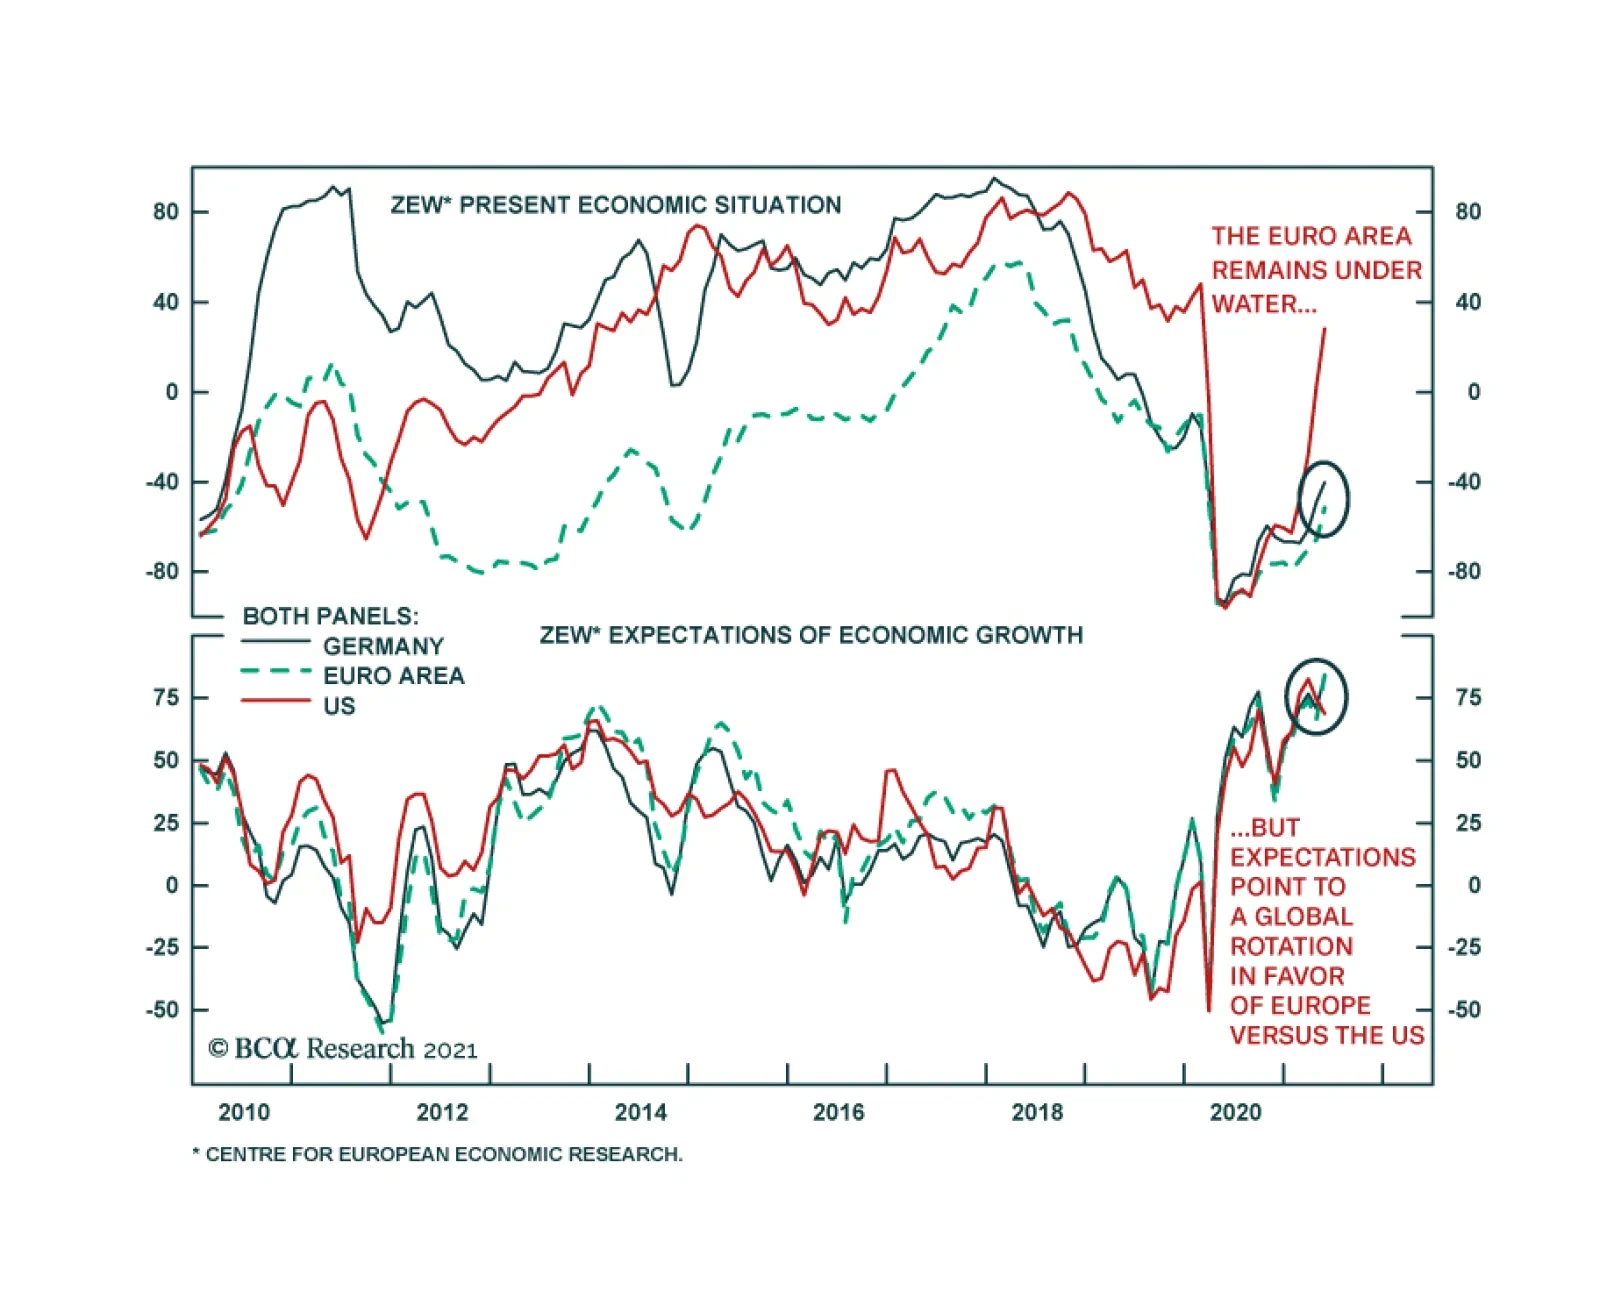
Chart 6Euro Area Data Has Surprised On The Upside
Euro Area Data Has Surprised On The Upside
Euro Area Data Has Surprised On The Upside
S&P 500 constituent firms derive 43% of their revenues from abroad (Chart 5). While Bloomberg estimates suggest that US growth will peak in the second quarter, growth in the euro area is not expected to peak until the third quarter. Mathieu Savary, who heads BCA’s European Investment Strategy service, sees upside risks to European growth estimates for the second half of this year. Consistent with Mathieu’s observations, recent economic data has been surprising to the upside in the euro area (Chart 6). Just this week, economic expectations for both Germany and the wider euro area leaped to the highest level in more than 20 years, according to the ZEW economic research institute. Growth in Japan should also pick up in the remainder of the year. Japan’s vaccination campaign has gotten off to a very slow start, with less than 3% of the population being inoculated to date. The government imposed its third state of emergency on April 25 in response to rising viral case counts. It subsequently extended those restrictions on May 11. The authorities intend to vaccinate the country’s 36 million elderly people by July, when the Olympics are set to begin. This should permit some easing in lockdown measures. Investors are worried that the Chinese economy will slow this year. The Chinese PMIs peaked in November 2020, about the same time as the combined credit/fiscal impulse reached an apex (Chart 7). Jing Sima, BCA’s chief China strategist, expects the general government budget deficit to remain at a still-ample 8% of GDP this year, similar to where it was last year. She expects credit growth to slow by 2%-to-3%, converging towards the pace of nominal GDP growth. Keep in mind that China’s credit-to-GDP ratio stands at 270%. Thus, if credit grows in line with nominal GDP growth of about 10%, this would still leave the stock of credit roughly 27% of GDP higher at the end of 2021 compared to the end of 2020. This hardly constitutes “deleveraging”. A resilient Chinese economy should buoy other emerging markets. Progress on the pandemic front should also help. The UN estimates that as many as 15 billion vaccine doses could be produced by the second half of 2021, enough to inoculate most of the world’s population (Chart 8). The shortages of vaccines in emerging markets could turn into a surfeit by the end of this year, something that market participants do not seem to fully appreciate. Chart 7China: Peak Stimulus And Peak Growth
China: Peak Stimulus And Peak Growth
China: Peak Stimulus And Peak Growth
The rotation in growth momentum from the US to the rest of the world should put downward pressure on the US dollar. A weaker dollar, in turn, has usually coincided with the outperformance of non-US stock markets (Chart 9). Chart 8Vaccine Production Set To Ramp Up Further
Peak Growth And A Whiff Of Stagflation
Peak Growth And A Whiff Of Stagflation
Chart 9A Weaker Dollar Has Coincided With The Outperformance Of Non-US Stock Markets
A Weaker Dollar Has Coincided With The Outperformance Of Non-US Stock Markets
A Weaker Dollar Has Coincided With The Outperformance Of Non-US Stock Markets
Reason #3: Monetary policy remains highly accommodative The slowdown in US growth is coming at a time when inflation is rising. The core CPI increased by 0.9% month-over-month in April. This was the biggest monthly jump since August 1981. The year-over-year rate climbed to 3.0%, the highest in 25 years. The “whiff of stagflation” helped push the S&P 500 down this week. As we discussed last week, we are very much in the camp that expects inflation to rise significantly over the long haul. Over the next one or two years, however, we would fade inflationary fears. As the example of the 1960s illustrates, a long period of overheating is often necessary to push up inflation in a sustained manner. The US unemployment rate reached its full employment level in 1962. However, it was not until 1966 – when the unemployment rate was two full percentage points below equilibrium – that inflation finally took off (Chart 10). The official core CPI likely overstates underlying inflationary pressures. The pandemic threw all sorts of prices out of whack. Stripping out volatile food and energy prices from inflation is not enough. One needs more refined measures of inflation. Luckily, they exist. Chart 11 shows that median CPI, trimmed-mean CPI, and sticky price CPI all remain well contained. Similarly, relatively clean measures of wage growth, such as the Atlanta Fed Wage Tracker, do not point to an imminent wage-price spiral (Chart 12). Chart 10Inflation Started Accelerating Quickly Only When Unemployment Reached Very Low Levels In The 1960s
Inflation Started Accelerating Quickly Only When Unemployment Reached Very Low Levels In The 1960s Inflation Started Accelerating Quickly Only When Unemployment Reached Very Low Levels In The 1960s
Inflation Started Accelerating Quickly Only When Unemployment Reached Very Low Levels In The 1960s Inflation Started Accelerating Quickly Only When Unemployment Reached Very Low Levels In The 1960s
Chart 11Cleaner Measures Of Inflation Are Telling A Different Story
Cleaner Measures Of Inflation Are Telling A Different Story
Cleaner Measures Of Inflation Are Telling A Different Story
Chart 12Wage Growth Is Still Lackluster
Wage Growth Is Still Lackluster
Wage Growth Is Still Lackluster
All this means that the Fed can afford to sustain exceptionally easy monetary policy. That should keep growth at an above-trend pace and continue to support to equity valuations. Investment Conclusions My “golden rule” for investing is to stay bullish on stocks unless one thinks there is a recession around the corner (Chart 13). Seeing around the corner is not easy, of course, but it is not impossible either. Chart 13Recessions And Bear Markets Tend To Overlap
Peak Growth And A Whiff Of Stagflation
Peak Growth And A Whiff Of Stagflation
Last year’s recession was caused by a true exogenous shock – the pandemic. Most recessions are endogenous in nature, however. They result from growing imbalances that are usually laid bare by tighter monetary policy. One can debate the extent to which the global economy is plagued by imbalances of one form or another. But one thing is clear, monetary policy is unlikely to turn contractionary any time soon. In this environment, one should remain positive on equities and other risk assets over a 12-month horizon. Nevertheless, with global growth momentum likely to slow later this year, investors who are maximally overweight risk should pare back cyclical exposure. Go Short Bitcoin We warned that “Bitcoin is on a collision course with ESG” two weeks ago in a report entitled “How To Short Bitcoin, Or Anything Else, Without Losing Your Shorts.” Elon Musk’s flip-flop on allowing Tesla customers to pay for Teslas in Bitcoin is yet another piece of evidence that ESG concerns will win out. News that Colonial Pipeline paid hackers 75 bitcoin (nearly $5 million) in ransom further cements Bitcoin’s status as the currency of choice for criminals around the world. With all that in mind, we are going short Bitcoin as of midnight Eastern Daylight Time (EDT) using the shorting technique described in that report. The technique flips the usual risk-reward from shorting on its head. Normally, when you short a stock, your gain is capped at 100% of the initial position whereas your potential loss is unlimited. With our shorting technique, your potential loss is capped at 100% while your potential gain is unlimited. This makes shorting as an investment strategy a lot safer. APPENDIX The Economic Cycle And Financial Assets APPENDIX CHART 1A
Peak Growth And A Whiff Of Stagflation
Peak Growth And A Whiff Of Stagflation
APPENDIX CHART 1B
Peak Growth And A Whiff Of Stagflation
Peak Growth And A Whiff Of Stagflation
Appendix Chart 1C
Peak Growth And A Whiff Of Stagflation
Peak Growth And A Whiff Of Stagflation
Appendix Chart 1D
Peak Growth And A Whiff Of Stagflation
Peak Growth And A Whiff Of Stagflation
Peter Berezin Chief Global Strategist pberezin@bcaresearch.com Global Investment Strategy View Matrix
Peak Growth And A Whiff Of Stagflation
Peak Growth And A Whiff Of Stagflation
Special Trade Recommendations
Peak Growth And A Whiff Of Stagflation
Peak Growth And A Whiff Of Stagflation
Current MacroQuant Model Scores
Peak Growth And A Whiff Of Stagflation
Peak Growth And A Whiff Of Stagflation
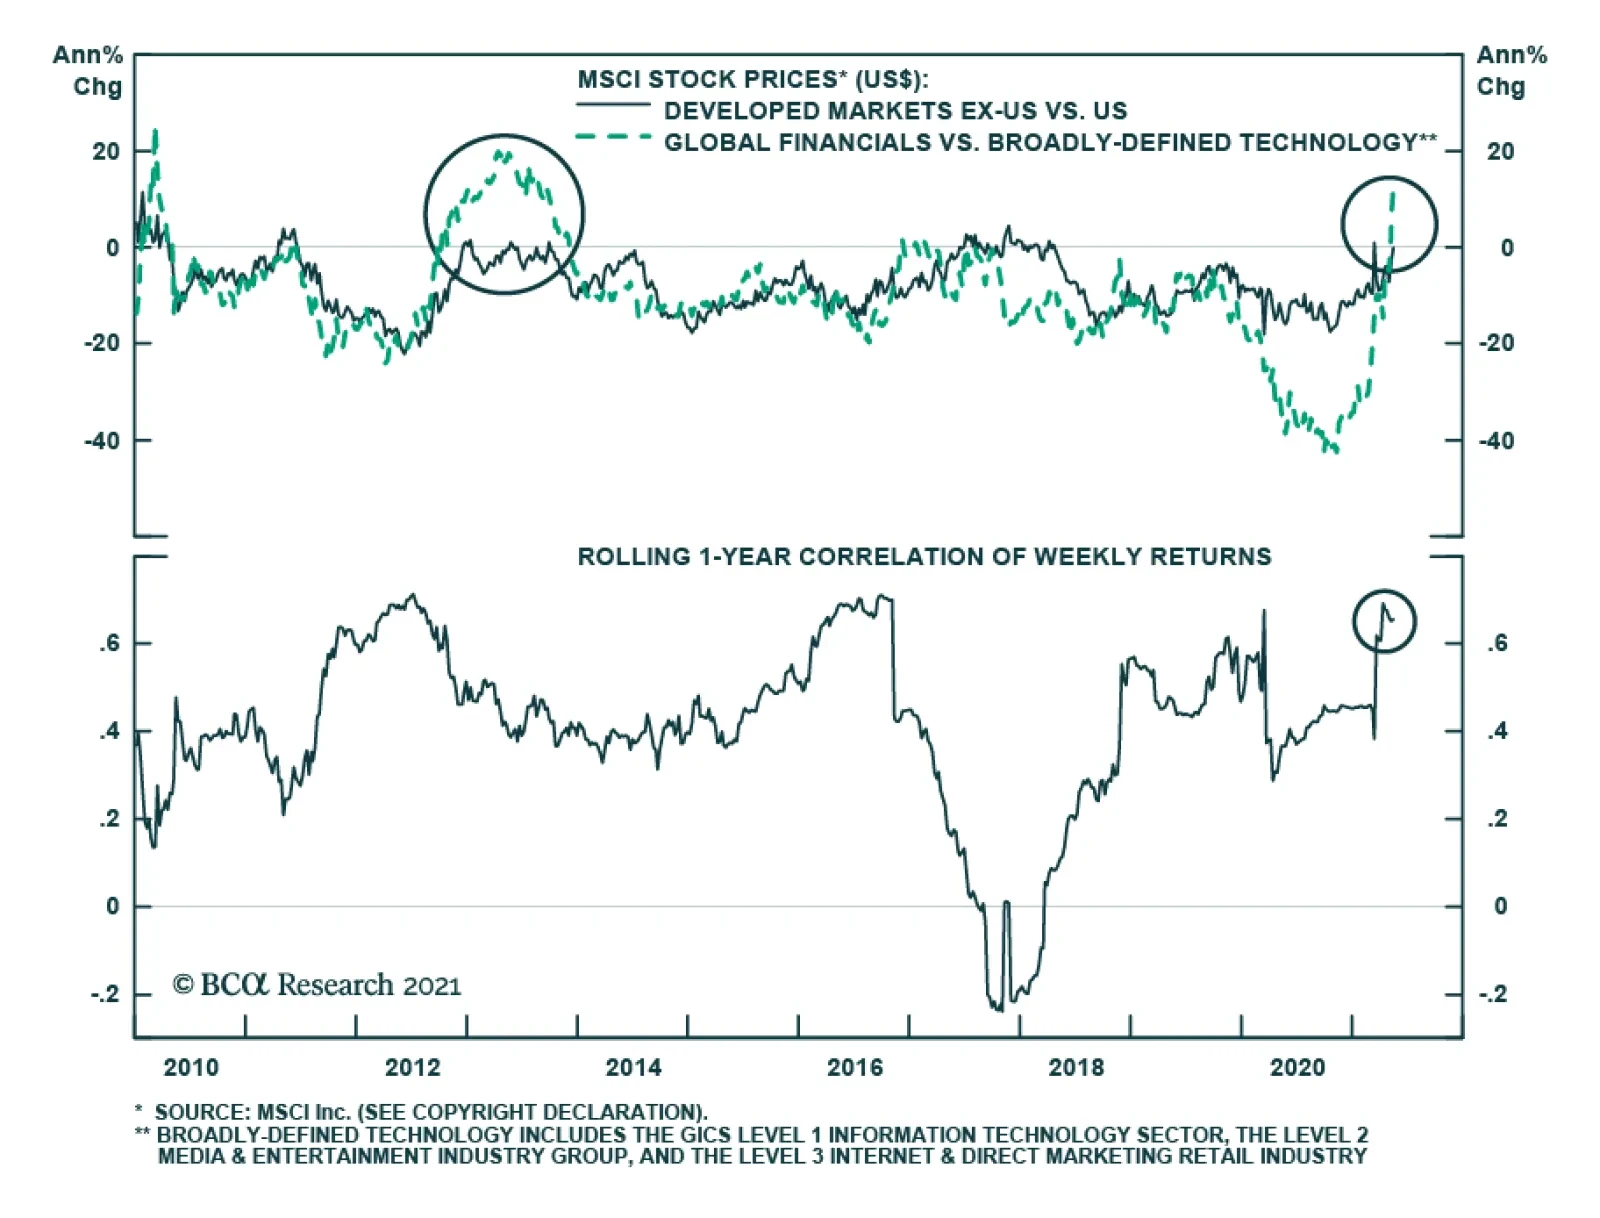
We noted in a previous Insight that regional equity allocation cannot always be derived from style and sector exposure. For example, we showed that global growth has underperformed value on a year-to-date basis, but that the tech-heavy US index had modestly…
Highlights Over the 2021-22 period, renewable capacity will account for 90% of global electricity-generation additions, per the IEA's latest forecast. This will follow the 45% surge (y/y) in renewable generation capacity added last year, which occurred despite the COVID-19 pandemic (Chart of the Week). Continued investment in renewables and EVs – along with a global economic rebound – are pushing forecasts at banks and trading companies to a $13k - $20k/MT range for copper, vs. ~ $10.6k/Mt (~ $4.80/lb) at present. Should these stronger metals forecasts prove out, investments that extend low-carbon use of fossil fuels via carbon-capture and circular-use technologies will become more attractive. Investment in these technologies has been limited because there is no explicit global reference price to assess investments against. A carbon market or tax would provide such a bogey and accelerate investment. It could be monitored via a Carbon Market Club, which would limit trade to states posting and collecting the tax.1 Feature At almost 280GW, renewable energy capacity additions last year increased 45% y/y, the most since 1999, according to the IEA's most recent update on renewable energy.2 For this year and next, renewables are expected to account for 90% of capacity additions, led by solar PV investment increasing ~ 50% to 162GW. Wind capacity grew 90% last year, increasing to 114GW, and is expected to increase ~ 50% to end-2022. As renewables generation – and EV investment – continues to grow, demand for bulks (steel and iron ore) and base metals, led by copper, will pull prices higher. This is occurring against a backdrop of flat supply growth and physical deficits over the four years ended 2020 (Chart 2). According to the IEA, a 40% increase in steel and copper prices over the September 2020 to March 2021 period played a role in higher solar PV module prices. Chart of the WeekRenewables Capacity Surges
Surging Metals Prices And The Case For Carbon-Capture
Surging Metals Prices And The Case For Carbon-Capture
The supply side of the copper market will remain in deficit this year and next, in our assessment, and may continue on that trajectory if, as Wood Mackenzie expects, demand grows at a 2% p.a. rate over the next 20 years and miners remain reluctant to commit to the capex required to keep up with demand.3 Chart 2Physical Deficits Will Draw Copper Stocks...
Physical Deficits Will Draw Copper Stocks...
Physical Deficits Will Draw Copper Stocks...
ESG risk for copper – and other metals required to build the generation and infrastructure required in the renewables buildout – will increase as prices rise, which also will add to cost.4 Cost increases coupled with increasing ESG risks in this buildout will increase the attractiveness of carbon-capture and circular-economy technology investment, in our view. This would extend the use of low-carbon fossil fuels if the technology can move the world closer to a net-zero carbon future. However, unless and until policy catalyzes this investment, – e.g., via a global carbon trading price or tax – investment in these technologies likely will continue to languish. Carbon-Capture Tech's Unfulfilled Promise The history of Carbon Capture, Utilization and Storage (CCUS) has been one of high hopes and unmet expectations. It is generally recognized as a route to mitigate climate change; however, its deployment has been slower than expected. Low-carbon technology requires more critical metals than its fossil-fuel counterpart (Chart 3). Apart from the issue of cost, the ESG risks of mining metals for the renewable energy transition will increase as more metals are demanded, which we discussed in previous research.5 According to Wood Mackenzie, mining companies will need to invest nearly $1.7 trillion in the next 15 years to help supply enough metals to transition to a low carbon world.6 Chart 3Low-Carbon Tech Is Metals Intensive
Surging Metals Prices And The Case For Carbon-Capture
Surging Metals Prices And The Case For Carbon-Capture
Given these looming physical requirements for metals, fossil fuels most likely will need to be used for longer than markets currently anticipate, as a bridge to the low-carbon future, or as part of that future, depending on how successfully carbon is removed from the hydrocarbons used to power modern society. If so, using fossil fuels while mitigating their environmental impact will require highly focused technology to lower CO2 and other green-house gas (GHG) emissions during the transition to a low-carbon future. Enter CCUS technology: This technology traps CO2 from sources that use fossil fuels or biomass to make the energy required to run modern societies. In the current iterations of this technology, CO2 can either be compressed and transported, or stored in geological or oceanic reservoirs. This can then be used for Enhanced Oil Recovery (EOR) to extract harder-to-reach oil by injecting CO2 into the reservoirs holding the hydrocarbons.7 The Scope For CCUS Investment CCUS investment spending is increasing, as are the number of planned facilities using or demonstrating this technology. In the 2020 edition of its Energy Technology Perspectives, the IEA noted 30 new integrated CCUS facilities have been announced since 2017, mostly in advanced economies such as US and Europe, but also in some EM nations. As of 2020, projects at advanced stages of planning represented a total of $27 billion, more than double the investment planned in 2017 (Chart 4). Among its many goals, the Paris Agreement seeks a balance between emissions by man-made sources and removal by greenhouse gas (GHGs) sinks (absorption of the gases) in the second half of the 21st century. Practically, many countries – especially EM economies – will still need to use fossil fuels to develop during this period (Chart 5).8 Chart 4Carbon-Capture Projects To Date
Surging Metals Prices And The Case For Carbon-Capture
Surging Metals Prices And The Case For Carbon-Capture
Chart 5EM Development Will Require Fossil-Fuel Energy
Surging Metals Prices And The Case For Carbon-Capture
Surging Metals Prices And The Case For Carbon-Capture
CCUS In The Energy Sector As a fuel that emits fewer GHGs than coal – i.e., half the CO2 of coal – natural gas can be used effectively as a bridge to green-power generation (Chart 6). Chart 6Natural Gas Will Remain Attractive As A Bridge Fuel
Surging Metals Prices And The Case For Carbon-Capture
Surging Metals Prices And The Case For Carbon-Capture
The CO2 in natgas needs to be removed before dry gas is sold as pipeline-quality gas or LNG. This CO2 is normally vented to the atmosphere; however, by using CCUS technology, it can be reinjected into geological formations and used for EOR. For this reason, LNG companies in the US, the world’s largest LNG exporter, have been looking into investing in CCUS technology in a bid to become greener.9 CCUS can also be used to produce low-cost hydrogen – so-called blue hydrogen – using natural gas and coal, as opposed to the more expensive electrolysis process, which uses renewables-based electricity to produce "green" hydrogen. The lower blue-hydrogen costs will make clean hydrogen more accessible to emerging nations, opening new avenues for the world to use the energy carrier in its decarbonization effort. The Value Of Ccus In Other Industries CCUS technology can be retrofitted to existing power and industrial plants, which, according to the IEA, could otherwise still emit 8 billion tons of CO2 in 2050, around one-quarter of annual energy-sector emissions in 2020. Of the fossil fuel generators, coal-fired power generation presents the biggest CO2 challenge, with most of the emissions coming from China and other EM Asia nations, where the average plant age is less than 20 years. Since the average age of a coal fired power plant is 40 years, according to the US National Association of Regulatory Commissioners, this implies that these plants have a long remaining life and could still be operating until 2050. CCUS is the only alternative to retiring or repurposing existing power and industrial plants. The IEA believes that CCUS is imperative to reach net-zero carbon emissions. In its Sustainable Development Scenario - in which global CO2 emissions from the energy sector decline to net-zero by 2070 – CCUS accounts for 15% of the cumulative reduction in emissions. If the world needs to reach net-zero by 2050 instead, it will need almost 50% more CCUS deployment.10 Properly implemented and scaled, CCUS can allow industries to continue using oil, gas and coal and to attain net-zero carbon emission targets, boosting demand for fossil fuels in the medium term. This is especially important to EM development. Why Aren’t We Further Along In CCUS? What Can Be Done? The main reason CCUS isn’t used more widely is because of its cost. Currently, the cost of capturing carbon varies, based on the amount of CO2 concentration, with Direct Air Capture being most expensive (Chart 7). Given the prohibitive costs, CCUS has not been commercially viable. However, the same argument could have been used against implementing renewable sources of energy. While at one point the Levelized Cost of Energy from renewable sources was high, as these sources have been scaled up – aided in no small part by government subsidies – costs have fallen, following something akin to a Moore’s Law cost-decay curve. A Levelized Cost of Energy for solar generation reported by Lazard Ltd., which allows for comparisons across technologies (e.g., fossil-fuel vs renewable), shows generation costs fell by 89% to $40/MWh from $359/MWh from 2009-2019 (Chart 8). This learning curve was able to take place because of government subsidies, which promoted the deployment of solar technology. Chart 7CCUS Can Be Expensive
Surging Metals Prices And The Case For Carbon-Capture
Surging Metals Prices And The Case For Carbon-Capture
Chart 8Subsides Could Support CCUS, Just As Was Done For Solar
Subsides Could Support CCUS, Just As Was Done For Solar
Subsides Could Support CCUS, Just As Was Done For Solar
The cost of CCUS technology is falling. For example, in 2019 the Global CCS Institute reported it cost $100/ton to capture carbon from the Canada-based Boundary Dam using a CCS unit built in 2014. The cost of carbon captured at the US-based Petra Nova plant – built three years later – using improved technology was $65/ton. Both are coal-powered electricity plants. The report also noted coal-fired power plants planning to commence operations in 2024-28 using the same CCS technology as those at Boundary Dam and Petra Nova expect carbon costs to be ~ $43/ton, due to steeper learning curves, research, lower capital costs due to economies of scale, and digitalization. One commonality amongst these sources of cost reductions is that companies need to invest more into CCUS and familiarize themselves with this technology. As was the case with renewables, government subsidies would reduce the prohibitive costs of operating CCUS technology, and draw more participation to refining this technology. Early, first-of-its-kind CCUS will be expensive, however subsidies in the form of capital support or tax credits will increase CCUS implementation and research. Boundary Dam and Petra Nova are examples of facilities that benefitted from government subsidies. The facilities received $170 million and $200 million respectively from Canadian and US Government agencies at the time of the CCS units’ construction. The US has also implemented a 45Q tax credit system which pays facilities $50/ton of CO2 stored and $35/ton of CO2 if it is used in applications like Enhanced Oil Recovery. According to the Global CCS Institute, in late-2019, of the eight new CCUS projects that were added in the US, four cited the presence of 45Q as the key driver. Putting Carbon Markets And Taxes To Work The EU’s Emissions Trading System (ETS) market, which was implemented in 2005, is an example of innovative policy which incentivizes companies to curb emissions, using market forces. The price of carbon measured in these markets puts a tangible value on a negative externality, which before this went unrecorded. The downside of this ETS is its reliance on the EU's environmental policy implementation, which is subject to policy changes that complicate supply-demand analysis for longer-term planning – e.g., the recent increase in its emissions target to a minimum of 55% net reduction in GHG emissions by 2030. An alternative to policy-driven trading of emissions rights is a per-ton tax on emissions, which governments would impose and collect. This would raise costs of technologies using fossil fuels – including those used in the mining industry to increase supply of critical bulks and base metals needed for the renewables transition. At the same time, such a tax would give firms supplying and using technologies that raise CO2 levels an incentive to lower CO2 output using CCUS technologies. ETS markets and governments imposing CO2 taxes could form Carbon Market Clubs – a technology developed by William Nordhaus, the 2018 Nobel Laureate in Economics – that restrict trading to states that can demonstrate their participation and support of actual carbon-reduction detailed in the Paris Agreement via trading or tax schemes.11 As the green energy transition gains traction and governments implement more net-zero emissions policies, the price of carbon will rise. As the price of carbon rises, the price tag associated with companies’ carbon emissions will increase with it. With market participants expecting the price of carbon to continue to rise after hitting record values, the incentive for companies operating in the EU to use CCUS technology will rise, as would the incentive for firms facing a carbon tax.12 Bottom Line: Given the meteoric price rise of green metals, underfunded capex, and the ESG risks associated with mining metals for the low carbon future, we expect fossil fuels to play a larger role in the transition to a low-carbon society than markets are currently expecting. For countries to be able to use fossil fuels while ensuring they achieve their climate goals, the use of CCUS technology is important. To increase CCUS uptake, governments will need to subsidize this technology until demand for it gains traction, just like in the case of renewables. Encouraging ETS and carbon-tax schemes also will be required to catalyze action. Robert P. Ryan Chief Commodity & Energy Strategist rryan@bcaresearch.com Ashwin Shyam Research Associate Commodity & Energy Strategy ashwin.shyam@bcaresearch.com Commodities Round-Up Energy: Bullish Brent prices were knocking against the $70/bbl door going to press, following the IEA's assessment of a robust demand recovery in 2H21 (Chart 9). The IEA took its 1H21 demand growth down 270k b/d, owing to COVID-19-induced demand destruction in India, OECD Americas and Europe, but left its 2H21 estimate intact, making overall demand growth for this year 5.4mm b/d. The EIA also expects 5.4mm b/d demand growth for this year, and growth of 3.7mm b/d next year. OPEC left its full-year 2021 demand growth estimate at 6mm b/d. OPEC 2.0 meets again on June 1 and will look to return more of its sidelined production to the market, in our estimation. We will be updating our supply-demand balances and price forecasts in next week's report. Base Metals: Bullish Spot copper prices traded on either side of $4.80/lb on the CME/COMEX market this week as we went to press. Threats of a tax increase in Chile, where a bill calling for such a measure is making its way through Congress; a potential strike by mine workers; and a shortage of sulfuric acid used in the extraction of ore brought about, according to Bloomberg, by reduced global sulfur supplies due to lower refinery runs during the pandemic all are keeping copper well bid. Our target for Dec21 COMEX copper remains $5/lb (~ $11k/ton on the LME). We remain long calendar 2022 COMEX copper vs short 2023 COMEX copper expecting physical supply deficits to continue to force storage draws, which will backwardate the metal's forward curve. Precious Metals: Bullish US CPI data on Wednesday showed that headline inflation rose by 4.2% for the month of April compared to the previous year. While this increase is the highest since 2008, this jump could also be fueled by a low base effect – Inflation levels were falling this time last year as the pandemic picked up. While rising prices increases demand for gold as an inflation hedge, if the Federal Reserve increases interest rates on the back of this data, the US dollar will rise, negatively affecting gold prices (Chart 10). However, we do not expect the Fed to abruptly change its guidance on this report, and therefore expect the central bank will treat this blip as transitory. As of yesterday’s close, COMEX gold was trading at $1,835.9/oz. Ags/Softs: Neutral Going to press, the Chicago soybean market was surging ahead of the scheduled World Agriculture Supply and Demand Estimates (WASDE) report due out later Wednesday. Front-month beans were trading ~ $16.70/bu, up 2% on the day. This month's WASDE will contain the USDA's first estimate for demand in ag markets for the 2021/22 crop year. Markets are expecting supplies to tighten as demand strengthens. Chart 9
Brent Prices Going Up
Brent Prices Going Up
Chart 10
Covid Uncertainty Could Push Up Gold Demand
Covid Uncertainty Could Push Up Gold Demand
Footnotes 1 Please see Carbon Market Clubs and the New Paris Regime published by the World Bank in July 2016. The intellectual and computational framework for such technology was developed by William Nordhaus, the 2018 Nobel Laureate in Economics. 2 Please see Renewable Energy Market Update, Outlook for 2021 and 2022.pdf, published by the IEA this week. 3 WoodMac notes, "without additional substantial investment, production will decline from 2024 onwards. Coupled with demand growth, this decline in output will lead to a theoretical shortfall of around 16 Mt by 2040." The consultancy estimates an additional $325 - $500+ billion will be needed to meet copper demand over this period. Please see Will a lack of supply growth come back to bite the copper industry? Published 23 March 2021 by woodmac.com. 4 Please see Renewables ESG Risks Grow With Demand, which we published 29 April 2021. It is available at ces.bcaresearch.com. 5 Refer to footnote 4. 6 Please see Low carbon world needs $1.7 trillion in mining investment, published by Reuters. 7 This method is used to increase oil production. It changes the properties of the hydrocarbons, restores formation pressure and enhances oil displacement in the reservoir. Using EOR, oil companies can recover 30% to 60% of the original oil level in the reservoir. Please see Enhanced Oil Recovery published by the US Department of Energy. 8 Please see the Reuter’s column CO2 emission limits and economic development. 9 Please see World Oil’s U.S. LNG players tout carbon capture in bid to boost green image. 10 Please see IEA’s Special Report on Carbon Capture Utilisation and Storage, published as a part of the Energy Technology Perspective 2020. 11 See footnote 1 above. 12 Please see Cost of polluting in EU soars as carbon price hits record €50 by the Financial Times. Investment Views and Themes Strategic Recommendations Tactical Trades Commodity Prices and Plays Reference Table Trades Closed in 2021 Summary of Closed Trades
Higher Inflation On The Way
Higher Inflation On The Way
BCA Research’s Global Fixed Income Strategy service concludes that the Federal Reserve will not be the next central bank to taper the pace of bond buying. The team recently assessed the most important factors that could drive central banks to consider a…
The German ZEW survey for May sent a positive message for the Euro Area recovery. Even though Germany’s current situation component remains in negative territory, it rose 8.7 points from the April reading. More notably, the economic expectations component…