Global
The Group of Seven meeting in the UK on June 11-13 highlighted the rhetorical shift among western democracies as they attempt to recover their political support in the wake of the global pandemic and recession. The joint communique highlighted four areas…
Where should you invest your money for the long term? This is a question that many investors struggle to answer in today’s environment. Low interest rates have made valuations unattractive in almost all traditional asset classes and, while valuations hold low…

Dear Client, Last week, I had the pleasure of participating in a debate with my colleague, Dhaval Joshi, on the future of cryptocurrencies. You can access a replay of the event here. Best regards, Peter Berezin Highlights The meme stock mania is unlikely to die down anytime soon. Fueled by zero-commission trading and an anti-establishment mindset, social media has given millions of retail traders the ability to coordinate attacks on individual companies. An examination of the most popular meme stocks reveals that returns were highest when both the closing price and volume during the prior day’s session were above their moving averages. For GameStop and AMC, in particular, returns averaged 11.0% and 13.9%, respectively, when both the prior day’s closing price and volume were above their 5-day moving averages, compared with -4.0% and -1.3%, respectively, when the price and volume were below their 5-day moving averages. Nearly 80% of the returns on meme stocks were earned overnight (i.e., between the close of trading and the following day’s open). The ups and downs of meme stocks have generally had little impact on the overall direction of the stock market. Nevertheless, growing interest in meme stocks is positive for equities over a medium-term horizon of about 12 months. This is because the meme stock phenomenon is drawing funds into the stock market, boosting prices and liquidity in the process. #HedgiesGetWedgies Chart 1Word Du Jour: Meme
Word Du Jour: Meme
Word Du Jour: Meme
This January, the term “meme stock” entered the popular lexicon (Chart 1). That was the month that GameStop and a handful of other once-left-for-dead stocks soared to dizzying heights. Armed with stimulus checks, millions of amateur investors flocked to one of the few sources of entertainment still available to them: online trading. Tales of instant riches spread like wildfire, motivating yet more new investors to enter the fray. Whether it was stocks or cryptos, the allure of easy money was irresistible. The decision by most American brokerages to eliminate trading commissions in the fall of 2019 added fuel to the fire. Meanwhile, the proliferation of social media provided a ready-made mechanism for retail traders to coordinate attacks on individual stocks. And attack they did. Most of the companies targeted had high short interest, making them ripe for a short squeeze. The implosion of Melvin Capital demonstrated to the Reddit crowd that they, too, could beat hedge funds at their own game. “We can remain stupid longer than you can stay solvent” became their rallying cry. In a game of chicken, being perceived by your opponent as irrational boosts your odds of winning. Trading Meme Stocks For Fun And Profit If one were so inclined, how should one trade meme stocks? It helps to begin with some data. Table 1 displays average daily returns from the start of 2021 for six popular meme stocks: GameStop (GME), AMC Entertainment (AMC), Blackberry (BB), Nokia (NOK), Bed Bath & Beyond (BBBY) and Koss Corp (KOSS). A few observations stand out: There is strong price momentum. Looking across all six stocks, the average daily return was 5.9% when the prior day’s closing price was above its 5-day moving average, compared to 0.3% when the prior day’s close was below its 5-day moving average. The average daily return for stocks in our sample was 3.3%. Volatility predicts higher returns. Meme stocks gained 4.3%, on average, when the prior day’s return was positive compared to 2.4% when it was negative. Looking only at the subset of cases where the prior day’s return was either above 10% or below -10%, we find that meme stocks gained 11.3% when the price rose more than 10% during the prior day and gained a still-robust 7.5% when the price dropped more than 10% during the prior day. Strong volume predicts higher returns. Consistent with the volatility observation, meme stocks gained an average of 6.1% when the volume in the prior day’s trading session was above its 5-day moving average, compared to just 1.3% when the volume was below its 5-day moving average. Meme stocks do best after the close of trading. Nearly 80% of returns on meme stocks were earned overnight (i.e., between the close of trading and the following day’s open). We attribute this phenomenon to the tendency of many traders to exit positions before the closing bell and reopen them at the start of trading the following day. Such a pattern of selling and repurchasing tends to boost overnight returns. Historically, a similar pattern has held for most other US stocks (Chart 2). Table 1Meme Stock: Returns And Patterns
To The Moon: How To Trade Meme Stocks
To The Moon: How To Trade Meme Stocks
Chart 2Bear By Day, Bull By Night
To The Moon: How To Trade Meme Stocks
To The Moon: How To Trade Meme Stocks
In summary, meme stocks perform best when they are trading above their 5-day moving average. Both volatility and strong volume predict positive returns. Holding (hodling?)1 meme stocks overnight can significantly enhance returns. Be An Ape Chart 3The BUZZ ETF Is Off To A Lackluster Start
The BUZZ ETF Is Off To A Lackluster Start
The BUZZ ETF Is Off To A Lackluster Start
Fans of AMC often refer to themselves as “apes.” The moniker is fitting, if not ironic, given the tendency of meme investors to ape one another in their trading decisions. The VanEck Vectors Social Sentiment ETF (BUZZ) tries to get in front of the apes and other meme investors by buying stocks that are garnering increasing attention from social media, news articles, blog posts, and other sources. While it is too early to assess the value of this approach, it should be noted that the fund has lagged the S&P 500 for most of the time since its inception in March (Chart 3). A potentially more fruitful approach, and one that I myself have adopted, is to seek out meme stocks before they become meme stocks. For example, Cinemark (CNK) is the second biggest publicly-listed movie theater chain in the US. The share of its float sold short is almost identical to AMC’s. Yet, the Reddit crowd has largely ignored it. Could that change? Only time will tell. Don’t Get A Wedgie: How To Short Meme Stocks Safely While meme stocks can benefit from positive price momentum in the short term, it is at the expense of lower returns down the road. By any reasonable measure, the leading meme stocks are grossly overvalued. Knowing when a meme stock will fall back to earth is no easy task, however. The discussion in this report provides one avenue for short-term traders to mitigate risk: Short meme stocks only when price and volume are trending lower. The average daily return for GME and AMC was 11.0% and 13.9%, respectively, when both the prior day’s closing price and volume were above their 5-day moving averages, compared with -4.0% and -1.3%, respectively, when the price and volume were below their 5-day moving averages. With that in mind, we are opening a new tactical trade going short an equally-weighted basket of AMC and GME. The trade will only be active when the prior day’s closing price and volume are below their 5-day moving averages.2 Longer-term investors looking to short meme stocks without having to frequently open and close positions should consider using the “exponential” shorting technique discussed in a recent report. The technique flips the usual risk-reward trade-off from going short on its head. Rather than facing unlimited losses and a maximum gain of only 100% of the initial position, our shorting strategy caps the loss at 100% but allows for unlimited gains. Broad Market Implications As Chart 4 illustrates, the ups and downs of meme stocks have generally had little impact on the overall direction of the stock market. Nevertheless, growing interest in meme stocks is positive for equities over a medium-term horizon of about 12 months. This is because the meme stock phenomenon is drawing funds into the stock market, boosting prices and liquidity in the process. Chart 4Meme Stock Roller-Coaster: Little Impact On The Broader Market
Meme Stock Roller-Coaster: Little Impact On The Broader Market
Meme Stock Roller-Coaster: Little Impact On The Broader Market
Chart 5Global Equity Risk Premium Remains Quite High
Global Equity Risk Premium Remains Quite High
Global Equity Risk Premium Remains Quite High
While the “stimmy” checks have already been deposited into brokerage accounts, their impact on the stock market will linger on. As we explained in Savings Gluts, Asset Shortages, And The 60/40 Split, retail investors who bid up the price of stocks will generally force institutional investors to sell their holdings.3 This will leave institutions with excess cash on hand – cash that they can deploy in other parts of the stock market. The resulting game of “hot potato” will only end when the value of the stock market rises by enough to ensure that all investors are happy with how much stock they own in relation to how much cash they hold. Given that the equity risk premium remains quite high, this dynamic likely has further to run (Chart 5). Disclosure: At the time of writing, I am personally long CNK and short AMC and GME. I previously held a short position in KOSS. Peter Berezin Chief Global Strategist pberezin@bcaresearch.com Footnotes 1 HODL stands for “Hold On for Dear Life”. The term is widely used by traders on Wallstreetbets and other online forums. 2 The equal-weighted trade should be initiated if the conditions are met for either stock (GME, AMC) in the basket. The conditions are as follows: Both the price and volume should be below their 5-day moving average. The price and volume at the end of the day determine whether one enters the trade the next day or not. 3 An exception is when retail investors buy stock from the company itself, as has happened several times with meme stocks. Global Investment Strategy View Matrix
To The Moon: How To Trade Meme Stocks
To The Moon: How To Trade Meme Stocks
Special Trade Recommendations
To The Moon: How To Trade Meme Stocks
To The Moon: How To Trade Meme Stocks
Current MacroQuant Model Scores
To The Moon: How To Trade Meme Stocks
To The Moon: How To Trade Meme Stocks
Highlights US labor-market disappointments notwithstanding, the global recovery being propelled by real GDP growth in the world's major economies is on track to be the strongest in 80 years. This growth will fuel commodity demand, which increasingly confronts tighter supply. Higher commodity prices will ensue, and feed through to realized and expected inflation. Manufacturers will continue to see higher input and output prices. Our modeling suggests the USD will weaken to end-2023; however, most of the move already has occurred. Real US rates will remain subdued, as the Fed looks through PCE inflation rates above its 2% target and continues to focus on its full-employment mandate (Chart of the Week). Given these supportive inflation fundamentals, we remain long gold with a price target of $2,000/oz for this year. We are upgrading silver to a strategic position, expecting a $30/oz price by year-end. We remain long the S&P GSCI Dynamic Roll Index ETF (COMT) and the S&P GSCI, expecting tight supply-demand balances to steepen backwardations in forward curves, and long the Global Metals & Mining Producers ETF (PICK). Global economic policy uncertainty will remain elevated until broader vaccine distributions reduce lockdown risks. Feature The recovery of the global economy catalyzed by massive monetary accommodation and fiscal stimulus is on track to be the strongest in the past 80 years, according to the World Bank.1 The Bank revised its growth expectation for real GDP this year sharply higher – to 5.6% from its January estimate of 4.1%. For 2022, the rate of global real GDP growth is expected to slow to 4.3%, which is still significantly higher than the average 3% growth of 2018-19. DM economies are expected to grow at a 4% rate this year – double the average 2018-19 rate – while EM growth is expected to come in at 6% this year vs a 4.2% average for 2018-19. The big drivers of growth this year will be China, where the Bank expects an unleashing of pent-up demand to push real GDP up by 8.5%, and the US, where massive fiscal and monetary support will lift real GDP 6.8%. The Bank expects other DM economies will contribute to this growth, as well. Growth in EM economies will be supported by stronger demand and higher commodity prices, in the Bank's forecast. Commodity demand is recovering faster than commodity supply in the wake of this big-economy GDP recovery. As a result, manufacturers globally are seeing significant increases in input and output prices (Chart 2). Chart of the WeekUS Real Rates Continue To Languish
Gold, Silver, Indexes Favored As Inflation Looms
Gold, Silver, Indexes Favored As Inflation Looms
Chart 2Global Manufacturers' Prices Moving Higher
Gold, Silver, Indexes Favored As Inflation Looms
Gold, Silver, Indexes Favored As Inflation Looms
These price increases at the manufacturing level reflect the higher-price environment in global commodity markets, particularly in industrial commodities – i.e., bulks like iron ore and steel; base metals like copper and aluminum; and oil prices, which touch most processes involved in getting materials out of the ground and into factories before they make their way to consumers, who then drive to stores to pick up goods or have them delivered. Chart 3Commodity Price Increases Reflected in CPI Inflation Expectations
Commodity Price Increases Reflected in CPI Inflation Expectations
Commodity Price Increases Reflected in CPI Inflation Expectations
These price pressures are being picked up in 5y5y CPI swaps markets, which are cointegrated with commodity prices (Chart 3). This also is showing up in shorter-tenor inflation gauges – monthly CPI and 2y CPI swaps. Oil prices, in particular, will be critical to the evolution of 5-year/5-year (5y5y) CPI swap rates, which are closely followed by fixed-income markets (Chart 4). Chart 4Oil Prices Are Key To 5Y5Y CPI Swap Rates
Oil Prices Are Key To 5Y5Y CPI Swap Rates
Oil Prices Are Key To 5Y5Y CPI Swap Rates
Higher Gold Prices Expected CPI inflation expectations drive 5-year and 10-year real rates, which are important explanatory variables for gold prices (Chart 5).2 In addition, the massive monetary and fiscal policy out of the US also is driving expectations for a lower USD: Currency debasement fears are higher than they otherwise would be, given all the liquidity and stimulus sloshing around global markets, which also is bullish for gold (Chart 6). Chart 5Weaker Real Rates Bullish For Gold
Weaker Real Rates Bullish For Gold
Weaker Real Rates Bullish For Gold
Chart 6Weaker USD Supports Gold
Weaker USD Supports Gold
Weaker USD Supports Gold
All of these effects, particularly the inflationary impacts, are summarized in our fair-value gold model (Chart 7). At the beginning of 2021, our fair-value gold model indicated price would be closer to $2,005/oz, which was well above the actual gold price in January. Gold prices have remained below the fair value model since the beginning of 2021. The model explains gold prices using real rates, TWIB, US CPI and global economic policy uncertainty. Based on our modeling, we expect these variables to continue to be supportive of gold, bolstering our view the yellow metal will reach $2000/ oz this year. Unlike industrial commodities, gold prices are sensitive to speculative positioning and technical indicators. Our gold composite indicator shows that gold prices may be reflecting bullish sentiment. This sentiment likely reflects increasing inflation expectations, which we use as an explanatory variable for gold prices. The fact that gold is moving higher on sentiment is corroborated by the latest data point from Marketvane’s gold bullish consensus, which reported 72% of the traders expect prices to rise further (Chart 8). Chart 7BCAs Gold Fair-Value Model Supports 00/oz View
BCAs Gold Fair-Value Model Supports $2000/oz View
BCAs Gold Fair-Value Model Supports $2000/oz View
Chart 8Sentiment Supports Oil Prices
Sentiment Supports Oil Prices
Sentiment Supports Oil Prices
Investment Implications The massive monetary and fiscal stimulus that saw the global economy through the worst of the economic devastation of the COVID-19 pandemic is now bubbling through the real economy, and will, if the World Bank's assessment proves out, result in the strongest real GDP growth in 80 years. Liquidity remains abundant and interest rates – real and nominal – remain low. In its latest Global Economic Prospects, the Bank notes, " The literature generally suggests that monetary easing, both conventional and unconventional, typically boosts aggregate demand and inflation with a lag of 1-3 years …" The evidence for this is stronger for DM economies than EM; however, as the experience in China shows, scale matters. If the Bank's assessment is correct, the inflationary impulse from this stimulus should be apparent now – and it is – and will endure for another year or two. This stimulus has catalyzed organic growth and will continue to do so for years, particularly in economies pouring massive resources into renewable-energy generation and the infrastructure required to support it, a topic we have been writing about for some time.3 We remain long gold with a price target of $2,000/oz for this year. We are long silver on a tactical basis, but given our growth expectations, are upgrading this to a strategic position, expecting a $30/oz price by year-end. As we have noted in the past, silver is sensitive to all of the financial factors we consider when assessing gold markets, and it has a strong industrial component that accounts for more than half of its demand.4 Supportive fundamentals remain in place, with total supply (mine output and recycling) falling, demand rising and balances tightening (Chart 9). Worth noting is silver's supply is constrained because of underinvestment in copper production at the mine level, where silver is a by-product. On the demand side, continued recovery of industrial and consumer demand will keep silver prices well supported. In terms of broad commodity exposure, we remain long the S&P GSCI Dynamic Roll Index ETF (COMT) and the S&P GSCI, expecting tight supply-demand balances to continue to draw down inventories – particularly in energy and metals markets – which will lead to steeper backwardations in forward curves. Backwardation is the source of roll-yields for long commodity index investments. Investors initially have a long exposure in deferred commodity futures contracts, which are then liquidated and re-established when these contracts become more prompt (i.e., closer to delivery). If the futures' forward curves are backwardated, investors essentially are buying the deferred contracts at a lower price than the price at which the position likely is liquidated. We also remain long the Global Metals & Mining Producers ETF (PICK), an equity vehicle that spans miners and traders; the longer discounting horizon of equity markets suits our view on metals. Chart 9Upgrading Silver To Strategic Position
Gold, Silver, Indexes Favored As Inflation Looms
Gold, Silver, Indexes Favored As Inflation Looms
Chart 10Wider Vaccine Distribution Will Support Gold Demand
Gold, Silver, Indexes Favored As Inflation Looms
Gold, Silver, Indexes Favored As Inflation Looms
Global economic policy uncertainty will remain elevated until broader vaccine distributions reduce lockdown risks. We expect the wider distribution of vaccines will become increasingly apparent during 2H21 and in 2022. This will be bullish for physical gold demand – particularly in China and India – which will add support for our gold position (Chart 10). Robert P. Ryan Chief Commodity & Energy Strategist rryan@bcaresearch.com Ashwin Shyam Research Associate Commodity & Energy Strategy ashwin.shyam@bcaresearch.com Commodities Round-Up Energy: Bullish The US EIA expects Brent crude oil prices to fall to $60/bbl next year, given its call higher production from OPEC 2.0 and the US shales will outpace demand growth. The EIA expects global oil demand will average just under 98mm this year, or 5.4mm b/d above 2020 levels. For next year, the EIA is forecasting demand will grow 3.6mm b/d, averaging 101.3mm b/d. This is slightly less than the demand growth we expect next year – 101.65mm b/d. We are expecting 2022 Brent prices to average $73/bbl, and $78/bbl in 2023. We will be updating our oil balances and price forecasts in next week's publication. Base Metals: Bullish Pedro Castillo, the socialist candidate in Peru's presidential election, held on to a razor-thin lead in balloting as we went to press. Markets have been focused on the outcome of this election, as Castillo has campaigned on increasing taxes and royalties for mining companies operating in Peru, which accounts for ~10% of global copper production. The election results are likely to be contested by opposition candidate rival Keiko Fujimori, who has made unsubstantiated claims of fraud, according to reuters.com. Copper prices traded on either side of $4.50/lb on the CME/COMEX market as the election drama was unfolding (Chart 11). Precious Metals: Bullish As economies around the world reopen and growth rebounds, car manufacturing will revive. Stricter emissions regulations mean the demand for autocatalysts – hence platinum and palladium – will rise with the recovery in automobile production. Platinum is also used in the production of green hydrogen, making it an important metal for the shift to renewable energy. On the supply side, most platinum shafts in South Africa are back to pre-COVID-19 levels, according to Johnson Matthey, the metals refiner. As a result, supply from the world’s largest platinum producer will rebound by 40%, resulting in a surplus. South Africa accounts for ~ 70% of global platinum supply. The fact that an overwhelming majority of platinum comes from a nation which has had periodic electricity outages – the most recent one occurring a little more than a week ago – could pose a supply-side risk to this metal. This could introduce upside volatility to prices (Chart 12). Ags/Softs: Neutral As of 6 June, 90% of the US corn crop had emerged vs a five-year average of 82%; 72% of the crop was reported to be in good to excellent condition vs 75% at this time last year. Chart 11
Political Risk in Chile and Peru Could Bolster Copper Prices
Political Risk in Chile and Peru Could Bolster Copper Prices
Chart 12
Platinum Prices Going Up
Platinum Prices Going Up
Footnotes 1 Please see World Bank's Global Economic Prospects update, published June 8, 2021. 2 In fact, US Treasury Inflation-Indexed securities include the CPI-U as a factor in yield determination. 3 For our latest installment of this epic evolution, please see A Perfect Energy Storm On The Way, which we published last week. It is available at ces.bcareserch.com. 4 Please see Higher Inflation Expectations Battle Lower Risk Premia In Gold Markets, which we published February 4, 2021. It is available at ces.bcareserch.com. Investment Views and Themes Strategic Recommendations Tactical Trades Commodity Prices and Plays Reference Table Trades Closed in 2021 Summary of Closed Trades
Higher Inflation On The Way
Higher Inflation On The Way
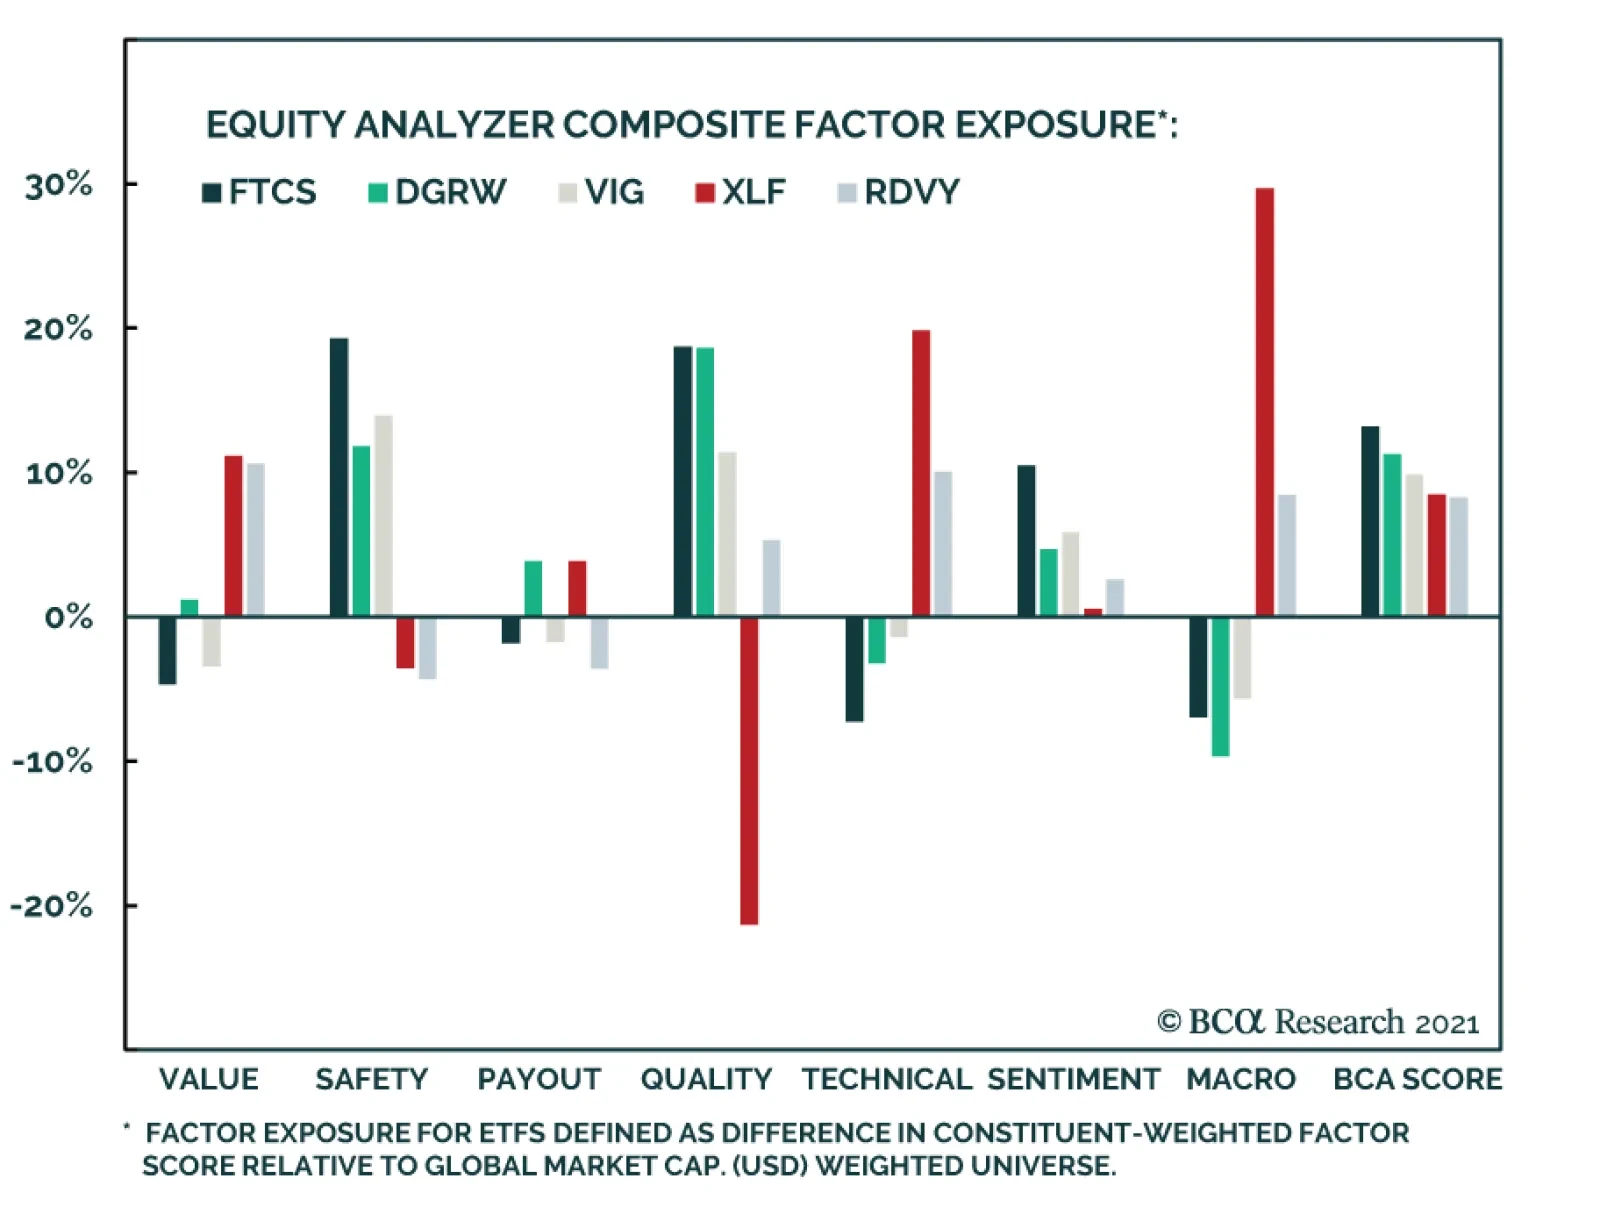
To capture emerging trends and uncover additional investment opportunities, our colleagues at BCA Research’s Equity Analyzer applied their factor scoring system to Exchange Traded Funds (ETFs). They have used this technique in the past to select the best…
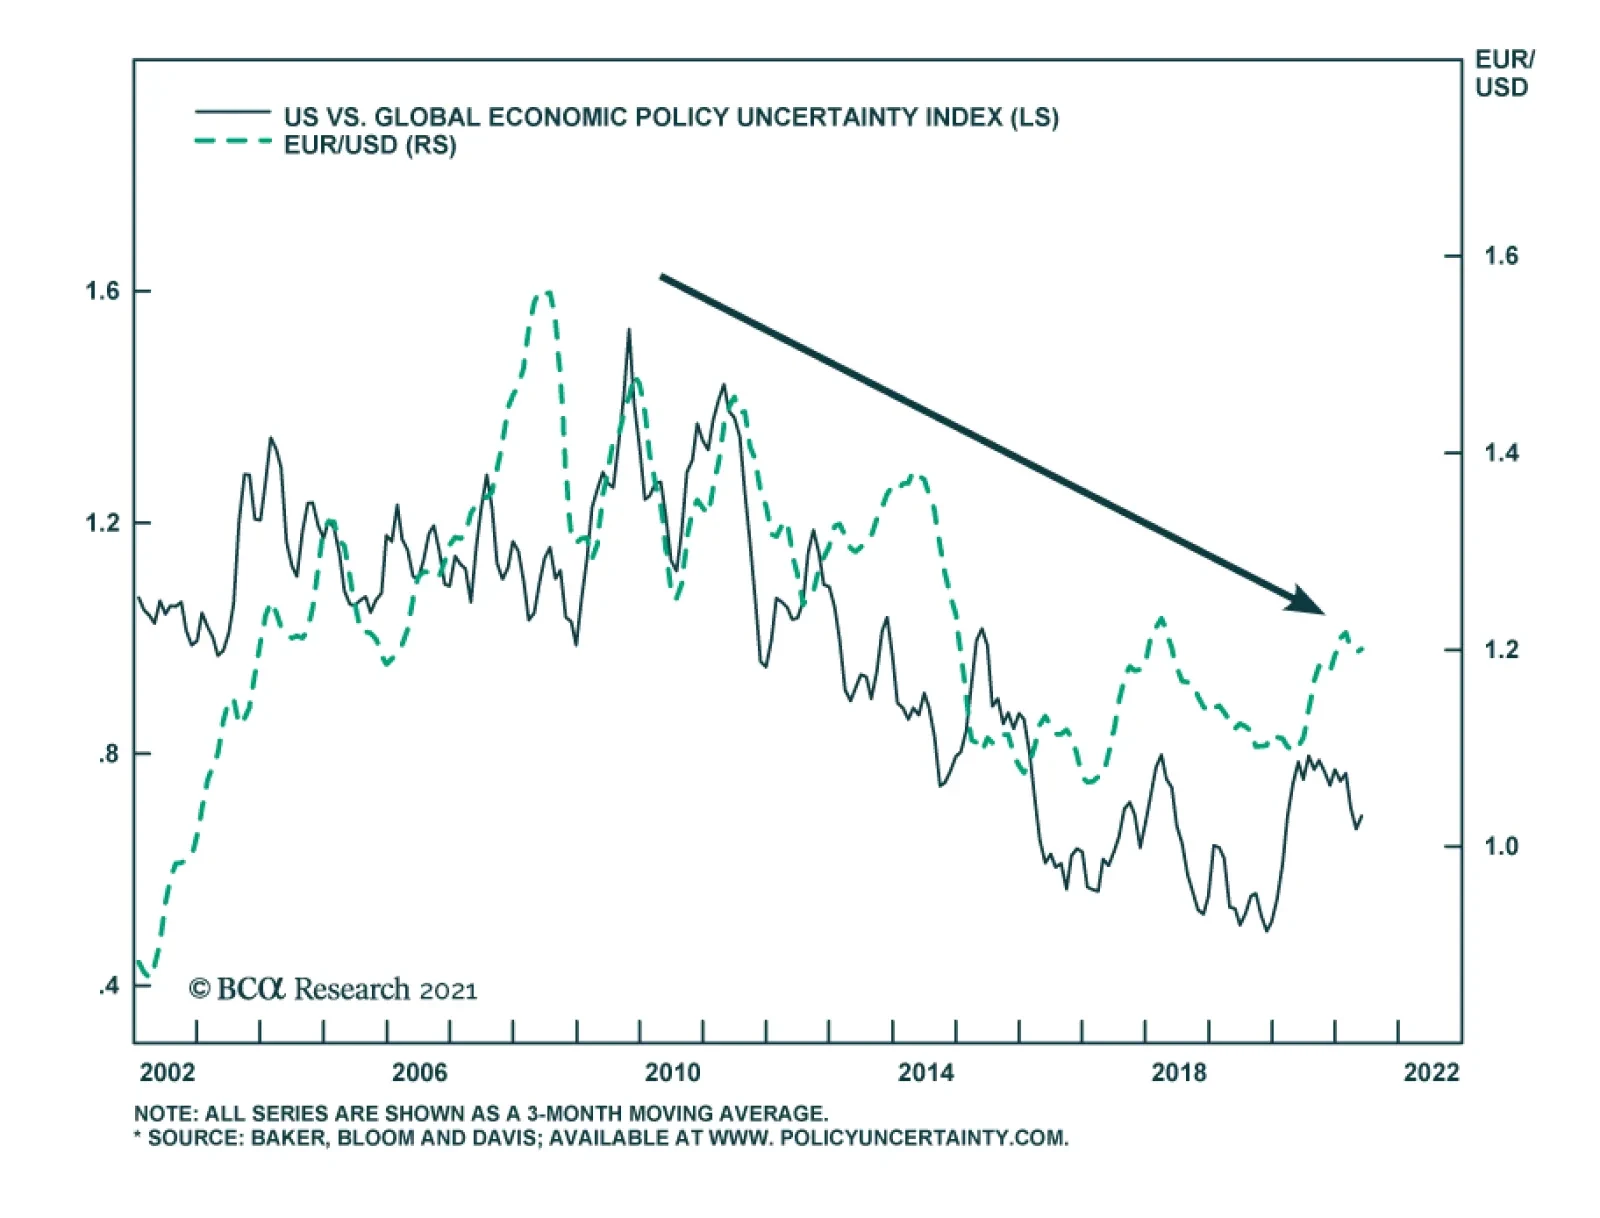
The Global Policy Uncertainty Index is falling sharply and is now at the lowest level since April 2019. The decline is consistent with positive global pandemic developments which are supporting economic recoveries worldwide. Receding uncertainty is negative…
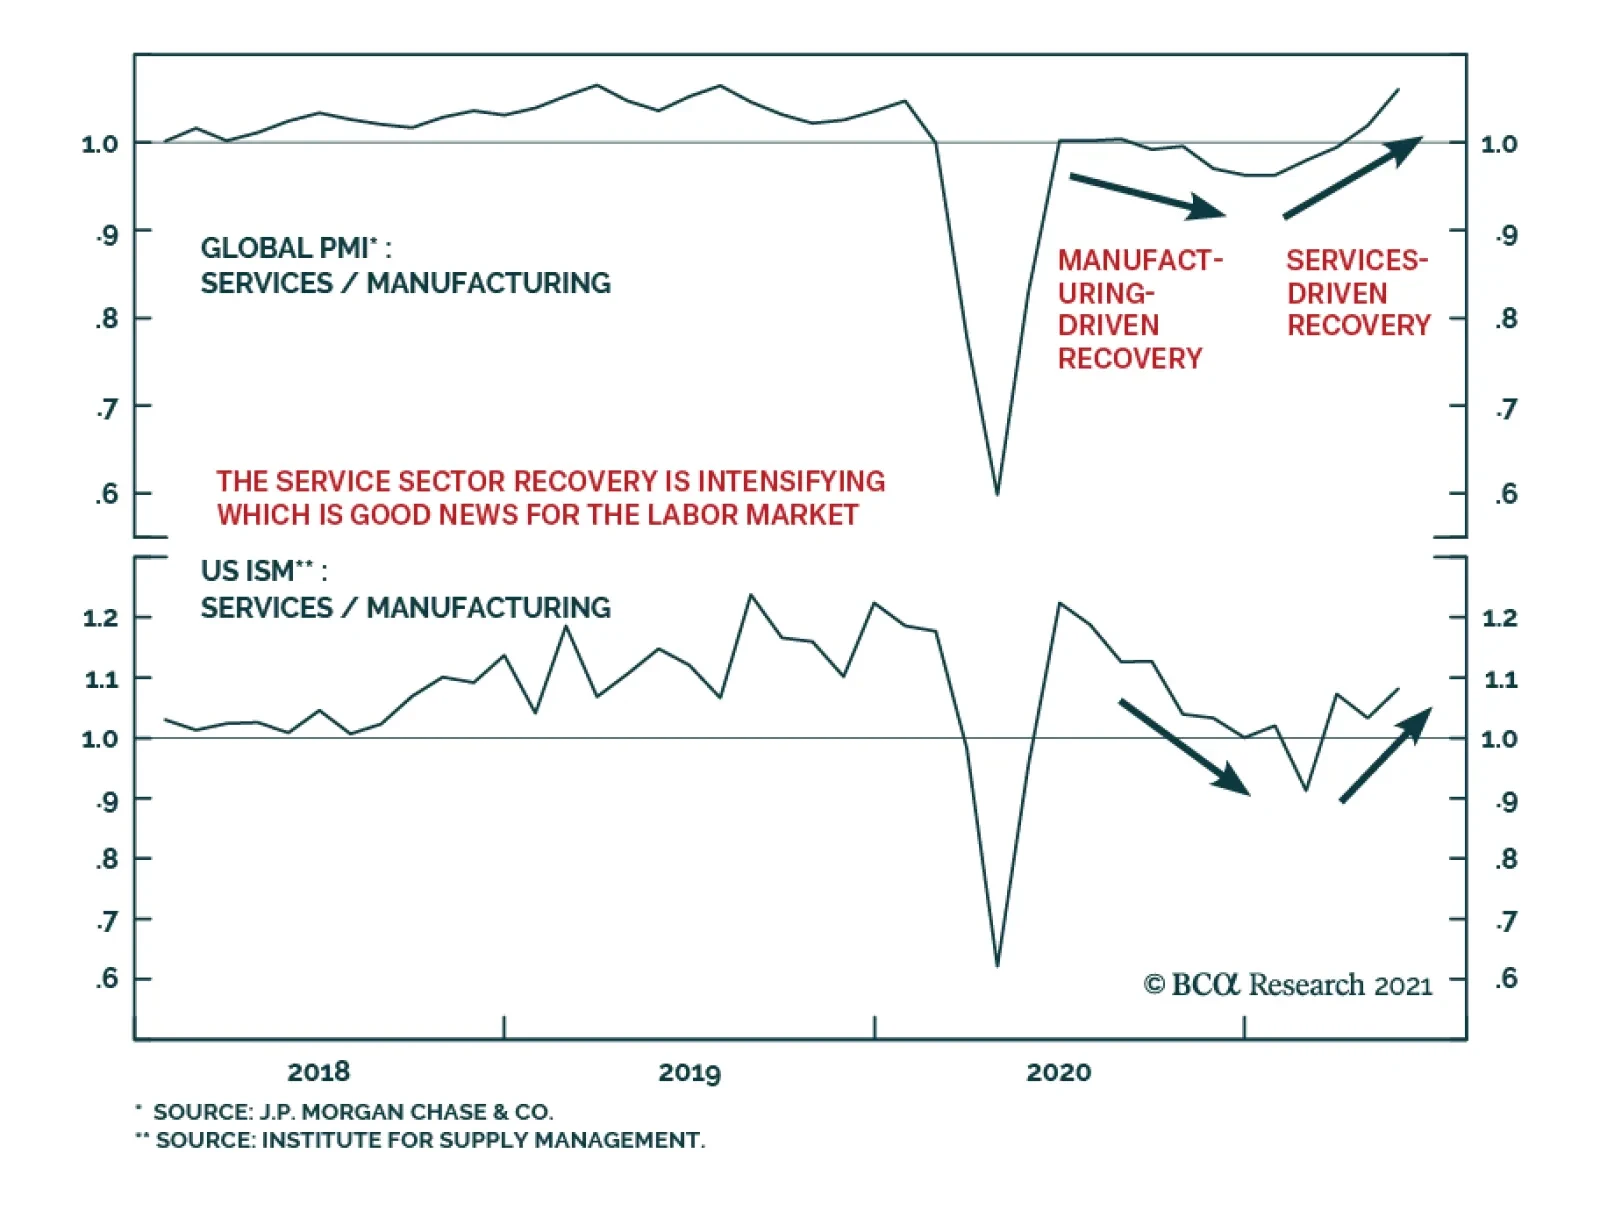
Services PMIs for May confirmed the message from the global manufacturing sector earlier this week that the global recovery is accelerating. The Global Services PMI jumped to 59.4 from 57.0 in April. Improvement in both the services and manufacturing sectors…
Highlights Political and corporate climate activism will increase the cost of developing the resources required to produce and deliver energy going forward – e.g., oil and gas wells; pipelines; copper mines, and refineries. Over the short run, the fastest way for investor-owned companies (IOCs) to address accelerated reductions in CO2 emissions imposed by courts and boards is to walk away from the assets producing them, which could be disruptive over the medium term. Longer term, state-owned companies (SOCs) not facing the constraints of IOCs likely will be required to provide an increasing share of the resources needed to produce and distribute energy. The real difficulty will come in the medium term. Capex for critical metals like copper languishes, just as the call on these metals steadily increases over the next 30 years (Chart of the Week). The evolution to a low-carbon future has not been thought through at the global policy level. A real strategy must address underinvestment in base metals and incentivize the development of technology via a carbon tax – not emissions trading schemes – so firms can innovate to avoid it. We remain long energy and metals exposures.1 Feature And you may ask yourself, "Well … how did I get here?" David Byrne, Once In A Lifetime Energy markets – broadly defined – are radically transforming from week to week. The latest iteration of these markets' evolution is catalyzed by climate activists, who are finding increasing success in court and on corporate boards – sometimes backed by major institutional investors – and forcing oil and gas producers to accelerate CO2 emission-reduction programs.2 Climate activists' arguments are finding increasing purchase because they have merit: Years of stiff-arming investors seeking clarity on the oil and gas producers' decarbonization agendas, coupled with a pronounced failure to provide returns in excess of their cost of capital, have given activists all of the ammo needed to argue their points. Chart of the WeekCall On Metals For Energy Will Increase
A Perfect Energy Storm On The Way
A Perfect Energy Storm On The Way
This activism is not limited to the courts or boardrooms. Voters in democratic societies with contested elections also are seeking redress for failures of their governments to effectively channel mineral wealth back into society on an equitable basis, and to protect their environments and the habitats of indigenous populations. This voter activism is especially apparent in Chile and Peru, where elections and constitutional conventions likely will result in higher taxes and royalties on metals IOCs operating in these states, which will increase production costs and ultimately be passed on to consumers.3 These states account for ~ 40% of world copper output. IOCs Walk Away Earlier this week, Exxon walked away from an early-stage offshore oil development project in Ghana.4 This followed the unfavorable court rulings and boardroom setbacks experienced by Royal Dutch Shell, Chevron and Exxon recently (referenced in fn. 2). While the company had no comment on its abrupt departure, its action shows how IOCs can exercise their option to put a project back to its host government, thus illustrating one of the most readily available alternatives for energy IOCs to meet court- or board-mandated CO2 emissions targets. If these investments qualify as write-offs, the burden will be borne by taxpayers. As climate activism increases, state-owned companies (SOCs) not facing the constraints of IOCs likely will be required to provide an increasing share of the resources – particularly oil and gas – needed to produce and distribute energy going forward. This is not an unalloyed benefit, as the SOCs still face stranded-asset risks, if they invest in longer-lived assets that are obviated by a successful renewables + grid buildout globally. That is a cost that will have to be compensated, when the SOCs work up their capex allocations. Still, if legal and investor activism significantly accelerates IOCs' capex reductions in oil and gas projects, the SOCs – particularly those in OPEC 2.0 – will be able to expand their position as the dominant supplier in the global oil market, and could perhaps increase their influence on price levels and forward-curve dynamics (Chart 2).5 Chart 2OPEC 2.0s Could Expand If Investor Activism Increases
OPEC 2.0s Could Expand If Investor Activism Increases
OPEC 2.0s Could Expand If Investor Activism Increases
Higher Call On Metals At present, there is a lot of talk about the need to invest in renewable electricity generation and the grid structure supporting it, but very little in the way of planning for this transition. Other than repeated assertions of its necessity, little is being said regarding how exactly this strategy will be executed given the magnitude of the supply increase in metals required. Nowhere is this more apparent than in the refined copper market, which has been in a physical deficit – i.e., production minus consumption is negative – for the last 6 years (Chart 3). Physical copper markets in China, which consumes more than 50% of refined output, remain extremely tight, as can be seen in the ongoing weakness of treating charges and refining charges (TC/RC) for the past year (Chart 4). These charges are inversely correlated to prices – when TC/RCs are low, it means there is surplus refining capacity for copper – unrefined metal is scarce, which drives down demand for these services. Chart 3Coppers Physical Deficit Likely Persist
Coppers Physical Deficit Likely Persist
Coppers Physical Deficit Likely Persist
Chart 4Chinas Refined Copper Supply Remains Tight
Chinas Refined Copper Supply Remains Tight
Chinas Refined Copper Supply Remains Tight
Theoretically, high prices will incentivize higher levels of production. However, after the last decade’s ill-timed investment in new mine discoveries and expansions, mining companies have become more wary with their investments, and are using earnings to pay dividends and reduce debt. This leads us to believe that mining companies will not invest in new mine discoveries but will use capital expenditure to expand brownfield projects to meet rising demand. In the last decade, as copper demand rose, capex for copper rose from 2010-2012, and fell from 2013-2016 (Chart 5). During this time, the copper ore grade was on a declining trend. This implies that the new copper brought online was being mined from lower-grade ore, due to the expansion of existing projects(Chart 6). Chart 5Copper Capex Growth Remains Weak
A Perfect Energy Storm On The Way
A Perfect Energy Storm On The Way
Chart 6Copper Ore-Quality Declines Persist Through Capex Cycle
A Perfect Energy Storm On The Way
A Perfect Energy Storm On The Way
Capex directed at keeping ore production above consumption will not be sufficient to avoid major depletions of ore supplies beginning in 2024, according to Wood Mackenzie. The consultancy foresees a cumulative deficit of ~ 16mm MT by 2040. Plugging this gap will require $325-$500 billion of investment in the copper mining sector.6 The Case For A Carbon Tax The low-carbon future remains something of a will-o'-the-wisp – seen off in the future but not really developed in the present. Most striking in discussions of the low-carbon transition is the assumption of resource availability – particularly bases metals –in, e.g., the IEA's Net Zero by 2050, A Roadmap for the Global Energy Sector, published last month. In the IEA's document, further investment in hydrocarbons is not required beyond 2025. The copper, aluminum, steel, etc., required to build the generation and supporting grid infrastructure will be available and callable as needed to build all the renewable generation the world requires. The document is agnostic between carbon trading and carbon taxes as a way to price carbon and incentivize the technology that would allow firms and households to avoid a direct cost on carbon. A real strategy must address the fact that most of the world will continue to rely on fossil fuels for decades, as development goals are pursued. Underinvestment in base metals and its implications for the buildout of generation and grids has to be a priority if these assets are to be built. Given the 5-10-year lead times base metals mines require to come online, it is obvious that beyond the middle of this decade, the physical reality of demand exceeding supply will assert itself. A good start would be a global effort to impose and collect carbon taxes uniformly across states.7 This would need to be augmented with a carbon club, which restricts admission and trading privileges to those states adopting such a scheme. Harmonizing the multiple emissions trading schemes worldwide will be a decades-long effort that is unlikely to succeed. Such schemes also can be gamed by larger players, producing pricing distortions. A hard and fast tax that is enforced in all of the members of such a carbon club would immediately focus attention on the technology required to avoid paying it – mobilizing capital, innovation and entrepreneurial drive to make it a reality. This would support carbon-capture, use and storage technologies as well, thus extending the life of existing energy resources as the next generation of metals-based resources is built out. In addition, a carbon tax raises revenue for governments, which can be used for a variety of public policies, including reducing other taxes to reduce the overall burden of taxation. Lastly, a tax eliminates the potential for short-term price volatility in the pricing of carbon – as long as households and firms know what confronts them they can plan around it. Tax revenues also can be used to reduce the regressive nature of such levies. Investment Implications The lack of a coherent policy framework that addresses the very real constraints on the transition to a low-carbon economy makes the likelihood of a volatile, years-long evolution foreordained. We believe this will create numerous investment opportunities as underinvestment in hydrocarbons and base metals production predisposes oil, natural gas and base metals prices to move higher in the face of strong and rising demand. We remain long commodity index exposure – the S&P GSCI and GSCI Commodity Dynamic Roll Strategy ETF (COMT), which is optimized to take advantage of the most backwardated commodity forward curves in the index. These positions were up 5.3% and 7.2% since inception on December 7, 2017 and March 12, 2021, respectively, at Tuesday's close. We also remain long the MSCI Global Metals & Mining Producers ETF (PICK), which is up 33.9% since it was put on December 10, 2020. Expecting continued volatility in metals – copper in particular – we will look for opportunities to re-establish positions in COMEX/CME Copper after being stopped out with gains. A trailing stop was elected on our long Dec21 copper position established September 10, 2020, which was closed out with a 48.2% gain on May 21, 2021. Our long calendar 2022 vs short calendar 2023 COMEX copper backwardation trade established April 22, 2021, was closed out on May 20, 2021, leaving us with a return of 305%. Robert P. Ryan Chief Commodity & Energy Strategist rryan@bcaresearch.com Ashwin Shyam Research Associate Commodity & Energy Strategy ashwin.shyam@bcaresearch.com Commodities Round-Up Energy: Bullish OPEC 2.0 offered no surprises to markets this week, as it remained committed to returning just over 2mm b/d of production to the market over the May-July period, 70% of which comes from the Kingdom of Saudi Arabia (KSA), according to Platts. While Iran's return to the market is not a given in OPEC 2.0's geometry, we have given better than even odds it will return to the market beginning in 3Q21 and restore most of the 1.4mm b/d not being produced at present to the market over the course of the following year. OPEC itself expects demand to increase 6mm b/d this year, somewhat above our expectation of 5.3mm b/d. Stronger demand could raise Brent prices above our average $63/bbl forecast for this year (Chart 7). Brent was trading above $71/bbl as we went to press. Base Metals: Bullish BHP declared operations at its Escondida and Spence mines were running at normal rates despite a strike by some 200 operations specialists. BHP is employing so-called substitute workers to conduct operation, according to reuters.com, which also reported separate unions at both mines are considering strike actions in the near future. Precious Metals: Bullish The Fed’s reluctance to increase nominal interest rates despite indications of higher inflation will reduce real rates, which will support higher gold prices (Chart 8). We agree with our colleagues at BCA Research's US Bond Strategy that the Fed is waiting for the US labor market to reach levels consistent with its assessment of maximum employment before it makes its initial rate hike in this interest-rate cycle. Subsequent rate changes, however, will be based on realized inflation and inflation expectations. In our opinion, the Fed is following this ultra-accommodative monetary policy approach to break the US liquidity trap, brought about by a rise in precautionary savings due to the pandemic. In addition, we continue to expect USD weakness, which also will support gold and precious metals prices. We remain long gold, expecting prices to clear $2,000/oz this year. Ags/Softs: Neutral Corn prices fell more than 2% Wednesday, following the release of USDA estimates showing 95% of the corn crop was planted by 31 May 2021, well over the 87% five-year average. This was in line with expectations. However, the Department's assessment that 76% of the crop was in good-to-excellent condition exceeded market expectations. Chart 7
By 2023 Brent Trades to $80/bbl
By 2023 Brent Trades to $80/bbl
Chart 8
Gold Prices Going Up
Gold Prices Going Up
Footnotes 1 Please see Trade Tables below. 2 Please see OPEC, Russia seen gaining more power with Shell Dutch ruling and EXCLUSIVE BlackRock backs 3 dissidents to shake up Exxon board -sources published by reuters.com June 1, 2021 and May 25, 2021. 3 Please see Chile's govt in shock loss as voters pick independents to draft constitution published by reuters.com May 17, 2021, and Peru’s elite in panic at prospect of hard-left victory in presidential election published by ft.com June 1, 2021. Peru has seen significant capital flight on the back of these fears. See also Results from Chile’s May 2021 elections published by IHS Markit May 21, 2021 re a higher likelihood of tax increases for the mining sector. The risk of nationalization is de minimis, according to IHS. 4 Please see Exxon walks away from stake in deepwater Ghana block published by worldoil.com June 1, 2021. 5 Please see OPEC 2.0's Production Strategy In Focus, which we published on May 20, 2021, for a recap our how we model OPEC 2.0's strategy. It is available at ces.bcaresearch.com. 6 Please see Will a lack of supply growth come back to bite the copper industry?, published by Wood Mackenzie on March 23, 2021. 7 Please see The Challenges and Prospects for Carbon Pricing in Europe published by the Oxford Institute for Energy Studies last month for a discussion of carbon taxes vs. emissions trading schemes. Investment Views and Themes Strategic Recommendations Tactical Trades Commodity Prices and Plays Reference Table Trades Closed in 2021 Summary of Closed Trades
Higher Inflation On The Way
Higher Inflation On The Way
On Friday 4th June, I will be debating my colleague Peter Berezin on the future of cryptocurrencies. I believe that the cryptocurrency asset-class has substantial further price upside, whereas Peter thinks that it is going to zero. So please join us for what will be a lively debate on Friday 4th June at 10am EDT, (3pm BST, 4pm CEST). Dhaval Joshi Feature Chart of the WeekThe Fractal Structure Of Cryptos Had Become Very Fragile
The Fractal Structure Of Cryptos Had Become Very Fragile
The Fractal Structure Of Cryptos Had Become Very Fragile
Today’s report is a brief review and update of the 22 short-term trades that we have recommended through the past three months, and it demonstrates the power of Fractals: The Competitive Advantage In Investing. At the end of the report we also introduce a new trade. Our 22 recommendations have comprised 10 structured trades – which include profit-targets, symmetrical stop-losses, and expiry dates – plus a further 12 recommendations without structured exit points. In summary, three structured recommendations have hit their profit targets: short NOK/PLN +2.6 percent, long European Personal Products versus Autos +15 percent, and long Finland versus Sweden +4.7 percent. Two open trades are in profit, and one is flat. Against this, two structured recommendations hit their stop-losses: short GBP/JPY -2.2 percent, and long New Zealand versus MSCI ACWI -4 percent. Meanwhile, long China versus Netherlands reached its expiry date at a slight loss -1.8 percent. And one open trade is in loss. This results in a ‘win ratio’ at a commendable 55 percent – counting a ‘full win’ as hitting the profit target, a ‘full loss’ as hitting the symmetrical stop-loss, and pro-rata for partial wins and losses. The win ratio at 55 percent is commendable because, in recent months, all financial assets been strongly correlated to the ebb and flow of bond yields and the ‘reflation trade’ – as we highlighted in The Pareto Principle Of Investment. This has made the current environment a difficult one to find genuinely independent investment ideas. Even more commendably, the 12 unstructured recommendations, which included Bitcoin, Ethereum, and several commodities, have all anticipated exhaustions or sharp reversals. The sections below review the structured and unstructured recommendations in chronological order. The 10 Structured Recommendations 1. 18th March: Short NOK/PLN Achieved its +2.6 percent profit target. 2. 25th March: Short GBP/JPY Hit its -2.2 percent stop-loss. 3. 1st April: Long European Personal Products vs. European Autos Achieved its +15 percent profit target. 4. 15th April: Long China vs. Netherlands Expired at -1.8 percent (versus its +5 percent profit target). 5. 15th April: Long Finland vs. Sweden Achieved its +4.7 percent profit target. 6. 22nd April: Long New Zealand vs. MSCI ACWI Hit its -4 percent stop-loss. 7. 6th May: Short Building and Construction (PKB) vs. Healthcare (XLV) In profit, and we expect further upside (Chart I-2). Chart I-2Short Building And Construction Versus Healthcare
Short Building And Construction Versus Healthcare
Short Building And Construction Versus Healthcare
8. 6th May: Short France vs. Japan In loss, but we expect upside. 9. 13th May: Long USD/CAD Flat, but we expect upside. 10. 20th May: Long 10-year T-bond vs. 10-year TIPS In profit, and we expect further upside (Chart I-3). Chart I-3Short Inflation Expectations
Short Inflation Expectations
Short Inflation Expectations
The 12 Unstructured Recommendations 1. 18th March: Stocks vs. Bonds (MSCI ACWI vs. 30-year T-bond) to consolidate As anticipated, global stocks have consolidated versus bonds since mid-March, and we expect the consolidation to continue. 2. 18th March: Long 30-year T-bond Likewise, exactly as anticipated, bond prices have rebounded since mid-March, and we expect the rebound to continue (Chart I-4). Chart I-4Bond Prices To Rebound
Bond Prices To Rebound
Bond Prices To Rebound
3. 25th March: Tactically short Bitcoin Bitcoin subsequently corrected by almost 40 percent, but the correction is mostly done (Chart I-1). 4. 25th March: Tactically short Ethereum Likewise, Ethereum subsequently corrected, but the correction is mostly done. 5. 15th April: Short Taiwan vs. China Taiwan subsequently corrected versus China, but the correction is mostly done. 6. 22nd April: Short PKR/USD As anticipated, PKR/USD corrected in the subsequent month. 7. 6th May: Short Corn vs. Wheat 8. 6th May: Short Timber (Chart I-5) Chart I-5Short Timber
Short Timber
Short Timber
9. 13th May: Short Soybeans 10. 20th May: Short Copper 11. 20th May: Short Tin 12. 27th May: Short Iron Ore As anticipated, all the above commodities have corrected, and in some cases very sharply. But the correction is still underway. New Recommendation Finally, this week’s new recommendation comes from the MSCI world equity index universe. The massive outperformance of Austria versus Chile – in large part due to the different sector compositions of the two markets – is fragile on all fractal dimensions: 65-day, 130-day, and 260-day (Chart I-6). Chart I-6Short Austria Vs. Chile
Short Austria Vs. Chile
Short Austria Vs. Chile
Accordingly, the recommendation is to short Austria versus Chile, setting the profit target and symmetrical stop-loss at 7 percent. Dhaval Joshi Chief Strategist dhaval@bcaresearch.com Fractal Trading System Fractal Trades 6-Month Recommendations Structural Recommendations Closed Fractal Trades Closed Trades Asset Performance Equity Market Performance Indicators To Watch - Bond Yields Chart I-1Indicators To Watch - Bond Yields ##br##- Euro Area
Indicators To Watch - Bond Yields - Euro Area
Indicators To Watch - Bond Yields - Euro Area
Chart I-2Indicators To Watch - Bond Yields ##br##- Europe Ex Euro Area
Indicators To Watch - Bond Yields - Europe Ex Euro Area
Indicators To Watch - Bond Yields - Europe Ex Euro Area
Chart I-3Indicators To Watch - Bond Yields ##br##- Asia
Indicators To Watch - Bond Yields - Asia
Indicators To Watch - Bond Yields - Asia
Chart I-4Indicators To Watch - Bond Yields ##br##- Other Developed
Indicators To Watch - Bond Yields - Other Developed
Indicators To Watch - Bond Yields - Other Developed
Indicators To Watch - Interest Rate Expectations Chart I-5Indicators To Watch - Interest Rate Expectations
Indicators To Watch - Interest Rate Expectations
Indicators To Watch - Interest Rate Expectations
Chart I-6Indicators To Watch - Interest Rate Expectations
Indicators To Watch - Interest Rate Expectations
Indicators To Watch - Interest Rate Expectations
Chart I-7Indicators To Watch - Interest Rate Expectations
Indicators To Watch - Interest Rate Expectations
Indicators To Watch - Interest Rate Expectations
Chart I-8Indicators To Watch - Interest Rate Expectations
Indicators To Watch - Interest Rate Expectations
Indicators To Watch - Interest Rate Expectations
The global manufacturing recovery accelerated in May with the Markit Global Manufacturing PMI inching up to an 11-year high of 56. The stronger headline number partially reflects an increase in the pace of new orders to 57.3 from 56.8, while output and…