Global
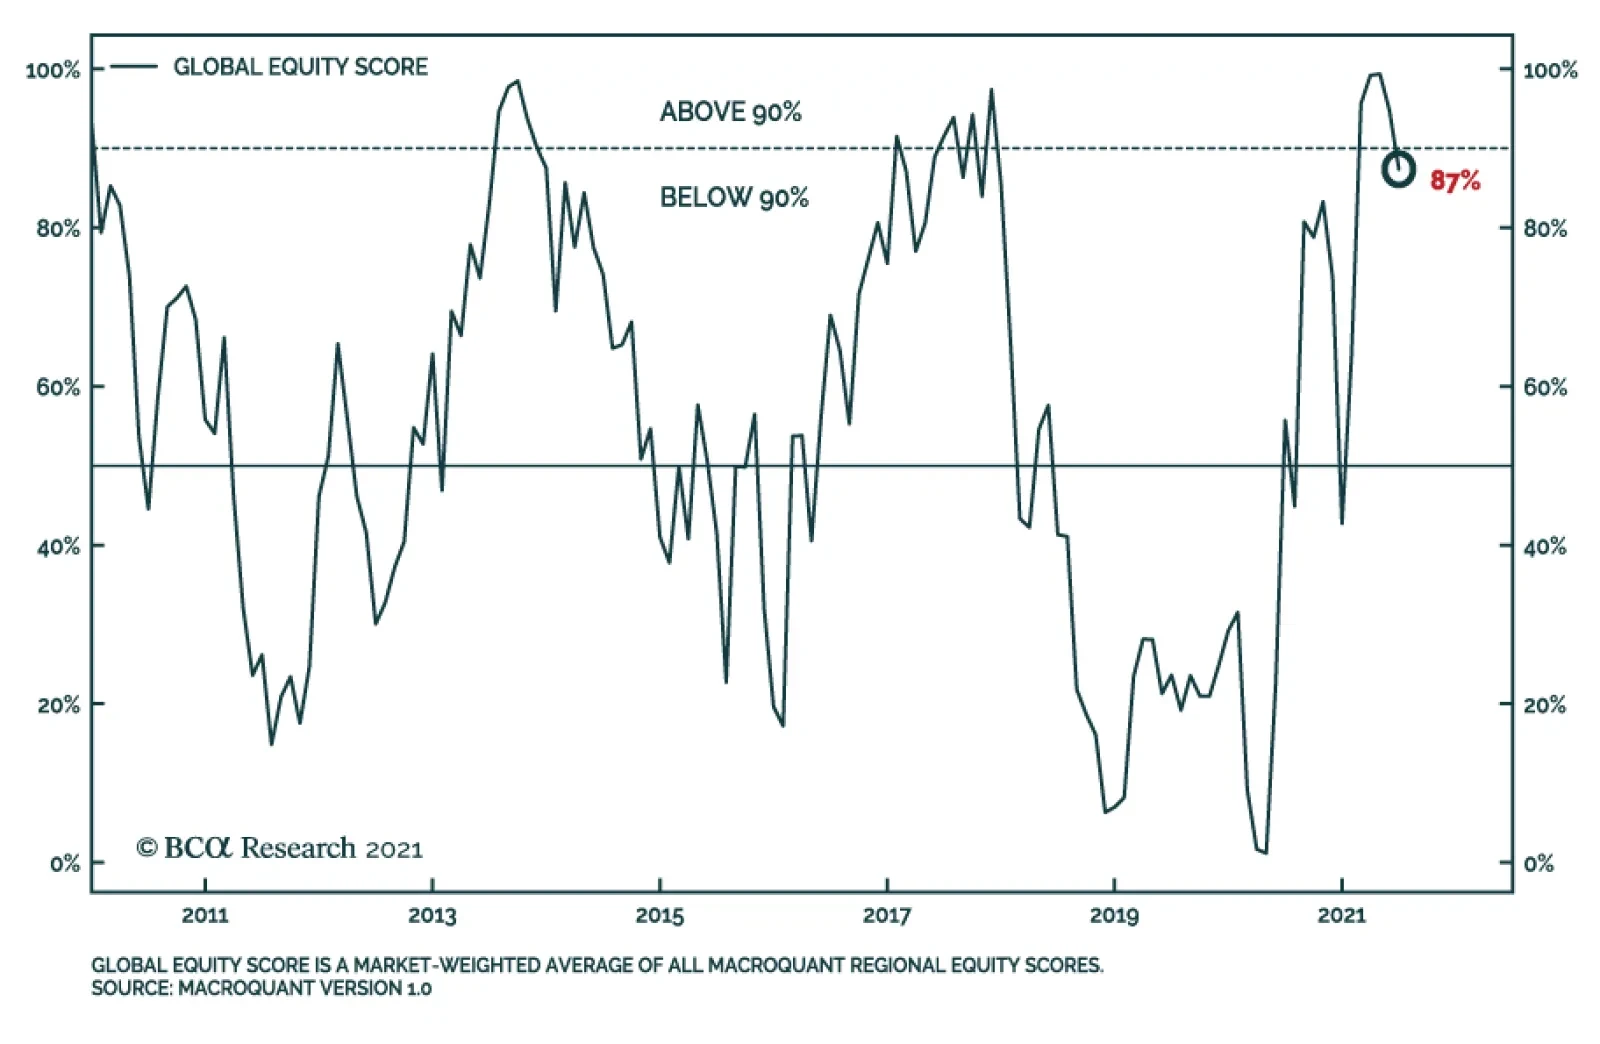
The MacroQuant global equity score is a market-weighted composite of all the regional equity scores within the model. It ranges between 0% and 100%, with 0% being most bearish and 100% being most bullish. Read the full details on MacroQuant in the recently…
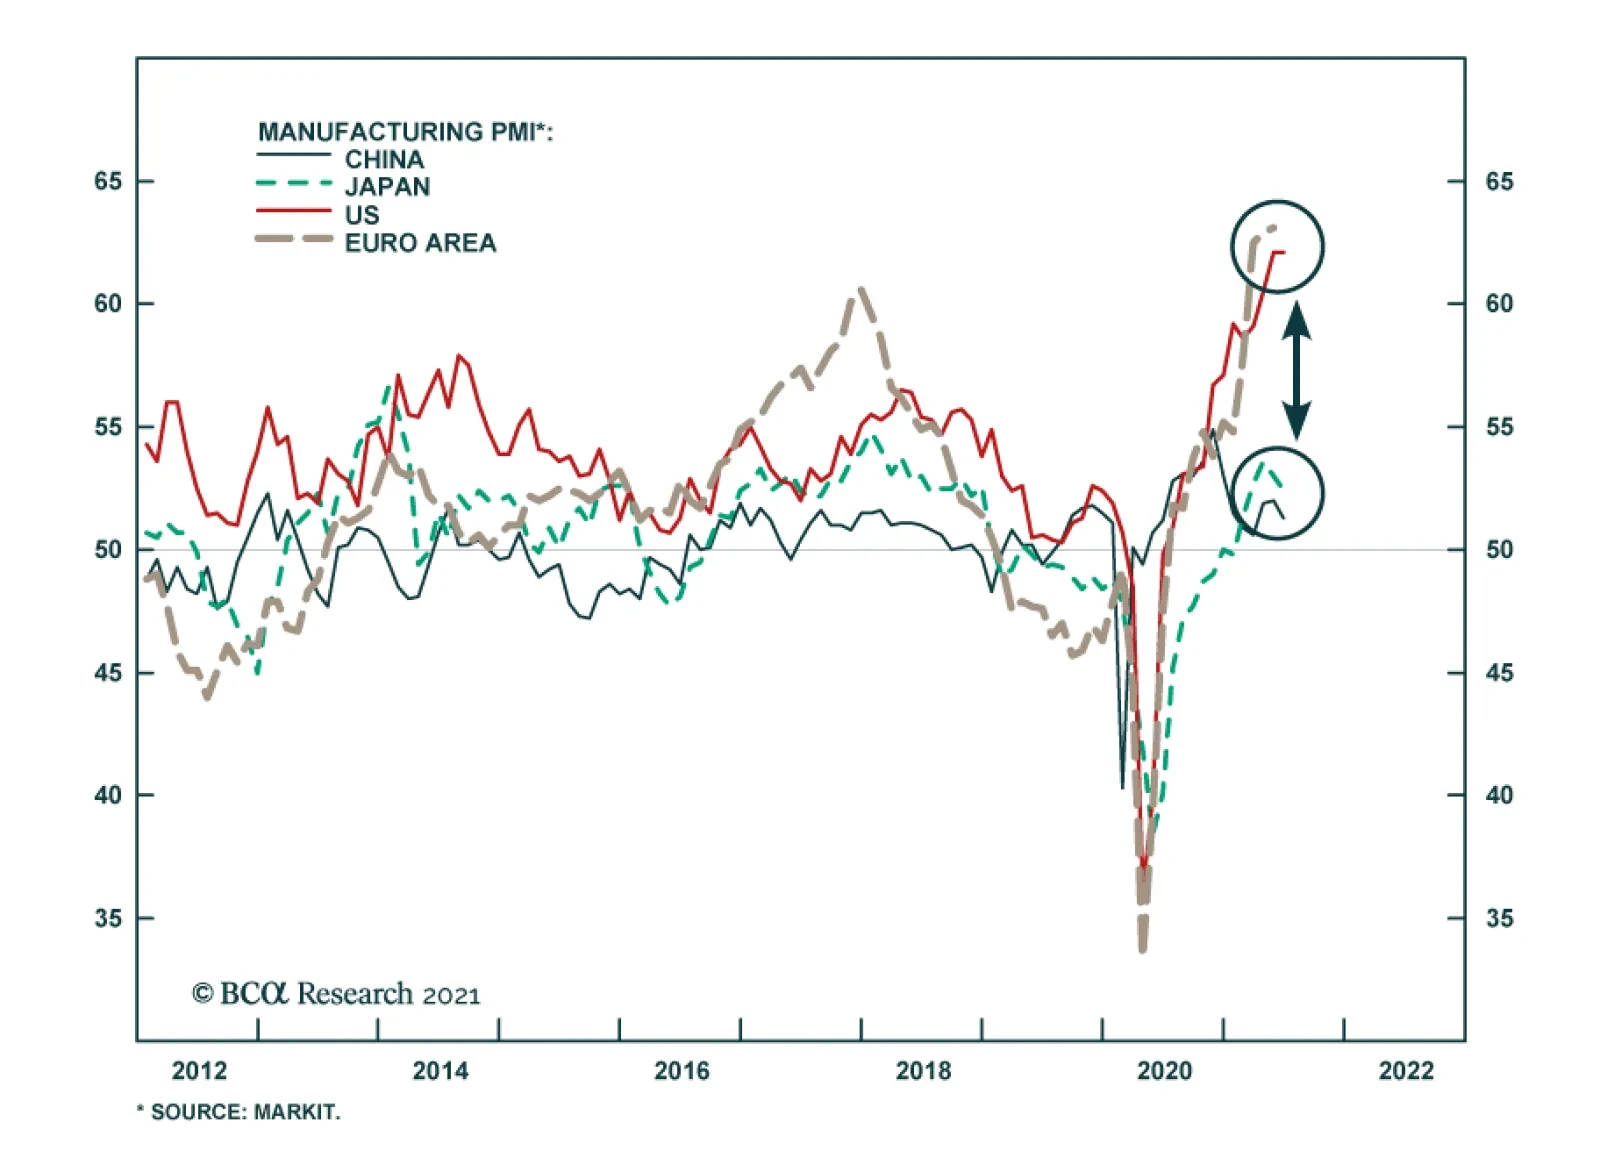
Global manufacturing PMI in June was at robust 54.4, indicating that more than 50% of global manufacturing industries continue expanding. Such a robust reading of global manufacturing PMI was despite the weakness in Asian manufacturing PMIs including ones in…

Highlights The US dollar will reach its ultimate high in the next deflationary shock. The swing factor for dollar demand is portfolio flows. In the next shock, portfolio flows will surge into US investments, driving up the US dollar to its ultimate high. One reason is that the US T-bond is the only major bond that can act as a haven-asset, now that most other bond yields are close to the effective lower bound. For US investors, international stocks will create a double-jeopardy. Not only will non-US stocks underperform US stocks, but non-US currencies will underperform the dollar. For non-US investors, the US 30-year T-bond will create a double-win from price surge and dollar surge, leading to a potential doubling of your money. Fractal trade shortlist: stocks versus bonds, tin, and US REITS versus US utilities. Feature Chart of the WeekSuccessive Shocks Take The Dollar To New Highs
Successive Shocks Take The Dollar To New Highs
Successive Shocks Take The Dollar To New Highs
In our recent report The Shock Theory Of Bond Yields we explained that the structural level of high-quality government bond yields is simply a function of the number of lasting deflationary shocks that an economy has endured. Each successive deflationary shock takes the bond yield to a lower low. Until it can go no lower (Chart 2). Chart I-2Successive Shocks Take The T-Bond Yield To New Lows
Successive Shocks Take The T-Bond Yield To New Lows
Successive Shocks Take The T-Bond Yield To New Lows
Today’s report explains an important corollary. Each major deflationary shock has taken the US dollar to a new high, led by strong rallies against cyclical currencies such as the pound and the Canadian dollar (Chart of the Week, Chart I-3 and Chart I-4). We conclude that the US dollar will reach its ultimate high in the next deflationary shock. Chart I-3USD/GBP Surges In Shocks
USD/GBP Surges In Shocks
USD/GBP Surges In Shocks
Chart I-4USD/CAD Surges In Shocks
USD/CAD Surges In Shocks
USD/CAD Surges In Shocks
Investors Must Build Shocks Into Their Strategy Most strategists claim that shocks, such as the pandemic, are inherently unpredictable. They argue that shocks are exogenous events that investors cannot plan for. We disagree. Granted, the timing and source of individual shocks are inherently unpredictable. But as we explained in How To Predict Shocks, the likelihood of suffering a shock is highly predictable. We define a shock as any event that causes the long-duration bond price in a major economy to rally or to slump by at least 25 percent.1 Using this definition through the past five decades, shocks have arrived with a remarkable predictability (Chart I-5). As a statistical distribution, the number of shocks in any ten-year period is Poisson (3.33) and the time between shocks is Exponential (3.33). Chart I-5A Shock Is A 25 Percent Move In The Long Duration Bond Price, And A Shock Tends To Come Every 3 Years
A Shock Is A 25 Percent Move In The Long Duration Bond Price, And A Shock Tends To Come Every 3 Years
A Shock Is A 25 Percent Move In The Long Duration Bond Price, And A Shock Tends To Come Every 3 Years
Hence, in any three-year period, the likelihood of suffering a shock is 50 percent; in a five-year period, it is 81 percent; and in a ten-year period, it is a near-certain 96 percent (Chart I-6). Chart I-6On A Multi-Year Horizon, A Shock Is A Near-Certainty
Why The Dollar’s Ultimate High Is Yet To Come
Why The Dollar’s Ultimate High Is Yet To Come
Yet, to repeat, the precise source and timing of the near-certain shock is unknown. This creates a dissonance for our narrative-focused minds. Absent a narrative for the certain shock, we do not plan for it. But we should. For long-term investors one crucial takeaway is that the ultimate low in the T-bond yield is yet to come. Another crucial takeaway is that the ultimate high in the US dollar is also yet to come. In A Shock, The US Dollar Surges The net demand for dollars comes from four sources: To fund the demand for goods and services denominated in dollars. (In fact, the structural US deficit in goods and services means that this source generates a persistent supply of dollars.) To fund the demand for long-term investments denominated in dollars, also known as foreign direct investment (FDI). To fund the demand for shorter-term financial investments like bonds and equities denominated in dollars, also known as portfolio flows.2 To fund the demand for currency reserves denominated in dollars. Of these four sources of dollar demand, the US deficit in goods and services is not particularly volatile. FDI flows also change relatively slowly. Meanwhile, demand for dollar reserves is a residual factor, except at the rare moment that a currency peg starts or ends.3 The largest quarterly swings in portfolio flows swamp the largest quarterly swings in the trade balance and FDI. This means that the swing factor for dollar demand is portfolio flows. Chart I-7 and Chart I-8 show that the largest quarterly swings in portfolio flows, at over $1.5 trillion (annualised rate) swamp the largest quarterly swings in the trade balance and FDI, at just $0.5 trillion. Chart I-7The Swing Factor For Dollar Demand Is Portfolio Flows
The Swing Factor For Dollar Demand Is Portfolio Flows
The Swing Factor For Dollar Demand Is Portfolio Flows
Chart I-8The Swing Factor For Dollar Demand Is Portfolio Flows
The Swing Factor For Dollar Demand Is Portfolio Flows
The Swing Factor For Dollar Demand Is Portfolio Flows
All of which brings us to the main point of this report. In a shock, portfolio flows surge into US investments, which drives up the US dollar. In a shock, portfolio flows surge into US investments, which drives up the US dollar. There are two reasons for this. First, the US stock market is one of the most defensive in the world. Hence, in a shock, equity flows flood into the US (Chart I-9). Chart I-9The US Stock Market Is One Of The Most Defensive In The World
The US Stock Market Is One Of The Most Defensive In The World
The US Stock Market Is One Of The Most Defensive In The World
But even more important now, the US T-bond is the only major bond that can act as a haven-asset. With most other bond yields already close to the effective lower bound, the US T-bond is the only mainstream asset which still has substantial scope to rally when other asset prices are collapsing. Hence, in recent years, the dollar is just tracking the performance of bonds versus stocks (Chart I-10). It follows that in the next deflationary shock, when bonds surge versus stocks, the dollar will surge to its ultimate high. Chart I-10The Dollar Is Just Tracking Bonds Versus Stocks
The Dollar Is Just Tracking Bonds Versus Stocks
The Dollar Is Just Tracking Bonds Versus Stocks
An Inflationary Shock Will Quickly Morph Into A Deflationary Shock But what if the next shock is a dollar crisis? Such a crisis, caused by a loss of faith in the greenback as a store of value, would start off inflationary – to the detriment of the dollar. However, our high-conviction view is that even if the shock started as inflationary, it would quickly morph into deflationary. The simple reason is that the initial backup in bond yields that would come from such an inflationary shock would collapse the value of $500 trillion worth of global real estate, equities, and other risk-assets, and thereby unleash a massive deflationary impulse. Many people believe that real assets, such as real estate and equities, perform well in an inflationary shock, but this is a misunderstanding. Granted, the income generated by real assets should keep pace with nominal GDP. But the valuation paid for that income will collapse if it starts off at an elevated level, such as now. Investors demand a massive risk premium when inflation is out of control. The starting valuation needed to generate a given real return during an inflationary shock collapses because investors demand a massive risk premium when inflation is out of control. For example, in the low-inflation 1990s and 2000s, a starting price to earnings multiple of 15 consistently generated a prospective 10-year real return of 10 percent. But to generate the same real return of 10 percent during the inflationary 1970s, the starting multiple had to halve to 7 (Chart I-11). Chart I-11In An Inflationary Shock, Valuations Collapse
In An Inflationary Shock, Valuations Collapse
In An Inflationary Shock, Valuations Collapse
Suffice to say, if the valuation of $500 trillion of global risk-assets were to halve, we would not have to worry about inflation. So, to sum up: On a timeframe of a few years, a shock is a near-certainty even if we do not know its precise source or its precise timing. Furthermore, the shock will be net deflationary. Hence, investors must build such a net deflationary shock or shocks into their long-term investment strategy. Specifically, in the next shock: US equities will outperform non-US equities. The 10-year T-bond yield will reach zero, and the 30-year T-bond yield will reach 0.5 percent. The US dollar will reach its ultimate high. This leads to two very important messages, one for US investors, one for non-US investors. For US investors, international stocks will create a double-jeopardy. In the next shock, not only will non-US stocks underperform US stocks, but non-US currencies will underperform the dollar. The corollary for non-US investors is that the US 30-year T-bond will create a double-win. Not only will the T-bond price surge, but the dollar will also reach a new high. The combination will lead to a potential doubling of your money. H1 2021 Win Ratio Reaches A Magnificent 71 Percent Last Thursday’s 16 percent rally in Nike shares on a brighter sales outlook means that our long Nike versus L’Oréal trade quickly achieved its 9 percent profit target. Long USD/HUF also quickly achieved its 3 percent profit target. Combined with other ‘wins’, this has boosted the fractal trades win ratio for H1 2021 to a magnificent 71 percent – comprising 12.1 wins versus just 4.9 losses. A fragile fractal structure is a warning that the investors setting the investment’s price has become dangerously biased to short-term traders. As longer-term value investors are missing from the price setting process, the price becomes unmoored from the longer-term valuation anchor. This creates an excellent countertrend investment opportunity because once the longer-term investors re-enter the price setting process, the recent trend will reverse. This week we highlight three fragile fractal structures. The fractal structure of stocks versus bonds (MSCI All Country World versus 30-year T-bond) remains fragile, suggesting that a neutral stance, at best, for stocks versus bonds through the summer (Chart I-12). Chart I-12The Fractal Structure Of Stocks Versus Bonds Is Fragile
The Fractal Structure Of Stocks Versus Bonds Is Fragile
The Fractal Structure Of Stocks Versus Bonds Is Fragile
The fractal structure of tin is also fragile (Chart I-13). Given that most commodity prices have begun corrections, tin is vulnerable – especially versus other commodities. Chart I-13The Fractal Structure Of Tin Is Fragile
The Fractal Structure Of Tin Is Fragile
The Fractal Structure Of Tin Is Fragile
Finally, comparing two high-yielding sectors, the fractal structure of US REITS versus US utilities is at a point of fragility that has reliably presaged countertrend moves (Chart I-14). Accordingly, this week’s recommended trade is to short US REITS versus US utilities, setting the profit target and symmetrical stop-loss at 5 percent. Chart I-14Short US REITS Versus US Utilities
Short US REITS Versus US Utilities
Short US REITS Versus US Utilities
Dhaval Joshi Chief Strategist dhaval@bcaresearch.com Footnotes 1 As bond yields approach their lower limit, this definition of a shock will need to change as it will become impossible for long-duration bond prices to rally by 25 percent. 2 In this discussion, portfolio flows include short-term speculative flows. 3For example, if a currency broke its peg with the dollar it would stop buying the dollar reserves needed to maintain the peg. Fractal Trading System Fractal Trades 6-Month Recommendations Structural Recommendations Closed Fractal Trades Closed Trades Asset Performance Equity Market Performance Indicators To Watch - Bond Yields Chart II-1Indicators To Watch - Bond Yields - Euro Area
Indicators To Watch - Bond Yields - Euro Area
Indicators To Watch - Bond Yields - Euro Area
Chart I-2Indicators To Watch - Bond Yields - Europe Ex Euro Area
Indicators To Watch - Bond Yields - Europe Ex Euro Area
Indicators To Watch - Bond Yields - Europe Ex Euro Area
Chart I-3Indicators To Watch - Bond Yields - Asia
Indicators To Watch - Bond Yields - Asia
Indicators To Watch - Bond Yields - Asia
Chart I-4Indicators To Watch - Bond Yields - Other Developed
Indicators To Watch - Bond Yields - Other Developed
Indicators To Watch - Bond Yields - Other Developed
Indicators To Watch - Interest Rate Expectations Chart I-5Indicators To Watch - Interest Rate Expectations
Indicators To Watch - Interest Rate Expectations
Indicators To Watch - Interest Rate Expectations
Chart I-6Indicators To Watch - Interest Rate Expectations
Indicators To Watch - Interest Rate Expectations
Indicators To Watch - Interest Rate Expectations
Chart I-7Indicators To Watch - Interest Rate Expectations
Indicators To Watch - Interest Rate Expectations
Indicators To Watch - Interest Rate Expectations
Chart I-8Indicators To Watch - Interest Rate Expectations
Indicators To Watch - Interest Rate Expectations
Indicators To Watch - Interest Rate Expectations
Dear Client, We are sending you our Strategy Outlook today, where we outline our thoughts on the macro landscape and the direction of financial markets for the rest of 2021 and beyond. Next week, please join me for a webcast on Thursday, July 8 at 10:00 AM EDT (3:00 PM BST, 4:00 PM CEST, 10:00 PM HKT) where I will discuss the outlook. Best regards, Peter Berezin, Chief Global Strategist Highlights Macroeconomic Outlook: Global growth is peaking but will remain solidly above trend. While the proliferation of the Delta strain is likely to trigger another wave of Covid cases this summer, the economic impact will be far smaller than during past waves. Global Asset Allocation: The risk-reward profile for stocks has deteriorated since the start of the year. Nevertheless, with few signs that the global economy is heading towards another major downturn, investors should maintain a modest equity overweight on a 12-month horizon. Equities: Favor cyclicals, value-oriented, and non-US equities. Emerging markets should spring back to life in the autumn once vaccine supplies increase and Chinese fiscal policy turns more stimulative. Fixed Income: Maintain below average interest-rate duration exposure. The 10-year US Treasury yield will finish the year at 1.9%. Spread product will continue to outperform high quality government bonds. Currencies: The US dollar will resume its weakening trend as growth momentum rotates from the US to the rest of the world. EUR/USD will finish the year at 1.25. Commodities: Brent will rise to $79/bbl by end-2021, 9% above current market expectations. While the lagged effects from the slowdown in Chinese credit growth earlier this year will weigh on base metals during the summer months, the long-term outlook for metals is positive. Favor gold over cryptos as an inflation hedge. I. Macroeconomic Outlook Global Vaccination Campaign Kicks Into High Gear Nearly 18 months after the pandemic began, the global economy is on the mend. In its latest round of forecasts released on May 31st, the OECD projects that the global economy will expand by 5.8% this year, up from its March projection of 5.6%. The OECD also bumped up its growth forecast for 2022 from 4% to 4.4%. After a rough start, the vaccination campaign is progressing well in most advanced economies (Chart 1). The US and the UK were the first major developed economies to roll out the vaccines, followed by Canada and the EU. While Japan has lagged behind, the pace of vaccinations has picked up lately. Twenty percent of the Japanese population has now received at least one dose. Developing economies are still struggling to secure enough vaccines. Fortunately, this problem should abate over the next six months. The Global Health Innovation Center at Duke University estimates that pharmaceutical companies are on track to produce more than 10 billion vaccine doses this year (Chart 2). While perhaps not enough to inoculate everyone who wants a jab, it will suffice in providing protection to the most vulnerable members of society – the elderly and those with pre-existing medical conditions. Chart 1The Vaccination Campaign Is Progressing Well In Most Developed Economies
The Vaccination Campaign Is Progressing Well In Most Developed Economies
The Vaccination Campaign Is Progressing Well In Most Developed Economies
Chart 2Vaccine Makers Are On Track To Produce Over 10 Billion Doses In 2021
2021 Third Quarter Strategy Outlook: The Path To Normal
2021 Third Quarter Strategy Outlook: The Path To Normal
New Variants And Vaccine Hesitancy Are Risks Novel strains of the virus remain a concern. First identified in India, the so-called “Delta variant” is spreading around the world. The number of new cases in the UK, where the Delta variant accounts for over 90% of all new infections, is rising again (Chart 3). The latest outbreak has forced the government to postpone “Freedom Day” from June 21st to July 19th (Chart 4). Chart 3The Number Of New Cases In The UK Is Rising Anew
2021 Third Quarter Strategy Outlook: The Path To Normal
2021 Third Quarter Strategy Outlook: The Path To Normal
Chart 4Dismantling Of Lockdown Measures Occurring At Varying Pace
2021 Third Quarter Strategy Outlook: The Path To Normal
2021 Third Quarter Strategy Outlook: The Path To Normal
It is highly likely that the Delta variant will produce another wave of cases in the US this summer. Despite ample availability, one-third of Americans over the age of 18 have yet to receive a single dose of a vaccine. As is the case with most everything in the United States, the question of whether to be inoculated has become politicized. In many Republican-leaning states, more than half the population remains unvaccinated (Chart 5). Chart 5The US Politicization Of Vaccines Raises The Risk From COVID-19 Variants
2021 Third Quarter Strategy Outlook: The Path To Normal
2021 Third Quarter Strategy Outlook: The Path To Normal
Vaccine hesitancy will likely diminish as the evidence of their effectiveness continues to mount. According to analysis by the Associated Press using CDC data, fully vaccinated people accounted for less than 1% of the 18,000 COVID-19 deaths in the US in May. A study out of the UK showed that two doses of the Pfizer-BioNTech vaccine was 96% effective against hospitalization from the Delta variant, while the Oxford-AstraZeneca vaccine was 92% effective. While another wave of the pandemic will curb growth this summer, the economic impact will be far smaller than in the past. At this point, the initial terror of the pandemic has faded. Politically, it will be more difficult to justify lockdowns in countries such as the US where almost everyone who wants a vaccine has already been able to get one. Macro Policy Outlook: Tighter But Not Tight After cranking the fire hose to full blast during the pandemic, policymakers are looking to scale back support. On the fiscal side, governments are slowly starting to rein in budget deficits. The IMF expects the fiscal impulse in advanced economies to average -4% of GDP in 2022, implying an incrementally tighter fiscal stance (Chart 6). Chart 6Budget Deficits Set To Decline, But Remain High By Historic Standards
2021 Third Quarter Strategy Outlook: The Path To Normal
2021 Third Quarter Strategy Outlook: The Path To Normal
Tighter does not necessarily mean tight, however. The IMF sees advanced economies running an average cyclically-adjusted primary budget deficit of 2.6% of GDP between 2022 and 2026, compared to an average deficit of 1.1% of GDP between 2014 and 2019. In the US, Congress is debating an infrastructure bill, a key element of President Biden’s “Build Back Better” agenda. If the bill fails to move out of the Senate, our geopolitical strategists expect Congress to use the reconciliation process to pass most of Biden’s legislative program. This should result in an additional 1.3% of GDP in federal spending per year over the next 8 years, offset only partly by higher taxes. Chart 7EU Fiscal Policy: Allocations To Southern European Countries Are Relatively Large
EU Fiscal Policy: Allocations To Southern European Countries Are Relatively Large
EU Fiscal Policy: Allocations To Southern European Countries Are Relatively Large
Chart 8Japanese PMIs Stuck In The Mud
Japanese PMIs Stuck In The Mud
Japanese PMIs Stuck In The Mud
In the euro area, the IMF expects fiscal policy to remain structurally looser by nearly 2% of GDP in the post-pandemic period. After six months of parliamentary debates, all 27 EU countries ratified the €750 billion Next Generation fund on May 28th. The allocations from the fund for southern European countries are relatively large (Chart 7). Most of the money will be spent on public investment projects with high fiscal multipliers. Japan has a habit of tightening fiscal policy at exactly the wrong moment, with the October 2019 hike in the sales tax from 8% to 10% being no exception. Unlike in other developed economies, both the Japanese manufacturing and services PMI remain stuck in the mud (Chart 8). The odds are rising that Prime Minister Yoshihide Suga will announce a major stimulus package after the Olympic Games and ahead of the general election due by October 22nd. China: Normalization Not Deleveraging Chart 9China: Weak Infrastructure Spending Should Pick Up
China: Weak Infrastructure Spending Should Pick Up
China: Weak Infrastructure Spending Should Pick Up
In China, strong export growth, propelled by the shift in global spending towards manufactured goods during the pandemic, allowed the government to tighten fiscal policy modestly in the first half of the year. Looking out, fiscal policy should turn more stimulative. Local governments used only 16% of their bond issuance allocation between January and May, compared with 59% over the same period last year and 40% in 2019. Proceeds should benefit infrastructure spending, which has been on the weak side in recent years (Chart 9). After a sharp decline, Chinese credit growth should stabilize in the second half of the year. The current pace of credit growth of 11% is near its 2018 lows and is broadly in line with nominal GDP growth (Chart 10). Given that the authorities have stated their desire to stabilize the ratio of credit-to-GDP, they are unlikely to proactively suppress credit growth further. The recent decline in the 3-month SHIBOR, which usually moves in the opposite direction of credit growth, is evidence to this effect (Chart 11). Chart 10Chinese Credit Growth Should Stabilize In The Second Half Of The Year
Chinese Credit Growth Should Stabilize In The Second Half Of The Year
Chinese Credit Growth Should Stabilize In The Second Half Of The Year
Chart 11China: Easing Off The Brakes?
China: Easing Off The Brakes?
China: Easing Off The Brakes?
Nevertheless, changes in fiscal and credit policy tend to affect the Chinese economy with a lag (Chart 12). Thus, the tightening in fiscal policy and the deceleration in credit growth that occurred early this year could still weigh on economic activity during the summer months. Chart 12China: Changes In Fiscal And Credit Policy Affect The Economy With A Lag
China: Changes In Fiscal And Credit Policy Affect The Economy With A Lag
China: Changes In Fiscal And Credit Policy Affect The Economy With A Lag
Don’t Sweat The Dot Plot Markets interpreted the June FOMC meeting in a hawkish light. Both the 2-year and 5-year yield jumped 10 basis points following the meeting (Table 1). The US dollar, which is quite sensitive to changes in short-term rate expectations, strengthened by nearly 2%. In contrast, long-term bond yields declined following the meeting, with the 10-year and 30-year bond yield falling by 6 and 19 basis points, respectively. Table 1Change In Yields Following June FOMC Meeting
2021 Third Quarter Strategy Outlook: The Path To Normal
2021 Third Quarter Strategy Outlook: The Path To Normal
As long duration assets, stocks take their cues more from long-term yields than short-term rates. Hence, it was not surprising that equities held their ground, and that growth stocks reversed some of their underperformance against value stocks this year. Chart 13Markets Interpreted The June FOMC Meeting In A Hawkish Light
Markets Interpreted The June FOMC Meeting In A Hawkish Light
Markets Interpreted The June FOMC Meeting In A Hawkish Light
This publication agrees with BCA’s bond strategists that the market overreacted to the changes in the Fed’s projections (aka “the dots”). As Chair Powell himself noted during the press conference, the dot plot is “not a great forecaster of future rate moves,” before adding that “Lift-off is well into the future.” The market is currently pricing in 105 basis points of tightening by the end of 2023. Prior to the meeting, investors were expecting 85 basis points in rate hikes (Chart 13). The regional Fed presidents tend to be more hawkish than the Board of Governors. Our guess is that Jay Powell himself only penciled in one hike for 2023. Lael Brainard, who may be replacing Powell next year, likely projects no hikes for 2023. The Path To Full Employment Chart 14The Divergence Of Goods And Services Spending
The Divergence Of Goods And Services Spending
The Divergence Of Goods And Services Spending
Rather than obsessing over the dots, investors should focus on the questions that will actually drive Fed policy, namely how long it takes the US economy to return to full employment and what happens to inflation in the interim and beyond. There is a lot of uncertainty over these questions – both on the demand side (how fast will spending recover?) and the supply side (how much labor market slack is there and how quickly can firms ramp up hiring?). On the demand side, the pandemic led to unprecedented changes in household spending and saving behavior. As Chart 14 shows, goods spending surged while services spending collapsed. Overall spending declined, and together with increased transfer payments, savings ballooned. As of May, US households were sitting on $2.5 trillion in excess savings. Looking at disaggregated bank deposit data as a proxy for the distribution of household savings, the wealthiest 10% of households accounted for about 70% of the increase in savings between Q1 of 2020 and Q1 of 2021 (Chart 15). Given that richer households have relatively low marginal propensities to spend, this suggests that a large fraction of these excess savings will remain unspent. Nevertheless, $2.5 trillion is a lot of money – it’s equal to almost 17% of annual consumption. Hence, even if a third of this cash hoard were to make its way into the economy, it could buoy aggregate demand significantly. Chart 15Excess Savings Have Mostly Flowed To The Rich
2021 Third Quarter Strategy Outlook: The Path To Normal
2021 Third Quarter Strategy Outlook: The Path To Normal
A Labor Market Puzzle Turning to the supply side, there were over 4% fewer people employed in the US in May than in January 2020 (Chart 16). On the face of it, this would suggest the presence of a significant amount of labor market slack. Chart 16US Employment Still More Than 4% Below Pre-Pandemic Levels
2021 Third Quarter Strategy Outlook: The Path To Normal
2021 Third Quarter Strategy Outlook: The Path To Normal
Yet, the NFIB small business survey tells a different story. It revealed that 48% of firms reported difficulty in filling vacant positions in May, the highest percentage of respondents in the 46-year history of the survey (Chart 17). Chart 17US Labor Market Shortages (I)
US Labor Market Shortages (I)
US Labor Market Shortages (I)
Chart 18US Labor Market Shortages (II)
US Labor Market Shortages (II)
US Labor Market Shortages (II)
Along the same lines, the nationwide job openings rate reached a record high of 6% in April, up from 4.5% in January 2020. The quits rate, a good proxy for worker confidence, is also at a record high (Chart 18). How does one reconcile the low level of employment with other data pointing to a tight labor market? As we discussed in a report two weeks ago, four explanations stand out: Generous unemployment benefits, which have depressed labor force participation among low-wage workers (Chart 19). Chart 19Labor Scarcity Prevalent In Low-Wage Sectors
2021 Third Quarter Strategy Outlook: The Path To Normal
2021 Third Quarter Strategy Outlook: The Path To Normal
Chart 20School Closures Have Curbed Labor Supply
2021 Third Quarter Strategy Outlook: The Path To Normal
2021 Third Quarter Strategy Outlook: The Path To Normal
Pandemic-related school closures. As Chart 20 shows, they have had a noticeable impact on labor force participation among women with young children. Reduced immigration. At one point during the pandemic, visa issuance was down 99% from pre-pandemic levels (Chart 21). An increase in early retirements. We estimate that about 1.5 million more workers retired during the pandemic than would have been expected based solely on demographic trends (Chart 22). Chart 21US Migrant Worker Supply Is Depressed
2021 Third Quarter Strategy Outlook: The Path To Normal
2021 Third Quarter Strategy Outlook: The Path To Normal
Chart 22The Pandemic Accelerated Early Retirement
The Pandemic Accelerated Early Retirement
The Pandemic Accelerated Early Retirement
All but the last effect is likely to be fleeting. Enhanced unemployment benefits expire in September; President Biden has reversed President Trump’s ban on most worker visas; and schools should fully reopen by the fall. And even for the retirement effect, most recent retirees were approaching retirement age anyway. Thus, there will likely be fewer incremental retirements over the next few years. A Speed Limit To Hiring? Assuming that a large fraction of sidelined workers return to the labor market in the fall, how fast will firms be able to hire them? In general, we are skeptical of arguments claiming that there is much of a speed limit to the pace of hiring. Chart 23There Is A Lot Of Churn In The Labor Market
There Is A Lot Of Churn In The Labor Market
There Is A Lot Of Churn In The Labor Market
There is a lot of churn in the labor market. Gross job flows are much larger than net flows. Between 2015 and 2019, 66.1 million people were hired on average per year compared with 59.6 million who quit or were discharged. Churn is especially strong in the retail and hospitality sectors, the two segments that account for the bulk of today’s shortfall in jobs. In April of this year, retailers hired nearly 800,000 workers. An additional 1.42 million workers found jobs in the leisure and hospitality sectors. This is equivalent to 5.3% and 10.1% of total employment in those sectors, respectively (Chart 23). And remember, we are talking about only one month’s worth of hiring. During past V-shaped recoveries, employment growth often surpassed 5% on a year-over-year basis (Chart 24). Such a growth rate would produce net 670K new jobs per month, enough to restore full employment by mid-2022. Chart 24V-Shaped Recoveries Are Generally Followed By Strong Labor Market Recoveries
V-Shaped Recoveries Are Generally Followed By Strong Labor Market Recoveries
V-Shaped Recoveries Are Generally Followed By Strong Labor Market Recoveries
The Fed’s Three Criteria For Lift-Off In August of 2020, the Fed formally adopted a “flexible average inflation targeting” framework. It seeks to offset periods of below-target inflation with periods of above-target inflation. The goal is to better anchor long-term inflation expectations, while giving households and firms more clarity over where the price level will be many years out. In the spirit of this new framework, the Fed has made it clear that it needs to see three things before it considers raising rates: The labor market must be at “maximum employment” 12-month PCE inflation must be above 2% The FOMC must expect inflation to remain above 2% for some time If the US economy achieves full employment by the middle of next year, the first criterion will be satisfied. PCE inflation clocked in at 3.9% in May, so at least for now, the second criterion is satisfied as well. The big question concerns the third criterion. How Transitory Is US Inflation Likely To Be? As Chart 25 shows, more than half of the increase in the CPI in April and May can be explained by higher vehicle prices, along with a rebound in pandemic-affected service prices (airfares, hotels, and event admissions). Outside those sectors, the level of the CPI still remains below its pre-pandemic trend, while the level of the PCE deflator is barely above it (Chart 26). Aside from a few low-wage sectors such as retail and hospitality, overall wage growth remains contained. Neither the Atlanta Fed Wage Growth Tracker nor the Employment Cost Index – the two cleanest measures of US wage inflation – is signaling a brewing wage-price spiral (Chart 27). Chart 25Rebounding Pandemic-Affected Services Prices Are Pushing Up Overall CPI
2021 Third Quarter Strategy Outlook: The Path To Normal
2021 Third Quarter Strategy Outlook: The Path To Normal
Chart 26AUnwinding Of "Base Effects" (I)
Unwinding Of "Base Effects" (I)
Unwinding Of "Base Effects" (I)
Chart 26BUnwinding Of "Base Effects" (II)
Unwinding Of "Base Effects" (II)
Unwinding Of "Base Effects" (II)
Chart 27No Sign Of A Wage-Price Spiral... For Now
No Sign Of A Wage-Price Spiral... For Now
No Sign Of A Wage-Price Spiral... For Now
Chart 28Rising Oil Prices Have Fueled The Jump In Inflation Expectations
2021 Third Quarter Strategy Outlook: The Path To Normal
2021 Third Quarter Strategy Outlook: The Path To Normal
Chart 29Inflation Expectations Back Below The Fed's Target Zone
Inflation Expectations Back Below The Fed's Target Zone
Inflation Expectations Back Below The Fed's Target Zone
Chart 30A Top In Inflation Expectations?
A Top In Inflation Expectations?
A Top In Inflation Expectations?
While inflation expectations have risen, they should fall in the second half of the year as gasoline prices descend from their seasonal highs (Chart 28). Market expectations of inflation have already dipped back below the Fed’s comfort zone (Chart 29). Inflation expectations 5-to-10 years out in the University of Michigan’s Survey of Consumers also dropped from 3% in May to 2.8% in June (Chart 30). Overall producer price inflation should decline. Chart 31 shows that lumber prices, steel prices, agriculture prices, and memory chip prices have all peaked. Taken together, all this suggests that the recent surge in inflation is indeed likely to be “transitory.” Chart 31Input Prices Have Rolled Over
Input Prices Have Rolled Over
Input Prices Have Rolled Over
Risk-Management Considerations Favor A “Go Slow” Approach Chart 32Market Participants See An Even Lower Terminal Rate Than The Fed
Market Participants See An Even Lower Terminal Rate Than The Fed
Market Participants See An Even Lower Terminal Rate Than The Fed
The financial press often characterizes the Fed’s monetary policy as ultra-accommodative. With policy rates near zero, one would be forgiven for agreeing. However, the reality is that neither the Fed nor, for that matter, most market participants think that monetary policy is all that easy. Using expectations for the terminal Fed funds rate as a proxy for the neutral rate of interest, the Fed’s estimate of the terminal rate has fallen from 4.3% in 2012 to 2.5% at present (Chart 32). Surveys of primary dealers and other market participants suggest that investors think the terminal rate is even lower than what the Fed believes it to be. It is an open question as to whether the neutral rate really is as low as widely believed. But if it is, raising rates prematurely would be a grave mistake. Given the zero lower bound constraint on nominal policy rates, the Fed would be hard-pressed to ease monetary policy by enough to respond to any future deflationary shock. In contrast, if inflation proves to be more persistent, raising rates to cool the economy would be relatively straightforward. All this suggests that the Fed is likely to maintain its “go slow” approach. This publication expects tapering of QE to begin early next year, with no rate hike until December 2022 or early 2023. Other Central Banks Constrained By The Fed Chart 33Long-Term Inflation Expectations Remain Subdued
Long-Term Inflation Expectations Remain Subdued
Long-Term Inflation Expectations Remain Subdued
The Fed’s dovish bias limits the ability of other developed economy central banks to tighten monetary policy. For some central banks, such as the ECB and BoJ, raising rates is the last thing they want to do. In both the euro area and Japan, long-term inflation expectations remain well below target (Chart 33). The Bank of England is in a better position to tighten monetary policy than the ECB. Inflation expectations are relatively high in the UK and a frothy housing market poses a long-term threat to economic stability. Nevertheless, the need to maintain a competitive currency to facilitate post-Brexit economic adjustments will limit the BoE’s ability to raise rates. Moreover, the departure of BoE Chief Economist, Andy Haldane, from the MPC will silence the sole voice sounding the alarm over rising inflation. Among the G7 economies, the Bank of Canada is the closest to raising rates. After a slow start, the vaccination campaign is now progressing well there. Property prices have gone through the roof. The Western Canada Select oil price has reached the highest level since 2014. The discount to WTI has shrunk from a peak over 50% in November 2018 to about 20% in recent weeks. The Bank of Canada has already begun tapering asset purchases. While concerns about a stronger loonie will tie the BoC’s hands to some extent, the first rate hike is still likely in mid-2022. II. Financial Markets A. Portfolio Strategy The Golden Rule embraced by this publication is “remain bullish on stocks as long as growth is likely to remain strong for the foreseeable future.” Historically, bear markets rarely occur outside of recessions (Chart 34). With both fiscal and monetary policy still supportive, and households in many countries sitting on plenty of dry powder, the odds that the global economy will experience a major downturn in the next 12 months are low. Chart 34Recessions And Bear Markets Tend To Overlap
2021 Third Quarter Strategy Outlook: The Path To Normal
2021 Third Quarter Strategy Outlook: The Path To Normal
That said, we do acknowledge that the risk-reward profile for equities has deteriorated since the start of the year. Global stocks have risen 12% year-to-date, implying that investors have priced in an increasingly optimistic economic outlook. Our equity valuation indicator points to very poor long-term future returns, particularly in the US (Chart 35). Chart 35ALong-Term Expected Returns Are Nothing To Write Home About (I)
Long-Term Expected Returns Are Nothing To Write Home About (I)
Long-Term Expected Returns Are Nothing To Write Home About (I)
Chart 35BLong-Term Expected Returns Are Nothing To Write Home About (II)
Long-Term Expected Returns Are Nothing To Write Home About (II)
Long-Term Expected Returns Are Nothing To Write Home About (II)
Democrats in Congress will likely use the reconciliation process to raise corporate taxes. While this is unlikely to cause major problems for the economy, it could weigh on stocks. As we discussed in a past report, neither analyst earnings estimates nor market expectations are baking in much impact from higher tax rates. Meanwhile, economic growth has peaked in the US and China, and will peak in the other major economies over the balance of 2021. Slower growth is usually associated with lower overall equity returns (Table 2). Stocks are also likely to face headwinds as spending shifts back from goods to services. Goods producers are overrepresented in stock market indices compared to the broader economy. Table 2The Economic Cycle And Financial Assets
2021 Third Quarter Strategy Outlook: The Path To Normal
2021 Third Quarter Strategy Outlook: The Path To Normal
The fact that global growth is peaking at exceptionally high levels will soften the blow for stocks. Likewise, the need to rebuild inventories and satisfy pent-up demand for some manufactured goods that have been in short supply will keep goods production from falling too drastically. Nevertheless, investors who have been maximally overweight stocks should consider paring exposure by raising cash. Only a modest equity overweight is appropriate going into the second half of this year. B. Equity Sectors, Regions, And Styles While we continue to favor cyclical equity sectors over defensives, non-US over the US, and value over growth, our conviction is lower than it was at the start of the year. In the near term, the lagged effects from the slowdown in Chinese credit growth could weigh on global cyclicals. Cyclicals could also stumble as the Delta variant rolls through the US and other countries. In addition, the US dollar could sustain recent gains as investors continue to fret that the Fed is turning hawkish. A stronger dollar is usually bad for cyclicals and non-US stocks (Chart 36). Chart 36Cyclical And Non-US Stocks Tend To Outperform Defensives When The Dollar Is Weakening
Cyclical And Non-US Stocks Tend To Outperform Defensives When The Dollar Is Weakening
Cyclical And Non-US Stocks Tend To Outperform Defensives When The Dollar Is Weakening
Chart 37Bank Shares Thrive in A Rising Yield Environment
Bank Shares Thrive in A Rising Yield Environment
Bank Shares Thrive in A Rising Yield Environment
Ultimately, as discussed earlier in this report, the Fed is likely to push back against the market’s hawkish interpretation of its dot plot. The resulting reflationary impulse should cause the dollar to weaken over a 12-month horizon while allowing for a re-steepening of the yield curve. Higher long-term bond yields tend to benefit banks, which are overrepresented in value indices (Chart 37). A stabilization in credit growth and more stimulative Chinese policy later this year should temper concerns about EM growth. Greater access to vaccines will also allow more EM economies to partake in reopening euphoria, thus benefiting local EM stock markets and global cyclicals. C. Fixed Income If stocks are pricey, government bonds are even more dear. Real yields are negative in most G10 economies. And while persistently higher inflation is not an imminent threat, it is a longer-term risk that bond valuations are not discounting. We expect the 10-year US Treasury yield to rise to 1.9% by the end of the year, above current market expectations of 1.61%. As of today, we are expressing this view by going short the 10-year Treasury note in our trade table. US Treasuries have a higher beta than most other government bond markets (Chart 38). Treasury yields tend to rise more when global bond yields are moving higher and vice versa. Given our expectation that global growth will remain solidly above trend over the next 12 months, fixed-income investors should underweight high-beta bond markets such as the US and Canada, while overweighting the euro area and Japan. Chart 38US Treasuries Have A Higher Beta Than Most Other Government Bond Markets
US Treasuries Have A Higher Beta Than Most Other Government Bond Markets
US Treasuries Have A Higher Beta Than Most Other Government Bond Markets
BCA’s bond strategists see more upside from high-yield bonds than for investment grade. While high-yield spreads are quite tight, they are still pricing in a default rate of 2.9%. This is more than their fair-value default estimate of 2.3%-to-2.8% (Chart 39). It is also above the year-to-date realized default rate of 1.8%. Chart 39Spread-Implied Default Rate
Spread-Implied Default Rate
Spread-Implied Default Rate
Our bond team sees USD-denominated EM corporate bonds as being attractively priced relative to domestic investment-grade corporate bonds with the same duration and credit rating. They prefer EM corporates to EM sovereigns in the A and Baa credit tiers, while preferring EM sovereigns over EM corporates in the Aa credit tier. Investors willing to take on foreign-exchange risk should consider EM local-currency bonds. As we discuss next, a weaker US dollar over the next 12 months should translate into stronger EM currencies. D. Currencies Four forces tend to drive the US dollar over cyclical horizons of about 12 months: Growth: As a countercyclical currency, the dollar typically does poorly when global growth is strong. This is especially the case when growth is rotating away from the US to other countries (Chart 40). Bloomberg consensus estimates imply that the US economy will transition from leader to laggard over the coming months, which is dollar bearish (Table 3). Chart 40The Dollar Is A Countercyclical Currency
The Dollar Is A Countercyclical Currency
The Dollar Is A Countercyclical Currency
Table 3Growth Is Peaking, But At A Very High Level
2021 Third Quarter Strategy Outlook: The Path To Normal
2021 Third Quarter Strategy Outlook: The Path To Normal
Interest Rate Differentials: The trade-weighted dollar tends to track the real 2-year spread between the US and its trading partners (Chart 41). It is unlikely that US real rates will fall much from current levels. However, the current level of spreads is already consistent with a meaningfully weaker dollar. Chart 41Rate Differentials Are A Headwind For The Dollar
Rate Differentials Are A Headwind For The Dollar
Rate Differentials Are A Headwind For The Dollar
Balance Of Payments: The US trade deficit has increased significantly over the past year (Chart 42). Equity inflows have been helping to finance the trade deficit (Chart 43). However, if stronger growth abroad causes equity flows to move out of the US, the dollar will suffer. Chart 42The US Trade Deficit Has Increased Significantly
The US Trade Deficit Has Increased Significantly
The US Trade Deficit Has Increased Significantly
Chart 43Equity Inflows Have Helped Finance The Trade Deficit
Equity Inflows Have Helped Finance The Trade Deficit
Equity Inflows Have Helped Finance The Trade Deficit
Momentum: Being a contrarian is a losing strategy when it comes to trading the dollar. This is because the US dollar is a high momentum currency (Chart 44). The dollar usually continues to weaken when it is trading below its various moving averages and sentiment is bearish (Chart 45). At present, while the dollar is near its short-term moving averages, it is still below its long-term moving averages. Sentiment is bearish, but has come off its lows. On balance, the technical picture for the dollar is slightly negative. Chart 44The Dollar Is A High Momentum Currency
2021 Third Quarter Strategy Outlook: The Path To Normal
2021 Third Quarter Strategy Outlook: The Path To Normal
Chart 45ABeing A Contrarian Doesn't Pay When It Comes To Trading The Dollar (I)
Being A Contrarian Doesn't Pay When It Comes To Trading The Dollar (I)
Being A Contrarian Doesn't Pay When It Comes To Trading The Dollar (I)
Chart 45BBeing A Contrarian Doesn't Pay When It Comes To Trading The Dollar (II)
Being A Contrarian Doesn't Pay When It Comes To Trading The Dollar (II)
Being A Contrarian Doesn't Pay When It Comes To Trading The Dollar (II)
Adding it all up, we expect the dollar to weaken over a 12-month horizon. The dollar’s downdraft will likely begin in earnest during the fall when Chinese policy turns more stimulative and fears that the Fed has turned hawkish subside. We expect EUR/USD to finish the year at 1.25. GBP/USD should hit 1.50. Both EM and commodity currencies should also do better. The lone laggard among “fiat currencies” will be the yen. As a highly defensive currency, the yen usually struggles when global growth is firm. Chart 46To This Day, Most Crypto Payments Are Made To Criminals
2021 Third Quarter Strategy Outlook: The Path To Normal
2021 Third Quarter Strategy Outlook: The Path To Normal
What about cryptocurrencies? I debated the topic with my colleague, Dhaval Joshi, in early June. To make a long story short, I think it is highly unlikely that cryptos will ever thrive. More than 13 years since Bitcoin was created, cryptos continue to be mainly used to facilitate illicit transactions. According to Chainalysis, there were fewer cryptocurrency payments processed by merchants in 2020 than in 2017 (Chart 46). Meanwhile, Bitcoin mining continues to produce significant environmental damage (Chart 47). And if there is any place where there is hyperinflation, it is in the creation of new cryptocurrencies. There are over 5000 cryptocurrencies at last count, double the number at this time last year (Chart 48). We are currently short Bitcoin in our trade table. Chart 47Bitcoin And Ethereum: How Dare You!
2021 Third Quarter Strategy Outlook: The Path To Normal
2021 Third Quarter Strategy Outlook: The Path To Normal
Chart 48Hyperinflation In New Cryptocurrency Creation
2021 Third Quarter Strategy Outlook: The Path To Normal
2021 Third Quarter Strategy Outlook: The Path To Normal
E. Commodities Structurally, oil faces a bleak future. Transport accounts for about 60% of global oil consumption. The shift to electric vehicles will undermine this key source of oil demand. Cyclically, however, crude prices could still rise as the global economic recovery unfolds. Supply remains quite tight, reflecting both OPEC vigilance and the steep drop in oil and gas capex of recent years (Chart 49). Bob Ryan, BCA’s chief commodity strategist, expects Brent to rise to $79/bbl by the end of the year, which is 9% above current market expectations (Chart 50). Chart 49Oil And Gas Companies Curtailed Capex In Recent Years
2021 Third Quarter Strategy Outlook: The Path To Normal
2021 Third Quarter Strategy Outlook: The Path To Normal
Chart 50Oil Prices Still Have Room To Run
Oil Prices Still Have Room To Run
Oil Prices Still Have Room To Run
Chart 51Chinese Metal Consumption Up 5-Fold Since The 2000s Commodity Boom
Chinese Metal Consumption Up 5-Fold Since The 2000s Commodity Boom
Chinese Metal Consumption Up 5-Fold Since The 2000s Commodity Boom
In contrast to oil, the long-term outlook for base metals is favorable. A typical electric vehicle requires four times as much copper as a typical gasoline-propelled vehicle. By 2030, the demand from EVs alone should amount to close to 4mm tonnes of copper per year, representing about 15% of current annual copper production. Strong demand for metals from China should also buoy metals prices. While trend GDP growth in China has slowed, the economy is much bigger in absolute terms than it was in the 2000s. China’s annual aggregate consumption of metals is five times as high as it was back then (Chart 51). In the near term, however, base metals have to grapple with the lagged effects of slower Chinese credit growth (Chart 52). We downgraded base metals to neutral on May 28 and are currently long global energy stocks via the IXC ETF versus global copper miners via the COPX ETF. We expect to reverse this trade by the fall. We are generally positive on gold. Since peaking last August, the price of gold has fallen more than one might have expected based on movements in real bond yields (Chart 53). Gold will also benefit from a weaker dollar later this year. Lastly, and importantly, gold should retain its standing as a good inflation hedge. Chart 52Tighter Chinese Credit Will Be A Headwind For Base Metals Over The Summer Months
Tighter Chinese Credit Will Be A Headwind For Base Metals Over The Summer Months
Tighter Chinese Credit Will Be A Headwind For Base Metals Over The Summer Months
Chart 53Gold Prices Tend To Track Real Rates
Gold Prices Tend To Track Real Rates
Gold Prices Tend To Track Real Rates
Peter Berezin Chief Global Strategist pberezin@bcaresearch.com Global Investment Strategy View Matrix
2021 Third Quarter Strategy Outlook: The Path To Normal
2021 Third Quarter Strategy Outlook: The Path To Normal
Special Trade Recommendations
2021 Third Quarter Strategy Outlook: The Path To Normal
2021 Third Quarter Strategy Outlook: The Path To Normal
Current MacroQuant Model Scores
2021 Third Quarter Strategy Outlook: The Path To Normal
2021 Third Quarter Strategy Outlook: The Path To Normal
Highlights The sharp drop in Chinese lending over the past year is highly likely to weigh on (non-oil) commodity demand and prices through the remainder of 2021. Commodity demand shocks dominate commodity supply shocks. Commodity supply shocks play only a transient role in setting prices. Go underweight basic resources equities versus the market. Commodity currencies like the Canadian dollar and New Zealand dollar are likely to underperform versus the US dollar. Fractal trade: Short corn versus wheat. Feature Chart of the WeekDeclining Chinese Lending Is A Headwind For Metal Prices
Declining Chinese Lending Is A Headwind For Metal Prices
Declining Chinese Lending Is A Headwind For Metal Prices
The recent collapse in China’s credit impulse has caught a lot of people’s attention, ours included. The collapse in the credit impulse quantifies the change in lending. Importantly, this means that even if the lending numbers themselves are large, the impulse will collapse if those lending numbers are declining – which is precisely what has happened in China. In the past year, China’s broad money supply has expanded by $17 trillion yuan, signifying a large amount of lending in the $100 trillion yuan economy. All well and good, except that the $17 trillion yuan has declined from an even larger $21 trillion yuan a year ago. To the extent that loans fund the demand for something, the $4 trillion yuan decline in those loans means that the demand for the something also declines. In the case of China, the something is the demand for industrial commodities, especially industrial metals (Chart of the Week). Using total social financing rather than the broad money supply reveals a similar downtrend in lending, and therefore a similarly collapsed impulse (Chart I-2 and Chart I-3) But as we explain in the next section, our preference is to focus on China’s broad money supply. Chart I-2Chinese Lending Is ##br##Declining...
Chinese Lending Is Declining...
Chinese Lending Is Declining...
Chart I-3...So The 12-Month Credit Impulse Has Collapsed
...So The 12-Month Credit Impulse Has Collapsed
...So The 12-Month Credit Impulse Has Collapsed
Declining Chinese Lending Is A Headwind For Metal Demand When interpreting the lending numbers in any economy, there are four important things to keep in mind. First, we should focus on bank lending. This is because the magic of fractional reserve banking allows a bank to create money and new spending power out of thin air. When somebody borrows from a bank, his bank account and spending power goes up, but nobody’s spending power goes down. In contrast, when somebody borrows by issuing a bond, it just reallocates spending power from one person to another. The bond issuer sees his bank account and spending power go up, but the bond buyer sees his bank account and spending power go symmetrically down. Demand will rise to the extent that the borrower has a higher propensity to spend than the lender, but this may or may not be the case. Second, and as already mentioned, the impact on economic demand comes from the change in lending – which is to say the credit impulse. This is just to compare apples with apples. Remember that GDP, demand, and lending are all flow statistics. Meaning that the change in demand depends on the change in lending (and not from absolute lending itself).1 Third, the most important part of lending is bank lending to the non-financial sector.2 This is because not all loans generate economic activity. Bank-to-bank lending and reserves held at the central bank stay trapped in the financial system. The money supply – which is on the liabilities side of the banks’ balance sheet – might not pick up this distinction. It could be expanding rapidly due to a surge in bank-to-bank lending and/or in reserves, giving the false signal that demand should be growing. Hence, it is better to focus on bank lending – which is on the assets side of the banks’ balance sheet – and only count lending that is likely to generate economic activity. However, this logic only works if the official data on bank loans is accurate and complete. In China, this is unlikely to be the case, given its large shadow banking system. Total social financing includes most, but not all, shadow lending. Yet all shadow lending must eventually show up in the money supply. For this reason, in analysing Chinese lending, we prefer to focus on the broad money supply. Having said that, the messages coming from both the broad money supply and total social financing concur. Chinese lending is slowing. Chinese lending is slowing. Fourth, we should choose the periodicity of the analysis to maximize its predictive power. This will depend on the specific lead times between the lending and the demand that it is funding, which will be discovered empirically. We find that the 1-year change in China’s broad money supply provides an excellent 1-year lead on industrial metal prices, because the lending leads commodity demand. The obvious rejoinder is, what about tight supply? The answer, from a recent academic paper – Drivers of commodity price booms and busts in the long run – is that for (non-oil) commodities, demand dominates supply. Specifically, “aggregate commodity and commodity-specific demand shocks appear to strongly dominate commodity supply shocks in driving variation in real commodity prices… commodity supply shocks play a rather secondary and transient role.”3 On this basis, we conclude that the sharp drop in Chinese lending over the past year is highly likely to weigh on (non-oil) commodity prices through the remainder of 2021 (Chart I-4 and Chart I-5). Chart I-4Declining Chinese Lending Is A Headwind For Industrial Metals...
Declining Chinese Lending Is A Headwind For Industrial Metals...
Declining Chinese Lending Is A Headwind For Industrial Metals...
Chart I-5...And Iron Ore ##br##Prices
...And Iron Ore Prices
...And Iron Ore Prices
Chinese Lending Is An Investment ‘Super-Driver’ We are strong believers in investment reductionism. Our reductionist philosophy stems from two guiding principles: Occam’s Razor – which says that when there are competing explanations for the same effect, the simplest explanation is usually the best; and the Pareto Principle – which says that 80% of effects come from just 20% of causes.4 Investment banks hate investment reductionism. Given that they want to sell you as much product as possible, they make investment seem much more complicated than it is. Yet most of the moves in most financial markets result from a very small number of ‘super-drivers.’ Our objective is to un-complicate investment – to identify the super-drivers, and to call them right. Clearly, one super-driver right now is the evolution of the pandemic, and specifically the evolution of new variants of the virus, as we discussed in Viral Variants Strike Down The Reflation Trade. A second super-driver is the direction of the T-bond yield, because this drives the direction of many other market trends such as growth versus value, defensives versus cyclicals, and US versus Europe. As we discussed in Don’t Panic About US Inflation, the T-bond yield is likely to drift lower in the coming months. Today’s report identifies a third super-driver – the evolution of Chinese lending. To repeat, the sharp drop in Chinese lending over the past year is highly likely to weigh on (non-oil) commodity prices through the remainder of 2021. The sharp drop in Chinese lending over the past year is highly likely to weigh on commodity prices through the remainder of 2021. This means that basic resources equities are likely to underperform both in absolute terms, and relative to the broader market (Chart I-6 and Chart I-7). On a 6-month horizon, go underweight basic resources versus the market. Chart I-6Declining Chinese Lending Is A Headwind For Basic Resources Equities, Both In Absolute Terms...
Declining Chinese Lending Is A Headwind For Basic Resources Equities, Both In Absolute Terms...
Declining Chinese Lending Is A Headwind For Basic Resources Equities, Both In Absolute Terms...
Chart I-7...And Relative To The Broad ##br##Market
...And Relative To The Broad Market
...And Relative To The Broad Market
It also means that commodity currencies like the Canadian dollar and New Zealand dollar are likely to underperform versus the US dollar (Chart I-8 and Chart I-9). Chart I-8The Canadian Dollar Just Tracks Inflation Expectations
The Canadian Dollar Just Tracks Inflation Expectations
The Canadian Dollar Just Tracks Inflation Expectations
Chart I-9The New Zealand Dollar Just Tracks Inflation Expectations
The New Zealand Dollar Just Tracks Inflation Expectations
The New Zealand Dollar Just Tracks Inflation Expectations
Commodities Are Fractally Fragile Reinforcing the super-driver of a Chinese lending slowdown, the 260-day fractal structure of the commodity complex is at the same extreme of fragility that heralded turning-points in 2009, 2010, 2018, and 2020 (Chart I-10). Chart I-10The Fractal Structure Of The Commodity Complex Is Extremely Fragile
The Fractal Structure Of The Commodity Complex Is Extremely Fragile
The Fractal Structure Of The Commodity Complex Is Extremely Fragile
As a reminder, a fragile fractal structure is a warning that the time horizons of investors setting the investment’s price has become dangerously skewed to short-term horizons. At this point, as longer-term value investors are missing from the price setting process, the price becomes unmoored from the longer-term valuation anchor. Eventually though, when the longer-term investors re-enter the price setting process, the price snaps back towards the valuation anchor. A fragile fractal structure is a warning that the time horizons of investors setting the investment’s price has become dangerously skewed to short-term horizons. In early May, we highlighted this fragility in the commodity complex and, exactly as anticipated, most commodities then started to correct. We are trading the on-going correction in commodities through a short position in PKB as well as short CAD/USD, and both positions are now in healthy profit. Staying on the theme of commodities, the 60 percent outperformance of corn versus wheat over the past year is only starting to correct now (Chart I-11). Hence, a recommended trade is to short the corn future (number 2, yellow) versus the wheat future (number 2, soft red) setting the profit target and symmetrical stop-loss at 12 percent. Chart I-11The 60 Percent Outperformance Of Corn Versus Wheat Will Soon Correct
The 60 Percent Outperformance Of Corn Versus Wheat Will Soon Correct
The 60 Percent Outperformance Of Corn Versus Wheat Will Soon Correct
Finally, relating to a non-commodity position, we have extended by 33 days the holding period of short France versus Japan. Thus far, the position has traded sideways so we are giving it more time to move into profit. Dhaval Joshi Chief Strategist dhaval@bcaresearch.com Footnotes 1 The change in lending is the definition of the credit impulse. 2 The non-financial sector includes households, (non-financial) firms and government. 3 Voxeu.org: Drivers of commodity price booms and busts in the long run, David Jacks and Martin Stuermer. 4 Often known as the 80-20 rule. In fact, it could be 90-10, 95-5, or even 100-5 as the numbers do not have to add up to 100. Fractal Trading System Fractal Trades 6-Month Recommendations Structural Recommendations Closed Fractal Trades Closed Trades Asset Performance Equity Market Performance Indicators To Watch - Bond Yields Chart II-1Indicators To Watch - Bond Yields - Euro Area
Indicators To Watch - Bond Yields - Euro Area
Indicators To Watch - Bond Yields - Euro Area
Chart II-2Indicators To Watch - Bond Yields - Europe Ex Euro Area
Indicators To Watch - Bond Yields - Europe Ex Euro Area
Indicators To Watch - Bond Yields - Europe Ex Euro Area
Chart II-3Indicators To Watch - Bond Yields - Asia
Indicators To Watch - Bond Yields - Asia
Indicators To Watch - Bond Yields - Asia
Chart II-4Indicators To Watch - Bond Yields - Other Developed
Indicators To Watch - Bond Yields - Other Developed
Indicators To Watch - Bond Yields - Other Developed
Indicators To Watch - Interest Rate Expectations Chart II-5Indicators To Watch - Interest Rate Expectations
Indicators To Watch - Interest Rate Expectations
Indicators To Watch - Interest Rate Expectations
Chart II-6Indicators To Watch - Interest Rate Expectations
Indicators To Watch - Interest Rate Expectations
Indicators To Watch - Interest Rate Expectations
Chart II-7Indicators To Watch - Interest Rate Expectations
Indicators To Watch - Interest Rate Expectations
Indicators To Watch - Interest Rate Expectations
Chart II-8Indicators To Watch - Interest Rate Expectations
Indicators To Watch - Interest Rate Expectations
Indicators To Watch - Interest Rate Expectations
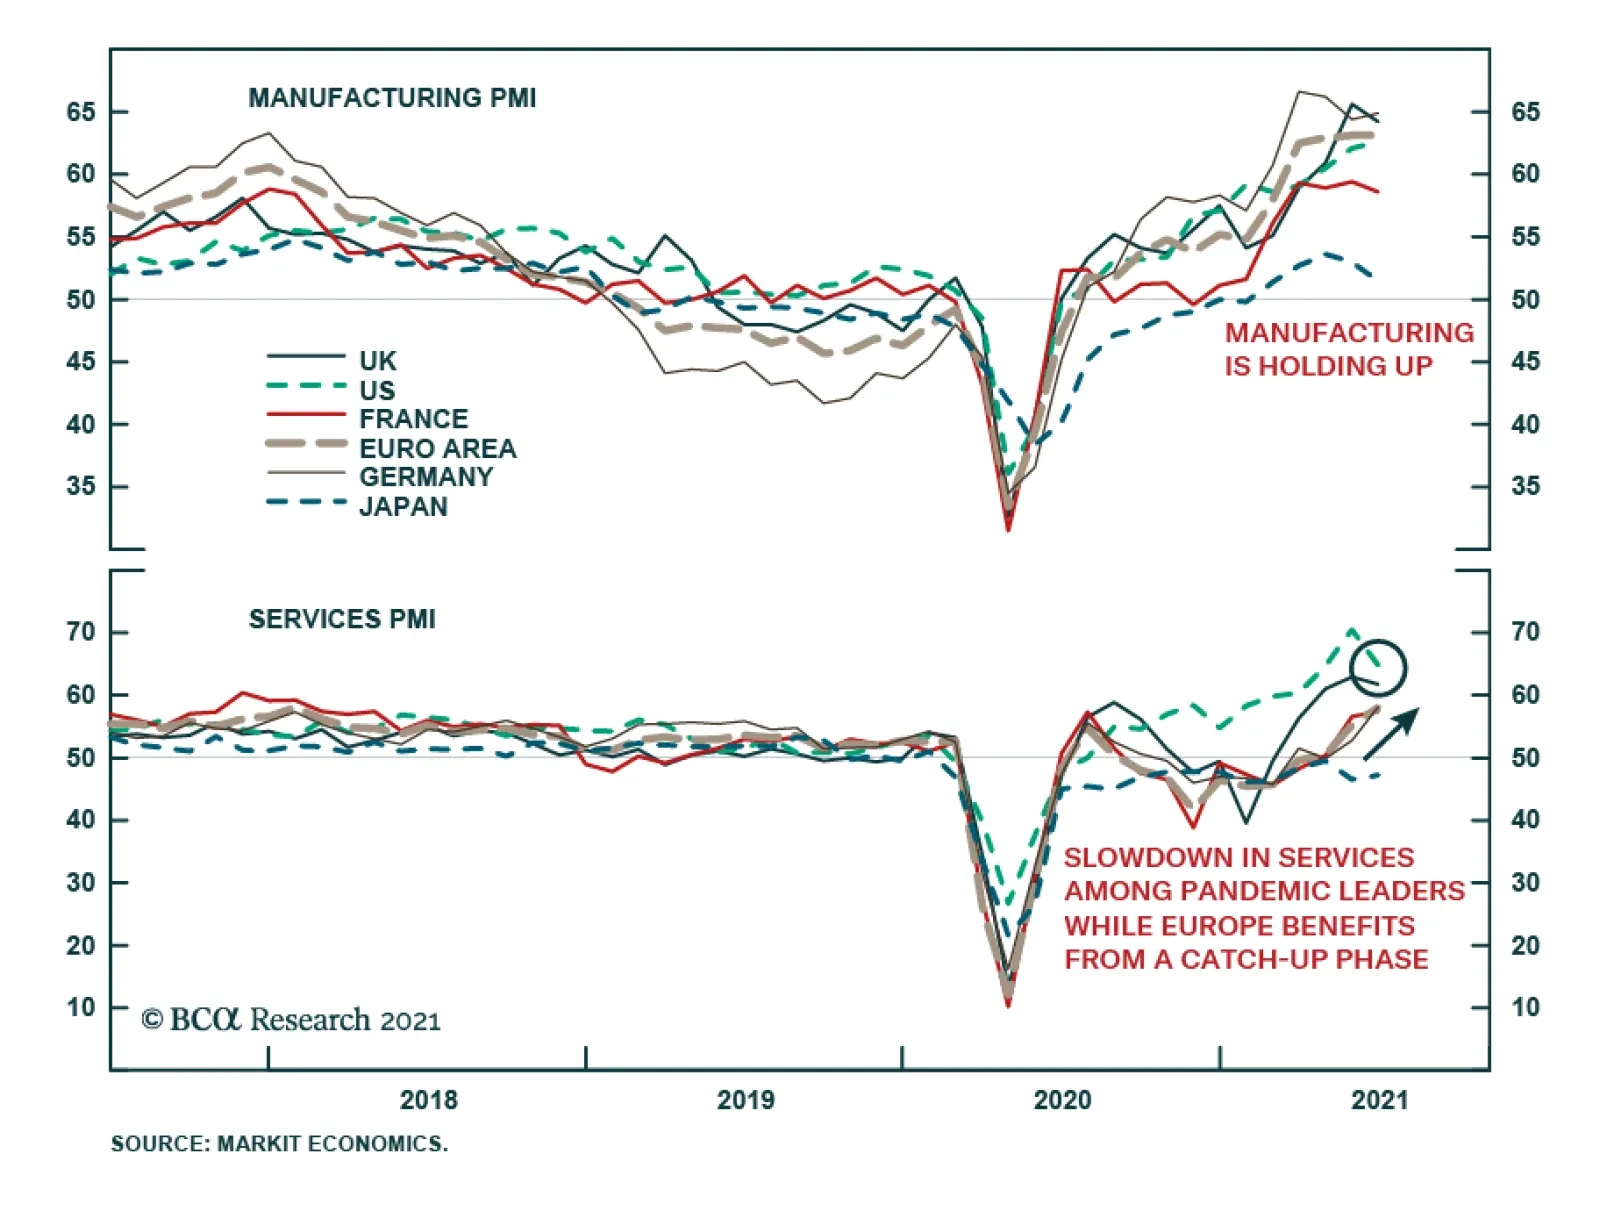
Flash PMIs were mixed in June. Composite indices for the US and to a lesser extent the UK – both leaders in the vaccine rollout and reopening process – softened. Surprisingly, US services experienced a greater than anticipated moderation while…
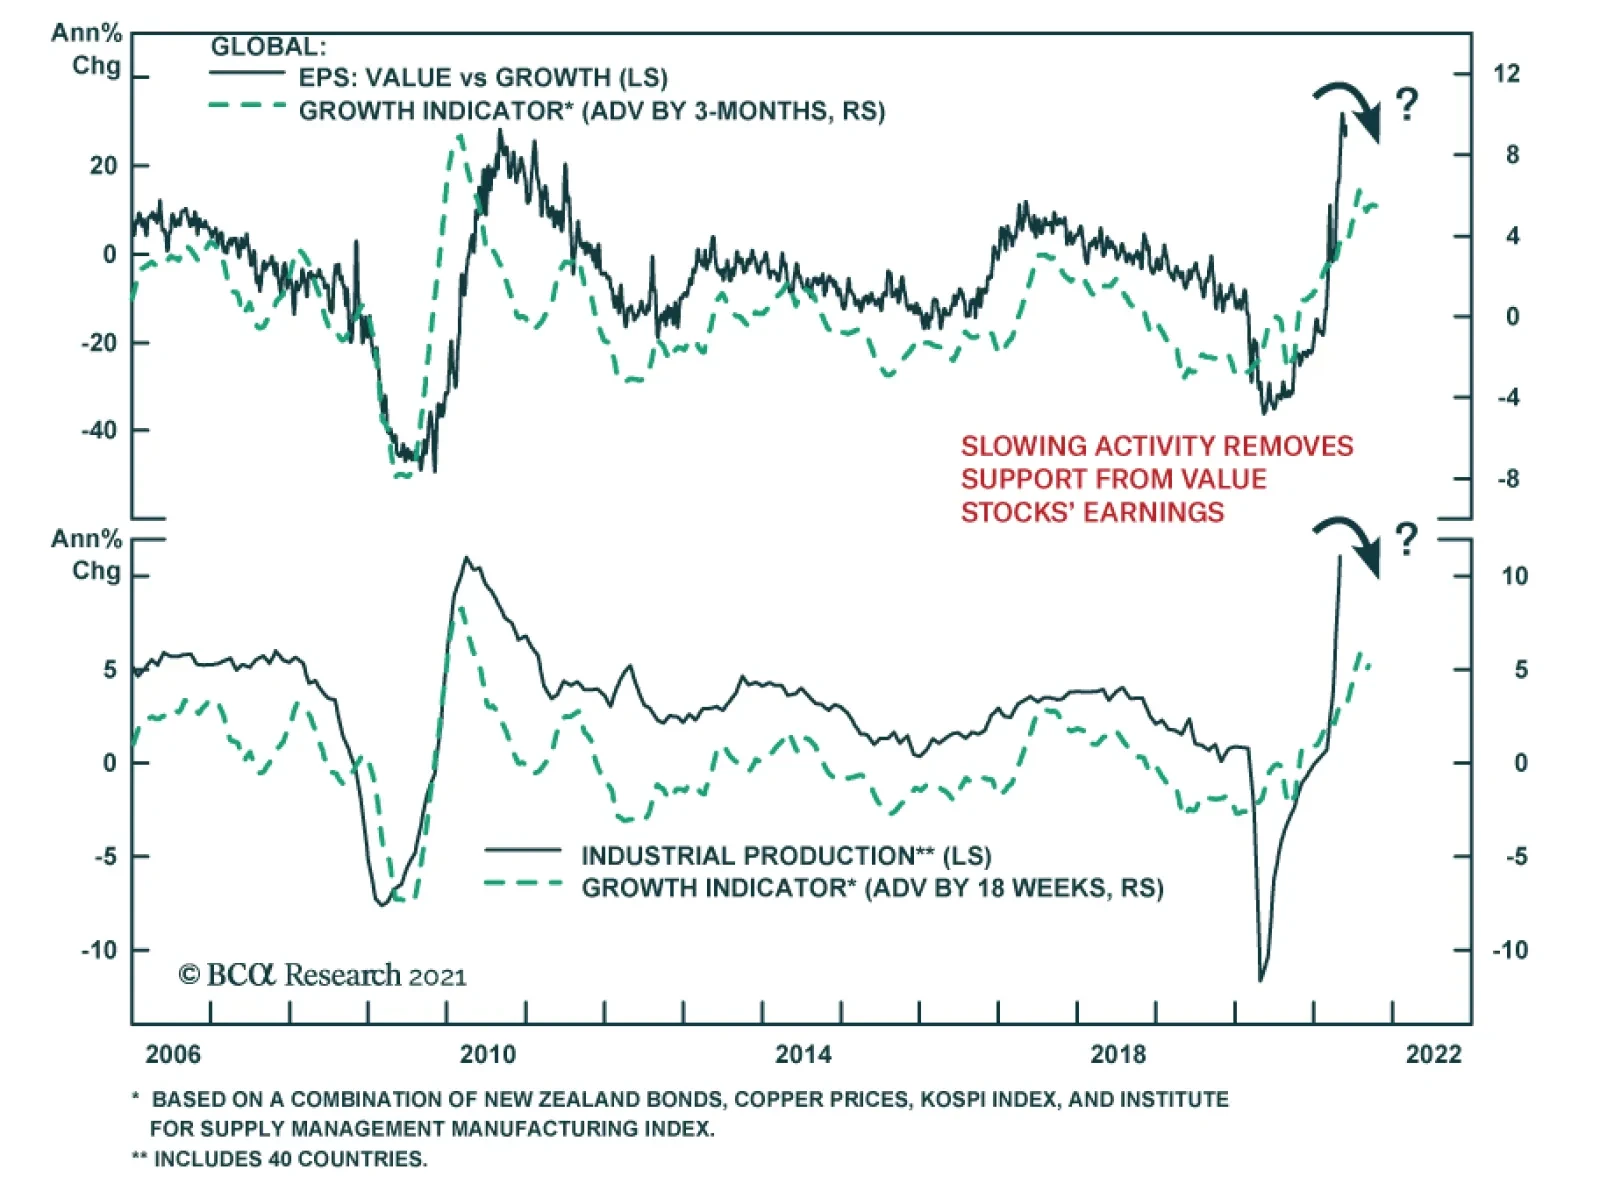
BCA Research’s Global Growth Indicator, which is based on the price of copper, Korean equities, Kiwi bonds and the US ISM manufacturing index, is sending a warning to value stocks. Its latest readings have ticked down from the late-March peak, suggesting that…
Dear Client, Next week, instead of our regular report, we will be sending you a Special Report from BCA Research’s MacroQuant tactical global asset allocation team. Titled “MacroQuant: A Quantitative Solution For Forecasting Macro-Driven Financial Trends,” this white paper will discuss the purpose, coverage, and methodology of the MacroQuant model. I hope you will find the report insightful. We will be back the following week with the GIS Quarterly Strategy Outlook, where we will explore the major trends that are set to drive financial markets for the rest of 2021 and beyond. We will also be holding a webcast on Thursday, July 8 at 10:00 AM EDT (3:00 PM BST, 4:00 PM CEST, 10:00 PM HKT) to discuss the outlook. Best regards, Peter Berezin Chief Global Strategist Highlights Although the Fed delivered a hawkish surprise on Wednesday, monetary policy is likely to remain highly accommodative for the foreseeable future. We continue to see high US inflation as a long-term risk rather than a short-term problem. Outside of a few industries, wage inflation remains well contained. In those industries suffering from labor shortages, the expiration of emergency unemployment benefits, increased immigration, and the opening up of schools should replenish labor supply. Bottlenecks in the global supply chain are starting to ease. Many key input prices have already rolled over, suggesting that producer price inflation has peaked and is heading down. A slowdown in Chinese credit growth could weigh on metals prices during the summer months, which would further temper inflationary pressures. We are downgrading our view on US TIPS from overweight to neutral. Owning bank shares is a cheaper inflation hedge. Look Who’s Talking The Fed jolted markets on Wednesday after the FOMC signaled it may raise rates twice in 2023. Back in March, the Fed projected no hikes until 2024 (Chart 1). Chart 1Fed Forecasts Converge Toward Market Expectations
Don’t Sweat US Inflation…Just Yet
Don’t Sweat US Inflation…Just Yet
Seven of 18 committee members expected lift-off as early as 2022, up from four in March. Only five participants expected the Fed to start raising rates in 2024 or later, down from 11 previously. The Fed acknowledged recent upward inflation surprises by lifting its forecast of core PCE inflation to 3.4% for 2021 compared with the March projection of 2.4%. These forecast revisions bring the Fed closer to market expectations, although the latter are proving to be a moving target. Going into the FOMC meeting, the OIS curve was pricing in 85 bps of rate tightening by the end of 2023. At present, the market is pricing in about 105 bps of tightening. At his press conference, Chair Powell acknowledged that FOMC members had discussed scaling back asset purchases. “You can think of this meeting as the ‘talking about talking about’ meeting,” he said. A rate hike in 2023 would imply the start of tapering early next year. The key question for investors is whether this week’s FOMC meeting marks the first of many hawkish surprises from the Fed. We do not think it does. As Chair Powell himself noted, the dot-plot is “not a great forecaster of future rate moves,” before adding that “Lift-off is well into the future.” Ultimately, a major monetary tightening cycle would require that inflation remain stubbornly high. As we discuss below, while there are good reasons to think that the US economy will eventually overheat, the current bout of inflation is indeed likely to be “transitory.” This implies that bond yields are unlikely to rise into restrictive territory anytime soon, which should provide continued support to stocks. Inflation: A Long-Term Risk Rather Than A Short-Term Problem Chart 2Globalization Plateaued More Than A Decade Ago
Globalization Plateaued More Than A Decade Ago
Globalization Plateaued More Than A Decade Ago
There are plenty of reasons to worry that US inflation will eventually move persistently higher. As we discussed in a recent report, many of the structural factors that have suppressed inflation over the past 40 years are reversing direction: Globalization is in retreat: The ratio of global trade-to-manufacturing output has been flat for over a decade (Chart 2). Looking out, the ratio could even decline as more companies shift production back home in order to gain greater control over unruly global supply chains. Baby boomers are leaving the labor force en masse. As a group, baby boomers control more than half of US wealth (Chart 3). They will continue to run down their wealth once they retire. However, since they will no longer be working, they will no longer contribute to national output. Continued spending against a backdrop of diminished production could be inflationary. Chart 3Baby Boomers Have Accumulated A Lot Of Wealth
Don’t Sweat US Inflation…Just Yet
Don’t Sweat US Inflation…Just Yet
Despite a pandemic-induced bounce, underlying productivity growth remains disappointing (Chart 4). Slow productivity growth could cause aggregate supply to fall short of aggregate demand. Social stability is in peril, as exemplified by the recent dramatic increase in the US homicide rate. In the past, social instability and higher inflation have gone hand in hand (Chart 5). Chart 4Trend Productivity Growth Has Been Disappointing
Trend Productivity Growth Has Been Disappointing
Trend Productivity Growth Has Been Disappointing
Chart 5Historically, Social Unrest And Higher Inflation Move In Lock-Step
Historically, Social Unrest And Higher Inflation Move In Lock-Step
Historically, Social Unrest And Higher Inflation Move In Lock-Step
Perhaps most importantly, policymakers are aiming to run the economy hot. A tight labor market will lift wage growth (Chart 6). Not only could higher wage growth push up inflation through the usual “cost-push” channel, but by boosting labor’s share of income, a tight labor market could spur aggregate demand. Despite these structural inflationary forces, history suggests that it will take a while – perhaps another two-to-four years – for the US economy to overheat to the point that persistently higher inflation becomes a serious risk. Consider the case of the 1960s. While the labor market reached its full employment level in 1962, it was not until 1966 – when the unemployment rate was a full two percentage points below NAIRU – that inflation finally took off (Chart 7). Chart 6A Tight Labor Market Eventually Bolsters Wages
A Tight Labor Market Eventually Bolsters Wages
A Tight Labor Market Eventually Bolsters Wages
Chart 7Inflation Started Accelerating Quickly Only When Unemployment Reached Very Low Levels In The 1960s
Inflation Started Accelerating Quickly Only When Unemployment Reached Very Low Levels In The 1960s
Inflation Started Accelerating Quickly Only When Unemployment Reached Very Low Levels In The 1960s
In May, 4.4% fewer Americans were employed than in January 2020 (Chart 8). The employment-to-population ratio for prime-aged workers stood at 77.1%, 3.4 percentage points below its pre-pandemic level (Chart 9). Chart 8US Employment Still More Than 4% Below Pre-Pandemic Levels
Don’t Sweat US Inflation…Just Yet
Don’t Sweat US Inflation…Just Yet
Chart 9Prime-Age Employment-To-Population Ratio Remains Below Pre-Pandemic Levels
Prime-Age Employment-To-Population Ratio Remains Below Pre-Pandemic Levels
Prime-Age Employment-To-Population Ratio Remains Below Pre-Pandemic Levels
A Labor Market Puzzle Admittedly, if one were to ask most companies if they were finding it easy to hire suitable workers, one would hear a resounding “no.” According to the National Federation of Independent Business (NFIB), 48% of firms reported difficulty in filling vacant positions in May, the highest share in the 46-year history of the survey (Chart 10). Chart 10US Labor Market Shortages (I)
US Labor Market Shortages (I)
US Labor Market Shortages (I)
Chart 11US Labor Market Shortages (II)
US Labor Market Shortages (II)
US Labor Market Shortages (II)
Nationwide, the job openings rate reached a record high of 6% in April, up from 4.5% in January 2020. The share of workers quitting their jobs voluntarily – a measure of worker confidence – also hit a record of 2.7% (Chart 11). How can we reconcile the apparent tightness in the labor market with the fact that employment is still well below where it was at the outset of the pandemic? Four explanations stand out. First, unemployment benefits remain extremely generous. For most low-wage workers, benefits exceed the pay they received while employed. It is not surprising that labor shortages have been most pronounced in sectors such as leisure and hospitality where average wages are relatively low (Chart 12). The good news for struggling firms is that the disincentive to working will largely evaporate by September when enhanced unemployment benefits expire. Chart 12Labor Scarcity Prevalent In Low-Wage Sectors
Don’t Sweat US Inflation…Just Yet
Don’t Sweat US Inflation…Just Yet
Chart 13School Closures Have Curbed Labor Supply
Don’t Sweat US Inflation…Just Yet
Don’t Sweat US Inflation…Just Yet
Second, lingering fears of the virus and ongoing school closures continue to depress labor force participation. Chart 13 shows that participation rates have recovered less for mothers with young children than for other demographic groups. This problem will also fade away by the fall when schools reopen. Third, the number of foreign workers coming to the US fell dramatically during the pandemic. State Department data show that visas dropped by 88% in the nine months between April and December of last year compared to the same period in 2019 (Chart 14). President Biden revoked President Trump’s visa ban in February, which should pave the way for renewed migration to the US. Chart 14US Migrant Worker Supply Is Depressed
Don’t Sweat US Inflation…Just Yet
Don’t Sweat US Inflation…Just Yet
Chart 15The Pandemic Accelerated Early Retirement
The Pandemic Accelerated Early Retirement
The Pandemic Accelerated Early Retirement
Fourth, about 1.5 million more workers retired during the pandemic than one would have expected based on the pre-pandemic trend (Chart 15). Most of these workers were near retirement age anyway. Thus, there will likely be a decline in new retirements over the next couple of years before the baby boomer exodus described earlier in this report resumes in earnest. Other Input Prices Set To Ease Just as labor shortages in a number of industries will ease later this year, some of the bottlenecks gripping the global supply chain should also diminish. The prices of various key inputs – ranging from lumber, steel, soybeans, corn, to DRAM prices – have rolled over (Chart 16). This suggests that producer price inflation for manufactured goods, which hit a multi-decade high of 13.5% in May – has peaked and is heading lower. Chart 16Input Prices Have Rolled Over
Input Prices Have Rolled Over
Input Prices Have Rolled Over
The jump in prices largely reflected one-off pandemic effects. For example, rental car companies, desperate to raise cash at the start of the pandemic, liquidated part of their fleets. Now that the US economy is reopening, they have found themselves short of vehicles. With fewer rental vehicles hitting the used car market, households flush with cash, and new vehicle production constrained by the global semiconductor shortage, both new and used car prices have soared. Vehicle prices have essentially moved sideways since the mid-1990s (Chart 17). Thus, it is doubtful that the recent surge in prices represents a structural break. More likely, prices will come down as supply increases. According to a recent report from Goldman Sachs, auto production schedules already imply an almost complete return to January output levels in June. Chart 17Vehicle Prices Have Essentially Moved Sideways Since The Mid-1990s
Vehicle Prices Have Essentially Moved Sideways Since The Mid-1990s
Vehicle Prices Have Essentially Moved Sideways Since The Mid-1990s
Chart 18Rebounding Pandemic-Affected Services Prices Are Pushing Up Overall CPI
Don’t Sweat US Inflation…Just Yet
Don’t Sweat US Inflation…Just Yet
As Chart 18 shows, more than half of the increase in consumer prices in April and May can be explained by higher vehicle prices, along with a rebound in pandemic-affected service prices (airfares, hotels, and event admissions). Outside those sectors, the level of the CPI remains below its pre-pandemic trend (Chart 19). Chart 19Unwinding Of "Base Effects"
Unwinding Of "Base Effects"
Unwinding Of "Base Effects"
Chart 20"Supercore" Inflation Measures Remain Well Contained
"Supercore" Inflation Measures Remain Well Contained
"Supercore" Inflation Measures Remain Well Contained
More refined measures of underlying inflation such as the trimmed-mean CPI, median CPI, and sticky price CPI are all running well below their official core CPI counterpart (Chart 20). While certain components of the CPI basket, such as residential rental payments, are likely to exhibit higher inflation in the months ahead, others such as vehicle and food prices will see lower inflation, and perhaps even outright deflation. Slower Chinese Credit Growth Should Temper Commodity Inflation Chart 21Chinese Credit Growth And Metal Prices Move Together
Chinese Credit Growth And Metal Prices Move Together
Chinese Credit Growth And Metal Prices Move Together
Chinese credit growth and base metals prices are strongly correlated (Chart 21). We do not expect the Chinese authorities to embark on a new deleveraging campaign. Credit growth has already fallen back to 11%, which is close to the prior bottom reached in late-2018. Nevertheless, to the extent that changes in Chinese credit growth affect commodity prices with a lag of about six months, metals prices could struggle to maintain altitude over the summer months. China’s plan to release metal reserves into the market could further dampen prices. We remain short the global copper ETF (COPX) relative to the global energy ETF (IXC) in our trade recommendations. The trade is up 18.4% since we initiated on May 27, 2021. We will close this trade if it reaches our profit target of 30%. Bank Shares Are A Better Hedge Against Inflation Than TIPS We have been overweight TIPS in our view matrix. However, with 5-year/5-year forward breakevens trading near pre-pandemic levels, any near-term upside for inflation expectations is limited (Chart 22). As such, we are downgrading TIPS from overweight to neutral in our fixed-income recommendations. Investors looking to hedge inflation risk should consider bank shares. Our baseline view is that the 10-year Treasury yield will rise to about 1.9% by the end of the year. If inflation fails to come down as fast as we anticipate, bond yields would increase even more than that. Chart 23 shows that banks almost always outperform the S&P 500 when bond yields are rising. Chart 22Limited Near-Term Upside For Inflation Expectations
Limited Near-Term Upside For Inflation Expectations
Limited Near-Term Upside For Inflation Expectations
Chart 23Bank Shares Thrive in A Rising Yield Environment
Bank Shares Thrive in A Rising Yield Environment
Bank Shares Thrive in A Rising Yield Environment
Banks are also cheap. US banks trade at 12.2-times forward earnings compared with 21.9-times for the S&P 500. Non-US banks trade at 10-times forward earnings compared to 16.4-times for the MSCI ACW ex-US index. Finally, we like gold as a long-term inflation hedge. We would go long gold in our structural trade recommendations if the price were to fall to $1700/ounce. Peter Berezin Chief Global Strategist pberezin@bcaresearch.com Global Investment Strategy View Matrix
Don’t Sweat US Inflation…Just Yet
Don’t Sweat US Inflation…Just Yet
Special Trade Recommendations
Don’t Sweat US Inflation…Just Yet
Don’t Sweat US Inflation…Just Yet
Current MacroQuant Model Scores
Don’t Sweat US Inflation…Just Yet
Don’t Sweat US Inflation…Just Yet
Highlights Oil demand expectations remain high. Realized demand continues to disappoint. This means OPEC 2.0's production-management strategy – i.e., keeping the level of supply below demand – will continue to dictate oil-price levels. US producers will remain focused on consolidation via M&A and on returning capital to shareholders, in line with the Kingdom of Saudi Arabia's (KSA) expectation. Going forward, shale producers will focus on protecting and growing profit margins. The durability of OPEC 2.0's tactical advantage arising from its enormous spare capacity – ~ 7mm b/d – is difficult to gauge: Tightening global oil markets now in anticipation of Iran's return as a bona fide exporter benefits producers globally, and could accelerate the return of US shales if that return is delayed or re-opening boosts demand more than expected. We are raising our average Brent forecast for 2021 to $66.50 vs. $63/bbl earlier, with 2H21 prices averaging $70/bbl. We are moving our 2022 and 2023 forecasts up slightly to $74 and $81/bbl (Chart of the Week). WTI will trade $2-$3/bbl lower. We remain long the S&P GSCI Dynamic Roll Index ETF (COMT) and the S&P GSCI, expecting tight supply-demand balances to further steepen backwardations in forward curves. Feature While the forecasted rebound in global oil demand continues to drive expectations for higher prices, it is the production discipline of OPEC 2.0 and capital discipline imposed on US shale producers that has and will continue to super-charge the recovery of prices. Continued monetary accommodation and fiscal stimulus notwithstanding, realized global oil demand has mostly flatlined at ~ 96mm b/d following its surge in February, as uncertainty over COVID-19 containment keeps governments hesitant about reopening their economies too quickly. Stronger demand in Asia, led by China, has been offset by weaker demand in India and Japan, where COVID-19 remains a deterrent to re-opening and recovery. The recovery in DM demand generally stalled over this period even as vaccine availability increased (Chart 2). Chart of the WeekOPEC 2.0 Comfortable With Higher Prices
Balance Of Risks Tilts To Higher Oil Prices
Balance Of Risks Tilts To Higher Oil Prices
Chart 2Global Demand Recovery Stalled
Balance Of Risks Tilts To Higher Oil Prices
Balance Of Risks Tilts To Higher Oil Prices
That likely will change in 2H21, but it is not a given: The UK, which has been among the world leaders in COVID-19 containment and vaccinations, delayed its full reopening by a month – to July 19 – in an effort to gain more time to bolster its efforts against the Delta variant first identified in India. In the US, New York state lifted all COVID-19-induced restrictions and fully re-opened this week. Still, even in the US, unintended inventory accumulation in the gasoline market – just as the summer driving season should be kicking into high gear – suggests consumers remain cautious (Chart 3). Chart 3Unintended Inventory Accumulation in US Gasoline Market
Balance Of Risks Tilts To Higher Oil Prices
Balance Of Risks Tilts To Higher Oil Prices
We continue to expect the re-opening of the US and Europe (including the UK) will boost DM demand in 2H21, and wider vaccine availability will boost EM oil demand later in the year and in 2022. For all of 2021, we have lifted our demand-growth estimate slightly to 5.3mm b/d from 5.2mm b/d last month. We expect global demand to grow 4.1mm b/d next year and 1.6mm b/d in 2023. Our 2021 estimates are in line with those of the US EIA and the IEA. OPEC is more bullish on demand recovery this year, expecting growth of 6mm b/d. We continue to believe the risk on the demand side remains to the upside; however, given continued uncertainty around global COVID-19 containment, we remain circumspect. Supply-Side Discipline Drives Oil Prices OPEC 2.0 remains committed to its production-management strategy that is keeping the level of supply below demand. Compliance with production cuts in May reportedly was at 115%, following a 114% rate in April.1 Core OPEC 2.0 – i.e., states with the capacity to increase production – is holding ~ 7mm b/d of spare capacity, according to the IEA, which will allow it to continue to perform its role as the dominant supplier in our modeling (Chart 4). Earlier this year, KSA's Energy Minister Abdulaziz bin Salman correctly recognized the turn in the market that likely ensures OPEC 2.0's dominance for the foreseeable future – i.e., the shift in focus of the US shale-oil producers from production for the sake of production to profitability.2 This is a trend that has been apparent for years as capital markets all but abandoned US shale-oil producers. Chart 4OPEC 2.0 Remains Dominant
Balance Of Risks Tilts To Higher Oil Prices
Balance Of Risks Tilts To Higher Oil Prices
Producers outside OPEC 2.0 – what we refer to as the "price-taking cohort" – have prioritized shareholder interests as a result of this market pressure, and remain focused on sometimes-forced consolidation via M&A, which we have been expecting.3 The significance of this evolution of shale-oil production is difficult to overstate, particularly as the survivors of this consolidation will be firms with strong balance sheets and a focus on profitability, as is the case with any well-run manufacturing firm. We also expect large producers to opportunistically shed production assets to reduce their carbon footprints, so as to come into compliance with court-ordered emission reductions and shareholder demands to reduce pollution.4 With the oil majors like Shell, Equinor and Oxy divesting themselves of shale properties, production increasingly will be in the hands of firms driven by profitability.5 We expect US shale-oil production to end the year at 9.86mm b/d and to average 9.57mm b/d next year; however, as the shales become the marginal global supply, production could become more volatile (Chart 5). The consolidation of US production also will alter the profitability of firms continuing to operate in the shales. We expect breakeven costs to fall as acquired production by stronger firms results in high-grading of assets – only the most profitable will be produced given market-pricing dynamics – while less profitable acreage will be mothballed until prices support development(Chart 6). Chart 5US Producers Focus On Profitability
Balance Of Risks Tilts To Higher Oil Prices
Balance Of Risks Tilts To Higher Oil Prices
Chart 6Shale Breakevens Likely Fall As Consolidation Picks Up
Balance Of Risks Tilts To Higher Oil Prices
Balance Of Risks Tilts To Higher Oil Prices
Supply-Demand Balances Tightening The current round of M&A consolidation and OPEC 2.0's continued discipline lead us to expect continued tightening of global oil supply-demand balances this year and next (Chart 7). This will allow inventories to continue to draw, which will keep forward oil curves backwardated (Chart 8). Chart 7Supply-Demand Balances Will Continue To Tighten
Balance Of Risks Tilts To Higher Oil Prices
Balance Of Risks Tilts To Higher Oil Prices
Chart 8Tighter Markets, Lower Stocks
Balance Of Risks Tilts To Higher Oil Prices
Balance Of Risks Tilts To Higher Oil Prices
The critical factor here will be OPEC 2.0's continued calibration of supply in line with realized demand and the return of Iran as a bona fide exporter, which we expect later this year. OPEC 2.0's restoration of ~ 2mm b/d of supply will be done by the beginning of 3Q21, when we expect Iran to begin restoring production and visible exports (i.e., in addition to its under-the-radar sales presently). The return of Iranian supply – and a possible increase in Libyan output – will present some timing difficulties for OPEC 2.0's overall strategy, but they will be short-lived. We continue to monitor output to assess the evolution of balances (Table 1). Table 1BCA Global Oil Supply - Demand Balances (MMb/d, Base Case Balances)
Balance Of Risks Tilts To Higher Oil Prices
Balance Of Risks Tilts To Higher Oil Prices
Investment Implications Oil demand will increase over the course of 2H21, as vaccines become more widely distributed globally, and the massive fiscal and monetary stimulus deployed worldwide kicks economic activity into high gear. On the supply side, markets will tighten on the back of continued restraint until Iranian barrels return to the market. The balance of risk is to the upside, particularly if the US and Iran are unable to agree terms that restore Iran as a bona fide exporter. In that case, the market tightening now under way will result in sharply higher prices. That said, realized demand growth has stalled over the past three months, which can be seen in unintended inventory accumulation in the US gasoline markets just as the summer driving season opens. We are raising our average Brent forecast for 2021 to $66.50 vs. $63/bbl earlier, with 2H21 prices averaging $70/bbl. We are moving our 2022 and 2023 forecasts up slightly as well to $74 and $81/bbl (Chart of the Week). WTI will trade $2-$3/bbl lower. We remain long the S&P GSCI Dynamic Roll Index ETF (COMT) and the S&P GSCI, expecting tight supply-demand balances to further steepen backwardations in forward curves. The big risk, as highlighted above, remains an acceleration of COVID-19 infections, hospitalizations and deaths, which force governments to delay re-opening or impose localized lockdowns once again. In this regard, KSA's strategy of calibrating its output to realized – vice forecasted – demand likely will remain in place. Robert P. Ryan Chief Commodity & Energy Strategist rryan@bcaresearch.com Ashwin Shyam Research Associate Commodity & Energy Strategy ashwin.shyam@bcaresearch.com Commodities Round-Up Energy: Bullish China's refinery throughput surged 4.4% to 14.3mm b/d in May, a record high that surpassed November 2020's previous record of 14.26mm b/d, according to S&P Platts Global. The increased runs were not unexpected, and were largely accounted for by state-owned refiners, which operated at 80% of capacity after coming out of turnaround season. Turnarounds will fully end in July. In addition, taxes on niche refined-product imports are due to increase, which will bolster refinery margins as inventories are worked down. China's domestic crude oil production was just slightly more than 4mm b/d. Base Metals: Bullish China's Standing Committee approved the release an undisclosed amount of its copper, aluminum and zinc stockpiles via an auction process in the near future, according to reuters.com. The government disclosed its intent on the website of National Food and Strategic Reserves Administration on Wednesday; however, specifics of the auction – volumes and auction schedule, in particular – were not disclosed. Prices had fallen ~ 9% from recent record highs in the lead-up to the announcement, which we flagged last month.6 Prices rallied from lows close to $4.34/lb on the COMEX Wednesday (Chart 9). Precious Metals: Bullish After a worse-than-expected US employment report, we do not expect the Federal Reserve to lift nominal interest rates in Wednesday’s Federal Open Market Committee (FOMC) meeting. The Fed will only raise rates once the US economy reaches a level consistent with its definition of "maximum employment." Wednesday’s interest rate decision will be crucial to gold prices. If the Fed does not mention asset tapering or an interest-rate hike, citing current inflation as a transitory phenomenon, gold demand and prices will rise. On the other hand, if the Fed indicates an interest rate hike sooner than the previously stated 2024, this will weigh on gold prices (Chart 10). Ags/Softs: Neutral As of June 13, 96% of the US corn crop had emerged vs. the five-year average of 91%, according to the USDA. 68% of the crop was rated in good to excellent condition, slightly below the five-year average. In the bean market, 94% of the crop was planted as of 13 June, vs. the five-year average of 88%. The Department reported 86% of the crop had emerged vs. the five-year average of 74%. According to the USDA, 52% of the bean crop was in good-to-excellent condition vs the five-year average of 72%. Chart 9
Balance Of Risks Tilts To Higher Oil Prices
Balance Of Risks Tilts To Higher Oil Prices
Chart 10
Balance Of Risks Tilts To Higher Oil Prices
Balance Of Risks Tilts To Higher Oil Prices
Footnotes 1 Please see OPEC+ complies with 115% of agreed oil curbs in May - source published by reuters.com on June 11, 2021. 2 Please see Saudis raise U.S. and Asian crude prices for April delivery published by worldoil.com on March 8, 2021. 3 Please see US shale consolidation continues as Independence scoops up Contango Oil & Gas published by S&P Global Platts on June 8, 2021. 4 We discuss this in A Perfect Energy Storm On The Way, published on June 3, 2021. Climate activism will become increasingly important to the evolution of oil and natural gas production, and likely will lead to greater concentration of supply in the hands of OPEC 2.0 and privately held producers that do not answer to shareholders. 5 Please see Interest in Shell's Permian assets seen as a bellwether for shale demand published by reuters.com on June 15, 2021. 6 Please see Less Metal, More Jawboning, which we published on May 27, 2021. It is available at ces.bcaresearch.com. Investment Views and Themes Strategic Recommendations Tactical Trades Commodity Prices and Plays Reference Table Trades Closed in 2021 Summary of Closed Trades
Image
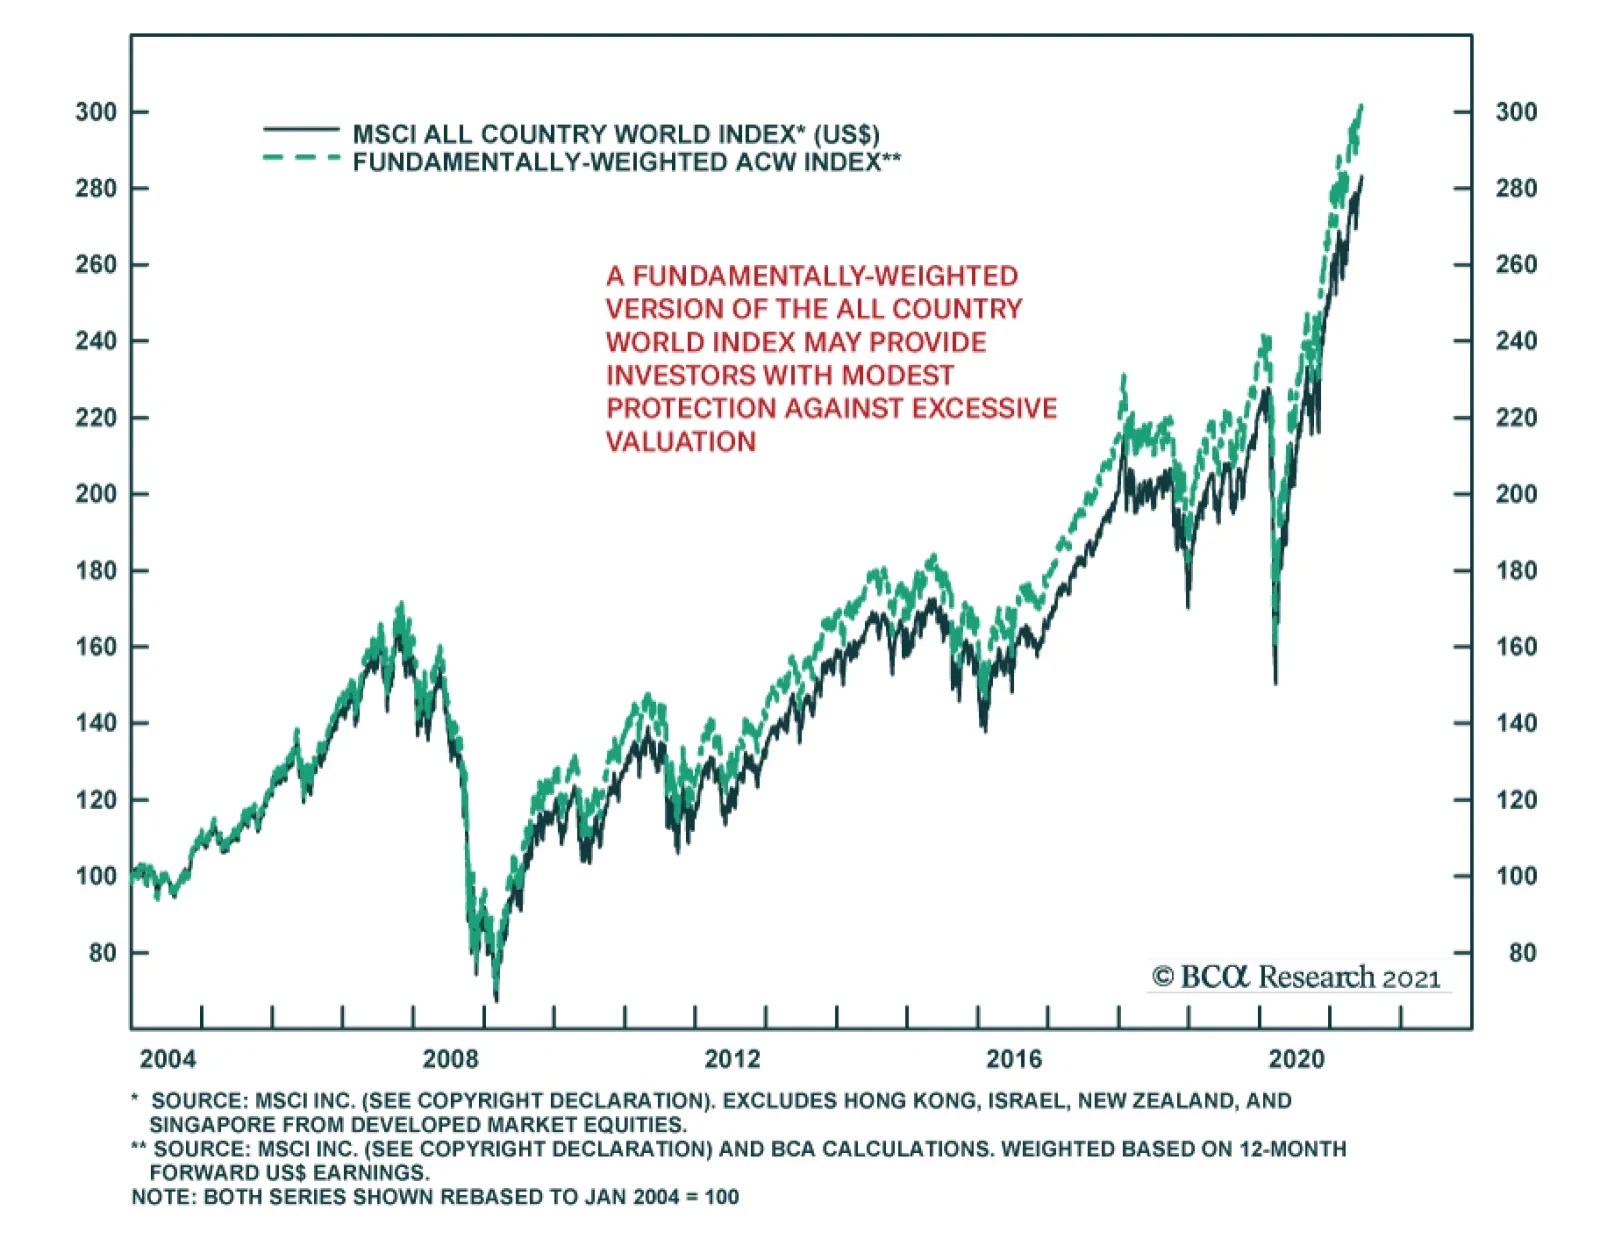
Relative to history, global equity markets have become richly valued over the past several years, particularly in the US. While stock prices are not expensive relative to competing assets such as government bonds and cash, this simply reflects the degree to…