Global

Highlights The Delta variant will continue causing jitters but there is much greater evidence today than there was in early 2020 that humanity can curb the virus, both with vaccines and government stimulus. Delta jitters will reinforce the Fed’s dovishness and will, if anything, increase the odds that President Biden passes his mammoth spending package this fall. The very near term could easily see more volatility but by the end of the year the reflationary cast of global policy will have won the day. Tax hikes and rate hikes lurk beyond 2021. There is still no stabilization in US-China policy and the US and its allies have called out China for cyber aggression, signaling a new front of open competition. A cyber event is one of the leading contenders for the next negative shock to the global economy. Structural factors strongly support rising concerns among the global elite about cyber insecurity. Stick to this year’s key themes and views: long gold, long value over growth, long international stocks, long Mexico, long aerospace and defense, and short emerging market “strongmen” regimes. Feature Global equities sank and rose over the past week as investors struggled with “peak growth” in the US and China, the prospect of monetary policy normalization, and other risks on the horizon, including immediate concerns over the Delta variant of COVID-19. The rapid rebound, including for cyclicals like European stocks, suggested that investors are still buying the dip given a very supportive macro and policy backdrop (Chart 1). The BCA House View consists of accommodative policy, economic recovery, a weakening dollar, and the outperformance of cyclical risk assets. We largely agree, with the caveat that there will be “No Return To Normalcy” in the geopolitical realm. Meaning that over the medium and long term the US dollar will remain firmer than expected and cyclical economies and sectors will face headwinds. Chart 1Equity Market Hits Wall Of Worry
Equity Market Hits Wall Of Worry
Equity Market Hits Wall Of Worry
The pandemic will have unforeseen consequences, such as social unrest and regime failures, while China’s secular slowdown and the Great Power competition between the US and its rivals will intensify. Not only is China slowing but also President Joe Biden has been confirmed as a China hawk, coopting President Trump’s aggressive stance and courting US allies to pile the pressure on Beijing. For most of this year the “normalcy” narrative has prevailed. Now investors are becoming fearful of the “abnormalcy” narrative. The US dollar has surprised its doubters on the basis of relative growth and interest rate differentials (Chart 2). Chart 2Dollar Remains Firm, Reflation Indicator Abates
Dollar Remains Firm, Reflation Indicator Abates
Dollar Remains Firm, Reflation Indicator Abates
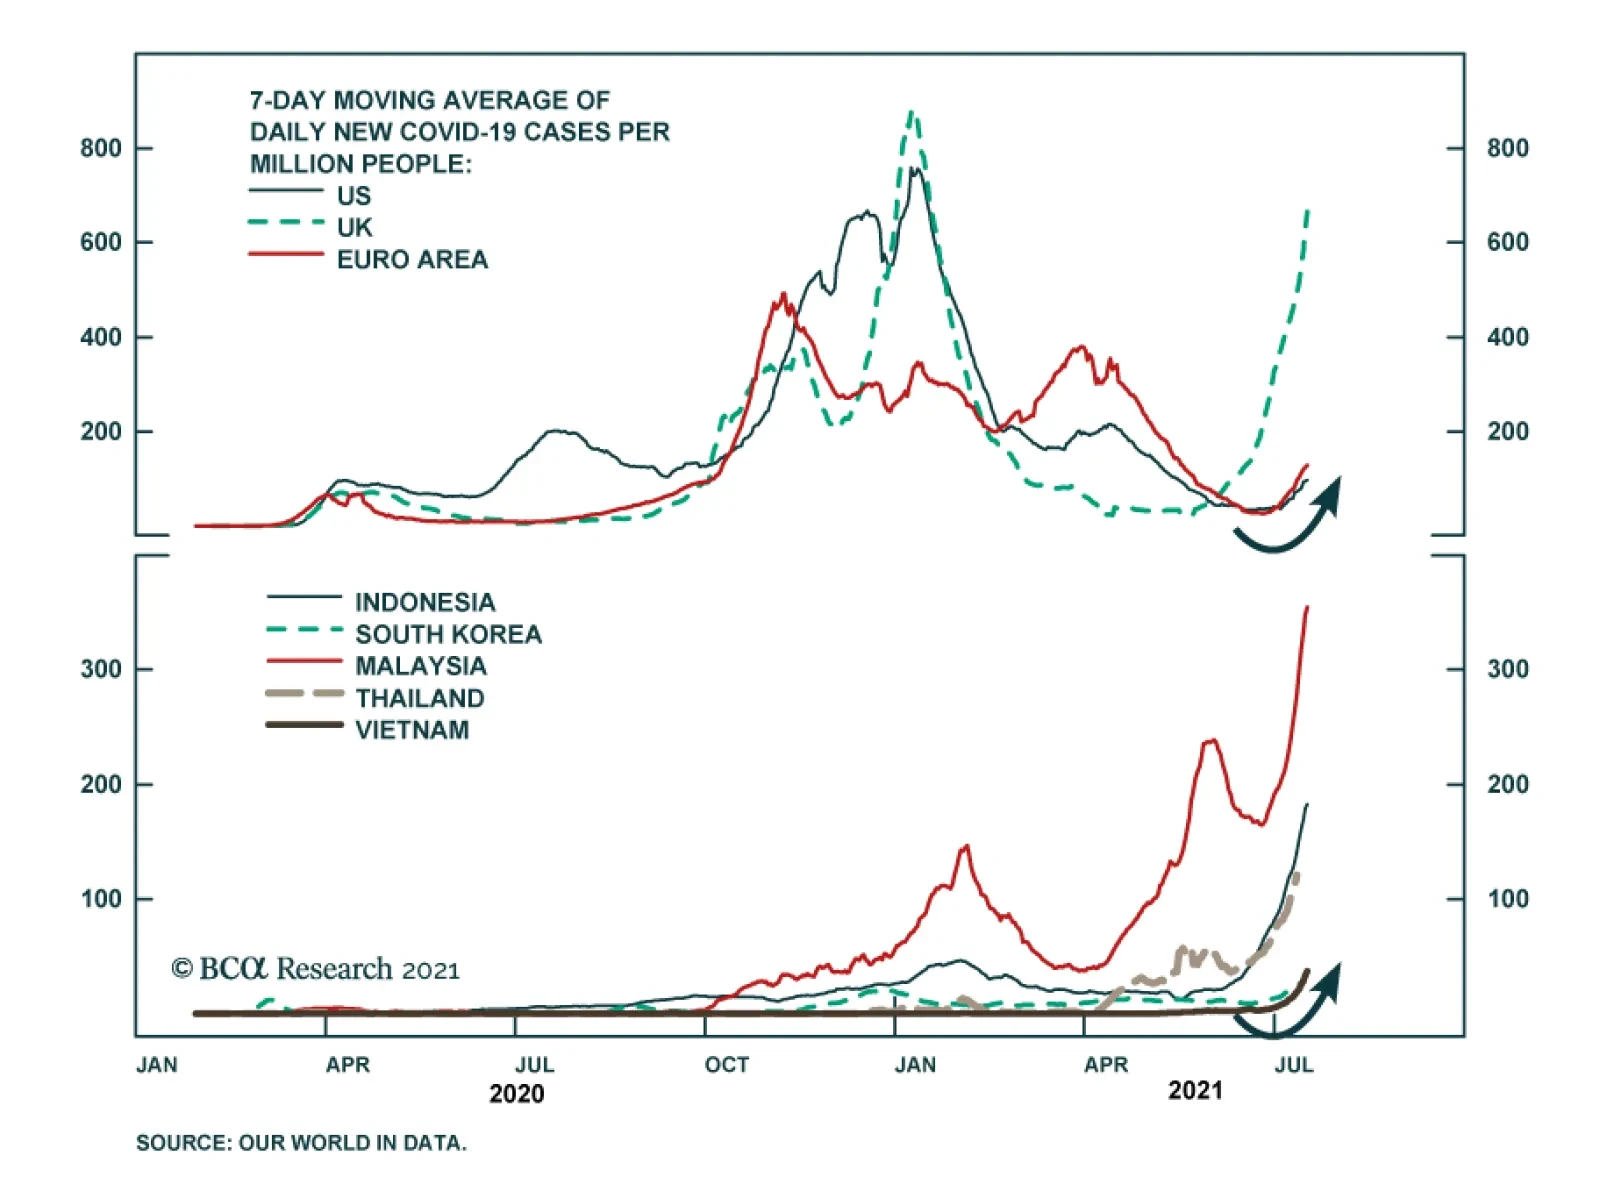
Over the next six months, the key point is that until these geopolitical risks boil over and explode, they reinforce the bullish macro view, since government spending will surge to address national challenges. The rich democracies have awoken to the threat posed by malaise at home and autocracy abroad. They have reactivated fiscal policy to rebuild their states and expand the social safety net. They are increasing investments in infrastructure, renewables, and defense. This trend is especially positive for US allied economies, global manufacturers ex-China, commodity prices, and commodity producing emerging markets, at least until the next shock erupts. We discuss the risk of a cyber shock as well as the points above in this report. Policy Responses To The Delta Variant The Delta variant began in India and has now swept the world. So far the variants respond to COVID vaccines, which are being rolled out globally. National and local political leaders will promote vaccination campaigns first – only if hospital systems are clogged will they resort to social restrictions. New infections have risen much faster than hospitalizations and deaths, although the latter are lagging indicators and will eventually follow cases (Chart 3). But financial markets will largely look past the scare, as they looked past the various waves of the original virus over the past 15 months. Today investors have greater evidence of humanity’s ability to curb the virus and can expect government spending to tide over the economy if new restrictions are necessary. New social restrictions should not be ruled out. They are not politically impossible. Public opinion in the developed countries shows that about 77% of people believe restrictions were about right or should have been tighter, while only 23% believe there should have been fewer restrictions (Chart 4). About 40% of Germans oppose the lifting of restrictions even for the vaccinated! Chart 3Delta Variant: A Limited Risk Unless Hospitals Clog
Delta Variant: A Limited Risk Unless Hospitals Clog
Delta Variant: A Limited Risk Unless Hospitals Clog
Chart 4ANew Lockdowns Not Impossible
Stay The Course (But Gird For Cyber War)
Stay The Course (But Gird For Cyber War)
Chart 4BNew Lockdowns Not Impossible
Stay The Course (But Gird For Cyber War)
Stay The Course (But Gird For Cyber War)
Any financial or economic distress from virus variants will reinforce ultra-accommodative monetary policy. The European Central Bank adopted a symmetric inflation target of 2% as it completed its strategic review, up from a previous goal which simply aimed at inflation just under 2%. It is likely to expand rather than taper asset purchases (Chart 5). At the Fed, the balance of power between hawks and doves on the Federal Open Market Committee reflects the political and geopolitical trends of the day. In the wake of the Great Recession, the doves overwhelmed the hawks (Chart 6). The institution has fully transitioned today – it now aims to generate an inflation overshoot – and it will not jeopardize its new average inflation targeting regime by tightening policy too soon this year or next. Chart 5Central Banks Will Delay Normalization If COVID Crisis Persists
Central Banks Will Delay Normalization If COVID Crisis Persists
Central Banks Will Delay Normalization If COVID Crisis Persists
Chart 6Doves Firmly In Ascendancy At Federal Reserve
Stay The Course (But Gird For Cyber War)
Stay The Course (But Gird For Cyber War)
The Delta variant makes it more likely that governments will increase fiscal support. The European Union’s Recovery Fund has a modest impact but the EU Commission is not patrolling budget deficits anymore, in the event that new social restrictions set back the recovery. The Democratic Party will pass President Biden’s $3.5-$4.1 trillion American Jobs and Families Plan through Congress by Christmas (with a net deficit increase of $1.3-$2.5 trillion over eight years). Support rates among independents and Democrats suggest Biden will come up with the votes (Chart 7). A renewed sense of crisis will compel any straggling senators. Chart 7ADelta Variant Makes Biden Stimulus Even More Likely To Pass
Stay The Course (But Gird For Cyber War)
Stay The Course (But Gird For Cyber War)
Chart 7BDelta Variant Makes Biden Stimulus Even More Likely To Pass
Stay The Course (But Gird For Cyber War)
Stay The Course (But Gird For Cyber War)
Markets will cheer more government spending as they have done throughout the vast surge in budget deficits across the world, not least in the developed markets, where austerity stunted the recovery in the wake of the Great Recession (Chart 8). Beyond Delta jitters and reactive stimulus, there are clouds forming on the horizon over the medium and long term. Budget deficits will start contracting, central banks will start hiking rates, and taxes will go up (and not only in the US). Geopolitical risks that are suppressed today will erupt later. Bottom Line: The very near term could easily see more volatility but by the end of the year the reflationary cast of global economic policy will have won the day. The bigger problems come clearly into review after the ink dries on the last installment of the great Biden budget blowout. Chart 8Market Will Cheer Another Round Of Government Spending
Market Will Cheer Another Round Of Government Spending
Market Will Cheer Another Round Of Government Spending
China Policy And Cyber War What might the next major negative shock be? A leading candidate is China, with its confluence of internal and external risks. China’s policymakers opened the floodgates of credit-and-fiscal stimulus to combat the global pandemic in 2020. They quickly shifted to tightening policy to prevent destabilizing asset bubbles. Now they are easing again. Stimulus and growth have both peaked. Authorities are on the verge of overtightening policy but tactical shifts in economic policy often occur in July. Right on cue the State Council ordered across-the-board cuts to bank reserve requirements on July 9. The Politburo’s July meeting on economic policy will bring an even more important policy signal. The concrete impact of the RRR cut should not be overstated. China has been lowering RRRs since late 2011 as its broad money growth has continually declined. The trend is indicative of China’s secular slowdown. A new series of RRR cuts is often attended by a global equity selloff (Chart 9). Chart 9China Blinked - But One RRR Cut Will Not Prevent A Global Selloff
China Blinked - But One RRR Cut Will Not Prevent A Global Selloff
China Blinked - But One RRR Cut Will Not Prevent A Global Selloff
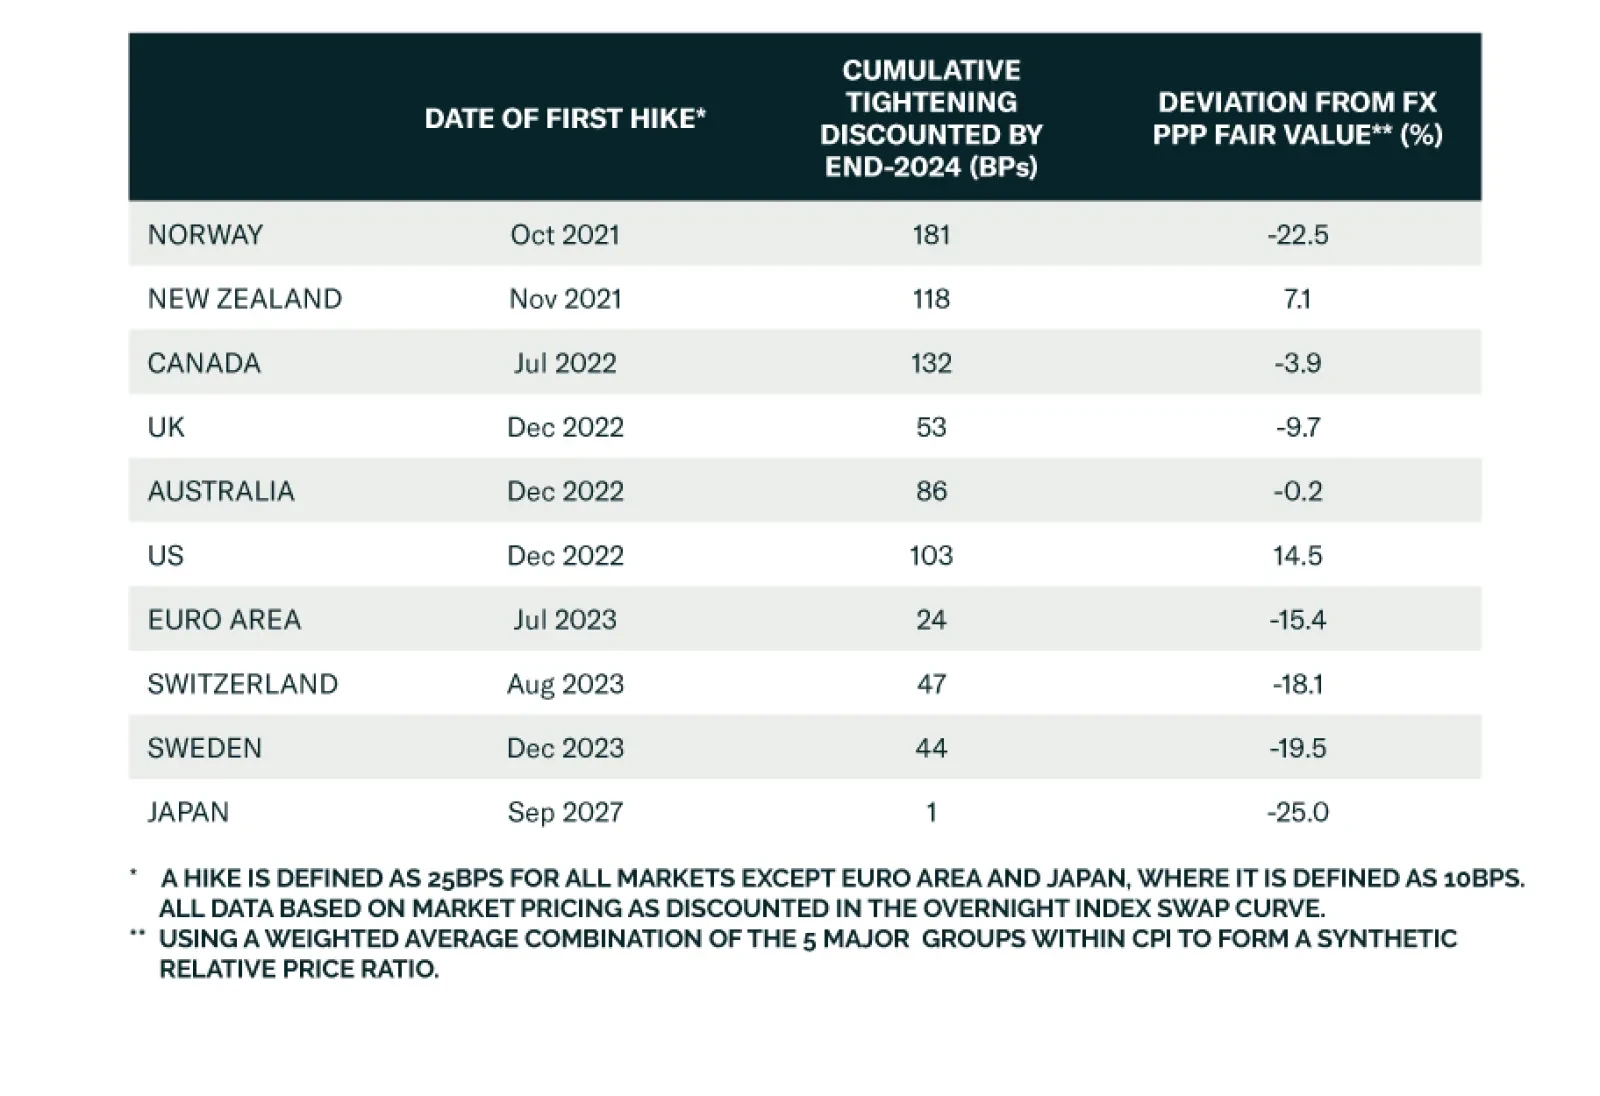
Our China Investment Strategy highlights that policy remains restrictive in other areas. Local governments have been told not to borrow if they have hidden debts. Moreover the crackdown on China’s tech sector also continues apace. These regulatory crackdowns are characteristic of the Xi Jinping administration and can continue for a while as it further consolidates power in advance of the twentieth National Party Congress in fall 2022. The US-China conflict is getting worse. The Biden administration took several punitive actions over the past month. It warned businesses against investing in Hong Kong and Xinjiang. It rejected a restart of the strategic and economic dialogue. While a bilateral summit between Biden and Xi Jinping is possible on October 30-31, it is not yet scheduled and would only temporarily improve relations. One of Biden’s more significant recent moves was to orchestrate a joint statement with allies condemning China for aggressive behavior in cyber space.1 A massive cyber attack should be high up on any investor’s list of “gray rhino” events (high-probability, high-impact events). The world has suffered large shocks from global terrorism, financial crisis, and pandemic. Lightning rarely strikes the same place twice. Of course, nobody knows what will cause the next upset. But a devastating cyber event has been underrated in the investment community and that is changing (Table 1). Fed Chair Powell, asked by a reporter what was the chief risk to the global financial system, said “cyber risk.” To quote in full: So you would worry about a cyber event. That's something that many, many government agencies, including the Fed and all large private businesses and all large private financial companies in particular, monitor very carefully, invest heavily in. And that's really where the risk I would say is now, rather than something that looked like the global financial crisis.2 Table 1Cyber Event Underrated In Consensus View Of Global Risks
Stay The Course (But Gird For Cyber War)
Stay The Course (But Gird For Cyber War)
Here are six structural reasons that cyber risk will continue to escalate: Cyber space is one of the truly ungoverned spaces. The US is the preponderant power in cyber space, as elsewhere, but there is no regular order or code of conduct. The US cyber bureaucracy is decentralized and uncoordinated while its opponents are centrally commanded, aggressive, and sophisticated. Great power competition is escalating. The US is struggling with China, Russia, and Iran and all sides seek to intimidate enemies and gain allies. Cyber capabilities enhance essential tasks like spying, sabotage, and information warfare. The tech race is intensifying, with companies and governments investing heavily in innovation and industry, while US export controls exacerbate China’s frantic efforts to obtain advanced tech by any means. The pandemic boosted digital dependency across industry and commerce, creating a “perfect storm” for cyber attacks and hacking.3 The US and its allies are threatening to retaliate more actively against cyber attacks, which may initially lead to an increase in the total number of attacks. In addition, Israel will need to sabotage Iran’s nuclear program if it is not halted by diplomacy. The US is polarized and war-weary yet claiming greater commitment to its allies, a paradox that encourages foreign rivals to use cyber tools to foment US divisions; strike at regional opponents that lack US security guarantees; and test the US commitment to its allies. The current US-Russia negotiations toward a truce against cyber attacks on critical infrastructure are the sole example of a potential structural improvement. The US and Russia could conceivably lay down some rules of the road in cyber space. There may be a basis for an agreement in that already this year the US refrained from blocking the Nordstream II pipeline with Germany while Russia refrained from re-invading Ukraine. However, a Russo-American truce would not dispel the risk of a global cyber surprise. It could even increase the odds. Russia this year alone showed with the Colonial Pipeline hack and the JBS meat-packing hack that its proxies can disrupt critical US infrastructure. It would make sense to agree to a truce so that the US does not demonstrate the same capability against Russia. Even without a truce, Russia does not benefit from provoking massive US cyber attacks. The US is the world’s leading cyber power and has pledged that it will retaliate. Rather Russia will concentrate its efforts closer to home: suppressing dissent, intimidating the former Soviet Union, and testing the US’s willingness to defend its allies. It would be useful for Russia to use cyber attacks to undermine NATO unity and demonstrate that the US is reluctant to defend NATO members’ critical infrastructure. Remember the cyber strike against Estonia in 2007. Hence huge shocks could still emerge in Europe or elsewhere even if the US and Russia make a ceasefire regarding their own critical infrastructure. The same can be said for China, Iran, and North Korea. Attacks in their neighborhood are even more likely than direct provocations against the United States now that the US is threatening graver consequences. Beijing is concentrating its cyber power on technological acquisition. But it will also try to intimidate its neighbors into neutrality and test America’s commitment to its allies. This applies to markets like Taiwan, South Korea, the Philippines, and Vietnam. Not all cyber attacks would cause a global shock but the danger of Biden’s emphasis on alliances and multilateralism is that the US will be tested and its commitments will expand. Local cyber attacks could escalate if the US believes it must prove its resolve. Bottom Line: Cyber firms’ share prices have risen since we made our contrarian buy call back in March. True, fundamentals are poor despite the strong geopolitical tailwind. The BCA Equity Analyzer shows that valuations, debt, liquidity, and return on equity have deteriorated relative to the global large cap equity universe (Chart 10). Still, as long as liquidity is ample and geopolitical risk is high we expect cyber firms’ share prices to keep grinding upward. Chart 10Cyber Stocks: Poor Fundamentals But Geopolitics A Secular Driver
Stay The Course (But Gird For Cyber War)
Stay The Course (But Gird For Cyber War)
Investment Takeaways We are sticking with our key themes and views: long gold; long value over growth; long DM-ex-US stocks such as FTSE100 (Chart 11) and European industrials; long US neighbors Mexico and Canada; long defense and cyber stocks; and short the assets of emerging market “strongman” regimes from China and Russia to Brazil, Turkey, and the Philippines. Taking several of our trade recommendations alongside the copper-to-gold ratio, a key measure of global reflation, there could be more near-term downside (Chart 12). Nevertheless these are strategic trades designed to bear rewards over 12 months and beyond. Mainland Chinese investors should book gains on long Chinese 10-year government bonds. We would not rule out a bigger bond rally later given China’s risks at home and abroad, but RRR cuts often lead to a selloff and the signal is that the socialist policy “put” remains in place. Book gains on long Italian / short Spanish equities. This tactical trade is now hitting the top of its range and will likely mean revert. We are still optimistic on European stocks and the euro as a whole and view the German election as a positive catalyst almost regardless of outcome. Chart 11Stay The Course: Long Value Over Growth
Stay The Course: Long Value Over Growth
Stay The Course: Long Value Over Growth
Matt Gertken Vice President Geopolitical Strategy mattg@bcaresearch.com Chart 12Stick To Cyclical Trades Over Near-Term Volatility
Stick To Cyclical Trades Over Near-Term Volatility
Stick To Cyclical Trades Over Near-Term Volatility
Footnotes 1 White House, “The United States, Joined by Allies and Partners, Attributes Malicious Cyber Activity and Irresponsible State Behavior to the People’s Republic of China,” July 19, 2021, whitehouse.gov. 2 “Jerome Powell: Full 2021 60 Minutes Interview Transcript,” CBS News, April 11, 2021, cbsnews.com. 3 Connor Fairman, “2020: Cybercrime’s Perfect Storm,” Council on Foreign Relations, January 20, 2021, cfr.org.
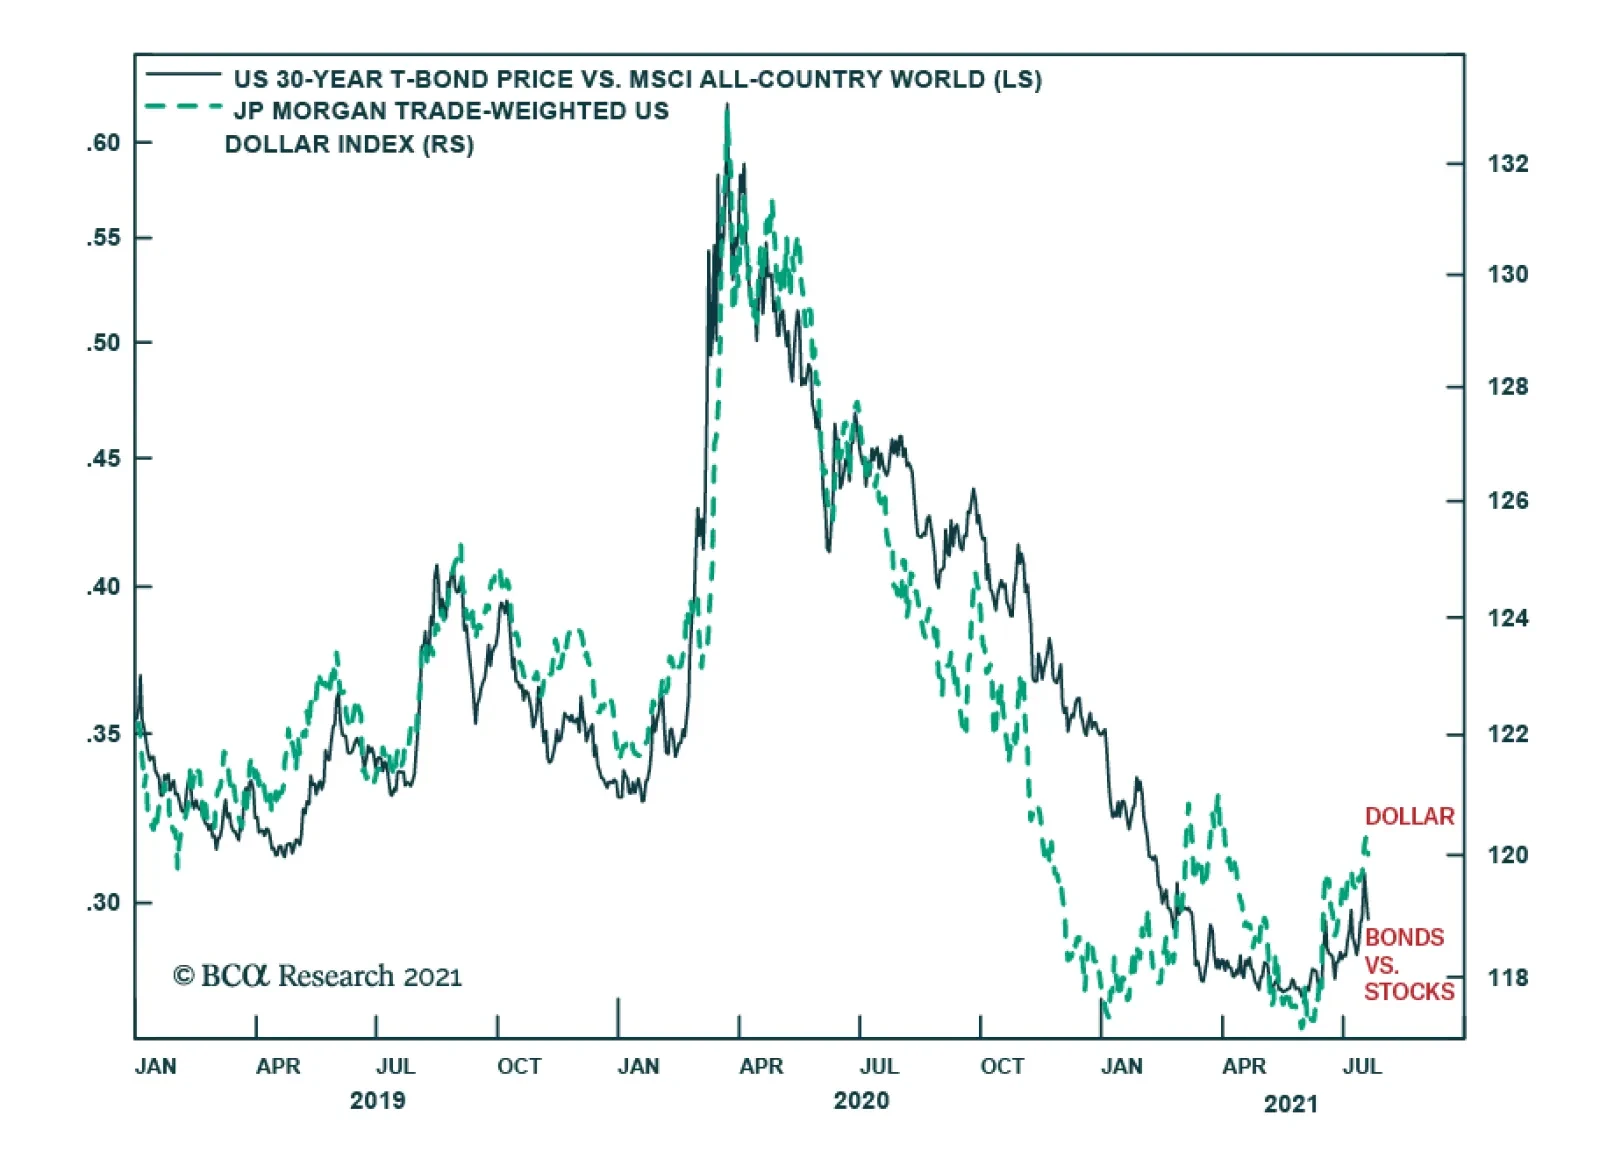
BCA Research’s Counterpoint service observes that over the past three years the US dollar has almost perfectly tracked the performance of bonds versus equities, proving that the main driver for dollar demand is (defensive) portfolio flows. This is because,…
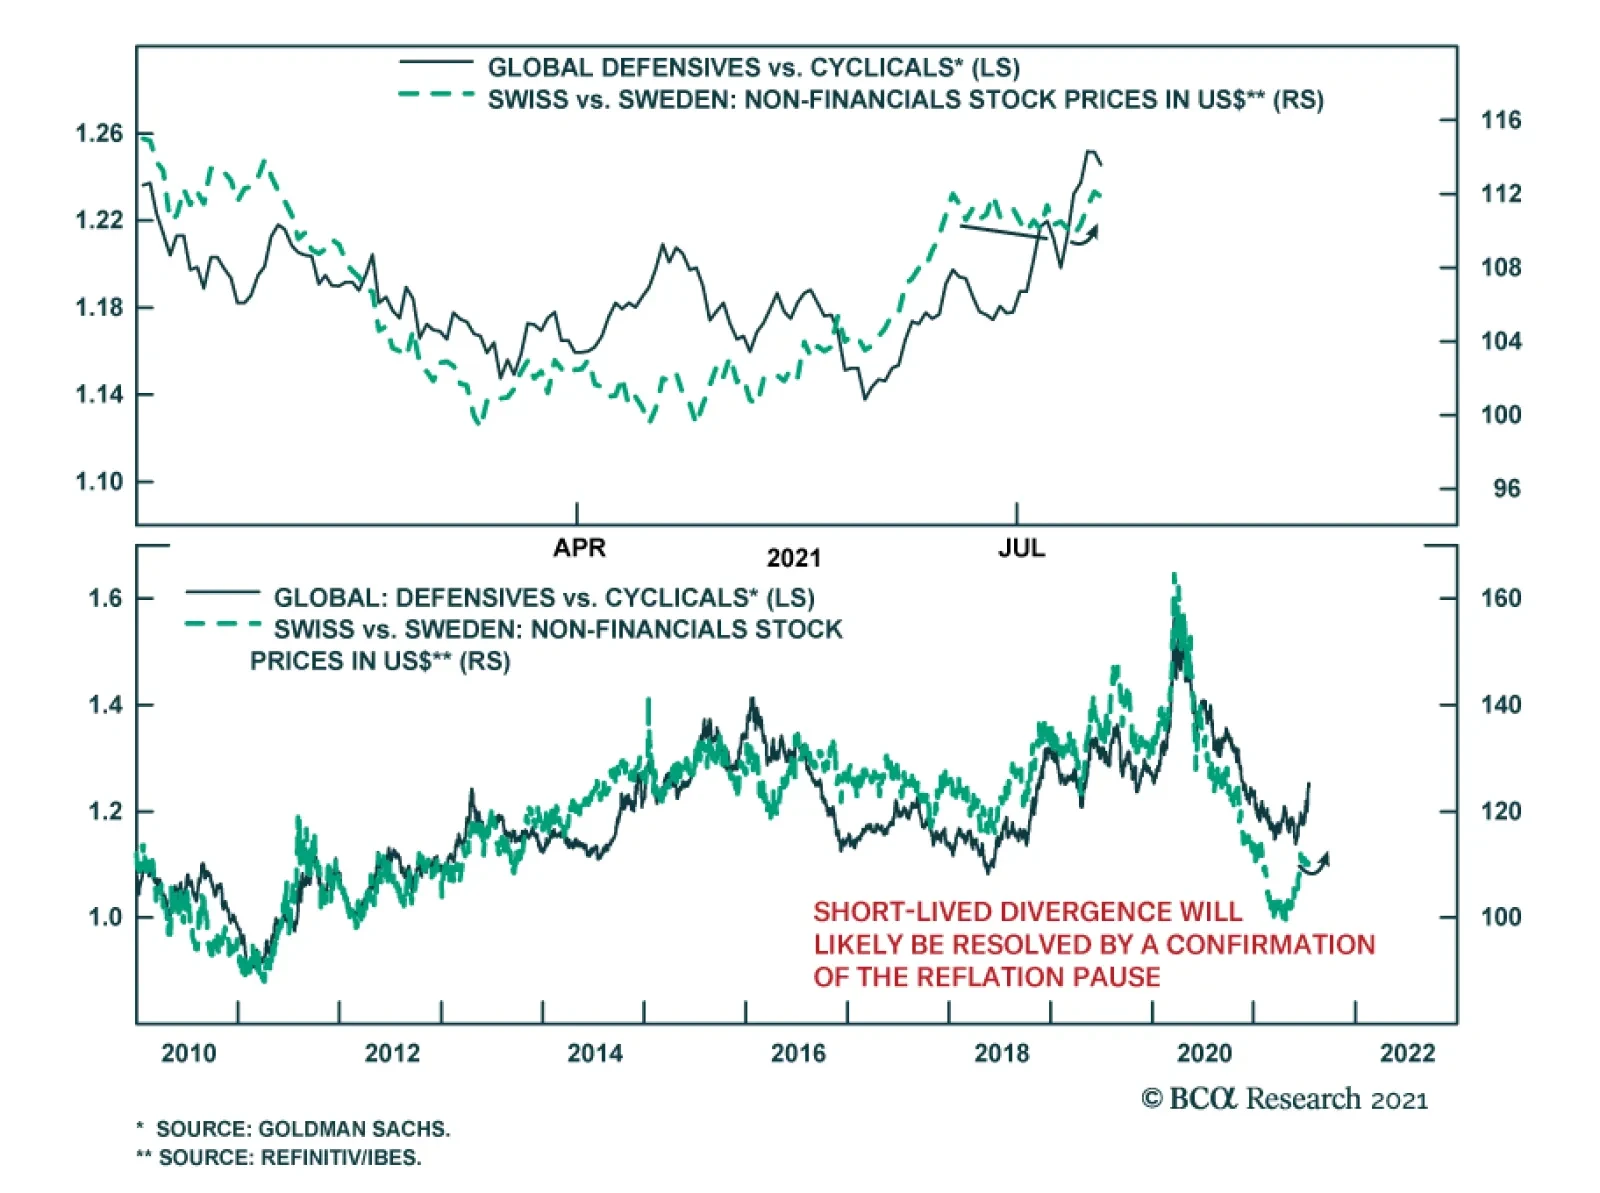
In a recent insight, we highlighted that Caterpillar’s underperformance since mid-March confirms the current interruption in the reflation trade and suggests that the cause of the pause is global growth concerns. The recent outperformance of Swiss…
In a recent insight, we highlighted our Global Investment Strategists’ view that slowing growth, fears that the Fed is turning more hawkish, and technical factors are all contributing factors to recent US yield curve flattening. The former was brought to the…
Highlights Yield curves have flattened considerably in the major economies since April. Slowing global growth, the perception that the Fed is turning more hawkish, and technical factors have contributed to flatter yield curves. Looking out, we expect the forces pushing down bond yields to abate, with the US 10-year Treasury yield ultimately rising to 1.8%-to-1.9% by the end of the year. Shrinking output gaps, rebounding inflation expectations, and stepped-up Treasury issuance should all push yields higher. Higher yields will benefit bank shares at the expense of tech stocks. Investors should favor value over growth and non-US equities over their US peers. We are closing our long global energy stocks/short copper miners trade. In its place, we are opening a trade to go long the December 2022 Brent futures contract at a price of $66.50/bbl. Flatter Yield Curves Yield curves have flattened considerably in the major economies since April. The US 10-year yield has fallen to 1.31% (and was down to as low as 1.25% intraday last Thursday) from a recent peak of 1.74% on March 31st. The US 2-year yield has risen 7 bps over this period, which has translated into 50 bps of flattening in the 2/10 yield curve. The German bund curve has flattened by 20 bps, the UK curve by 28 bps, the Canadian curve by 52 bps, and the Australian curve by 57 bps. Even the Japanese yield curve has managed to flatten by 13 bps (Chart 1). Chart 1AYield Curves In The Major Economies Have Flattened Since April (I)
Yield Curves In The Major Economies Have Flattened Since April (I)
Yield Curves In The Major Economies Have Flattened Since April (I)
Chart 1BYield Curves In The Major Economies Have Flattened Since April (II)
Yield Curves In The Major Economies Have Flattened Since April (II)
Yield Curves In The Major Economies Have Flattened Since April (II)
Chart 2US Economic Surprise Index Is Near A Post-Pandemic Low
US Economic Surprise Index Is Near A Post-Pandemic Low
US Economic Surprise Index Is Near A Post-Pandemic Low
Three major factors account for the recent bout of yield-curve flattening: Slowing growth: Decelerating growth is usually accompanied by a flatter yield curve. Chinese growth peaked late last year. US growth peaked around March, with the Citi Economic Surprise Index falling to a post-pandemic low last week (Chart 2). European growth will peak over the course of this summer (Table 1). The emergence of the Delta variant has amplified growth concerns. Table 1Growth Is Peaking, But At A Very High Level
The Message From The Yield Curve
The Message From The Yield Curve
Fears that the Fed is turning more hawkish: About one-third of the flattening in the US yield curve occurred in the two days following the June FOMC meeting. The shift in the median Fed forecast towards a 2023 rate hike was interpreted by many market participants as a signal that the Fed was unwilling to tolerate a prolonged inflation overshoot (Chart 3). As a result, short-term rate expectations moved up while long-term rate expectations declined (Chart 4). Chart 3The Fed Dots Have Shifted Towards An Earlier Rate Hike
The Message From The Yield Curve
The Message From The Yield Curve
Chart 4Markets Saw The June FOMC Meeting As A Turning Point
Markets Saw The June FOMC Meeting As A Turning Point
Markets Saw The June FOMC Meeting As A Turning Point
Chart 5Treasury Cash Balances Are Declining
Treasury Cash Balances Are Declining
Treasury Cash Balances Are Declining
Technical factors: Investors were positioned very bearishly on bonds earlier this year, helping to set the stage for a short-covering rally. Meanwhile, with yet another debt ceiling showdown looming in Congress, the Treasury department began to slash T-bill issuance, drawing on its cash balances at the Fed instead (Chart 5). Treasurys, which were already in short supply due to the Fed’s QE program, became even scarcer. All this happened at a time when seasonal factors normally turn bond bullish (Chart 6). Chart 6Seasonality In Markets
The Message From The Yield Curve
The Message From The Yield Curve
How these three factors evolve over the coming months will dictate the path of bond yields, with important implications for stocks and currencies. Let’s examine each in turn. Global Growth Will Slow, But Remain Firmly Above Trend Chart 7High Vacancies Suggest Strong Demand For Labor
High Vacancies Suggest Strong Demand For Labor
High Vacancies Suggest Strong Demand For Labor
While global growth will continue to decelerate, it will remain well above trend. This is important because ultimately, it is the size of the output gap that determines the timing and magnitude of rate hikes. In the US, the high level of job vacancies suggests that there is no shortage of labor demand (Chart 7). What is missing are willing workers. As we noted in our Third Quarter Strategy Outlook, labor shortages should ease in the fall as expanded unemployment benefits expire, schools reopen, and immigration picks up. The recent rapid decline in initial unemployment claims is consistent with an acceleration in job gains over the coming months (Chart 8). The share of small businesses planning to increase hiring also jumped in June to the highest level in the 48-year history of the NFIB survey (Chart 9). Chart 8Declining Unemployment Claims Point To Further Strong Employment Growth
Declining Unemployment Claims Point To Further Strong Employment Growth
Declining Unemployment Claims Point To Further Strong Employment Growth
Chart 9Small US Businesses Are Keen To Hire
Small US Businesses Are Keen To Hire
Small US Businesses Are Keen To Hire
Delta Risk In the US, 32,000 new Covid cases were reported on Wednesday. This pushed the 7-day average to 25,000, double the level it was the first week of July. According to the CDC, more than 90% of US counties with high case counts had vaccination rates below 40% (Map 1). As is in other countries, the highly contagious Delta variant accounts for the majority of new US infections. Map 1AUS Covid Vaccination Coverage
The Message From The Yield Curve
The Message From The Yield Curve
Map 1BUS Covid Infection Trends
The Message From The Yield Curve
The Message From The Yield Curve
Chart 10Vaccine Makers Are On Track To Produce Over 10 Billion Doses In 2021
The Message From The Yield Curve
The Message From The Yield Curve
The latest Covid wave will slow US economic activity, but probably not by much. The CDC estimates that over 99% of recent US Covid deaths have been among the non-vaccinated population. Vaccinated people have little to fear from the Delta strain and hence, will likely continue to go on with their daily lives. Non-vaccinated people, in most cases, are presumably not very concerned about contracting the virus, so they too will go on with their daily lives. Thus, it is difficult to see how the Delta strain will lead to major behavioral changes. And politically, it will be difficult for governments to legislate lockdowns when everyone who wants a vaccine has been able to receive one. Outside the US, the Delta strain will cause more havoc. Nevertheless, there is a light at the end of the tunnel. Globally, vaccine makers are set to produce over 10 billion doses this year (Chart 10). Many of these vaccines will make their way to emerging economies, which have struggled to obtain adequate supplies. That should help boost EM growth. China Policy Support Chinese retail sales, industrial production, and fixed asset investment all rose faster than expected in June. Yesterday’s solid activity data followed strong trade numbers released earlier this week. Chart 11Chinese Credit Growth Should Stabilize In The Second Half Of The Year
Chinese Credit Growth Should Stabilize In The Second Half Of The Year
Chinese Credit Growth Should Stabilize In The Second Half Of The Year
Chinese policy is turning more stimulative, which should continue to support growth. Effective this Thursday, the PBOC cut its reserve requirement ratio by 0.5 percentage points, releasing about RMB 1 trillion of liquidity into the banking system. It was the first such cut since April 2020. Total social financing, a broad measure of Chinese credit, rose by RMB 3.7 trillion in June, well above consensus estimates of RMB 2.9 trillion. Credit growth has fallen sharply since last October and is currently running near its 2018 lows (Chart 11). Looking out, Chinese credit growth should pick up modestly as local governments issue more debt. As of June, local governments had used only 28% of their annual bond issuance quota, compared with 61% over the same period last year and 65% in 2019. The proceeds from local government bond sales will likely flow into infrastructure spending, which has been tepid in recent years (Chart 12). Increased infrastructure spending will boost metals prices. With that in mind, we are closing our long global energy stocks/short copper miners trade for a gain of 8.5%. In its place, we are opening a trade to go long the December 2022 Brent futures contract at a price of $66.50/bbl. As Chart 13 shows, BCA’s Commodity and Energy service expects oil prices to keep rising in contrast to market expectations of a price decline. Chart 12China: Weak Infrastructure Spending Should Pick Up
China: Weak Infrastructure Spending Should Pick Up
China: Weak Infrastructure Spending Should Pick Up
Chart 13Oil Prices Have Further Upside
Oil Prices Have Further Upside
Oil Prices Have Further Upside
The Fed Will Stay Dovish Chart 14Excluding Pandemic-Affected Sectors, Core CPI Has Not Surged As Much As Headline Measures
Excluding Pandemic-Affected Sectors, Core CPI Has Not Surged As Much As Headline Measures
Excluding Pandemic-Affected Sectors, Core CPI Has Not Surged As Much As Headline Measures
Market participants overreacted to the shift in the Fed’s dot plot. The regional Fed presidents tend to be more hawkish than the Board of Governors. Jay Powell himself probably penciled in one hike for 2023. Lael Brainard, who may end up replacing Powell next year, likely projects no hikes for 2023. Granted, inflation has surged. The CPI rose 5.4% year-over-year in June, above expectations of 4.9%. Core CPI inflation clocked in at 4.5%, surpassing expectations of 4.0%. However, most of the increase in the CPI continues to be driven by a few pandemic-affected sectors. Excluding airfares, hotels, and vehicle prices, the core CPI rose by a modest 2.5% in June. The level of the CPI outside these pandemic-affected sectors is still below trend, suggesting little imminent need for monetary tightening (Chart 14). Many input prices have already rolled over (Chart 15). The price of lumber, which at one point was up 93% from the start of 2021, is now down for the year. Steel prices are well off their highs. So too are memory chip prices. Even used car auction prices are starting to decline (Chart 16). Chart 15Input Prices Have Rolled Over
Input Prices Have Rolled Over
Input Prices Have Rolled Over
Chart 16Used Car Prices Have Probably Peaked
Used Car Prices Have Probably Peaked
Used Car Prices Have Probably Peaked
Chart 17Both The Fed And Market Participants Have Revised Down Their Estimate Of The Neutral Rate Of Interest
Both The Fed And Market Participants Have Revised Down Their Estimate Of The Neutral Rate Of Interest
Both The Fed And Market Participants Have Revised Down Their Estimate Of The Neutral Rate Of Interest
Chart 18Inflation Expectations Have Fallen Back Below The Fed's Target Zone
Inflation Expectations Have Fallen Back Below The Fed's Target Zone
Inflation Expectations Have Fallen Back Below The Fed's Target Zone
Despite the widespread perception that US monetary policy is ultra-accommodative, current policy rates are only two percentage points below both the Fed’s and the market’s estimates of the terminal rate (Chart 17). Given the zero lower bound constraint on nominal policy rates, tightening monetary policy prematurely could be a grave mistake.Market-based inflation expectations are signaling the need for easier, not tighter, monetary policy. After rising earlier this year, the 5-year/5-year forward TIPS breakeven inflation rate has fallen back below the Fed’s comfort zone (Chart 18). It is highly unlikely that the Fed will commence tapering if long-term inflation expectations remain below target. More likely, the Fed will ramp up its dovish rhetoric over the coming months, allowing inflation expectations to recover. This should put some upward pressure on long-term bond yields. Technical Factors Are Turning Less Bond Friendly Chart 19Investors Were Heavily Short Bonds Earlier This Year
Investors Were Heavily Short Bonds Earlier This Year
Investors Were Heavily Short Bonds Earlier This Year
While seasonal factors should remain bond bullish over the remainder of the year, other technical factors are turning less supportive. Investors surveyed by J.P. Morgan increased duration exposure over the past four weeks, after having cut it to the lowest level since 2017 (Chart 19). Traders also cut short positioning on the 30-year bond by two-thirds from record levels. Treasury issuance should normalize by the fall. While the obligatory brinkmanship over the debt ceiling is likely to extend beyond the August 1st deadline, BCA’s chief political strategist Matt Gertken believes that Democrats will ultimately be able to raise the ceiling. Senate Democrats may end up using the reconciliation process to both raise the debt ceiling and pass President Joe Biden’s $3.5 trillion American Jobs and Families Plan with 51 votes along. They are also likely to move forward on passing Biden’s proposed $600 billion in traditional infrastructure, with or without Republican support. The combination of increased Treasury supply and more fiscal spending should translate into higher bond yields. Higher Bond Yields Favor Value Stocks We expect the US 10-year Treasury yield to move back up to 1.8%-to-1.9% by the end of the year. Bond yields in other markets will also rise, but less so than in the US, given the relatively “high beta” status of US Treasurys (Chart 20). In contrast to tech stocks, banks usually outperform when bond yields are rising (Chart 21). The recent pickup in US consumer lending should also help bank shares (Chart 22). Chart 20US Treasuries Have A Higher Beta Than Most Other Government Bond Markets
US Treasuries Have A Higher Beta Than Most Other Government Bond Markets
US Treasuries Have A Higher Beta Than Most Other Government Bond Markets
Chart 21Bank Shares Thrive In A Rising Yield Environment
Bank Shares Thrive In A Rising Yield Environment
Bank Shares Thrive In A Rising Yield Environment
Chart 22Recent Pickup In US Consumer Lending Will Help Bank Shares
Recent Pickup In US Consumer Lending Will Help Bank Shares
Recent Pickup In US Consumer Lending Will Help Bank Shares
Chart 23Outperformance Of Tech Stocks Not Backed By Trend In Earnings Estimates
Outperformance Of Tech Stocks Not Backed By Trend In Earnings Estimates
Outperformance Of Tech Stocks Not Backed By Trend In Earnings Estimates
Chart 24Non-US Stocks And Value Stocks Typically Perform Best When The Dollar Is Falling
Non-US Stocks And Value Stocks Typically Perform Best When The Dollar Is Falling
Non-US Stocks And Value Stocks Typically Perform Best When The Dollar Is Falling
It is worth noting that the outperformance of tech stocks over the past six weeks has not been mirrored in relative upward revisions to earnings estimates (Chart 23). Without the tailwind from relatively fast earnings growth, tech names will lag the market over the remainder of 2021. The US dollar usually weakens when growth momentum rotates from the US to the rest of the world, which is likely to occur in the second half of this year. A dovish Fed will put further downward pressure on the greenback. Non-US stocks and value stocks typically perform best when the dollar is falling (Chart 24). Peter Berezin Chief Global Strategist peterb@bcaresearch.com Global Investment Strategy View Matrix
The Message From The Yield Curve
The Message From The Yield Curve
Special Trade Recommendations
The Message From The Yield Curve
The Message From The Yield Curve
Current MacroQuant Model Scores
The Message From The Yield Curve
The Message From The Yield Curve
Trying To Sort Out The Hawks & Doves
…
In lieu of next week’s report, I will be presenting the quarterly Counterpoint webcast titled ‘Where Is The Groupthink Wrong? And How To Profit From It.’ I do hope you can join. We will then take a summer break, so our next report will come out on August 5. Highlights The quantum theory of finance describes the strange quantum effects of ultra-low inflation, of ultra-low interest rates, and of ultra-low probabilities. The key finding of the quantum theory of finance is that when inflation and interest rates get ultra-low, inflation becomes completely insensitive to monetary policy, while risk-asset valuations become hyper-sensitive to monetary policy. The hyper-sensitivity of $500 trillion of global risk-assets to bond yields means that the ultimate low in the US T-bond yield is still to come. Given the hyper-sensitivity of equity valuations to bond yields and the demand for US assets during bond market rallies, it also means that the structural bull market in equities and the structural bull market in the US dollar are both still intact. Feature Feature ChartNear The Lower Bound In Bond Yields, Potential Losses Are Greater Than Potential Gains
Near The Lower Bound In Bond Yields, Potential Losses Are Greater Than Potential Gains
Near The Lower Bound In Bond Yields, Potential Losses Are Greater Than Potential Gains
When things get ultra-small, the laws of physics undergo a radical shift. Classical physics breaks down, and we must to turn to an alternative theory to explain and predict the physical world. That theory is the quantum theory of physics. In this updated Special Report we propose that, just as there is the quantum theory of physics, there is The Quantum Theory Of Finance. When inflation and interest rates get ultra-low, the laws of economics and finance undergo a radical shift. And we must turn to the alternative theory to explain and predict the economic and financial world. In the physical world, the allowable values of a physical system appear to be continuous, with all values permitted. In fact, the permitted values occur in discrete ‘quanta’. At ultra-small scales, these quantum effects become the dominant driver of physical systems and form the foundation of the quantum theory of physics. Likewise, in the economic and financial world of ultra-low inflation and interest rates, quantum effects become the dominant drivers of the system. These quantum effects take three forms: The quantum effects of ultra-low inflation. The quantum effects of ultra-low interest rates. The quantum effects of ultra-low probabilities. The Quantum Effects Of Ultra-Low Inflation Even though inflation is continuous mathematically, we do not perceive it as such psychologically. Instead we perceive inflation as ‘quantum states’ of either price stability or price instability. A recent IFO paper points out that households’ inflation perceptions are “more in line with the imperfect information view prevailing in social psychology than with the rational actor view assumed in mainstream economics.”1 And in Real-Feel Inflation: Quantitative Estimation of Inflation Perceptions, Michael Ashton confirms that “it would be challenging for a consumer to distinguish 1 percent inflation from 2 percent inflation – that fine of a gradation in perception would be extremely unusual to find.”2 There are several reasons why we perceive inflation imprecisely: We do not recognise quality change and substitution adjustments. We tend to feel inflation asymmetrically, noticing goods whose prices are rising, but noticing less goods whose prices are falling. This is the classic attribution bias: higher prices are inflation, lower prices are “good shopping.” Items whose prices are volatile tend to draw more attention, and give more opportunities for these asymmetries to compound. We notice the price changes of small, frequently purchased items more than the price changes of large infrequently purchased items. We perceive the cost of homeownership as the monthly mortgage payment, and not the imputed cost of owners’ equivalent rent (OER). Yet OER is the largest single item in the US core CPI basket, weighted at 30 percent. The result of these biases is that we perceive inflation intuitively, as a quantum state rather than as a precise number within a continuum. The quantum effects of ultra-low inflation mean that policymakers can take an economy from the state of price instability to the state of price stability, and vice-versa, but they cannot sustainably hit an arbitrary inflation target within the quantum state, such as 2 percent (Chart I-2). Chart I-2Mission Impossible: 2 Percent Inflation
Mission Impossible: 2 Percent Inflation
Mission Impossible: 2 Percent Inflation
The Quantum Effects Of Ultra-Low Interest Rates Policymakers accept that there exists an interest rate, at around -1 percent, below which there would be an exodus of bank deposits. Hence, this marks the lower bound of policy interest rates. When policy interest rates are at, or near, this lower bound, central banks can turn to a second strategy: they can promise to keep the policy rate ultra-low for an extended period. Thereby they can pull down the long bond yield towards the lower bound too. To do this, they must convince the market that their promise is genuine. Enter quantitative easing (QE) which, in the words of the ECB’s former Chief Economist Peter Praet, is nothing more than “a signalling channel which reinforces the credibility of forward guidance on (ultra-low) policy rates.” Once forward guidance plus QE has taken bond yields close to their lower bound, we start to see the quantum effects of ultra-low interest rates. Specifically, the bond investor is left with a highly asymmetric payoff – the bond price can fall much more than it can rise. Witness the performance of Swiss bonds through the past three years. The worst drawdowns have far exceeded the best gains (Feature Chart, Chart I-3 and Chart I-4). Chart I-3Swiss Bonds Offer Small Potential Gains...
Swiss Bonds Offer Small Potential Gains...
Swiss Bonds Offer Small Potential Gains...
Chart I-4...But Big Potential Losses
...But Big Potential Losses
...But Big Potential Losses
This asymmetric payoff is technically known as negative skew and it starts to take effect when bond yields decline to around 2 percent above their lower bound. So, if the lower bound for the 10-year T-bond yield is -0.5 percent, the negative skew in its payoffs would start to take effect at around 1.5 percent. One important implication of the quantum effect of ultra-low interest rates is that the asymmetry of bond payoffs becomes very similar to the asymmetry of equity and other risk-asset payoffs (Chart I-5). This is important because, as we describe in the next section, it is the skew of an asset’s payoff that establishes its absolute and relative riskiness. Chart I-5Equities Can Suffer Bigger Short-Term Losses Than Short-Term Gains (Negative Skew)
Equities Can Suffer Bigger Short-Term Losses Than Short-Term Gains (Negative Skew)
Equities Can Suffer Bigger Short-Term Losses Than Short-Term Gains (Negative Skew)
The Quantum Effects Of Ultra-Low Probabilities We are very bad at comprehending low probabilities. For example, we cannot distinguish a 1 in a 1000 risk from a 1 in a 100 risk, even though the second risk is ten times greater than the first. This is what Daniel Kahneman’s and Amos Tversky’s Nobel prize winning Prospect Theory called the ‘quantal effect’ of ultra-low probabilities. Kahneman and Tversky discovered that our fears and hopes come in quanta rather than in a continuum, with the result that we overweight the tail-events in a payoff distribution. “Because people are limited in their ability to comprehend and evaluate extreme probabilities, highly unlikely events are either ignored or over-weighted.” If the payoff distribution is symmetric, then our overweighting of the positive and negative tails cancels out, meaning there is no impact on the value of the payoff (Figure I-1). However, if the payoff distribution is skewed, then the longer tail dominates our perceived value of the payoff. Figure I-1In A Symmetric Payoff, We Overestimate The Big Gain And the Big Loss Equally, So It Cancels Out
The Quantum Theory Of Finance (Part 2)
The Quantum Theory Of Finance (Part 2)
A lottery payoff has an extreme positive skew. There exists a miniscule chance of winning a fortune. As we overweight this highly unlikely event, we overvalue the lottery ticket relative to its expected payoff (Figure I-2). And this explains the existence of the multi-billion dollar lottery industry. Figure I-2In A Positively-Skewed Payoff (Lottery), We Overestimate The Big Gain, So We Overpay
The Quantum Theory Of Finance (Part 2)
The Quantum Theory Of Finance (Part 2)
Conversely, the payoff from equities has a negative skew. As we overweight the tail-event of losing a lot of money, we undervalue this negatively skewed payoff (Figure I-3). In other words, we demand a higher return from a negatively skewed payoff relative to a symmetrical payoff, such as the payoff from bonds when yields are not ultra-low. And this explains the existence of the so-called ‘equity risk premium.’ Figure I-3In A Negatively-Skewed Payoff (Risk-Assets), We Overestimate The Big Loss, So We Demand A ‘Risk Premium’
The Quantum Theory Of Finance (Part 2)
The Quantum Theory Of Finance (Part 2)
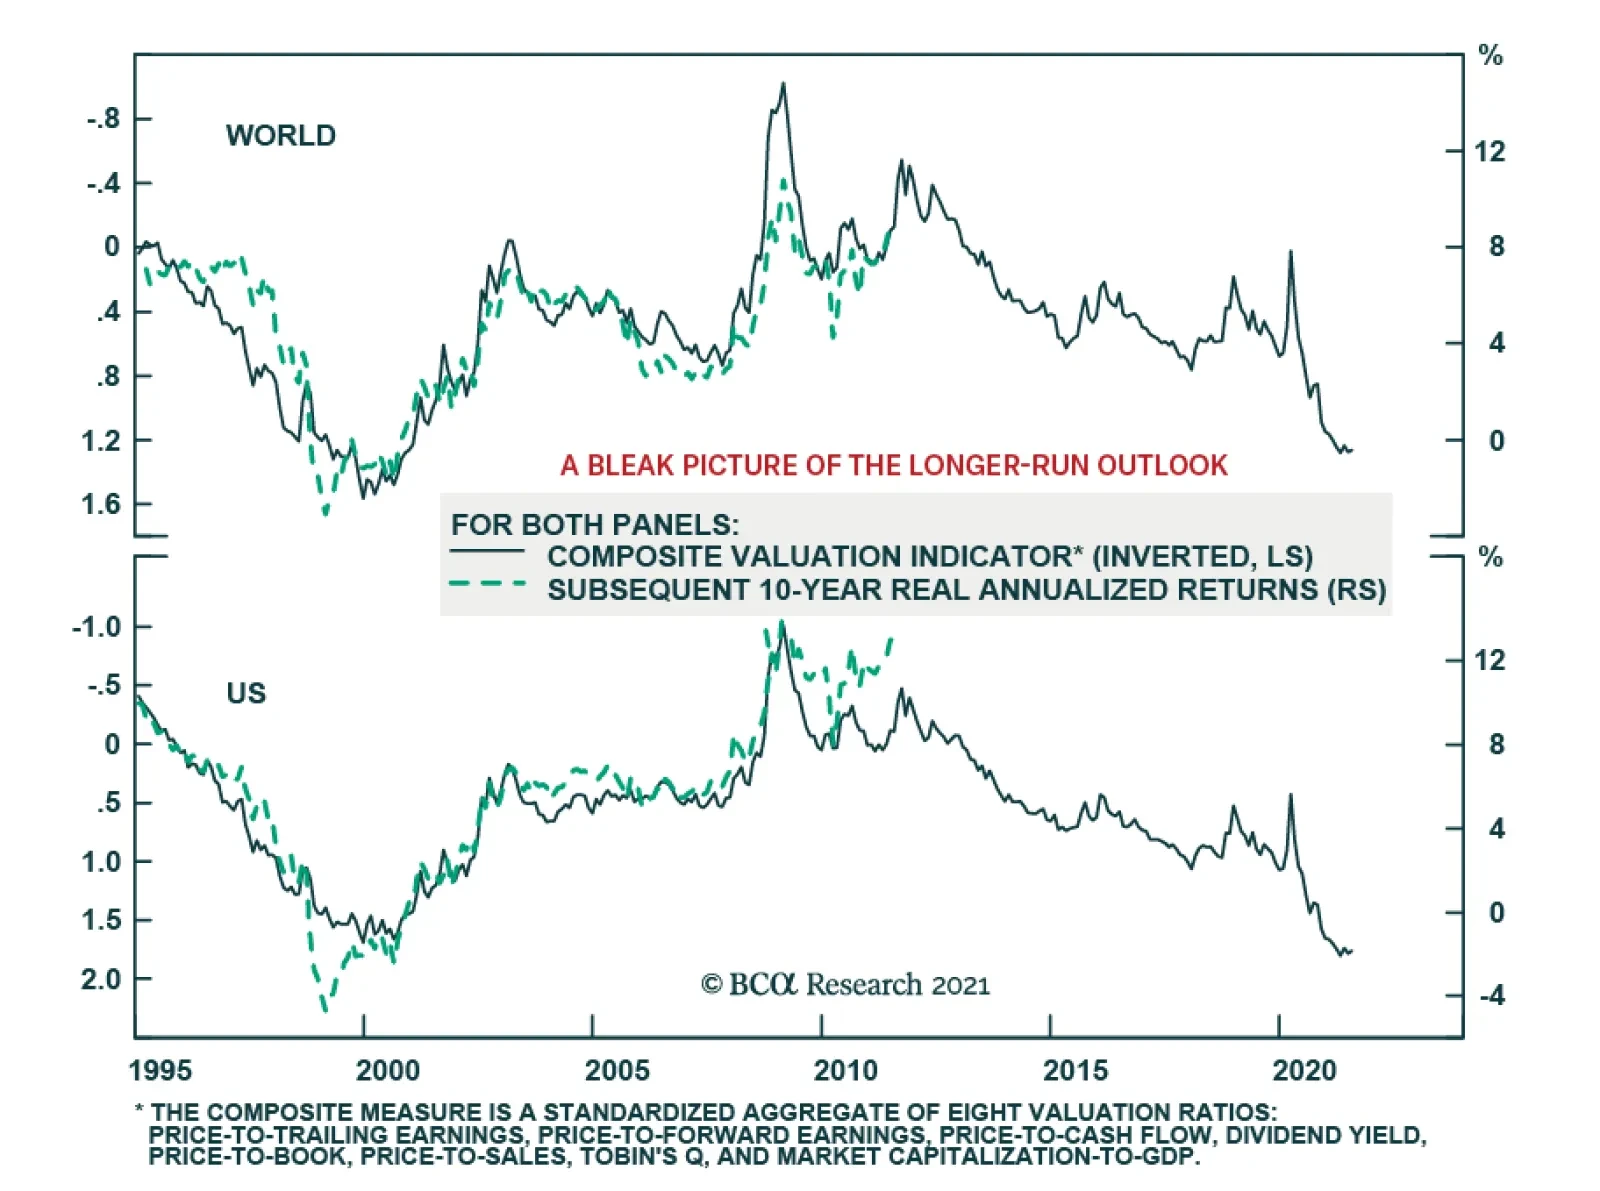
Crucially though, at ultra-low bond yields – when both equity and bond payoffs carry the same negative skew – we no longer demand a higher return from equities versus bonds. As the equity risk premium compresses, the return demanded from equities and other risk-assets collapses to the ultra-low bond yield. Put another way, the valuation of risk-assets soars. The Quantum Theory Of Finance, The Past And The Future The key finding of the quantum theory of finance is this. When inflation and interest rates get ultra-low, inflation becomes completely insensitive to monetary policy, while risk-asset valuations become hyper-sensitive to monetary policy. This is the story of the past decade, and most likely the story of the coming years. For over a decade now, central banks have fixated on hitting their 2 percent inflation targets when the quantum effects of ultra-low inflation make such a target unachievable. In their misguided fixation, the unleashing of trillions of dollars of QE has taken bond yields to unprecedented lows which has driven risk-asset valuations to unprecedented highs, and made them hyper-sensitive to the slightest move in bond yields (Chart I-6 and Chart I-7). Chart I-6Real Estate Prices Have Massively Outperformed Rents
Real Estate Prices Have Massively Outperformed Rents
Real Estate Prices Have Massively Outperformed Rents
Chart I-7Equity Prices Have Massively Outperformed Profits
Equity Prices Have Massively Outperformed Profits
Equity Prices Have Massively Outperformed Profits
Yet to be clear, though policymakers cannot consistently hit the 2 percent inflation target, they could certainly take the economy back to price instability – if they pursued ultra-loose monetary policy combined with ultra-loose fiscal policy aggressively enough for long enough. But if a major economy were to take this road – intentionally or accidentally – the $500 trillion valuation of global risk-assets that is premised on ultra-low inflation and ultra-low interest rates would collapse. As we have previously written, this means that The Road To Inflation Ends At Deflation and the ultimate low in the T-bond yield is still to come. Alternatively, another deflationary shock could take us to this ultimate low in the T-bond yield more directly. Given the hyper-sensitivity of equity valuations to bond yields and the massive portfolio inflows into US assets during shocks, this also means that the structural bull markets in equities and the structural bull market in the US dollar are both still intact. Dhaval Joshi Chief Strategist dhaval@bcaresearch.com Footnotes 1 Please see Households’ Inflation Perceptions and Expectations: Survey Evidence from New Zealand, IFO Working Paper, February 2018 available at https://www.ifo.de/DocDL/wp-2018-255-hayo-neumeier-inflation-perceptions-expectations.pdf 2 Please see Real-Feel Inflation: Quantitative Estimation of Inflation Perceptions by Michael Ashton, National Association for Business Economics available at https://link.springer.com/content/pdf/10.1057/be.2011.35.pdf Fractal Trade Update We are pleased to report that long USD/CAD achieved its 3.7 percent profit target, and short building materials (PKB) versus healthcare (XLV) achieved its 15 percent profit target. Combined with other successes, this lifts the 6-month win ratio to an all-time high of 76 percent, comprising 12.3 winners versus just 3.9 losers. This week, we present two new candidates for countertrend reversal. First, the strong recent rally in Australian 30-year bonds has reached fragility on its 65-day fractal structure. The recommended trade is to short Australian versus Canadian 30-year bonds, setting the profit-target and symmetrical stop-loss at 3.9 percent. Second, the strong recent rally in lead versus platinum has also reached fragility on its 65-day fractal structure. The recommended trade is to short lead versus platinum, setting the profit-target and symmetrical stop-loss at 6.4 percent. Chart I-8Short Australian Vs, Canadian 30-Year Bonds
Short Australian Vs, Canadian 30-Year Bonds
Short Australian Vs, Canadian 30-Year Bonds
Chart I-9Short Lead Vs. Platinum
Short Lead Vs. Platinum
Short Lead Vs. Platinum
Fractal Trading System Fractal Trades 6-Month Recommendations Structural Recommendations Closed Fractal Trades Closed Trades Asset Performance Equity Market Performance Indicators To Watch - Bond Yields Chart II-1Indicators To Watch - Bond Yields - Euro Area
Indicators To Watch - Bond Yields - Euro Area
Indicators To Watch - Bond Yields - Euro Area
Chart II-2Indicators To Watch - Bond Yields - Europe Ex Euro Area
Indicators To Watch - Bond Yields - Europe Ex Euro Area
Indicators To Watch - Bond Yields - Europe Ex Euro Area
Chart II-3Indicators To Watch - Bond Yields - Asia
Indicators To Watch - Bond Yields - Asia
Indicators To Watch - Bond Yields - Asia
Chart II-4Indicators To Watch - Bond Yields - Other Developed
Indicators To Watch - Bond Yields - Other Developed
Indicators To Watch - Bond Yields - Other Developed
Indicators To Watch - Interest Rate Expectations Chart II-5Indicators To Watch - Interest Rate Expectations
Indicators To Watch - Interest Rate Expectations
Indicators To Watch - Interest Rate Expectations
Chart II-6Indicators To Watch - Interest Rate Expectations
Indicators To Watch - Interest Rate Expectations
Indicators To Watch - Interest Rate Expectations
Chart II-7Indicators To Watch - Interest Rate Expectations
Indicators To Watch - Interest Rate Expectations
Indicators To Watch - Interest Rate Expectations
Chart II-8Indicators To Watch - Interest Rate Expectations
Indicators To Watch - Interest Rate Expectations
Indicators To Watch - Interest Rate Expectations
Over a 12-month horizon, investors should maintain a modest overweight allocation to equities. Although pandemic-related uncertainties linger – particularly regarding the emergence and impact of variants – global growth will remain strong. And even though…
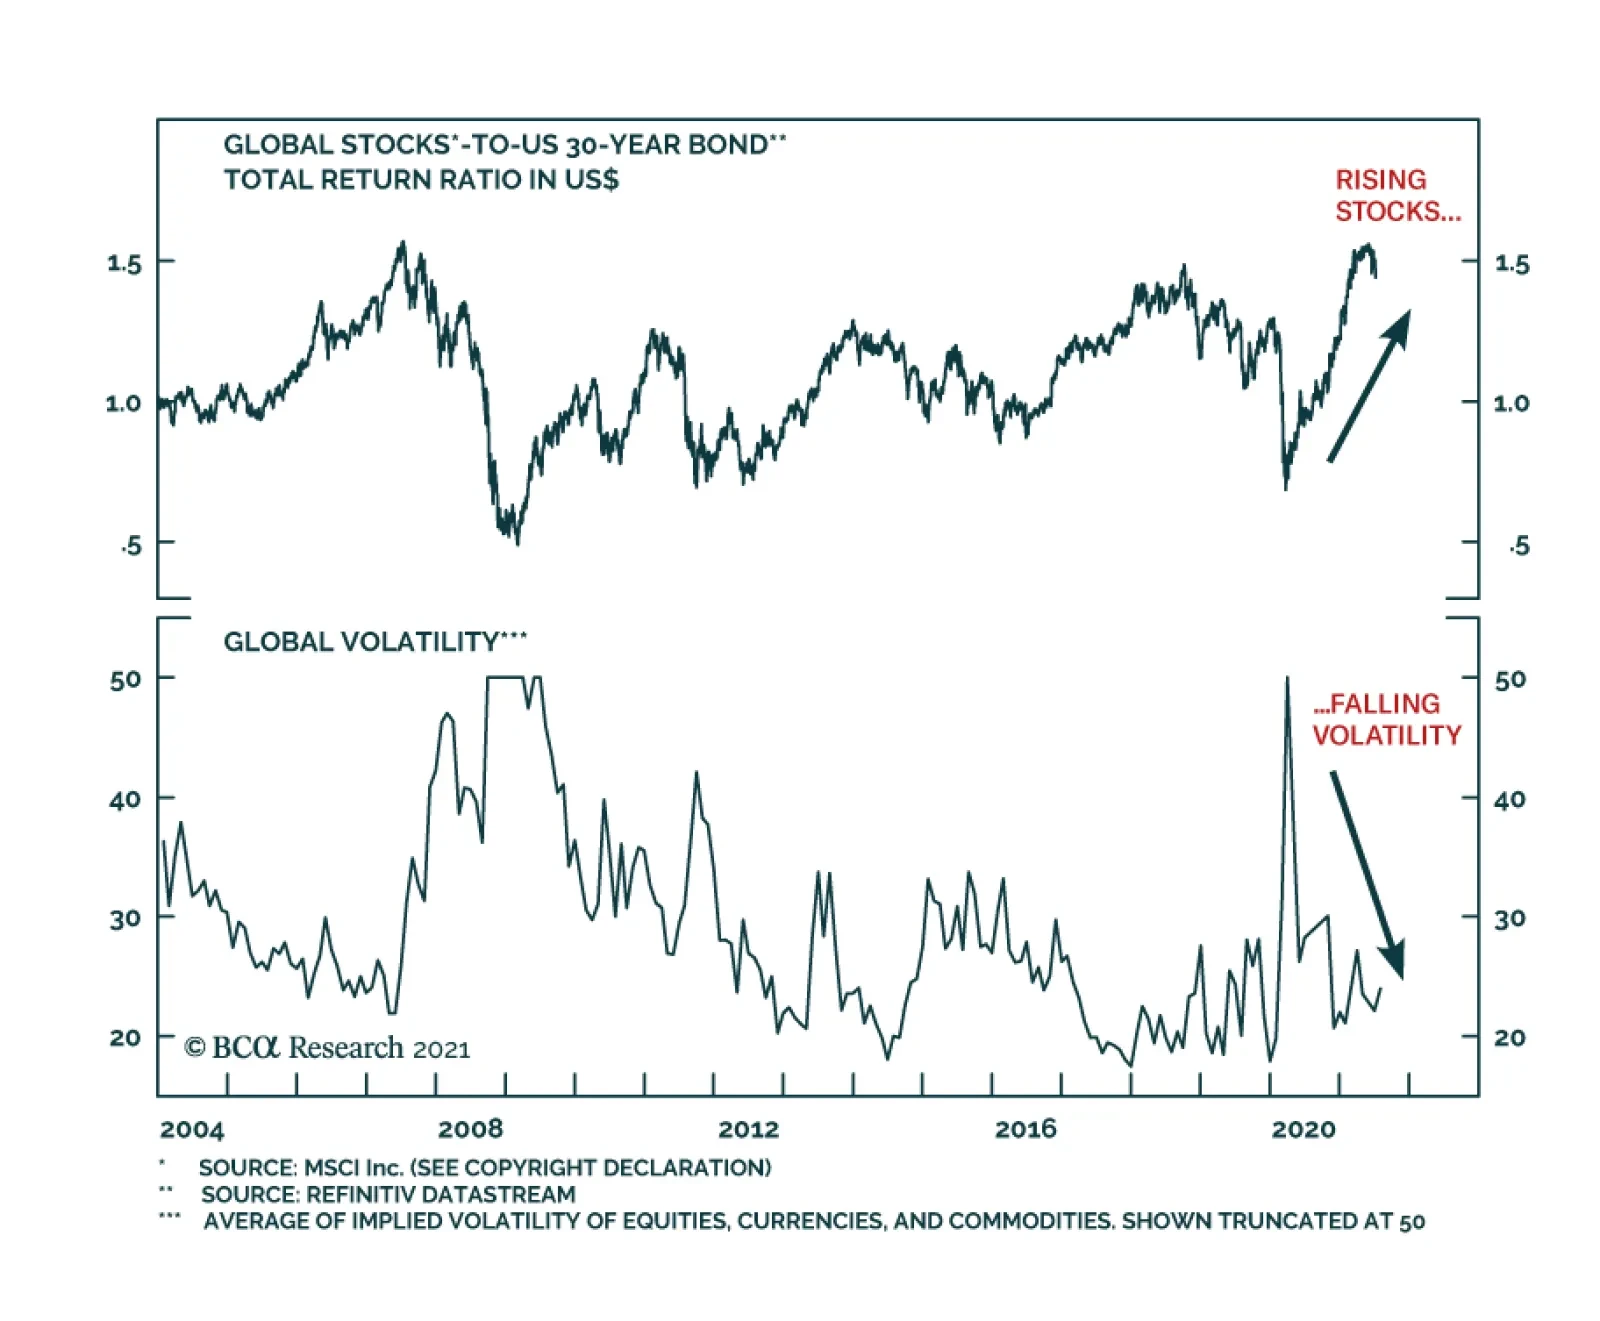
The spectacular outperformance of global equities versus bonds since the pandemic trough has been accompanied by declining volatility in all asset classes globally. But investors are now close to fully invested in US equities. Sentiment in financial markets…
Highlights Inflation is set to decelerate, job creation has a speed limit, and super-spreaders of new-variant Covid-19 infections will create speed bumps in the economy. This means that in the second half of the year: Bonds will rally. The US dollar will rally. Growth stocks will outperform value stocks. US stocks will outperform non-US stocks. Fractal trade shortlist: Brazilian real, Saudi Tadawul All Share, and Marine Transportation. Feature Chart of the WeekThe 60 Percent Correction In Lumber Shows What Happens When Supply Bottlenecks Ease. Are Used Cars Next?
The 60 Percent Correction In Lumber Shows What Happens When Supply Bottlenecks Ease. Are Used Cars Next?
The 60 Percent Correction In Lumber Shows What Happens When Supply Bottlenecks Ease. Are Used Cars Next?
As Supply Bottlenecks Ease, Inflation Will Cool Since mid-March, US inflation has surged to 5 percent. Yet bond yields have drifted lower, by almost 50 bps in the case of the 30-year T-bond yield, equating to a handsome return of 12 percent. The seeming contradiction between rising inflation and declining bond yields has puzzled some people, but it shouldn’t. In 2009, the same pattern occurred in reverse. Inflation collapsed, culminating in a modern era low of -2 percent in July 2009. Yet while inflation was collapsing, bond yields rose sharply (Chart I-2 and Chart I-3). Chart I-2In 2009, Bond Yields Rose When Year-On-Year Inflation Fell
In 2009, Bond Yields Rose When Year-On-Year Inflation Fell
In 2009, Bond Yields Rose When Year-On-Year Inflation Fell
Chart I-3In 2021, Bond Yields Fell When Year-On-Year Inflation Rose
In 2021, Bond Yields Fell When Year-On-Year Inflation Rose
In 2021, Bond Yields Fell When Year-On-Year Inflation Rose
We can explain this seeming contradiction with an analogy from driving. The inflation rate is like your average speed over the past mile. But the bond market cares much more about your average speed over the next mile, or even over the next 5-10 miles. If you are driving at a constant speed, then your speed over the past mile is a good guide to your future speed. But if you have been driving unusually fast or unusually slowly, there is a more important predictor of your future speed. That important predictor is your acceleration – meaning, what is happening to your speed over successive hundred yards stretches. In the same way, during episodes of unusually low or unusually high inflation, the bond market focusses on the monthly rate of inflation, and specifically the moment that it stops decreasing, as in early-2009, or stops increasing, as in mid-2021. In 2008, after a long sequence of declining monthly rates of inflation that went deep into negative territory, the December 2008 print marked the first substantial increase. Hence, the bond yield also bottomed in December 2008 (Chart I-4), even though annual inflation did not bottom until July 2009. Chart I-4In 2009, Bond Yields Bottomed When Month-On-Month Inflation Bottomed
In 2009, Bond Yields Bottomed When Month-On-Month Inflation Bottomed
In 2009, Bond Yields Bottomed When Month-On-Month Inflation Bottomed
Similarly, in 2020-21, after a six month sequence of increasing monthly rates of inflation, the May 2021 print marked the end of the rising trend. To the extent that this was anticipated, most of the decline in the bond yield has happened since mid-May (Chart I-5). Chart I-5In 2021, Bond Yields Topped When Month-On-Month Inflation Topped
In 2021, Bond Yields Topped When Month-On-Month Inflation Topped
In 2021, Bond Yields Topped When Month-On-Month Inflation Topped
Since mid-May, the 60 percent crash in the lumber price shows what happens when supply bottlenecks ease. Other prices that are being supported by temporary supply constraints – such as used car prices – are likely to suffer the same fate (Chart of the Week). Hence, so long as the coming monthly prints confirm an ongoing deceleration in inflation, the current rally in bonds will stay intact. Jobs: The Hard Work Starts Now Staying on the theme of speed, there is a well-defined speed limit to every post-recession jobs recovery. In A Fed Rate Hike By Early 2023 Is Pie In the Sky, we pointed out the remarkable consistency in the pace of post-recession US jobs recoveries. The last five recessions had different causes, severities, durations and peak unemployment rates. Yet in the recoveries that followed each recession, the unemployment rate declined at a remarkably consistent pace of 0.4-0.5 percent per year (Table I-1). Table I-1After Every Recession, The Pace Of Recovery In The Jobs Market Is Near-Identical
H2 2021: Speed Limits, Speed Bumps, And Super-Spreaders
H2 2021: Speed Limits, Speed Bumps, And Super-Spreaders
Reassuringly at the last FOMC press conference, Jay Powell supported this thesis: Most of the act of sort of going back to one's old job – that's kind of already happened. So, this is a question of people finding a new job. And that's just a process that takes longer. There may be something of a speed limit on it. You've got to find a job where your skills match, you know, what the employer wants. It's got to be in the right area. There's just a lot that goes into the function of finding a job. Powell’s comments lead to two further points: The act of going back to one’s old job for those on ‘temporary layoff’ is relatively straightforward. For job creation, this is the low hanging fruit, most of which has already been picked. Now comes the much harder part – finding jobs for those ‘not on temporary layoff’ whose numbers have barely declined from the peak (Chart I-6). Chart I-6For Job Creation, The Low Hanging Fruit Has Already Been Picked
For Job Creation, The Low Hanging Fruit Has Already Been Picked
For Job Creation, The Low Hanging Fruit Has Already Been Picked
One way of encapsulating this is to observe that the unemployment rate – including those on temporary layoff – has already made 80 percent of the journey from its recession peak to the February 2020 trough, which makes it seem that the jobs recovery is largely done. However, the unemployment rate for those not on temporary layoff has made only 25 percent of the journey (Chart I-7). Moreover, this process is not a straight line, it is a curve. The first quarter of the journey is the easiest, then it gets harder. Chart I-7The Hard Part Is Finding Jobs For Those Unemployed 'Not On Temporary Layoff'
The Hard Part Is Finding Jobs For Those Unemployed 'Not On Temporary Layoff'
The Hard Part Is Finding Jobs For Those Unemployed 'Not On Temporary Layoff'
As we, and Jay Powell, have pointed out, the process to reduce this unemployment rate has a remarkably consistent speed limit of 0.4-0.5 percent per year. Starting at the current rate of 2.5 percent and a target of 1.5 percent, this means full employment will not be reached before the second half of 2023. And even this assumes clear blue skies for the world economy through the next two years, which is a tall order. We conclude that the market pricing of a Fed funds rate lift-off in December 2022 is much too optimistic, making the December 2022 Eurodollar contract a good buy. The End Of Pandemic Restrictions Will Unleash Super-Spreaders On July 19, the UK will remove all its domestic pandemic restrictions – meaning no more facemasks, social distancing, and limits on the size of gatherings. This doesn’t mean that the pandemic is over in the UK. Far from it. The delta variant of the virus is rampant. Rather, with a large portion of the population vaccinated, the government is replacing state-imposed laws and regulations with a libertarian onus on personal responsibility. Given that Covid-19 is not going away, the UK strategy raises a fundamental question. Other than implementing a vaccination program, what role should a government take in containing the virus? In Who’s Right On The Pandemic – Sweden Or Denmark? we revealed two important findings: First, it is a misunderstanding that state-imposed restrictions cause the collapse in social consumption. This is a classic confusion between correlation and causation. The true cause of the recession is that a virulent disease focuses millions of people on self-preservation, shunning crowds and public places. But to the extent that the pandemic also leads to state-imposed restrictions, many people blame the slowdown on these correlated restrictions rather than on the underlying cause – the voluntary change in behaviour. Second, without state-imposed restrictions, the majority will voluntarily change their behaviour to avoid catching and spreading the virus, but a minority will not. When a virus is spreading, this is critical because a tiny minority of so-called ‘super-spreaders’ is responsible for most infections. Put simply, economic growth depends on the behaviour of the majority and in a pandemic the majority will voluntarily reduce their social consumption. This explains why libertarian Sweden and lockdown Denmark suffered similar contractions in their economies (Chart I-8). Chart I-8Libertarian Sweden Has Not Significantly Outperformed Lockdown Denmark...
Libertarian Sweden Has Not Significantly Outperformed Lockdown Denmark...
Libertarian Sweden Has Not Significantly Outperformed Lockdown Denmark...
In contrast, containing the virus depends on restricting the minority of super-spreaders. Which explains why libertarian Sweden suffered a much worse outbreak of the disease than lockdown Denmark (Chart I-9). Chart I-9...But Libertarian Sweden Has Suffered Many More Covid-19 Casualties
...But Libertarian Sweden Has Suffered Many More Covid-19 Casualties
...But Libertarian Sweden Has Suffered Many More Covid-19 Casualties
The worry now is that the end of state-imposed restrictions will unleash super-spreaders and super-spreading events. This will allow the virus to replicate, mutate, and create new variants which are potentially more transmissible and resistant to existing vaccines. Pulling together our three themes for the second half of the year, inflation is set to decelerate, job creation has a natural speed-limit, and super-spreaders of new-variant Covid-19 infections will create speed bumps in the economy. This means that: Bonds will rally. The US dollar will rally. Growth stocks will outperform value stocks. US stocks will outperform non-US stocks Candidates For Countertrend Reversal This week, we present three candidates for countertrend reversal. First, the Brazilian real’s recent surge has hit expected resistance at 65-day fractal fragility. A good way to play a continued reversal is to short BRL/COP (Chart I-10). Chart I-10The Brazilian Real Is Correcting
The Brazilian Real Is Correcting
The Brazilian Real Is Correcting
Second, within emerging markets, the strong rally in the Saudi equity market is vulnerable to a setback, especially versus other markets. A good way to play this is to short the Saudi Tadawul All Share index versus the FTSE Bursa Malaysia KLCI, given that the 260-day fractal structure is at the point of fragility that marked the major top in 2014 (Chart I-11). Chart I-11The Saudi Stock Market Is Vulnerable To A Setback
The Saudi Stock Market Is Vulnerable To A Setback
The Saudi Stock Market Is Vulnerable To A Setback
Finally, coming full circle to short-term supply bottlenecks, one major beneficiary has been the Marine Transportation sector which, since February, has outperformed the world market by 70 percent. As the supply bottlenecks ease, this is vulnerable to correction, especially as the 260-day fractal structure is at the point of fragility that marked the major top in 2007 (Chart I-12). Chart I-12Underweight Marine Transportation
Underweight Marine Transportation
Underweight Marine Transportation
Hence, this week’s recommended trade is to underweight Marine Transportation versus the market, setting the profit target and symmetrical stop-loss at 16.5 percent. Dhaval Joshi Chief Strategist dhaval@bcaresearch.com Fractal Trading System Fractal Trades 6-Month Recommendations Structural Recommendations Closed Fractal Trades Closed Trades Asset Performance Equity Market Performance Indicators To Watch - Bond Yields Chart II-1Indicators To Watch - Bond Yields - Euro Area
Indicators To Watch - Bond Yields - Euro Area
Indicators To Watch - Bond Yields - Euro Area
Chart II-2Indicators To Watch - Bond Yields - Europe Ex Euro Area
Indicators To Watch - Bond Yields - Europe Ex Euro Area
Indicators To Watch - Bond Yields - Europe Ex Euro Area
Chart II-3Indicators To Watch - Bond Yields - Asia
Indicators To Watch - Bond Yields - Asia
Indicators To Watch - Bond Yields - Asia
Chart II-4Indicators To Watch - Bond Yields - Other Developed
Indicators To Watch - Bond Yields - Other Developed
Indicators To Watch - Bond Yields - Other Developed
Indicators To Watch - Interest Rate Expectations Chart II-5Indicators To Watch - Interest Rate Expectations
Indicators To Watch - Interest Rate Expectations
Indicators To Watch - Interest Rate Expectations
Chart II-6Indicators To Watch - Interest Rate Expectations
Indicators To Watch - Interest Rate Expectations
Indicators To Watch - Interest Rate Expectations
Chart II-7Indicators To Watch - Interest Rate Expectations
Indicators To Watch - Interest Rate Expectations
Indicators To Watch - Interest Rate Expectations
Chart II-8Indicators To Watch - Interest Rate Expectations
Indicators To Watch - Interest Rate Expectations
Indicators To Watch - Interest Rate Expectations