Global

Highlights Global growth is peaking, which makes it important to monitor the risks for signs that it is time to reduce equity exposure. We are especially focused on five risks: 1) The emergence of vaccine-resistant Covid variants; 2) a possible “goods recession”; 3) higher real bond yields; 4) higher US corporate tax rates; and 5) a weaker Chinese economy and regulatory crackdown. For now, we recommend a modest overweight to global equities. We will likely pare back exposure early next year. Stocks And The Business Cycle Our “golden rule” for asset allocation is to remain bullish on equities unless there is a good reason to think that a recession is around the corner. This rule has strong empirical support. Chart 1 shows that equity bear markets rarely occur outside of major business cycle downturns. Chart 1Recessions And Bear Markets Tend To Overlap
Five Risks We Are Monitoring
Five Risks We Are Monitoring
Nevertheless, there are different shades of bullishness. Stocks generally perform best coming out of recessions; that is, when the economy is weak but improving. Stocks perform worst when the economy is falling into recession. We are currently in an intermediate phase, where global growth is weakening but still solidly above trend. Historically, stocks have posted positive but uninspiring returns during such phases (Table 1). Table 1The Economic Cycle And Financial Assets
Five Risks We Are Monitoring
Five Risks We Are Monitoring
Monitoring The Risks In “post peak growth” environments, it is important to monitor the risks for signs that it is time to reduce equity exposure. We are especially focused on five risks: Risk 1: New Covid Variants Chart 2A New Covid Wave
Five Risks We Are Monitoring
Five Risks We Are Monitoring
The Delta strain continues to roll through the US and a number of other countries (Chart 2). While the new strain does not seem to be any more deadly than other variants, it is a lot more contagious. CDC internal estimates suggest the R0 for the Delta variant is between 5-to-8, similar to that of chickenpox, and 40% higher than the original strain.1 Countries such as Thailand and Vietnam, which were able to keep the pandemic at bay last year, have succumbed to Delta. In Australia, the 7-day average of new cases has climbed above 300, the highest since last August. China has detected the Delta variant in more than a dozen cities since July 20. Even if the country succeeds in quashing the new variant, it will come at an economic cost. Lockdowns in major Chinese cities could further clog a global supply chain that is still reeling from the dislocations caused by the pandemic. While still vulnerable to the Delta variant, the symptoms of vaccinated individuals tend to be mild and non-life threatening. The Lambda variant, which surfaced in Peru this past December, appears more vaccine-resistant than the Delta variant. Fortunately, it is not as contagious as Delta, and has struggled to propagate outside of South America. The risk is that a new variant emerges which is: 1) highly contagious; 2) vaccine resistant; and 3) as or more lethal than the original strain. Chart 3The Divergence Between Goods And Services Spending
The Divergence Between Goods And Services Spending
The Divergence Between Goods And Services Spending
Our Assessment: The current suite of vaccines confers substantial protection. While a vaccine-resistant strain could emerge, it is likely that vaccine producers will be able to adjust their formula to keep the virus at bay. As such, we see Covid as only a modest risk to global stocks. Risk #2: A Goods Recession Even if Covid fades from view, the dislocations caused by the pandemic will persist for a while longer. As we discussed last week, the pandemic induced a major reallocation of spending from services to goods: Overall consumer spending in the US is broadly back to its pre-pandemic trend. However, service spending remains below trend while goods spending is above trend (Chart 3). Retail sales, which are dominated by goods, are also firmly above trend (Chart 4). We do not expect spending on goods to drop off anytime soon. A variety of manufactured goods, ranging from automobiles to major appliances, remain in short supply. The need to fill backorders and replenish inventories will keep production elevated for the next four quarters. However, at some point in the second half of 2022, manufacturers and retailers could find themselves with a glut of goods on their hands. Chart 4AUS Retail Spending Is Well Above Trend (I)
US Retail Spending Is Well Above Trend (I)
US Retail Spending Is Well Above Trend (I)
Chart 4BUS Retail Spending Is Well Above Trend (II)
US Retail Spending Is Well Above Trend (II)
US Retail Spending Is Well Above Trend (II)
Manufacturing accounts for only 11% of US GDP. However, goods producers account for about a third of S&P 500 market capitalization. Thus, while a slowdown in spending on goods is unlikely to push the US into recession, it could cause S&P 500 earnings growth to slow sharply, similar to what occurred during the 2015-16 manufacturing recession (Chart 5). Our Assessment: A goods recession represents a threat to both US and overseas stocks, particularly manufacturers and retailers. Most likely, however, that threat will not become visible to investors until next year. Risk #3: Higher Real Bond Yields Stocks represent a claim on future corporate cash flows. Higher real interest rates reduce the present value of those claims, leading to lower stock prices. Chart 6 shows that there is a strong correlation between the US 10-year TIPS yield and the forward P/E ratio for the stock market. Chart 5The 2015-16 Manufacturing Recession Weighed On Earnings
The 2015-16 Manufacturing Recession Weighed On Earnings
The 2015-16 Manufacturing Recession Weighed On Earnings
Chart 6Higher Real Rates Would Be A Headwind For Equity Valuations
Higher Real Rates Would Be A Headwind For Equity Valuations
Higher Real Rates Would Be A Headwind For Equity Valuations
US real yields jumped in the wake of July’s stellar employment report. However, they still remain negative and far below pre-pandemic levels. Looking out, real yields could rise for two diametrically different reasons. On the one hand, an adverse demand shock could drive up real yields by pushing down inflationary expectations. This is precisely what happened during the early days of the pandemic. Such a deflationary shock could arise if a vaccine-resistant variant emerges or if spending on manufactured goods declines faster than we expect. The failure of the US Congress to pass the infrastructure bill and/or a budget reconciliation bill could also exacerbate fiscal tightening next year. Under current law, fiscal policy will subtract around two percentage points from growth next year (Chart 7). Chart 7After A Strong Boost, Fiscal Thrust Is Turning Negative
Five Risks We Are Monitoring
Five Risks We Are Monitoring
On the other hand, real yields could rise if an overheated economy prompts the Fed to hike rates more aggressively than markets are discounting. The US 10-year yield tends to track expected policy rates three years out (Chart 8). Chart 810-Year Treasurys Track Expected Policy Rates Three Years Out
10-Year Treasurys Track Expected Policy Rates Three Years Out
10-Year Treasurys Track Expected Policy Rates Three Years Out
Chart 9Both The Fed And Market Participants Have Revised Down Their Estimate Of The Neutral Rate Of Interest
Both The Fed And Market Participants Have Revised Down Their Estimate Of The Neutral Rate Of Interest
Both The Fed And Market Participants Have Revised Down Their Estimate Of The Neutral Rate Of Interest
An increase in the market’s estimate of the terminal rate could also push up real yields. According to the New York Fed’s survey of primary dealers and market participants, investors think that the fed funds rate will top out at around 2%. Not only is this extremely low by historic standards, but it is also lower than the Fed’s estimate of the terminal rate (Chart 9). In the past, we have made a distinction between the strong- and weak-form versions of secular stagnation. The strong-form version is one where an economy is unable to reach full employment even with zero interest rates. Japan is a good example. The weak-form version is one where the economy can achieve full employment but only in the presence of low positive interest rates (Chart 10). Chart 10Strong- Versus Weak-Form Secular Stagnation
Five Risks We Are Monitoring
Five Risks We Are Monitoring
In many respects, weak-form secular stagnation is better for equities than the normal state of affairs where the economy is at full employment and interest rates are near their historic average. This is because weak-form secular stagnation allows equity investors to have their cake and eat it too – to enjoy full employment and high corporate profits, all with the persistent tailwind of very low rates. Our Assessment: Our baseline view on the US envisions a goldilocks scenario of sorts: An economy that is hot enough to keep deflationary forces at bay, but not so hot that the Fed has to intervene to raise rates. While there are risks on both sides of this view, they are fairly modest. US households are sitting on nearly $2.5 trillion in excess savings, which should support consumption over the next few years. BCA’s geopolitical team, led by Matt Gertken, thinks that there is an 80% chance that Congress will pass an infrastructure bill. Assuming an infrastructure bill passes, they also see a 65% chance that the Democrats will succeed in pushing through a watered-down $3.5 trillion budget reconciliation bill. Meanwhile, as the July CPI report illustrates, inflationary forces are already starting to die down, which should keep rate expectations from rising too rapidly. Risk #4: Higher US Corporate Tax Rates Chart 11Bettors Expect US Corporate Tax Rates To Rise, But Not By Much
Five Risks We Are Monitoring
Five Risks We Are Monitoring
Congress’ passage of a budget reconciliation bill would blunt some of the fiscal tightening slated for next year. However, to pay for the additional spending, Democrats will seek to levy more taxes on corporations and higher-income earners. The Biden Administration is aiming to raise the corporate tax rate from 21% to 28%, bringing it halfway back to the 35% level that prevailed prior to the Trump tax cuts. Joe Manchin, a key swing voter in the Senate, has indicated a preference for 25%. PredictIt, a popular betting site, assigns 31% odds to no tax hike. Among bettors forecasting higher tax rates, the median estimate is around 25% (Chart 11). Analyst estimates do not appear to reflect the prospect of higher taxes. This is not surprising. Chart 12 shows that analysts did not adjust their earnings estimates until shortly after President Trump signed the Tax Cuts and Jobs Act into law on December 22, 2017. Chart 12Analysts Have Not Adjusted Their Earnings Estimates To Reflect The Likelihood Of Higher Taxes
Analysts Have Not Adjusted Their Earnings Estimates To Reflect The Likelihood Of Higher Taxes
Analysts Have Not Adjusted Their Earnings Estimates To Reflect The Likelihood Of Higher Taxes
Chart 13Until Recently, Companies That Stand To Lose The Most From Higher Taxes Have Fared Well
Until Recently, Companies That Stand To Lose The Most From Higher Taxes Have Fared Well
Until Recently, Companies That Stand To Lose The Most From Higher Taxes Have Fared Well
It is more difficult to know what markets are discounting. Chart 13 displays the performance of Goldman‘s “Formerly High Tax” and “Formerly Low Tax” equity baskets. The formerly high-taxed companies gained the most from Trump’s tax cuts and presumably would lose the most if the tax cuts were rolled back. While formerly high-taxed companies have underperformed the market since early May, they are still up relative to their low-taxed peers since the Georgia runoff election, which handed control of the Senate to the Democrats. Moreover, companies that are vulnerable to higher taxes on overseas profits – many of which are in the tech space – have continued to fare well. Our Assessment: BCA’s geopolitical team thinks that corporate taxes will rise more than current market expectations suggest. However, even under our baseline scenario, higher tax rates will only cut earnings-per-share for S&P 500 companies by about 5% in 2022. Given that earnings are expected to rise by 9% next year, this would still leave earnings growth in positive territory. Risk #5: China The Chinese economy grew at an annualized rate of only 3.5% in the first half of 2021 (Chart 14). While stricter Covid restrictions will weigh on growth in Q3, activity should pick up again in the fourth quarter. Chart 14Chinese Growth Was Weak In The First Half of 2021
Chinese Growth Was Weak In The First Half of 2021
Chinese Growth Was Weak In The First Half of 2021
The degree to which China’s economy recovers later this year will depend on the overall policy stance. Both credit and money growth fell short of expectations in July. Aggregate social financing declined to CNY 1.06 trillion from CNY 3.7 trillion in June, missing expectations of a CNY 1.7 trillion increase. M2 money growth clocked in at 8.3% year-over-year, below consensus estimates of 8.7%. As of July, local governments had used only 37% of their annual bond issuance quota, compared with 61% over the same period last year and 78% in 2019. BCA Chief China strategist, Jing Sima, thinks that local governments were waiting for a clear signal from the Politburo meeting held on July 30th before issuing new debt. If so, the fiscal stance should turn more expansionary over the coming months. Nevertheless, Beijing continues to send conflicting messages – on the one hand, telling local governments that they need to support growth, while on the other hand admonishing them for wasteful spending. Chart 15Chinese Tech Stocks Have Underperformed Their Global Peers This Year
Chinese Tech Stocks Have Underperformed Their Global Peers This Year
Chinese Tech Stocks Have Underperformed Their Global Peers This Year
Stepped-up regulation of China’s major internet companies has also unnerved investors. Chinese internet stocks have underperformed the global tech sector by more than 40% since February (Chart 15). Our Assessment: With credit growth back down to its 2018 lows, the authorities are likely to ease policy over the coming months. While the crackdown on internet companies will continue, it is unlikely to spill over to other sectors. Unlike Chinese companies in, say, the telecom or semiconductor sectors, Beijing does not see most online platforms as contributing much to the economy. What they do see are companies with the potential to undermine the authority of the Communist Party (and in the case of online education providers, reduce the birth rate by burdening parents with high educational expenses). Investment Conclusions Chart 16Equities Look More Attractive Than Bonds
Equities Look More Attractive Than Bonds
Equities Look More Attractive Than Bonds
We will likely pare back equity exposure early next year. For now, however, we recommend that asset allocators maintain a modest overweight to global equities. Growth is slowing but will remain solidly above trend for the remainder of the year. The forward earnings yield on the MSCI All-Country World Index stands at 5.2%. While this is not particularly high in absolute terms, it is still very high in relation to bond yields (Chart 16). Stocks outside the US trade at a still-decent earnings yield of 6.4% (compared to 4.6% in the US). Granted, the earnings performance of many non-US companies leaves much to be desired. Nevertheless, relative valuations largely discount this fact. Moreover, continued above-trend global growth, Chinese stimulus, and rising bond yields should benefit cyclical stocks and value names, which are overrepresented in overseas indices. Peter Berezin Chief Global Strategist peterb@bcaresearch.com Footnotes 1 The basic reproduction number, R0 (pronounced “R naught”), corresponds to the average number of people a carrier of the virus will infect in a population with no natural or vaccine-induced immunity. Global Investment Strategy View Matrix
Five Risks We Are Monitoring
Five Risks We Are Monitoring
Special Trade Recommendations
Five Risks We Are Monitoring
Five Risks We Are Monitoring
Current MacroQuant Model Scores
Five Risks We Are Monitoring
Five Risks We Are Monitoring
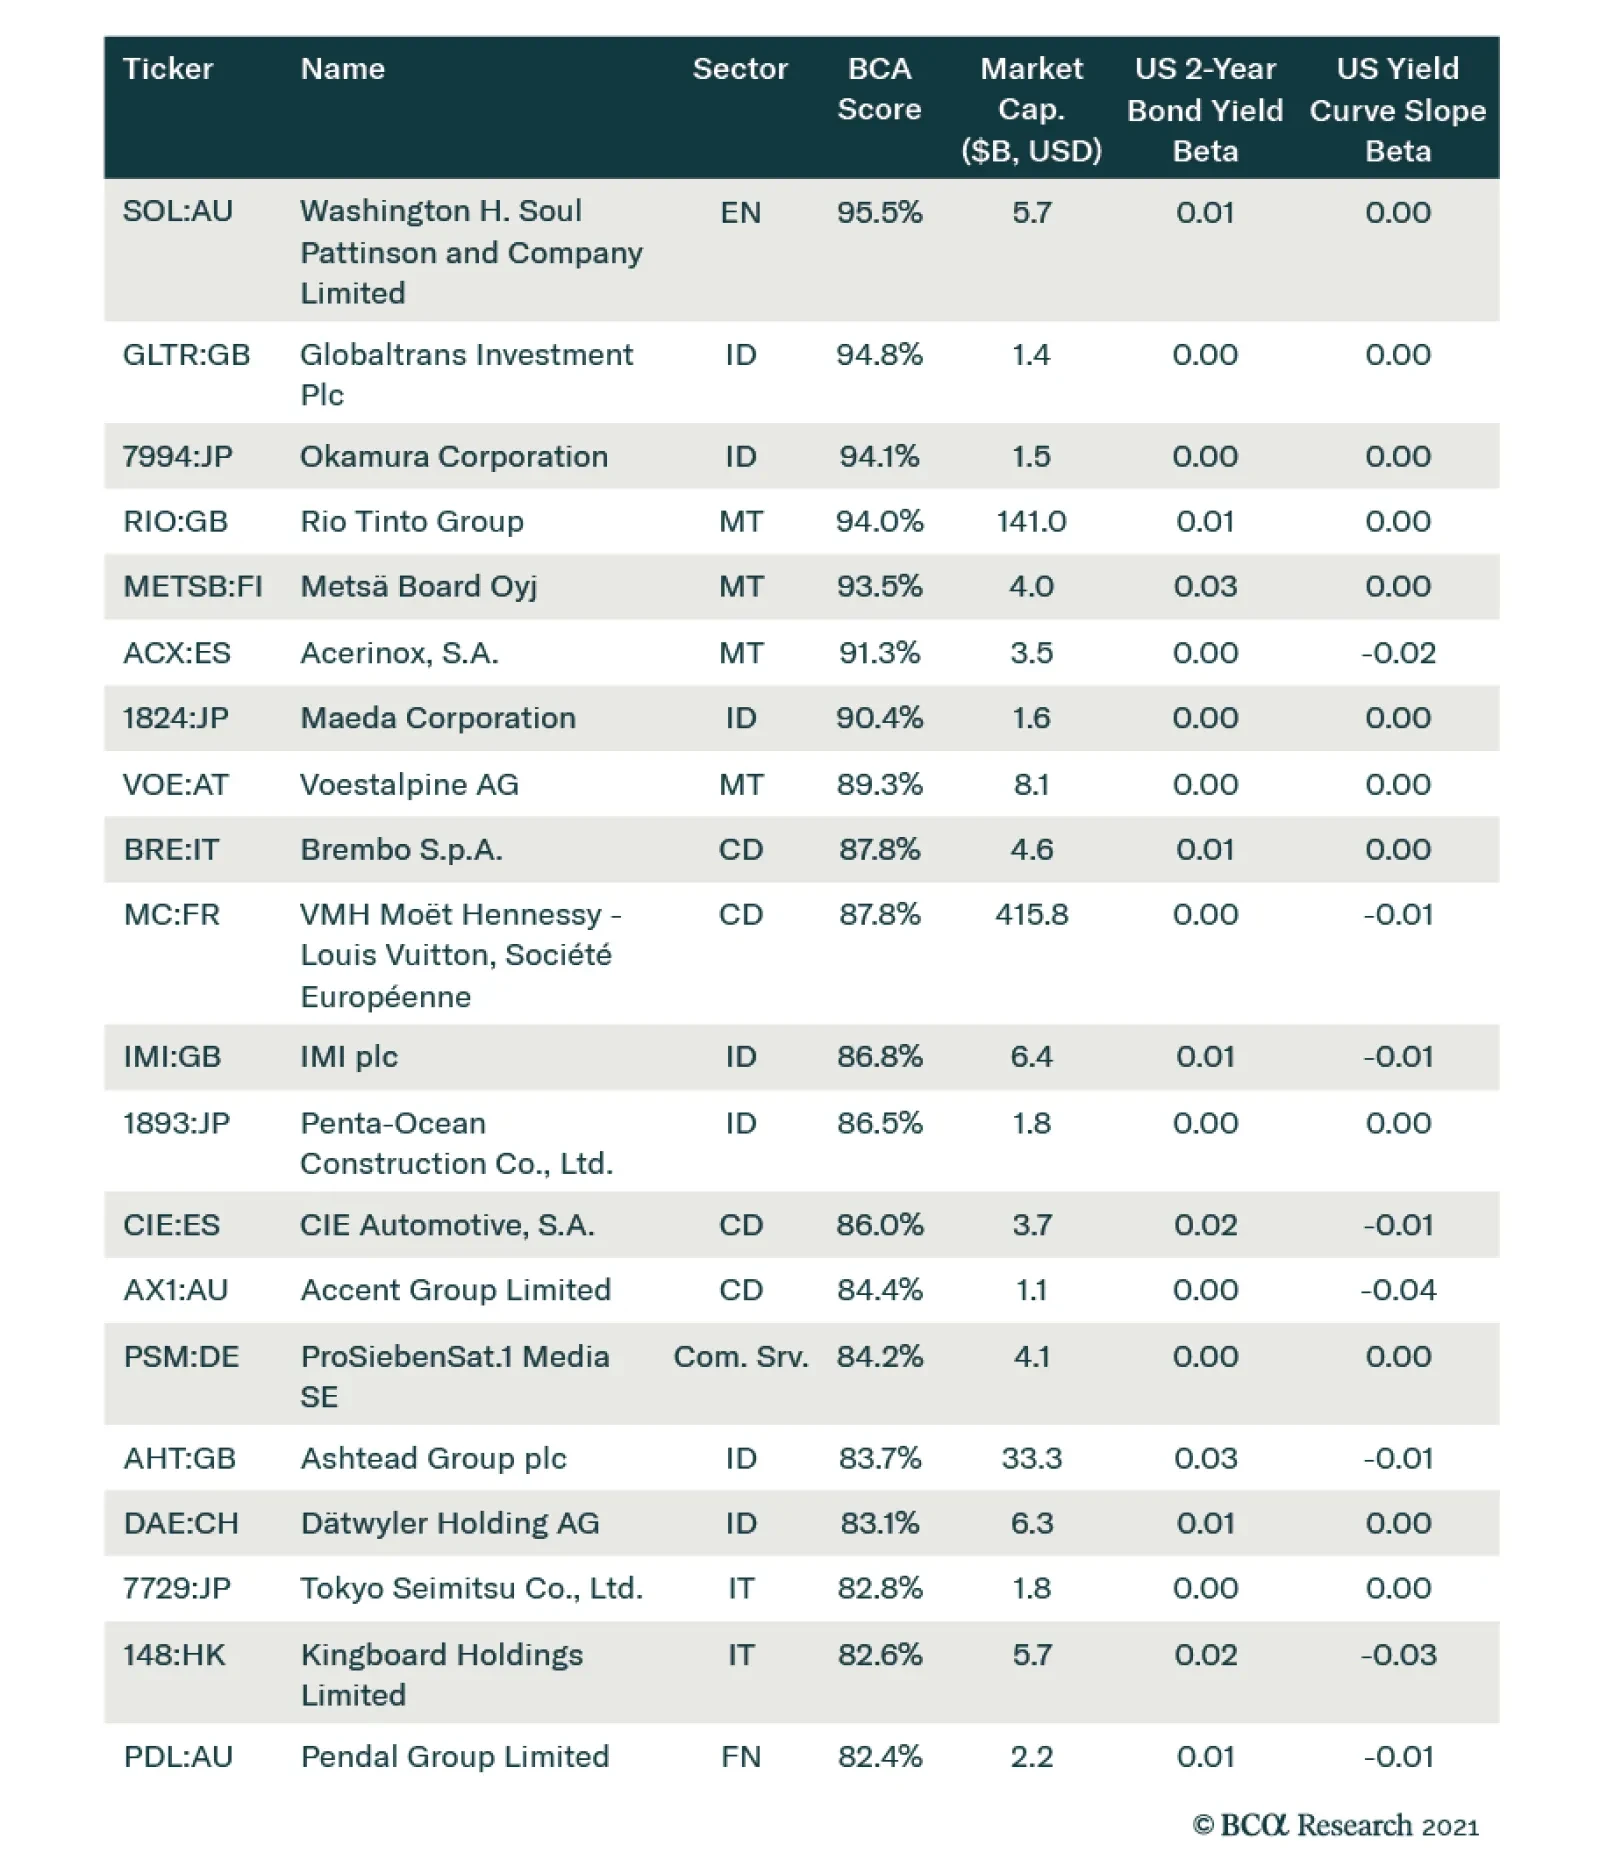
Our Colleagues at BCA Research’s Equity Analyzer recently used their new Equity Analyzer macro sensitivities tool to combine their bottom-up quantitative framework with our Fixed Income strategists’ top-down theme to identify stocks that will benefit as the…
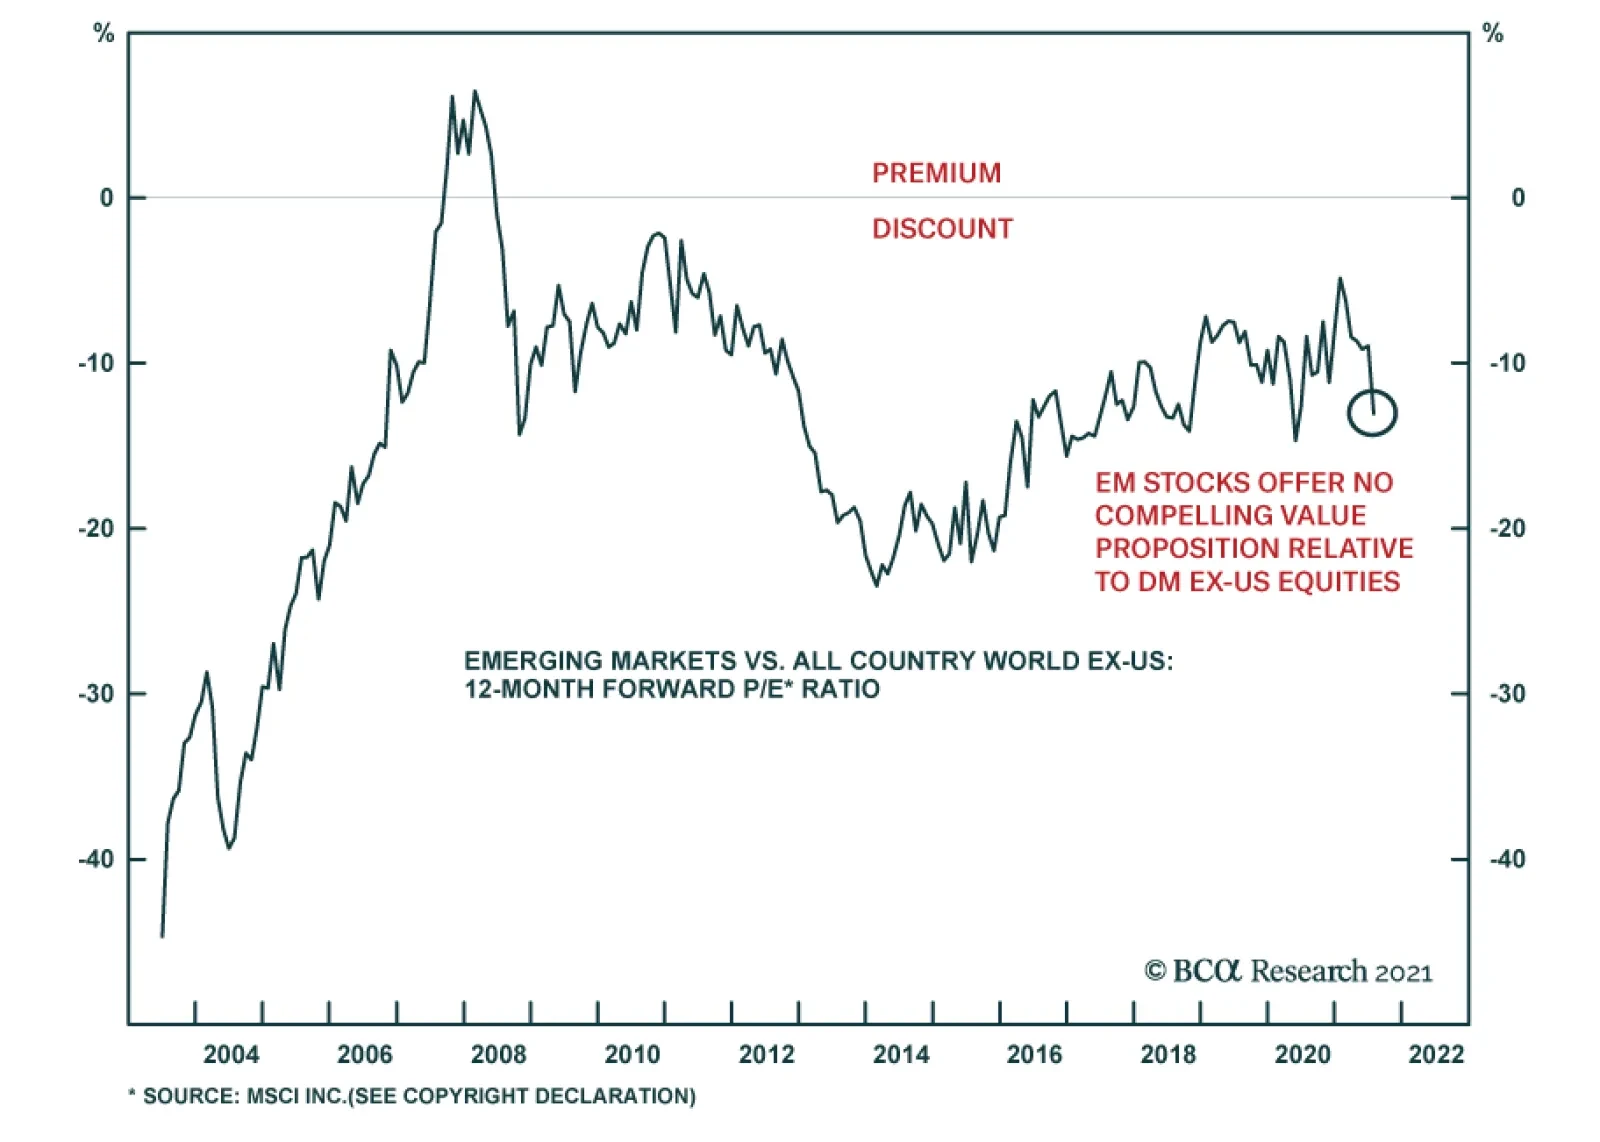
Within a global equity portfolio, the most important allocation decision for investors to make is usually whether to favor US or global ex-US equities. But within an allocation to the latter, there is also the question of whether investors should overweight…
According to BCA Research’s Counterpoint service, a productivity super-boom will cause interest rate hikes to be much later and much shallower than the market is pricing. Just as advances in tennis, swimming and the high jump came from challenging the…
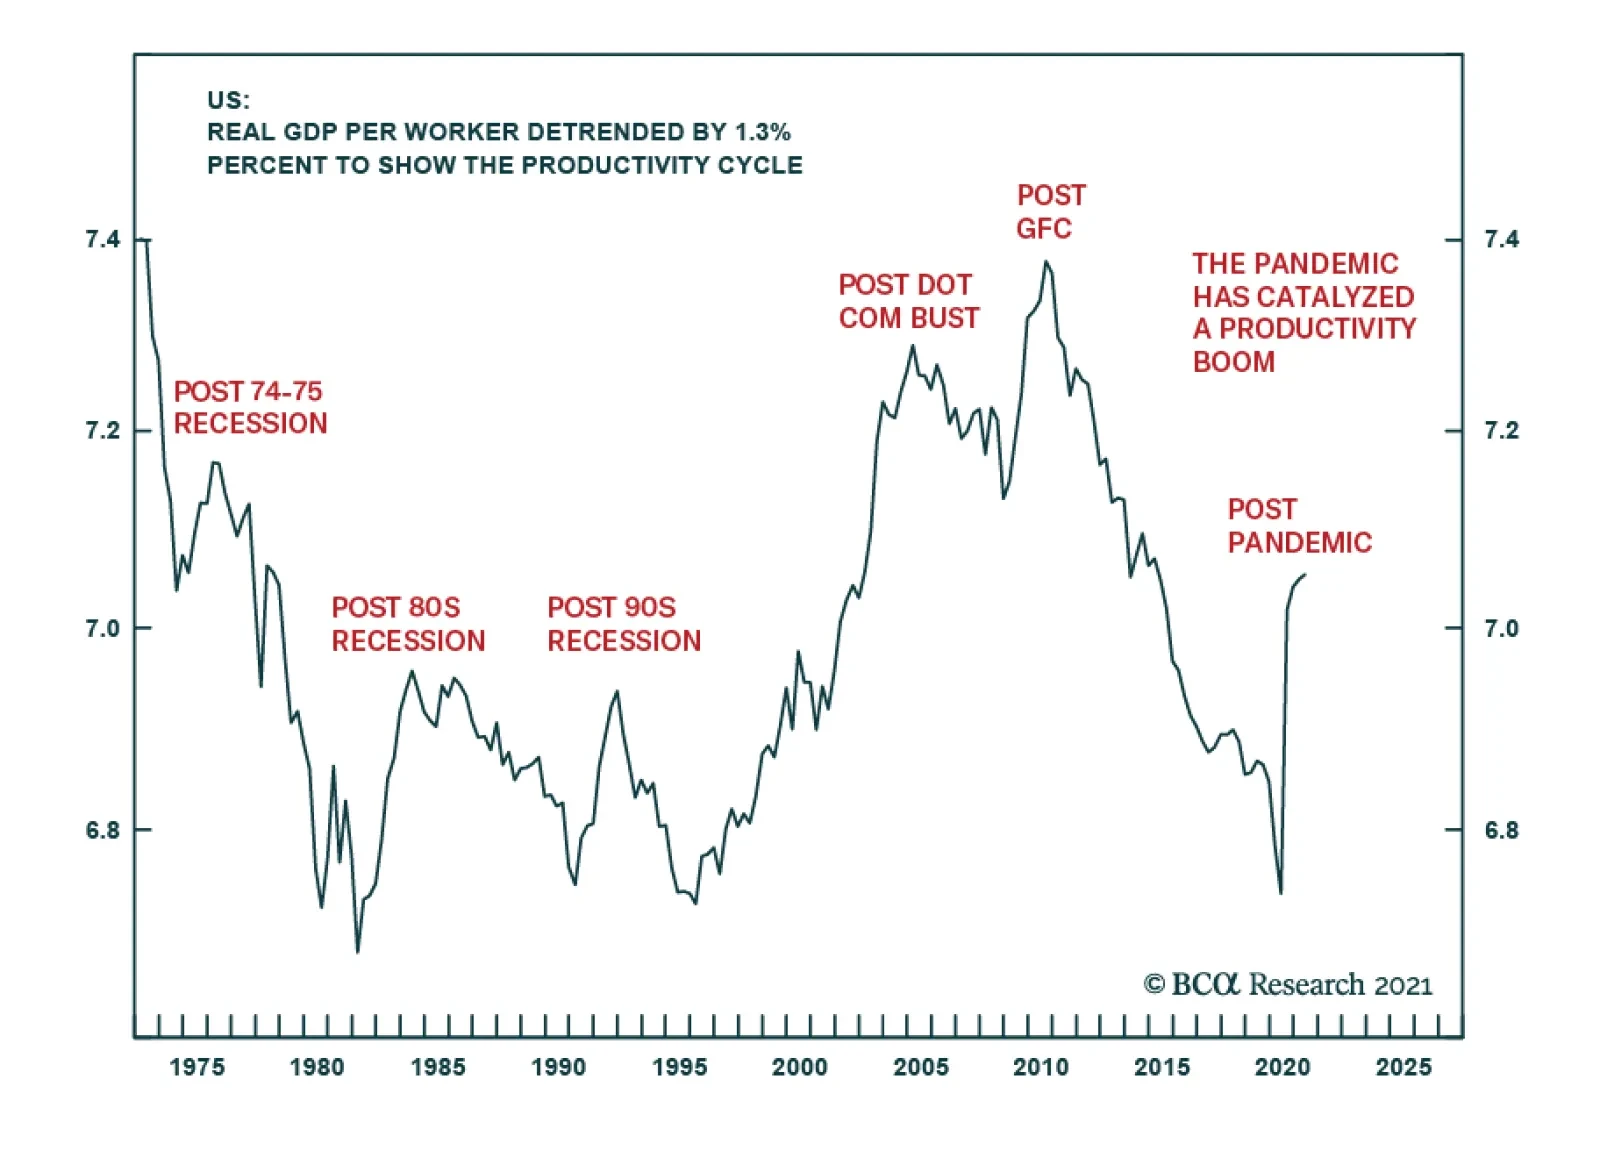
Highlights Advances in tennis, swimming and the high jump came from challenging the ‘best practices’, and finding better ways of doing these things. The pandemic has challenged the best practices on how we should work, do business, and shop, catalysing better ways of doing these things. The productivity boom could be a super-boom because the current disruption is not in just one sector but across the entire economy. A productivity super-boom means that the economy will take longer to reabsorb the unemployed, and that structural inflation will stay depressed. This means that interest rate hikes will be much later and much shallower than the market is pricing. For equity investors, a productivity super-boom plus the market’s overestimation of Fed rate hikes structurally favours growth sectors versus value sectors. Thereby, it also structurally favours the S&P500 versus the Eurostoxx50. Fractal analysis: stocks versus bonds remains fragile, and the rally in tin is very fragile. Feature Chart of the WeekThe Pandemic Has Catalysed A Productivity Boom
The Pandemic Has Catalysed A Productivity Boom
The Pandemic Has Catalysed A Productivity Boom
“I believe that the (Fosbury) flop was a natural style and I was just the first to find it” – Dick Fosbury, on how he revolutionised the high jump Watching the Tokyo Olympics, the flurry of new world records reassures us that human athletic productivity continues to advance. It does so in three ways: better biology, better technology, and better ways of doing the same thing. Better biology comes from advances in nutrition and healthcare – at least, for those that embrace the advances. Better technology means better equipment. For example, more ergonomic bikes, sharkskin-like swimwear that minimises water resistance, and running shoes that re-channel energy back into the legs. Albeit this raises the contentious issue that technological advances are giving some athletes an unfair and unnatural advantage. Case in point, World Athletics (and the Tokyo Olympics) have banned prototype versions of Nike’s Vaporfly running shoe that was used by Eliud Kipchoge to run the first sub-two hour marathon. The banned prototype shoe, containing triple carbon plates inside thick ultra-compressed foam, is claimed to improve running economy by up to four percent. But if technological advances are giving some athletes an advantage, it follows that they must also be giving some firms and economies an advantage. While this is unfair in sporting competition, it is fair in economic competition. An important implication is that firms and economies that embrace disruptive technologies and innovations – such as working from home – are likely to generate superior long-term productivity growth than firms and economies that do not. Productivity Growth Comes From Finding Better Ways Of Doing The Same Thing Yet, looking at the longer-term ‘productivity growth’ in sport, many of the greatest advances have come not from better biology or better technology, but just from finding better ways of doing the same thing. Tennis, swimming, and athletics provide three excellent examples of such innovation. A tennis ball weighs just 50 grams, so anybody can hit a tennis ball hard. The difficult part is hitting the ball hard and landing it within the 78 foot court. In the 1970s, Bjorn Borg revolutionised tennis by hitting with aggressive topspin on both the forehand and backhand as well as the serve. Meaning that rather than having to approach the net as was the ‘best practice’, Borg could win matches from the baseline. All it required was a different way of holding the racket and using his arms (Figure I-1). Figure I-1Challenging The Best Practice In Tennis Boosted Its Productivity
What The Olympics Teaches Us About Productivity Growth
What The Olympics Teaches Us About Productivity Growth
Borg’s revolution has a fascinating backstory. Borg’s father, a table tennis champion, won a tennis racket in a table tennis tournament and gave it to the 9-year old Bjorn. Familiar with table tennis and now armed with a tennis racket, the young Borg’s revolution was to play tennis as if it were table tennis – with its trademark topspin on both wings as well as the serve – albeit on a much bigger ‘table.’ And with a racket that was far too heavy for him that he held with both hands. (He eventually switched to a one-handed forehand but kept his two-handed backhand.) Go back a hundred years, and swimming experienced a similar revolution. Until the 1870s, the best practice for European swimmers was the highly inefficient breaststroke. But in 1873, John Arthur Trudgen emulated the technique used by Native Americans whereby the arms moved in a crawl. Later, the Australian Fred Cavill also emulated the Natives’ flutter kick, and thus made mainstream the front crawl, which has significantly increased swimming speed, or swimming ‘productivity.’ All it required was a different way of moving our arms and legs. But probably the greatest example of athletic innovation came in the 1968 Mexico Olympics, when Dick Fosbury turned the standard high jumping technique on its head – or, more precisely, on its back – to win the gold medal and smash the world record. Prior to the 1968 Games, the best practice high jump technique had been the ‘straddle’ which involved jumping forward, twisting the body to navigate the bar, and then landing on your feet. Fosbury changed all that forever. He jumped backwards off the wrong foot, arched his back over the bar, and landed on his back (Figure I-2). Figure I-2Challenging The Best Practice In The High Jump Boosted Its Productivity
What The Olympics Teaches Us About Productivity Growth
What The Olympics Teaches Us About Productivity Growth
Just like the tennis topspin and swimming’s front crawl, high jump’s ‘Fosbury flop’ has become the mainstream technique in the sport, taking performance and ‘productivity’ literally to new highs. And just like the tennis topspin and swimming’s front crawl, all it required was a different way of using our existing resources – in this case, jumping backwards rather than forwards. Yet in the case of the innovative Fosbury flop, something else also played an important role – a new environment. Until the 1960s, high jumpers cleared the bar and landed on sawdust, sand, or thin mats. Hence, any innovation in high jump techniques was constrained by having to land on your feet. This changed when Fosbury’s high school became one of the first to install deep foam matting for high jump landing. The Fosbury flop could not have been innovated before the introduction of deep foam matting, because jumping backwards and landing on your back depended on the existence of a soft foam mat for a safe landing. The crucial lesson is that a new environment gives us a chance to challenge beliefs on ‘how things should be done’, a chance to discover new ways of doing the same thing differently, and better. To challenge beliefs on how things should be done, what bigger change in the environment can there be than a global pandemic? The Pandemic Has Catalysed Better Ways Of Doing The Same Thing Just like athletic productivity growth, economic productivity growth comes from better biology (which improves both our physical and intellectual capacity), better technology, and finding better ways of doing the same thing. Of these three drivers, the first two are continuous processes but the third, finding better ways of doing the same thing, gets a massive boost from disruptive changes in the environment such as recessions (Chart of the Week and Chart I-2). Chart I-2Productivity Surges After Recessions
Productivity Surges After Recessions
Productivity Surges After Recessions
In this regard, any technology that is required already generally exists, but the recession is the necessary catalyst for its wholesale adoption. For example, the mass manufacturing of autos already existed well before the Great Depression, but the Depression was the catalyst for its wholesale adoption. Likewise, word processors existed well before the dot com bust, but the 2000 recession was what finally killed the office typing pool. In the same way, the technology for online shopping and remote meetings has been around for years, but it is the pandemic that has catalysed its wholesale adoption (Chart I-3). Chart I-3The Pandemic Has Accelerated The Shift To Online
What The Olympics Teaches Us About Productivity Growth
What The Olympics Teaches Us About Productivity Growth
As Fosbury said, he was just the first to find a more natural style of high jumping, yet it required a change of environment to challenge the best practice. Similarly, it has taken a global pandemic for us to challenge the best practice on how we should work, do business, shop, and interact (Chart I-4). Chart I-4The Pandemic Has Accelerated The Shift To Online
What The Olympics Teaches Us About Productivity Growth
What The Olympics Teaches Us About Productivity Growth
It is sub-optimal to work in the office or to shop in-person all the time. It is also sub-optimal to do these things remotely all the time. The optimal way is some hybrid of in-person and remote interactions, which will clearly differ for each person. But the pandemic has given us the opportunity to find this more natural and better way, and thereby to give our productivity a massive boost (Chart I-5). Chart I-5The Pandemic Has Challenged The Best Practice On How To Work
What The Olympics Teaches Us About Productivity Growth
What The Olympics Teaches Us About Productivity Growth
The productivity boom could be a super-boom because the current disruption has forced us all to find better ways of doing things. This differentiates the current episode from previous post-recession periods where transformations were focussed in one sector. For example, the 80s recession reshaped manufacturing, the dot com bust changed the technology sector, and the 2008 recession transformed the financial sector. By comparison, the current transformation is penetrating the entire economy. The Investment Conclusion A productivity super-boom carries two important implications for policymakers. It will take longer for the economy to reabsorb the unemployed, and it will keep structural inflation depressed. This means that interest rate hikes will be much later and much shallower than the market is pricing (Chart I-6 and Chart I-7). Chart I-6Rate Hikes Will Be Later Than The Market Is Pricing
Rate Hikes Will Be Later Than The Market Is Pricing
Rate Hikes Will Be Later Than The Market Is Pricing
Chart I-7Rate Hikes Will Be Shallower Than The Market Is Pricing
Rate Hikes Will Be Shallower Than The Market Is Pricing
Rate Hikes Will Be Shallower Than The Market Is Pricing
The investment conclusion is to buy any of the US interest rate futures that expire from December 2022 out to June 2024. The earlier contracts have the higher probabilities of expiring in profit while the later contracts have the greater potential upside. An alternative expression is to buy the 30-year T-bond, or to go long the 30-year T-bond versus the 30-year German bund. For equity investors, a productivity super-boom plus the market’s overestimation of Fed rate hikes structurally favours growth sectors versus value sectors. Thereby, it also structurally favours the S&P500 versus the Eurostoxx50. Fractal Analysis Update Global stocks versus bonds (MSCI All Country World versus 30-year T-bond) continue to exhibit the fragility on the 260-day fractal structure that started in mid-March. Since then, and consistent with this fragility, global stocks have underperformed bonds by 6 percent (Chart I-8). Chart I-8Stocks Versus Bonds Remains Fractally Fragile
Stocks Versus Bonds Remains Fractally Fragile
Stocks Versus Bonds Remains Fractally Fragile
But fragility on a 260-day fractal structure implies elevated risk of a reversal through at least the following six months. On this basis, our recommendation is to remain, at most, neutral to global stocks versus bonds through the summer. Among recent trades, short corn versus wheat, and short marine transportation versus market achieved their profit targets of 12 percent and 16.5 percent respectively, but short Austria versus Chile, and short lead versus platinum hit their stop-losses of 7 percent and 6.4 percent respectively. The 6-month win ratio stands at a very pleasing 71 percent. This week’s recommended trade is to reinitiate the stopped-out metals pair-trade in a modified expression – short tin versus platinum – given the very fragile 130-day and 260-day fractal structure (Chart I-9). Set the profit target and symmetrical stop-loss at 16.5 percent. Chart I-9Tin Is Fractally Fragile
Tin Is Fractally Fragile
Tin Is Fractally Fragile
Dhaval Joshi Chief Strategist dhaval@bcaresearch.com Fractal Trading System Fractal Trades 6-Month Recommendations Structural Recommendations Closed Fractal Trades Closed Trades Asset Performance Equity Market Performance Indicators To Watch - Bond Yields Chart II-1Indicators To Watch - Bond Yields ##br##- Euro Area
Indicators To Watch - Bond Yields - Euro Area
Indicators To Watch - Bond Yields - Euro Area
Chart II-2Indicators To Watch - Bond Yields ##br##- Europe Ex Euro Area
Indicators To Watch - Bond Yields - Europe Ex Euro Area
Indicators To Watch - Bond Yields - Europe Ex Euro Area
Chart II-3Indicators To Watch - Bond Yields ##br##- Asia
Indicators To Watch - Bond Yields - Asia
Indicators To Watch - Bond Yields - Asia
Chart II-4Indicators To Watch - Bond Yields ##br##- Other Developed
Indicators To Watch - Bond Yields - Other Developed
Indicators To Watch - Bond Yields - Other Developed
Indicators To Watch - Interest Rate Expectations Chart II-5Indicators To Watch - Interest Rate Expectations
Indicators To Watch - Interest Rate Expectations
Indicators To Watch - Interest Rate Expectations
Chart II-6Indicators To Watch - Interest Rate Expectations
Indicators To Watch - Interest Rate Expectations
Indicators To Watch - Interest Rate Expectations
Chart II-7Indicators To Watch - Interest Rate Expectations
Indicators To Watch - Interest Rate Expectations
Indicators To Watch - Interest Rate Expectations
Chart II-8Indicators To Watch - Interest Rate Expectations
Indicators To Watch - Interest Rate Expectations
Indicators To Watch - Interest Rate Expectations
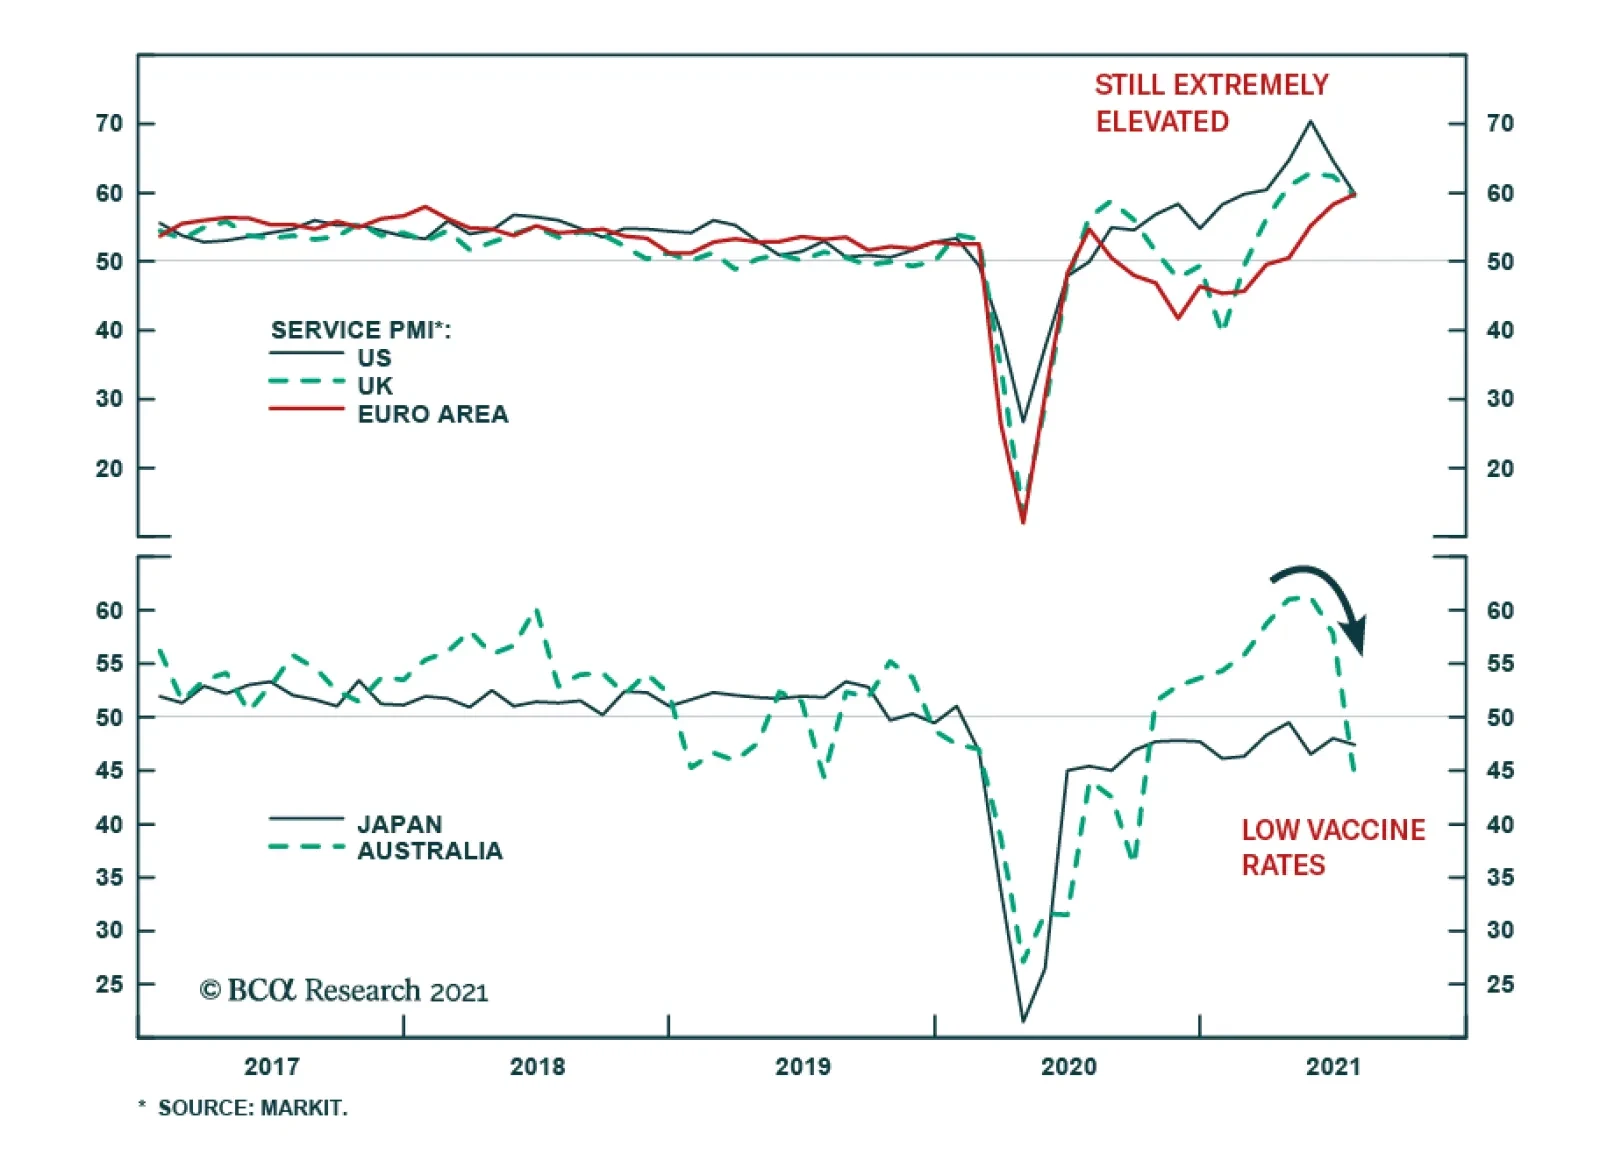
Global services continue to recover smartly despite the latest wave of COVID-19 infections. Even after losing 1.2 points in July, the global services PMI remains relatively elevated at 56.3, indicating that the sector continues to expand. Services activity…
Dear Client, This week, in lieu of our regular report, I am sending you a special report written by my colleague Jonathan LaBerge, chief strategist of our flagship The Bank Credit Analyst service. Jonathan argues that investors should see social media as a technological innovation that harms productivity. While Jonathan concedes that social media was not the main driver of policy uncertainty and political risk over the past decade, he makes a good case that it plays an aggravating role. He warns that social media and political polarization still pose risks to the macroeconomic outlook in the coming years, while also highlighting idiosyncratic risks threatening social media stocks. We trust that you will find this report insightful. We will resume regular publication next week. All very best, Matt Gertken Vice President Geopolitical Strategy US Political Strategy BCA Research Highlights Investors should view social media as a technological innovation with negative productivity growth. Social media has contributed to policy mistakes – such as fiscal austerity and protectionism – that have acted as shocks to aggregate demand over the past 15 years. The cyclical component of productivity was long lasting in nature during the last economic expansion. Forces that negatively impact economic growth but do not change the factors of production necessarily reduce measured productivity, and repeated policy mistakes strongly contributed to the slow growth profile of the last economic cycle. Political polarization in a rapidly changing world is the root cause of these policy shocks, but social media likely facilitated and magnified them. The risks of additional mistakes from populism remain present, even before considering other risks to society from social media: a reduction in mental health among young social media users, and the role that social media has played in spreading misinformation. A potential revival in protectionist sentiment is a risk to a constructive cyclical view that we will be closely monitoring over the coming 12-24 months. Investors with concentrated positions in social media stocks should be aware of the potential idiosyncratic risks facing these companies from the public’s impression of the impact of social media on society – especially if social media companies come to be widely associated with political gridlock, the polarization of society, and failed economic policies (as already appears to be the case). Feature Investors should view social media as a technological innovation with negative productivity growth. Social media has contributed to policy mistakes – such as fiscal austerity and protectionism – that have acted as shocks to aggregate demand over the past 15 years. Political polarization in a rapidly changing world is the root cause of these policy shocks, but social media likely facilitated and magnified them. While the risk of premature fiscal consolidation appears low today compared to the 2010-14 period, the pandemic and its aftermath could force the Biden administration or Congressional Democrats toward protectionist or otherwise populist actions over the coming year in the lead up to the 2022 mid-term elections. The midterms, for their part, are expected to bring gridlock back into US politics, which could remove fiscal options should the economy backslide. Frequent shocks during the last economic expansion reinforced the narrative of secular stagnation. In the coming years, any additional policy shocks following a return to economic normality will again be seen by both investors and the Fed as strong justification for low interest rates – despite the case for cyclically and structurally higher bond yields. In addition, investors with concentrated positions in social media companies should take seriously the long-term idiosyncratic risks facing these stocks. These risks stem from the public’s impression of the impact of social media on society, particularly if social media comes to be widely associated with political gridlock, the polarization of society, and failed economic policies. A Brief History Of Social Media The earliest social networking websites date back to the late 1990s, but the most influential social media platforms, such as Facebook and Twitter, originated in the mid-2000s. Prior to the advent of modern-day smartphones, user access to platforms such as Facebook and Twitter was limited to the websites of these platforms (desktop access). Following the release of the first iPhone in June 2007, however, mobile social media applications became available, allowing users much more convenient access to these platforms. Charts 1 and 2 highlight the impact that smartphones have had on the spread of social media, especially since the release of the iPhone 3G in 2008. In 2006, Facebook had roughly 12 million monthly active users; by 2009, this number had climbed to 360 million, growing to over 600 million the year after. Twitter, by contrast, grew somewhat later, reaching 100 million monthly active users in Q3 2011. Social media usage is more common among those who are younger, but Chart 3 highlights that usage has risen over time for all age groups. As of Q1 2021, 81% of Americans aged 30-49 reported using at least one social media website, compared to 73% of those aged 50-64 and 45% of those aged 65 and over. Chart 4 highlights that the usage of Twitter skews in particular toward the young, and that, by contrast, Facebook and YouTube are the social media platforms of choice among older Americans. Chart 1Facebook: Monthly Active Users
The Social Media Magnification Effect: Austerity, Populism, And Slower Growth
The Social Media Magnification Effect: Austerity, Populism, And Slower Growth
Chart 2Twitter: Monthly Active Users Worldwide
The Social Media Magnification Effect: Austerity, Populism, And Slower Growth
The Social Media Magnification Effect: Austerity, Populism, And Slower Growth
Chart 3A Sizeable Majority Of US Adults Regularly Use Social Media
A Sizeable Majority Of US Adults Regularly Use Social Media
A Sizeable Majority Of US Adults Regularly Use Social Media
Chart 4Older Americans Use Facebook Far More Than Twitter
The Social Media Magnification Effect: Austerity, Populism, And Slower Growth
The Social Media Magnification Effect: Austerity, Populism, And Slower Growth
As a final point documenting the development and significance of social media, Chart 5 highlights that more Americans now report consuming news often (roughly once per day) from a smartphone, computer, or tablet other than from television. Radio and print have been completely eclipsed as sources of frequent news. The major news publications themselves are often promoted through social media, but the rise of the Internet has weighed heavily on the journalism industry. Social media has, for better and for worse, enabled the rapid proliferation of alternative news, citizen journalism, rumor, conspiracy theories, and foreign disinformation. Chart 5Social Media Has Changed The Way People Consume News
The Social Media Magnification Effect: Austerity, Populism, And Slower Growth
The Social Media Magnification Effect: Austerity, Populism, And Slower Growth
The Link Between Social Media And Post-GFC Austerity Following the 2008-2009 global financial crisis (GFC), there have been at least five deeply impactful non-monetary shocks to the US and global economies that have contributed to the disconnection between growth and interest rates: A prolonged period of US household deleveraging from 2008-2014 The Euro Area sovereign debt crisis Fiscal austerity in the US, UK, and Euro Area from 2010 – 2012/2014 The US dollar / oil price shock of 2014 The rise of populist economic policies, such as the UK decision to leave the European Union, and the US-initiated trade war of 2018-2019. Among these shocks to growth, social media has had a clear impact on two of them. In the case of austerity in the aftermath of the Great Recession, a sharp rise in fiscal conservatism in 2009 and 2010, emblematized by the rise of the US Tea Party, profoundly affected the 2010 US midterm elections. It is not surprising that there was a fiscally conservative backlash following the crisis: the US budget deficit and debt-to-GDP ratio soared after the economy collapsed and the government enacted fiscal stimulus to bail out the banking system. And midterm elections in the US often lead to significant gains for the opposition party However, Tea Party supporters rapidly took up a new means of communicating to mobilize politically, and there is evidence that this contributed to their electoral success. Chart 6 illustrates that the number of tweets with the Tea Party hashtag rose significantly in 2010 in the lead-up to the election, which saw the Republican Party take control of the House of Representatives as well as the victory of several Tea Party-endorsed politicians. Table 1 highlights that Tea Party candidates, who rode the wave of fiscal conservatism, significantly outperformed Democrats and non-Tea Party Republicans in the use of Twitter during the 2010 campaign, underscoring that social media use was a factor aiding outreach to voters. Chart 6Tea Party Supporters Rapidly Adopted Social Media To Mobilize Politically
Tea Party Supporters Rapidly Adopted Social Media To Mobilize Politically
Tea Party Supporters Rapidly Adopted Social Media To Mobilize Politically
Table 1Tea Party Candidates Significantly Outperformed In Their Use Of Social Media
The Social Media Magnification Effect: Austerity, Populism, And Slower Growth
The Social Media Magnification Effect: Austerity, Populism, And Slower Growth
And while it is more difficult to analyze the use and impact of Facebook by Tea Party candidates and supporters owing to inherent differences in the structure of the Facebook platform, interviews with core organizers of both the Tea Party and Occupy Wall Street movements have noted that activists in these ideologically opposed groups viewed Facebook as the most important social networking service for their political activities.1 Under normal circumstances, we agree that fiscal policy should be symmetric, with reduced fiscal support during economic expansions following fiscal easing during recessions. But in the context of multi-year household deleveraging, the fiscal drag that occurred in following the 2010 midterm elections was clearly a policy mistake. This mistake occurred partially under full Democratic control of government and especially under a gridlocked Congress after 2010. Chart 7 highlights that the contribution to growth from government spending turned sharpy negative in 2010 and continued to subtract from growth for some time thereafter. In addition, panel of Chart 7 highlights that the US economic policy uncertainty index rose in 2010 after falling during the first year of the recovery, reaching a new high in 2011 during the Tea Party-inspired debt ceiling crisis. Chart 7The Fiscal Drag That Followed The 2010 Midterm Elections Was A Clear Policy Mistake
The Fiscal Drag That Followed The 2010 Midterm Elections Was A Clear Policy Mistake
The Fiscal Drag That Followed The 2010 Midterm Elections Was A Clear Policy Mistake
In addition to the negative impact of government spending on economic growth, this extreme uncertainty very likely damaged confidence in the economic recovery, contributing to the subpar pace of growth in the first half of the last economic expansion. Chart 8 highlights the weak evolution in real per capita GDP from 2009-2019 compared with previous economic cycles, which was caused by a prolonged household balance sheet recovery process that was made worse by policy mistakes. To be sure, the UK and the EU did not have a Tea Party, and yet political elites imposed fiscal austerity. It is also the case that President Obama was the first president to embrace social media as a political and public relations tool. So it cannot be said that either social media or the Republican Party are uniquely to blame for the policy mistakes of that era. But US fiscal policy would have been considerably looser in the 2010s if not for the Tea Party backlash, which was partly enabled by social media. Too tight of fiscal policy in turn fed populism and produced additional policy mistakes down the road. Chart 8Policy Mistakes Significantly Contributed To Last Cycle's Subpar Growth Profile
Policy Mistakes Significantly Contributed To Last Cycle's Subpar Growth Profile
Policy Mistakes Significantly Contributed To Last Cycle's Subpar Growth Profile
From Fiscal Drag To Populism While social media is clearly not the root cause of the recent rise of populist policies, it has had a hand in bringing them about – in both a direct and indirect manner. The indirect link between social media use and the rise in populist policies has mainly occurred through the highly successful use of social media by international terrorist organizations (chiefly ISIL) and its impact on sentiment toward immigration in several developed market economies. Chart 9 highlights that public concerns about immigration and race in the UK began to rise sharply in 2012, in lockstep with both the rise in UK immigrants from EU accession countries and a series of events: the Syrian refugee crisis, the establishment and reign of the Islamic State, and three major terrorist attacks in European countries for which ISIL claimed responsibility. Given that the main argument for “Brexit” was for the UK to regain control over its immigration policies, these events almost certainly increased UK public support for withdrawing from the EU. In other words, it is not clear that Brexit would have occurred (at least at that moment in time) without these events given the narrow margin of victory for the “leave” campaign. The absence of social media would not have prevented the rise of ISIL, as that occurred in response to the US’s precipitous withdrawal from Iraq. The inevitable rise of ISIL would still have generated a backlash against immigration. Moreover, fiscal austerity in the UK and EU also fed other grievances that supported the Brexit movement. But social media accelerated and amplified the entire process. Chart 10 presents fairly strong evidence that Brexit weakened UK economic performance relative to the Euro Area prior to the pandemic, with the exception of the 2018-2019 period. In this period Euro Area manufacturing underperformed during the Trump administration’s trade war as a result of its comparatively higher exposure to automobile production and its stronger ties to China. Panel 2 highlights that GBP-EUR fell sharply in advance of the referendum, and remains comparatively weak today. Chart 9Terrorism And Immigration Likely Contributed To Brexit
Terrorism And Immigration Likely Contributed To Brexit
Terrorism And Immigration Likely Contributed To Brexit
Chart 10Brexit Weakened UK Economic Performance Prior To The Pandemic
Brexit Weakened UK Economic Performance Prior To The Pandemic
Brexit Weakened UK Economic Performance Prior To The Pandemic
Turning to the US, Donald Trump’s election as US President in 2016 was aided by both the direct and indirect effects of social media. In terms of indirect effects, Trump benefited from similar concerns over immigration and terrorism that caused the UK to leave the EU: Chart 11 highlights that terrorism and foreign policy were second and third on the list of concerns of registered voters in mid-2016, and Chart 12 highlights that voters regarded Trump as the better candidate to defend the US against future terrorist attacks. Chart 11Terrorism Ranked Highly As An Issue In The 2016 US Election
The Social Media Magnification Effect: Austerity, Populism, And Slower Growth
The Social Media Magnification Effect: Austerity, Populism, And Slower Growth
Chart 12Voters Regarded Trump As Better Equipped To Defend Against Terrorism
The Social Media Magnification Effect: Austerity, Populism, And Slower Growth
The Social Media Magnification Effect: Austerity, Populism, And Slower Growth
Trump’s election; and the enactment of populist policies under his administration, were directly aided by Trump’s active use of social media (mainly Twitter) to boost his candidacy. Chart 13 highlights that there were an average of 15-20 tweets per day from Trump’s Twitter account from 2013-2015, and 80% of those tweets occurred before he announced his candidacy for president in June 2015. This strongly underscores that Trump mainly used Twitter to lay the groundwork for his candidacy as an unconventional political outsider rather than as a campaign tool itself, which distinguishes his use of social media from that of other politicians. In other words, new technology disrupted the “good old boys’ club” of traditional media and elite politics. Chart 13Trump Used Twitter To Lay The Groundwork For His Candidacy
Trump Used Twitter To Lay The Groundwork For His Candidacy
Trump Used Twitter To Lay The Groundwork For His Candidacy
Chart 14The Trump Tax Cuts A Huge Rise In Corporate Earnings
The Trump Tax Cuts A Huge Rise In Corporate Earnings
The Trump Tax Cuts A Huge Rise In Corporate Earnings
Some policies of the Trump administration were positive for financial markets, and it is fair to say that Trump fired up animal spirits to some extent: Chart 14 highlights that the Tax Cuts and Jobs Act caused a significant rise in stock market earnings per share. But the Trump tax cuts were a conventional policy pushed mostly by the Congressional leadership of the Republican Party, and they did not meaningfully boost economic growth. Chart 15 highlights that, while the US ISM manufacturing index rose sharply in the first year of Trump’s administration, an uptrend was already underway prior to the election as a result of a significant improvement in Chinese credit growth and a recovery in oil prices after the devastating collapse that took place in 2014-2015. Chart 15But The Tax Cuts Did Not Do Much To Boost Growth
But The Tax Cuts Did Not Do Much To Boost Growth
But The Tax Cuts Did Not Do Much To Boost Growth
Similarly, Chart 15 highlights that the Trump trade war does not bear the full responsibility of the significant slowdown in growth in 2019, as China’s credit impulse decelerated significantly between the passage of the Tax Cuts and Jobs Act and the onset of the trade war because Chinese policymakers turned to address domestic concerns. But Chart 16 highlights that the aggressive imposition of tariffs, especially between the US and China, caused an explosion in trade uncertainty even when measured on an equally-weighted basis (i.e., when overweighting trade uncertainty, in countries other than the US and China), which undoubtedly weighed on the global economy and contributed to a very significant slowdown in US jobs growth in 2019 (panel 2). Moreover, Chinese policymakers responded to the trade onslaught by deleveraging, which weighed on the global economy; and consolidating their grip on power at home. In essence, Trump was a political outsider who utilized social media to bypass the traditional media and make his case to the American people. Other factors contributed to his surprising victory, not the least of which was the austerity-induced, slow-growth recovery in key swing states. While US policy was already shifting to be more confrontational toward China, the Trump administration was more belligerent in its use of tariffs than previous administrations. The trade war thus qualifies as another policy shock that was facilitated by the existence of social media. Chart 16The Trade War Caused An Explosion In Global Trade Uncertainty
The Trade War Caused An Explosion In Global Trade Uncertainty
The Trade War Caused An Explosion In Global Trade Uncertainty
Viewing Social Media As A Negative Productivity-Innovation A rise in fiscal conservatism leading to misguided austerity, the UK’s decision to leave the European Union, and the Trump administration’s trade war have represented significant non-monetary shocks to both the US and global economies over the past 12 years. These shocks strongly contributed to the subpar growth profile of the last economic expansion, as demonstrated above. Given the above, it is reasonable for investors to view social media as a technological innovation with negative productivity growth, given that it has facilitated policy mistakes during the last economic expansion. Chart 17 underscores this point, by highlighting that multi-factor productivity growth has been extremely weak in the post-GFC environment. While productivity is usually driven by supply-side factors over the longer term, it has a cyclical component to it – and in the case of the last economic expansion, the cyclical component was long lasting in nature. Any forces negatively impacting economic growth that do not change the factors of production necessarily reduce measured productivity; it is for this reason that measured productivity declines during recessions; and policy mistakes negatively impact productivity growth. Chart 17Policy Mistakes, Partially Enabled By Social Media, Reduced Productivity During The Last Expansion
Policy Mistakes, Partially Enabled By Social Media, Reduced Productivity During The Last Expansion
Policy Mistakes, Partially Enabled By Social Media, Reduced Productivity During The Last Expansion
Chart 18State & Local Government Finances Are In Much Better Shape Today
State & Local Government Finances Are In Much Better Shape Today
State & Local Government Finances Are In Much Better Shape Today
The Risk Of Aggressive Austerity Seems Low Today… Fiscal austerity in the early phase of the last economic cycle was the first social media-linked shock that we identified, but the risk of aggressive austerity appears low today. Much of the fiscal drag that occurred in the aftermath of the global financial crisis happened because of insufficient financial support to state and local governments – and the subsequent refusal by Congress to authorize more aid. But Chart 18 highlights that state and local government finances have already meaningfully recovered, on the back of bipartisan stimulus in 2020, while the American Rescue Plan provides significant additional funding. While it is true that US fiscal policy is set to detract from growth over the coming 6-12 months, this will merely reflect the unwinding of fiscal aid that had aimed to support household income temporarily lost, as a result of a drastic reduction in services spending. As we noted in last month’s report,2 goods spending will likely slow as fiscal thrust turns to fiscal drag, but services spending will improve meaningfully – aided not just by a post-pandemic normalization in economic activity, but also by the deployment of some of the sizable excess savings that US households have accumulated over the past year. Fiscal drag will also occur outside of the US next year. For example, the IMF is forecasting a two percentage point increase in the Euro Area’s cyclically-adjusted primary budget balance, which would represent the largest annual increase over the past two decades. But here too the reduction in government spending will reflect the end of pandemic-related income support, and is likely to occur alongside a positive private-sector services impulse. During the worst of the Euro Area sovereign debt crisis, the impact of austerity was especially acute because it was persistent, and it occurred while the output gap was still large in several Euro Area economies. Chart 19 highlights that Euro Area fiscal consolidation from 2010-2013 was negatively correlated with economic activity during that period, and Chart 20 highlights that, with the potential exception of Spain, this austerity does not appear to have led to subsequently stronger rates of growth. Chart 19Euro Area Austerity Lowered Growth During The Consolidation Phase…
The Social Media Magnification Effect: Austerity, Populism, And Slower Growth
The Social Media Magnification Effect: Austerity, Populism, And Slower Growth
Chart 20…And Did Not Seem To Subsequently Raise Growth
The Social Media Magnification Effect: Austerity, Populism, And Slower Growth
The Social Media Magnification Effect: Austerity, Populism, And Slower Growth
This experiment in austerity led the IMF to conclude that fiscal multipliers are indeed large during periods of substantial economic slack, constrained monetary policy, and synchronized fiscal adjustment across numerous economies.3 Similarly, attitudes about austerity have shifted among policymakers globally in the wake of the populist backlash. Given this, despite the significant increase in government debt levels that has occurred as a result of the pandemic, we strongly doubt that advanced economies will attempt to engage in additional austerity prematurely, i.e., before unemployment rates have returned close-to steady-state levels. …But The Risk Of Protectionism And Other Populist Measures Looms Large The role that social media has played at magnifying populist policies should be concerning for investors, especially given that there has been a rising trend towards populism over the past 20 years. In a recent paper, Funke, Schularick, and Trebesch have compiled a cross-country database on populism dating back to 1900, defining populist leaders as those who employ a political strategy focusing on the conflict between “the people” and “the elites.” Chart 21 highlights that the number of populist governments worldwide has risen significantly since the 1980s and 1990s, and Chart 22 highlights that the economic performance of countries with populist leaders is clearly negative. Chart 21Populism Has Been On The Rise For The Past 30 Years
The Social Media Magnification Effect: Austerity, Populism, And Slower Growth
The Social Media Magnification Effect: Austerity, Populism, And Slower Growth
The authors found that countries’ real GDP growth underperformed by approximately one percentage point per year after a populist leader comes to power, relative to both the country’s own long-term growth rate and relative to the prevailing level of global growth. To control for the potential causal link between economic growth and the rise of populist leaders, Chart 23 highlights the results of a synthetic control method employed by the authors that generates a similar conclusion to the unconditional averages shown in Chart 22: populist economic policies are significantly negative for real economic growth. Chart 22Populist Leaders Are Clearly Growth Killers Even After…
The Social Media Magnification Effect: Austerity, Populism, And Slower Growth
The Social Media Magnification Effect: Austerity, Populism, And Slower Growth
Chart 23… Controlling For The Odds That Weak Growth Leads To Populism
The Social Media Magnification Effect: Austerity, Populism, And Slower Growth
The Social Media Magnification Effect: Austerity, Populism, And Slower Growth
This is especially concerning given that wealth and income inequality, perhaps the single most important structural cause of rising populism and political polarization, is nearly as elevated as it was in the 1920s and 1930s (Chart 24). This trend, at least in the US, has been exacerbated by a decline in public trust of mainstream media among independents and Republicans that began in the early 2000s and helped to fuel the public’s adoption of alternative news and social media. The decline in trust clearly accelerated as a result of erroneous reporting on what turned out to be nonexistent weapons of mass destruction in Iraq and other controversies of the Bush administration. Chart 21 showed that the rise in populism has also yet to abate, suggesting that social media has the potential to continue to amplify policy mistakes for the foreseeable future. Chart 24Inequality: The Most Important Structural Cause Of Populism And Polarization
Inequality: The Most Important Structural Cause Of Populism And Polarization
Inequality: The Most Important Structural Cause Of Populism And Polarization
It is not yet clear what economic mistakes will occur under the Biden administration, but investors should not rule out the possibility of policies that are harmful for growth. The likely passage of a bipartisan infrastructure bill or a partisan reconciliation bill in the second half of this year will most likely be the final word on fiscal policy until at least 2025,4 underscoring that active fiscal austerity is not likely a major risk to investors. Spending levels will probably freeze after 2022: Republicans will not be able to slash spending, and Democrats will not be able to hike spending or taxes, if Republicans win at least one chamber of Congress in the midterms (as is likely). Biden has preserved the most significant of Trump’s protectionist policies by maintaining US import tariffs against China, and the lesson from the Tea Party’s surge following the global financial crisis is that major political shifts, magnified by social media, can manifest themselves as policy with the potential to impact economic activity within a two-year window. Attitudes toward China have shifted negatively around the world because of deindustrialization and now the pandemic.5 White collar workers in DM countries have clearly fared better during lockdowns than those of lower-income households. This has created extremely fertile ground for a revival in populist sentiment, which could force the Biden administration or Congressional Democrats toward protectionist or otherwise populist actions over the coming year, in the lead up to the 2022 mid-term elections. Investment Conclusions In this report, we have documented the historical link between social media, populism, and policy mistakes during the last economic expansion. It is clear that neither social media nor even populism is solely responsible for all mistakes – the UK’s and EU’s ill-judged foray into austerity was driven by elites. Furthermore, we have not addressed in this report the impact of populism on actions of emerging markets, such as China and Russia, whose own behavior has dealt disinflationary blows to the global economy. Nevertheless, populism is a potent force that clearly has the power to harness new technology and deliver shocks to the global economy and financial markets. The risks of additional mistakes from populism are still present, and that is even before considering other risks to society from social media: a reduction in mental health among young social media users, and the role that social media has played in spreading misinformation – contributing to the vaccine hesitancy in some DM countries that we discussed in Section 1 of our report. Two investment conclusions emerge from our analysis. First, we noted in our April report that there is a chance that investor expectations for the natural rate of interest (“R-star”) will rise once the economy normalizes post-pandemic, but that this will likely not occur as long as investors continue to believe in the narrative of secular stagnation. Despite the fact that the past decade’s shocks occurred against the backdrop of persistent household deleveraging (which has ended in the US), these shocks reinforced that narrative, and any additional policy shocks following a return to economic normality will again be seen by both investors and the Fed as strong justification for low interest rates. Thus, while the rapid closure of output gaps in advanced economies over the coming year argues for both cyclically and structurally higher bond yields, a revival in protectionist sentiment is a risk to this view that we will be closely monitoring over the coming 12-24 months. Second, for tech investors, the bipartisan shift in public sentiment to become more critical of social media companies is gradually becoming a real risk, potentially affecting user growth. Based solely on Facebook, Twitter, Pinterest, and Snapchat, social media companies do not account for a very significant share of the overall equity market (Chart 25), suggesting that the impact of a negative shift in sentiment toward social media companies would not be an overly significant event for equity investors in general. Chart 25 highlights that the share of social media companies as a percent of the broad tech sector rises if Google is included; YouTube accounts for less than 15% of Google’s total advertising revenue, however, suggesting modest additional exposure beyond the solid line in Chart 25. Chart 25The Underperformance Of Social Media Would Not Excessively Weigh On The Broad Market
The Underperformance Of Social Media Would Not Excessively Weigh On The Broad Market
The Underperformance Of Social Media Would Not Excessively Weigh On The Broad Market
Still, investors with concentrated positions in social media stocks should be aware of the potential idiosyncratic risks facing social media companies as a result of the public’s impression of the impact of social media on society. If social media companies come to be widely associated with political gridlock, the polarization of society, and failed economic policies (as already appears to be the case), then the fundamental performance of these stocks is likely to be quite poor regardless of whether or not tech companies ultimately enjoy a relatively friendly regulatory environment under the Biden administration. Jonathan LaBerge, CFA Vice President The Bank Credit Analyst Footnotes 1 Grassroots Organizing in the Digital Age: Considering Values and Technology in Tea Party and Occupy Wall Street by Agarwal, Barthel, Rost, Borning, Bennett, and Johnson, Information, Communication & Society, 2014. 2 Please see The Bank Credit Analyst “July 2021,” dated June 24, 2021, available at bca.bcaresearch.com 3 “Are We Underestimating Short-Term Fiscal Multipliers?”,IMF World Economic Outlook, October 2012 4 Please see US Political Strategy Outlook "Third Quarter Outlook 2021: Game Time," dated June 30, 2021, available at usps.bcaresearch.com 5 “Unfavorable Views of China Reach Historic Highs in Many Countries,” PEW Research Center, October 2020.
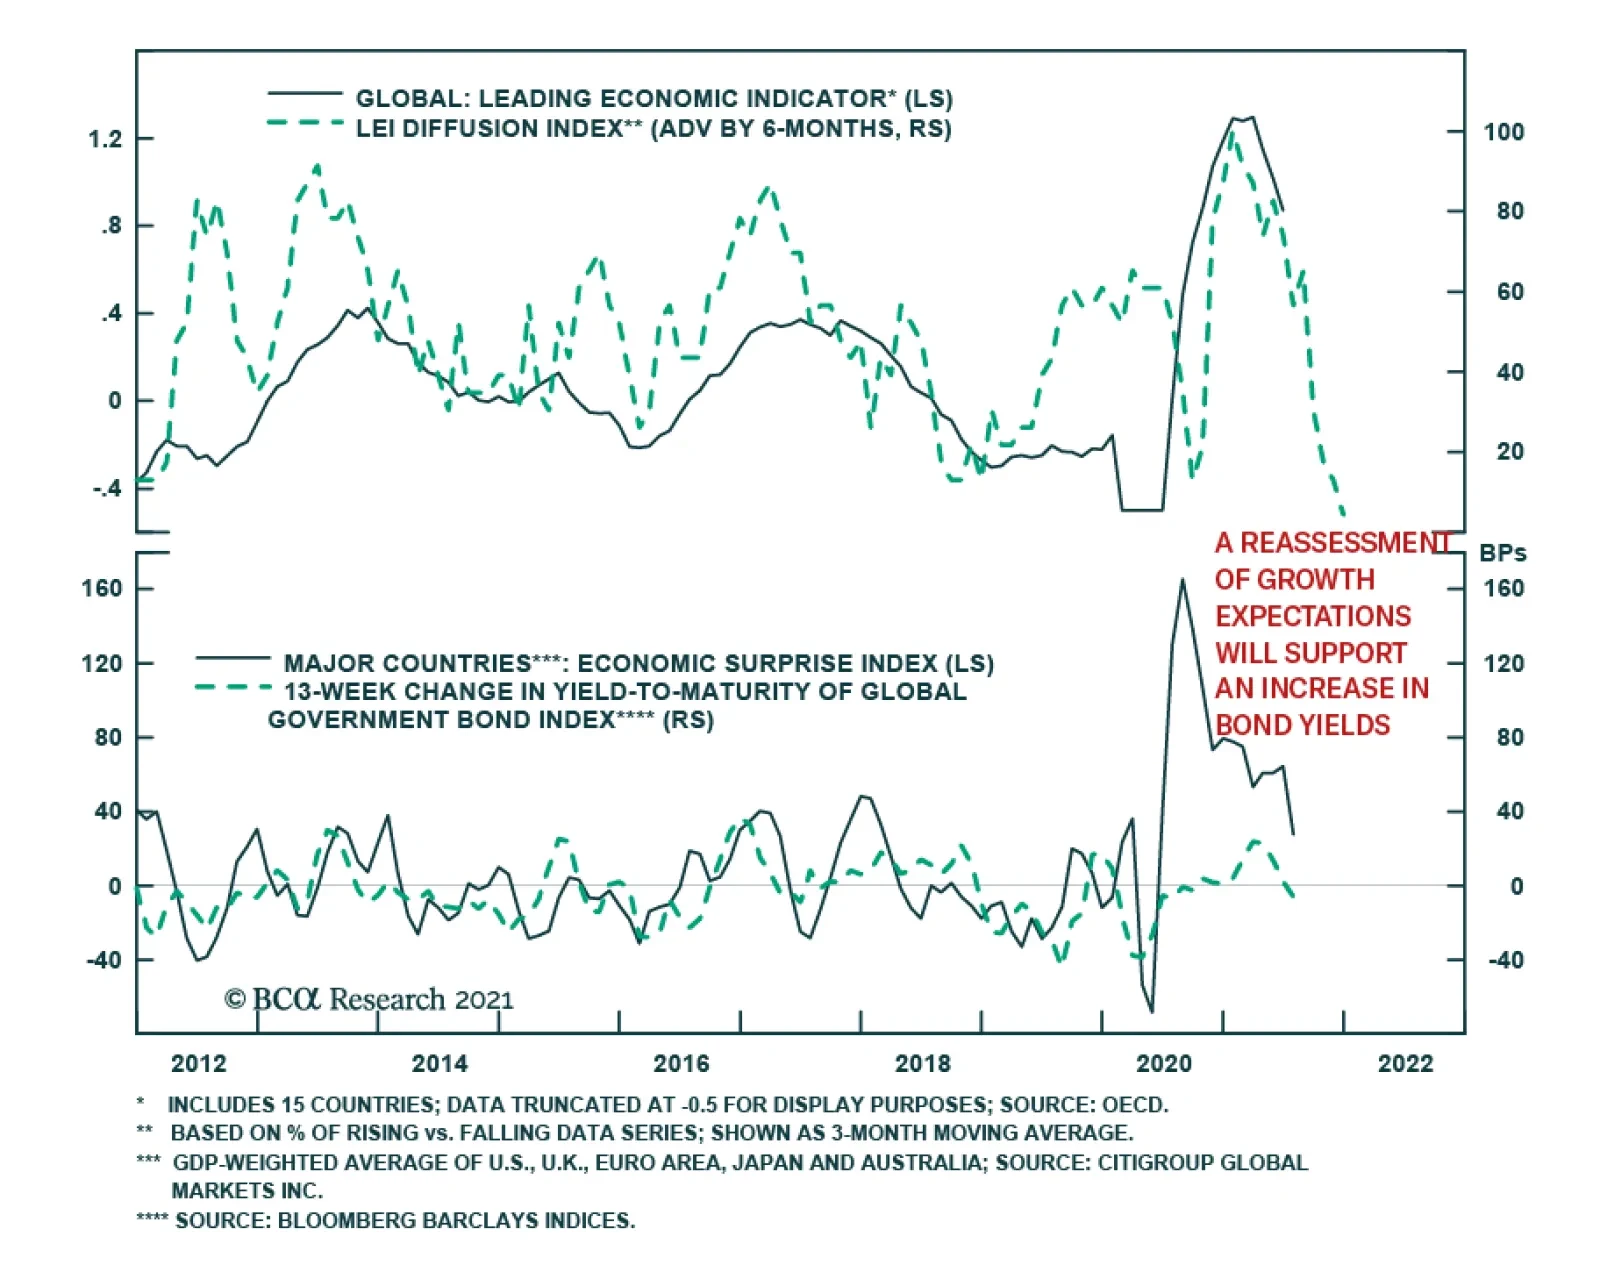
The global leading economic indicator has rolled over, suggesting that growth momentum is set to slow. Moreover, the global LEI diffusion index, which typically leads the LEI by six months, has declined sharply. This indicates that the global LEI’s…
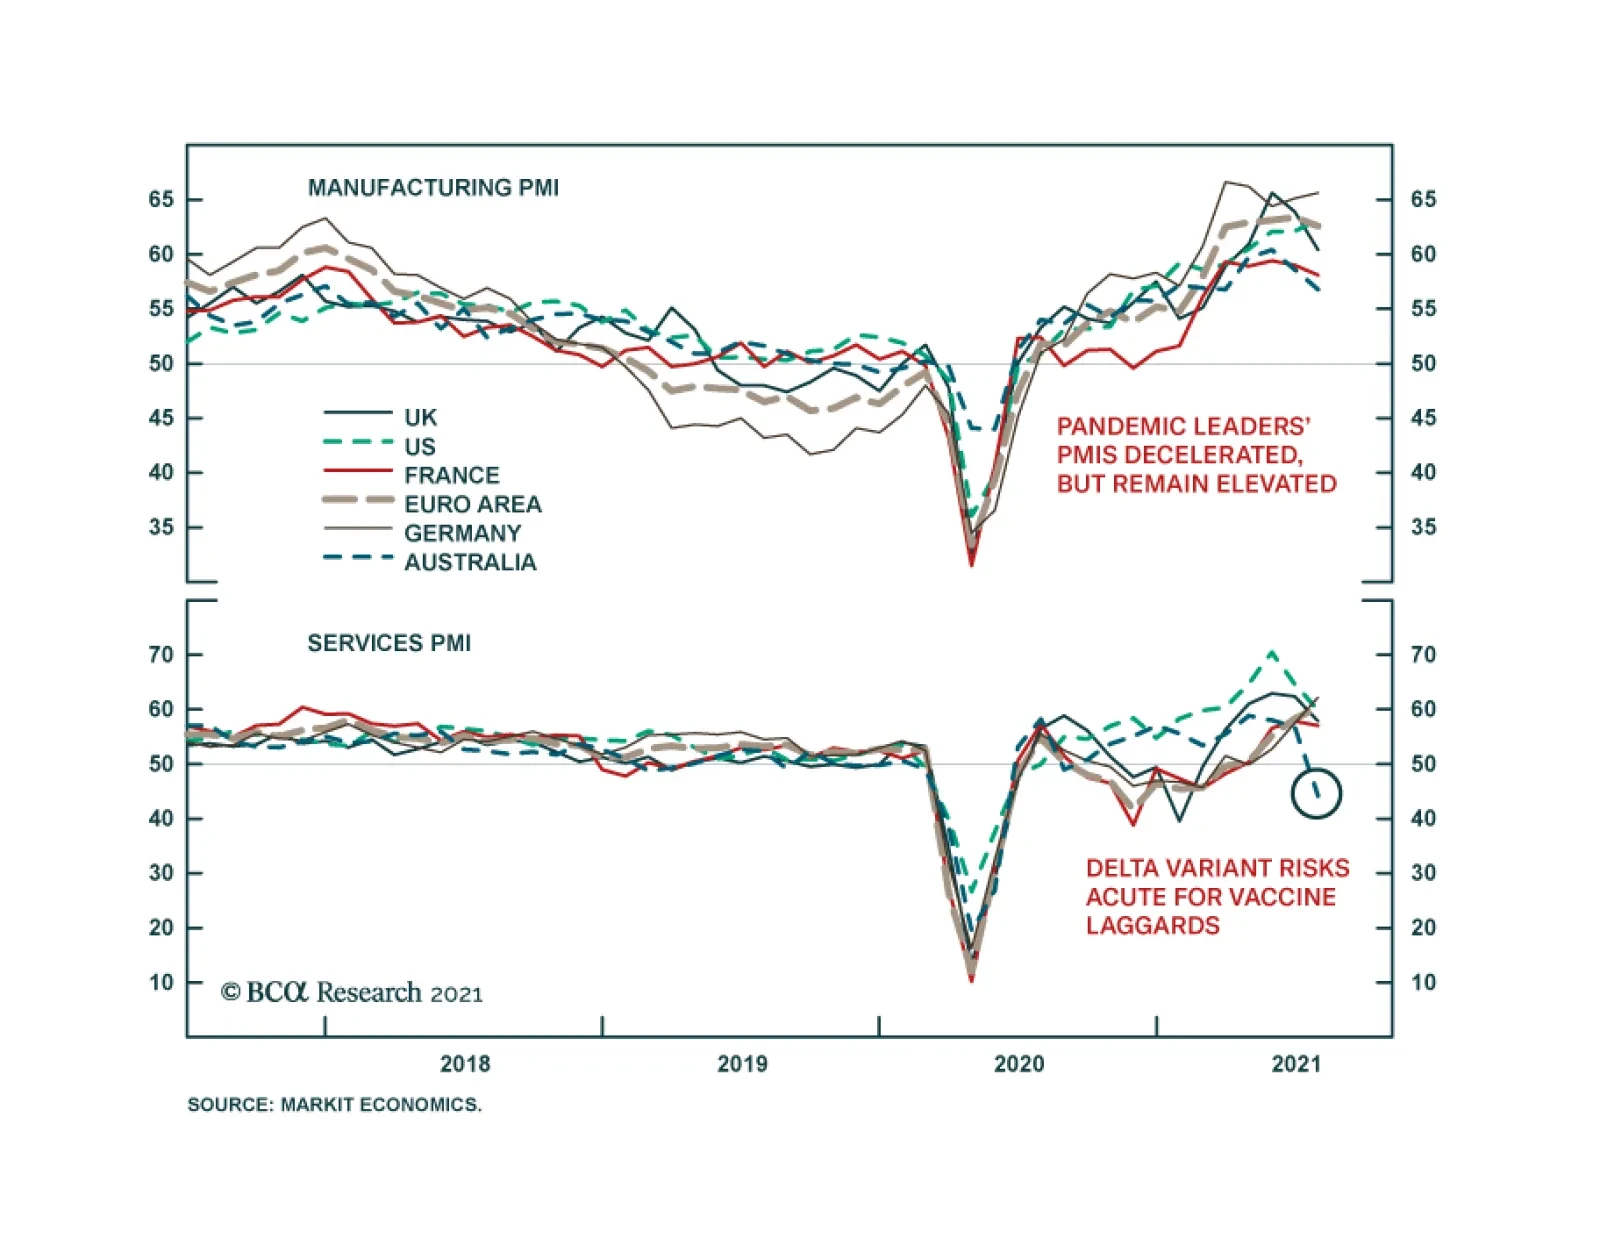
Flash PMIs were mixed in July. The Eurozone composite measure ticked up 1.1 points to a 21-year high of 60.6, above expectations of 60.0. However, the UK and US composite indices declined slightly, but remained relatively elevated. Meanwhile, the…
Dear Client, I will be on vacation next week. In lieu of our regular report, we will be sending you a Special Report written by my colleague Arthur Budaghyan, BCA Research’s Chief Emerging Markets Strategist. Arthur’s report will discuss the long-term outlook for industrial companies. He argues that the US is entering an industrial boom prompted by infrastructure stimulus and onshoring. This will benefit US industrial equities, or ones selling into the US on a multi-year horizon. I trust you will find it insightful. Best regards, Peter Berezin, Chief Global Strategist Highlights Investors keep asking whether the recent increase in US inflation is transitory. However, this is the wrong question to ask. Annualized core CPI inflation reached 10.6% in the second quarter. There is little doubt that inflation will fall from such elevated levels. The key question that investors should be asking is whether inflation will decline more or less than what the market is discounting. The widely watched 5-year/5-year forward TIPS inflation breakeven rate has sunk to 2.11%, below the Fed’s “comfort zone” of 2.3%-to-2.5%. Thus, the market already expects a substantial decline in inflation. Our sense is that US inflation will come down fast enough to allow the Fed to maintain a highly dovish policy stance, but not as fast as market expectations currently imply. As inflation surprises on the upside, long-term bond yields will rise. This should revive bank shares and other reflationary plays. The combination of a weaker US dollar, faster sequential Chinese growth, increased vaccine supplies, and favorable valuations should all help EM stocks later this year. Go long the Vanguard FTSE Emerging Markets ETF (VWO) versus the Vanguard S&P 500 ETF (VOO). The Right Question About Inflation Chart 1After A Spike In Q2, US Inflation Will Decelerate
After A Spike In Q2, US Inflation Will Decelerate
After A Spike In Q2, US Inflation Will Decelerate
Investors remain focused on whether the recent bout of US inflation is transitory. However, this is not the correct question to be asking at the present juncture. The US core CPI rose by 10.6% at an annualized pace in Q2 relative to the first quarter (Chart 1). It is almost inevitable that inflation will come down from such high levels. The key question investors should be asking is whether inflation will decline more or less than what is already baked into market expectations. As Chart 2 shows, investors expect US inflation to come down rapidly over the next two years. The 5-year/5-year forward TIPS breakeven inflation rate – a good proxy for where investors expect inflation to be over the long haul – has sunk to 2.11% (Chart 3). This is below the Fed’s comfort zone of 2.3%-to-2.5%.1 Globally, long-term inflation expectations remain subdued (Chart 4). Chart 2Inflation Is Expected To Moderate Over The Coming Years
Investors Are Asking The Wrong Question About Inflation
Investors Are Asking The Wrong Question About Inflation
Chart 3Inflation Expectations Have Fallen Back Below The Fed's Target Zone
Inflation Expectations Have Fallen Back Below The Fed's Target Zone
Inflation Expectations Have Fallen Back Below The Fed's Target Zone
Chart 4Long-Term Inflation Expectations Remain Subdued
Investors Are Asking The Wrong Question About Inflation
Investors Are Asking The Wrong Question About Inflation
Inflation Will Fall, But… Our sense is that US inflation will come down fast enough to allow the Fed to maintain a highly dovish policy stance, but not as fast as market expectations currently imply. Broad-based inflationary pressures would make the Fed nervous. However, that is not what we are seeing. Wages have accelerated markedly in only a few relatively low-skilled sectors such as retail trade and leisure and hospitality (Chart 5). For the economy as a whole, wage growth is broadly stable (Chart 6). The expiration of extended unemployment benefits, the reopening of schools, and increased immigration should also boost labor supply in the fall. Chart 5Faster Wage Growth Has Been Confined To A Few Low-Wage Sectors
Investors Are Asking The Wrong Question About Inflation
Investors Are Asking The Wrong Question About Inflation
Chart 6No Sign Of A Wage-Price Spiral... For Now
No Sign Of A Wage-Price Spiral... For Now
No Sign Of A Wage-Price Spiral... For Now
On the price front, more than two-thirds of the increase in the core CPI in June stemmed from pandemic-afflicted sectors (Chart 7). The price of the median item within the CPI index rose by just 2.2% year-over-year in June, somewhat below the pre-pandemic pace of inflation (Chart 8). Chart 7Most Of The Recent Increase In Inflation Is Pandemic-Related
Investors Are Asking The Wrong Question About Inflation
Investors Are Asking The Wrong Question About Inflation
Chart 8The Median Price In The CPI Basket Is Up Only 2.2%
The Median Price In The CPI Basket Is Up Only 2.2%
The Median Price In The CPI Basket Is Up Only 2.2%
… Not As Fast As The Market Expects While inflation will fall as pandemic effects recede, investors are overestimating how fast this will happen. US growth has undoubtedly peaked, but at a very high level. Economists surveyed by Bloomberg estimate that US GDP rose by 9.0% in Q2. Growth is expected to slow to 7.1% in Q3 and 5.1% in Q4, while averaging 4.2% in 2022 (Table 1). By any standard, these are very strong, above-trend growth rates. Table 1Growth Is Peaking, But At A Very High Level
Investors Are Asking The Wrong Question About Inflation
Investors Are Asking The Wrong Question About Inflation
Chart 9Nearly 90% Of US Seniors Have Had At Least One Shot
Investors Are Asking The Wrong Question About Inflation
Investors Are Asking The Wrong Question About Inflation
The current Delta-variant wave is unlikely to slow US growth by very much. Although vaccination rates among younger people are at middling levels, they are quite high for the elderly who are most at risk of serious illness. Close to 89% of Americans above the age of 65 have received at least one shot, and nearly 80% are fully vaccinated (Chart 9). The 65+ age group accounts for four-fifths of all Covid deaths in the United States. Widespread vaccination coverage for older Americans will take pressure off the hospital system, allowing the economy to remain open. Fiscal Support In The US And Abroad As we noted last week, Senate Democrats are likely to use the reconciliation process to both raise the debt ceiling and pass President Biden’s $3.5 trillion American Jobs and Families Plan. They are also likely to move forward on Biden’s proposed $600 billion in infrastructure spending, with or without Republican support. Meanwhile, much of the fiscal stimulus that has already been undertaken has yet to make its way through to the economy. US households are sitting on about $2.5 trillion in excess savings, about half of which stems from increased government transfers (Chart 10). Chart 10A Lot Of Excess Savings
Investors Are Asking The Wrong Question About Inflation
Investors Are Asking The Wrong Question About Inflation
Chart 11Inventories Are At Low Levels
Inventories Are At Low Levels
Inventories Are At Low Levels
Satiating that demand has not been easy for many companies. Retail sector inventories are at record lows (Chart 11). The number of homes that have been authorized for construction but where building has yet to begin has increased by 62% since the start of the pandemic (Chart 12). By limiting production, supply-chain bottlenecks will push some spending towards the future. This will keep growth from decelerating more than it otherwise would. Outside the US, fiscal policy will remain supportive. All 27 EU countries ratified the €750 billion Next Generation fund on May 28th. The allocations from the fund for southern European countries are relatively large (Chart 13). Most of the money will be spent on public investment projects with high fiscal multipliers. Chart 12Growing Backlog Of New Home Construction Projects
Growing Backlog Of New Home Construction Projects
Growing Backlog Of New Home Construction Projects
Chart 13EU Fiscal Policy: Allocations To Southern European Countries Are Relatively Large
EU Fiscal Policy: Allocations To Southern European Countries Are Relatively Large
EU Fiscal Policy: Allocations To Southern European Countries Are Relatively Large
Chart 14Economic Growth In China Was Slow In H1
Economic Growth In China Was Slow In H1
Economic Growth In China Was Slow In H1
The Japanese government is contemplating sending stimulus checks to low-income citizens in advance of the general election due by October 22nd. It is an understandable move. Covid cases are rising again. As a result, the authorities have declared a state of emergency in Tokyo and barred spectators from attending the Olympic games in and around the city. Fortunately, the Japanese vaccination campaign has accelerated after a slow start. A third of the population has now received at least one shot. The government intends to vaccinate all eligible people by November. Looking at quarter-over-quarter growth rates, Chinese growth averaged just 3.8% on an annualized basis in the first half of 2021 (Chart 14). Growth should pick up in the second half of the year thanks in part to increased fiscal spending. As of June, local governments had used only 28% of their annual bond issuance quotas, compared with 61% over the same period last year and 65% in 2019. Most of the proceeds from local government bond sales will likely flow into infrastructure projects. Resumption Of The Dollar Bear Market Will Keep Inflation From Falling Too Far As a countercyclical currency, the US dollar usually weakens when global growth is strong (Chart 15). Short-term real interest rate differentials have moved sharply against the dollar, a trend that is unlikely to change anytime soon given the Fed’s dovish bias (Chart 16). While inflation in the US is not as sensitive to currency fluctuations as in most other countries, a weaker dollar will still lift tradeable goods prices (Chart 17). Chart 15The Dollar Is A Countercyclical Currency
The Dollar Is A Countercyclical Currency
The Dollar Is A Countercyclical Currency
Chart 16Rate Differentials Are A Headwind For The Dollar
Rate Differentials Are A Headwind For The Dollar
Rate Differentials Are A Headwind For The Dollar
Chart 17The Dollar And Inflation
Investors Are Asking The Wrong Question About Inflation
Investors Are Asking The Wrong Question About Inflation
Structural Forces Turning More Inflationary Not only are cyclical forces likely to turn out to be less disinflationary than investors believe, but many of the structural factors that have suppressed inflation over the past 40 years are reversing direction: Chart 18Globalization Plateaued More Than A Decade Ago
Globalization Plateaued More Than A Decade Ago
Globalization Plateaued More Than A Decade Ago
Globalization is in retreat: The ratio of global trade-to-manufacturing output has been flat for over a decade (Chart 18). Looking out, the ratio could even decline as more companies shift production back home in order to gain greater control over supply chains of essential goods. Baby boomers are leaving the labor force en masse. As a group, baby boomers hold more than half of US household wealth (Chart 19). They will continue to run down their wealth once they retire. However, since they will no longer be working, they will no longer contribute to national output. Continued spending against a backdrop of diminished production could be inflationary. Despite a pandemic-induced bounce, underlying productivity growth remains anemic (Chart 20). Slow productivity growth could cause aggregate supply to fall short of aggregate demand. Social stability is in peril, as exemplified by the recent dramatic increase in the US homicide rate. In the past, social instability and higher inflation have gone hand in hand (Chart 21). Perhaps most importantly, policymakers are deliberately aiming to run the economy hot. A tight labor market will eventually lift wage growth to a greater degree than what we have seen so far (Chart 22). Not only could higher wage growth push up inflation through the usual “cost-push” channel, but by boosting labor’s share of income, a tight labor market could spur aggregate demand. Chart 19Baby Boomers Have Accumulated A Lot Of Wealth
Investors Are Asking The Wrong Question About Inflation
Investors Are Asking The Wrong Question About Inflation
Chart 20Trend Productivity Growth Has Been Disappointing
Trend Productivity Growth Has Been Disappointing
Trend Productivity Growth Has Been Disappointing
Chart 21Historically, Social Unrest And Higher Inflation Move In Lock-Step
Historically, Social Unrest And Higher Inflation Move In Lock-Step
Historically, Social Unrest And Higher Inflation Move In Lock-Step
Chart 22A Tight Labor Market Eventually Bolsters Wages
A Tight Labor Market Eventually Bolsters Wages
A Tight Labor Market Eventually Bolsters Wages
Investment Implications Chart 23Positive Earnings Revisions Are At High Levels
Investors Are Asking The Wrong Question About Inflation
Investors Are Asking The Wrong Question About Inflation
The path to higher rates is lined with lower rates. The longer central banks keep interest rates below their neutral level, the more economies will overheat, and the more rates will eventually need to rise to bring inflation back down. For now, we are still in the warm-up phase to higher inflation. With long-term inflation expectations below target, central banks will be able to maintain accommodative monetary policies. This is good news for stocks, at least in the short-to-medium term. The recent wobble in equity markets has occurred despite a strong second quarter earnings season. According to the latest available data from I/B/E/S, 90% of S&P 500 companies have reported earnings above analyst expectations. Earnings have surprised on the upside by an average of 19.2%, compared to a historical average of 3.9%. Positive earnings revisions are at record high levels (Chart 23). Full year 2021 S&P 500 EPS estimates have risen 16% since the start of the year. Analysts have also raised their estimates for 2022 and 2023 (Chart 24). We continue to recommend that asset allocators favor stocks over bonds over a 12-month horizon. Chart 24Analysts Have Been Revising Up Earnings Estimates This Year
Analysts Have Been Revising Up Earnings Estimates This Year
Analysts Have Been Revising Up Earnings Estimates This Year
Chart 25The Gains Of Recent Winners Have Not Been Fully Mirrored In Relative Earnings Growth
The Gains Of Recent Winners Have Not Been Fully Mirrored In Relative Earnings Growth
The Gains Of Recent Winners Have Not Been Fully Mirrored In Relative Earnings Growth
Chart 26Bank Shares Thrive In A Rising Yield Environment
Bank Shares Thrive In A Rising Yield Environment
Bank Shares Thrive In A Rising Yield Environment
Tech stocks have outperformed the broader market over the past seven weeks. However, unlike during the pandemic, 12-month forward EPS estimates for tech have not risen in relation to other sectors (Chart 25). As long-term bond yields move back up, tech shares will underperform. In contrast, banks will benefit from higher yields (Chart 26). Along the same lines, US stocks have outpaced other stock markets by more than one would have expected based on relative EPS trends. Notably, EM earnings have moved sideways versus the US since mid-2019. Yet, US stocks have outperformed EM by 17% over this period. Today, the forward P/E ratio for EM stands at 13.8, compared to 22.1 for the US (Chart 27). The combination of a weaker US dollar, faster sequential Chinese growth, increased vaccine supplies, and favorable valuations should all help EM stocks later this year. Go long the Vanguard FTSE Emerging Markets ETF (VWO) versus the Vanguard S&P 500 ETF (VOO). Peter Berezin Chief Global Strategist pberezin@bcaresearch.com Chart 27Wide Valuation Gap Between US And Non-US Markets
Wide Valuation Gap Between US And Non-US Markets
Wide Valuation Gap Between US And Non-US Markets
Footnotes 1 The Federal Reserve targets an average inflation rate of 2% for the personal consumption expenditures (PCE) index. The TIPS breakeven is based on the CPI index. Due to compositional differences between the two indices, CPI inflation has historically averaged 30-to-50 basis points higher than PCE inflation. This is why the Fed effectively targets a CPI inflation rate of about 2.3%-to-2.5%. Global Investment Strategy View Matrix
Investors Are Asking The Wrong Question About Inflation
Investors Are Asking The Wrong Question About Inflation
Special Trade Recommendations
Investors Are Asking The Wrong Question About Inflation
Investors Are Asking The Wrong Question About Inflation
Current MacroQuant Model Scores
Investors Are Asking The Wrong Question About Inflation
Investors Are Asking The Wrong Question About Inflation