Global
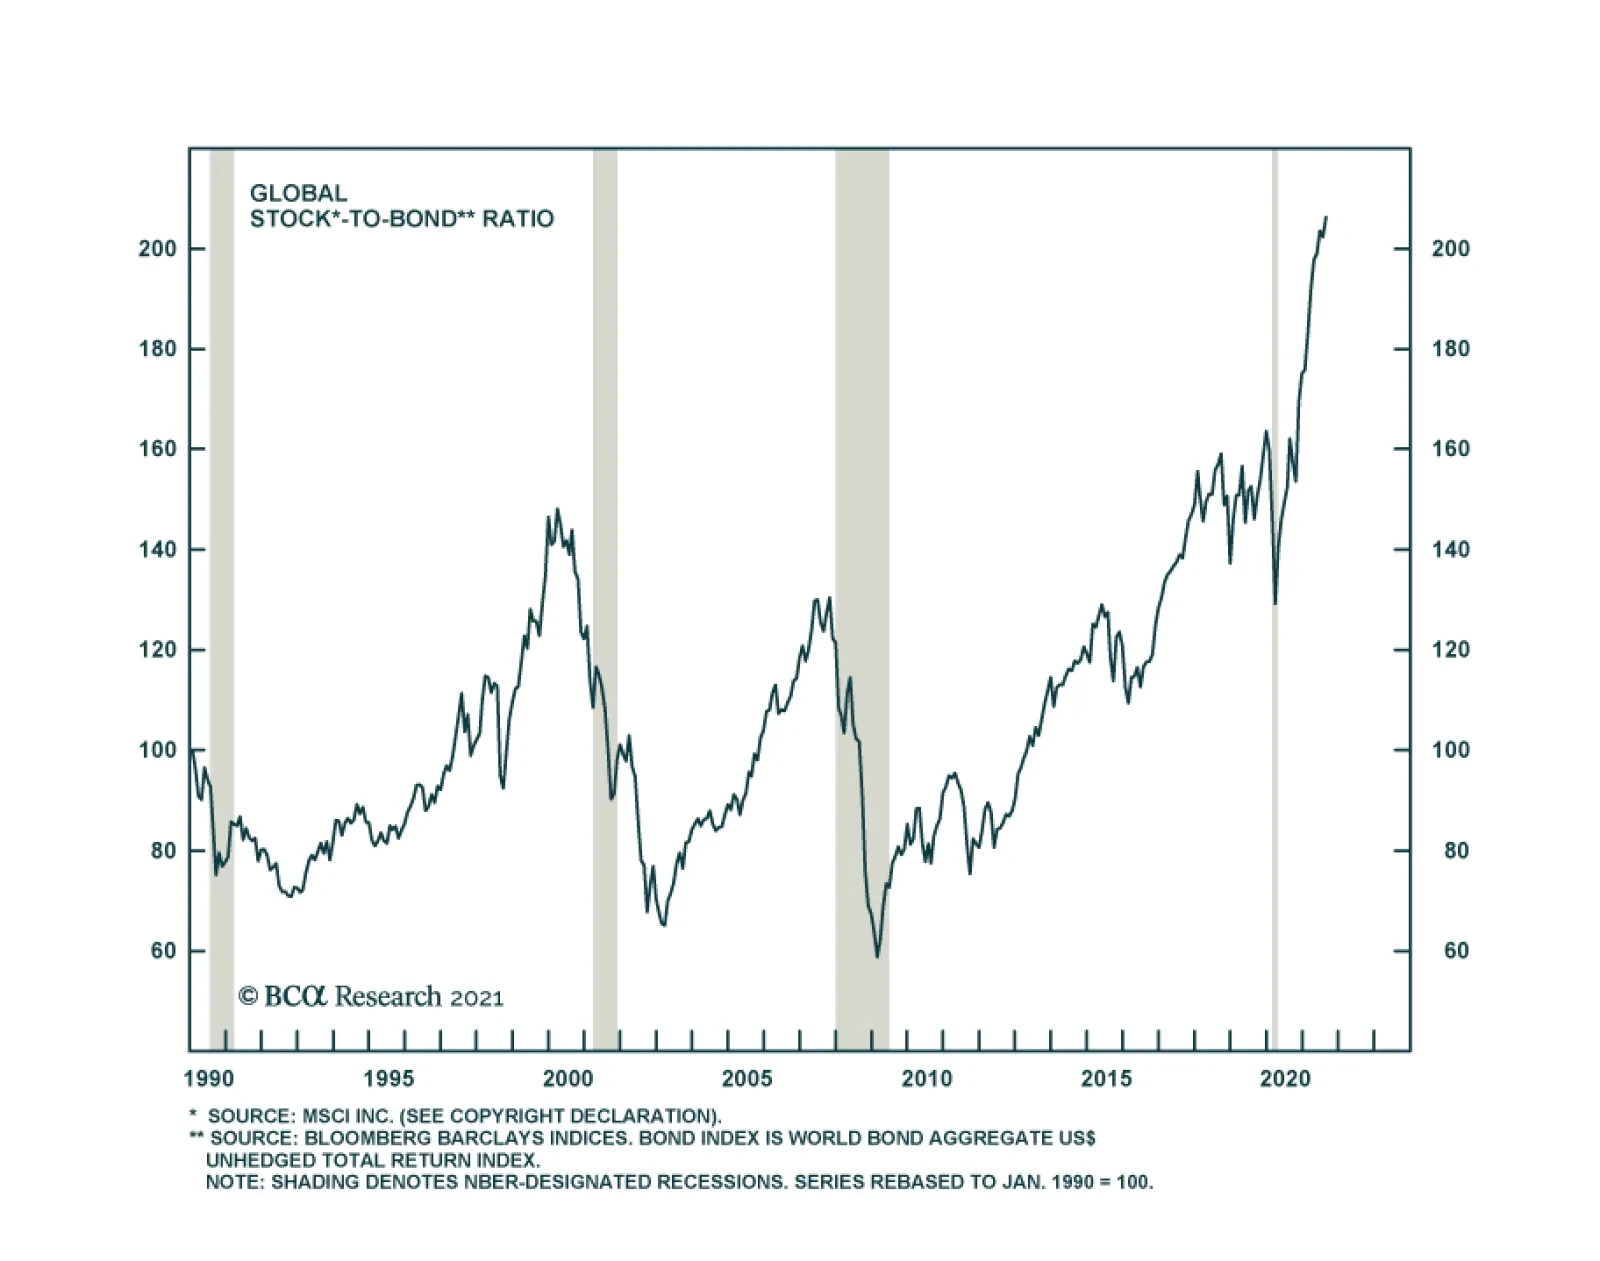
The key decision for asset allocators is always at the asset-class level: Whether equities will outperform bonds or vice versa. Despite the decline in government bond yields since March, the stock/bond ratio - defined most broadly as the total…
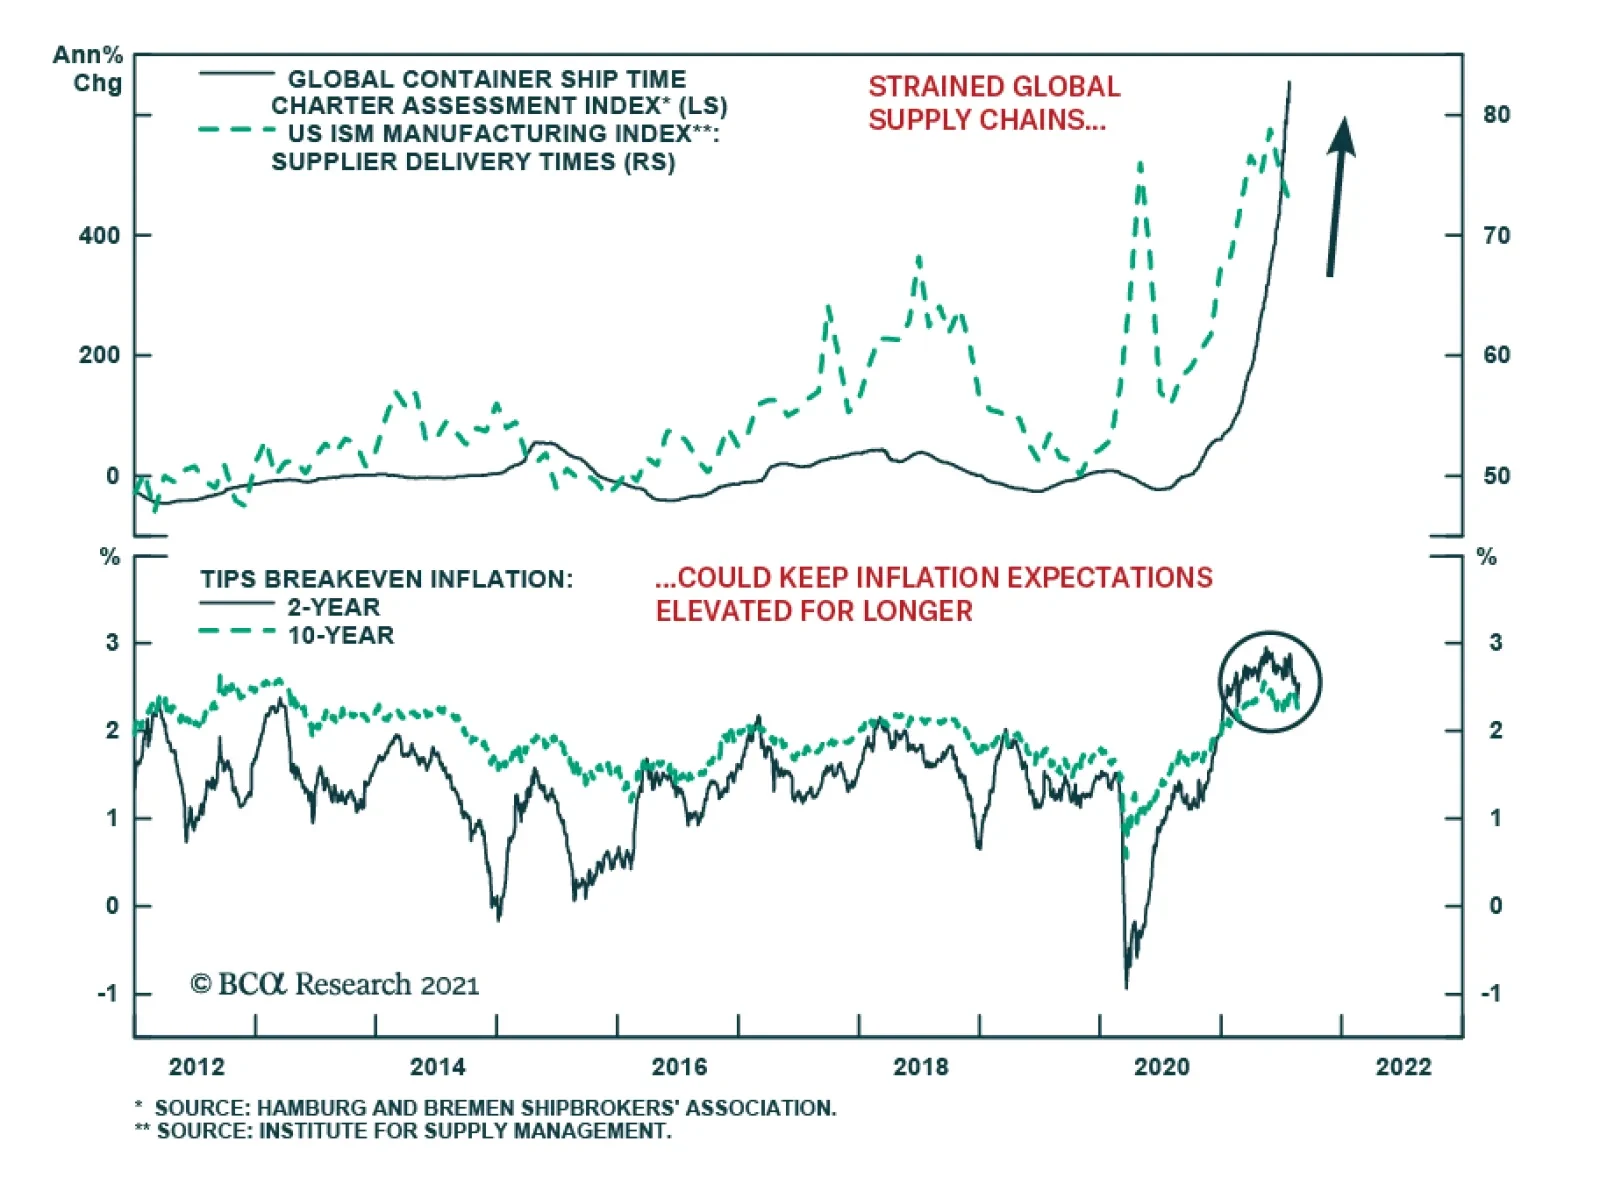
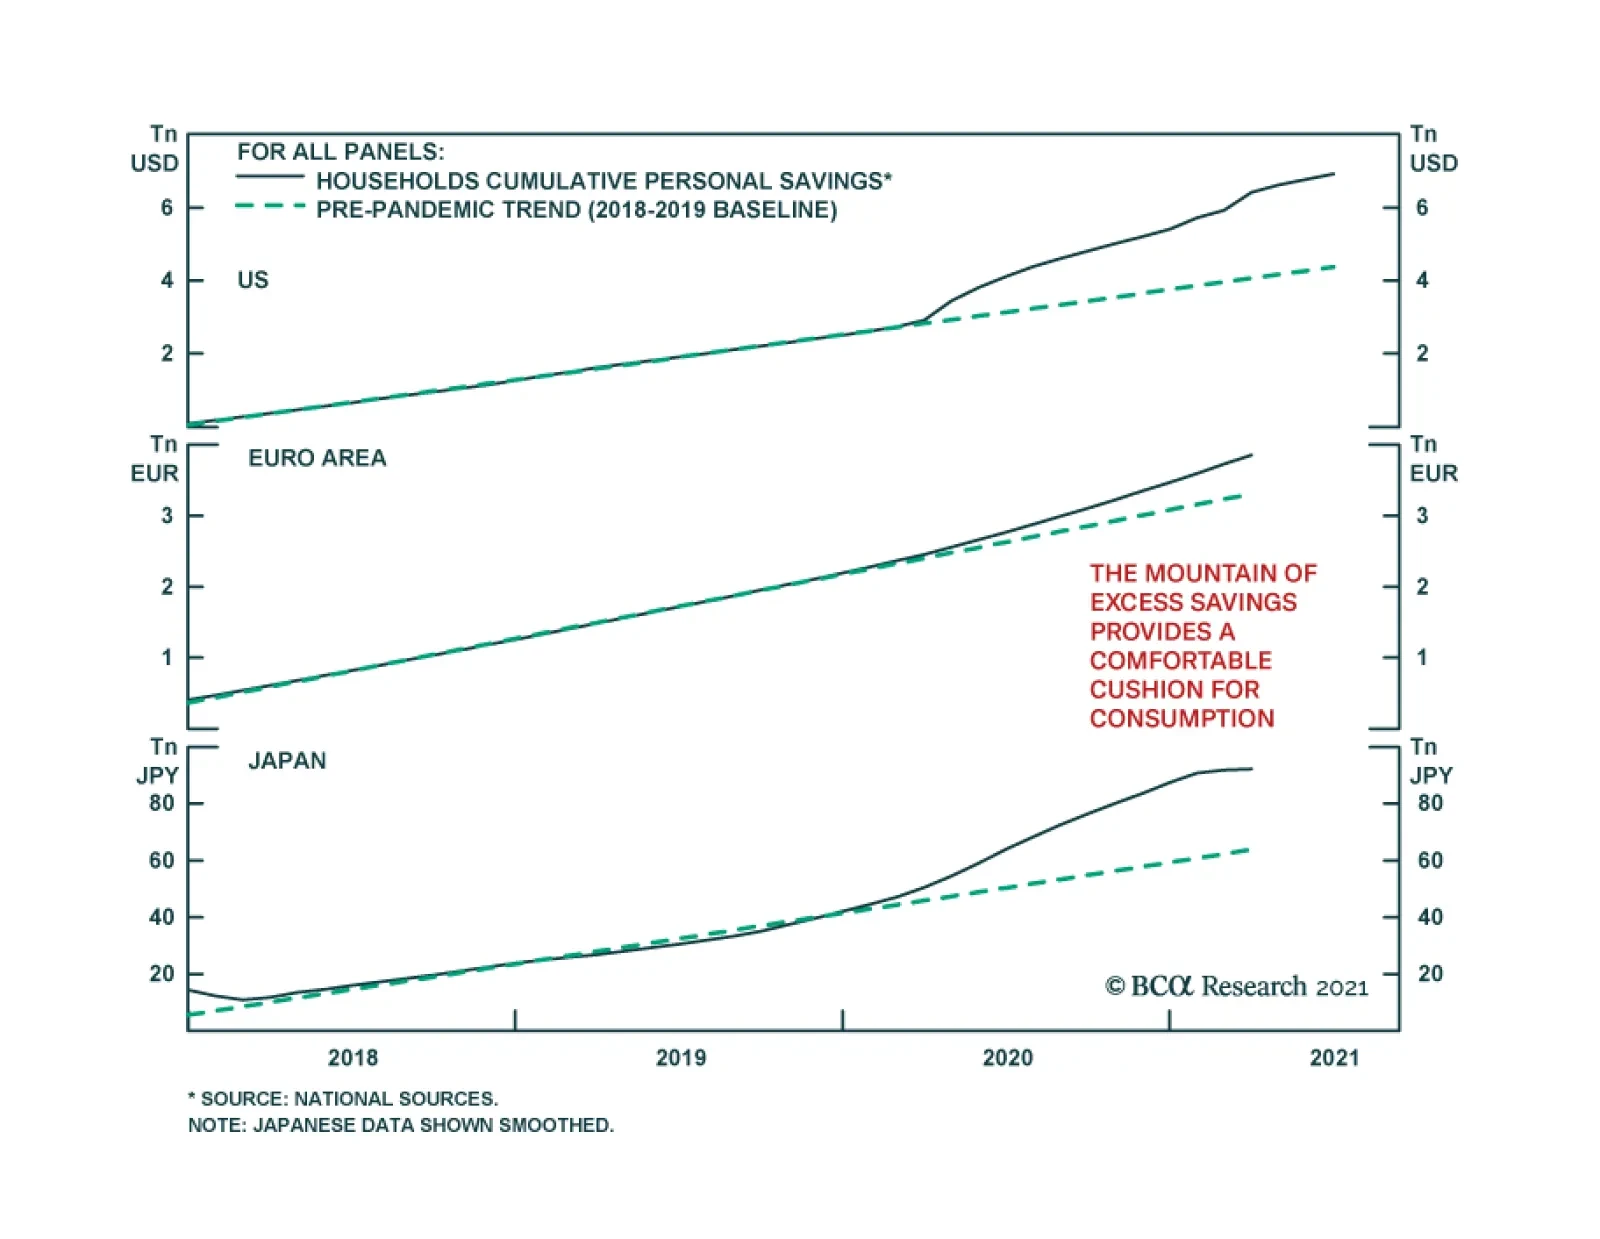
The disruption of global supply chains continues to be a major concern, with measures of shipping container chartering rates not only at all-time highs but many orders of magnitude above regular levels. Booming global goods demand as households spend down…

Highlights The post-pandemic investment phase is just a continuation of the post-credit boom investment phase. This is because the pandemic has just accelerated the pre-existing shifts to a more remote way of working, shopping and interacting as well as the de-carbonisation of the economy. Combined with no new credit boom, these ongoing trends will structurally weigh on the profits of old economy sectors, consumer prices, and bond yields. At the same time, these trends are a continuing structural tailwind for the profits in those sectors that facilitate the shift to a more digital and cleaner world. Our high-conviction recommendation is to stay structurally overweight growth sectors versus old economy sectors… …and to stay structurally overweight the US stock market versus the non-US stock market. Fractal analysis: PLN/USD, Hungary versus Emerging Markets, and sugar versus soybeans. Feature Chart of the WeekUS And Non-US Profits Go Their Starkly Separate Ways
US And Non-US Profits Go Their Starkly Separate Ways
US And Non-US Profits Go Their Starkly Separate Ways
Many people use the US stock market as a proxy for the world stock market. Intuitively, this makes sense, because the US stock market is the largest in the world, and the S&P 500 and Dow Jones Industrials are well-known indexes that we can monitor in real time. In contrast, world equity indexes such as the MSCI All Country World are less familiar and do not move in real time. Yet to use the US stock market as a proxy for the world stock market is a mistake. Although the US comprises makes up half of the world stock market capitalisation, the other half is so different – the non-US yan to the US yin – that the US cannot represent the world. As we will now illustrate. US Profits Have Doubled While Non-US Profits Have Shrunk Over the past ten years, US and non-US stock market profits have gone their starkly separate ways. While US profits have nearly doubled, non-US profits languish 10 percent below where they were in 2011! (Chart of the Week) While US profits have nearly doubled, non-US profits languish 10 percent below where they were in 2011. Of course, in any comparison of this sort, a key issue is the starting point. In this first part of our analysis, we are defining the starting point as the point at which profits had recouped all their global financial crisis losses. For both US and non-US profits this point was in March 2011 (Chart I-2 and Chart I-3). Chart I-2Comparing Profit Growth Since The Full Recovery From The Financial Crisis
Comparing Profit Growth Since The Full Recovery From The Financial Crisis
Comparing Profit Growth Since The Full Recovery From The Financial Crisis
Chart I-3Comparing Valuation Expansion Since The Full Recovery From The Financial Crisis
Comparing Valuation Expansion Since The Full Recovery From The Financial Crisis
Comparing Valuation Expansion Since The Full Recovery From The Financial Crisis
Because the issue of the starting point of the analysis is contentious, we will look at a much earlier starting point later in the report. But first, here are the decompositions of the US and non-US stock market moves from March 2011. US stock market profits are up 93 percent, while the multiple paid for those profits (valuation) is up 75 percent. Compounding to a total price gain of 235 percent (Chart I-4). Chart I-4US Profits Up 93 Percent, Valuation Up 75 Percent
US Profits Up 93 Percent, Valuation Up 75 Percent
US Profits Up 93 Percent, Valuation Up 75 Percent
Non-US stock market profits are down -9 percent, while the multiple paid for those profits is up 38 percent. Compounding to a total price gain of a measly 25 percent (Chart I-5). Chart I-5Non-US Profits Down -9 Percent, Valuation Up 38 Percent
Non-US Profits Down -9 Percent, Valuation Up 38 Percent
Non-US Profits Down -9 Percent, Valuation Up 38 Percent
The aggregate world stock market profits are up 24 percent, while the multiple paid for those profits is up 57 percent. Compounding to a total price gain of 94 percent (Chart I-6). Chart I-6World Profits Up 24 Percent, Valuation Up 57 Percent
World Profits Up 24 Percent, Valuation Up 57 Percent
World Profits Up 24 Percent, Valuation Up 57 Percent
The Post-Credit Boom Phase Favours The US Over The Non-US Stock Market In the post-credit boom phase, several important features of stock market performance are worth highlighting. In absolute terms, valuation expansion has lifted US stocks by twice as much as non-US stocks, 75 percent versus 38 percent. Yet even the 75 percent expansion in the US stock market valuation has played second fiddle to the 93 percent expansion in US stock market profits. Absent valuation expansion, non-US stocks would stand lower today than in 2011. But for non-US stocks, whose structural profit growth has been non-existent, valuation expansion has been the only instrument for structural gains. Indeed, absent valuation expansion, non-US stocks would stand lower today than in 2011. And absent valuation expansion at a world level, the world stock market would lose three quarters of its ten-year gain. What can explain the startling performance differential between US and non-US stocks on both profit and valuation expansions? As we have argued before, most of the difference does not come from the underlying (US versus non-US) economies, but instead comes from the company and sector compositions of the stock markets. The US stock market is heavily over-weighted to global growth companies and sectors – such as technology and healthcare (Chart I-7) – which, by definition, have experienced structural growth in their profits. In contrast, the non-US stock market is heavily over-weighted to global old economy companies and sectors – such as financials, energy, and resources (Chart I-8) – whose profits have stagnated, or entered structural downtrends (Chart I-9). Chart I-7The US Stock Market Is Heavily Over-Weighted To Growth Sectors
The US Stock Market Is Heavily Over-Weighted To Growth Sectors
The US Stock Market Is Heavily Over-Weighted To Growth Sectors
Chart I-8The Non-US Stock Market Is Heavily Over-Weighted To Old Economy Sectors
The Non-US Stock Market Is Heavily Over-Weighted To Old Economy Sectors
The Non-US Stock Market Is Heavily Over-Weighted To Old Economy Sectors
Chart I-9Old Economy Sector Profits Have Gone Nowhere
Old Economy Sector Profits Have Gone Nowhere
Old Economy Sector Profits Have Gone Nowhere
At the same time, when bond yields decline, companies whose profits are growing (and time-weighted into the distant future) see a greater increase in their net present values. Hence, companies in the global growth sectors have experienced a larger valuation expansion than those in the old economy sectors. In this way, the US stock market has outperformed the non-US stock market on both profit growth and valuation expansion. The key question is, will these post-credit boom trends continue? The answer depends on whether the post-pandemic world marks a new phase for investment, or whether it is just a continuation of the post-credit boom phase. The Post-Pandemic Phase Is A Continuation Of The Post-Credit Boom Phase Let’s now address the issue of the starting point of our analysis by panning out to 1990. This bigger picture from 1990 shows three distinct phases for investors (Chart I-10 and Chart I-11). Chart I-10Since 1990, There Have Been Three Distinct Investment Phases
Since 1990, There Have Been Three Distinct Investment Phases
Since 1990, There Have Been Three Distinct Investment Phases
Chart I-11The Post-Pandemic Investment Phase Is A Continuation Of The Post-Credit Boom Phase
The Post-Pandemic Investment Phase Is A Continuation Of The Post-Credit Boom Phase
The Post-Pandemic Investment Phase Is A Continuation Of The Post-Credit Boom Phase
The first phase was the 1990s build-up to the dot com boom. This phase clearly favoured growth sectors, and thereby the US stock market versus the non-US stock market. The second phase was the early 2000s credit boom. This phase clearly favoured sectors that facilitated the credit boom or benefited from its spending – notably, the old economy sectors of financials, energy, and resources. Thereby it favoured the non-US stock market versus the US stock market. The third and most recent phase is the post-credit boom phase. This phase has flipped the leadership back to growth sectors as the absence of structural credit growth has stifled financials as well as the capital-intensive old economy sectors that had previously benefited from the credit boom. Additionally, the structural disinflation that has comes from weak credit growth has dragged down bond yields and – as already discussed – given a much bigger boost to growth sector valuations. Since 1990, there have been three distinct phases for investors: the dot com boom; the credit boom; and the post-credit boom. Now we come to the key question. Did 2020 mark the end of the post-credit boom phase and the start of a new ‘post-pandemic’ phase? On the evidence so far, the answer is an emphatic no. Crucially, there is no new credit boom. A still highly indebted private sector is neither willing nor able to borrow. And although public sector debt surged during the pandemic, governments are now keen to temper or rein in deficits. In any case, Japan teaches us that government borrowing – which is bond rather than bank financed – does nothing for the banks or the broader financial sector. An equally important question is, has the pandemic reversed the societal and economic trends of the post-credit boom phase? The answer is no. Quite the contrary, the pandemic has accelerated the pre-existing shifts to a more remote way of working, shopping and interacting as well as the de-carbonisation of the economy. Combined with no new credit boom, these ongoing trends are structurally disinflationary for the profits of old economy sectors as well as for consumer prices. Thereby, they will continue to weigh on bond yields. At the same time, the trends are a continuing structural tailwind for the profits in those sectors that facilitate and enable the shift to a more digital and cleaner world. While we are open to the evolving evidence, the post-pandemic investment phase seems an extension of the post-credit boom phase. This means that structurally, there is no reason to flip out of growth sectors back to old economy sectors. It also means that structurally, there is no reason to switch from US to non-US stocks. Fractal Analysis Update This week’s fractal analysis highlights three potential countertrend moves based on fragile fractal structures. First, the recent rally in the US dollar could meet near-term resistance given its weakening 65-day fractal structure. A good way of playing this would be long PLN/USD (Chart I-12). Chart I-12PLN/USD Could Rebound
PLN/USD Could Rebound
PLN/USD Could Rebound
Second, the strong outperformance of Hungary versus Emerging Markets – largely driven by one stock, OTP Bank – has become a crowded trade based on its 130-day fractal structure. This would suggest underweighting Hungary versus the Emerging Markets index (Chart I-13). Chart I-13Underweight Hungary Versus EM
Underweight Hungary Versus EM
Underweight Hungary Versus EM
Finally, the sugar price has skyrocketed as extreme weather has disrupted output in the world’s top producer, Brazil. Given that supply bottlenecks ultimately ease, a recommended trade would be to short sugar versus soybeans, using ICE versus CBOT futures contracts (Chart I-14). Set the profit target and symmetrical stop-loss at 8 percent. Chart I-14Short Sugar Versus Soybeans
Short Sugar Versus Soybeans
Short Sugar Versus Soybeans
Dhaval Joshi Chief Strategist dhaval@bcaresearch.com Fractal Trading System Fractal Trades 6-Month Recommendations Structural Recommendations Closed Fractal Trades Closed Trades Asset Performance Equity Market Performance Indicators To Watch - Bond Yields Indicators To Watch - Bond Yields ##br##- Euro Area
Indicators To Watch - Bond Yields - Euro Area
Indicators To Watch - Bond Yields - Euro Area
Indicators To Watch - Bond Yields ##br##- Europe Ex Euro Area
Indicators To Watch - Bond Yields - Europe Ex Euro Area
Indicators To Watch - Bond Yields - Europe Ex Euro Area
Indicators To Watch - Bond Yields ##br##- Asia
Indicators To Watch - Bond Yields - Asia
Indicators To Watch - Bond Yields - Asia
Indicators To Watch - Bond Yields ##br##- Other Developed
Indicators To Watch - Bond Yields - Other Developed
Indicators To Watch - Bond Yields - Other Developed
Indicators To Watch - Interest Rate Expectations Indicators To Watch - Interest Rate Expectations
Indicators To Watch - Interest Rate Expectations
Indicators To Watch - Interest Rate Expectations
Indicators To Watch - Interest Rate Expectations
Indicators To Watch - Interest Rate Expectations
Indicators To Watch - Interest Rate Expectations
Indicators To Watch - Interest Rate Expectations
Indicators To Watch - Interest Rate Expectations
Indicators To Watch - Interest Rate Expectations
Indicators To Watch - Interest Rate Expectations
Indicators To Watch - Interest Rate Expectations
Indicators To Watch - Interest Rate Expectations
The S&P 500 continues to climb, registering fresh highs. However, other parts of financial markets are signaling greater caution about the growth outlook. Cyclical equity sectors have been underperforming defensives since June 1st, the 10-year Treasury…
Stocks and bonds have been sending a contradictory signal. US 10-year Treasury yields stand 45 bps below their late March peak - reflecting both technical factors as well as heightened global growth uncertainty and pandemic fears. Meanwhile, equities…
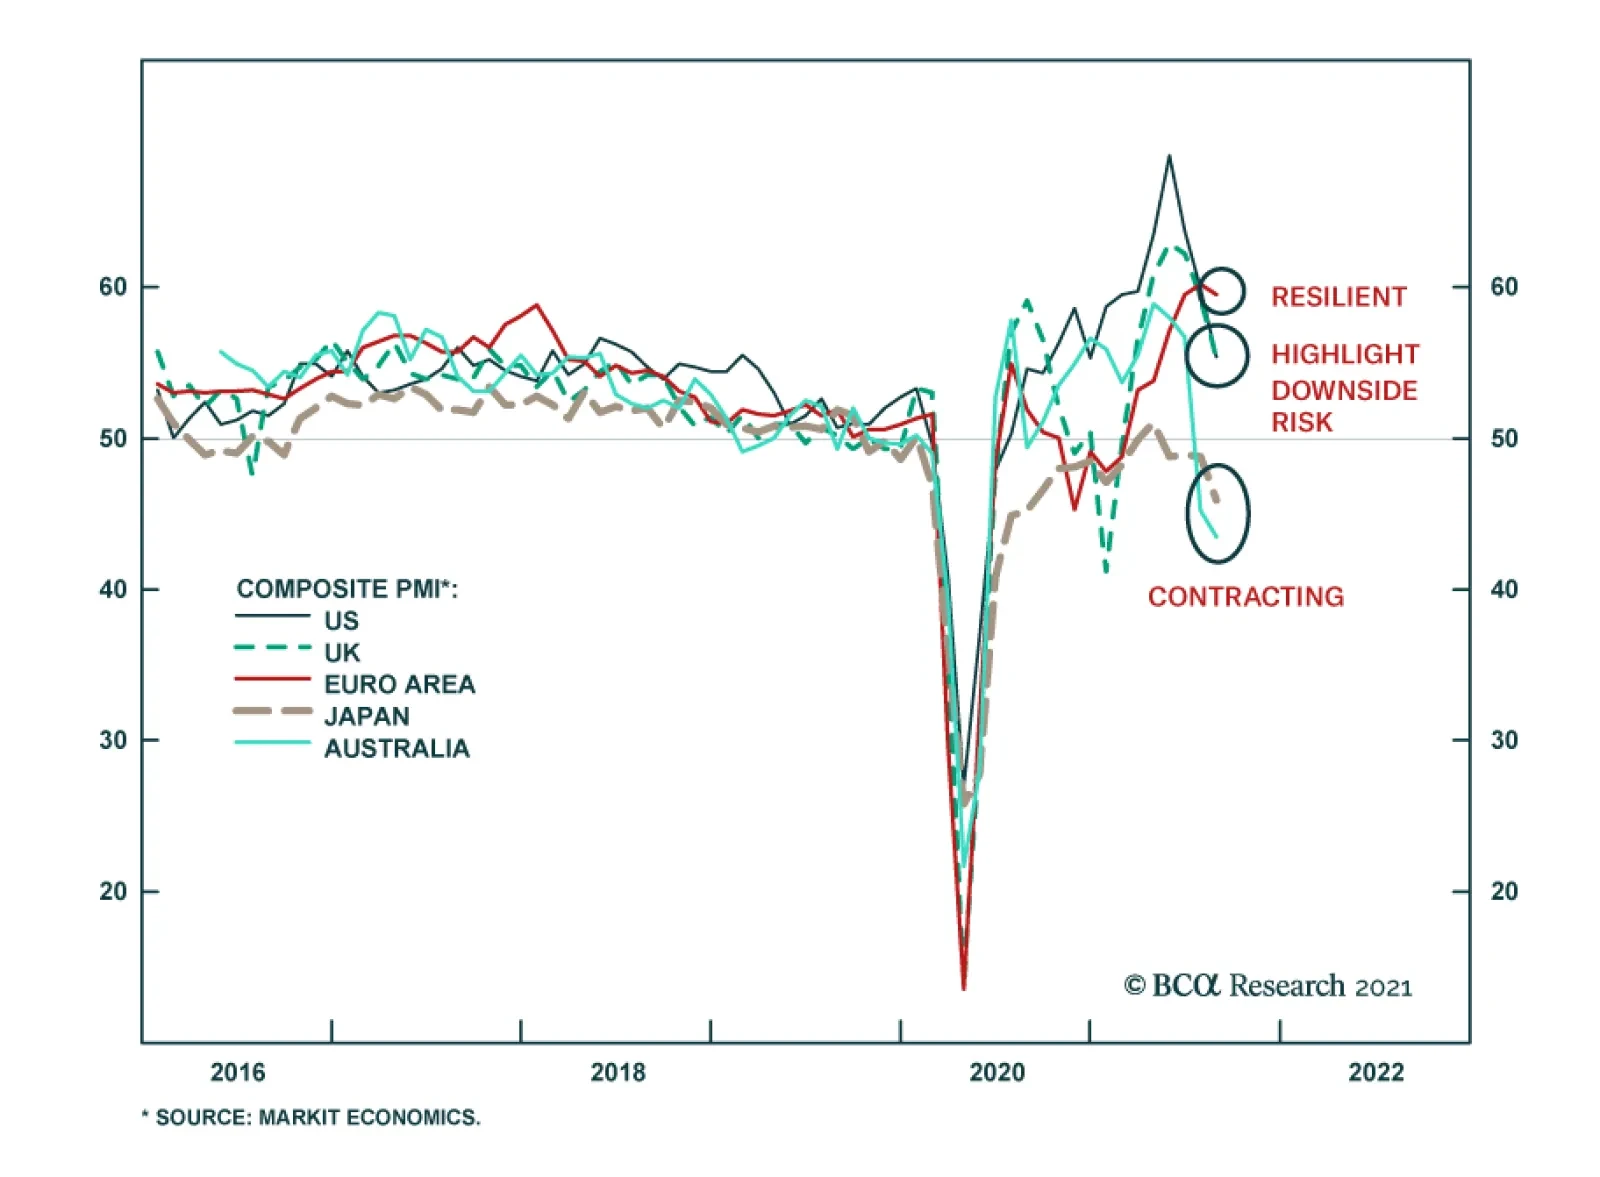
IHS Markit's flash PMIs for August reveal a bifurcated economic performance among major developed markets. Economic activity continues to be weighed down by negative pandemic dynamics in Australia and Japan where COVID-19 infections are rising, vaccination…
Dear Client, I will be on vacation next week. In lieu of our regular report, we will be sending you a Special Report written by my colleagues Chester Ntonifor, BCA Research’s Chief Foreign Exchange Strategist, and Matt Gertken, Chief Geopolitical Strategist. Their report discusses the threat to the dollar’s reserve status over the next decade. This week, Matt published a timely report entitled “Afghanistan? Watch Iran And China,” examining the global macro significance of the US withdrawal from Afghanistan. I trust you will find both reports insightful. Best regards, Peter Berezin, Chief Global Strategist Highlights Over the next 12 months, US inflation will decline fast enough to allow the Federal Reserve to maintain its accommodative monetary stance, but not as fast as investors are expecting. A number of structural forces were becoming inflationary even before the pandemic began. The pandemic will only buttress the tide. Even if the virus is eventually vanquished, the pandemic could prop up inflation by permanently reducing labor supply, hastening the retreat from globalization, and keeping fiscal policy looser than it otherwise would have been. Fixed-income investors should maintain a short duration stance. We expect the US 10-year Treasury yield to rebound to about 1.8% by early next year. Long-term bond yields in the other major economies will also rise, although not as much as in the US. In and of itself, higher inflation is not necessarily bad for equities. What makes higher inflation toxic for stocks is when it forces central banks to raise rates to punitive levels. Fortunately, such an outcome is still a few years away, justifying an overweight equity position for now. Upside Risks To Inflation In our July 23rd report, we argued that investors were asking the wrong question about inflation. Rather than asking whether higher inflation is transitory, they should be asking whether inflation will decline faster or slower than what the market is discounting. Chart 1Investors Expect Inflation To Fall Rapidly From Current Levels
Transitory At First: The Pandemic’s Long-Term Impact On Inflation
Transitory At First: The Pandemic’s Long-Term Impact On Inflation
Chart 1 shows that investors expect inflation to fall rapidly from current levels and to remain subdued thereafter. The widely followed 5-year/5-year forward TIPS breakeven inflation rate currently stands at 2.12%, below the Fed’s comfort zone of 2.3%-to-2.5% (Chart 2).1 Chart 2Below-Target Inflation Expectations And A Low R* Have Restrained Bond Yields
Below-Target Inflation Expectations And A Low R* Have Restrained Bond Yields
Below-Target Inflation Expectations And A Low R* Have Restrained Bond Yields
Downbeat long-term inflation expectations and the market’s perception that the neutral rate of interest is very low are the two main reasons why bond yields are so depressed. QE programs have also dampened yields, although not nearly as much as widely believed. Chart 3Outside Of A Few Pandemic-Related Sectors, The CPI Has Yet To Return To Trend
Outside Of A Few Pandemic-Related Sectors, The CPI Has Yet To Return To Trend
Outside Of A Few Pandemic-Related Sectors, The CPI Has Yet To Return To Trend
In our report, we contended that US inflation would come down fast enough over the next few quarters to allow the Federal Reserve to maintain its accommodative monetary stance, but not as fast as investors are expecting. On the one hand, the evidence clearly shows that most of the recent increase in US inflation has been driven by just a few pandemic-related sectors (Chart 3). On the other hand, high levels of excess household savings, the need for firms to expand capacity and rebuild inventories, and continued policy support will boost output and prices. The Long-Term Inflationary Consequences Of The Pandemic We also argued that a variety of structural forces, including the exodus of baby boomers from the labor market, a retreat from globalization, and increasing social unrest, would drive up inflation over the long haul. A key question is how the pandemic will shape these structural forces going forward. As we discuss below, there are three main overlapping channels through which the pandemic could have a lasting impact on inflation: Labor market scarring: Even if the virus is eventually vanquished, the pandemic could still permanently reduce the labor supply. Widespread worker shortages would fuel inflation. Deglobalization: Globalization has historically been a deflationary force. The pandemic could accelerate the retreat from globalization by prompting firms to bring more production back home, while exacerbating geopolitical tensions. Fiscal policy: Big budget deficits could persist in the post-pandemic period. Debt-saddled governments may turn to inflation to erode their debt burdens. Let us assess these three channels in turn. Channel #1: Labor Market Scarring Despite July’s blockbuster employment report, there are still nearly 4% fewer Americans employed than was the case in January 2020. Yet, US businesses are struggling to hire workers (Chart 4). Nationwide, the job openings rate stands at a record 6.5%, up from 4.5% on the eve of the pandemic (Chart 5). Chart 4US Companies Are Facing A Labor Shortage
US Companies Are Facing A Labor Shortage
US Companies Are Facing A Labor Shortage
Chart 5There Are Plenty Of Jobs Available
There Are Plenty Of Jobs Available
There Are Plenty Of Jobs Available
Generous unemployment benefits, less immigration, and the reluctance of many workers to expose themselves to the virus have all helped to reduce labor supply. A marked shift in the composition of spending has increased the demand for workers in some sectors while reducing demand in other sectors (Chart 6). Since labor is not perfectly fungible across sectors, this has caused overall unemployment to rise. Chart 6Which Sectors Have Gained And Which Have Lost Jobs Since The Pandemic?
Transitory At First: The Pandemic’s Long-Term Impact On Inflation
Transitory At First: The Pandemic’s Long-Term Impact On Inflation
Looking out, labor supply should increase as emergency unemployment benefits expire, immigration picks up, and more people are vaccinated. The mismatch of workers across sectors should also diminish as goods and services spending rebalances. Nevertheless, there is considerable uncertainty over how quickly all this will happen. According to Indeed, an online job posting site, unemployed workers cited having a “financial cushion” as the most popular reason for not looking for a job in July (Chart 7). Given that American households are sitting on $2.4 trillion in excess savings, it may take some time for this cushion to deflate (Chart 8). Chart 7Americans Are Not Desperate To Find Work
Transitory At First: The Pandemic’s Long-Term Impact On Inflation
Transitory At First: The Pandemic’s Long-Term Impact On Inflation
Chart 8A Lot Of Excess Savings
A Lot Of Excess Savings
A Lot Of Excess Savings
Chart 9No Jab, No Job
Transitory At First: The Pandemic’s Long-Term Impact On Inflation
Transitory At First: The Pandemic’s Long-Term Impact On Inflation
Wider vaccine mandates could also impact labor market participation. A host of major companies, ranging from Google to Citigroup, are requiring their employees to be inoculated before returning to the office (Chart 9). The Pentagon has laid out a plan endorsed by President Biden obliging members of the military to get the COVID-19 vaccine. Earlier this week, the Las Vegas Raiders became the first NFL team to require fans to produce proof of vaccination to gain entry to home games. On the one hand, vaccine mandates could encourage more people to get the jab, which should help curb the pandemic and boost employment in the service sector. While the numbers have improved in recent weeks, only 57% of Americans between the ages of 18 and 64 are fully vaccinated (Chart 10). On the other hand, some people might opt for unemployment over a vaccine. According to a recent YouGov poll, about half of all unvaccinated Americans believe that the government is using COVID-19 vaccines to microchip the population (Chart 11). The threat of losing one’s job is unlikely to sway many of them. Chart 10Many Workers Remain Unvaccinated
Transitory At First: The Pandemic’s Long-Term Impact On Inflation
Transitory At First: The Pandemic’s Long-Term Impact On Inflation
Chart 11One In Five Americans Believes The US Government Is Using The Covid-19 Vaccine To Microchip The Population
Transitory At First: The Pandemic’s Long-Term Impact On Inflation
Transitory At First: The Pandemic’s Long-Term Impact On Inflation
Pandemic-induced shifts in work-life preferences could also reduce labor supply. According to Ipsos, a polling firm, most employees would prefer to work remotely at least part of the time, with 25% indicating they do not want to return to their workplace at all (Chart 12). The same poll found that 30% of workers would consider looking for another job if their employer required them to work away from home full time (Chart 13). Chart 12Let’s Chat Around The Water Cooler On Tuesdays And Wednesdays
Transitory At First: The Pandemic’s Long-Term Impact On Inflation
Transitory At First: The Pandemic’s Long-Term Impact On Inflation
Chart 13What Is The Opposite Of A “One Size Fits All” Work Environment?
Transitory At First: The Pandemic’s Long-Term Impact On Inflation
Transitory At First: The Pandemic’s Long-Term Impact On Inflation
Chart 14Number Of Retired People Jumped During The Pandemic
Number Of Retired People Jumped During The Pandemic
Number Of Retired People Jumped During The Pandemic
If remote working boosted productivity, as some have claimed, this would not be such a bad thing. However, it is far from clear that this is the case. A recent University of Chicago study of 10,000 skilled professionals from an Asian IT company revealed that work-from-home policies decreased productivity by 8%-to-19%. Early retirement has also reduced labor supply. The share of retirees in the US population rose by 1.3 percentage points between February 2020 and July 2021, with most of the increase occurring early in the pandemic (Chart 14). Based on pre-pandemic demographic trends, the retirement rate should have risen by only 0.5 percentage points over this period. The good news, as discussed in a recent study by the Kansas City Fed, is that most of the increase in the retirement rate was driven by fewer people transitioning from retirement back into employment. The share of people transitioning from employment to retirement did not change much (Chart 15). This led the authors to conclude that “More retirees may rejoin the workforce as health risks fade, but the retirement share is unlikely to return to a normal level for some time.” Chart 15Increased Retirees: A Closer Look
Transitory At First: The Pandemic’s Long-Term Impact On Inflation
Transitory At First: The Pandemic’s Long-Term Impact On Inflation
Bottom Line: Labor supply will recover as the pandemic recedes. Nevertheless, the available pool of workers will likely be lower in the post-pandemic period than it would have otherwise been. A shortage of workers will prop up wage growth, helping to fuel inflation. Channel #2: Deglobalization Globalization was on the back foot even before the pandemic began. Having steadily increased between 1991 and 2008, the ratio of global trade-to-output was basically flat during the 2010s (Chart 16). Ironically, the pandemic has revived global trade by shifting the composition of spending away from non-tradable services towards tradable goods. This shift in spending is the key reason why shipping costs have soared in recent months (Chart 17). Chart 16Globalization Plateaued Over A Decade Ago
Globalization Plateaued Over A Decade Ago
Globalization Plateaued Over A Decade Ago
Chart 17Shipping Costs Have Soared In Recent Months
Shipping Costs Have Soared In Recent Months
Shipping Costs Have Soared In Recent Months
The rebound in trade will not endure. Already, we are seeing companies moving production back home to establish greater control over their supply chains. The pandemic has exacerbated geopolitical tensions between China and the US. Recriminations about how the pandemic began and what China could have done to stop it will not go away anytime soon. Trade bloomed during Pax Britannica, when Great Britain ruled the waves, and then again during Pax Americana, when the US controlled the commanding heights. As BCA’s geopolitical team has long stressed, the shift to a multi-polar world is likely to restrain globalization.2 Historically, globalization has been a deflationary force. Trade has allowed countries such as the US that consistently run current account deficits to satiate excess demand for goods with imports, thereby forestalling inflation. Trade has also raised productivity by allowing countries to specialize in those areas in which they have a comparative advantage, while providing a mechanism to diffuse technological know-how around the world. Standard trade theory predicts that less-skilled workers in developed economies will suffer a relative decline in wages in response to rising trade with developing countries. A number of studies have documented that this is precisely what happened after China entered the global trading system.3 Poor workers tend to spend more of their paychecks than either rich workers or the owners of capital. To the extent that deglobalization shifts the balance of economic power back towards blue-collar workers in advanced economies, this will raise overall aggregate demand. Against the backdrop of muted productivity growth, inflation could increase as a consequence. Bottom Line: Globalization is deflationary, while deglobalization is inflationary. The pandemic is likely to reinforce the trend towards deglobalization. Channel #3: Fiscal Policy There was once a time when governments trembled in fear of the bond vigilantes. Those days are long gone. After briefly rising to 4% in June 2009, the US 10-year Treasury yield trended lower over the subsequent decade, even though unemployment fell and government debt rose. The pandemic sent the bond vigilantes scurrying for cover. Negative real yields allowed governments to run budget deficits of previously unimagined proportions during the pandemic. Budget deficits will decline over the next few years, but the aversion to deficit spending will not return. Not anytime soon at least. The IMF expects the cyclically-adjusted primary budget deficit in advanced economies to average 2.6% of GDP between 2022 and 2026, up from 1% of GDP in the 2014-19 period (Chart 18). Even that is probably too conservative, since the IMF’s projections do not include pending legislation such as President Biden’s $550 billion infrastructure package and $3.5 trillion reconciliation budget bill. Chart 18Fiscal Policy: Tighter But Not Tight
Transitory At First: The Pandemic’s Long-Term Impact On Inflation
Transitory At First: The Pandemic’s Long-Term Impact On Inflation
If the growth rate of the economy exceeds the interest rate on government debt, then governments with high debt-to-GDP ratios could run larger budget deficits than governments with low ratios, while still achieving a stable debt-to-GDP ratio over time.4 The problem is that these same governments would face an exponential increase in debt-servicing costs if interest rates were to rise above the growth rate of the economy. This is not a risk for any major developed economy at the moment but could become an issue as spare capacity recedes. At that point, central banks could face political pressure to keep rates low, even if their economies are overheating. The result could be higher inflation. Higher inflation, in turn, would boost nominal GDP growth, putting downward pressure on debt-to-GDP ratios. Bottom Line: While budget deficits will come down over the next few years, governments in developed economies will still maintain looser fiscal policies than before the pandemic. High debt levels could incentivize policymakers to permit higher inflation. Investment Conclusions US inflation will decline over the next 12 months, but not as quickly as markets are discounting. A number of structural forces were becoming inflationary even before the pandemic began. The pandemic will only reinforce the inflationary tide. Fixed-income investors should maintain a short duration stance. We expect the US 10-year Treasury yield to rebound to about 1.8% by early next year as the Delta variant wave fades. Long-term bond yields in the other major economies will also rise, although not as much as in the US. In and of itself, higher inflation is not necessarily bad for equities. What makes higher inflation toxic for stocks is when it forces central banks to raise rates to punitive levels. Fortunately, such an outcome is still a few years away, justifying an overweight equity position for now. The second quarter earnings season was a strong one. Back on July 2nd, analysts expected S&P 500 companies to generate about $45 in EPS in Q2. In the end, they generated at least $52. Analysts expect earnings to decline in absolute terms in Q3 and remain below Q2 levels until the second quarter of next year, when they are projected to grow by a meagre 3.5% year-over-year (Table 1). Table 1US Earnings Estimates Have Upside
Transitory At First: The Pandemic’s Long-Term Impact On Inflation
Transitory At First: The Pandemic’s Long-Term Impact On Inflation
Earnings estimates usually drift lower over time (Chart 19). BCA’s US equity strategists think there is scope for earnings estimates for the second half of this year to rise materially from current levels. This should support US stocks. Along the same lines, above-trend global growth and attractive valuations should buoy stock markets outside the US. Chart 19Analysts Have Been Revising Up Earnings Estimates This Year
Analysts Have Been Revising Up Earnings Estimates This Year
Analysts Have Been Revising Up Earnings Estimates This Year
Peter Berezin Chief Global Strategist peterb@bcaresearch.com Footnotes 1 The Federal Reserve targets an average inflation rate of 2% for the personal consumption expenditures (PCE) index. The TIPS breakeven is based on the CPI index. Due to compositional differences between the two indices, CPI inflation has historically averaged 30-to-50 basis points higher than PCE inflation. This is why the Fed effectively targets a CPI inflation rate of about 2.3%-to-2.5%. 2 Please see Geopolitical Strategy Weekly Report “Hypo-Globalization (A GeoRisk Update),” dated July 30, 2021; and Special Report, “The Apex Of Globalization - All Downhill From Here,” dated November 12, 2014. 3 For example, economists Katharine Abraham and Melissa Kearney have estimated that increased competition from Chinese imports cost the US economy 2.65 million jobs between 1999 and 2016, almost double the 1.4 million jobs lost to automation. Similarly, David Autor and his colleagues found that increased trade with China has led to large job losses for blue-collar workers in the US manufacturing sector. 4 The steady-state debt-to-GDP ratio can be expressed as p/(r-g), where r is the interest rate, g is trend GDP growth, and p is the primary (i.e., non-interest) budget balance. Thus, for example, if the government wanted to achieve a stable debt-to-GDP ratio of 50% and r-g is -2%, it would need to run a primary budget deficit of 0.5*0.02=1% of GDP. However, if the government targeted a stable debt-to-GDP ratio of 200%, it could run a primary budget deficit of 2*0.02=4% of GDP. See Box 1 in our February 22, 2019 report for a derivation of this debt sustainability equation. Global Investment Strategy View Matrix
Transitory At First: The Pandemic’s Long-Term Impact On Inflation
Transitory At First: The Pandemic’s Long-Term Impact On Inflation
Special Trade Recommendations
Transitory At First: The Pandemic’s Long-Term Impact On Inflation
Transitory At First: The Pandemic’s Long-Term Impact On Inflation
Current MacroQuant Model Scores
Transitory At First: The Pandemic’s Long-Term Impact On Inflation
Transitory At First: The Pandemic’s Long-Term Impact On Inflation
Global risk assets struggled on Thursday. Stock markets in Asia and Europe ended the day in the red, cyclical commodities such as oil and metals declined, and the VIX spiked to near 25 before receding to 21.6. The proximate cause of the setback is a…
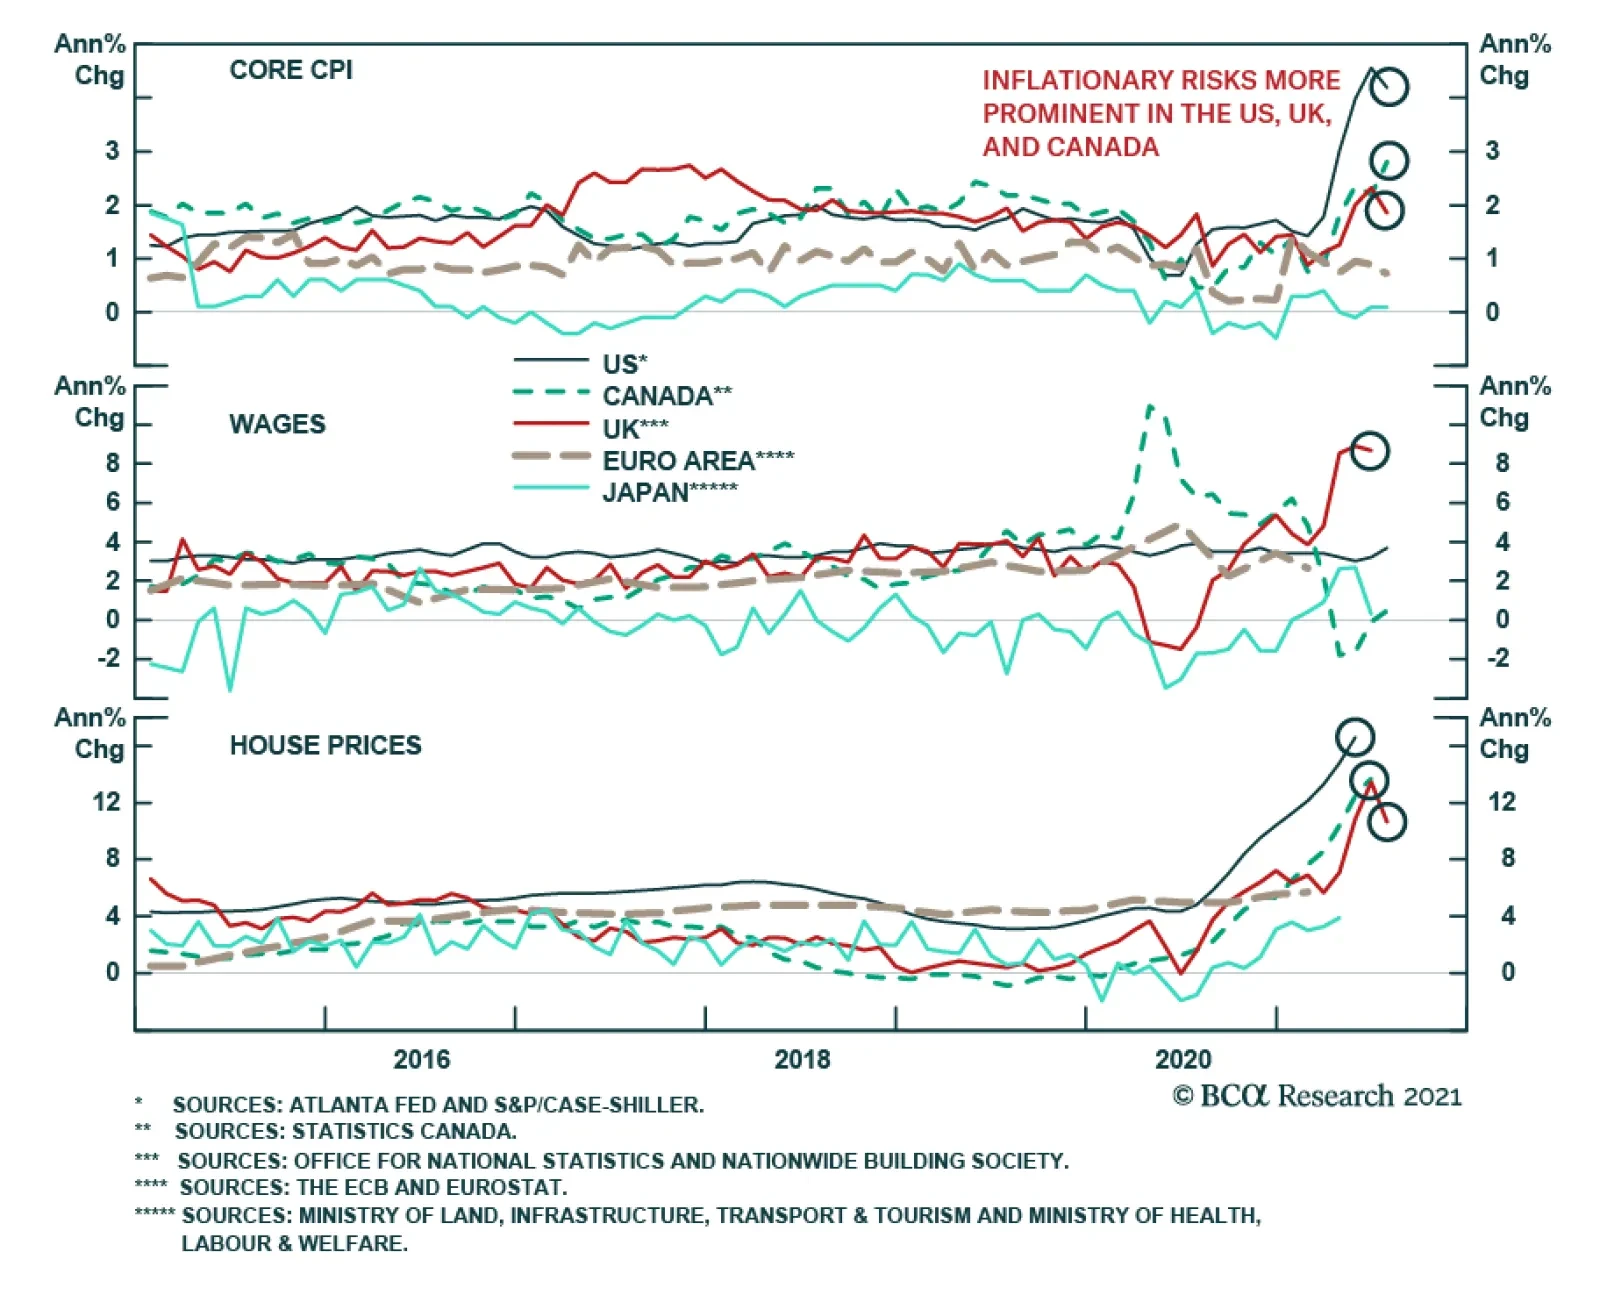
Canadian, UK, and Euro Area CPI prints for July were released on Tuesday. The UK’s core CPI grew 1.8% y/y and Canada’s three core measures average 2.5% y/y. Meanwhile, the Euro Area faces relatively mute core inflation at 0.7% y/y. This reflects the broader…
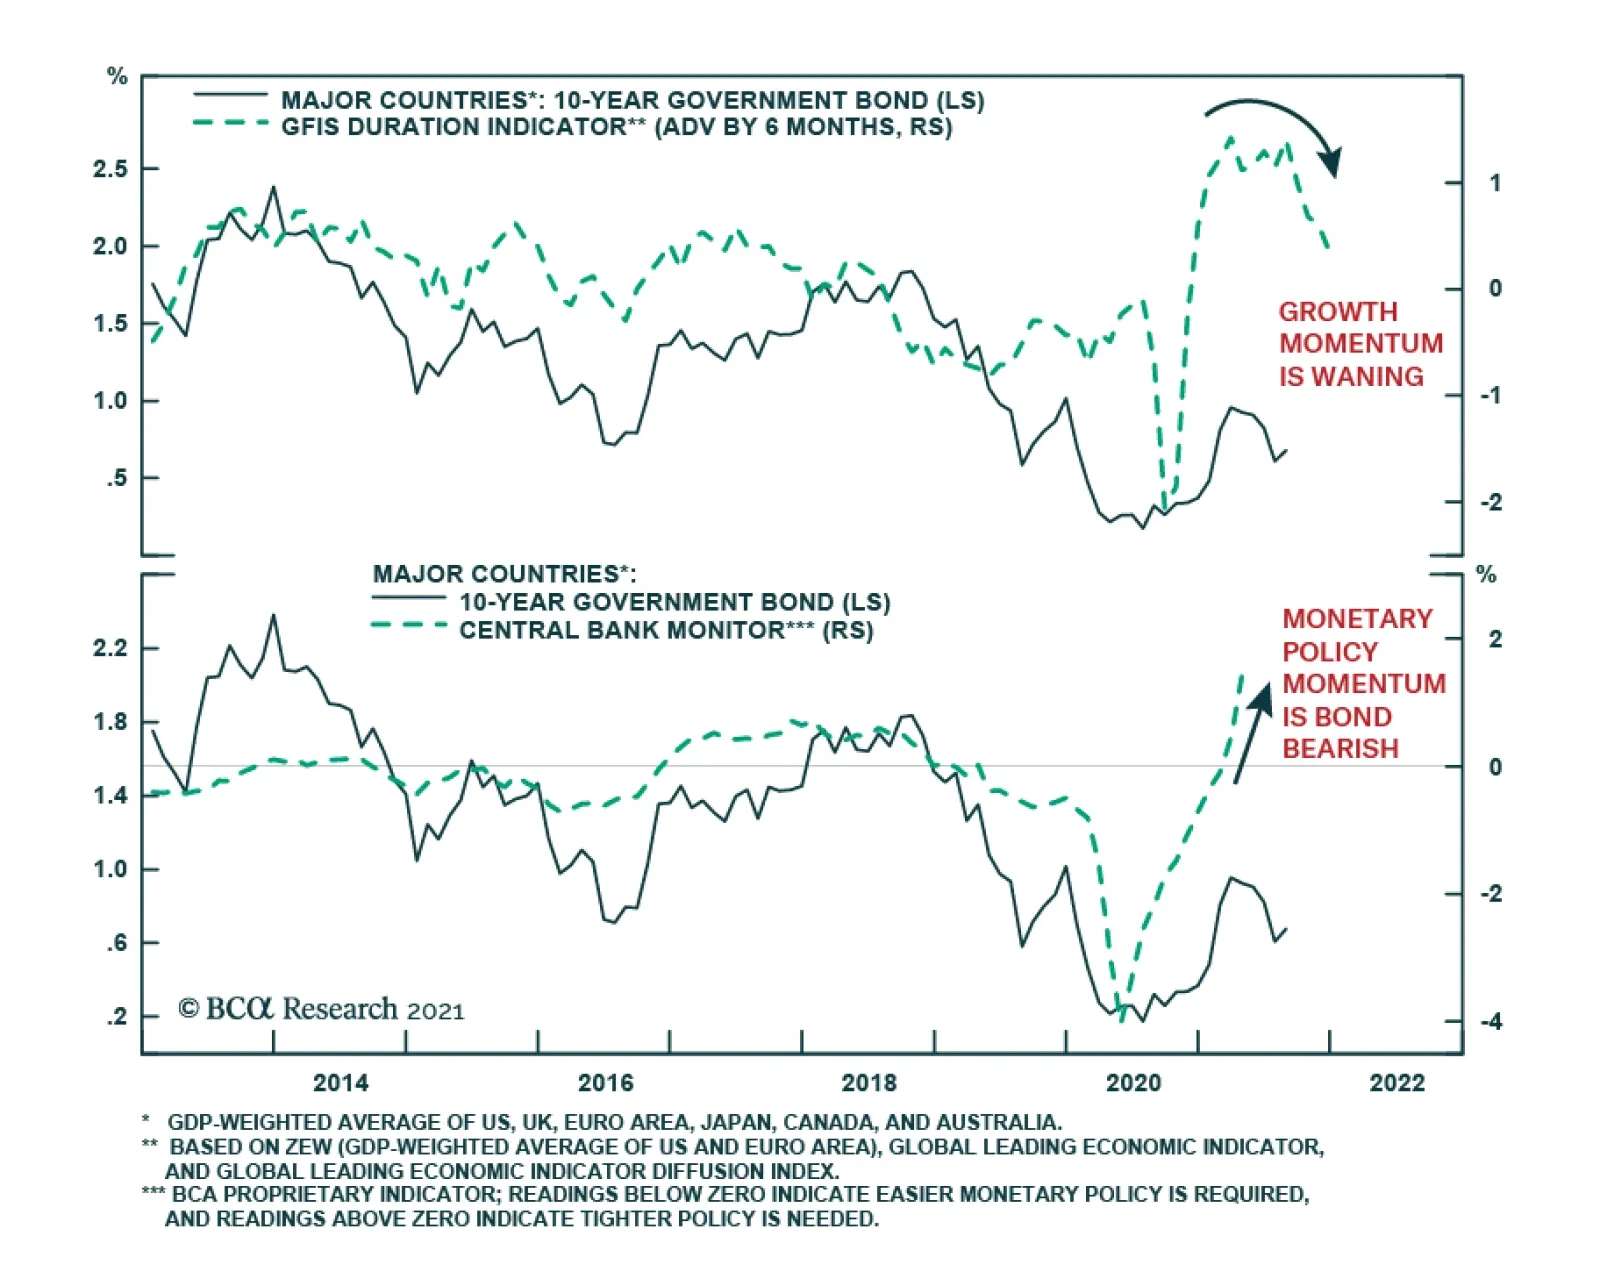
Our Global Fixed Income team’s Duration Indicator suggests that slowing growth momentum will continue weighing down on government bond yields. However, major economies are likely to continue growing at an above-trend pace and central banks are starting to…