Global

Highlights The U.S. dollar is likely to correct further over the coming weeks. The CAD should benefit as it is cheap and oversold, and the inflationary back-drop warrants tighter monetary conditions. This will be a bear market rally, not the ultimate trough for the loonie. EUR/SEK should correct as the Riksbank will start tightening policy in December; a pause in the global growth slowdown should also give the cheap SEK a welcome boost. Cheap long-term valuations will not help the yen in the coming weeks; instead, falling Japanese inflation expectations and growing investor expectations of Chinese stimulus will weigh on the JPY. A better opportunity to buy the yen on its crosses will emerge later this year. EUR/CHF has upside over the coming months; the swissie needs additional global growth weakness to rally further. This is unlikely to happen for a few months. Feature Chart I-1DXY Correction Has Further To Run
DXY Correction Has Further To Run
DXY Correction Has Further To Run
By the middle of the summer, the dollar had hit massively overbought levels, which left it vulnerable to any signs of stabilization in global growth, especially if some key U.S. activity gauges began to soften (Chart I-1). This is exactly what is transpiring. As we highlighted last week, BCA's Global LEI Diffusion Index is rebounding, EM and Japanese exports are stabilizing and U.S. core inflation and building permits have disappointed. This bifurcation in the data suggests the dollar has more room to correct, as neither our Capitulation Index nor our Intermediate-Term Technical Indicator have hit technically oversold levels. Last week we also argued that this correction in the dollar is likely to prove a temporary reprieve, but that in the interim the euro and the Australian dollar were well placed to experience significant rebounds.1 This week, we explore if the same case can be built for the Canadian dollar, the Swedish krona, the yen and the Swiss Franc. CAD: The Bank of Canada Will Proceed Cautiously The first half of 2018 has not been kind to the Canadian dollar. A rout in EM assets, signs of softening global growth and tough rhetoric from the White House on trade generally and NAFTA and Canada in particular have conspired to create fertile grounds for loonie-selling. Since the end of June, the CAD has managed to regain some composure, rallying by 3.3% against the USD. Essentially, much bad news has been embedded in this currency, which now trades at a significant discount to BCA's estimate of its short-term fair value (Chart I-2). Moreover, speculators, who had been aggressively buying the CAD at the end of 2017, now hold large short positions in the currency (Chart I-2, bottom panel). This combination is now resulting in a situation where any pause in the USD's strength is being mirrored in CAD strength. Can this rebound continue? Canadian economic data sends a murky message. Canadian real GDP growth had overtaken that of the U.S., peaking at 3.6% in February last year. However, it is now below U.S. growth (Chart I-3). Canadian consumers have been the main source of the slowdown as Canadian capex growth is in line with the U.S. and the Trudeau government has been spending generously. Can this rebound continue? Canadian economic data sends a murky message. Canadian real GDP growth had overtaken that of the U.S., peaking at 3.6% in February last year. However, it is now below U.S. growth (Chart I-3). Canadian consumers have been the main source of the slowdown as Canadian capex growth is in line with the U.S. and the Trudeau government has been spending generously. Chart I-2No One Is Going Crazy For The Loonie
No One Is Going Crazy For The Loonie
No One Is Going Crazy For The Loonie
Chart I-3Canada: Growth Picture Is Mixed
Canada: Growth Picture Is Mixed
Canada: Growth Picture Is Mixed
The weakness in Canadian consumption partly reflects the underperformance of Canadian employment relative to the U.S. However, the slowdown in house prices has played a bigger role (Chart I-4). Canadian households are burdened by a debt load of 170% of disposable income. Now that mortgage rates are rising, Canadians are spending more than 14% of their disposable income servicing their debt, a burden last experienced in 2008 when mortgage rates were 220 basis points higher. Without the benefit of rapidly rising real estate assets, it is much more difficult for Canadian retail sales to grow at an 8.7% annual rate as they did three quarters ago. Despite these weaknesses, it is hard to justify that Canadian monetary conditions - as approximated by the slope of the yield curve, the level of real rates, and the trade-weighted CAD - should be as easy as they are today (Chart I-5). This is even truer when we take into account Canadian inflationary conditions. Chart I-4Canadian Consumers Have A Problem
Canadian Consumers Have A Problem
Canadian Consumers Have A Problem
Chart I-5Canadian Monetary Conditons Are Very Easy
Canadian Monetary Conditons Are Very Easy
Canadian Monetary Conditons Are Very Easy
The three inflation gauges targeted by the Bank of Canada stand between 1% and 3%, or at its objective. This means that the BoC's 1.5% policy rate is negative in real terms. Moreover, this inflationary pressure is unlikely to abate. The BoC estimates that the output gap has closed, and companies are running into growing capacity constraints (Chart I-6, top panel). Despite a correction last month, wages are in an uptrend, powered by growing and severe labor shortages (Chart I-6, bottom panel). Thanks to these conditions, we anticipate that the BoC will track the pace of rate increases by the Federal Reserve over the next 12 months. This is not very different from what is currently priced into Canadian money markets. Chart I-6Canadian Capacity Pressures Point To A Hawkish ##br##BoC Inflation Will Force The BoC's Hand
Canadian Capacity Pressures Point To A Hawkish BoC Inflation Will Force The BoC's Hand
Canadian Capacity Pressures Point To A Hawkish BoC Inflation Will Force The BoC's Hand
If the BoC does not disappoint, the combination of a cheap and oversold CAD should help the loonie rally against the USD, so long as the current stabilization in global growth continues. A move toward USD/CAD 1.26 is likely. The biggest risk to this view is that trade negotiations between the U.S. and Canada deteriorate further. While we do not anticipate an imminent breakthrough in these negotiations, we do not see much scope for significant deterioration in the relationship either. The energy market could prove to be another positive for the loonie. Bob Ryan, who leads BCA's Commodity and Energy Strategy service, argues that the oil market is currently very tight and vulnerable to supply disruptions.2 Under these circumstances, the removal of Iranian exports, tensions in Iraq, declining Nigerian production and Venezuela's cascading implosion all risk causing a melt-up in oil prices by the first half of 2019. This could help the CAD as well, even if the Canadian oil benchmark remains at a large discount to Brent. Longer-term, the upside in the CAD is likely to be capped. There is only one rate hike priced into the U.S. OIS curve from June 2019 to December 2020. We expect the Fed to hike rates by more than that. Meanwhile, the emerging softness in the Canadian household sector suggests it will be much more difficult for the BoC to keep following the Fed higher over that period. The CAD is not cheap enough to compensate for these long-term headwinds (Chart I-7). Bottom Line: On a short-term basis, the Canadian dollar is cheap and oversold. While the Canadian consumer has begun to disappoint, the inflationary pressures present in Canada should keep the BoC on track to follow the Fed and push rates higher over the coming 12 months. The CAD should therefore benefit from any USD weakness, with USD/CAD moving toward 1.26. Once the short-term undervaluation and oversold conditions are corrected, USD/CAD should rebound toward 1.40. Chart I-7We Like The CAD For Now, But The Rally Has A Limited Shelf Life
We Like The CAD For Now, But The Rally Has A Limited Shelf Life
We Like The CAD For Now, But The Rally Has A Limited Shelf Life
EUR/SEK Will Trade Heavy Any which way we cut it, the SEK is cheap. The trade-weighted krona is trading at its cheapest levels relative to BCA's long-term fair value since the Great Financial Crisis (Chart I-8). The SEK is not only trading at a 32% discount to its purchasing-power parity against the greenback, it is also trading at a 10% discount against its PPP relative to the euro. Chart I-8The SEK Is An Attractive Long-Term Buy...
The SEK Is An Attractive Long-Term Buy...
The SEK Is An Attractive Long-Term Buy...
The SEK is not only cheap on a long-term basis, it is also cheap on a short-term basis. This is most evident against the euro. Currently the SEK trades at a 7% discount to the euro according to our short term fair value model based on real rate differentials, commodity prices and global risk aversion. Historically, this kind of discount in the SEK has been followed by a prompt rebound (Chart I-9). Are there any catalysts to convert this good value into good returns? We see many. First, as was the case in Canada, Sweden's Monetary Gauge has not been at such easy levels since the Great Financial Crisis (Chart I-10). Meanwhile, the economy is also experiencing rising capacity pressures. The OECD's estimate of the output gap stands at 0.7% of GDP, and inflationary pressures are building, as evidenced by the Riksbank's Capacity Utilization measure (Chart I-11). Chart I-9...And A Short-Term One As Well
...And A Short-Term One As Well
...And A Short-Term One As Well
Chart I-10The Riksbank Is Too Easy
The Riksbank Is Too Easy
The Riksbank Is Too Easy
Chart I-11Swedish Inflation Has Upside
Swedish Inflation Has Upside
Swedish Inflation Has Upside
This set of circumstances suggests the Riksbank could start hiking rates as early as this coming December, well ahead of the European Central Bank. As a result, we project that Swedish real interest rates could rise further relative to the euro area. Historically, falling euro area / Swedish real interest rate spreads precede depreciations in EUR/SEK (Chart I-12). Chart I-12Real Rate Differentials Point To A Lower EUR/SEK
EUR/SEK AND REAL INTEREST RATE SPREAD*: EMU-SWEDEN FX.EURSEKTHEME Real Rate Differentials Point To A Lower EUR/SEK
EUR/SEK AND REAL INTEREST RATE SPREAD*: EMU-SWEDEN FX.EURSEKTHEME Real Rate Differentials Point To A Lower EUR/SEK
Chart I-13Chinese Liquidity Injections Point To A Lower EUR/SEK
Chinese Liquidity Injections Point To A Lower EUR/SEK
Chinese Liquidity Injections Point To A Lower EUR/SEK
The global context also points toward an imminent correction in EUR/SEK. The krona is much more pro-cyclical than the euro. This reflects the more volatile nature of the Swedish economy and the extraordinarily large role of trade in its GDP. EUR/SEK greatly benefited from the tightening in Chinese liquidity conditions, as evidenced by the widening between the 1-month and 1-week Chinese interbank rate (Chart I-13). EUR/SEK essentially sniffed out a slowdown in Chinese capex, a key source of ultimate demand for Swedish goods. However, now that the PBoC is injecting liquidity in the Chinese interbank system, EUR/SEK is likely to suffer. Moreover, the outperformance of Chinese infrastructure and real estate stocks in recent weeks also suggests the SEK could appreciate further against the EUR. The rally of risk assets on the day that U.S. President Donald Trump announced an additional 10% tariff on US$200 billion worth of Chinese exports further confirms that investors may be in the process of discounting additional stimulus out of China, which would further hurt EUR/SEK. To be clear, we have already noted that we do not anticipate the Chinese authorities to attempt to boost growth - we only expect them to limit the damage created by an intensifying trade war with the U.S. As a result, the positive impact of China on the krona should prove transitory. But for the time being, it could be enough to help correct the SEK's 7% discount to the euro. Since we anticipate the USD to continue to correct in the coming weeks, this also implies that USD/SEK possesses ample tactical downside. This negative EUR/SEK view is not without risks. The first comes from the fact that the Swedish current account surplus is now smaller than the euro area's, something not seen since the early 1990s. This is mitigated by the fact that Sweden's net international investment position is now 10% of GDP, while it used to be negative as recently as 2015. The euro area NIIP is still in negative territory. The second risk is that Swedish house prices have begun to contract in response to macroprudential measures. However, we believe that Sweden's inflationary backdrop is likely to dominate the Riksbank's reaction function. Bottom Line: The SEK is cheap against the dollar and the euro on both long-term and short-term metrics. As the Riksbank is set to lift rates in December, we expect EUR/SEK to decline significantly. Recent injections of liquidity by the PBoC and growing expectations among investors of Chinese stimulus could create additional downward impetus under both EUR/SEK and USD/SEK. This is a tactical view. We anticipate the reprieve in the global growth slowdown to be temporary. Once it resumes, the SEK will find it difficult to rally further. JPY: Down Now, Up Later Investors are well aware that the yen is one of the cheapest G10 currencies on a long-term basis. BCA's long-term fair value model shows that the real trade-weighted yen is trading at a 17% discount, close to its cheapest levels in 36 years. However, despite its prodigious long-term cheapness, the yen is not nearly as attractive when compared to its short-term determinants, which show a small premium in the price of the yen versus the dollar (Chart I-14). This means the direction of Japanese monetary policy and global growth will remain more important for the yen's price action over the coming months than its long-term cheapness. When it comes to growth, Japan is doing okay. We witnessed a decline in industrial production driven by foreign demand this summer, but domestic machinery orders are improving and export growth is finding a floor. Actually, BCA's real GDP model for Japan is suggesting that growth could re-accelerate significantly next quarter (Chart I-15). In our view, this improvement reflects the fact that business credit is once again growing after decades of hibernation. Chart I-14Is The JPY A Bargain? Long Term, Yes; Short Term, No!
Is The JPY A Bargain? Long Term, Yes; Short Term, No!
Is The JPY A Bargain? Long Term, Yes; Short Term, No!
Chart I-15Japanese Growth Doing Just Fine
Japanese Growth Doing Just Fine
Japanese Growth Doing Just Fine
However, we doubt this is enough to prompt any tightening in the Bank of Japan's policy. The most immediate problem facing the BoJ is that Japanese inflation expectations are in free fall (Chart I-16). Since the BoJ assigns the blame of low realized inflation on depressed inflation expectations, this aforementioned weakness, despite the yen's softness, guarantees that the BoJ will stay on the sidelines for much longer. After all, if any little shock can spur such a sharp impact on Japanese inflation expectations, despite an unemployment rate at 2.5% and an output gap at 0.8% of GDP, the BoJ has not anchored inflation expectations higher. Further reinforcing our bias that the BoJ is not set to tighten policy for many more quarters, the VAT is set to be increased to 10% in October 2019. The LDP leadership race is currently underway, and no one is mentioning postponing that hike. This suggests that significant fiscal tightening could emerge next year. The fact that the BoJ will continue to lag behind other global central banks forces us to be negative on the yen. However, could an external event push the yen higher, despite this absence of domestic support? A big downgrade in EM asset prices and global growth would do the trick. While we do think this is likely to happen over the next six to nine months, now does not appear to be the moment to implement such a bet. As we highlighted above, the deceleration in global growth seems to be pausing, and Chinese liquidity conditions have eased. Seven weeks ago, we introduced our China Play Index to track whether or not investors were discounting additional easing on the part of China.3 This indicator looks as if it is forming a base right now (Chart I-17), indicating that pro-growth plays could perform well over the coming weeks while countercyclical plays, like the yen, could perform poorly. Until this indicator begins a new down leg - something we anticipate for the backend of the year - the yen will remain under downward pressure against the dollar, the euro or the aussie. Chart I-16The BoJ's Problem
The BoJ's Problem
The BoJ's Problem
Chart I-17Chinese Plays Are Stabilizing
Chinese Plays Are Stabilizing
Chinese Plays Are Stabilizing
As a result, while we continue to expect more upside in the yen in the latter part of the year, for the time being we will remain on the sidelines as neither short-term valuations, monetary policy dynamics or the global growth environment point to an imminent rally in the yen. Bottom Line: The yen is an attractive long-term play as it displays prodigiously cheap long-term valuations. However, the short-term outlook is less favorable. The yen is not cheap enough based on our augmented interest rate differentials models, the BoJ will remain dovish for the foreseeable future, and an uptick in our China Play Index bodes poorly for countercyclical currencies like the yen. However, since we do expect that global growth will stabilize only on a temporary basis, we will look to open some long yen bets later this fall. Close Short EUR/CHF Trade Last March, we argued that EUR/CHF had more cyclical upside, but that bouts of volatility in global markets would cause periods of weaknesses in the cross.4 Based on this insight, we proceeded to sell EUR/CHF on April 6 as we worried that markets were set to price in a period of weakness in global growth.5 We closed this trade in August, but EUR/CHF kept falling. Now, is EUR/CHF more likely to rally or selloff in the coming quarter? We think a rebound is in the cards. First, the franc is once again highly valued, based on the Swiss National Bank's assessment. It is true that the SNB has not intervened to limit the franc's upside recently, but the CHF's strength is likely to short-circuit the increase in inflation that could have justified betting on the Swissie moving higher (Chart I-18). Ultimately, there is limited domestic inflationary pressures in Switzerland. Moreover, since the import penetration of goods and services in Switzerland is the highest of all the G10, imported deflation will soon be felt. Further, as Swiss labor costs remain very high internationally, the large improvement in full-time jobs witnessed this year is likely to peter off as Swiss businesses work to maintain their competitiveness. Second, the franc received an additional fillip this year as the breakup risk premium in Europe surged (Chart I-19). Every time investors perceive that the probability of a disintegration of the euro rises, they end up pouring money into stable Switzerland. Marko Papic, BCA's Geopolitical Strategy expert, believes that the euro break-up risk will continue to be a red herring in the coming few years. Investors will therefore price out this risk, pulling money out of Switzerland where interest rates remain 30 basis points below the euro area, and boosting EUR/CHF in the process. Chart I-18The Swissie's Strength Will Be Deflationary
The Swissie's Strength Will Be Deflationary
The Swissie's Strength Will Be Deflationary
Chart I-19If A Euro Break-Up Is A Red Herring...
If A Euro Break-Up Is A Red Herring...
If A Euro Break-Up Is A Red Herring...
Finally, if a temporary stabilization in global growth will hurt the yen, it will also hurt the Swiss franc. As a result, the stabilization in the China Play Index should support EUR/CHF. While we expect EUR/CHF to rally over the coming months, we worry that any such rebound will prove temporary. The current expansion in Chinese stimulus is only a passing phenomenon, and not one powerful enough to put a durable bottom under global growth and EM assets. Hence, while EUR/CHF could easily rally to 1.15, any such rebound should be faded. This move, if followed by a deterioration in our China Play Index, should be used to re-open EUR/CHF shorts. Bottom Line: The Swiss franc remains in a cyclical bear market, punctuated by occasional rallies against the euro when global growth sentiment sours. We just experienced such a rally in the Swissie, but it is ending as the deflationary impact of the CHF's rally will soon be felt. Moreover, the breakup risk premium in the euro is currently too large, and the pricing-in of slowing global growth is likely to take a breather. As a result, EUR/CHF is likely rally over the coming months. We will look to bet again on a CHF rally once the reprieve in global growth ends. Mathieu Savary, Vice President Foreign Exchange Strategy mathieu@bcaresearch.com 1 Please see Foreign Exchange Strategy Weekly Report, titled "Policy Divergence Are Still The Name Of The Game", dated September 14, 2018, available at fes.bcaresearch.com 2 Please see Commodity & Energy Strategy Weekly Report, titled "Odds Of Oil-Price Spike In 1H19 Rise; 2019 Brent Forecast Lifted $15 To $95/bbl", dated September 20, 2018, available at ces.bcaresearch.com 3 Please see Foreign Exchange Strategy Weekly Report, titled "The Dollar And Risk Assets Are Beholden To China's Stimulus", dated August 3, 2018, available at fes.bcaresearch.com Currencies U.S. Dollar Chart II-1USD Technicals 1
USD Technicals 1
USD Technicals 1
Chart II-2USD Technicals 2
USD Technicals 2
USD Technicals 2
Recent data in the U.S. has been mixed: Retail sales and retail sales ex autos yearly growth underperformed expectations, coming in at 0.1% and 0.3% respectively. Capacity utilization and building permits also surprised to the downside, coming in at 78.1% and 1.229 million respectively. However, Housing starts and the Michigan Consumer Sentiment Index surprised positively, coming in at 9.2% and 100.8 respectively. DXY has fallen by nearly 1% this week. Overall, we continue to be bullish on the dollar on a cyclical basis, as inflationary pressures inside the U.S. will force the Fed to hike more than the market expects. That being said, the slowdown in the dollar's momentum, the growing Chinese stimulus, and accumulating signs of stabilizing global economic activity are likely to further weigh on the dollar on a more immediate basis. We will monitor these factors closely in order to gauge whether or not this pullback will remain a garden-variety correction or something more serious. Report Links: Policy Divergences Are Still The Name Of The Game - August 14, 2018 The Dollar And Risk Assets Are Beholden To China's Stimulus - August 3, 2018 Rhetoric Is Not Always Policy - July 27, 2018 The Euro Chart II-3EUR Technicals 1
EUR Technicals 1
EUR Technicals 1
Chart II-4EUR Technicals 2
EUR Technicals 2
EUR Technicals 2
Recent data in the euro area has been positive: Labor costs growth outperformed expectations, coming in at 2.2%. Moreover, construction output yearly growth also surprised positively, coming in at 2.6%. Finally, both core and headline inflation came in line with expectations, at 1% and 2% respectively. EUR/USD has rallied by 1.1% this week We are bearish on the cyclical outlook for the euro, given that core inflation measures are continue to be too weak for the ECB to meaningfully change their dovish monetary policy stance. However, the current tactical rebound is likely to continue, as the weakness in the euro this year has eased financial conditions, which could lead to a temporary boon for the economy. Report Links: Policy Divergences Are Still The Name Of The Game - August 14, 2018 Time To Pause And Breathe - July 6, 2018 What Is Good For China Doesn't Always Help The World - June 29, 2018 The Yen Chart II-5JPY Technicals 1
JPY Technicals 1
JPY Technicals 1
Chart II-6JPY Technicals 2
JPY Technicals 2
JPY Technicals 2
Recent data in Japan has been mixed: Industrial production yearly growth surprised negatively, coming in at 2.2%. Moreover, capacity utilization also underperformed expectations, coming in at -0.6%. Finally, both export and import yearly growth outperformed expectations, coming in at 6.6% and 15.4% respectively. USD/JPY has been relatively flat this week. We are bearish on the yen on a structural basis, given that the economy continues to suffer from strong deflationary forces, which will force the Bank of Japan to keep their ultra-easy monetary policy. Report Links: Rhetoric Is Not Always Policy - July 27, 2018 Updating Our Long-Term FX Fair Value Models - June 22, 2018 Rome Is Burning: Is It The End? - June 1, 2018 British Pound Chart II-7GBP Technicals 1
GBP Technicals 1
GBP Technicals 1
Chart II-8GBP Technicals 2
GBP Technicals 2
GBP Technicals 2
Recent data in the U.K. has been positive: The retail price index yearly growth surprised to the upside, coming in at 3.5%. Moreover, both core and headline inflation outperformed expectations, coming in at 2.1% and 2.7% respectively. Finally, the DCLG House Price Index also surprised positively, coming in at 3.1%. GBP/USD has rallied by roughly 1.5% this week. The GBP's vol is likely to increase further going foirward, as very little political risks is priced into it. A practical strategy will be to lean against large weekly moves, both on the upside and downside. This strategy should be particularly profitable versus the euro. Report Links: Updating Our Long-Term FX Fair Value Models - June 22, 2018 Inflation Is In The Price - June 15, 2018 Updating Our Intermediate Timing Models - May 18, 2018 Australian Dollar Chart II-9AUD Technicals 1
AUD Technicals 1
AUD Technicals 1
Chart II-10AUD Technicals 2
AUD Technicals 2
AUD Technicals 2
Recent data in Australia has been positive: The participation rate surprised to the upside, coming in at 65.7%. Moreover, the total change in employment also outperformed expectations, coming in at 44 thousand. Finally, the house price index yearly growth also surprised positively, coming in at -0.6%. AUD/USD has risen by roughly 1.8% this week. We continue to be cyclically bearish on the Australian dollar, as the deleveraging campaign in China will weigh on demand for industrial metals, Australia's main export. Moreover, the AUD will also have downside against the CAD, as oil should continue to hold up relative to other commodities thanks to supply cuts from OPEC. That being said, the AUD's recent rebound is likely to continue on a short-term basis. Hence, investors already shorting the Aussie should consider buying hedges. Report Links: Policy Divergences Are Still The Name Of The Game - August 14, 2018 What Is Good For China Doesn't Always Help The World - June 29, 2018 Updating Our Long-Term FX Fair Value Models - June 22, 2018 New Zealand Dollar Chart II-11NZD Technicals 1
NZD Technicals 1
NZD Technicals 1
Chart II-12NZD Technicals 2
NZD Technicals 2
NZD Technicals 2
NZD/USD has rallied nearly 1.9% this week. We are negative on the New Zealand dollar on a structural basis due to the measures taken by the Ardern government, which include reducing immigration, and adopting_a dual mandate for the RBNZ. Both of these measures will weigh on the real neutral rate, which means that the RBNZ will have to hold rates lower than otherwise. However, on a more tactical basis, this cross could rally, thanks to the temporary stimulus by the Chinese authorities which will help risk assets. Report Links: Updating Our Long-Term FX Fair Value Models - June 22, 2018 Updating Our Intermediate Timing Models - May 18, 2018 Value Strategies In FX Markets: Putting PPP To The Test - May 11, 2018 Canadian Dollar Chart II-13CAD Technicals 1
CAD Technicals 1
CAD Technicals 1
Chart II-14CAD Technicals 2
CAD Technicals 2
CAD Technicals 2
Recent data in Canada has been mixed: Manufacturing shipments monthly growth outperformed expectations, coming in at 0.9%. However, capacity utilization surprised to the downside, coming in at 85.5%. Finally, the new house price index yearly growth was in line with expectations, coming in at 0.5% USD/CAD has depreciated by 1% this week. We remain bullish on the CAD among the dollar bloc currencies, given that inflationary pressures continue to be strong in Canada. Report Links: Updating Our Long-Term FX Fair Value Models - June 22, 2018 Inflation Is In The Price - June 15, 2018 Rome Is Burning: Is It The End? - June 1, 2018 Swiss Franc Chart II-15CHF Technicals 1
CHF Technicals 1
CHF Technicals 1
Chart II-16CHF Technicals 2
CHF Technicals 2
CHF Technicals 2
EUR/CHF has rallied by 0.5% this week. We continue to be bullish on this cross on a cyclical basis, as the Swiss economy is still too fragile for the SNB to remove its ultra-dovish monetary stance. Moreover, the recent appreciation in the franc that has taken place over the last four months should be very negative for inflation, as Switzerland is the country with the most imports as a percentage of demand in the G10, and thus the country with the most sensitive inflation to currency movements. Finally, on a tactical basis we are also bullish on this cross, as the recent easing of monetary policy by Chinese authorities should be weigh on safe heaven assets like the franc. Report Links: Updating Our Long-Term FX Fair Value Models - June 22, 2018 Updating Our Intermediate Timing Models - May 18, 2018 Value Strategies In FX Markets: Putting PPP To The Test - May 11, 2018 Norwegian Krone Chart II-17NOK Technicals 1
NOK Technicals 1
NOK Technicals 1
Chart II-18NOK Technicals 2
NOK Technicals 2
NOK Technicals 2
Yesterday, Norges Bank increased rates for the first time since 2011, yet the NOK was flat against a weak USD, and fell against the euro and the Swedish krona, suggesting that the hike was well anticipated by market participants. Despite this price action, USD/NOK has depreciated by 1.2% this week. We are positive on the NOK against other non-oil commodity currencies, as oil should outperform base metals in the current environment. After all, OPEC supply cuts and geopolitical risk in the Middle East should provide a boon for oil prices. On the other hand, while temporary easing is likely, the Chinese deleveraging campaign will continue once the Chinese economy has stabilized. Finally, the positive NIIP, and positive current account of the NOK should give it an additional advantage against the rest of the commodity currencies. Report Links: Updating Our Long-Term FX Fair Value Models - June 22, 2018 Updating Our Intermediate Timing Models - May 18, 2018 Value Strategies In FX Markets: Putting PPP To The Test - May 11, 2018 Swedish Krona Chart II-19SEK Technicals 1
SEK Technicals 1
SEK Technicals 1
Chart II-20SEK Technicals 2
SEK Technicals 2
SEK Technicals 2
Recent data in Sweden has been negative: Headline inflation underperformed expectations, coming in at 2%. Moreover, the unemployment rate increased from 6% in July to 6.1% on the August reading. USD/SEK has depreciated by almost 2.8% this week. We expect the Riksbank to begin tightening policy in December, as Swedish inflationary pressures remain strong. Moreover, the recent stimulus from the PBoC should put additional downward pressure on EUR/SEK, given the krona's more pro-cyclical profile than the euro. Finally, valuations also support the SEK, as the krona is cheap according to multiple measures. Report Links: Updating Our Long-Term FX Fair Value Models - June 22, 2018 Updating Our Intermediate Timing Models - May 18, 2018 Value Strategies In FX Markets: Putting PPP To The Test - May 11, 2018 Trades & Forecasts Forecast Summary Core Portfolio Tactical Trades Closed Trades
Highlights In this Weekly Report, we present our semi-annual chartbook of the BCA Central Bank Monitors. The message now conveyed by the Monitors is that divergences between the cyclical pressures faced by the individual central banks are growing larger. This is occurring within some countries, where the growth and inflation indicators are trending in opposite directions. This is also visible across countries, with not every Monitor calling for rate hikes - a significant shift from the coordinated backdrop seen in 2017 (Chart of the Week). Chart of the WeekFrom Convergence To Divergence In The BCA Central Bank Monitors
From Convergence To Divergence In the BCA Central Bank Monitors
From Convergence To Divergence In the BCA Central Bank Monitors
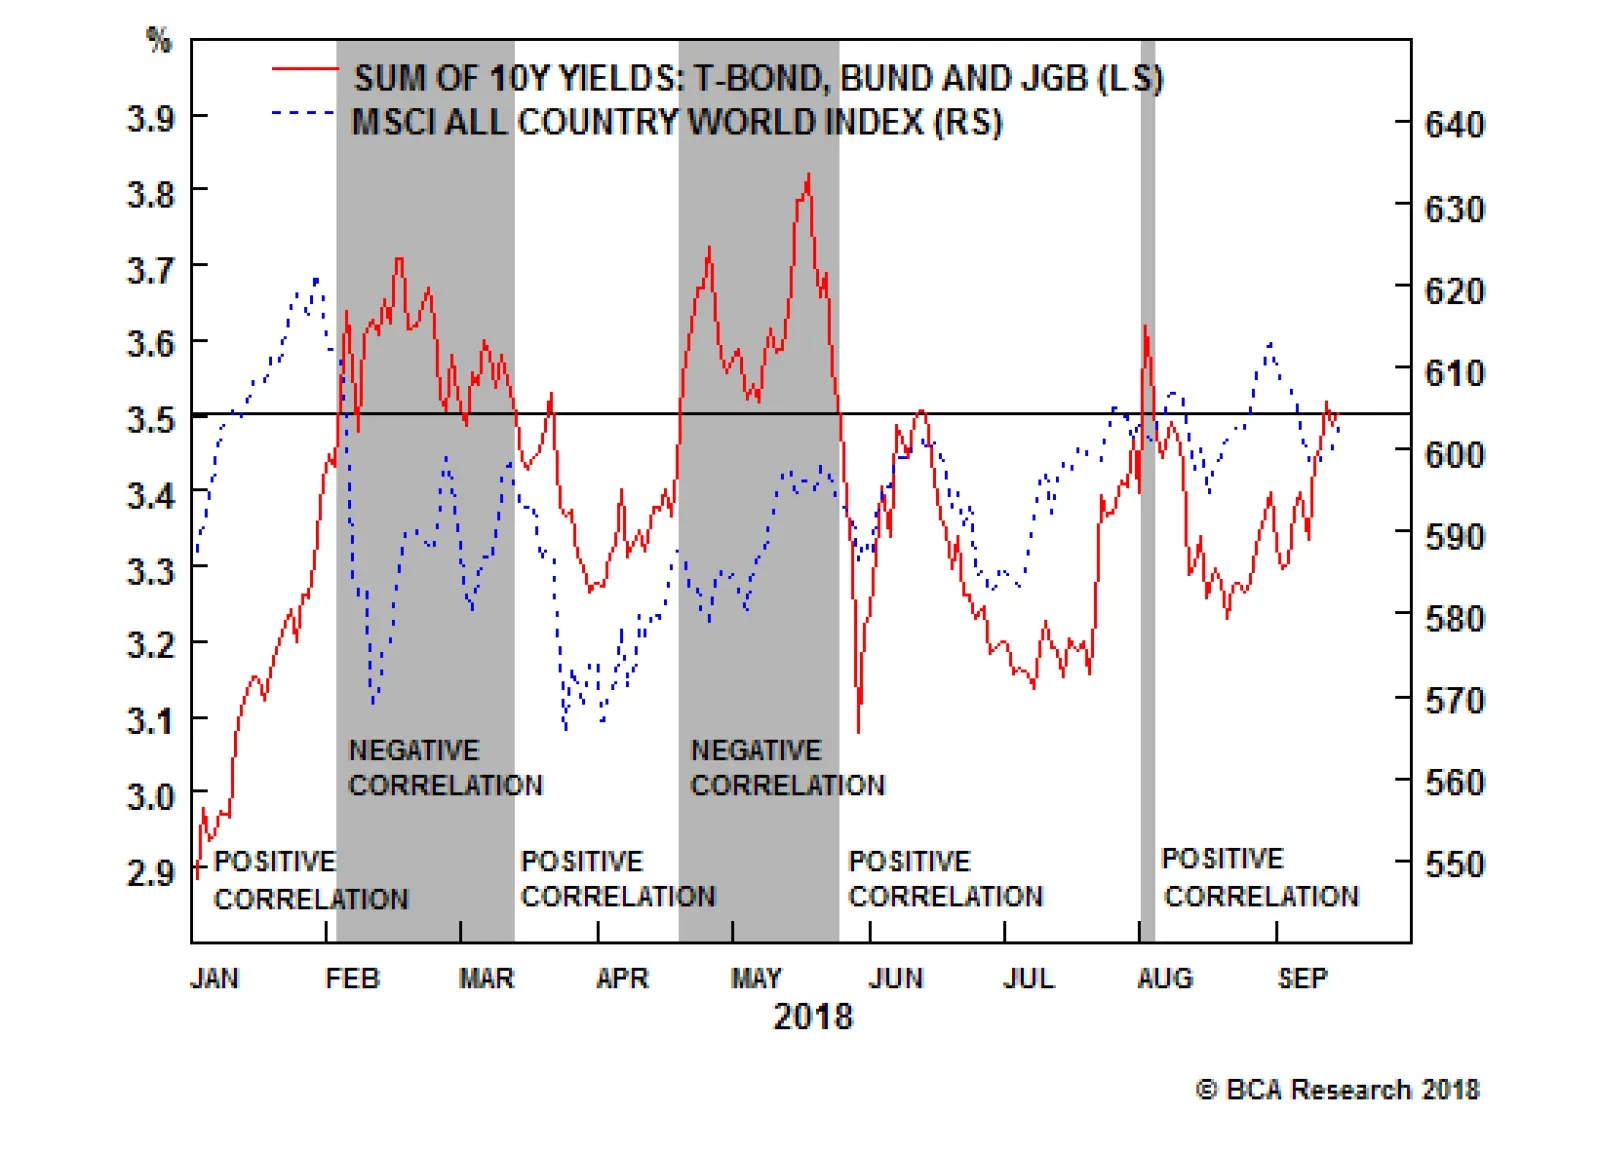
The combined message from the Monitors is that the slower pace of global growth seen in 2018 has not been enough put a serious dent in inflation pressures stemming from a dearth of spare capacity in most major countries. Perhaps that changes if a full-blown U.S.-China trade war develops, or if the tensions in emerging markets spill over more broadly into global financial conditions, but that remains to be seen. Add it all up, and a below-benchmark stance on overall global duration exposure remains appropriate. Feature An Overview Of The BCA Central Bank Monitors Chart 2CB Monitor Divergence = Bond Yield Divergence
CB Monitor Divergence = Bond Yield Divergence
CB Monitor Divergence = Bond Yield Divergence
The BCA Central Bank Monitors are composite indicators designed to measure the cyclical growth and inflation pressures that can influence future monetary policy decisions. The economic data series used to construct the Monitors are not the same for every country, but the list of indicators generally measure the same things (i.e. manufacturing cycles, domestic demand strength, commodity prices, labor market conditions, exchange rates, etc). The data series are standardized and combined to form the Monitors. Readings above the zero line for each Monitor indicate pressures for central banks to raise interest rates, and vice versa. Through the nexus between growth, inflation, and market expectations of future interest rate changes, the Monitors do exhibit broad correlations to government bond yields in the Developed Markets (Chart 2). Our current recommended country allocation for global government bonds reflects the trends seen in the Central Bank Monitors - underweighting countries were the Monitors are most elevated (the U.S., Canada) in favor of regions where the Monitors are lower (Australia, Japan, euro area, New Zealand). In each BCA Central Bank Monitor Chartbook, we include a new chart for each country that we have not shown previously. In this edition, we show the Monitors plotted against the relative returns for each country versus the overall Bloomberg Barclays Global Treasury index (shown inversely in the charts so that a rising line means underperformance versus the benchmark index). Fed Monitor: Still On A Gradual Rate Hike Path Our Fed Monitor remains in the "tight money required" zone, signalling that the cyclical backdrop justifies additional Fed rate hikes (Chart 3A). Resilient U.S. growth, a dearth of spare capacity and an acceleration of both wage growth and core inflation are all consistent with a U.S. economy starting to overheat and requiring tighter monetary policy (Chart 3B). Chart 3AU.S.: Fed Monitor
U.S.: Fed Monitor
U.S.: Fed Monitor
Chart 3BU.S. Inflation On The Rise
U.S. Inflation On The Rise
U.S. Inflation On The Rise
The growth and inflation components of the Fed Monitor have both accelerated since our last Central Bank Monitor Chartbook was published back in April. Most notably, the inflation component has blasted through the zero line to the highest level since 2008 (Chart 3C). The financial conditions component has retreated from very elevated (i.e. growth-supportive) levels, mostly due to the stronger U.S. dollar but also because of wider corporate credit spreads seen since the start of 2018. Importantly, the financial conditions component has not tightened enough to offset the impact on the Monitor from faster growth and inflation. Chart 3CAll Fed Monitor Components Now Above Zero
All Fed Monitor Components Now Above Zero
All Fed Monitor Components Now Above Zero
Recent comments from senior Fed officials (Chair Jay Powell and Governor Lael Brainard) have indicated that the Fed is less confident in its own estimates of the full-employment NAIRU or the appropriate neutral level of the funds rate. Our read on this is that the Fed will instead continue to raise the funds rate at a gradual 25bp per quarter pace until there are signs that U.S. monetary policy has become tight (i.e. an inverted yield curve, wider credit spreads, softer U.S. economic data). Until then, the message sent by the Fed Monitor is to remain underweight U.S. Treasuries with below-benchmark duration, as market pricing of expectations for both the funds rate and inflation remain too low (Chart 3D). Chart 3DU.S. Treasury Underperformance Will Continue - Stay Underweight
U.S. Treasury Underperformance Will Continue - Stay Underweight
U.S. Treasury Underperformance Will Continue - Stay Underweight
BoE Monitor: Brexit Uncertainty Trumps Inflation Pressures The BoE Monitor remains in the "tighter money required" zone as it has since late 2015 (Chart 4A). Despite that persistent signal, the BoE has kept monetary policy at highly accommodative levels, only raising the base rate 50bps over the past year. The BoE Monetary Policy Committee remains torn between signs that inflation risks are tilted to the upside and the downside risks to U.K. growth from an uncertain Brexit outcome. The U.K. unemployment rate is well below NAIRU with an output gap that is now estimated to be closed (Chart 4B). Yet realized inflation has peaked, with core inflation drifting back below 2%. Wages are finally starting to grow in real terms, which the BoE cites as an important factor underpinning consumer spending, but the pace remains modest. Chart 4AU.K.: BoE Monitor
U.K.: BoE Monitor
U.K.: BoE Monitor
Chart 4BNo Spare Capacity, Yet Has Inflation Peaked?
No Spare Capacity, Yet Has Inflation Peaked?
No Spare Capacity, Yet Has Inflation Peaked?
Looking at the breakdown of our BoE Monitor, both the growth and inflation sub-components of the indicator have recently reaccelerated (Chart 4C). Yet U.K. leading economic indicators continue to decline and dampened business confidence measures reflect the heightened uncertainty over the future relationship between the U.K. and the European Union. Chart 4CBoth Growth & Inflation Components Are Boosting The BoE Monitor
Both Growth & Inflation Components Are Boosting The BoE Monitor
Both Growth & Inflation Components Are Boosting The BoE Monitor
The performance of U.K. Gilts has diverged from the Monitor since the 2016 Brexit vote (Chart 4D), as the BoE has been more worried about Brexit than inflation and has stayed accommodative. Stay overweight U.K. Gilts within global government bond portfolios, even with the more bearish signal implied by our BoE Monitor, given the weakening trend in leading economic indicators and persistent Brexit uncertainty. Chart 4DBrexit Uncertainty Preventing More BoE Hikes - Stay Overweight Gilts
Brexit Uncertainty Preventing More BoE Hikes - Stay Overweight Gilts
Brexit Uncertainty Preventing More BoE Hikes - Stay Overweight Gilts
ECB Monitor: No Pressure To Hike Rates Quickly Post-QE Our European Central Bank (ECB) Monitor has fallen sharply since we last published this Chartbook back in April, and it now sits below the zero line (Chart 5A). The growth deceleration in the first half of the year from the rapid pace seen in 2017 is the main reason for this move, as inflation pressures have not subsided (Chart 5B). Chart 5AEuro Area: ECB Monitor
Euro Area: ECB Monitor
Euro Area: ECB Monitor
Chart 5BEuro Area At Full Capacity
Euro Area At Full Capacity
Euro Area At Full Capacity
ECB President Mario Draghi noted last week that the plan remains in place to end the net new buying phase of the ECB's Asset Purchase Program at the end of 2018. Policymakers' have grown more confident that their inflation forecasts will be met as most measures of euro area wage growth (and headline inflation) have accelerated to 2% over the past year. It remains to be seen if those expectations are too optimistic, as the growth component of our ECB Monitor remains well below the zero line, while the inflation component is no longer rising (Chart 5C). Chart 5CGrowth Component Dragging Down The ECB Monitor
Growth Component Dragging Down The ECB Monitor
Growth Component Dragging Down The ECB Monitor
For now, we recommend a neutral stance on core euro area government bonds with an underweight posture on Peripheral sovereign debt as a way to manage these conflicting trends. The overall performance of euro area bonds versus global benchmarks has followed the pace of the ECB's bond-buying since 2015, and not the pressures suggested by our ECB Monitor (Chart 5D), suggesting a bearish stance as the bond buying ends. Yet from a more bullish perspective, the mixed message on growth and lack of immediate pressures on core inflation (still at 1%) imply that the ECB will not deviate from its current dovish forward guidance of no interest rate hikes until at least September 2019. Chart 5DECB Will Not Hike Rates Quickly After QE Ends - Stay Neutral Core European Bonds
ECB Will Not Hike Rates Quickly After QE Ends - Stay Neutral Core European Bonds
ECB Will Not Hike Rates Quickly After QE Ends - Stay Neutral Core European Bonds
BoJ Monitor: Too Soon To Consider Policy Changes Our Bank of Japan (BoJ) Monitor has stayed just barely in the "tighter money required" zone since last October, due mostly to growing inflation pressures (Chart 6A). Yet with the Japanese labor market now as tight as it has been in decades, headline and core CPI inflation are only at 0.9% and 0.3% respectively, well below the BoJ's 2% target (Chart 6B). Chart 6AJapan: BoJ Monitor
Japan: BoJ Monitor
Japan: BoJ Monitor
Chart 6BInflation Pressures Slowly Building In Japan
Inflation Pressures Slowly Building In Japan
Inflation Pressures Slowly Building In Japan
Japanese firms appear to finally be reacting to the tightness of the labor market, however, as wage growth has accelerated in recent months. The pick-up in wages has helped boost inflation expectations, both of which are part of the inflation component of the BoJ Monitor that is now at the highest level since 2008 (Chart 6C). However, the growth component just rolled over and now sits at the zero line, as the Japanese economy has lost some momentum. Chart 6CInflation Boosting BoJ Monitor
Inflation Boosting BoJ Monitor
Inflation Boosting BoJ Monitor
We continue to recommend an overweight stance on JGBs, based on our view that the BoJ will maintain hyper-easy monetary policy settings - especially compared to the rest of the developed markets - until there is much higher realized inflation in Japan. JGBs have indeed been outperforming over the past year, even with the less dovish signal sent by the BoJ Monitor (Chart 6D). Yet the absolute level of the Monitor remains around zero, suggesting that no policy changes should be expected. That means no upward adjustment of the BoJ's 0% yield target on 10-year JGBs or major further reductions in the annual pace of BoJ JGB buying (even though the central bank is hitting capacity constraints as it now owns close to ½ of all outstanding JGBs). Chart 6DBoJ In No Hurry To Turn Hawkish - Stay Overweight JGBs
BoJ In No Hurry To Turn Hawkish - Stay Overweight JGBs
BoJ In No Hurry To Turn Hawkish - Stay Overweight JGBs
BoC Monitor: Rate Hikes - More To Come The Bank of Canada (BoC) Monitor has stayed in "tighter money required" since the beginning of 2017 and is now well above the zero line (Chart 7A). The BoC has been following our BoC Monitor, hiking rates by a cumulative 100bps since July 2017. Chart 7ACanada: BoC Monitor
Canada: BoC Monitor
Canada: BoC Monitor
Chart 7BAn Overheating Canadian Economy?
An Overheating Canadian Economy?
An Overheating Canadian Economy?
The BoC has been responding to the growing inflation pressure in Canada. There is no evidence that spare economic capacity exists, while realized inflation is near the upper bound of BoC's target range of 1-3% (Chart 7B). There is a growing divergence between the growth and inflation subcomponents of the BoC Monitor, with the latter decelerating over the past several months. That was due to a combination of slowing Chinese import demand and the imposition of trade tariffs on Canada by the Trump administration (Chart 7C). Yet the domestic economy remains in good shape, with the overall indicator from the BoC's Business Outlook Survey at the highest level since 2010. Chart 7CInflation Component Boosting BoC Monitor
Inflation Component Boosting BoC Monitor
Inflation Component Boosting BoC Monitor
We continue to recommend an underweight stance on Canadian government bonds, as the relative performance has broadly followed the path of the BoC Monitor over the past three years (Chart 7D). The BoC tends to follow the policy actions of the Fed with a short lag, thus our bearishness on Canadian government bonds is related to our more hawkish views on the Fed. Yet the surge in Canadian inflation, at a time when the economy has no spare capacity, suggests that there are good domestic reasons to expect more rate hikes from the BoC over the next year than what is currently discounted by markets. Chart 7DBoC Not Done Yet - Stay Underweight Canadian Bonds
BoC Not Done Yet - Stay Underweight Canadian Bonds
BoC Not Done Yet - Stay Underweight Canadian Bonds
RBA Monitor: Easier Policy Needed The Reserve Bank of Australia (RBA) monitor has rapidly fallen below the zero line for the first time since 2016, and now indicates that easier monetary policy is required (Chart 8A). This stands out from the more stable trajectory of the rest of the BCA Central Bank Monitors. Unlike most other developed countries, there is still excess capacity in the Australian economy. Australia's output gap has not closed while the current unemployment rate is just at the OECD's NAIRU estimate of 5.3%. Headline and core inflation are at the low end of the RBA's 2-3% target and struggling to gain much upward momentum (Chart 8B). Chart 8AAustralia: RBA Monitor
Australia: RBA Monitor
Australia: RBA Monitor
Chart 8BMinimal Inflation Pressure In Australia
Minimal Inflation Pressure In Australia
Minimal Inflation Pressure In Australia
While both the growth and inflation components of the RBA Monitor have fallen, the biggest decline has come from the inflation side (Chart 8C). The sluggishness of Australia's economy is due to the slow growth of consumer spending and a big deceleration in exports related to softer Chinese demand. On inflation, excess labor market slack, with an underemployment rate close to 8.5%, is the main factor explaining soft wage growth and overall sluggish inflation. Chart 8CInflation Component Weighing On RBA Monitor
Inflation Component Weighing On RBA Monitor
Inflation Component Weighing On RBA Monitor
Our highest conviction country allocation call this year has been to overweight Australian Government bonds, and we see no need to change that given the bullish signal from our RBA Monitor (Chart 8D). It would likely take a rise in unemployment, a renewed decline in realized inflation or a big external shock for the RBA to actually cut rates as our Monitor suggests, but the signal is still bullish for Australian debt on a relative basis. Chart 8DRBA A Long Way From A Hike - Stay Overweight Australian Government Bonds
RBA A Long Way From A Hike - Stay Overweight Australian Government Bonds
RBA A Long Way From A Hike - Stay Overweight Australian Government Bonds
RBNZ Monitor: Policy On Hold For A While Longer The Reserve Bank of New Zealand (RBNZ) Monitor is currently just above the zero line, indicating that tighter monetary policy is required (although just barely) (Chart 9A). This is consistent with the mixed messages in the New Zealand economic data. For example, there is no spare capacity in the economy according to estimates of the output and employment gaps, yet both headline and core inflation have decelerated to the lower end of the RBNZ's 1-3% target band (Chart 9B). Chart 9ANew Zealand: RBNZ Monitor
New Zealand: RBNZ Monitor
New Zealand: RBNZ Monitor
Chart 9BNo Spare Capacity In NZ, But No Inflation Either
No Spare Capacity In NZ, But No Inflation Either
No Spare Capacity In NZ, But No Inflation Either
Looking at the components of the RBNZ Monitor, the growth factors have continued to plunge whereas the inflation factors have been increasing (from below zero) since the start of 2018 (Chart 9C). New Zealand's economic growth has slowed because of softer consumer spending and weaker housing activity, the latter of which is related to lower net immigration. Yet business confidence is falling, both the manufacturing and services PMIs have also declined, and export growth has cooled thanks to weaker growth from China and Australia. Meanwhile, the uptick in the inflation components has not yet translated into any broader improvement in realized inflation that would cause the RBNZ to take a more hawkish turn. Chart 9CConflicting Trends Within The RBNZ Monitor
Conflicting Trends Within The RBNZ Monitor
Conflicting Trends Within The RBNZ Monitor
We continue to recommend an overweight stance on New Zealand Government Bonds, in line with the bullish signal sent by our RBNZ Monitor (Chart 9D). The RBNZ has already provided forward guidance indicating that the Overnight Cash Rate (OCR) will stay unchanged until 2020, and it will take some time before there is evidence that the recent hook down in inflation is nothing more than a temporary blip. Chart 9DRBNZ To Remain On Hold - Stay Long New Zealand Bonds
RBNZ To Remain On Hold - Stay Long New Zealand Bonds
RBNZ To Remain On Hold - Stay Long New Zealand Bonds
Robert Robis, CFA, Senior Vice President Global Fixed Income Strategy rrobis@bcaresearch.com Ray Park, CFA, Research Analyst ray@bcaresearch.com Recommendations The GFIS Recommended Portfolio Vs. The Custom Benchmark Index
BCA Central Bank Monitor Chartbook: Divergences Opening Up
BCA Central Bank Monitor Chartbook: Divergences Opening Up
Duration Regional Allocation Spread Product Tactical Trades Yields & Returns Global Bond Yields Historical Returns
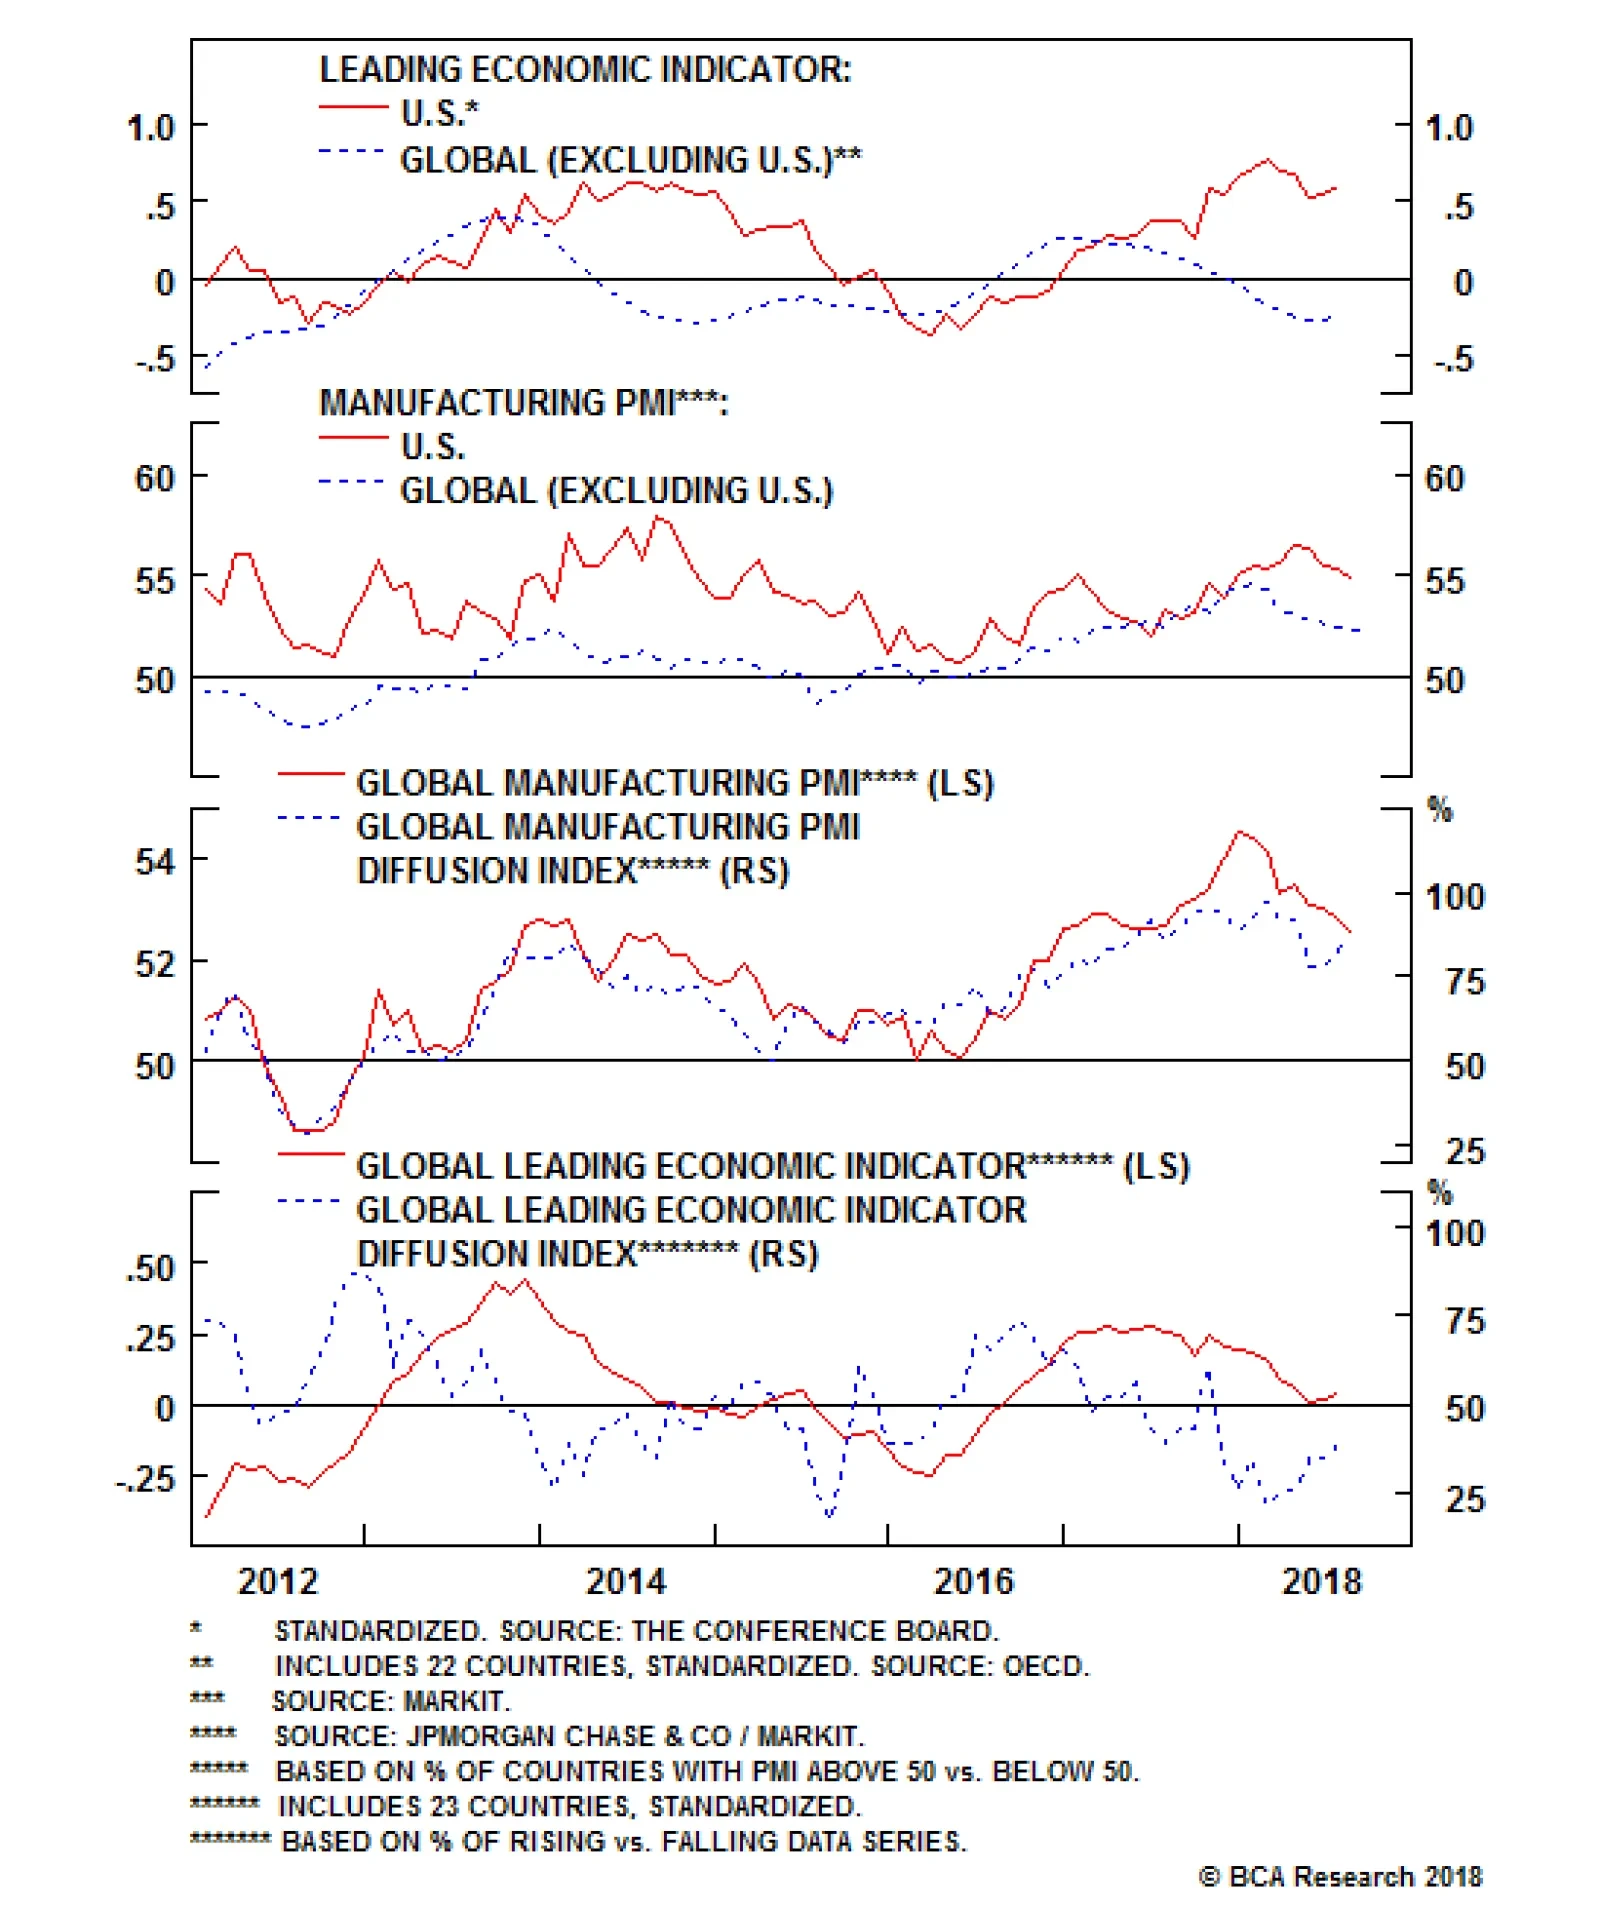
In past reports our U.S. Bond Strategy team has noted that the Global Leading Economic Indicator (LEI) excluding the U.S. is below zero. Since 1993, every time the Global LEI excluding the U.S. has fallen below zero, the U.S. LEI eventually followed it lower.…
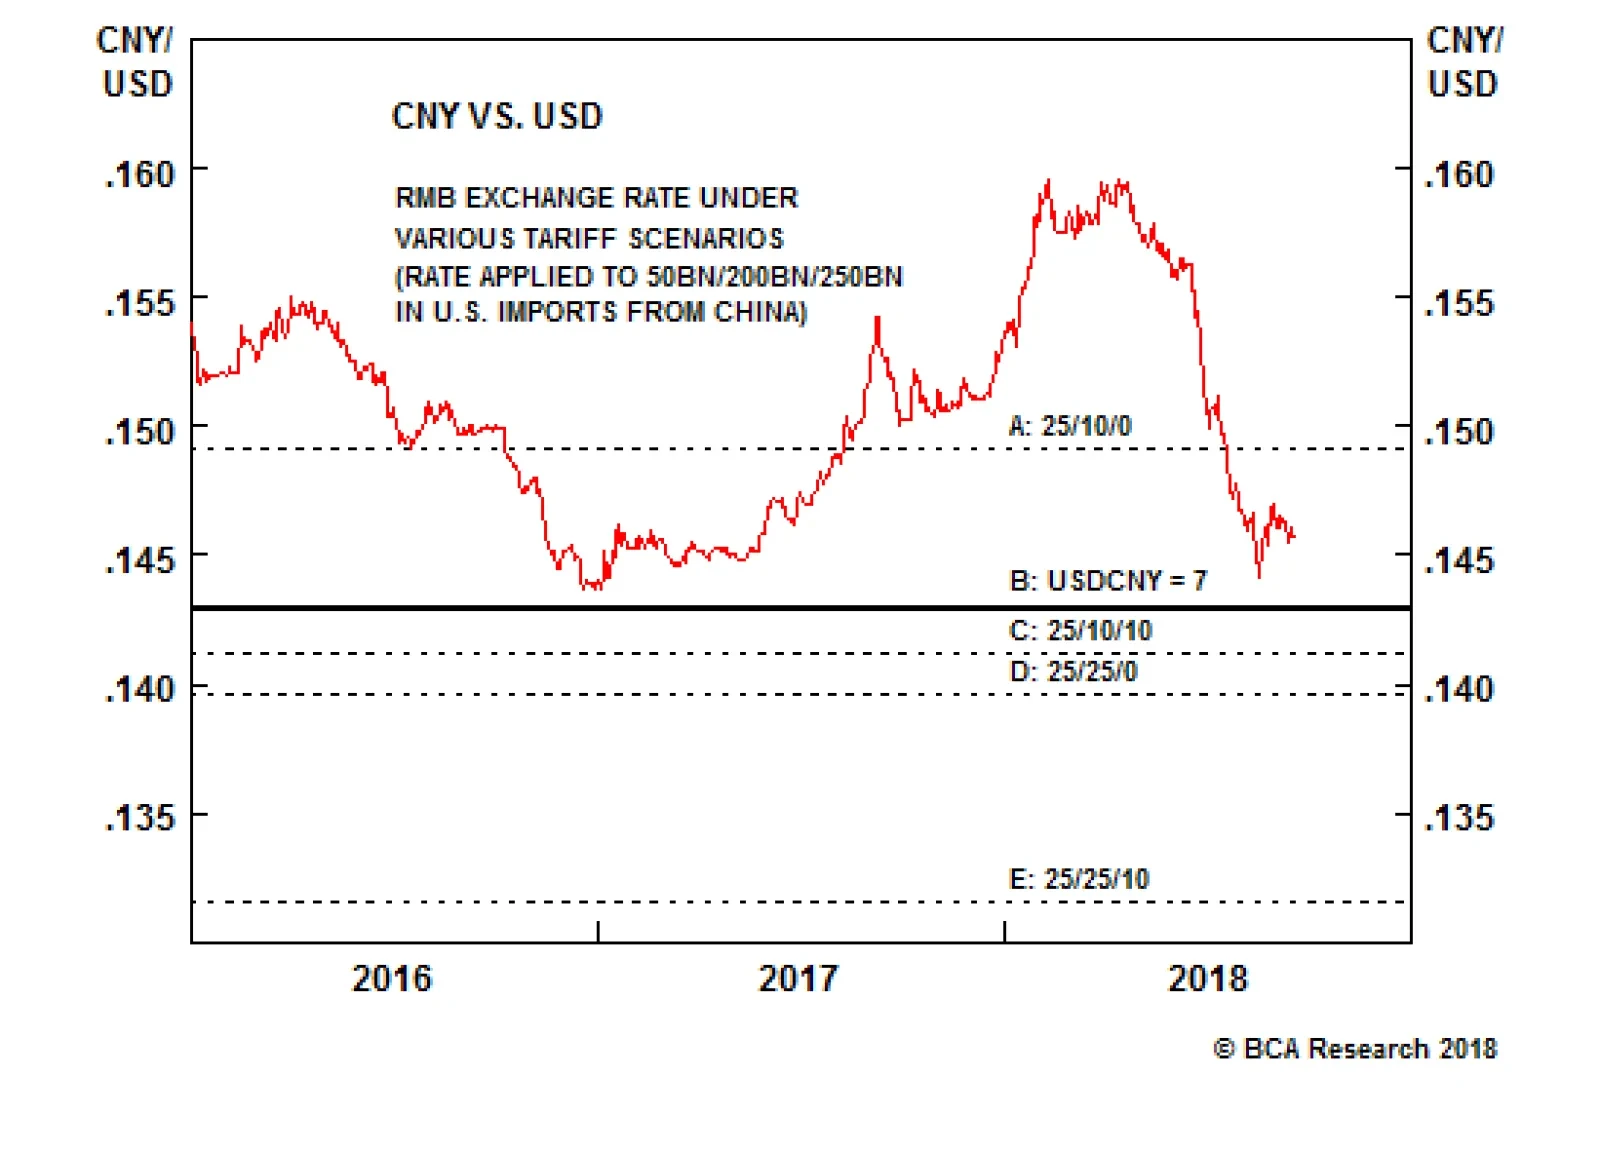
Markets started the week with news that the Trump administration is likely to impose a 10% tariff on $200 billion of Chinese imports. A ten percent tariff is at the low-end of the range that was being considered by President Trump, and could potentially…
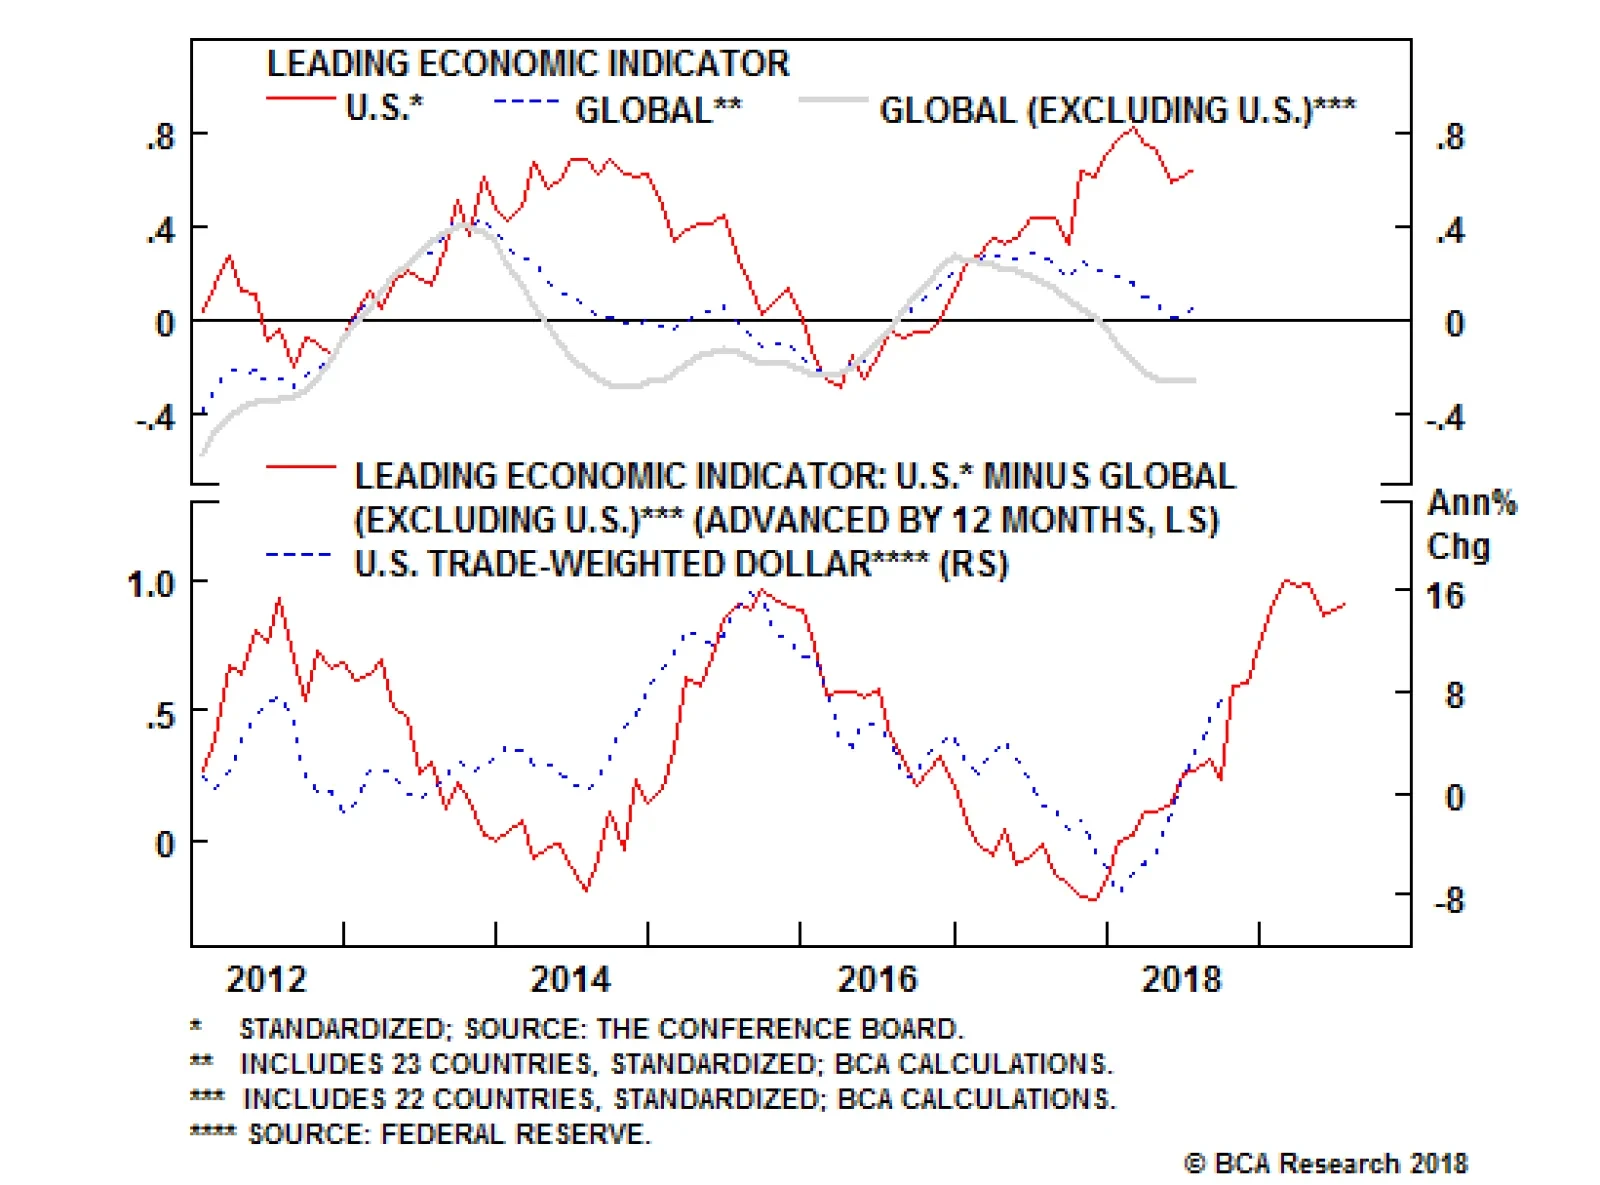
The recent glaring divergences in U.S. versus global growth will make Thursday’s release of the Conference Board's leading economic indicator (LEI) particularly important. A disappointing number will show that the U.S. is becoming more vulnerable to the…
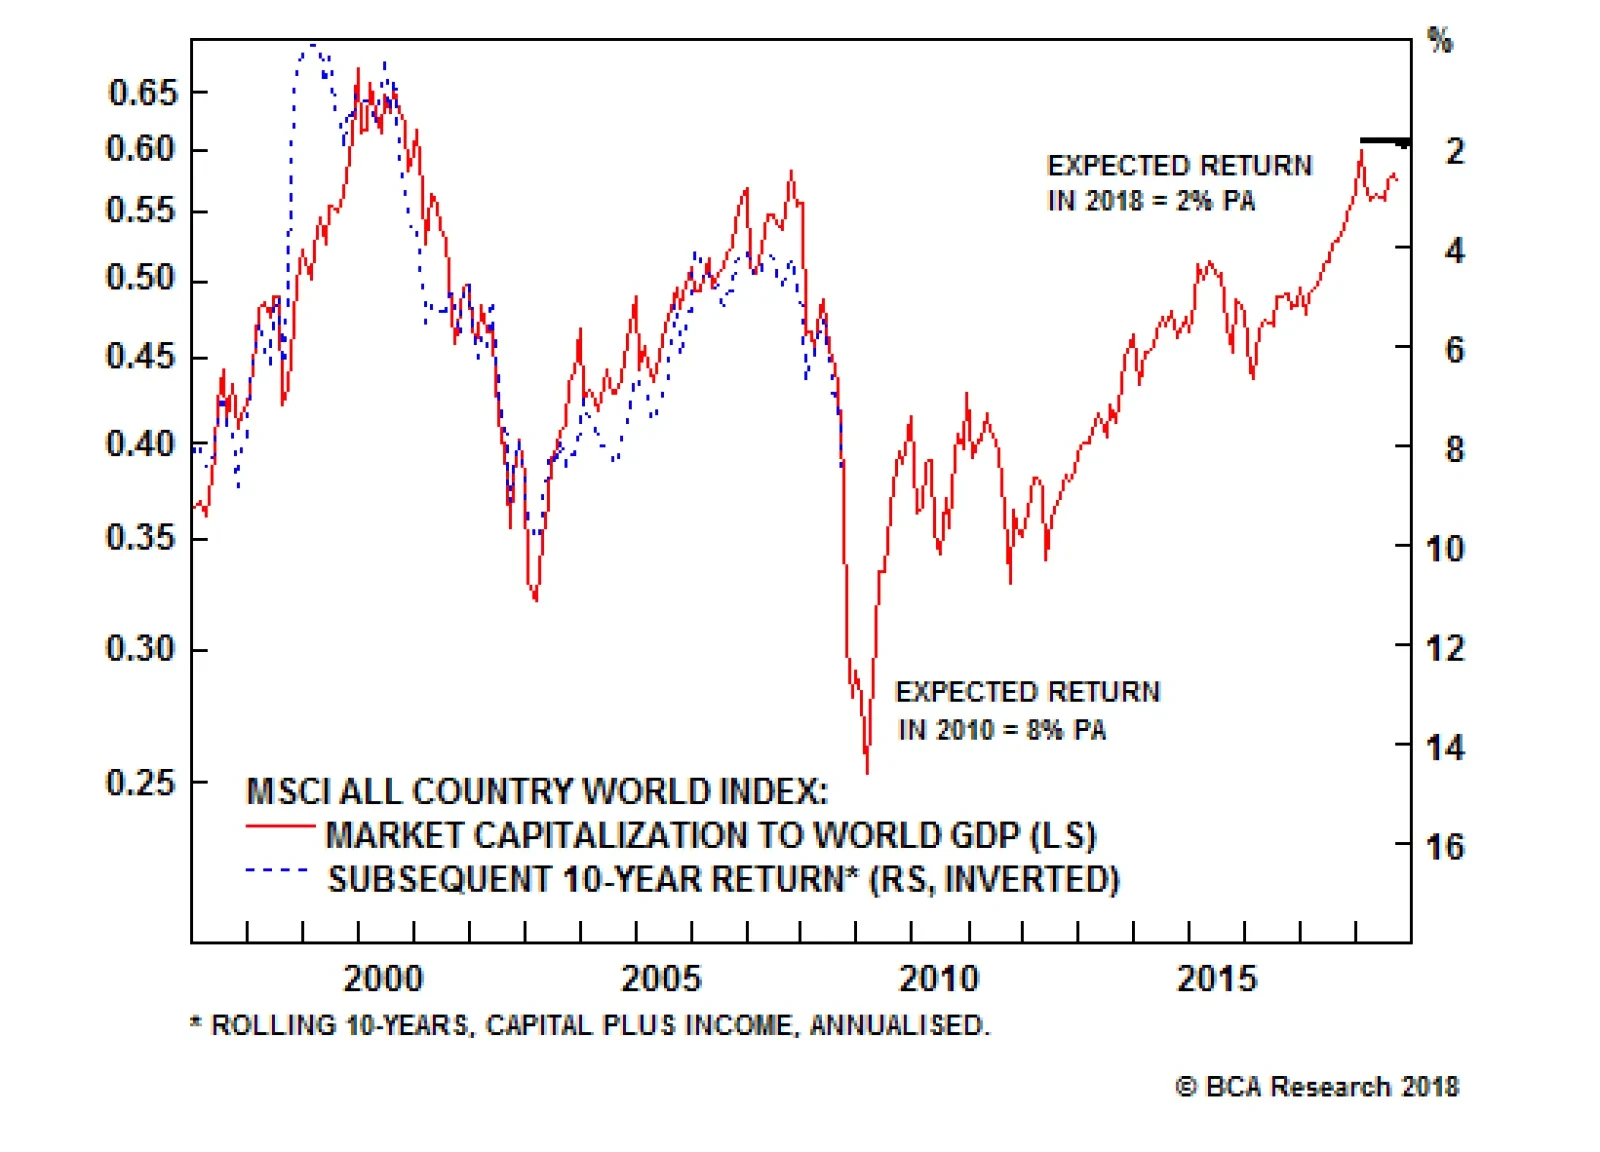
Our European investment strategists make the important point that the performance of bonds in an inflation scare would depend on the relative size of the inflationary impulse compared with the disinflationary impulse that resulted from sharply lower…
In the major developed economies, unemployment rates keep hitting new generational lows, implying that the main labor markets are tight. Yet policy interest rates remain near or at historically low levels. This raises the potential for an inflation scare. …
Highlights Oil markets and U.S. monetary policy are tightening coincidentally. This confluence of events in the past typically presages an equity correction and recession in the U.S. in the following 6 to 18 months (Chart of the Week). EM economies also could weaken as Fed policy collides with the oil-price spike we expect in the wake of a supply shock. In spite of continuing pressure from the Fed's policy-rate normalization policy, we continue to favor gold as a portfolio hedge (see below). Energy: Overweight. Russia's energy minister Alexander Novak expressed his determination to cooperate with OPEC to evolve the current production cut and emphasized his willingness to maintain a stable market, as reported by Platts on Tuesday.1 Base Metals: Neutral. Alcoa workers at Western Australian alumina and bauxite facilities voted to extend a strike initiated on August 8. Precious Metals: Neutral. The odds of sharply higher oil prices colliding with rising U.S. interest rates are increasing as the year winds down. Gold will outperform equities in this environment. Ags/Softs: Underweight. Brazilian farmers are lobbying Chinese consumers and Argentine suppliers to establish a futures contract tailored for delivery of soybeans from Latin America to China.2 Feature Oil markets continue to tighten, as the now fully discounted loss of ~ 2mm b/d of Iranian and Venezuelan exports is compounded by additional supply-side concerns in Iraq and Libya, and razor-thin OPEC spare capacity. Global demand remains robust. Against this backdrop, it is hardly surprising the energy ministers of the Kingdom of Saudi Arabia (KSA) and Russia are huddling with the U.S. Energy Secretary this week to discuss oil markets in separate meetings on opposite sides of the globe.3 The risk an oil-supply shock collides with tightening monetary conditions in the U.S. is rising, as the Fed continues its rates-normalization policy. This potent confluence of risks, which could push Brent prices above $120/bbl, raises the odds of a sharp correction in U.S. equities (Chart of the Week). It also could pull the recession we expect in 2020 into 2019. This is a risk assessment, not our baseline scenario. While the odds of an oil-price spike accompanied by higher interest rates are increasing, we are not changing our view of oil or gold markets: We expect Brent crude to average $70/bbl in 2H18 and $80/bbl in 2019. We also remain long gold as a portfolio hedge against higher inflation this year and next, and expect the Fed to stay the course on its rates-normalization policy.4 Chart of the WeekOil Price Spikes + Rising U.S. Interest Rates Typically Presage S&P 500 Sell-Off
Oil-Supply Shock, Rising U.S. Rates Favor Gold As A Portfolio Hedge
Oil-Supply Shock, Rising U.S. Rates Favor Gold As A Portfolio Hedge
That said, gold will remain one of the best indicators of how markets assess the Fed's willingness to lean into its rates policy: If prices weaken further, it will signal markets are pricing in continued tightness in U.S. monetary policy. Any weakness resulting from this expectation will be an opportunity to get long (or longer) gold as a portfolio hedge, particularly if oil markets tighten as we expect. Energy Ministers Meet As Oil Markets Tighten KSA's minister, Khalid al-Falih, and U.S. Energy Secretary Rick Perry met in Washington this past Monday, and Perry is due to travel to Moscow for a scheduled visit today. The increasing likelihood of 2mm b/d of exports being lost to U.S. sanctions against Iran later this year, and the imminent collapse of Venezuela, provides the context for these meetings. Platts Analytics estimates as much as 1.4mm b/d of Iranian exports could be lost to the market by the time U.S. sanctions against that country kick in in November. In our base case, we expect a loss of 1mm b/d, which keeps the global market in a physical deficit next year (Chart 2). Total OPEC production in August is estimated by Platts at 32.9mm b/d, a 10-month high, with output in Iraq surging to 4.7mm b/d and to 940k b/d in Libya.5 That Iraqi and Libyan production surge is increasingly at risk, however. In addition to the fully discounted Iranian and Venezuelan risk, we expect American, Saudi and Russian ministers also will discuss the growing risk to Iraq's and Libya's production, and its implications for global supply.6 Civil unrest in these states raises the risk of additional unplanned outages over the near term just as output is recovering.7 Concerns over razor-thin OPEC spare capacity - equal to ~ 1.5% to 2.0% of global demand - and continued strong global consumption likely number among their concerns, as well. In our view, these factors strongly suggest the oil market is setting up for a supply shock that could lift prices above $120/bbl (Chart 3). Chart 2Physical Deficits Could Widen
Physical Deficits Could Widen
Physical Deficits Could Widen
Chart 3High-Price Scenarios Becoming More Likely
High-Price Scenarios Becoming More Likely
High-Price Scenarios Becoming More Likely
Fed Policy Could Collide With Oil Price Spike With the U.S. economy at or very near full capacity, unemployment below 4%, and inflation and inflation expectations ticking higher, we believe the Fed will remain focused on its rates-normalization policy. This increases the risk an oil-supply shock collides with tightening monetary conditions in the U.S. is rising. If the Fed looks through the oil-price spike we expect in the next 6 to 12 months - treating it as a transitory event - its rates-normalization policy will become problematic for the U.S. and global economies. Such a reading by the Fed would be a policy error, in our estimation. As shown in the Chart of the Week, an oil-supply shock accompanied by continued Fed tightening raises the risk of a sharp correction in U.S. equity markets, and perhaps could trigger a bear market. In addition, the recession we expect later in 2020 could be pulled into 2019. As shown in Table 1, 10 out of the 11 recessions in the U.S. since 1945 were preceded by spikes in oil prices. Not every rise in oil prices was accompanied by a recession. In other words, recessions in the U.S. are usually preceded by spikes in oil prices, but not all spikes in oil prices are followed by recessions. This is important, as it implies that forecasting a recession based solely on rises in oil prices can sometimes misfire. Table 1History Of Oil Supply Shocks
Oil-Supply Shock, Rising U.S. Rates Favor Gold As A Portfolio Hedge
Oil-Supply Shock, Rising U.S. Rates Favor Gold As A Portfolio Hedge
On the other hand, an oil-price shock combined with a rate-tightening cycle presents a more reliable recession signal. In fact, since 1970, every time the Fed-funds rate rose by more than ~200bps and oil prices rose by more than 50%, the U.S. business cycle peaked in the following 6-18 months.8 EM Growth Threatened, As Well As the Fed proceeds with its policy-rate normalization, the broad trade-weighted USD (USD TWIB) will strengthen. A sharp increase in oil prices accompanied by continued strength in the USD TWIB will redound to the detriment of EM economies, reducing demand for commodities generally, as the local currency costs of all USD-denominated goods increases. The confluence of these factors - should they materialize - would reduce EM income growth - perhaps even cause a contraction - and would produce a medium-term deflationary impulse, along with a rush to U.S. treasuries and other safe-haven assets. This would lower U.S. interest rates, all else equal, forcing the Fed to put its rates-normalization policy on hold, and possibly reverse it.9 Favor Gold, If Oil Spikes And Rates Rise In sum, the U.S. economy is at or very near full capacity, which will keep the Fed focused on its rates-normalization process. This will likely cause the Fed to treat the oil-price spike we expect on the back of a supply-side shock over the next 6 - 12 months as transitory. The Fed won't view it as a true inflationary threat, and will continue with its rates policy, as its core inflation gauge - the U.S. PCEPI ex food and energy - continues to move higher. Over the short run, this would look like U.S. real rates are falling, boosting the appeal of gold. However, the oil-price spike plus a maintained bias by the Fed to continue raising policy rates will lift the USD TWIB, even as oil prices remain high. This will be a double-whammy to EM economies - the absolute price of oil in USD will rise significantly, even as a stronger USD raises the cost of all other dollar-denominated goods and services. This will reduce disposable income and lower aggregate demand in EM economies. Should the Fed misread the oil-price spike in a rising interest-rate environment, we believe holding gold in a diversified portfolio continues to make sense. Gold outperforms in rising inflation environments, and when demand for safe-havens increases. In addition, gold outperforms equities in periods of declining stock markets (Chart 4). This convexity on the upside and downside is one of gold's strongest attributes. Bottom Line: Given the continued pressure on gold from the Fed's rates-normalization policy, the yellow metal will remain an inexpensive portfolio hedge. Gold prices are currently below or close to their long-term average when expressed in terms of the S&P 500 or oil units (Chart 5). Hence, diverting limited amount from equity to gold is recommended on a risk-adjusted basis. Chart 4Gold V. S&P 500
Oil-Supply Shock, Rising U.S. Rates Favor Gold As A Portfolio Hedge
Oil-Supply Shock, Rising U.S. Rates Favor Gold As A Portfolio Hedge
Chart 5Gold Is Relatively Cheap
Gold Is Relatively Cheap
Gold Is Relatively Cheap
Robert P. Ryan, Senior Vice President Commodity & Energy Strategy rryan@bcaresearch.com Hugo Bélanger, Senior Analyst Commodity & Energy Strategy HugoB@bcaresearch.com 1 Please see "Russian energy minister Novak sees broader OPEC, Russia, allies cooperation charter 'expedient' from Jan 1, 2019" published by SP Platts Global on September 11, 2018. 2 Please see "Brazil Farmers Vie For Soy Contract During U.S. - China Trade War," published by reuters.com on September 10, 2018. 3 Please see "U.S. and Saudi energy ministers to meet in Washington: DOE," and "Russia's Novak to meet with U.S. counterpart Perry, discuss oil markets," both published by reuters.com on September 10, 2018. 4 Our view is aligned with BCA's U.S. Bond Strategy, which can be found in "The Powell Doctrine Emerges" published September 4, 2018. It is available at usbs.bcaresearch.com. 5 Please see "OPEC crude oil production rises to 32.89 mil b/d in Aug as cuts unwind: Platts survey" published by SP Platts Global September 6, 2018. Noteworthy in the Platts analysis is the KSA increase to 10.5mm b/d. NB: We will be updating our balances next week. See also "U.S. warns Iran it will respond to attacks by Tehran allies in Iraq" published by reuters.com on September 11, 2018. 6 Rising secular tensions in Iraq - particularly vis-à-vis Iran's role in that state - could threaten production and exports there, as we discussed in the Special Report we published last week, in concert with BCA's Geopolitical Strategy. Please see "Iraq: The Fulcrum Of Middle East Geopolitics And Global Oil Supply" published September 5, 2018, and "Iraq Is The Prize In U.S. - Iran Sanctions Conflict" published June 7, 2018. Both are available at ces.bcaresearch.com. 7 Civil order in Libya is collapsing. The Islamic State is increasing the tempo of its operations in and around Libya; forces loyal to the late dictator late Muammar Qaddafi staged a mass escape from a Tripoli prison earlier this month; and local militia are threatening to extend the Libyan unrest into neighboring states. Please see "Libya's Haftar threatens to 'spread war' to Algeria" reported by Arab News September 11, 2018; "Masked gunmen attack Libyan oil corporation HQ in Tripoli," published by The Guardian September 10, 2018; and "Hundreds escape in jailbreak near Libyan capital" published by The National in the UAE September 3, 2018. 8 These effects are not constant or fixed. Each period has its own specificities implying a range around the rate hike and oil-prices spike necessary to disrupt the economy. 9 Please see BCA Commodity & Energy Strategy Weekly Report, "Trade, Dollars, Oil & Metals ... Assessing Downside Risk" published August 23, 2018, available at ces.bcaresearch.com. Investment Views and Themes Recommendations Strategic Recommendations Tactical Trades Commodity Prices and Plays Reference Table
Oil-Supply Shock, Rising U.S. Rates Favor Gold As A Portfolio Hedge
Oil-Supply Shock, Rising U.S. Rates Favor Gold As A Portfolio Hedge
Trades Closed in 2018 Summary of Trades Closed in 2017
Oil-Supply Shock, Rising U.S. Rates Favor Gold As A Portfolio Hedge
Oil-Supply Shock, Rising U.S. Rates Favor Gold As A Portfolio Hedge

Last month we penned a Special Report highlighting that the S&P 500 is relatively immune to U.S. trade policy uncertainty.1 In fact, not only is the SPX having an outstanding 2018 in absolute terms, but also relative to the rest of the world (ROW) U.S., large caps are soaring, as the ROW bourses bear the brunt of the Administration's hawkish trade rhetoric. Beyond trade policy uncertainty, relative profit outperformance also explains the U.S. stock market's global dominance. As a reminder, the SPX garners 60% of sales domestically. Moreover, the diverging relative economic backdrop appears to further underlie the outperformance. In the chart below, we present the difference between the U.S. ISM manufacturing survey compared with the global manufacturing PMI excluding the U.S. Relative animal spirits are clearly enough to explain the U.S. outperformance, with some obvious interplay from the impact of trade uncertainty. Bottom Line: Relative economic and profit outperformance as well as apparent low sensitivity to trade policy uncertainty suggest that U.S. equity outperformance has staying power.
The U.S. Is Leaving Everyone Else In The Dust
The U.S. Is Leaving Everyone Else In The Dust
1 Please see BCA U.S. Equity Strategy Special Report, " Trump, Trade, Tweets & Tumult - Does The Stock Market Care?" dated August 22, 2018, available at uses.bcaresearch.com.